Breve Análise do Portátil Lenovo IdeaPad 310-15IKB
| SD Card Reader | |
| average JPG Copy Test (av. of 3 runs) | |
| Dell XPS 13 9360 FHD i5 | |
| Lenovo Ideapad 310-15IKB | |
| Acer TravelMate X3 X349-M-7261 | |
| maximum AS SSD Seq Read Test (1GB) | |
| Dell XPS 13 9360 FHD i5 | |
| Acer TravelMate X3 X349-M-7261 | |
| Lenovo Ideapad 310-15IKB | |
| Networking | |
| iperf Server (receive) TCP 1 m | |
| Xiaomi Mi Notebook Air 13.3 2016 | |
| Acer Aspire E5-774-54HJ (jseb) | |
| Lenovo Ideapad 310-15IKB | |
| iperf Client (transmit) TCP 1 m | |
| Xiaomi Mi Notebook Air 13.3 2016 | |
| Acer Aspire E5-774-54HJ (jseb) | |
| Lenovo Ideapad 310-15IKB | |
| |||||||||||||||||||||||||
iluminação: 95 %
iluminação com acumulador: 185 cd/m²
Contraste: 661:1 (Preto: 0.28 cd/m²)
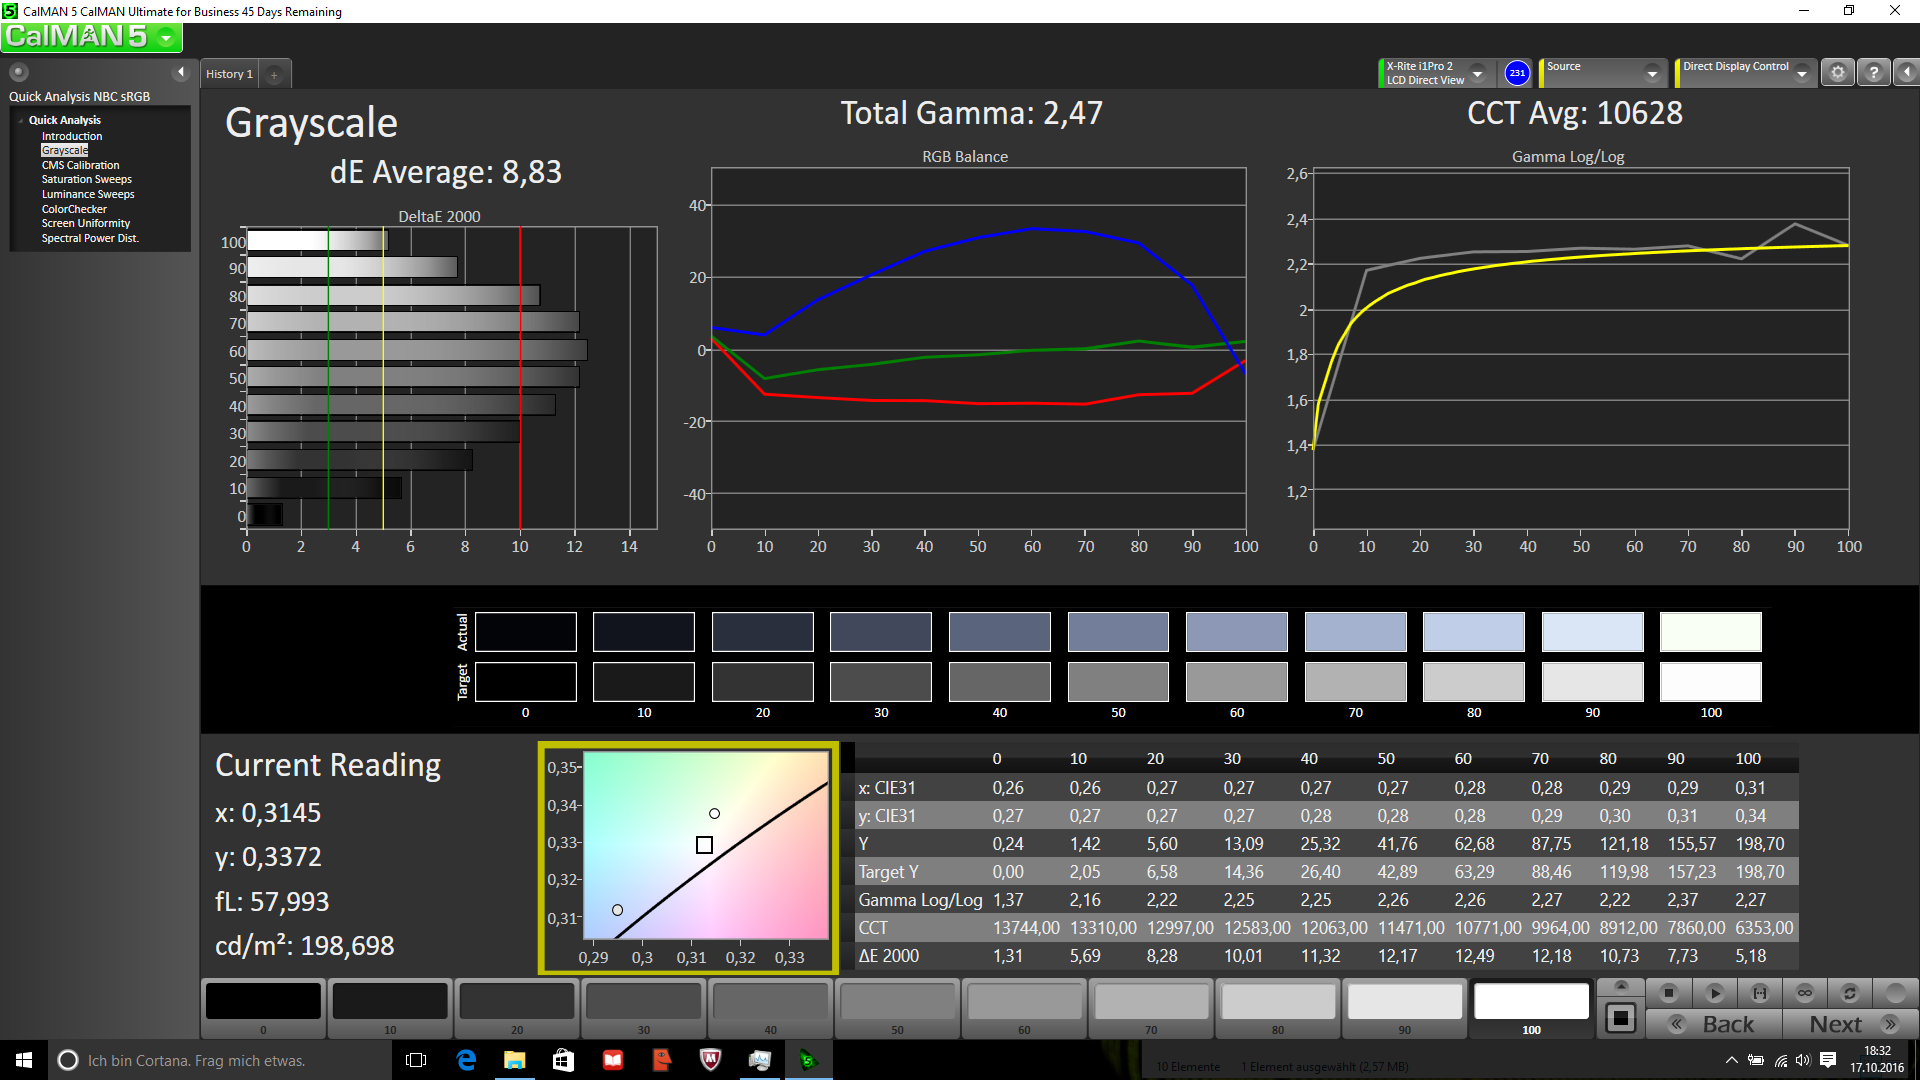
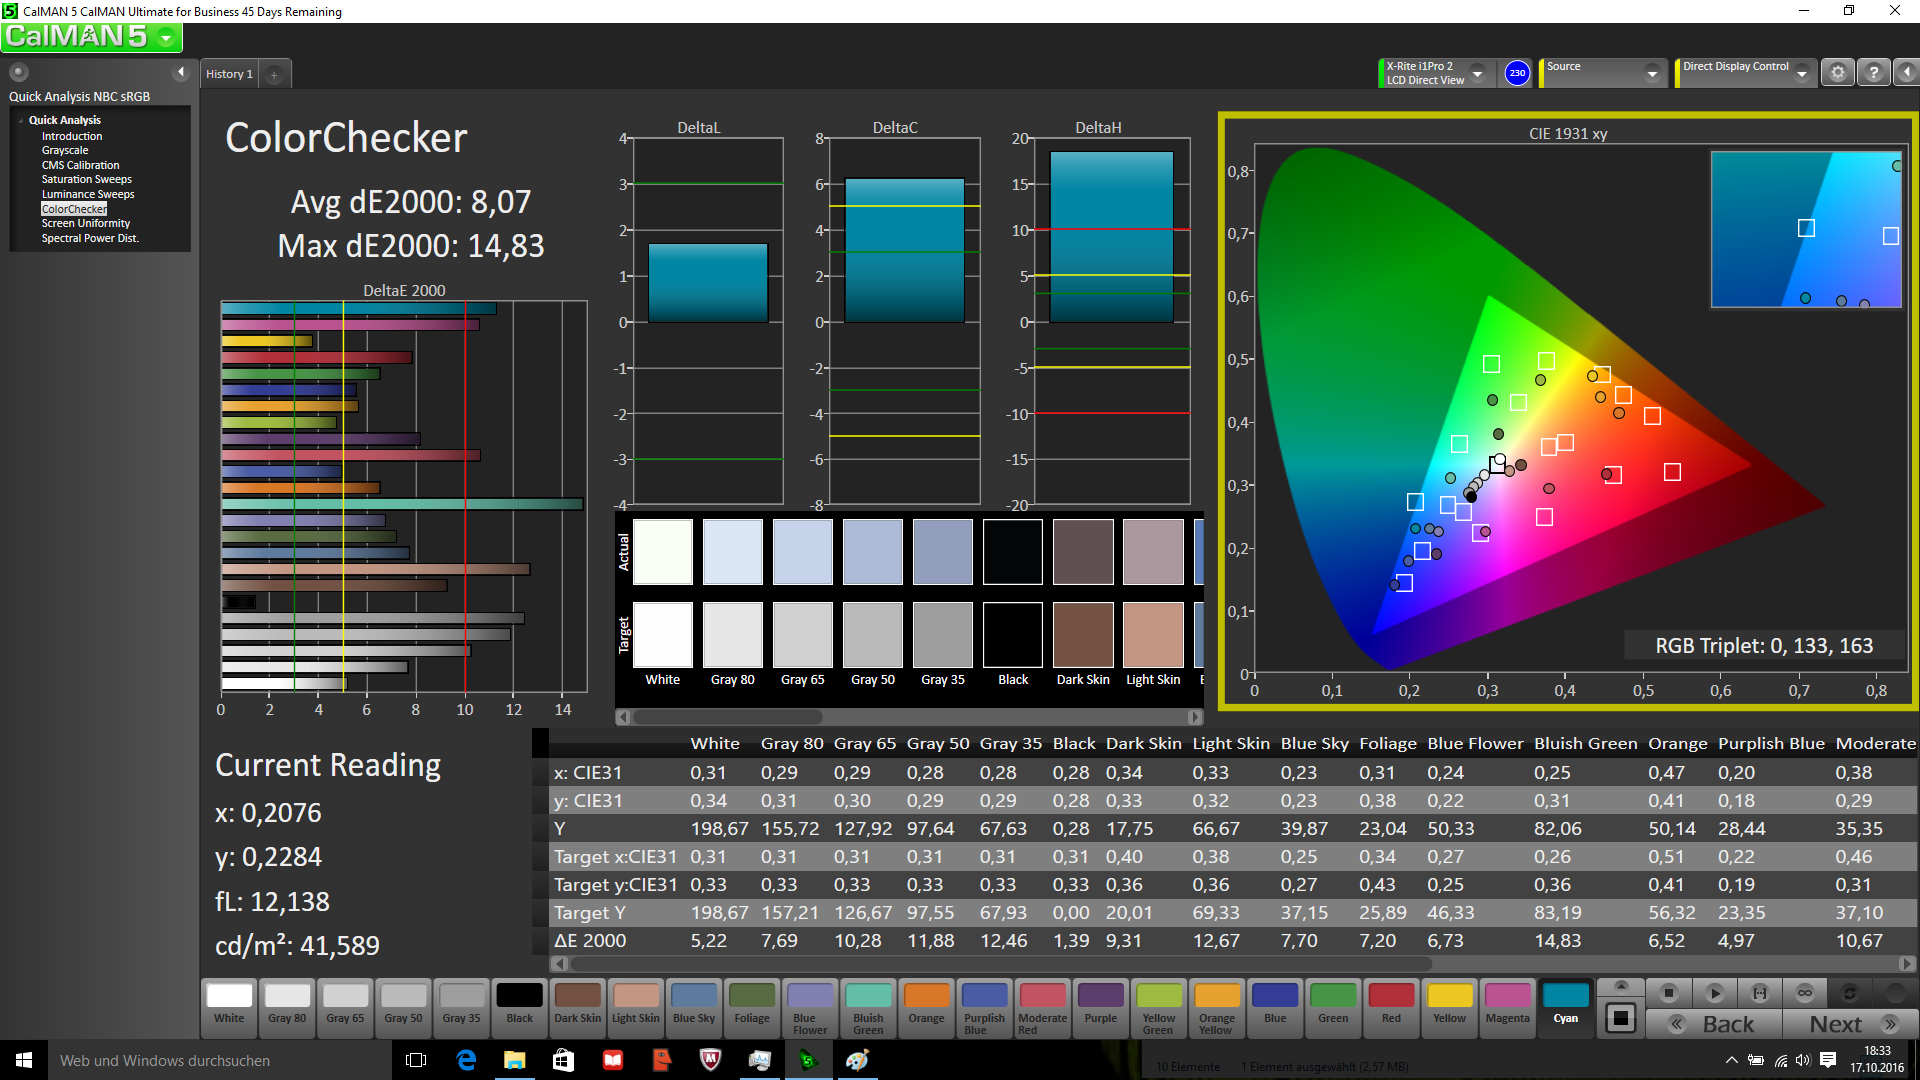
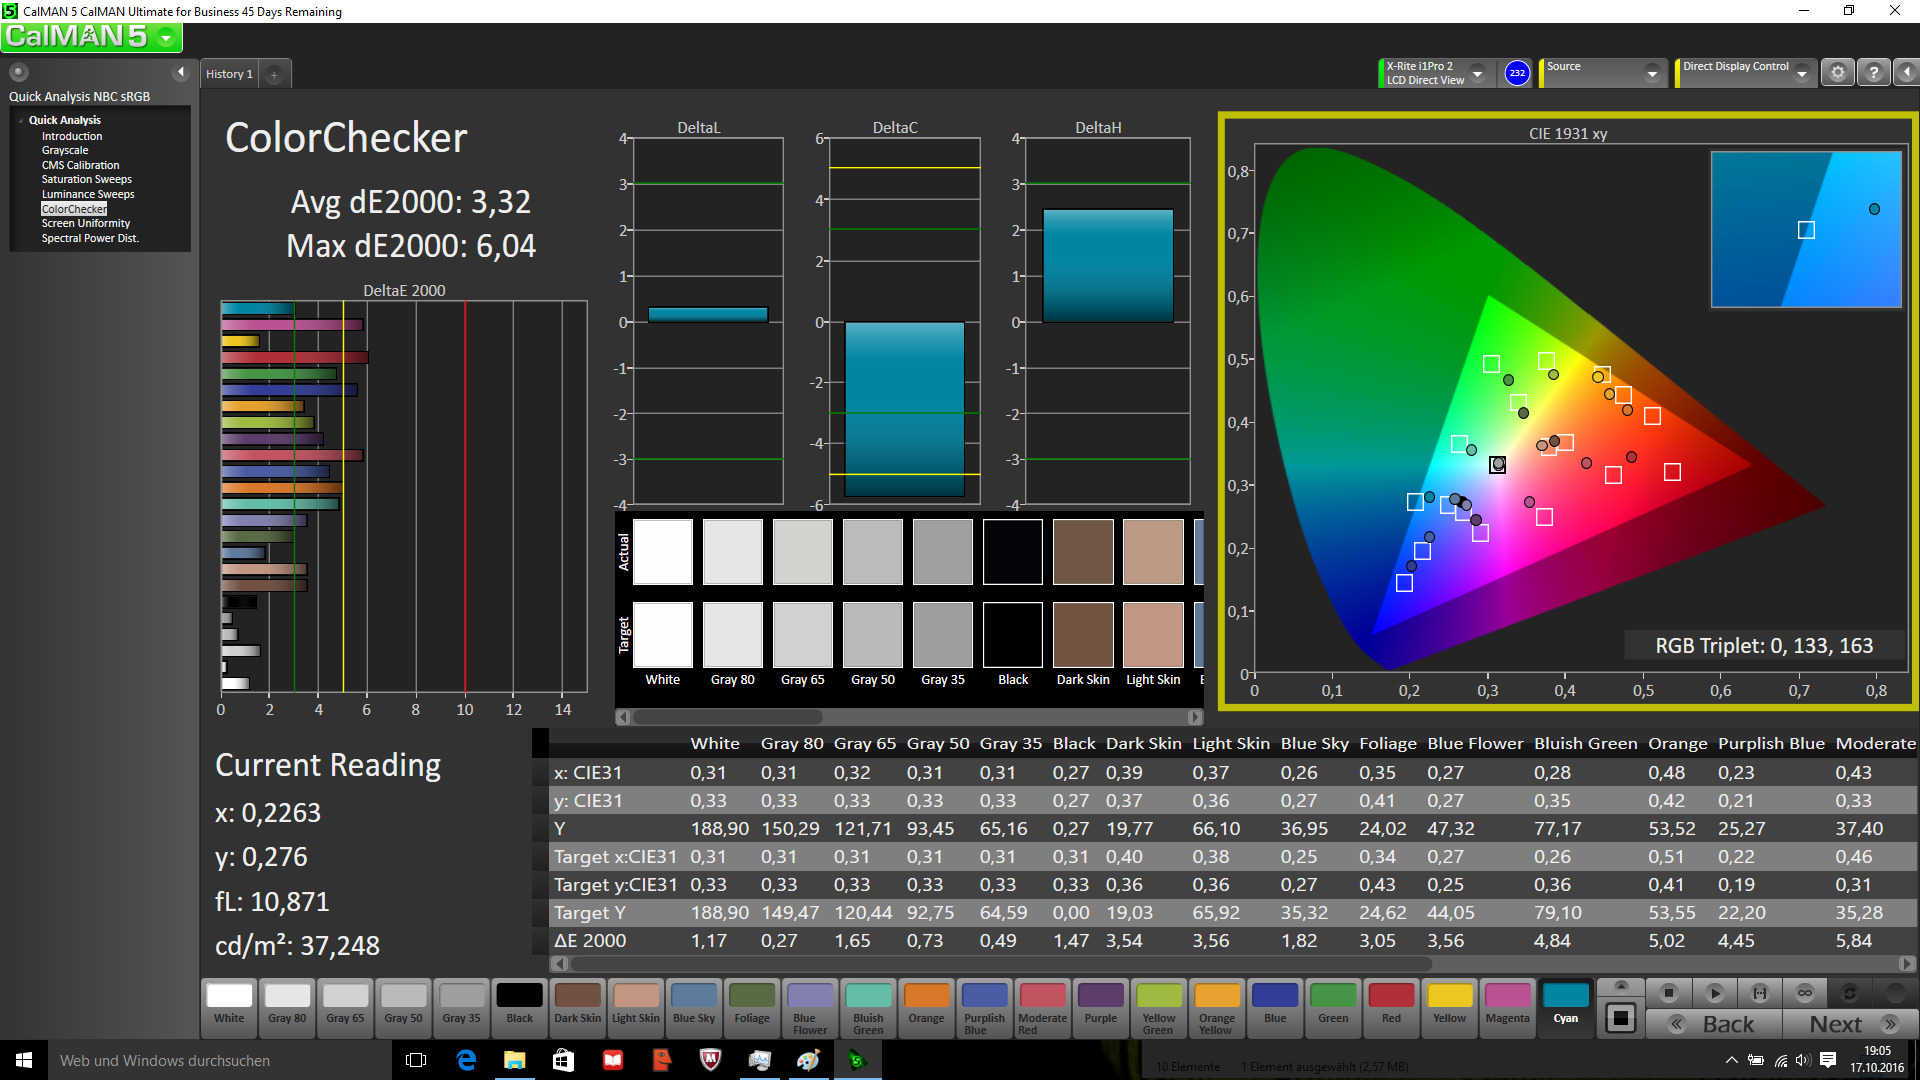
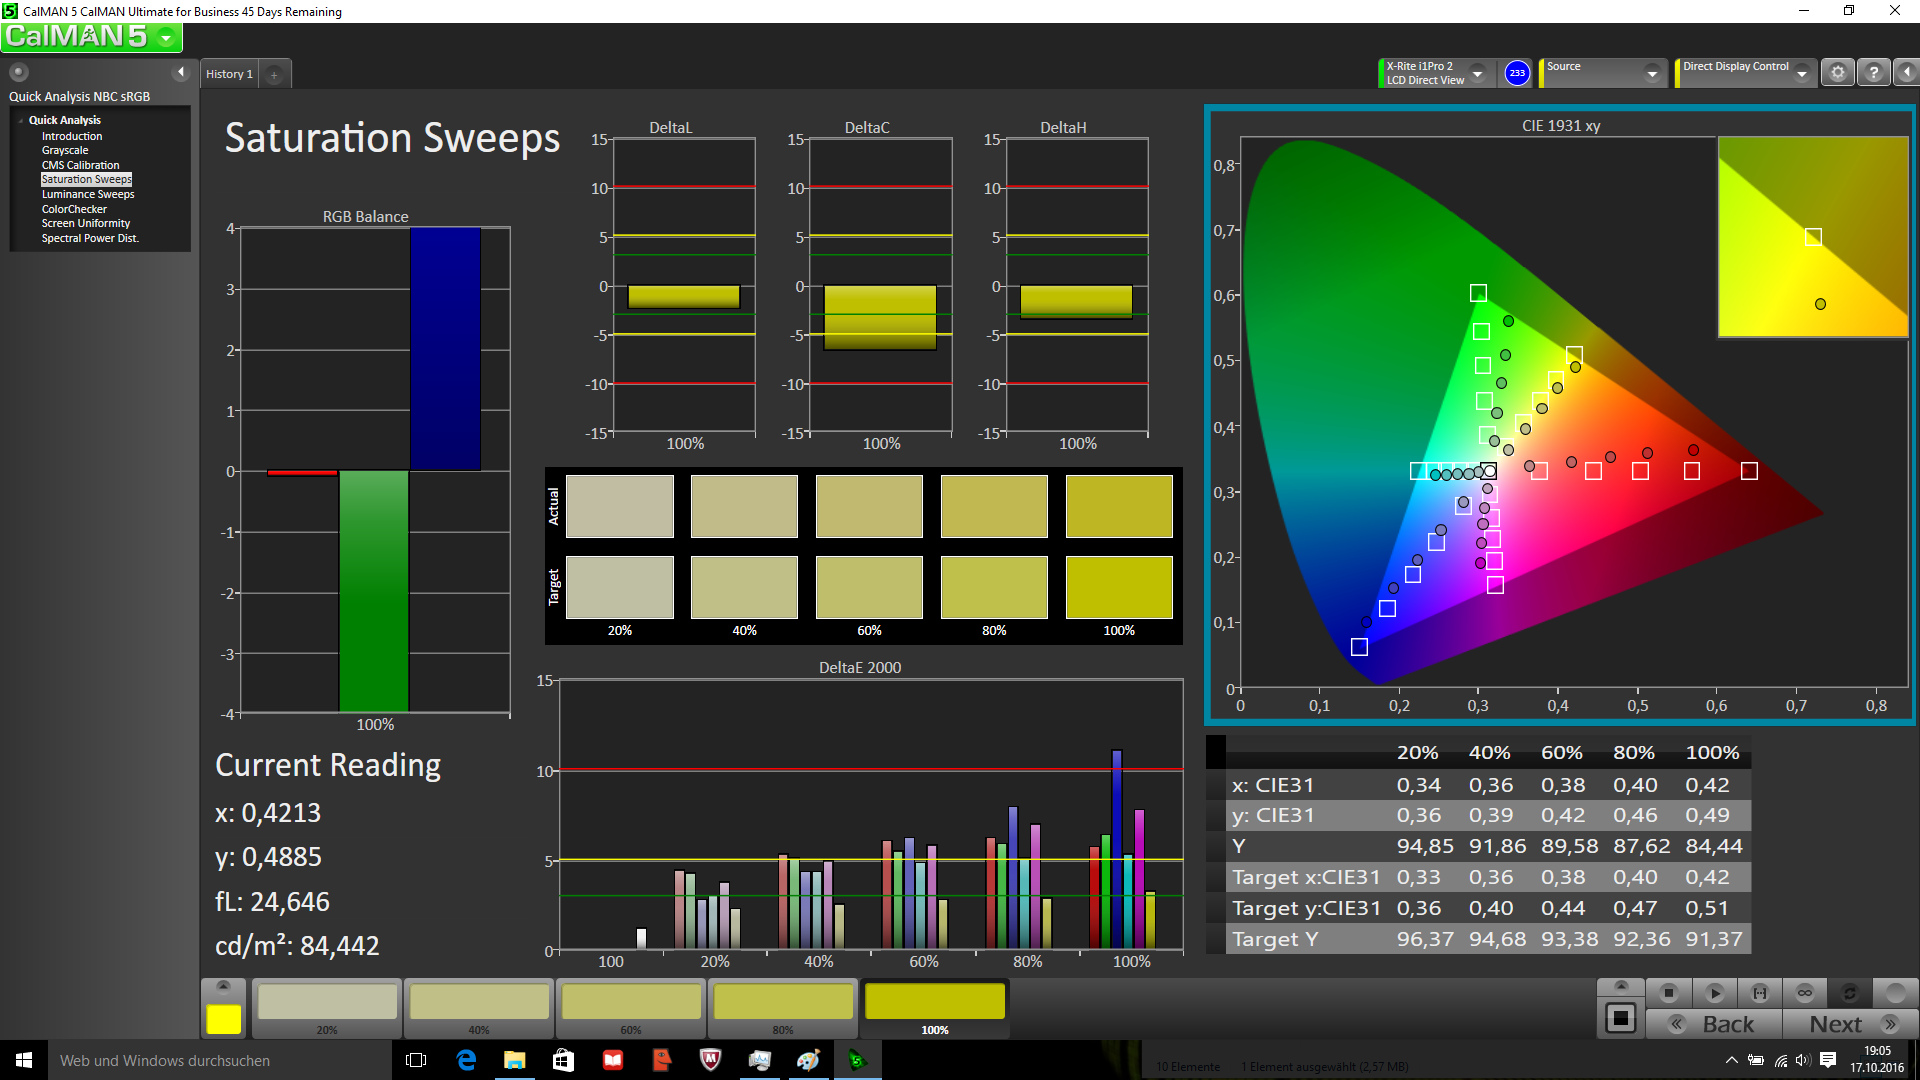
ΔE ColorChecker Calman: 8.07 | ∀{0.5-29.43 Ø4.71}
ΔE Greyscale Calman: 8.83 | ∀{0.09-98 Ø4.96}
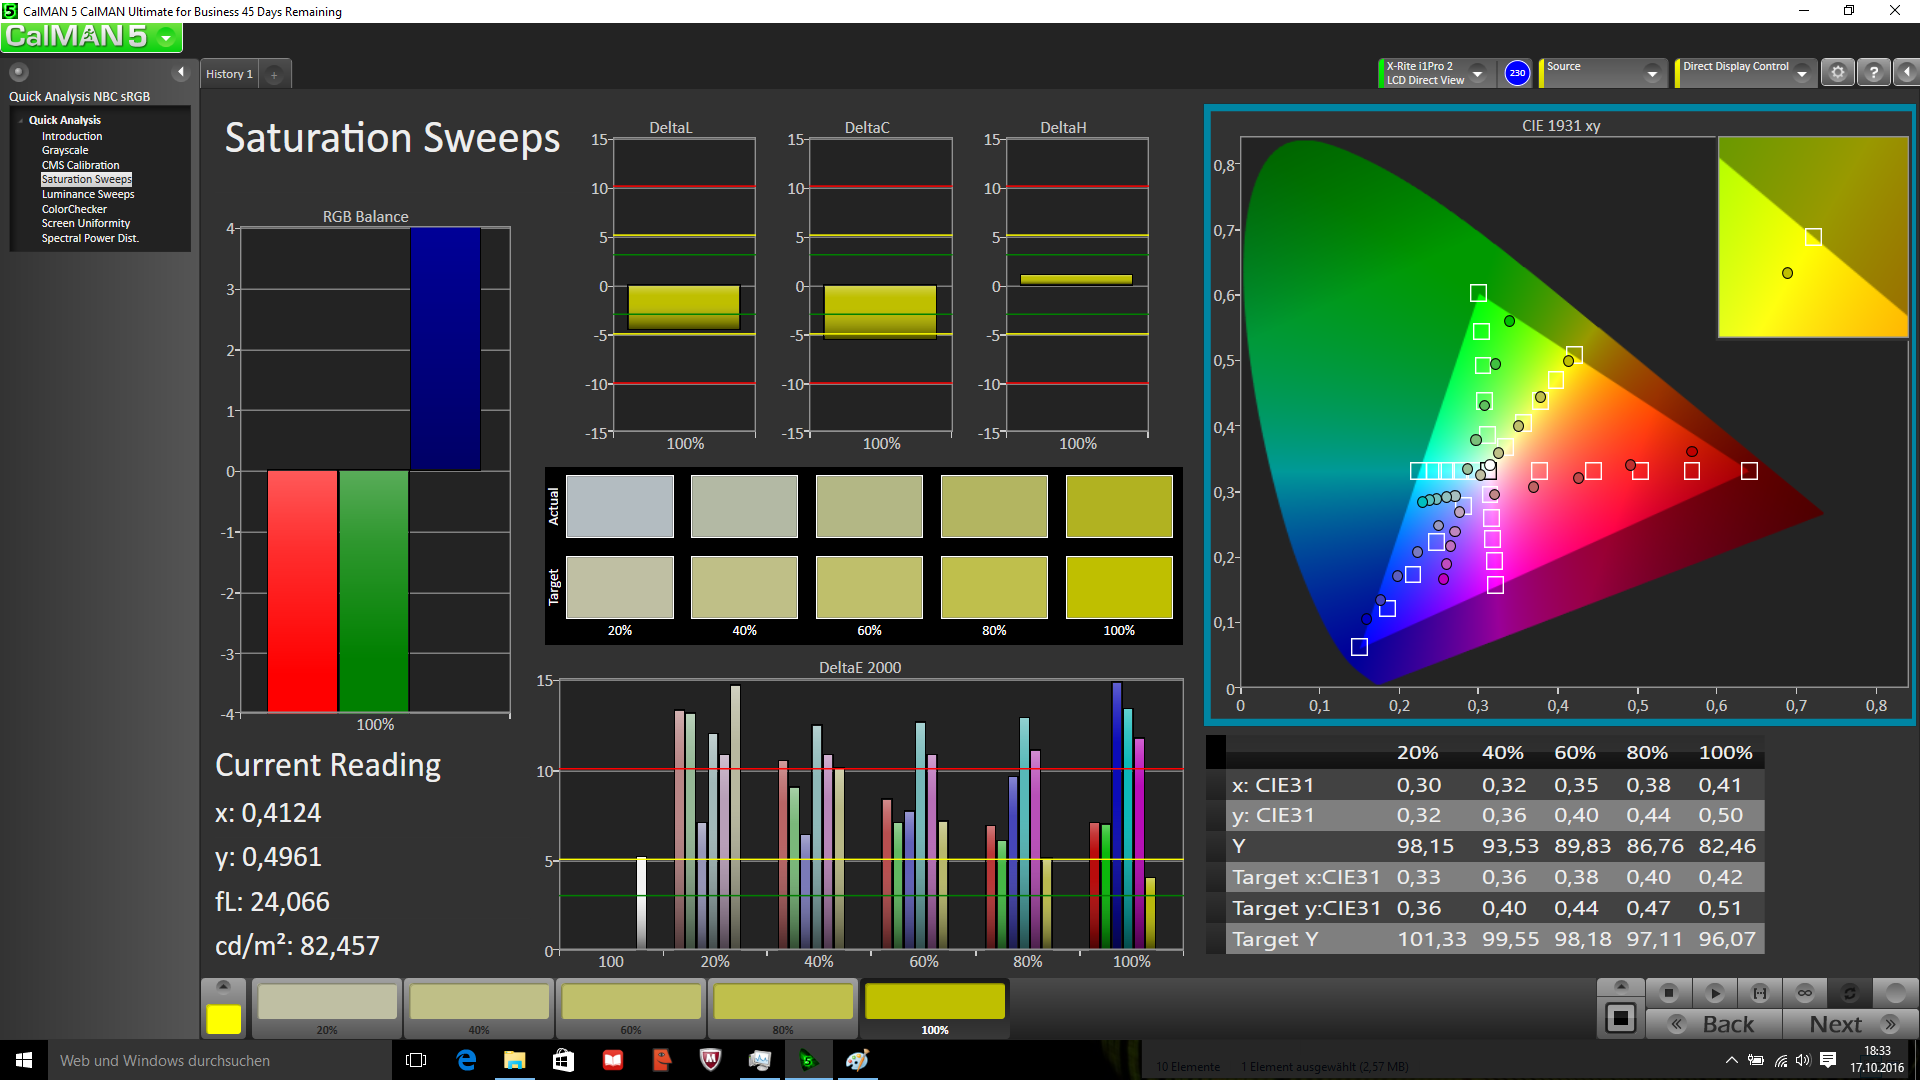
57% sRGB (Argyll 1.6.3 3D)
36.2% AdobeRGB 1998 (Argyll 1.6.3 3D)
39.34% AdobeRGB 1998 (Argyll 3D)
57.3% sRGB (Argyll 3D)
38.07% Display P3 (Argyll 3D)
Gamma: 2.47
CCT: 10628 K
| Lenovo Ideapad 310-15IKB BOE NT156FHM-N31, , 1920x1080, 15.6" | Lenovo IdeaPad 510-15IKB 80SV0087GE BOE HF NV156FHM-N42, , 1920x1080, 15.6" | Acer Aspire E5-774-54HJ AU Optronics B173HTN01.1, , 1920x1080, 17.3" | HP 250 G5 SP X0N33EA AU Optronics AUO38ED, , 1920x1080, 15.6" | Medion Akoya P6670 LG Philips LP156WF6-SPK3, , 1920x1080, 15.6" | Lenovo Ideapad 310-15ISK LG Philips LP156WHU-TPG1, , 1366x768, 15.6" | |
|---|---|---|---|---|---|---|
| Display | 12% | 73% | -4% | 0% | -3% | |
| Display P3 Coverage (%) | 38.07 | 42.66 12% | 71.3 87% | 36.51 -4% | 38.14 0% | 37.06 -3% |
| sRGB Coverage (%) | 57.3 | 64.1 12% | 91.7 60% | 55 -4% | 57.2 0% | 55.8 -3% |
| AdobeRGB 1998 Coverage (%) | 39.34 | 44.08 12% | 67.1 71% | 37.72 -4% | 39.43 0% | 38.29 -3% |
| Response Times | -50% | -4% | 1% | -2% | 16% | |
| Response Time Grey 50% / Grey 80% * (ms) | 43 ? | 51 ? -19% | 42 ? 2% | 40 ? 7% | 42 ? 2% | 27 ? 37% |
| Response Time Black / White * (ms) | 21 ? | 38 ? -81% | 23 ? -10% | 22 ? -5% | 22 ? -5% | 22 ? -5% |
| PWM Frequency (Hz) | 50 ? | 1000 ? | 50 | 50 ? | ||
| Screen | 36% | 30% | -19% | 2% | -6% | |
| Brightness middle (cd/m²) | 185 | 291 57% | 353 91% | 219 18% | 287 55% | 200 8% |
| Brightness (cd/m²) | 184 | 265 44% | 320 74% | 222 21% | 269 46% | 198 8% |
| Brightness Distribution (%) | 95 | 86 -9% | 82 -14% | 85 -11% | 74 -22% | 83 -13% |
| Black Level * (cd/m²) | 0.28 | 0.23 18% | 0.38 -36% | 0.39 -39% | 0.65 -132% | 0.28 -0% |
| Contrast (:1) | 661 | 1265 91% | 929 41% | 562 -15% | 442 -33% | 714 8% |
| Colorchecker dE 2000 * | 8.07 | 4.78 41% | 5.07 37% | 12.67 -57% | 5.42 33% | 10.63 -32% |
| Colorchecker dE 2000 max. * | 14.83 | 9.51 36% | 10.12 32% | 20.99 -42% | 9.54 36% | 15.69 -6% |
| Greyscale dE 2000 * | 8.83 | 3.49 60% | 13.38 -52% | 13.82 -57% | 5.14 42% | 11.19 -27% |
| Gamma | 2.47 89% | 2.58 85% | 2.69 82% | 2.63 84% | 2.48 89% | 1.78 124% |
| CCT | 10628 61% | 6013 108% | 15991 41% | 15633 42% | 6952 93% | 11258 58% |
| Color Space (Percent of AdobeRGB 1998) (%) | 36.2 | 40 10% | 60.1 66% | 35 -3% | 36 -1% | 35 -3% |
| Color Space (Percent of sRGB) (%) | 57 | 64 12% | 91.6 61% | 55 -4% | 57 0% | 56 -2% |
| Média Total (Programa/Configurações) | -1% /
20% | 33% /
34% | -7% /
-13% | 0% /
1% | 2% /
-2% |
* ... menor é melhor
Exibir tempos de resposta
| ↔ Tempo de resposta preto para branco | ||
|---|---|---|
| 21 ms ... ascensão ↗ e queda ↘ combinadas | ↗ 5 ms ascensão | 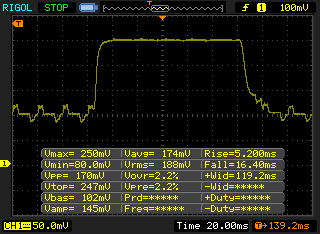 |
| ↘ 16 ms queda | ||
| A tela mostra boas taxas de resposta em nossos testes, mas pode ser muito lenta para jogadores competitivos. Em comparação, todos os dispositivos testados variam de 0.1 (mínimo) a 240 (máximo) ms. » 47 % de todos os dispositivos são melhores. Isso significa que o tempo de resposta medido é semelhante à média de todos os dispositivos testados (19.8 ms). | ||
| ↔ Tempo de resposta 50% cinza a 80% cinza | ||
| 43 ms ... ascensão ↗ e queda ↘ combinadas | ↗ 21 ms ascensão | 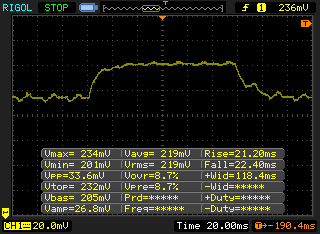 |
| ↘ 22 ms queda | ||
| A tela mostra taxas de resposta lentas em nossos testes e será insatisfatória para os jogadores. Em comparação, todos os dispositivos testados variam de 0.165 (mínimo) a 636 (máximo) ms. » 71 % de todos os dispositivos são melhores. Isso significa que o tempo de resposta medido é pior que a média de todos os dispositivos testados (31 ms). | ||
Cintilação da tela / PWM (modulação por largura de pulso)
| Tela tremeluzindo / PWM não detectado | ||
[pwm_comparison] Em comparação: 52 % de todos os dispositivos testados não usam PWM para escurecer a tela. Se PWM foi detectado, uma média de 7754 (mínimo: 5 - máximo: 343500) Hz foi medida. | ||
| Cinebench R15 | |
| CPU Single 64Bit | |
| Lenovo IdeaPad 510-15IKB 80SV0087GE | |
| Lenovo Ideapad 310-15ISK | |
| Lenovo Ideapad 310-15IKB | |
| Medion Akoya P6670 | |
| HP 250 G5 SP X0N33EA | |
| CPU Multi 64Bit | |
| Lenovo IdeaPad 510-15IKB 80SV0087GE | |
| Lenovo Ideapad 310-15ISK | |
| Lenovo Ideapad 310-15IKB | |
| Medion Akoya P6670 | |
| HP 250 G5 SP X0N33EA | |
| PCMark 8 - Home Score Accelerated v2 | |
| Lenovo IdeaPad 510-15IKB 80SV0087GE | |
| Lenovo Ideapad 310-15ISK | |
| Lenovo Ideapad 310-15IKB | |
| Medion Akoya P6670 | |
| HP 250 G5 SP X0N33EA | |
| Acer Aspire E5-774-54HJ | |
| PCMark 8 Home Score Accelerated v2 | 3457 pontos | |
Ajuda | ||
| Lenovo Ideapad 310-15IKB Hynix HFS128G3MND | Lenovo IdeaPad 510-15IKB 80SV0087GE Liteonit CV3-DE256 | HP 250 G5 SP X0N33EA SanDisk Z400s SD8SNAT-256G | Medion Akoya P6670 Phison S11-128G | Dell XPS 13 9360 FHD i5 Toshiba NVMe THNSN5256GPUK | |
|---|---|---|---|---|---|
| AS SSD | 24% | -1% | 15% | 75% | |
| Seq Read (MB/s) | 511 | 479.8 -6% | 495.8 -3% | 492.2 -4% | 1179 131% |
| Seq Write (MB/s) | 200.6 | 377.8 88% | 316.9 58% | 385.2 92% | 372.8 86% |
| 4K Read (MB/s) | 24.49 | 32.4 32% | 19.37 -21% | 40.83 67% | 29.52 21% |
| 4K Write (MB/s) | 63.6 | 59.7 -6% | 75.3 18% | 77.2 21% | 92 45% |
| 4K-64 Read (MB/s) | 302.9 | 345.5 14% | 137.4 -55% | 371.3 23% | 723 139% |
| 4K-64 Write (MB/s) | 145.4 | 203.7 40% | 198.8 37% | 271.9 87% | 197.7 36% |
| Access Time Read * (ms) | 0.117 | 0.127 -9% | 0.111 5% | 0.174 -49% | 0.055 53% |
| Access Time Write * (ms) | 0.116 | 0.066 43% | 0.157 -35% | 0.321 -177% | 0.035 70% |
| Score Read (Points) | 378 | 426 13% | 206 -46% | 461 22% | 870 130% |
| Score Write (Points) | 229 | 301 31% | 306 34% | 388 69% | 327 43% |
* ... menor é melhor

| 3DMark 11 - 1280x720 Performance GPU | |
| Medion Akoya P6670 | |
| Lenovo IdeaPad 510-15IKB 80SV0087GE | |
| Lenovo Ideapad 310-15ISK | |
| Lenovo Ideapad 310-15IKB | |
| HP 250 G5 SP X0N33EA | |
| 3DMark 11 Performance | 1621 pontos | |
| 3DMark Cloud Gate Standard Score | 5728 pontos | |
| 3DMark Fire Strike Score | 825 pontos | |
Ajuda | ||
| baixo | média | alto | ultra | |
|---|---|---|---|---|
| BioShock Infinite (2013) | 54.1 | 31.21 | 25.79 | |
| Company of Heroes 2 (2013) | 24.62 | 18.7 | ||
| Rise of the Tomb Raider (2016) | 19.8 |
Barulho
| Ocioso |
| 30.6 / 30.6 / 30.6 dB |
| Carga |
| 36.8 / 38.2 dB |
 | ||
30 dB silencioso 40 dB(A) audível 50 dB(A) ruidosamente alto |
||
min: | ||
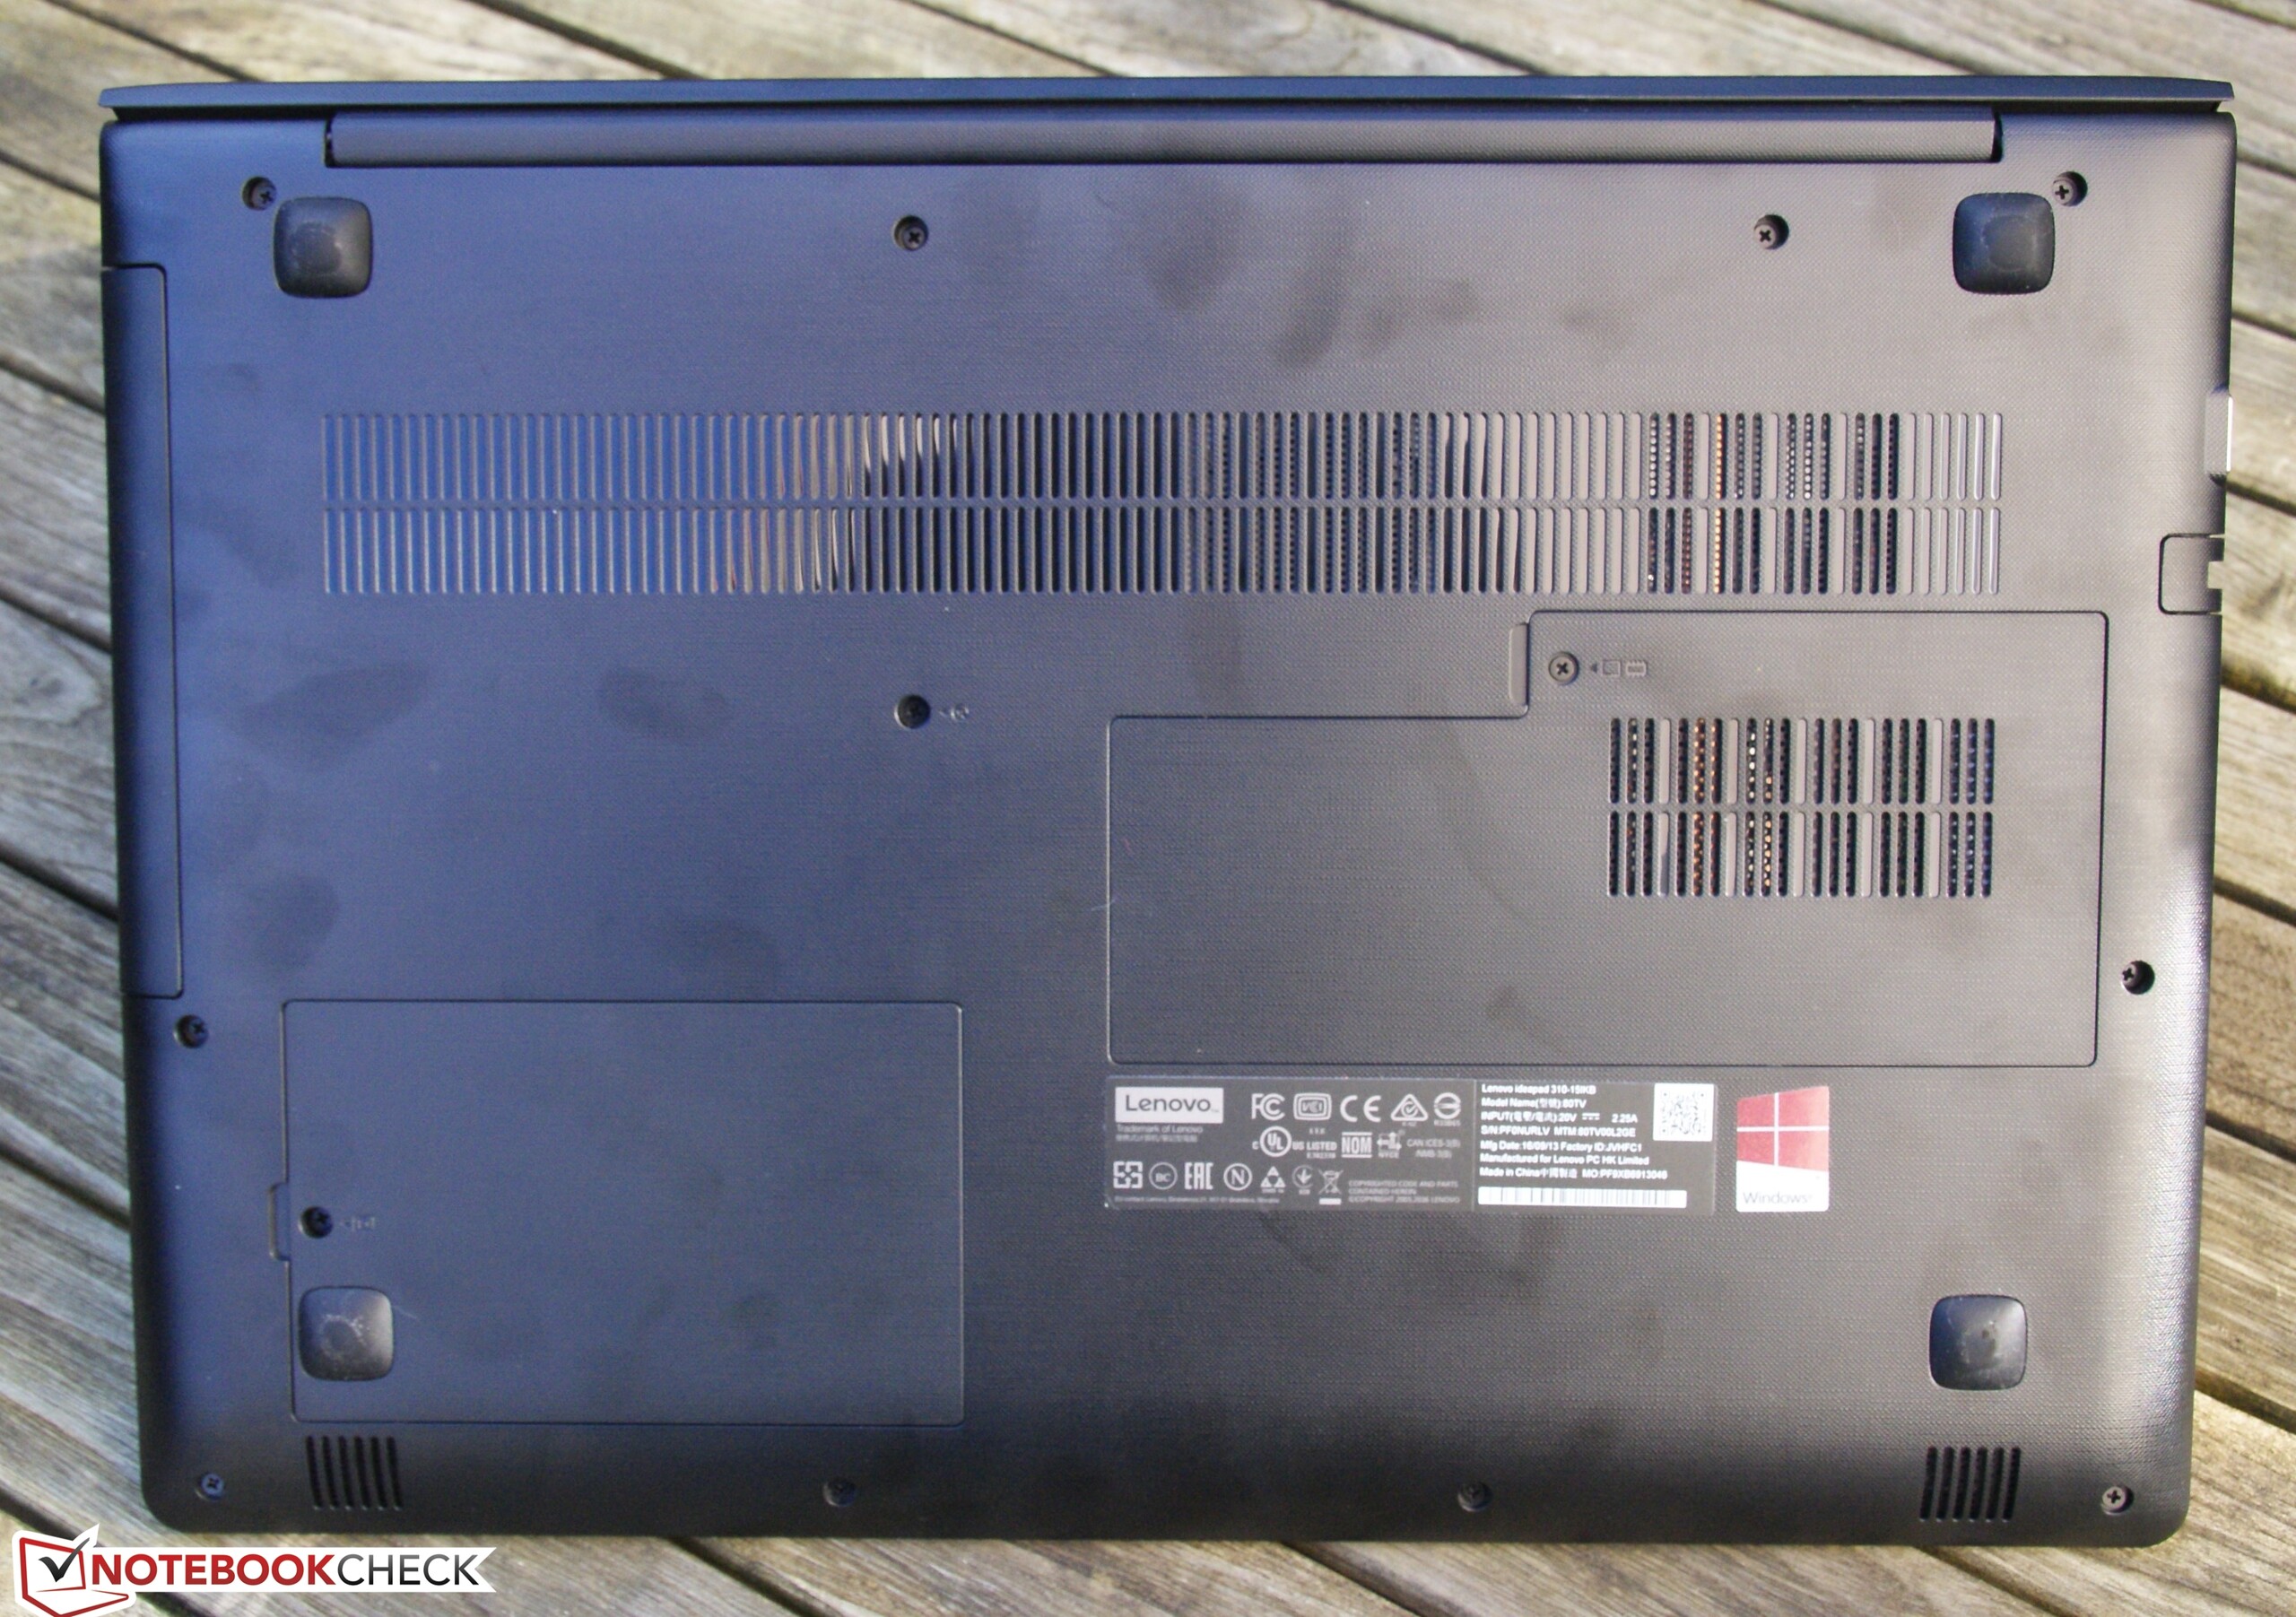
(+) A temperatura máxima no lado superior é 34.1 °C / 93 F, em comparação com a média de 34.3 °C / 94 F , variando de 21.2 a 62.5 °C para a classe Office.
(+) A parte inferior aquece até um máximo de 35.6 °C / 96 F, em comparação com a média de 36.8 °C / 98 F
(+) Em uso inativo, a temperatura média para o lado superior é 25 °C / 77 F, em comparação com a média do dispositivo de 29.5 °C / ### class_avg_f### F.
(+) Os apoios para as mãos e o touchpad são mais frios que a temperatura da pele, com um máximo de 30.2 °C / 86.4 F e, portanto, são frios ao toque.
(-) A temperatura média da área do apoio para as mãos de dispositivos semelhantes foi 27.5 °C / 81.5 F (-2.7 °C / -4.9 F).
Lenovo Ideapad 310-15IKB análise de áudio
(±) | o volume do alto-falante é médio, mas bom (###valor### dB)
Graves 100 - 315Hz
(±) | graves reduzidos - em média 11% menor que a mediana
(±) | a linearidade dos graves é média (13.8% delta para a frequência anterior)
Médios 400 - 2.000 Hz
(+) | médios equilibrados - apenas 3.2% longe da mediana
(±) | a linearidade dos médios é média (7.8% delta para frequência anterior)
Altos 2 - 16 kHz
(+) | agudos equilibrados - apenas 2.4% longe da mediana
(+) | os máximos são lineares (5.7% delta da frequência anterior)
Geral 100 - 16.000 Hz
(±) | a linearidade do som geral é média (15.1% diferença em relação à mediana)
Comparado com a mesma classe
» 14% de todos os dispositivos testados nesta classe foram melhores, 4% semelhantes, 81% piores
» O melhor teve um delta de 7%, a média foi 21%, o pior foi 53%
Comparado com todos os dispositivos testados
» 21% de todos os dispositivos testados foram melhores, 4% semelhantes, 75% piores
» O melhor teve um delta de 4%, a média foi 23%, o pior foi 134%
Apple MacBook 12 (Early 2016) 1.1 GHz análise de áudio
(+) | os alto-falantes podem tocar relativamente alto (###valor### dB)
Graves 100 - 315Hz
(±) | graves reduzidos - em média 11.3% menor que a mediana
(±) | a linearidade dos graves é média (14.2% delta para a frequência anterior)
Médios 400 - 2.000 Hz
(+) | médios equilibrados - apenas 2.4% longe da mediana
(+) | médios são lineares (5.5% delta para frequência anterior)
Altos 2 - 16 kHz
(+) | agudos equilibrados - apenas 2% longe da mediana
(+) | os máximos são lineares (4.5% delta da frequência anterior)
Geral 100 - 16.000 Hz
(+) | o som geral é linear (10.2% diferença em relação à mediana)
Comparado com a mesma classe
» 7% de todos os dispositivos testados nesta classe foram melhores, 2% semelhantes, 90% piores
» O melhor teve um delta de 5%, a média foi 18%, o pior foi 53%
Comparado com todos os dispositivos testados
» 5% de todos os dispositivos testados foram melhores, 1% semelhantes, 94% piores
» O melhor teve um delta de 4%, a média foi 23%, o pior foi 134%
| desligado | |
| Ocioso | |
| Carga |
|
Key:
min: | |
| Lenovo Ideapad 310-15IKB i5-7200U, HD Graphics 620, Hynix HFS128G3MND, TN LED, 1920x1080, 15.6" | Lenovo IdeaPad 510-15IKB 80SV0087GE i7-7500U, GeForce 940MX, Liteonit CV3-DE256, IPS, 1920x1080, 15.6" | HP 250 G5 SP X0N33EA 6200U, HD Graphics 520, SanDisk Z400s SD8SNAT-256G, TN, 1920x1080, 15.6" | Medion Akoya P6670 6200U, GeForce 940MX, Phison S11-128G, IPS, 1920x1080, 15.6" | Lenovo Ideapad 310-15ISK 6500U, GeForce 920MX, WDC Scorpio Blue WD10JPCX-24UE4T0, TN LED, 1366x768, 15.6" | |
|---|---|---|---|---|---|
| Power Consumption | -22% | 12% | -49% | -40% | |
| Idle Minimum * (Watt) | 3.5 | 3.9 -11% | 3.6 -3% | 6.7 -91% | 7 -100% |
| Idle Average * (Watt) | 6.1 | 7.4 -21% | 6 2% | 9.2 -51% | 8 -31% |
| Idle Maximum * (Watt) | 7 | 9.5 -36% | 6.4 9% | 9.7 -39% | 8.4 -20% |
| Load Average * (Watt) | 31.2 | 41 -31% | 26 17% | 40.6 -30% | 38.8 -24% |
| Load Maximum * (Watt) | 42.9 | 48 -12% | 28.1 34% | 58 -35% | 52.8 -23% |
* ... menor é melhor
| Lenovo Ideapad 310-15IKB i5-7200U, HD Graphics 620, 30 Wh | Lenovo IdeaPad 510-15IKB 80SV0087GE i7-7500U, GeForce 940MX, 30 Wh | HP 250 G5 SP X0N33EA 6200U, HD Graphics 520, 41 Wh | Medion Akoya P6670 6200U, GeForce 940MX, 44 Wh | Lenovo Ideapad 310-15ISK 6500U, GeForce 920MX, 31 Wh | |
|---|---|---|---|---|---|
| Duração da bateria | 21% | 29% | 24% | 45% | |
| Reader / Idle (h) | 10.2 | 10.6 4% | |||
| WiFi v1.3 (h) | 3.8 | 4.6 21% | 5.8 53% | 4.7 24% | 5.5 45% |
| Load (h) | 1.4 | 1.8 29% | |||
| H.264 (h) | 5.2 |
Pro
Contra
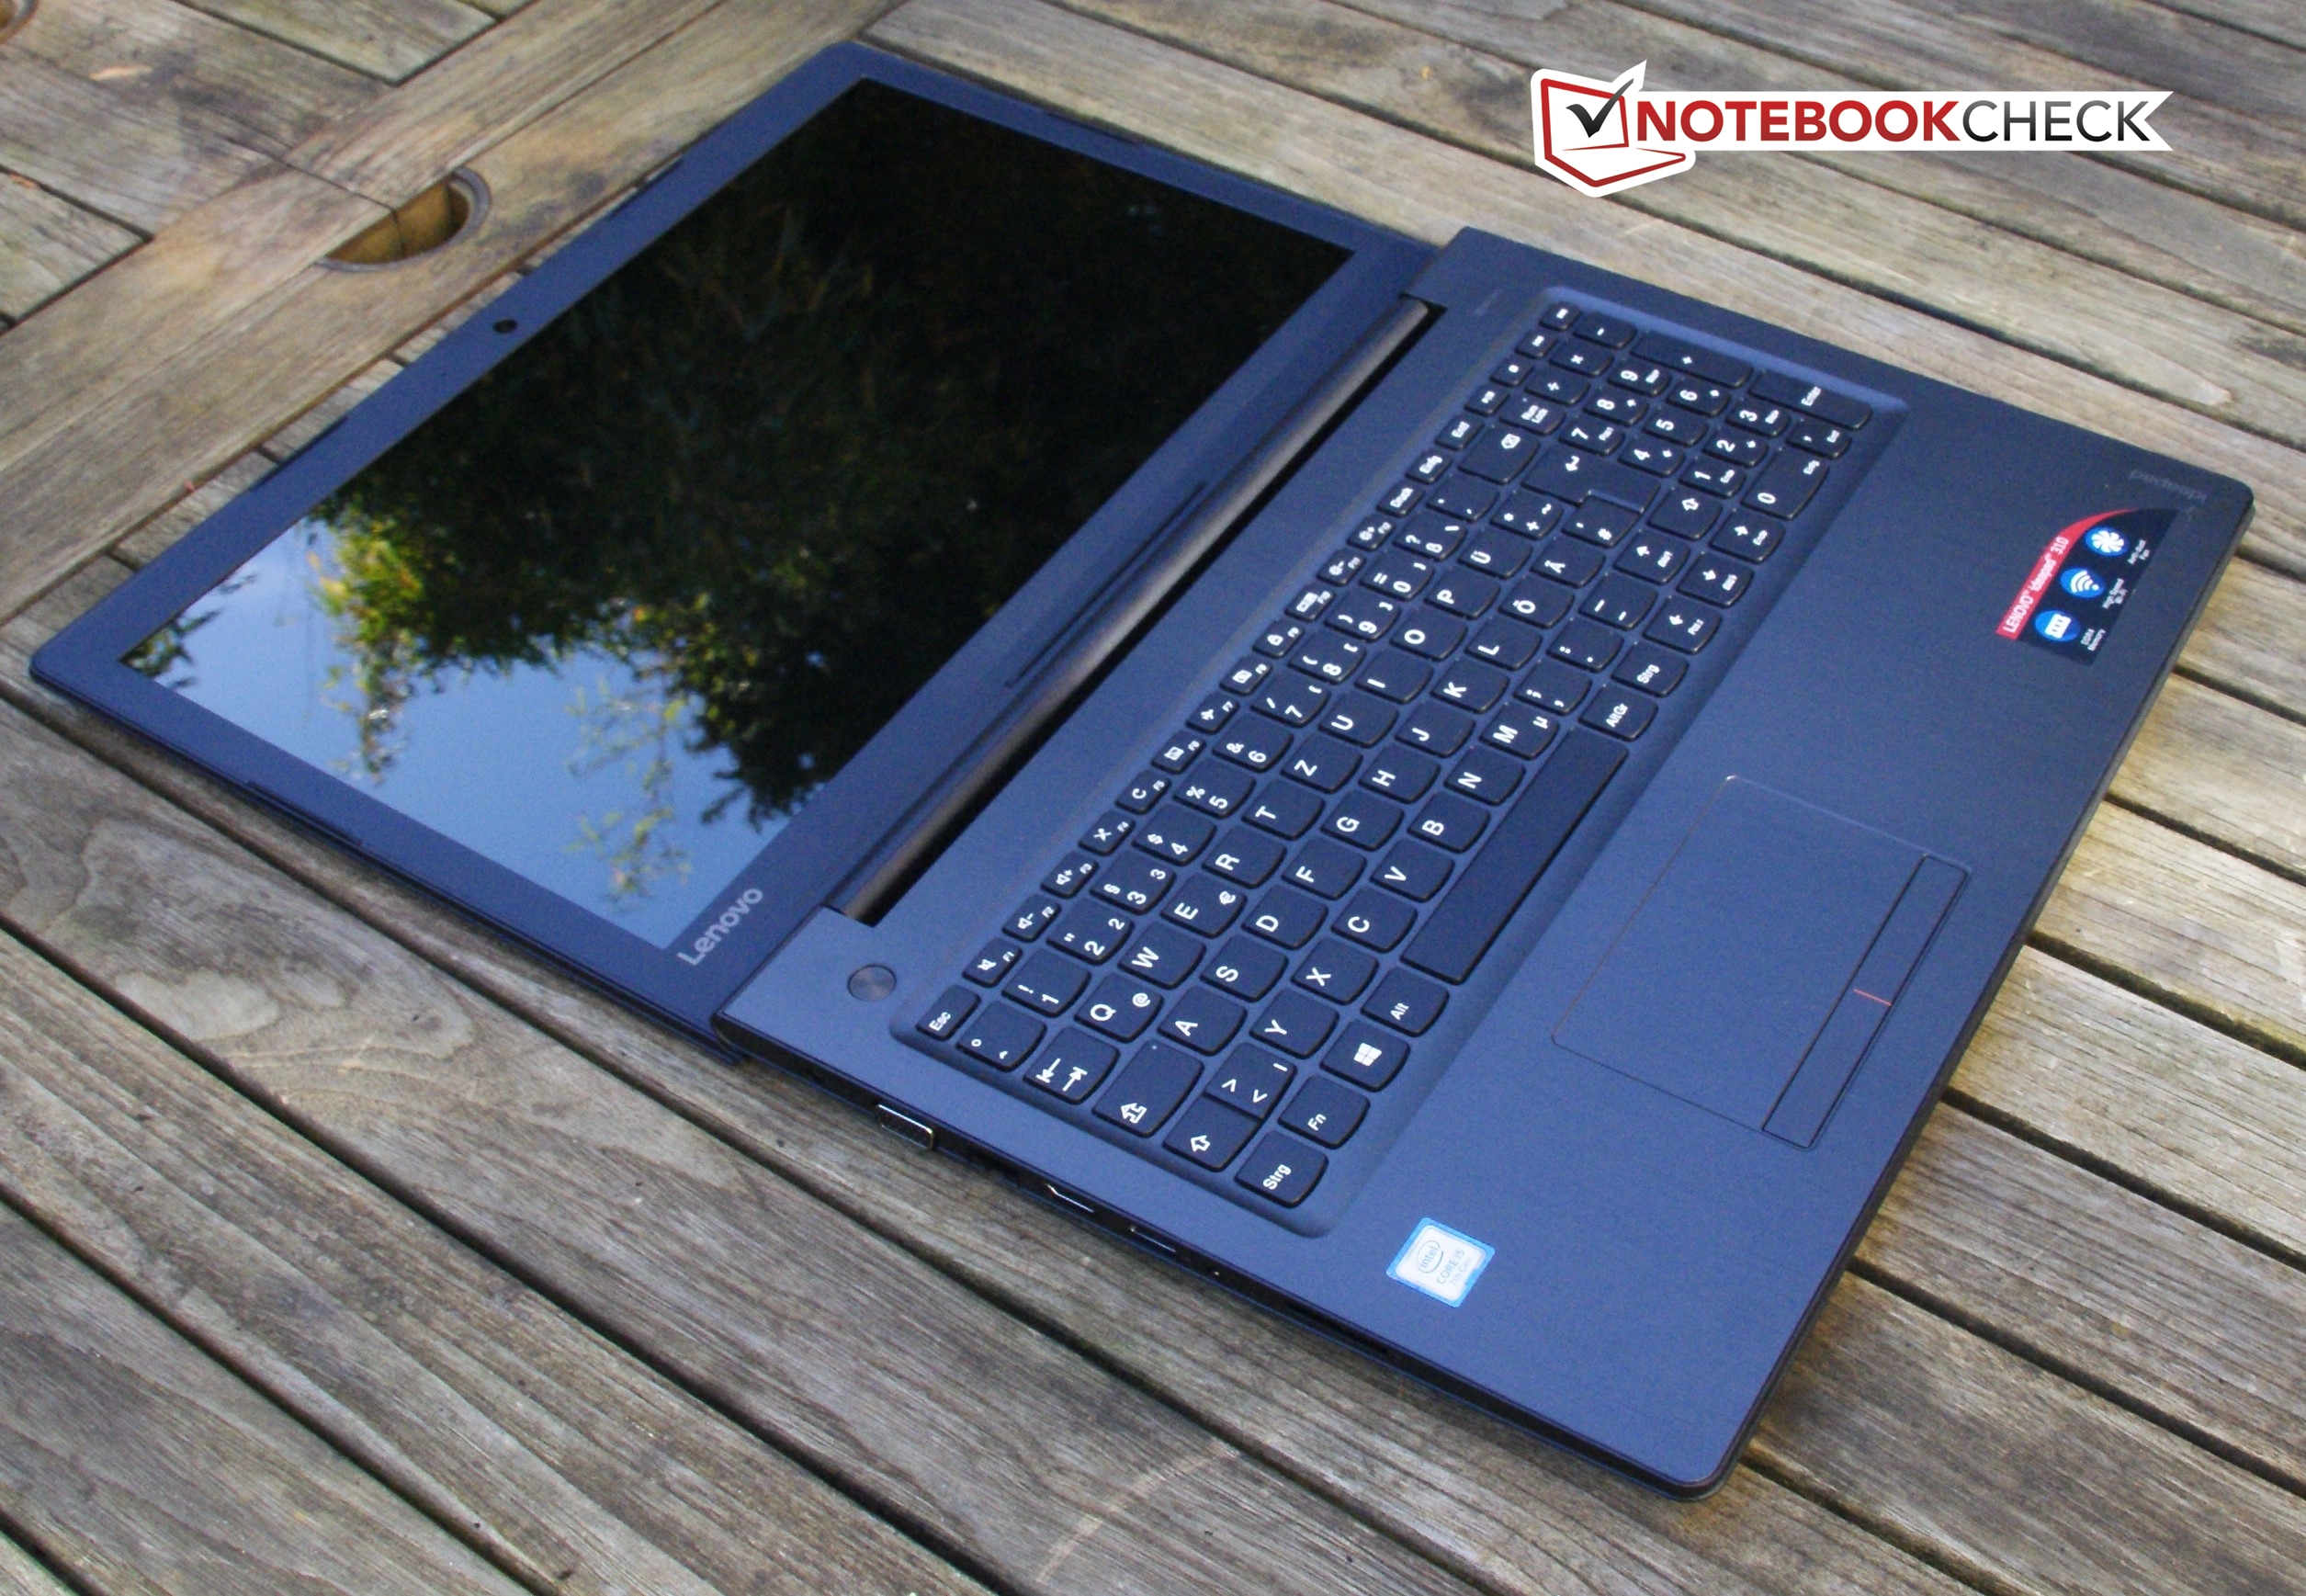
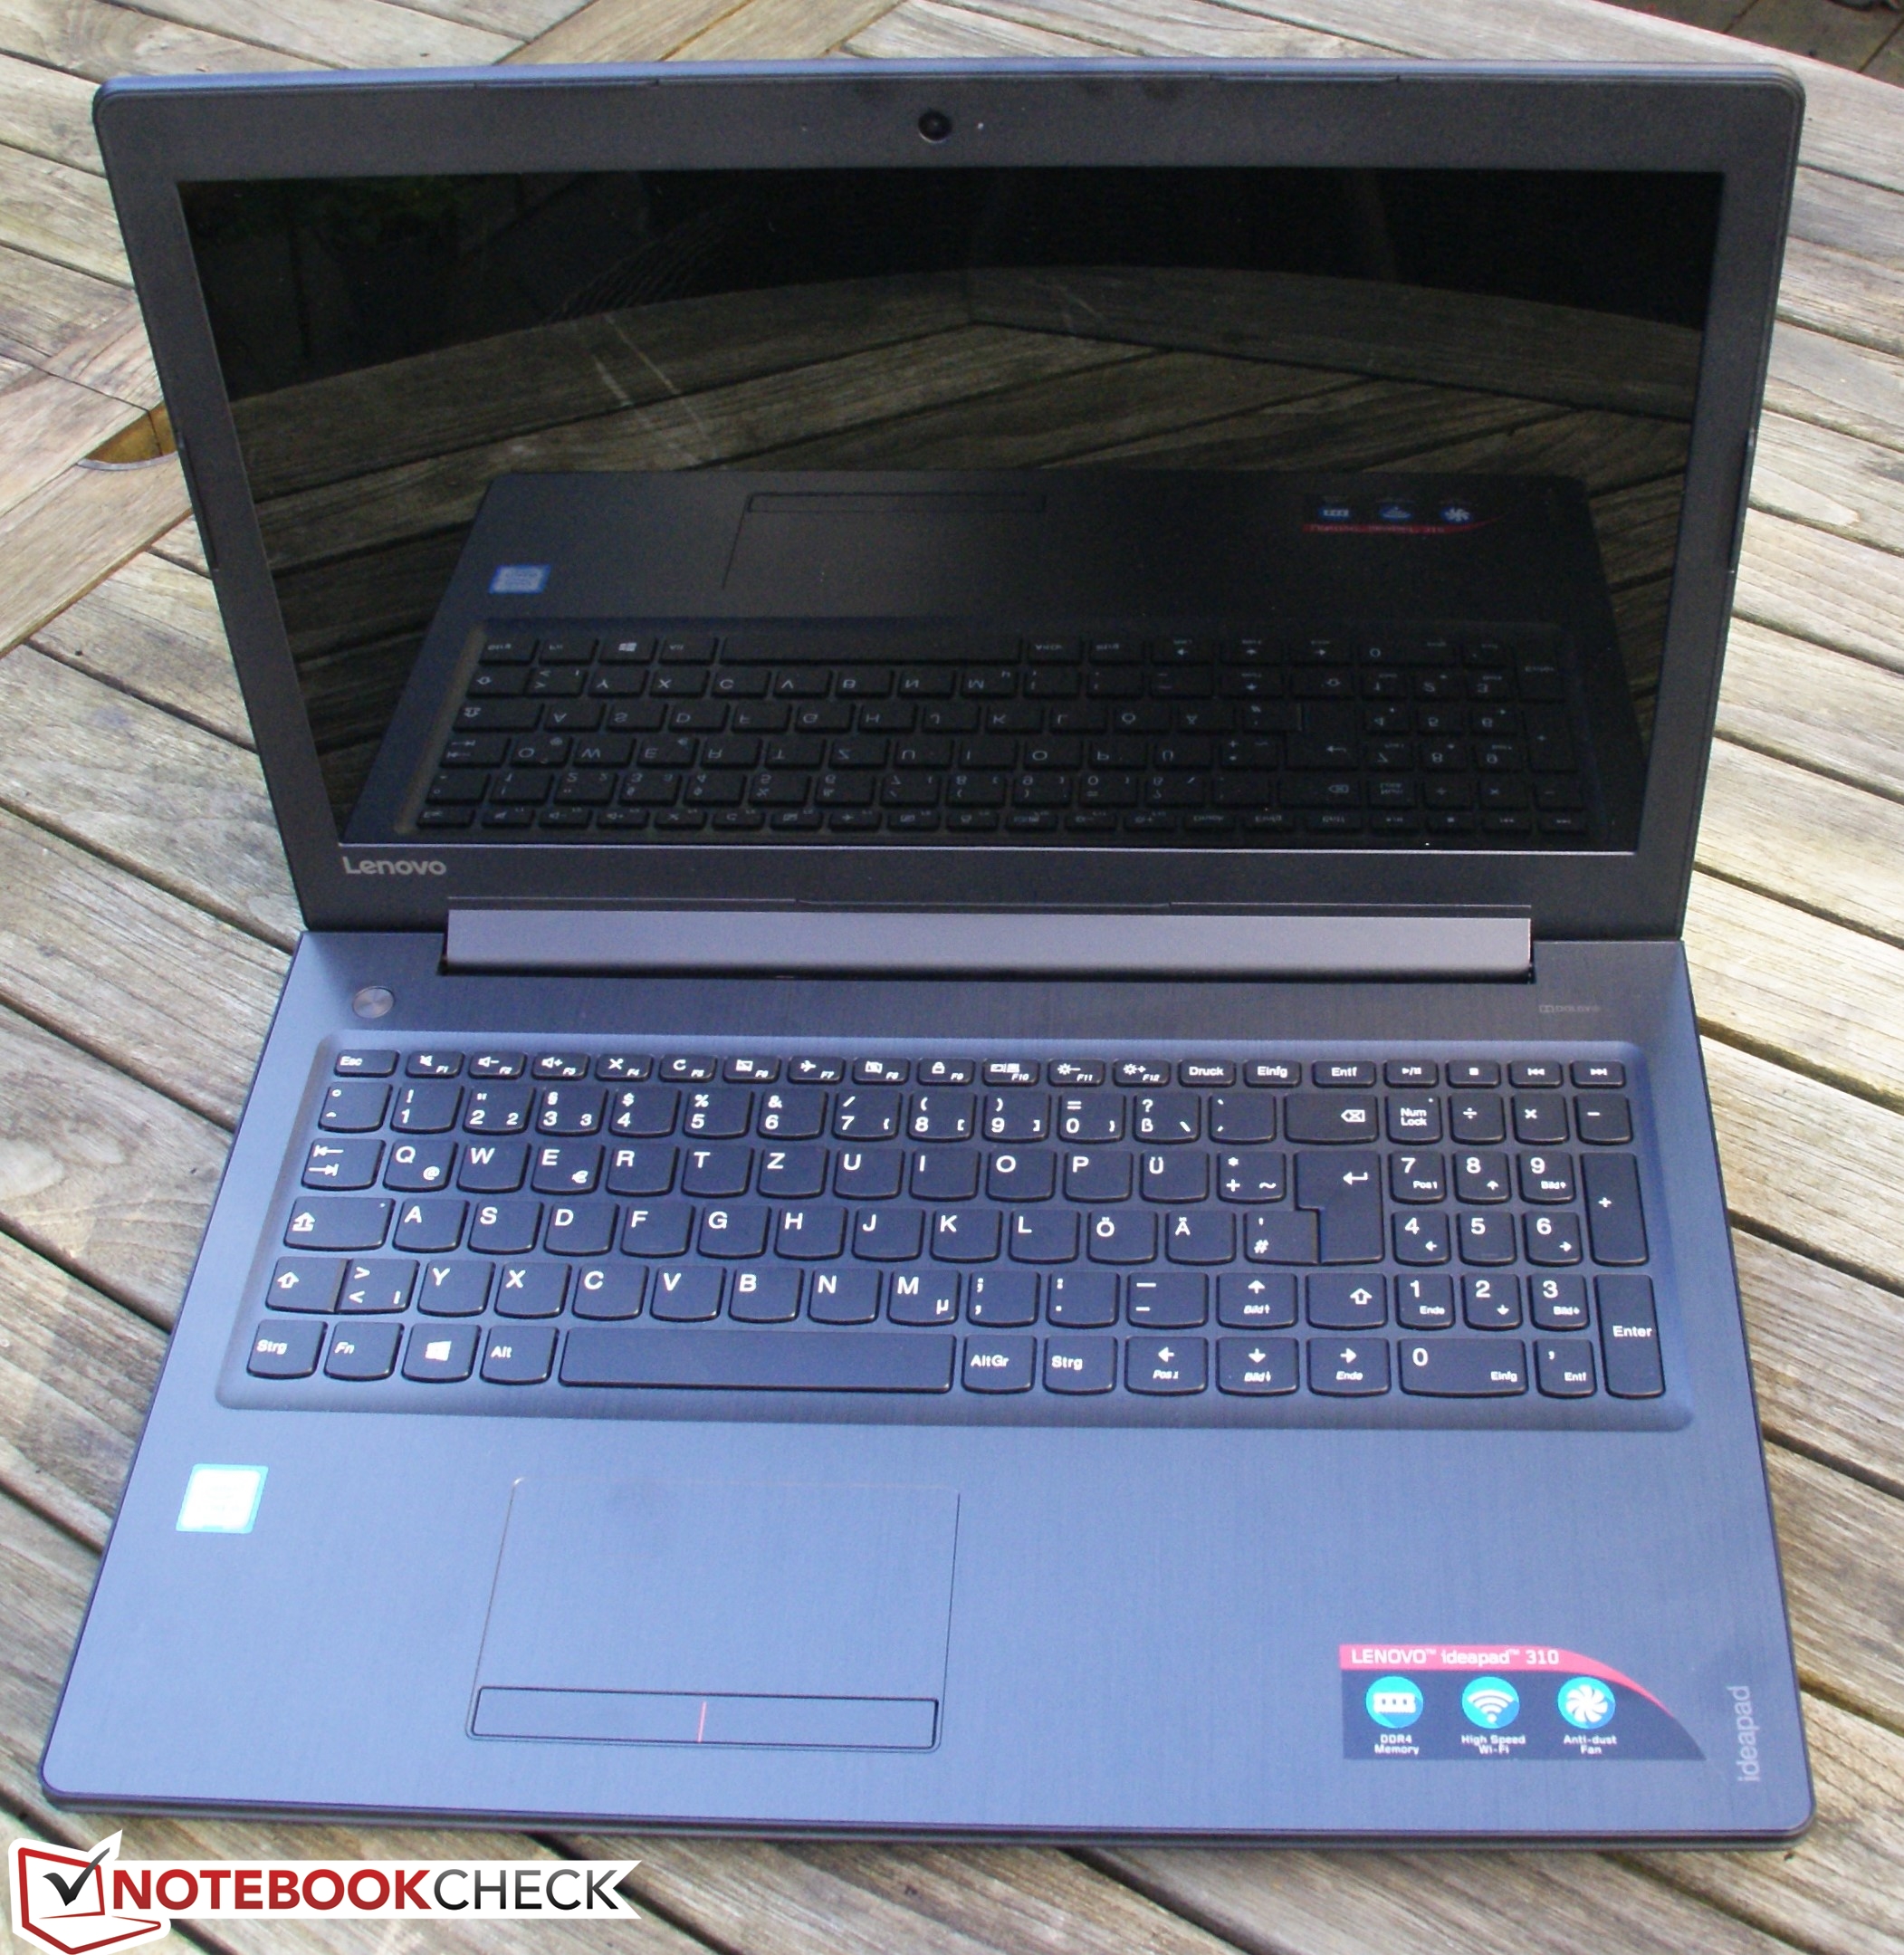
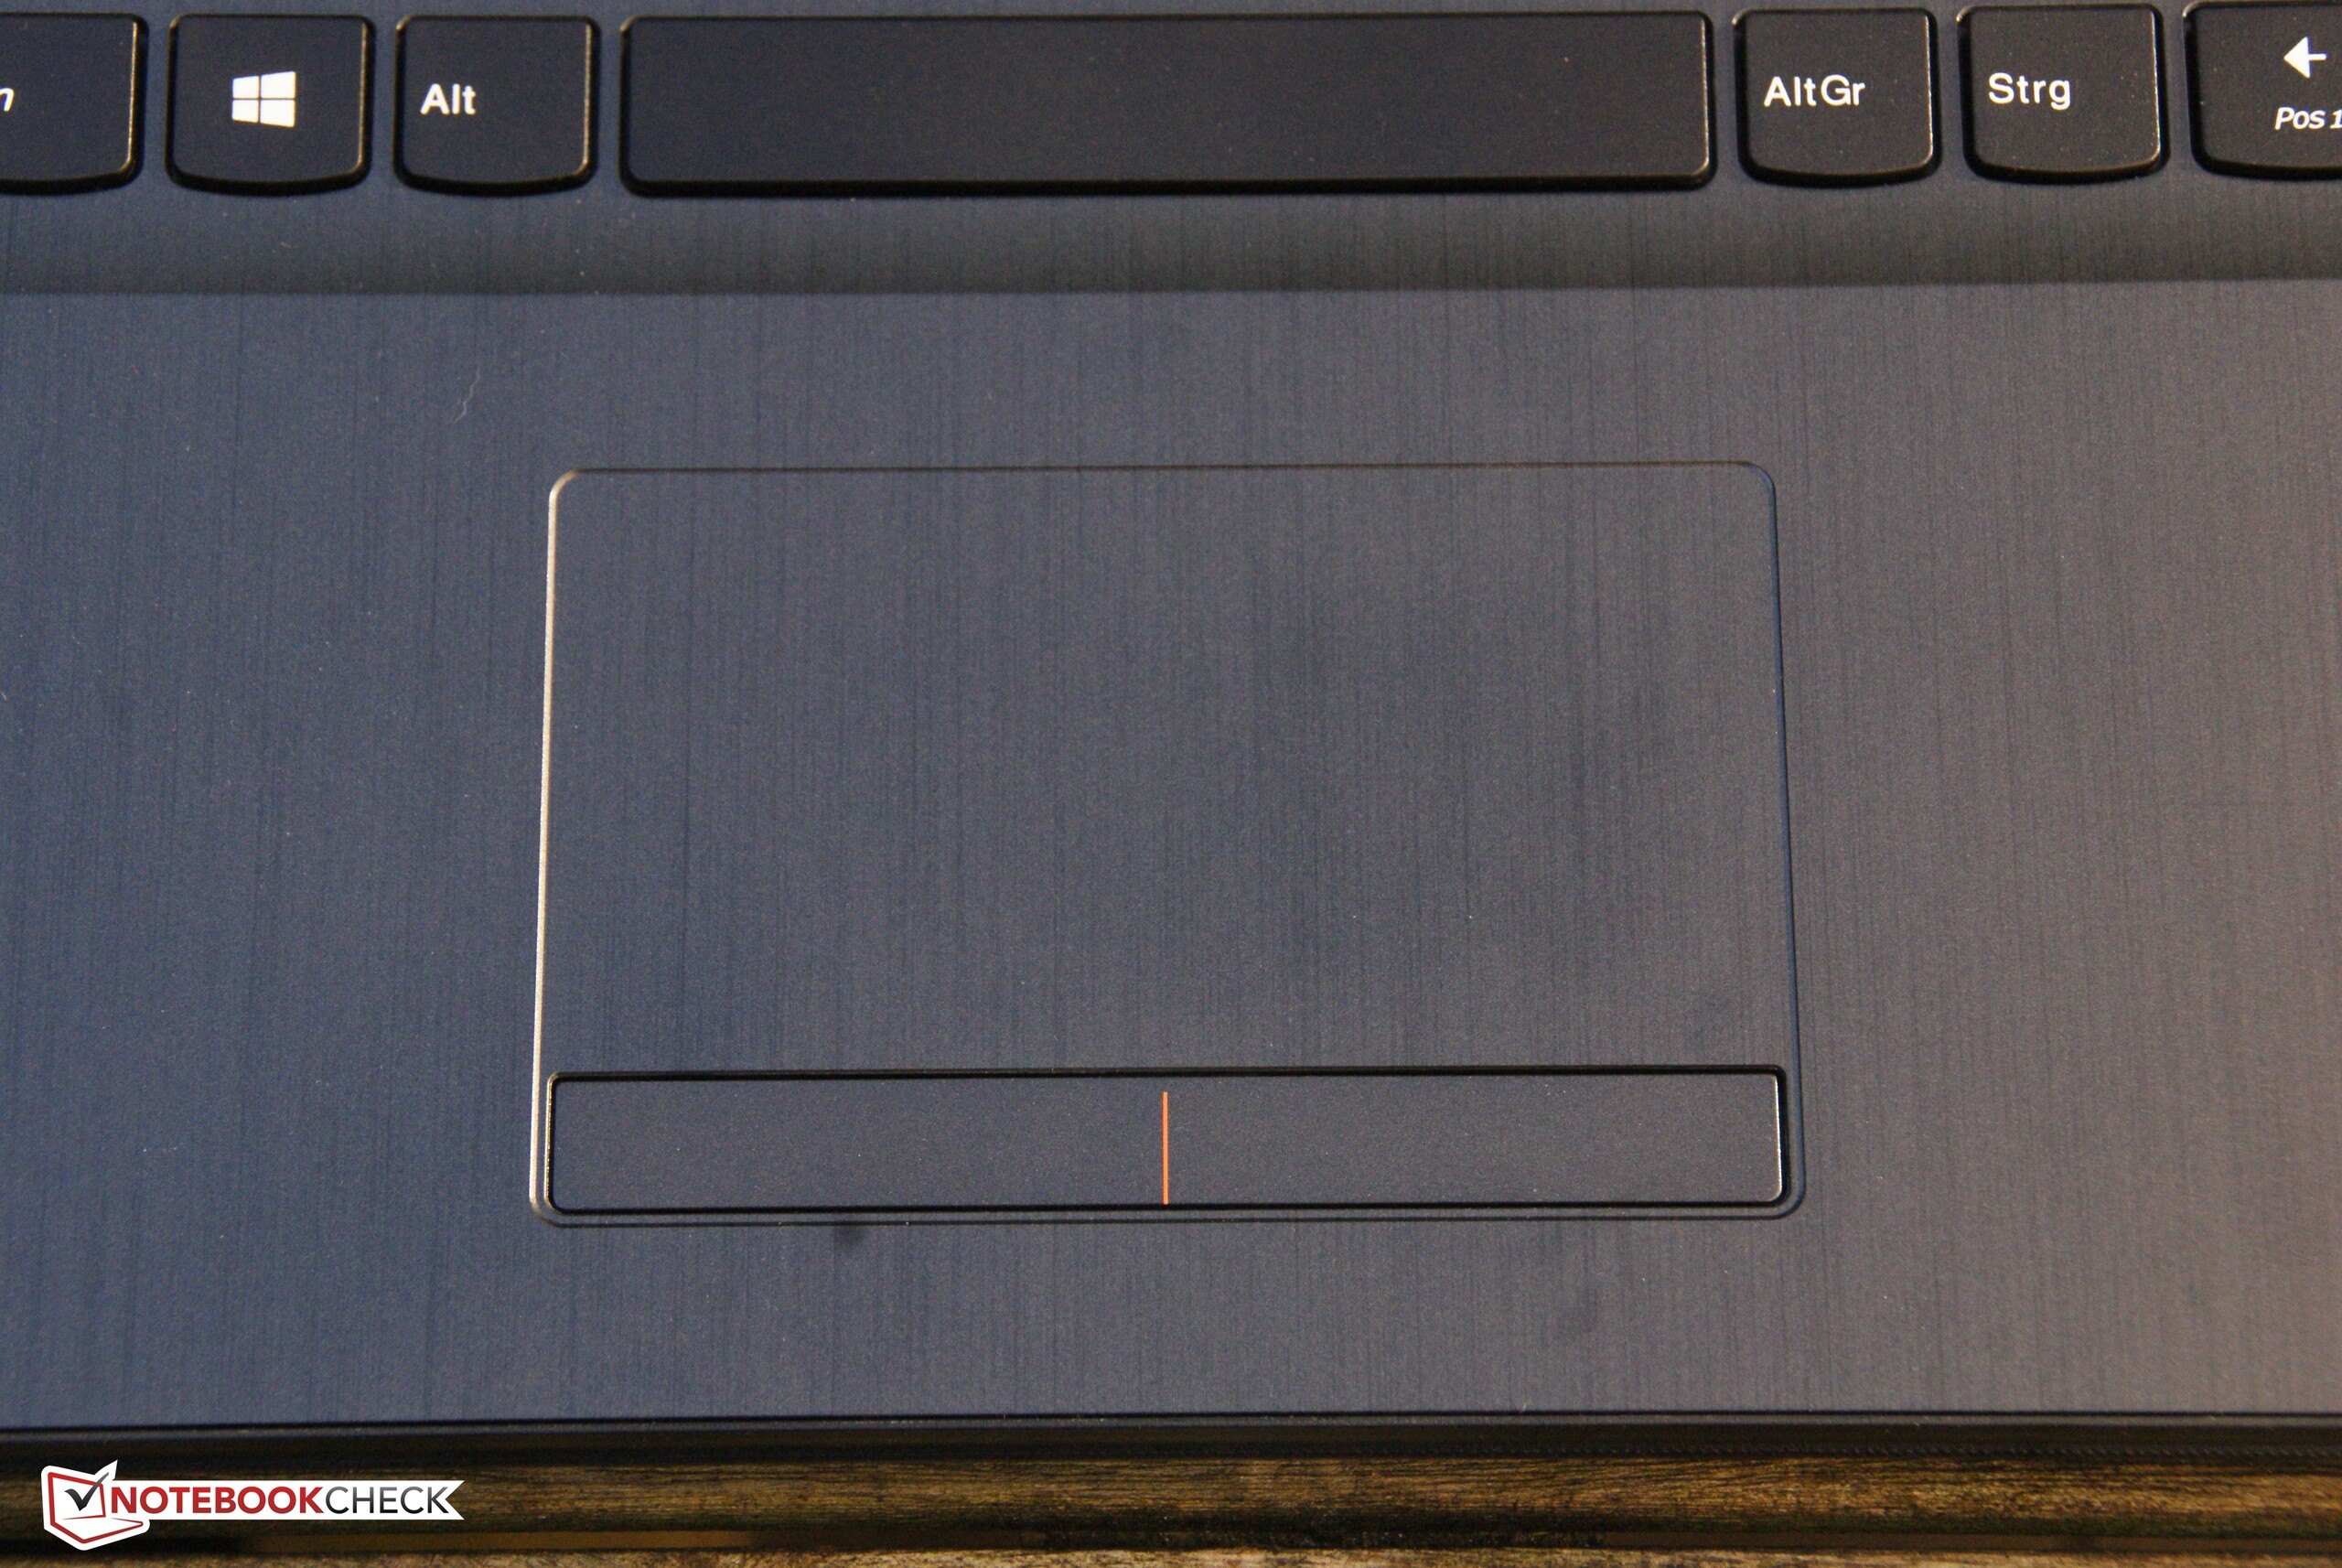
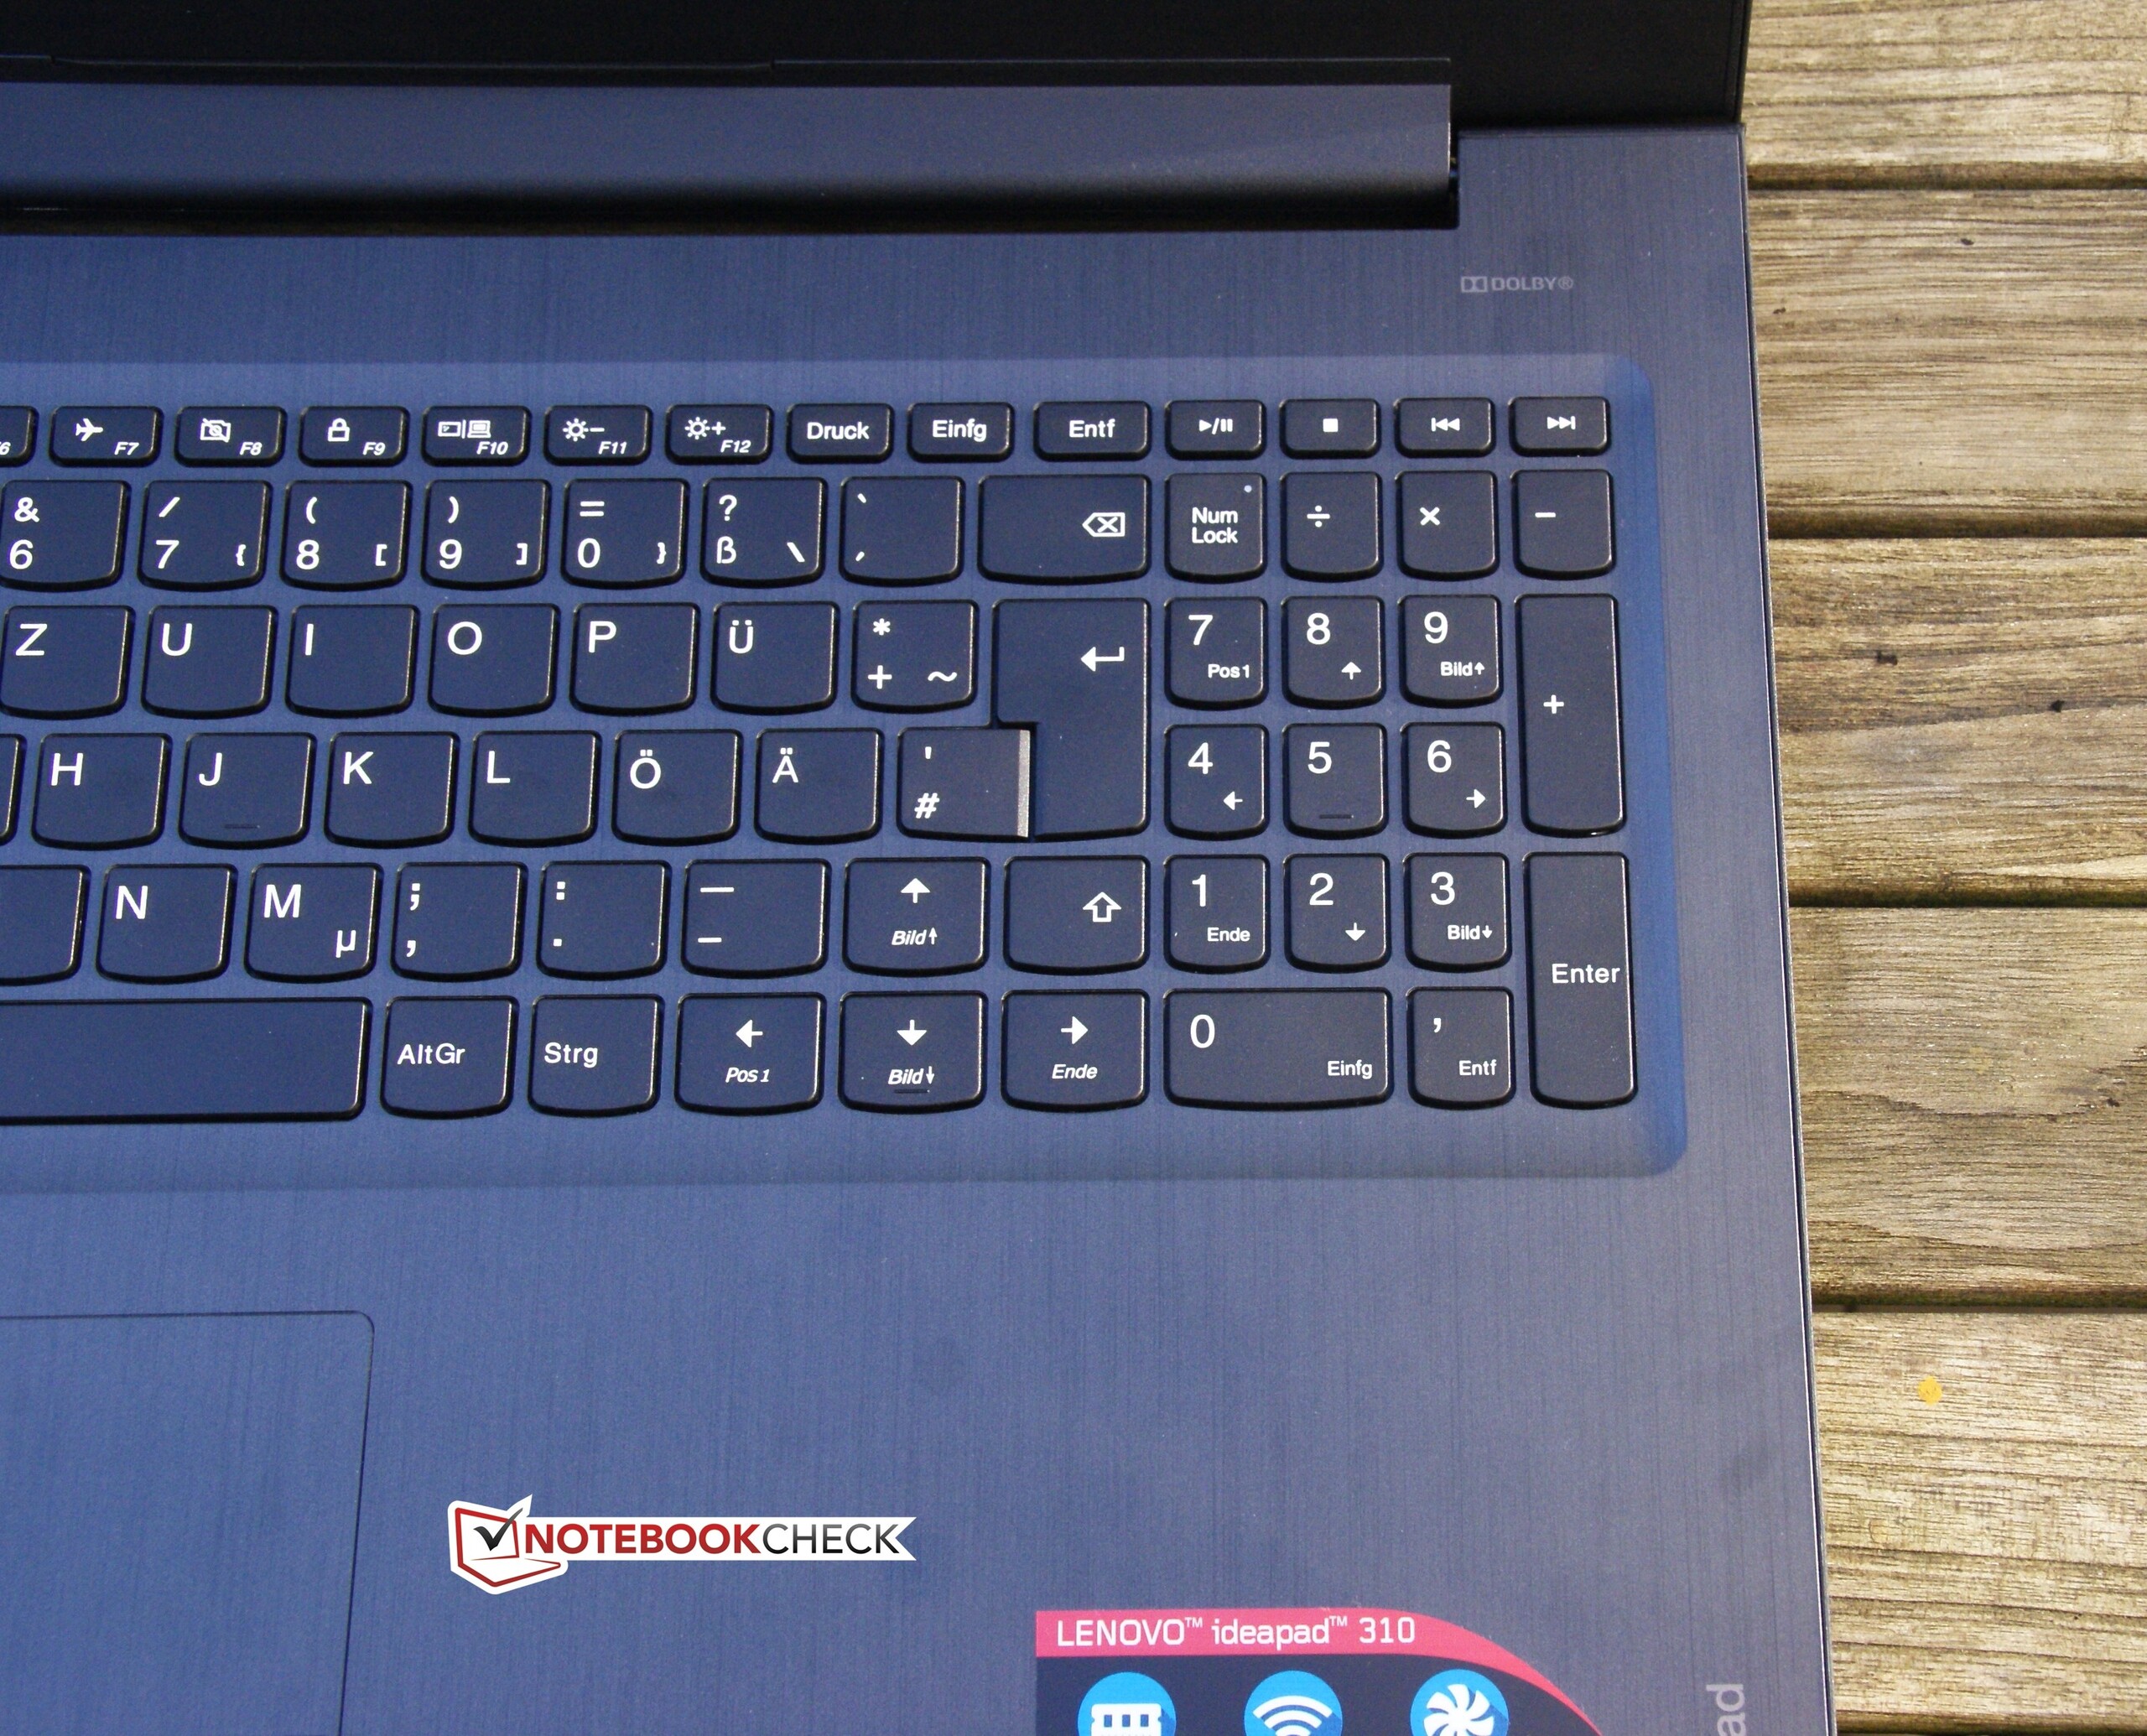
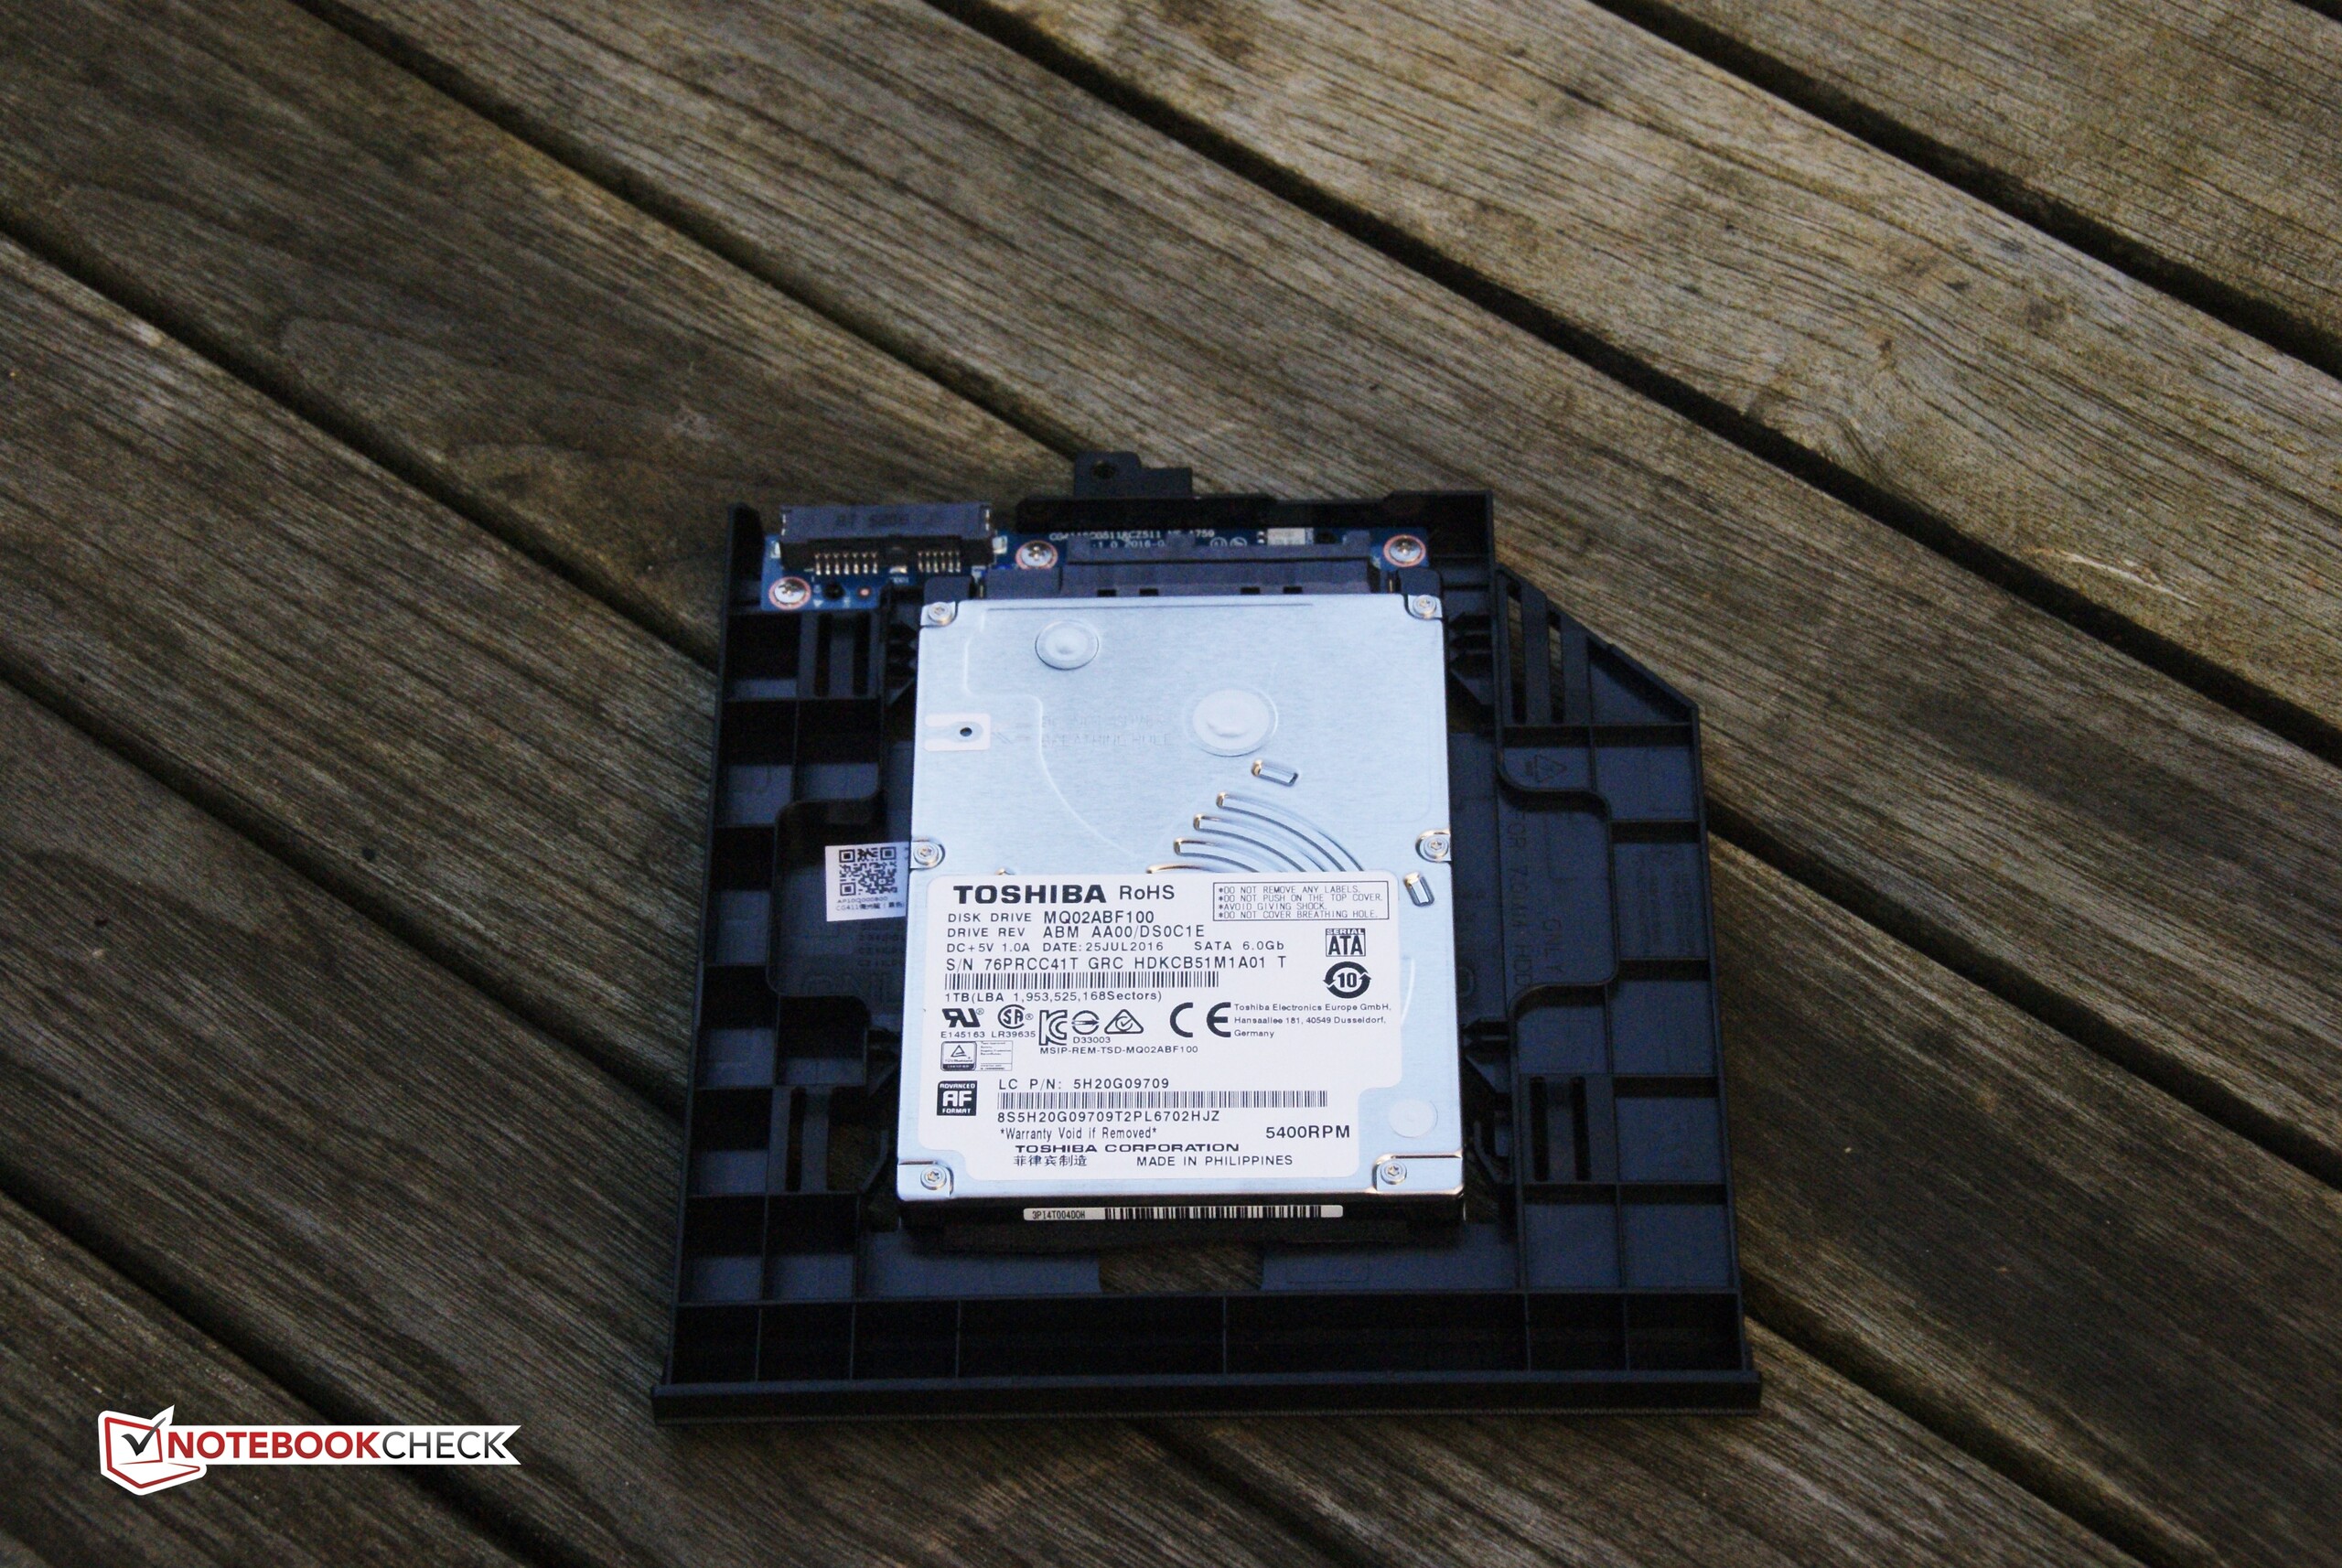
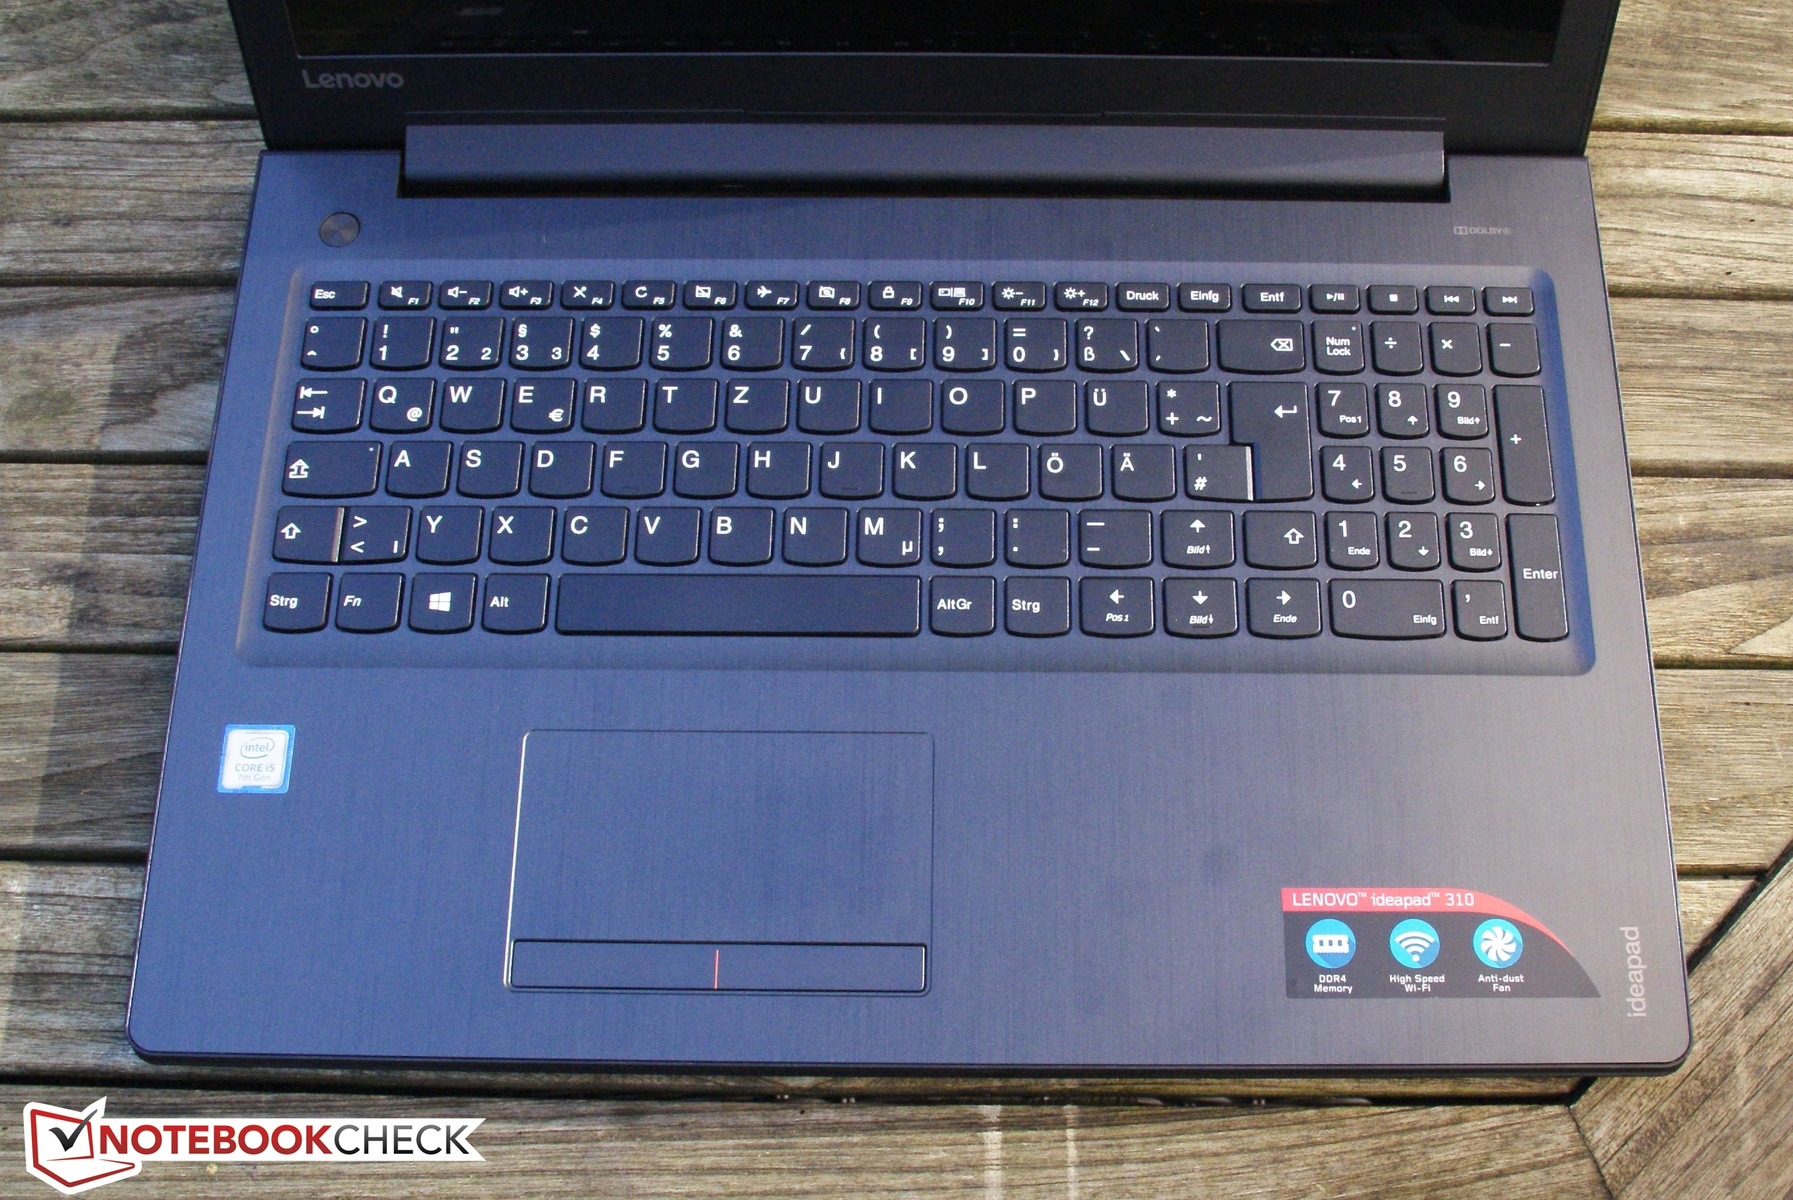
O Lenovo IdeaPad 310-15IKB tem como objetivo ser um poli funcional de escritório e multimídia. No entanto, para ser um verdadeiro portátil multimídia, ele precisa ter uma tela melhor e possivelmente uma GPU mais potente. Por outro lado, o portátil definitivamente é um bom portátil de escritório com certas fraquezas. Se você gosta de trabalhar em paz, então este modelo pode não ser para você, dado que o HD do IdeaPad é um companheiro barulhento constante. Este problema pode ser resolvido trocando o HD por um SSD. As barras/teclas do mouse também são bastante irritantes de usar, mas o teclado é confiável. Trabalhar durante uma viagem não é possível devido á tela pobre e à bateria pequena.
No final do dia, não conseguimos reunir suficientes motivos para recomendar o IdeaPad. Definitivamente é médio e não consegue se destacar entre a multidão.
Por que você deveria comprar o IdeaPad 310-15IKB? A principal motivo é o preço. Este portátil é mais barato que alguns de seus concorrentes. No entanto, por outro lado, você verá que pagando um pouco mais pode obter um painel IPS muito melhor. Este é um ponto especialmente importante, dado que a tela de qualidade pobre do nosso modelo de teste é uma de suas maiores fraquezas.
Lenovo Ideapad 310-15IKB
- 11/29/2016 v5.1 (old)
Benjamin Herzig