 Deutsch
 English
 Español
 Français
 Italiano
 Nederlands
 Polski
 Português
 Русский
 Türkçe
 Svenska
 Chinese
 Magyar
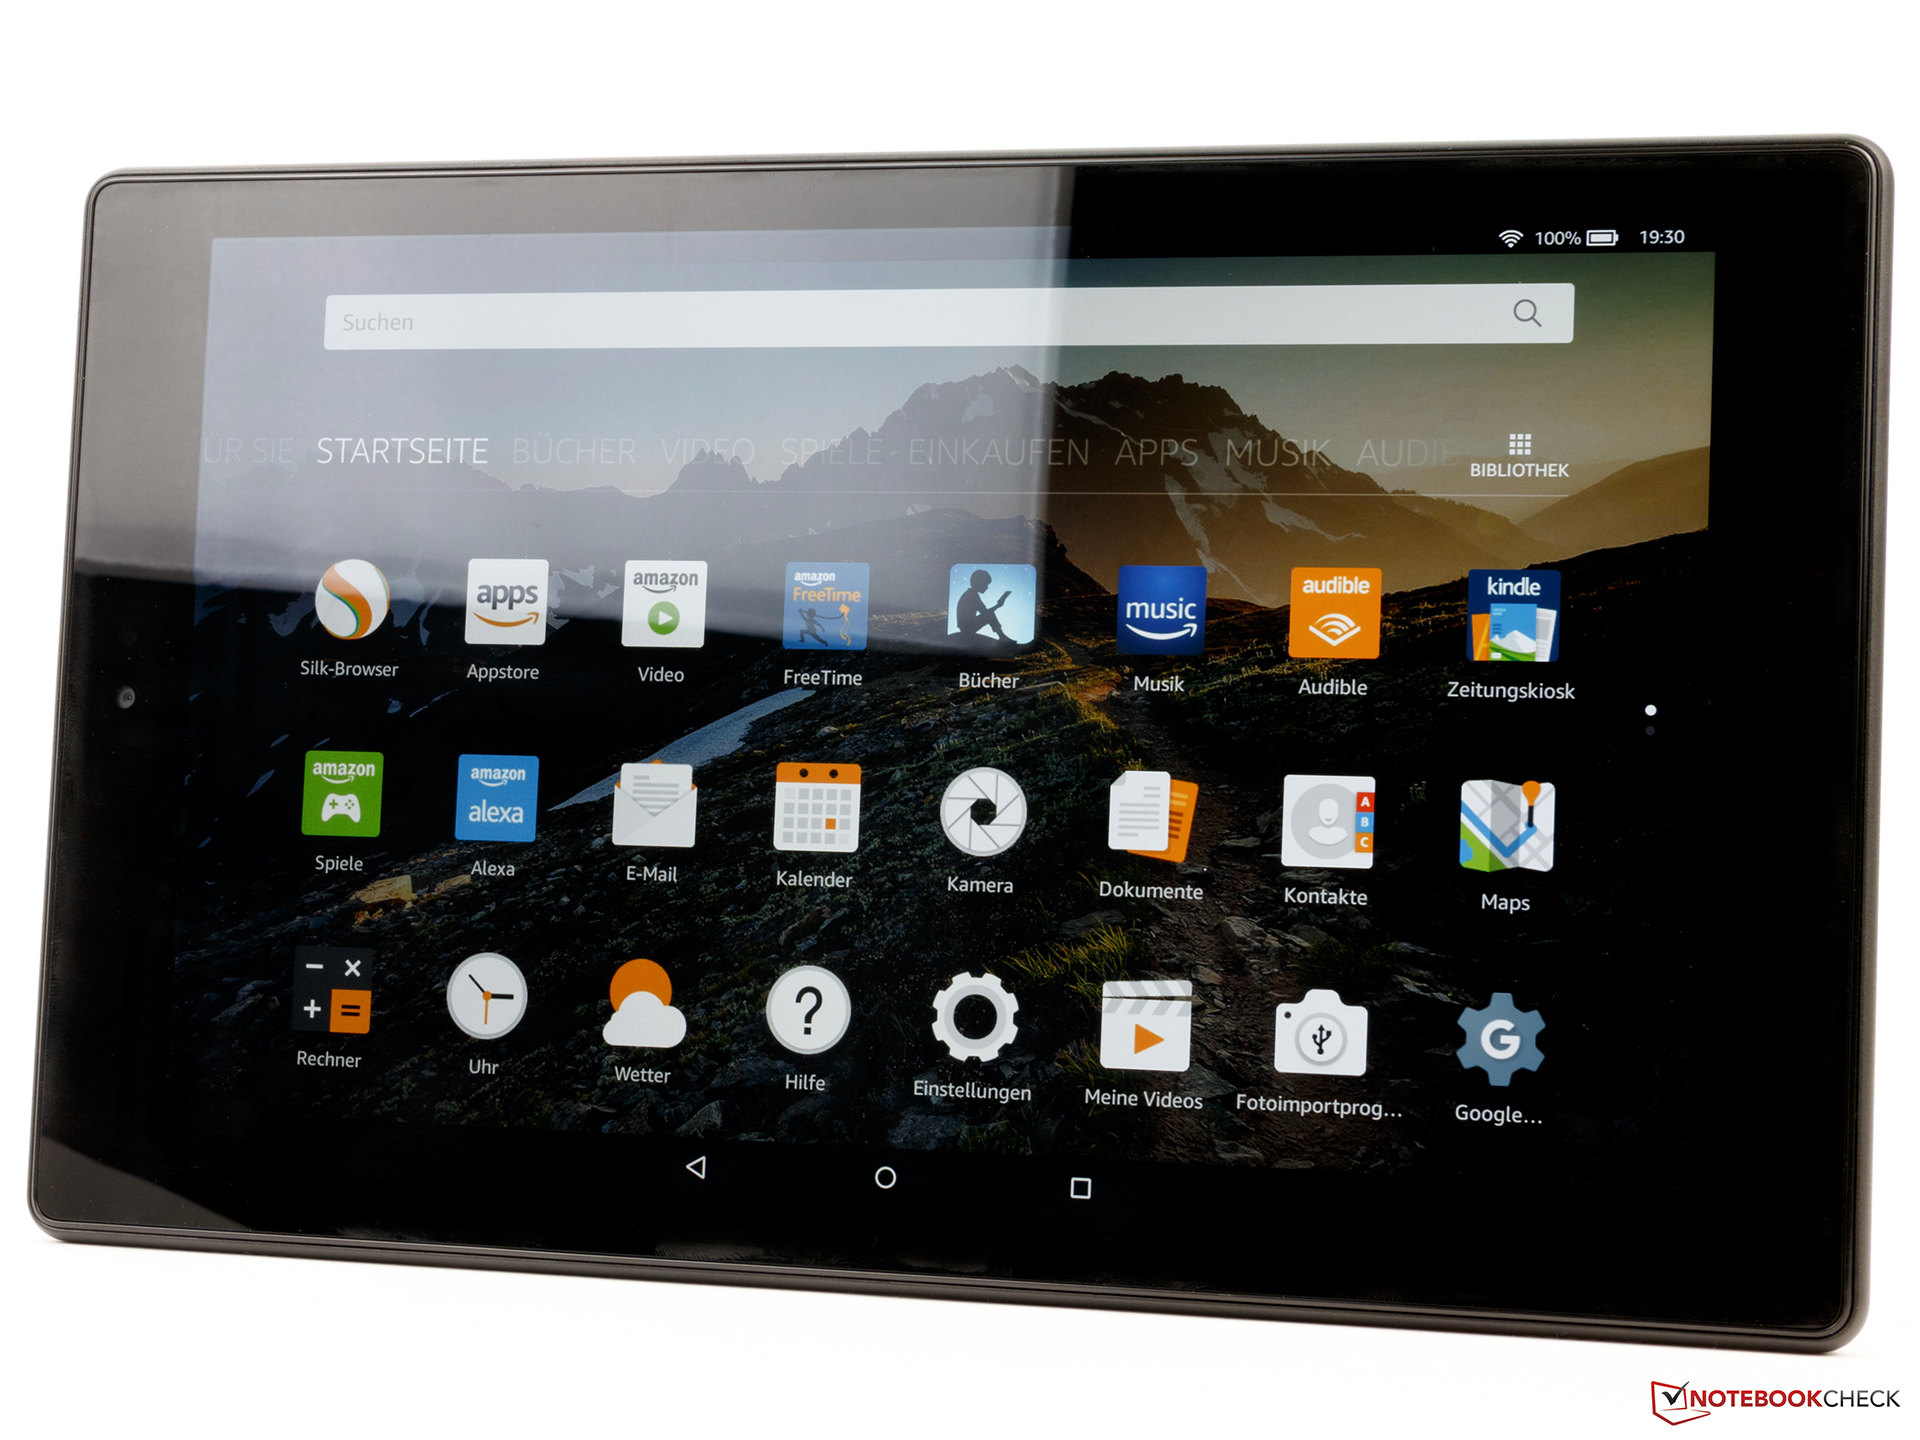
Breve Análise do Tablet Amazon Fire HD 10 (2017)


| Networking | |
| iperf3 transmit AX12 | |
| Apple iPad (2017) | |
| Asus ZenPad 3s 10 Z500M | |
| Amazon Fire HD 10 2017 | |
| Huawei MediaPad T3 10 | |
| Lenovo Tab 4 10 | |
| iperf3 receive AX12 | |
| Apple iPad (2017) | |
| Asus ZenPad 3s 10 Z500M | |
| Amazon Fire HD 10 2017 | |
| Huawei MediaPad T3 10 | |
| Lenovo Tab 4 10 | |


| |||||||||||||||||||||||||
iluminação: 91 %
iluminação com acumulador: 426 cd/m²
Contraste: 1121:1 (Preto: 0.38 cd/m²)
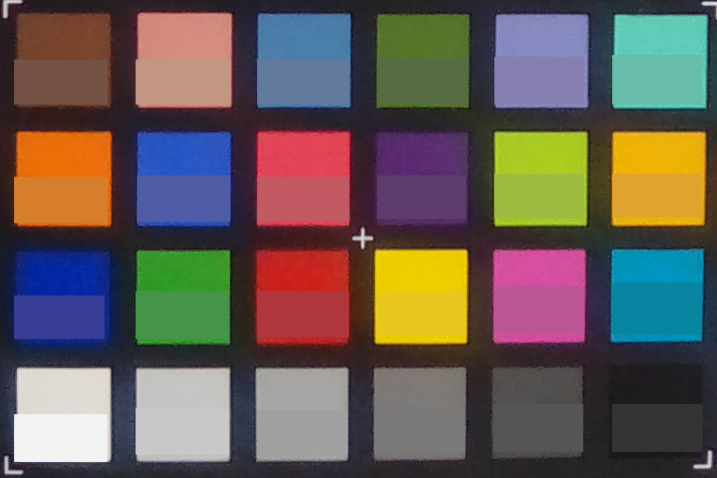
ΔE Color 4.5 | 0.5-29.43 Ø5
ΔE Greyscale 5.2 | 0.57-98 Ø5.3
Gamma: 2.23
| Amazon Fire HD 10 2017 IPS, 1920x1200, 10.10 | Asus ZenPad 3s 10 Z500M IPS, 2048x1536, 9.70 | Lenovo Tab 4 10 IPS, 1280x800, 10.10 | Huawei MediaPad T3 10 IPS, 1280x800, 9.60 | Apple iPad (2017) IPS, 2048x1536, 9.70 | |
|---|---|---|---|---|---|
| Screen | -11% | 0% | 2% | 26% | |
| Brightness middle | 426 | 489 15% | 316 -26% | 410 -4% | 514 21% |
| Brightness | 399 | 443 11% | 305 -24% | 409 3% | 485 22% |
| Brightness Distribution | 91 | 86 -5% | 86 -5% | 92 1% | 88 -3% |
| Black Level * | 0.38 | 0.43 -13% | 0.2 47% | 0.32 16% | 0.46 -21% |
| Contrast | 1121 | 1137 1% | 1580 41% | 1281 14% | 1117 0% |
| Colorchecker dE 2000 * | 4.5 | 5.5 -22% | 5 -11% | 4.5 -0% | 1.4 69% |
| Colorchecker dE 2000 max. * | 7.9 | 11.6 -47% | 8.7 -10% | 14.2 -80% | 2.9 63% |
| Greyscale dE 2000 * | 5.2 | 6.7 -29% | 5.7 -10% | 2 62% | 2.1 60% |
| Gamma | 2.23 99% | 2.06 107% | 2.25 98% | 2.17 101% | 2.22 99% |
| CCT | 6875 95% | 7457 87% | 7921 82% | 6930 94% | 6647 98% |
* ... smaller is better
Screen Flickering / PWM (Pulse-Width Modulation)
| Screen flickering / PWM detected | 80650 Hz | ≤ 55 % brightness setting | 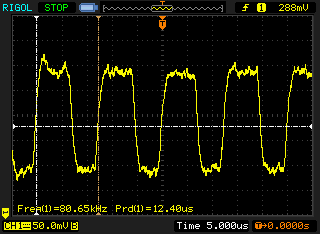 |
The display backlight flickers at 80650 Hz (worst case, e.g., utilizing PWM) Flickering detected at a brightness setting of 55 % and below. There should be no flickering or PWM above this brightness setting. The frequency of 80650 Hz is quite high, so most users sensitive to PWM should not notice any flickering. In comparison: 53 % of all tested devices do not use PWM to dim the display. If PWM was detected, an average of 17903 (minimum: 5 - maximum: 3846000) Hz was measured. | |||
Display Response Times
| ↔ Response Time Black to White | ||
|---|---|---|
| 37.2 ms ... rise ↗ and fall ↘ combined | ↗ 12.4 ms rise | 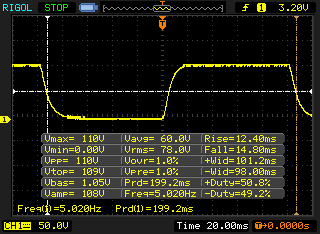 |
| ↘ 14.8 ms fall | ||
| The screen shows slow response rates in our tests and will be unsatisfactory for gamers. In comparison, all tested devices range from 0.1 (minimum) to 240 (maximum) ms. » 95 % of all devices are better. This means that the measured response time is worse than the average of all tested devices (21.5 ms). | ||
| ↔ Response Time 50% Grey to 80% Grey | ||
| 40.4 ms ... rise ↗ and fall ↘ combined | ↗ 22 ms rise | 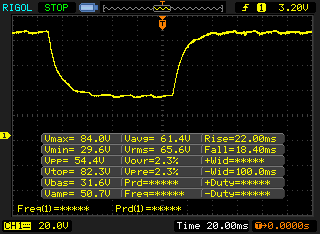 |
| ↘ 18.4 ms fall | ||
| The screen shows slow response rates in our tests and will be unsatisfactory for gamers. In comparison, all tested devices range from 0.2 (minimum) to 636 (maximum) ms. » 58 % of all devices are better. This means that the measured response time is worse than the average of all tested devices (33.7 ms). | ||
| AnTuTu v6 - Total Score | |
| Apple iPad (2017) | |
| Asus ZenPad 3s 10 Z500M | |
| Amazon Fire HD 10 2017 | |
| Huawei MediaPad T3 10 | |
| Lenovo Tab 4 10 | |
| PCMark for Android | |
| Work performance score | |
| Amazon Fire HD 10 2017 | |
| Huawei MediaPad T3 10 | |
| Lenovo Tab 4 10 | |
| Asus ZenPad 3s 10 Z500M | |
| Work 2.0 performance score | |
| Amazon Fire HD 10 2017 | |
| Huawei MediaPad T3 10 | |
| Lenovo Tab 4 10 | |
| Geekbench 4.4 | |
| 64 Bit Single-Core Score | |
| Amazon Fire HD 10 2017 | |
| Lenovo Tab 4 10 | |
| Huawei MediaPad T3 10 | |
| 64 Bit Multi-Core Score | |
| Amazon Fire HD 10 2017 | |
| Lenovo Tab 4 10 | |
| Huawei MediaPad T3 10 | |
| Compute RenderScript Score | |
| Amazon Fire HD 10 2017 | |
| Lenovo Tab 4 10 | |
| GFXBench (DX / GLBenchmark) 2.7 | |
| T-Rex Onscreen | |
| Apple iPad (2017) | |
| Asus ZenPad 3s 10 Z500M | |
| Amazon Fire HD 10 2017 | |
| Huawei MediaPad T3 10 | |
| Lenovo Tab 4 10 | |
| 1920x1080 T-Rex Offscreen | |
| Apple iPad (2017) | |
| Asus ZenPad 3s 10 Z500M | |
| Amazon Fire HD 10 2017 | |
| Lenovo Tab 4 10 | |
| Huawei MediaPad T3 10 | |
| GFXBench 3.0 | |
| on screen Manhattan Onscreen OGL | |
| Apple iPad (2017) | |
| Asus ZenPad 3s 10 Z500M | |
| Amazon Fire HD 10 2017 | |
| Huawei MediaPad T3 10 | |
| Lenovo Tab 4 10 | |
| 1920x1080 1080p Manhattan Offscreen | |
| Apple iPad (2017) | |
| Asus ZenPad 3s 10 Z500M | |
| Amazon Fire HD 10 2017 | |
| Lenovo Tab 4 10 | |
| Huawei MediaPad T3 10 | |
| GFXBench 3.1 | |
| on screen Manhattan ES 3.1 Onscreen | |
| Apple iPad (2017) | |
| Amazon Fire HD 10 2017 | |
| Asus ZenPad 3s 10 Z500M | |
| 1920x1080 Manhattan ES 3.1 Offscreen | |
| Apple iPad (2017) | |
| Amazon Fire HD 10 2017 | |
| Asus ZenPad 3s 10 Z500M | |
| GFXBench | |
| on screen Car Chase Onscreen | |
| Amazon Fire HD 10 2017 | |
| Asus ZenPad 3s 10 Z500M | |
| 1920x1080 Car Chase Offscreen | |
| Amazon Fire HD 10 2017 | |
| Asus ZenPad 3s 10 Z500M | |
| Basemark ES 3.1 / Metal - offscreen Overall Score | |
| Apple iPad (2017) | |
| Octane V2 - Total Score | |
| Apple iPad (2017) | |
| Amazon Fire HD 10 2017 (Amazon Silk 61.2) | |
| Asus ZenPad 3s 10 Z500M (Chrome 55) | |
| Lenovo Tab 4 10 (Chrome 60) | |
| Huawei MediaPad T3 10 (Chrome 58) | |
| WebXPRT 2015 - Overall | |
| Apple iPad (2017) | |
| Amazon Fire HD 10 2017 (Amazon Silk 61.2) | |
| Asus ZenPad 3s 10 Z500M (Chrome 55) | |
| Huawei MediaPad T3 10 (Chrome 58) | |
| Lenovo Tab 4 10 (Chrome 60) | |
| JetStream 1.1 - Total Score | |
| Apple iPad (2017) | |
| Asus ZenPad 3s 10 Z500M (Chrome 55) | |
| Amazon Fire HD 10 2017 (Amazon Silk 61.2) | |
| Huawei MediaPad T3 10 (Chrome 58) | |
| Mozilla Kraken 1.1 - Total | |
| Huawei MediaPad T3 10 (Chrome 58) | |
| Lenovo Tab 4 10 (Chrome 60) | |
| Amazon Fire HD 10 2017 (Amazon Silk 61.2) | |
| Asus ZenPad 3s 10 Z500M (Chrome 55) | |
| Apple iPad (2017) | |
* ... smaller is better
| Amazon Fire HD 10 2017 | Asus ZenPad 3s 10 Z500M | Lenovo Tab 4 10 | Huawei MediaPad T3 10 | |
|---|---|---|---|---|
| AndroBench 3-5 | -16% | 17% | 12% | |
| Sequential Read 256KB | 262.2 | 209.3 -20% | 275 5% | 154.7 -41% |
| Sequential Write 256KB | 147.7 | 136.5 -8% | 45.3 -69% | 41.1 -72% |
| Random Read 4KB | 27.72 | 24.85 -10% | 32.3 17% | 50 80% |
| Random Write 4KB | 9.37 | 6.8 -27% | 8.9 -5% | 5.3 -43% |
| Sequential Read 256KB SDCard | 55.5 ? | 45.15 ? -19% | 84.5 52% | 83 ? 50% |
| Sequential Write 256KB SDCard | 30.14 ? | 26.9 ? -11% | 59.9 99% | 58.7 ? 95% |
| Asphalt 8: Airborne | |||
| Configurações | Valor | ||
| high | 22 fps | ||
| very low | 30 fps | ||
| Temple Run 2 | |||
| Configurações | Valor | ||
| default | 60 fps | ||
| Dead Trigger 2 | |||
| Configurações | Valor | ||
| high | 30 fps | ||
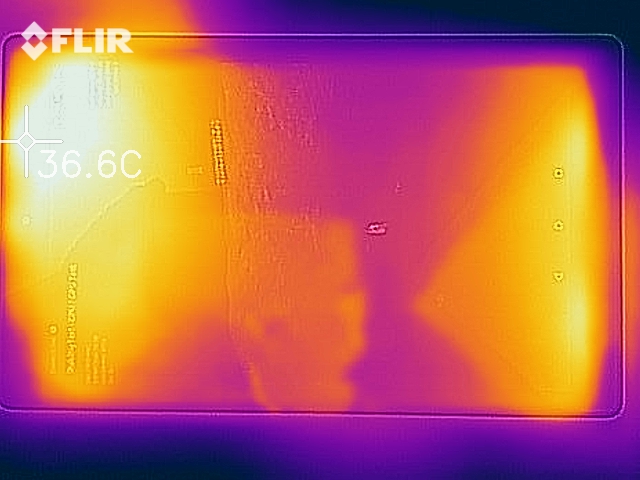
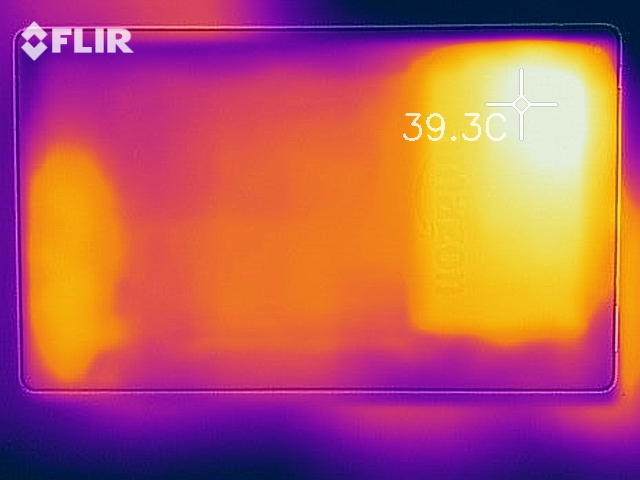
(+) The maximum temperature on the upper side is 36.1 °C / 97 F, compared to the average of 33.8 °C / 93 F, ranging from 20.7 to 53.2 °C for the class Tablet.
(+) The bottom heats up to a maximum of 39.9 °C / 104 F, compared to the average of 33.3 °C / 92 F
(+) In idle usage, the average temperature for the upper side is 25.2 °C / 77 F, compared to the device average of 30 °C / 86 F.
Amazon Fire HD 10 2017 audio analysis
(+) | speakers can play relatively loud (86.1 dB)
Bass 100 - 315 Hz
(-) | nearly no bass - on average 24.1% lower than median
(±) | linearity of bass is average (10.6% delta to prev. frequency)
Mids 400 - 2000 Hz
(+) | balanced mids - only 4.8% away from median
(+) | mids are linear (5.9% delta to prev. frequency)
Highs 2 - 16 kHz
(±) | higher highs - on average 5.8% higher than median
(+) | highs are linear (6.5% delta to prev. frequency)
Overall 100 - 16.000 Hz
(±) | linearity of overall sound is average (21.5% difference to median)
Compared to same class
» 57% of all tested devices in this class were better, 5% similar, 38% worse
» The best had a delta of 7%, average was 23%, worst was 129%
Compared to all devices tested
» 55% of all tested devices were better, 7% similar, 38% worse
» The best had a delta of 4%, average was 25%, worst was 134%
Asus ZenPad 3s 10 Z500M audio analysis
(+) | speakers can play relatively loud (95 dB)
Bass 100 - 315 Hz
(-) | nearly no bass - on average 24% lower than median
(+) | bass is linear (5% delta to prev. frequency)
Mids 400 - 2000 Hz
(±) | reduced mids - on average 5.4% lower than median
(+) | mids are linear (4.2% delta to prev. frequency)
Highs 2 - 16 kHz
(±) | higher highs - on average 5.7% higher than median
(+) | highs are linear (5.3% delta to prev. frequency)
Overall 100 - 16.000 Hz
(±) | linearity of overall sound is average (18.4% difference to median)
Compared to same class
» 38% of all tested devices in this class were better, 7% similar, 54% worse
» The best had a delta of 7%, average was 23%, worst was 129%
Compared to all devices tested
» 35% of all tested devices were better, 8% similar, 57% worse
» The best had a delta of 4%, average was 25%, worst was 134%
Huawei MediaPad T3 10 audio analysis
(+) | speakers can play relatively loud (87.2 dB)
Bass 100 - 315 Hz
(-) | nearly no bass - on average 32.3% lower than median
(±) | linearity of bass is average (9.4% delta to prev. frequency)
Mids 400 - 2000 Hz
(±) | reduced mids - on average 5.6% lower than median
(±) | linearity of mids is average (7.6% delta to prev. frequency)
Highs 2 - 16 kHz
(±) | higher highs - on average 7.8% higher than median
(+) | highs are linear (4.9% delta to prev. frequency)
Overall 100 - 16.000 Hz
(±) | linearity of overall sound is average (26.7% difference to median)
Compared to same class
» 79% of all tested devices in this class were better, 3% similar, 17% worse
» The best had a delta of 7%, average was 23%, worst was 129%
Compared to all devices tested
» 79% of all tested devices were better, 4% similar, 17% worse
» The best had a delta of 4%, average was 25%, worst was 134%
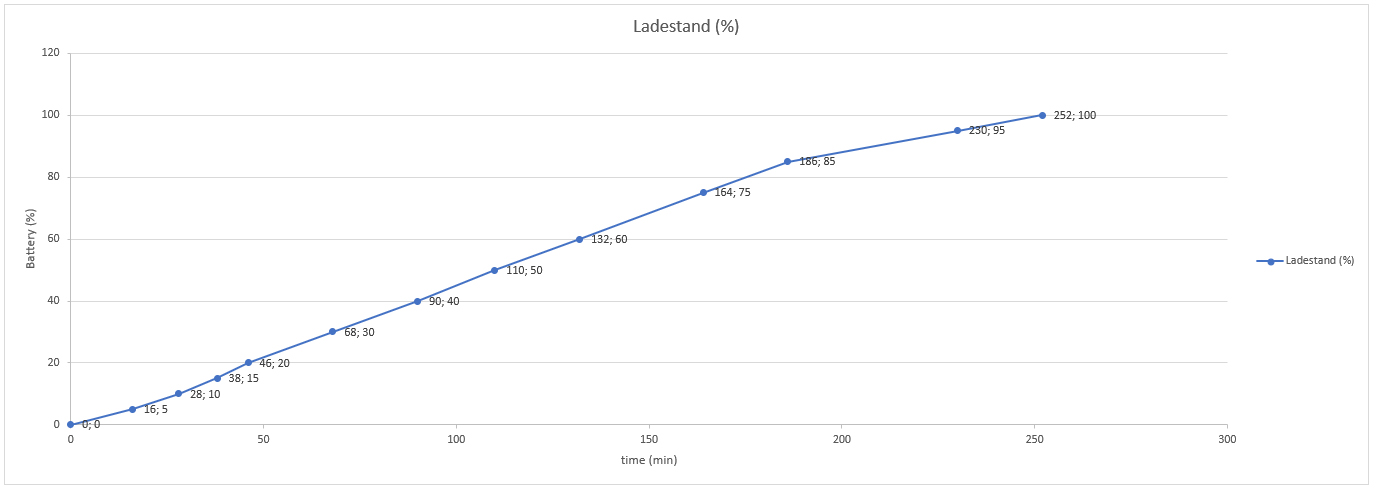
| desligado | |
| Ocioso | |
| Carga |
|
| Amazon Fire HD 10 2017 6300 mAh | Asus ZenPad 3s 10 Z500M 5900 mAh | Lenovo Tab 4 10 7000 mAh | Apple iPad (2017) 8.827 mAh | |
|---|---|---|---|---|
| Power Consumption | -15% | 22% | -50% | |
| Idle Minimum * | 1.55 | 1.59 -3% | 1.09 30% | 2.06 -33% |
| Idle Average * | 4.17 | 4.14 1% | 3.71 11% | 7.42 -78% |
| Idle Maximum * | 4.25 | 4.23 -0% | 3.84 10% | 7.47 -76% |
| Load Average * | 7.13 | 10.89 -53% | 5.07 29% | 9.45 -33% |
| Load Maximum * | 9.63 | 11.58 -20% | 6.88 29% | 12.31 -28% |
* ... smaller is better
| Amazon Fire HD 10 2017 6300 mAh | Asus ZenPad 3s 10 Z500M 5900 mAh | Lenovo Tab 4 10 7000 mAh | Huawei MediaPad T3 10 4800 mAh | Apple iPad (2017) 8.827 mAh | |
|---|---|---|---|---|---|
| Battery Runtime | 8% | 17% | -7% | 31% | |
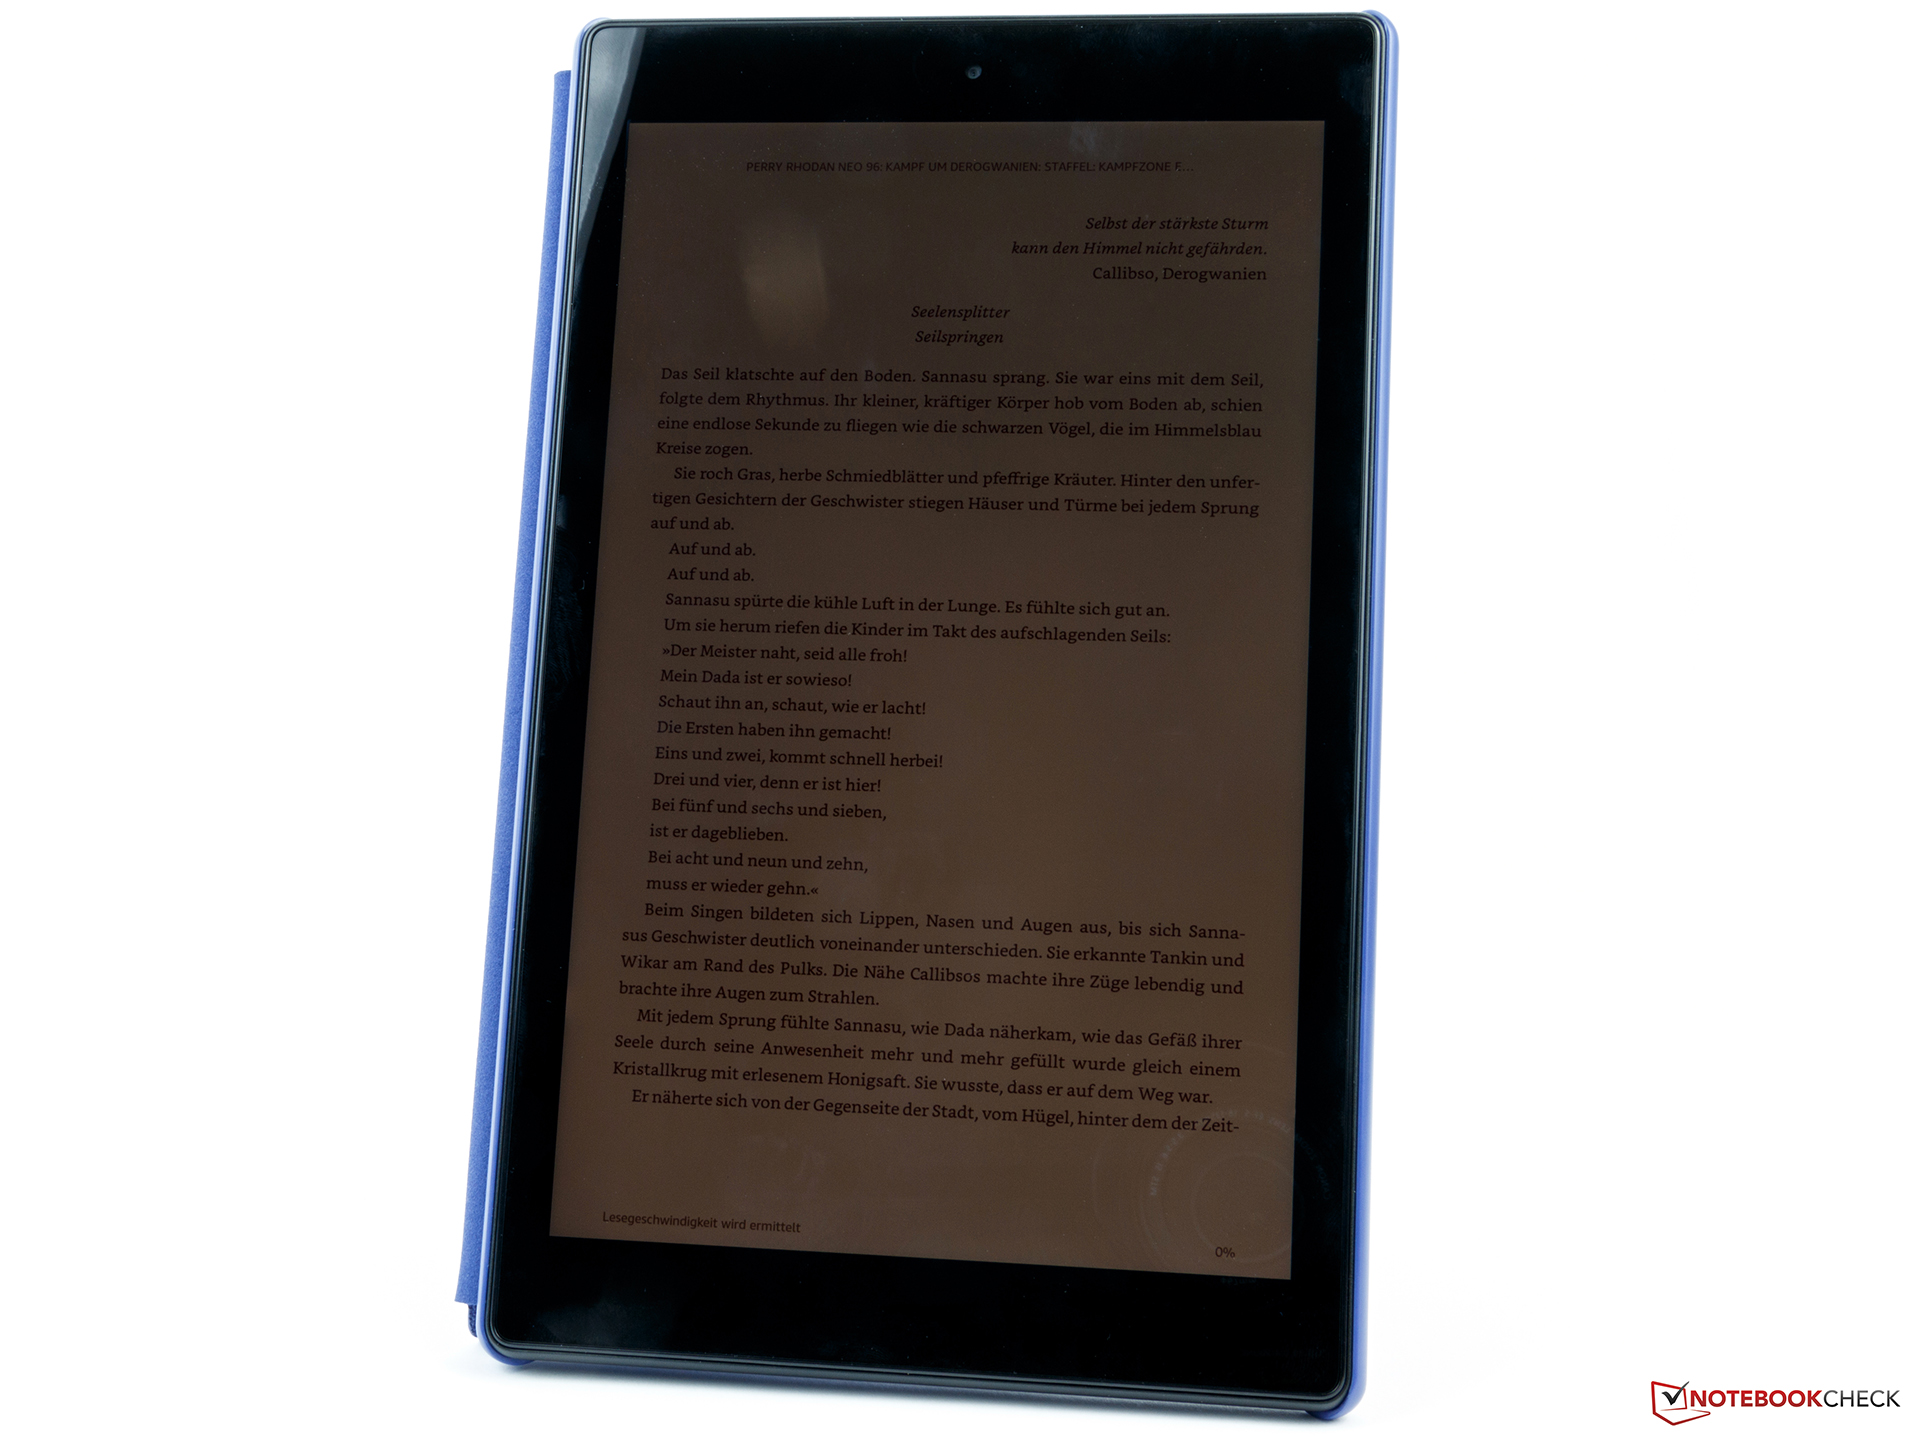
| Reader / Idle | 960 | 1453 51% | 1134 18% | 1496 56% | |
| H.264 | 585 | 600 3% | 527 -10% | 845 44% | |
| WiFi v1.3 | 542 | 518 -4% | 632 17% | 439 -19% | 764 41% |
| Load | 274 | 225 -18% | 229 -16% | 225 -18% |
Pro
Contra
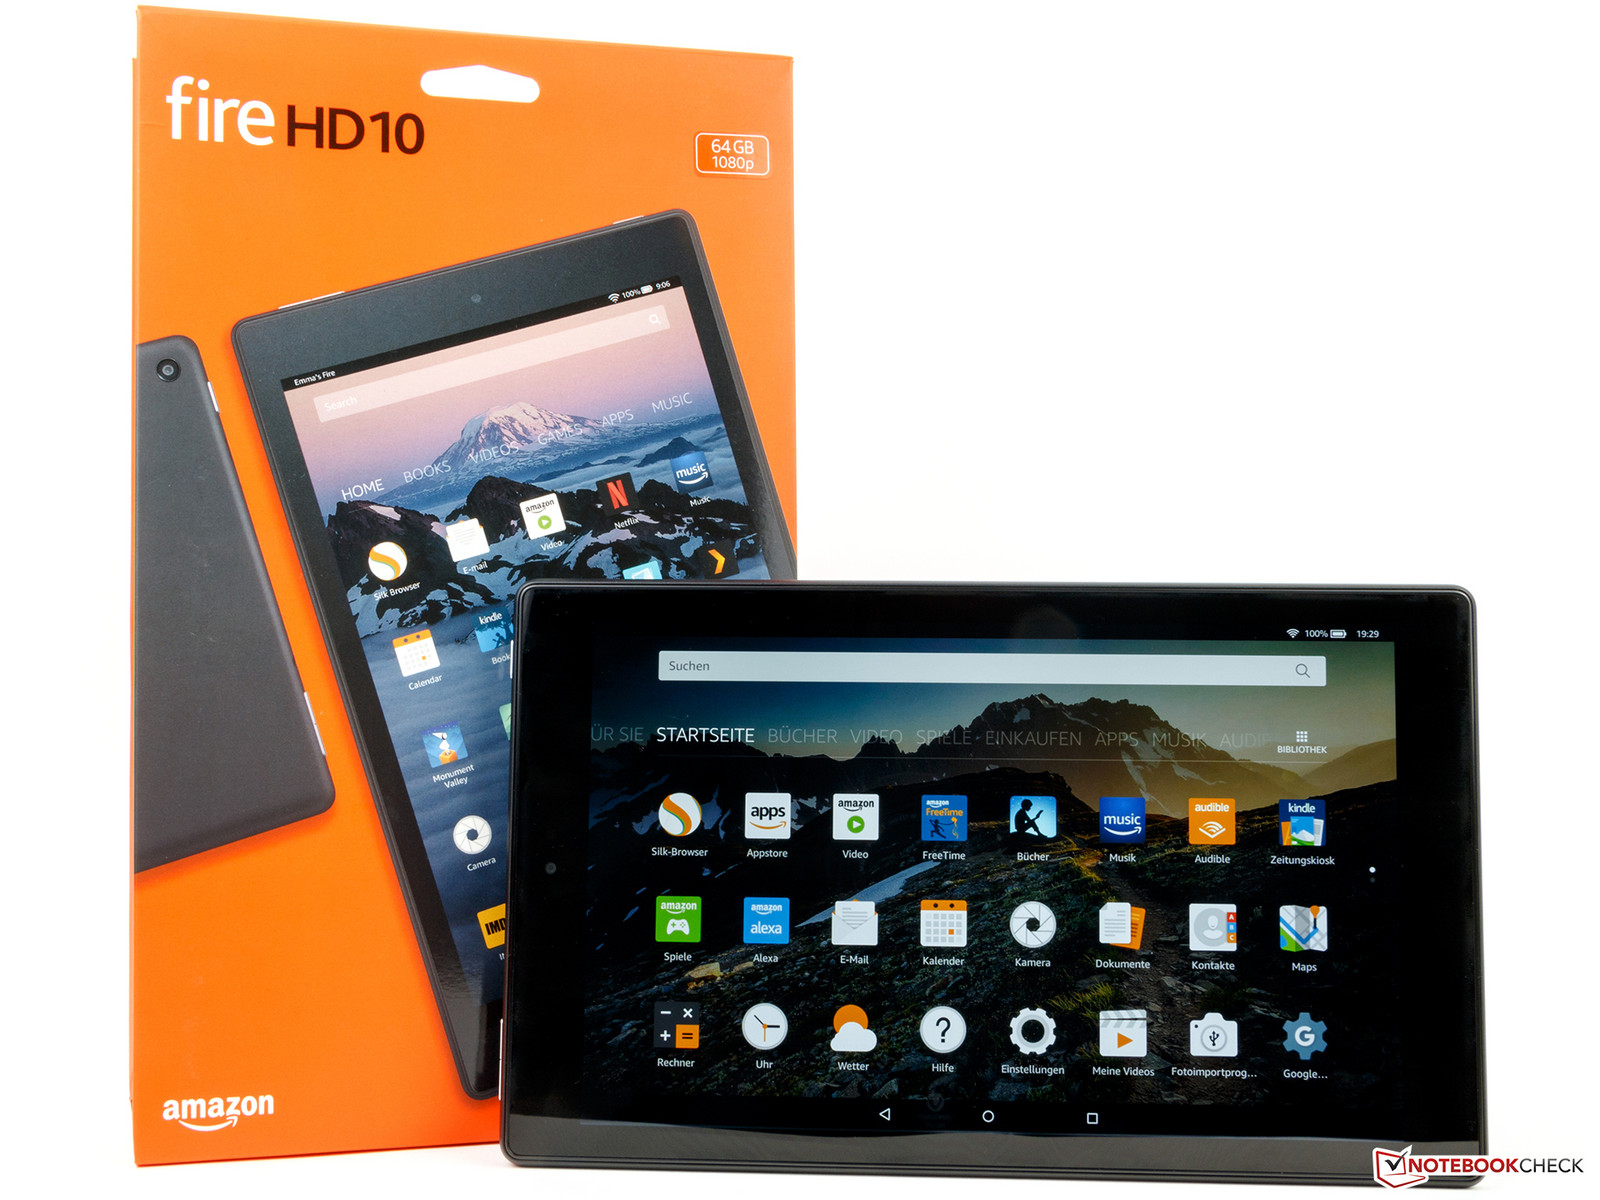
Aqueles que compram um tablet Amazon Fire HD 10 da sétima geração receberão um especialista em multimídia no eco espaço da Amazon sem maiores deficiências. É exatamente isso o que faz do dispositivo uma alternativa real que pode ser adquirida por um preço bastante baixo.
No lado positivo, há uma boa tela, alto-falantes decentes, Wi-Fi rápido e um chipset rápido que, de outra forma, só pode ser usado em dispositivos mais caros. Por outro lado, o software de base antigo que provavelmente não receberá mais atualizações é uma desvantagem.
O Amazon Fire HD 10 é uma alternativa consciente para os consumidores de mídia.
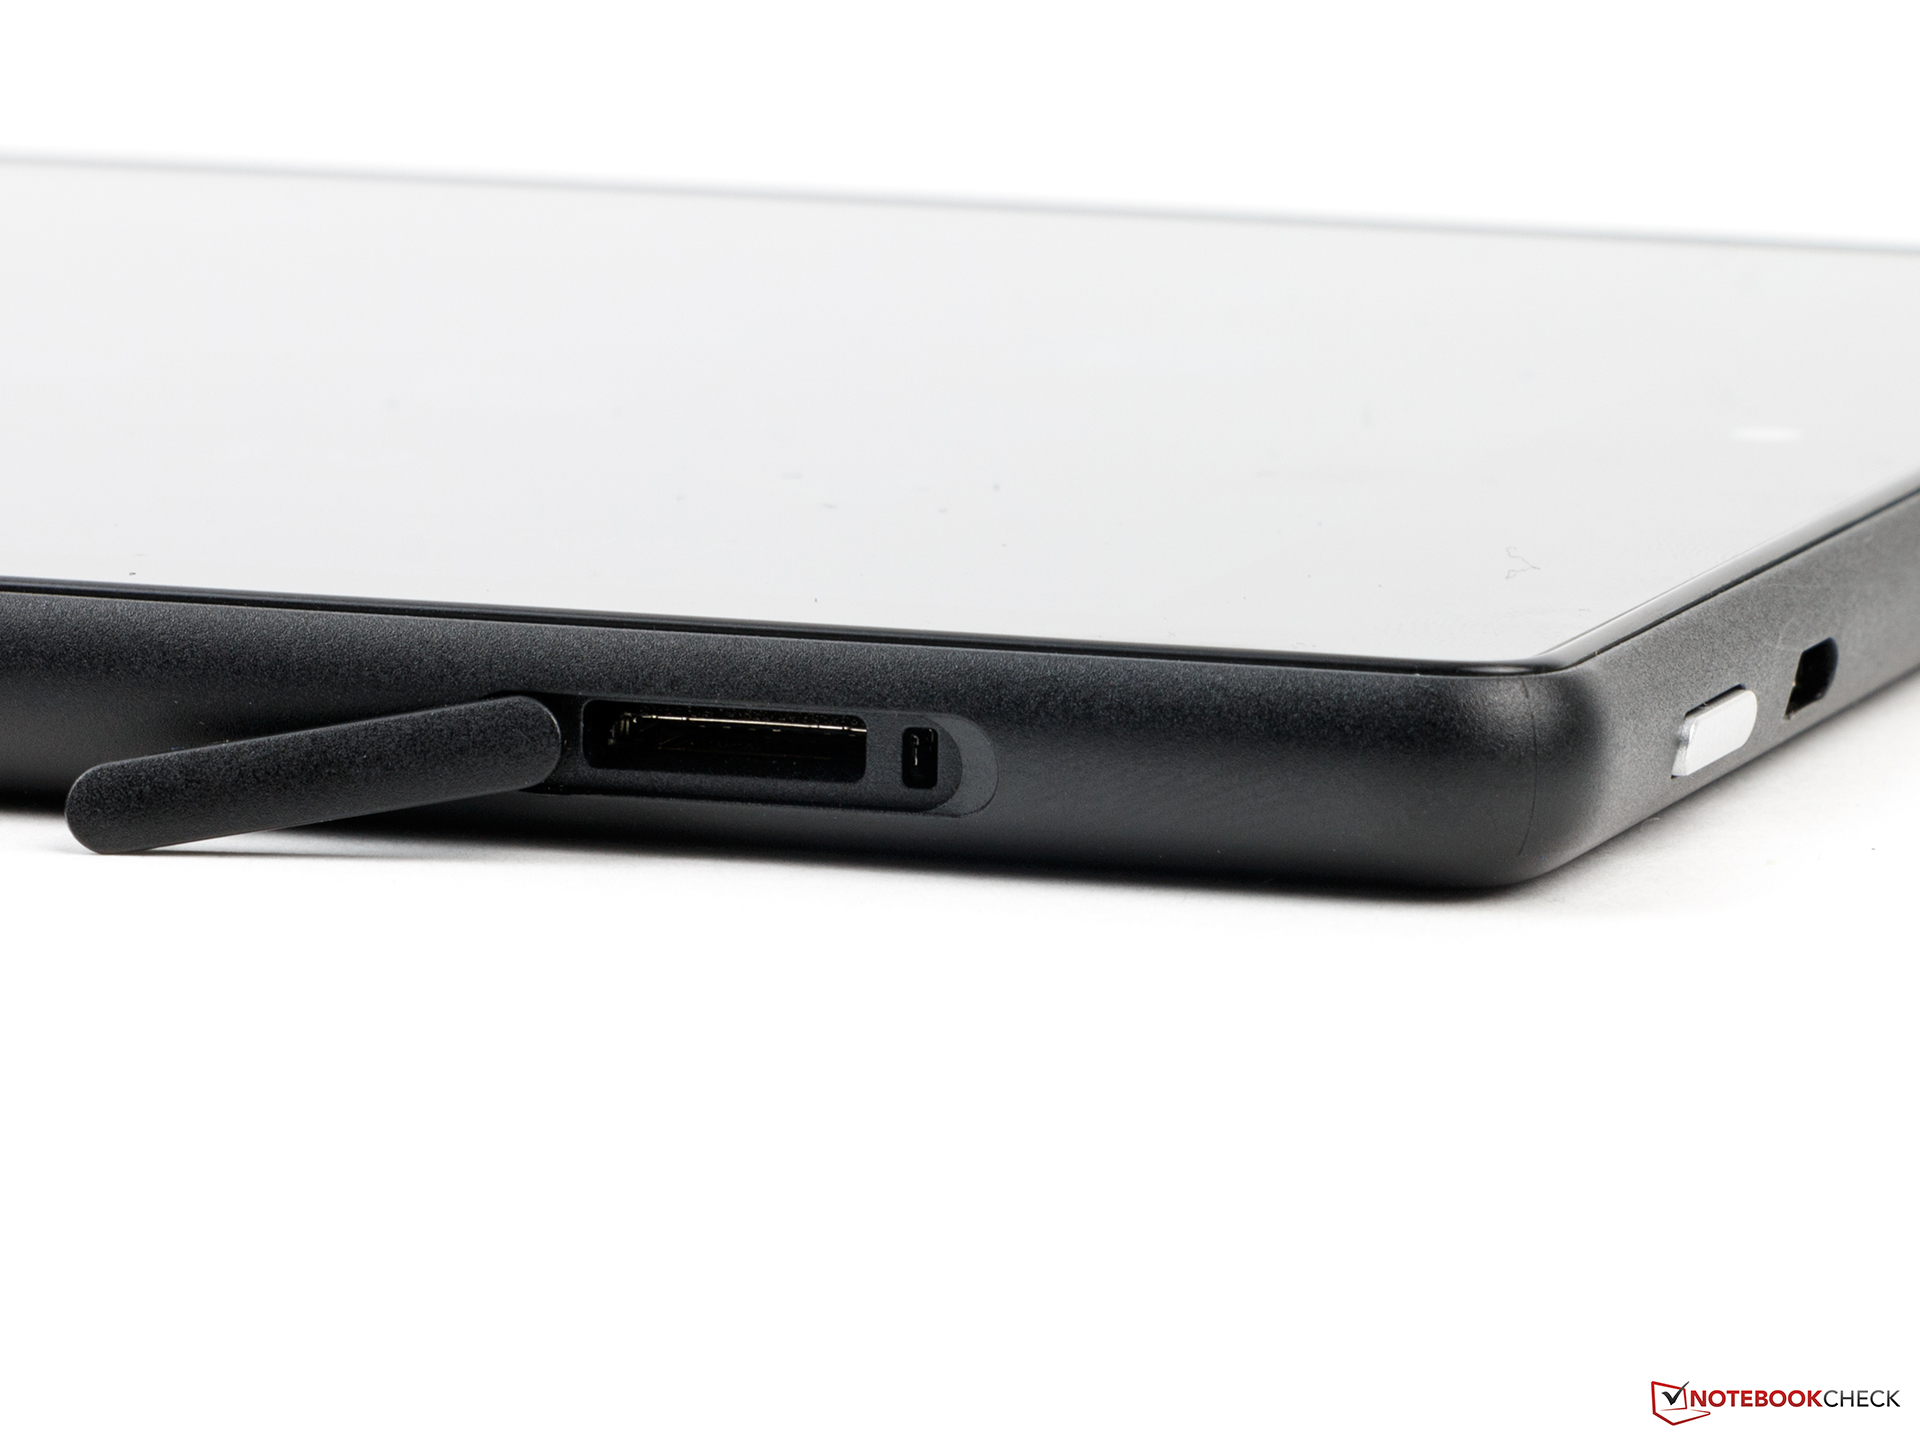
Para ter certeza, recursos como NFC, aptX, GPS, Miracast, carregamento rápido ou uma melhor variedade de sensores estão faltando. Além disso, Alexa ainda não roda tçao fluentemente, embora isso seja corrigido com futuras atualizações. No entanto, a Amazon possui uma forte oferta combinada a um preço atraente.
Amazon Fire HD 10 2017
-
11/05/2019 v7
Daniel Schmidt