Breve Análise do Tablet Apple iPad (2017)
| Networking | |
| iperf3 transmit AX12 | |
| Apple iPhone 7 (Klaus I211) | |
| Apple iPad (2017) | |
| Samsung Galaxy S7 | |
| iperf3 receive AX12 | |
| Apple iPhone 7 (Klaus I211) | |
| Apple iPad (2017) | |
| Samsung Galaxy S7 | |


| |||||||||||||||||||||||||
iluminação: 88 %
iluminação com acumulador: 514 cd/m²
Contraste: 1117:1 (Preto: 0.46 cd/m²)
ΔE ColorChecker Calman: 1.4 | ∀{0.5-29.43 Ø4.71}
ΔE Greyscale Calman: 2.1 | ∀{0.09-98 Ø4.96}
97.4% sRGB (Calman 2D)
Gamma: 2.22
CCT: 6647 K
| Apple iPad (2017) IPS, 2048x1536, 9.7" | Apple iPad Air 1 2013 IPS, 2048x1536, 9.7" | Apple iPad Pro 9.7 IPS, 2048x1536, 9.7" | Apple iPad Pro 12.9 IPS, 2732x2048, 12.9" | Google Pixel C LTPS, 2560x1800, 10.2" | Huawei MediaPad T2 10.0 Pro IPS, 1920x1200, 10.1" | |
|---|---|---|---|---|---|---|
| Screen | -10% | 10% | -11% | -75% | -79% | |
| Brightness middle (cd/m²) | 514 | 473 -8% | 523 2% | 399 -22% | 487 -5% | 392 -24% |
| Brightness (cd/m²) | 485 | 442 -9% | 500 3% | 393 -19% | 510 5% | 385 -21% |
| Brightness Distribution (%) | 88 | 90 2% | 93 6% | 92 5% | 91 3% | 91 3% |
| Black Level * (cd/m²) | 0.46 | 0.41 11% | 0.52 -13% | 0.22 52% | 0.39 15% | 0.59 -28% |
| Contrast (:1) | 1117 | 1154 3% | 1006 -10% | 1814 62% | 1249 12% | 664 -41% |
| Colorchecker dE 2000 * | 1.4 | 2.82 -101% | 1.1 21% | 2.96 -111% | 5.24 -274% | 4.5 -221% |
| Colorchecker dE 2000 max. * | 2.9 | 1.9 34% | 7.8 -169% | |||
| Greyscale dE 2000 * | 2.1 | 1.45 31% | 1.4 33% | 3 -43% | 7.95 -279% | 4.8 -129% |
| Gamma | 2.22 99% | 2.47 89% | 2.11 104% | 2.21 100% | 2.16 102% | 2.47 89% |
| CCT | 6647 98% | 6768 96% | 6662 98% | 7049 92% | 6565 99% | 7426 88% |
| Color Space (Percent of AdobeRGB 1998) (%) | 62.97 | 71.15 | ||||
| Color Space (Percent of sRGB) (%) | 99.55 | 97.87 |
* ... menor é melhor
Cintilação da tela / PWM (modulação por largura de pulso)
| Tela tremeluzindo / PWM não detectado | 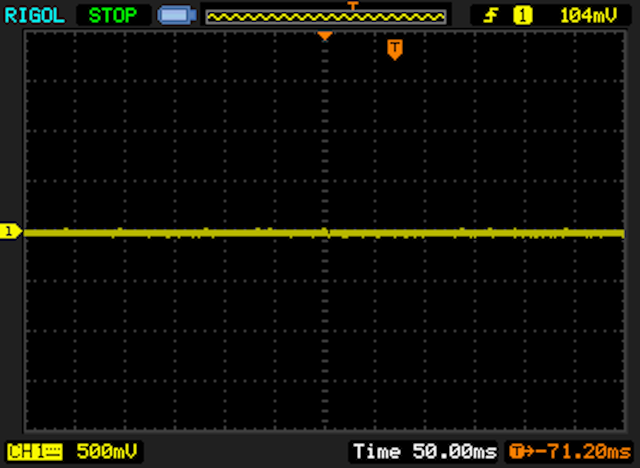 | ||
[pwm_comparison] Em comparação: 52 % de todos os dispositivos testados não usam PWM para escurecer a tela. Se PWM foi detectado, uma média de 7754 (mínimo: 5 - máximo: 343500) Hz foi medida. | |||
Exibir tempos de resposta
| ↔ Tempo de resposta preto para branco | ||
|---|---|---|
| 26 ms ... ascensão ↗ e queda ↘ combinadas | ↗ 15 ms ascensão | 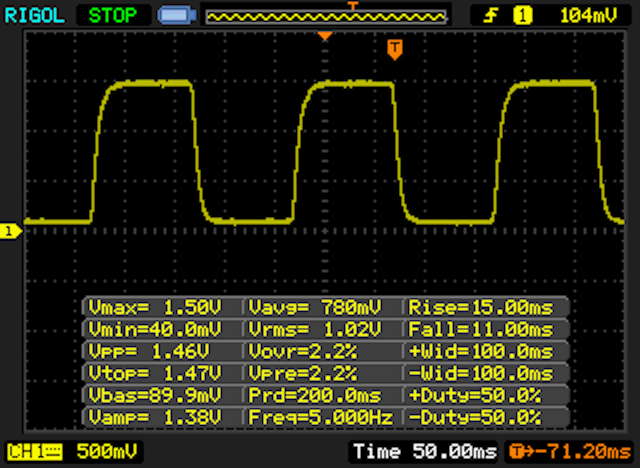 |
| ↘ 11 ms queda | ||
| A tela mostra taxas de resposta relativamente lentas em nossos testes e pode ser muito lenta para os jogadores. Em comparação, todos os dispositivos testados variam de 0.1 (mínimo) a 240 (máximo) ms. » 63 % de todos os dispositivos são melhores. Isso significa que o tempo de resposta medido é pior que a média de todos os dispositivos testados (19.8 ms). | ||
| ↔ Tempo de resposta 50% cinza a 80% cinza | ||
| 40 ms ... ascensão ↗ e queda ↘ combinadas | ↗ 23 ms ascensão | 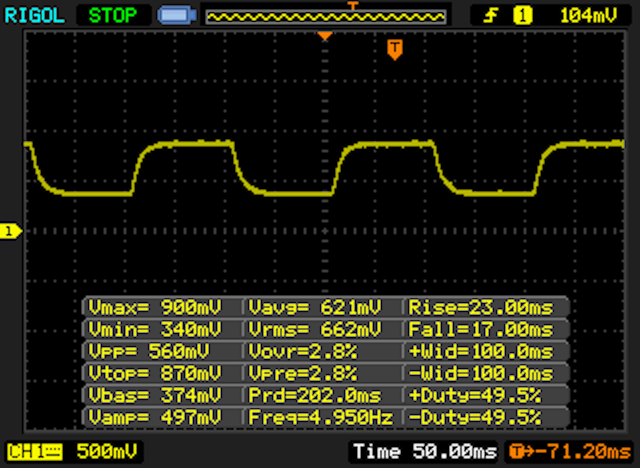 |
| ↘ 17 ms queda | ||
| A tela mostra taxas de resposta lentas em nossos testes e será insatisfatória para os jogadores. Em comparação, todos os dispositivos testados variam de 0.165 (mínimo) a 636 (máximo) ms. » 61 % de todos os dispositivos são melhores. Isso significa que o tempo de resposta medido é pior que a média de todos os dispositivos testados (31 ms). | ||
| AnTuTu v6 - Total Score | |
| Apple iPad Pro 12.9 | |
| Apple iPad Pro 9.7 | |
| Samsung Galaxy Tab S3 SM-T825 | |
| Apple iPhone 7 | |
| Apple iPad (2017) | |
| Google Pixel C | |
| Huawei MediaPad T2 10.0 Pro | |
| GFXBench 3.0 | |
| on screen Manhattan Onscreen OGL | |
| Apple iPhone 7 | |
| Apple iPad Pro 9.7 | |
| Samsung Galaxy Tab S3 SM-T825 | |
| Apple iPad Pro 12.9 | |
| Apple iPad (2017) | |
| Google Pixel C | |
| Huawei MediaPad T2 10.0 Pro | |
| 1920x1080 1080p Manhattan Offscreen | |
| Apple iPad Pro 12.9 | |
| Apple iPhone 7 | |
| Apple iPad Pro 9.7 | |
| Samsung Galaxy Tab S3 SM-T825 | |
| Apple iPad (2017) | |
| Google Pixel C | |
| Huawei MediaPad T2 10.0 Pro | |
| GFXBench 3.1 | |
| on screen Manhattan ES 3.1 Onscreen | |
| Apple iPhone 7 | |
| Apple iPad Pro 12.9 | |
| Apple iPad Pro 9.7 | |
| Samsung Galaxy Tab S3 SM-T825 | |
| Apple iPad (2017) | |
| Google Pixel C | |
| 1920x1080 Manhattan ES 3.1 Offscreen | |
| Apple iPad Pro 12.9 | |
| Apple iPhone 7 | |
| Apple iPad Pro 9.7 | |
| Samsung Galaxy Tab S3 SM-T825 | |
| Google Pixel C | |
| Apple iPad (2017) | |
| Basemark ES 3.1 / Metal - offscreen Overall Score | |
| Apple iPad Pro 12.9 | |
| Apple iPhone 7 | |
| Apple iPhone 7 | |
| Apple iPad Pro 9.7 | |
| Apple iPad (2017) | |
| Google Pixel C | |
| Samsung Galaxy Tab S3 SM-T825 | |
| Octane V2 - Total Score | |
| Apple iPhone 7 | |
| Apple iPad Pro 12.9 | |
| Apple iPad Pro 9.7 | |
| Apple iPad (2017) | |
| Samsung Galaxy Tab S3 SM-T825 | |
| Google Pixel C | |
| Apple iPad Air 1 2013 | |
| Huawei MediaPad T2 10.0 Pro | |
| Mozilla Kraken 1.1 - Total | |
| Huawei MediaPad T2 10.0 Pro | |
| Apple iPad Air 1 2013 | |
| Google Pixel C | |
| Samsung Galaxy Tab S3 SM-T825 | |
| Apple iPad Pro 9.7 | |
| Apple iPad Pro 12.9 | |
| Apple iPad (2017) | |
| Apple iPhone 7 | |
| JetStream 1.1 - 1.1 Total | |
| Apple iPhone 7 | |
| Apple iPad Pro 9.7 | |
| Apple iPad Pro 12.9 | |
| Apple iPad (2017) | |
| Google Pixel C | |
| Samsung Galaxy Tab S3 SM-T825 | |
| Huawei MediaPad T2 10.0 Pro | |
| WebXPRT 2015 - Overall | |
| Apple iPad Pro 9.7 | |
| Apple iPad Pro 12.9 | |
| Apple iPad (2017) | |
| Apple iPhone 7 | |
| Samsung Galaxy Tab S3 SM-T825 | |
| Google Pixel C | |
| Huawei MediaPad T2 10.0 Pro | |
* ... menor é melhor
| PassMark PerformanceTest Mobile V1 - Disk Tests | |
| Apple iPad Pro 12.9 | |
| Apple iPad Pro 9.7 | |
| Apple iPad (2017) | |
| Apple iPhone 7 | |
| Apple iPad Air 1 2013 | |
| Google Pixel C | |
| BaseMark OS II - Memory | |
| Apple iPad Pro 9.7 | |
| Apple iPad Pro 12.9 | |
| Samsung Galaxy Tab S3 SM-T825 | |
| Apple iPad (2017) | |
| Apple iPhone 7 | |
| Google Pixel C | |
| Huawei MediaPad T2 10.0 Pro | |
(+) A temperatura máxima no lado superior é 35.2 °C / 95 F, em comparação com a média de 33.7 °C / 93 F , variando de 20.7 a 53.2 °C para a classe Tablet.
(+) A parte inferior aquece até um máximo de 37.7 °C / 100 F, em comparação com a média de 33.2 °C / 92 F
(+) Em uso inativo, a temperatura média para o lado superior é 31 °C / 88 F, em comparação com a média do dispositivo de 30 °C / ### class_avg_f### F.
Apple iPad (2017) análise de áudio
(+) | os alto-falantes podem tocar relativamente alto (###valor### dB)
Graves 100 - 315Hz
(-) | quase nenhum baixo - em média 17.5% menor que a mediana
(±) | a linearidade dos graves é média (10.8% delta para a frequência anterior)
Médios 400 - 2.000 Hz
(+) | médios equilibrados - apenas 2.8% longe da mediana
(+) | médios são lineares (5.3% delta para frequência anterior)
Altos 2 - 16 kHz
(±) | máximos mais altos - em média 8.5% maior que a mediana
(+) | os máximos são lineares (3.9% delta da frequência anterior)
Geral 100 - 16.000 Hz
(±) | a linearidade do som geral é média (19% diferença em relação à mediana)
Comparado com a mesma classe
» 52% de todos os dispositivos testados nesta classe foram melhores, 5% semelhantes, 43% piores
» O melhor teve um delta de 7%, a média foi 20%, o pior foi 129%
Comparado com todos os dispositivos testados
» 45% de todos os dispositivos testados foram melhores, 7% semelhantes, 47% piores
» O melhor teve um delta de 4%, a média foi 23%, o pior foi 134%
Apple iPad Pro 9.7 análise de áudio
(+) | os alto-falantes podem tocar relativamente alto (###valor### dB)
Graves 100 - 315Hz
(-) | quase nenhum baixo - em média 23.2% menor que a mediana
(±) | a linearidade dos graves é média (8.6% delta para a frequência anterior)
Médios 400 - 2.000 Hz
(+) | médios equilibrados - apenas 4.7% longe da mediana
(+) | médios são lineares (4.9% delta para frequência anterior)
Altos 2 - 16 kHz
(+) | agudos equilibrados - apenas 4.6% longe da mediana
(+) | os máximos são lineares (4.1% delta da frequência anterior)
Geral 100 - 16.000 Hz
(±) | a linearidade do som geral é média (16.8% diferença em relação à mediana)
Comparado com a mesma classe
» 41% de todos os dispositivos testados nesta classe foram melhores, 4% semelhantes, 55% piores
» O melhor teve um delta de 7%, a média foi 20%, o pior foi 129%
Comparado com todos os dispositivos testados
» 30% de todos os dispositivos testados foram melhores, 8% semelhantes, 63% piores
» O melhor teve um delta de 4%, a média foi 23%, o pior foi 134%
| desligado | |
| Ocioso | |
| Carga |
|
Key:
min: | |
| Apple iPad (2017) 8.827 mAh | Apple iPad Pro 9.7 7306 mAh | Apple iPad Pro 12.9 10307 mAh | Apple iPad Air 1 2013 mAh | Google Pixel C mAh | Huawei MediaPad T2 10.0 Pro 6600 mAh | |
|---|---|---|---|---|---|---|
| Power Consumption | 5% | -31% | 15% | 16% | 34% | |
| Idle Minimum * (Watt) | 2.06 | 1.71 17% | 2.69 -31% | 1.8 13% | 1.82 12% | 1.58 23% |
| Idle Average * (Watt) | 7.42 | 7.55 -2% | 10.95 -48% | 5.9 20% | 4.26 43% | 4.12 44% |
| Idle Maximum * (Watt) | 7.47 | 7.62 -2% | 11.14 -49% | 7.1 5% | 4.33 42% | 4.15 44% |
| Load Average * (Watt) | 9.45 | 8.39 11% | 11.54 -22% | 7.5 21% | 9.82 -4% | 6.2 34% |
| Load Maximum * (Watt) | 12.31 | 12.08 2% | 12.8 -4% | 10.4 16% | 13.99 -14% | 9.27 25% |
* ... menor é melhor
| Apple iPad (2017) 8.827 mAh | Apple iPad Pro 9.7 7306 mAh | Apple iPad Pro 12.9 10307 mAh | Apple iPad Air 1 2013 mAh | Samsung Galaxy Tab S3 SM-T825 6000 mAh | Google Pixel C mAh | Huawei MediaPad T2 10.0 Pro 6600 mAh | |
|---|---|---|---|---|---|---|---|
| Duração da bateria | -2% | -5% | -5% | 15% | 10% | -22% | |
| Reader / Idle (h) | 24.9 | 30.8 24% | 32.2 29% | 23.8 -4% | 31.7 27% | 34.8 40% | 20.5 -18% |
| H.264 (h) | 14.1 | 11.8 -16% | 10.5 -26% | 10.7 -24% | 9.2 -35% | 12.3 -13% | 9.9 -30% |
| WiFi v1.3 (h) | 12.7 | 13 2% | 11.6 -9% | 12.7 0% | 10.6 -17% | 6.9 -46% | |
| Load (h) | 3.8 | 3.1 -18% | 3.3 -13% | 4.3 13% | 6.3 66% | 4.9 29% | 4.1 8% |
| WiFi (h) | 9.2 |
Pro
Contra
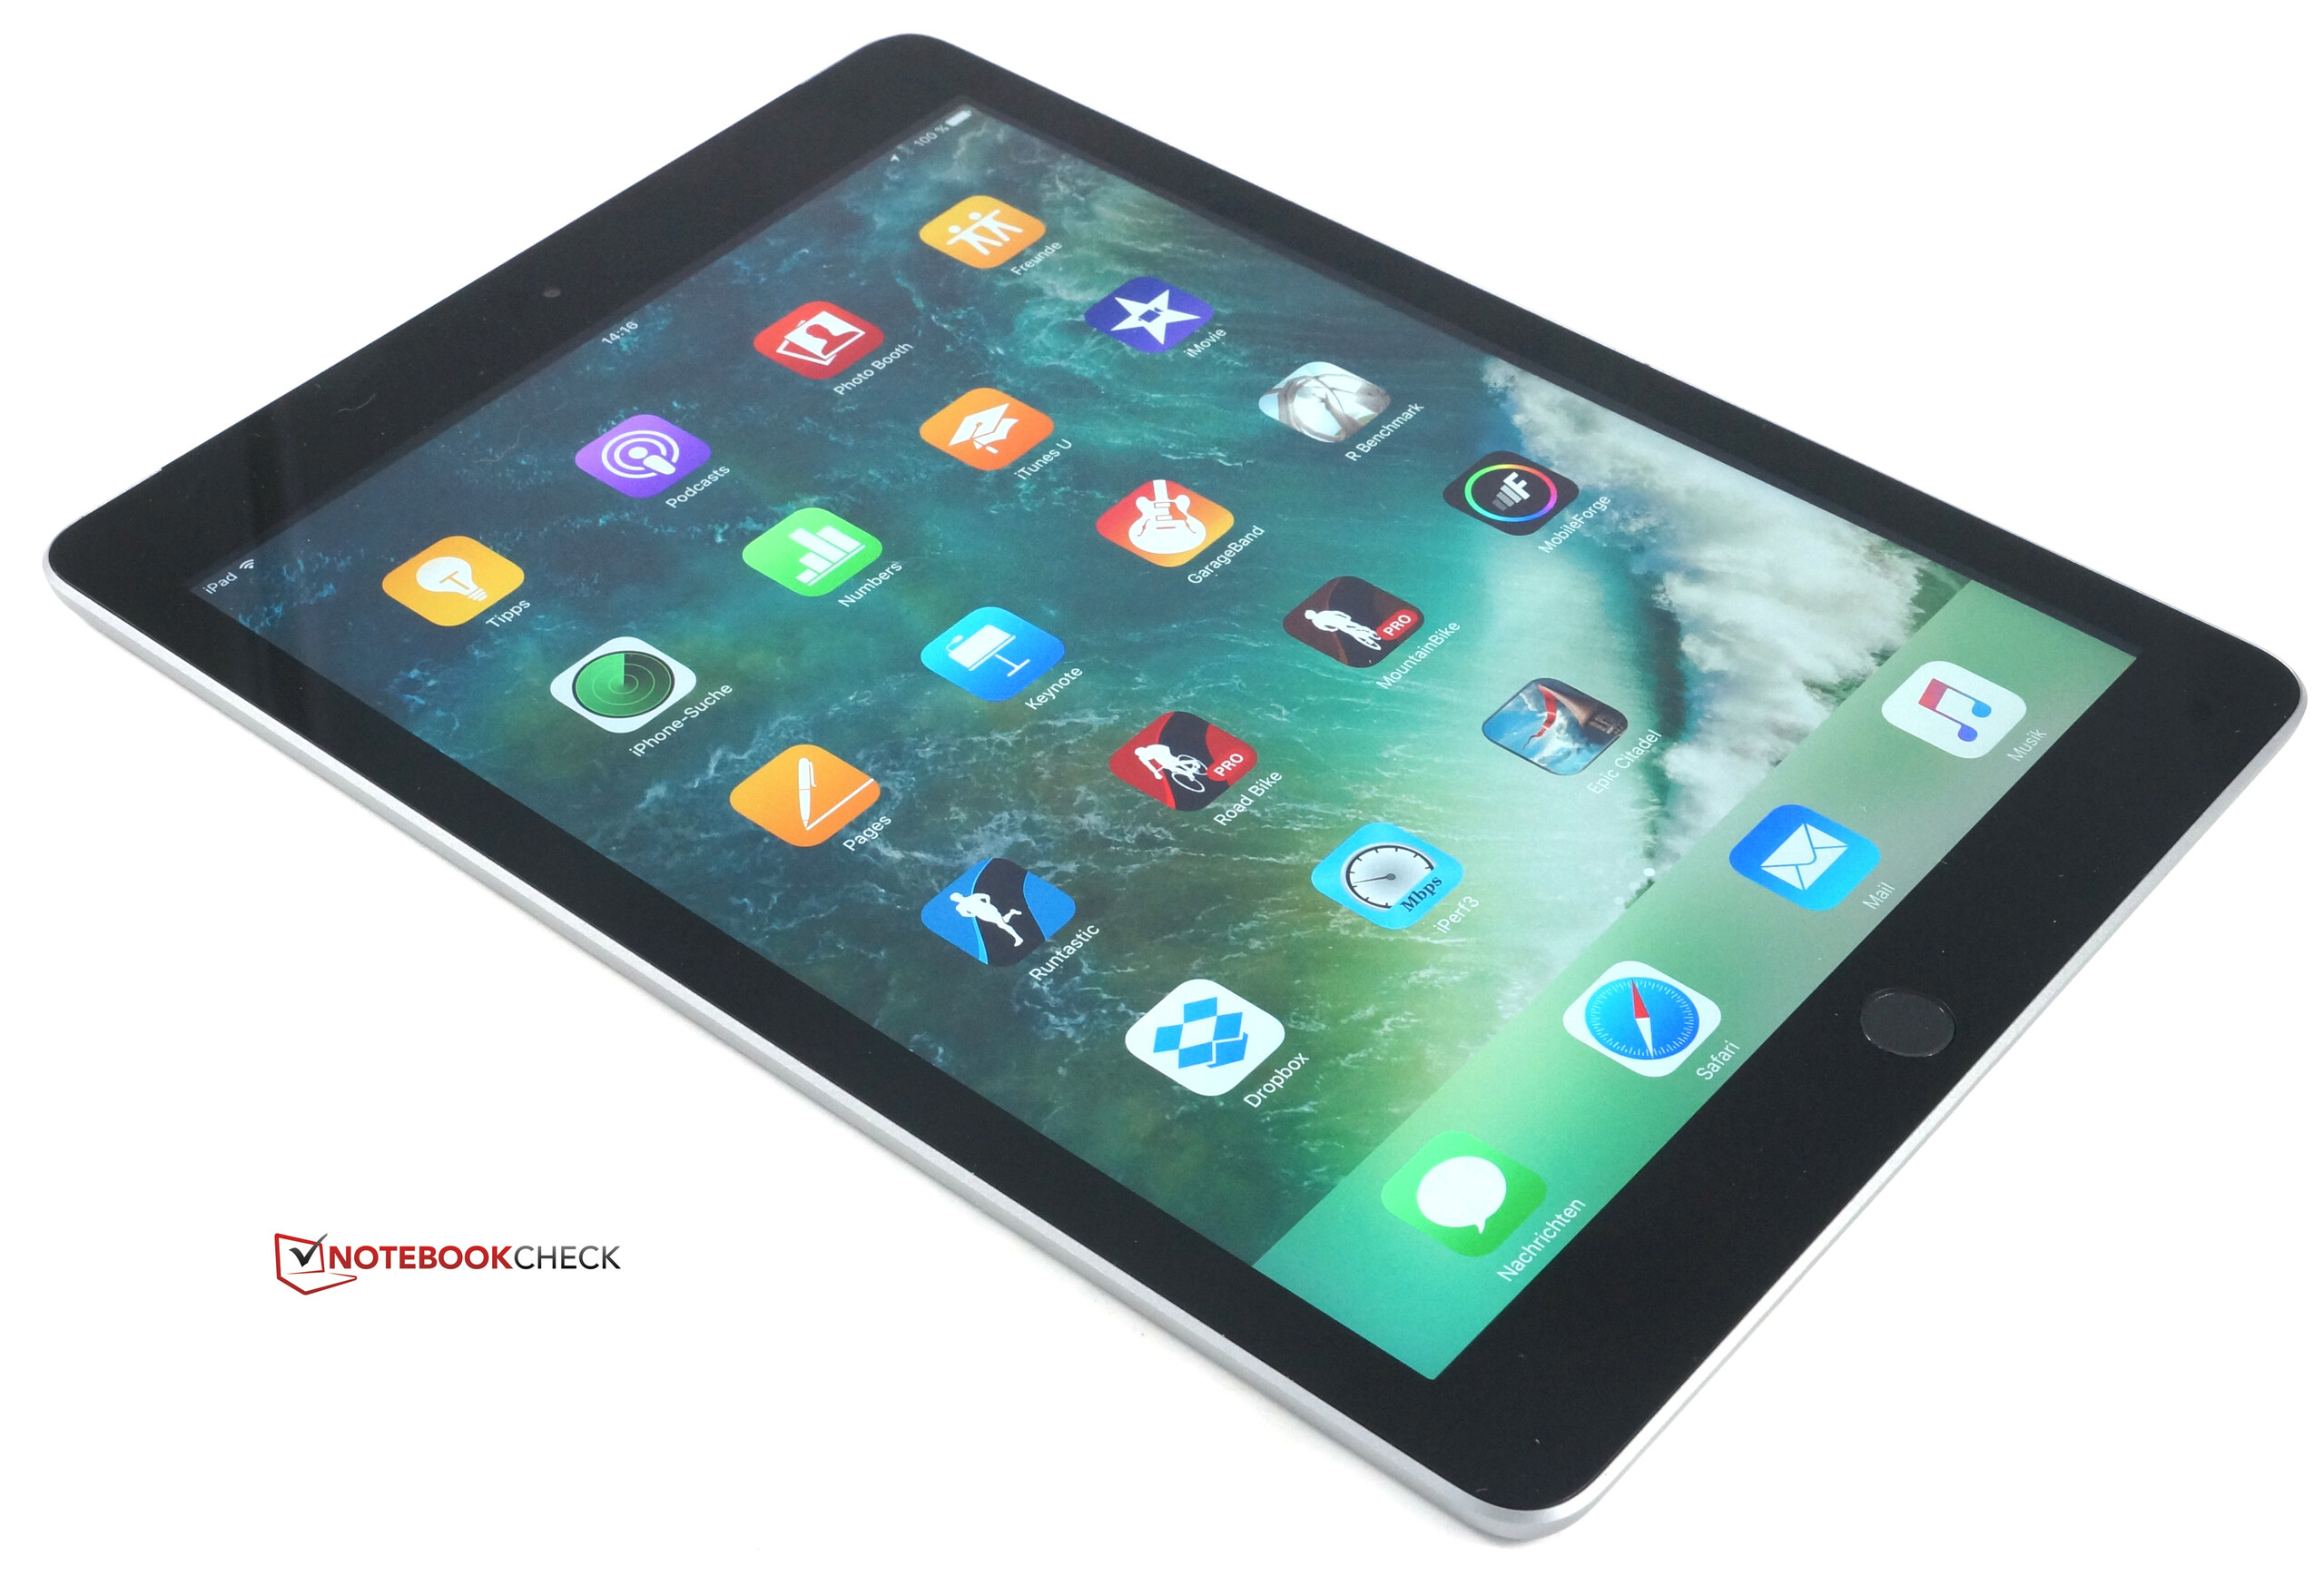
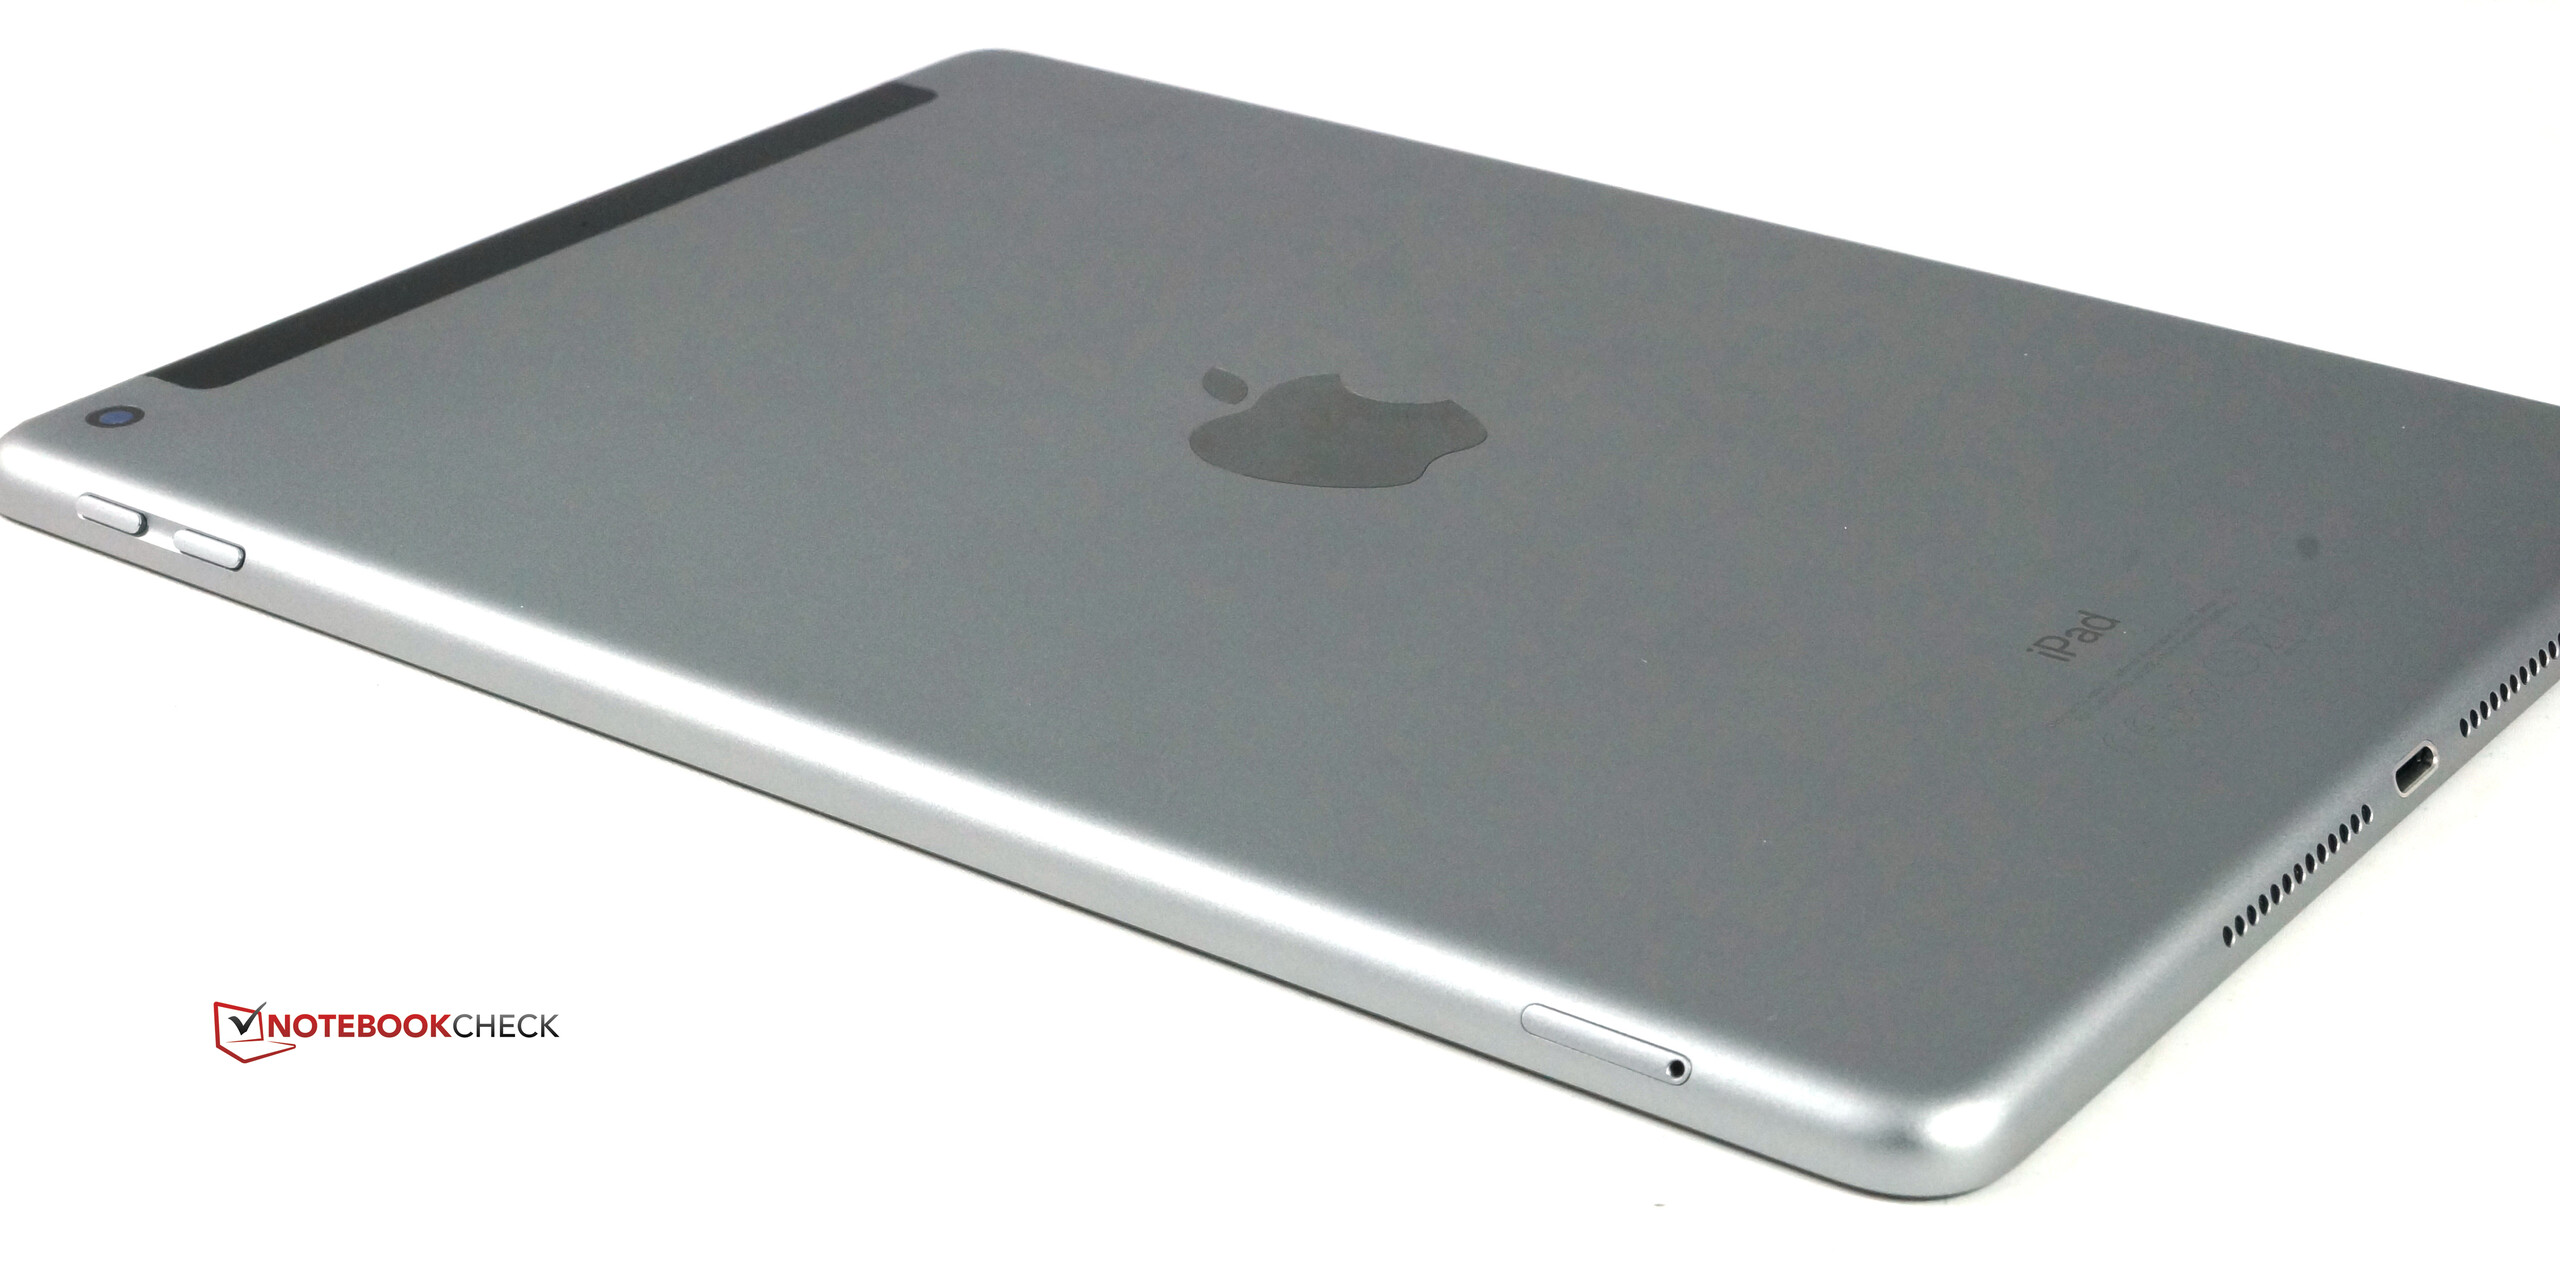
Vinho velho em garrafas novas – escutamos isso frequentemente quando um fabricante atualiza um produto supostamente antigo. Especialmente quando está equipado com tecnologia desatualizada. Este também é o caso do mais recente iPad da Apple. O tablet iOS de 2017 é apenas isso: hardware reciclado e datado em um chassi ainda mais antigo. No entanto, a versão de nível de entrada custa apenas 400 Euros ($329) em compensação, quase uma barganha para os tablets da Apple. O veredicto teoricamente poderia acabar neste ponto, quando você olha desde um ponto de vista superficial.
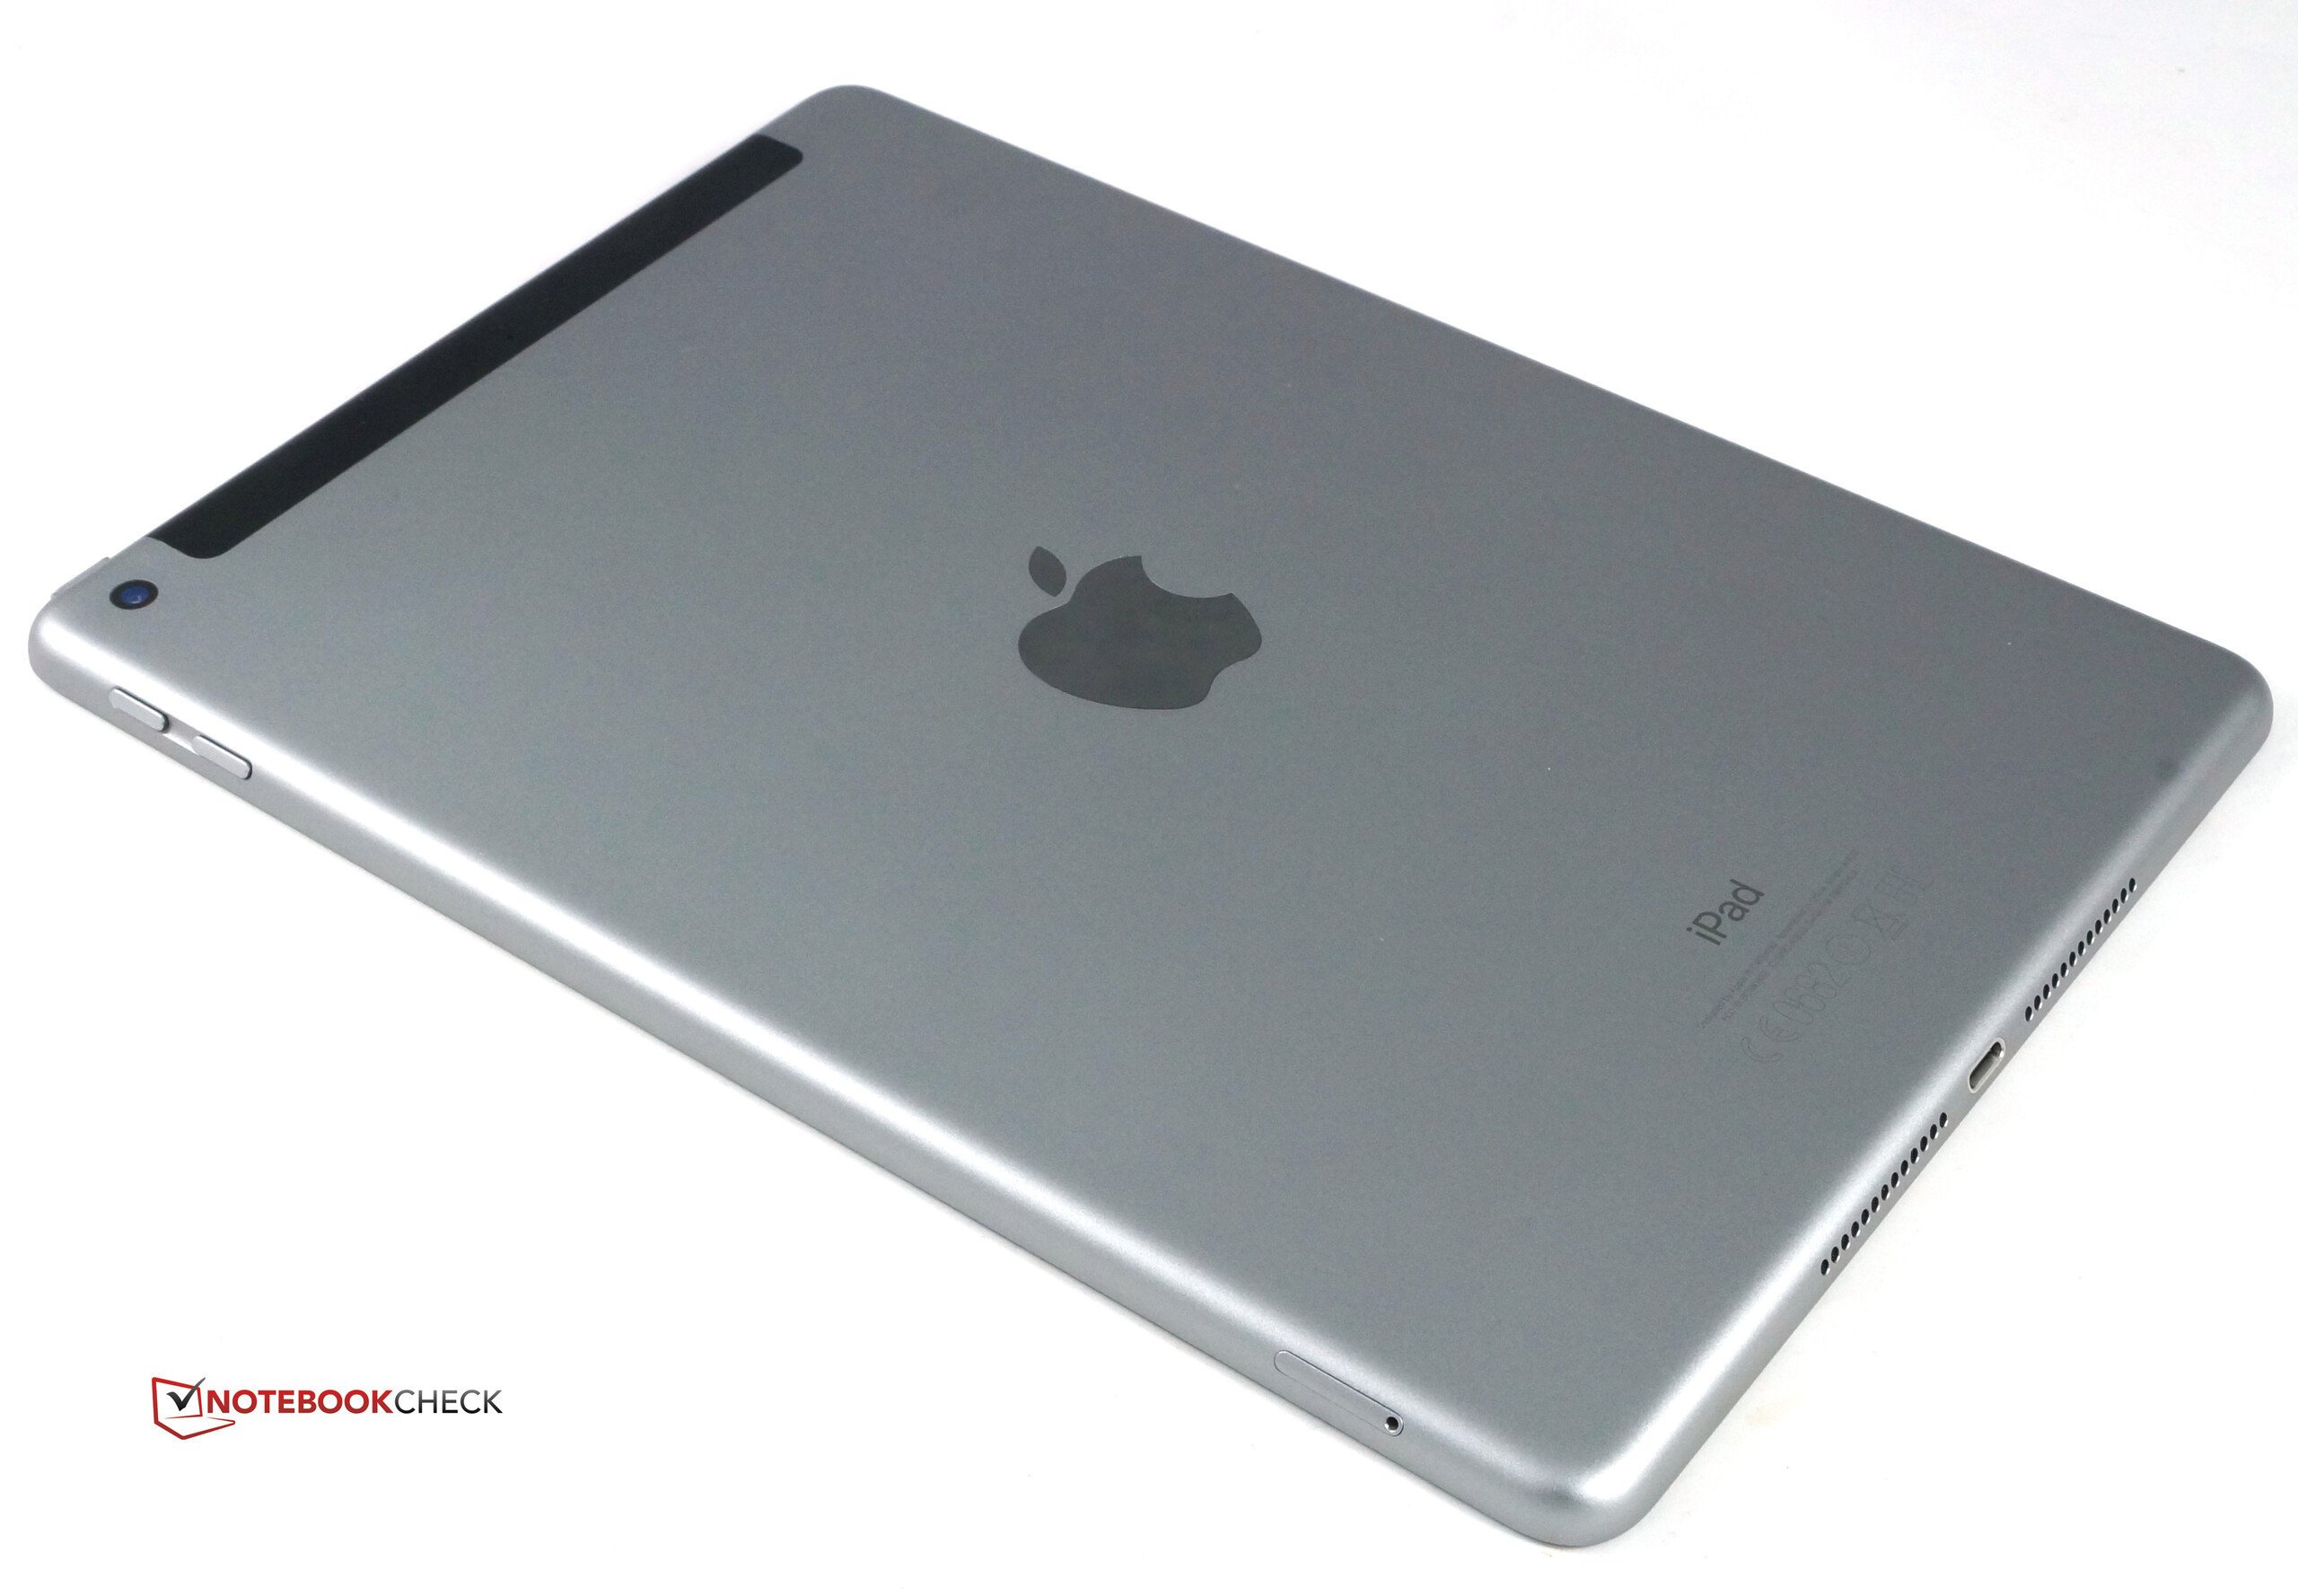
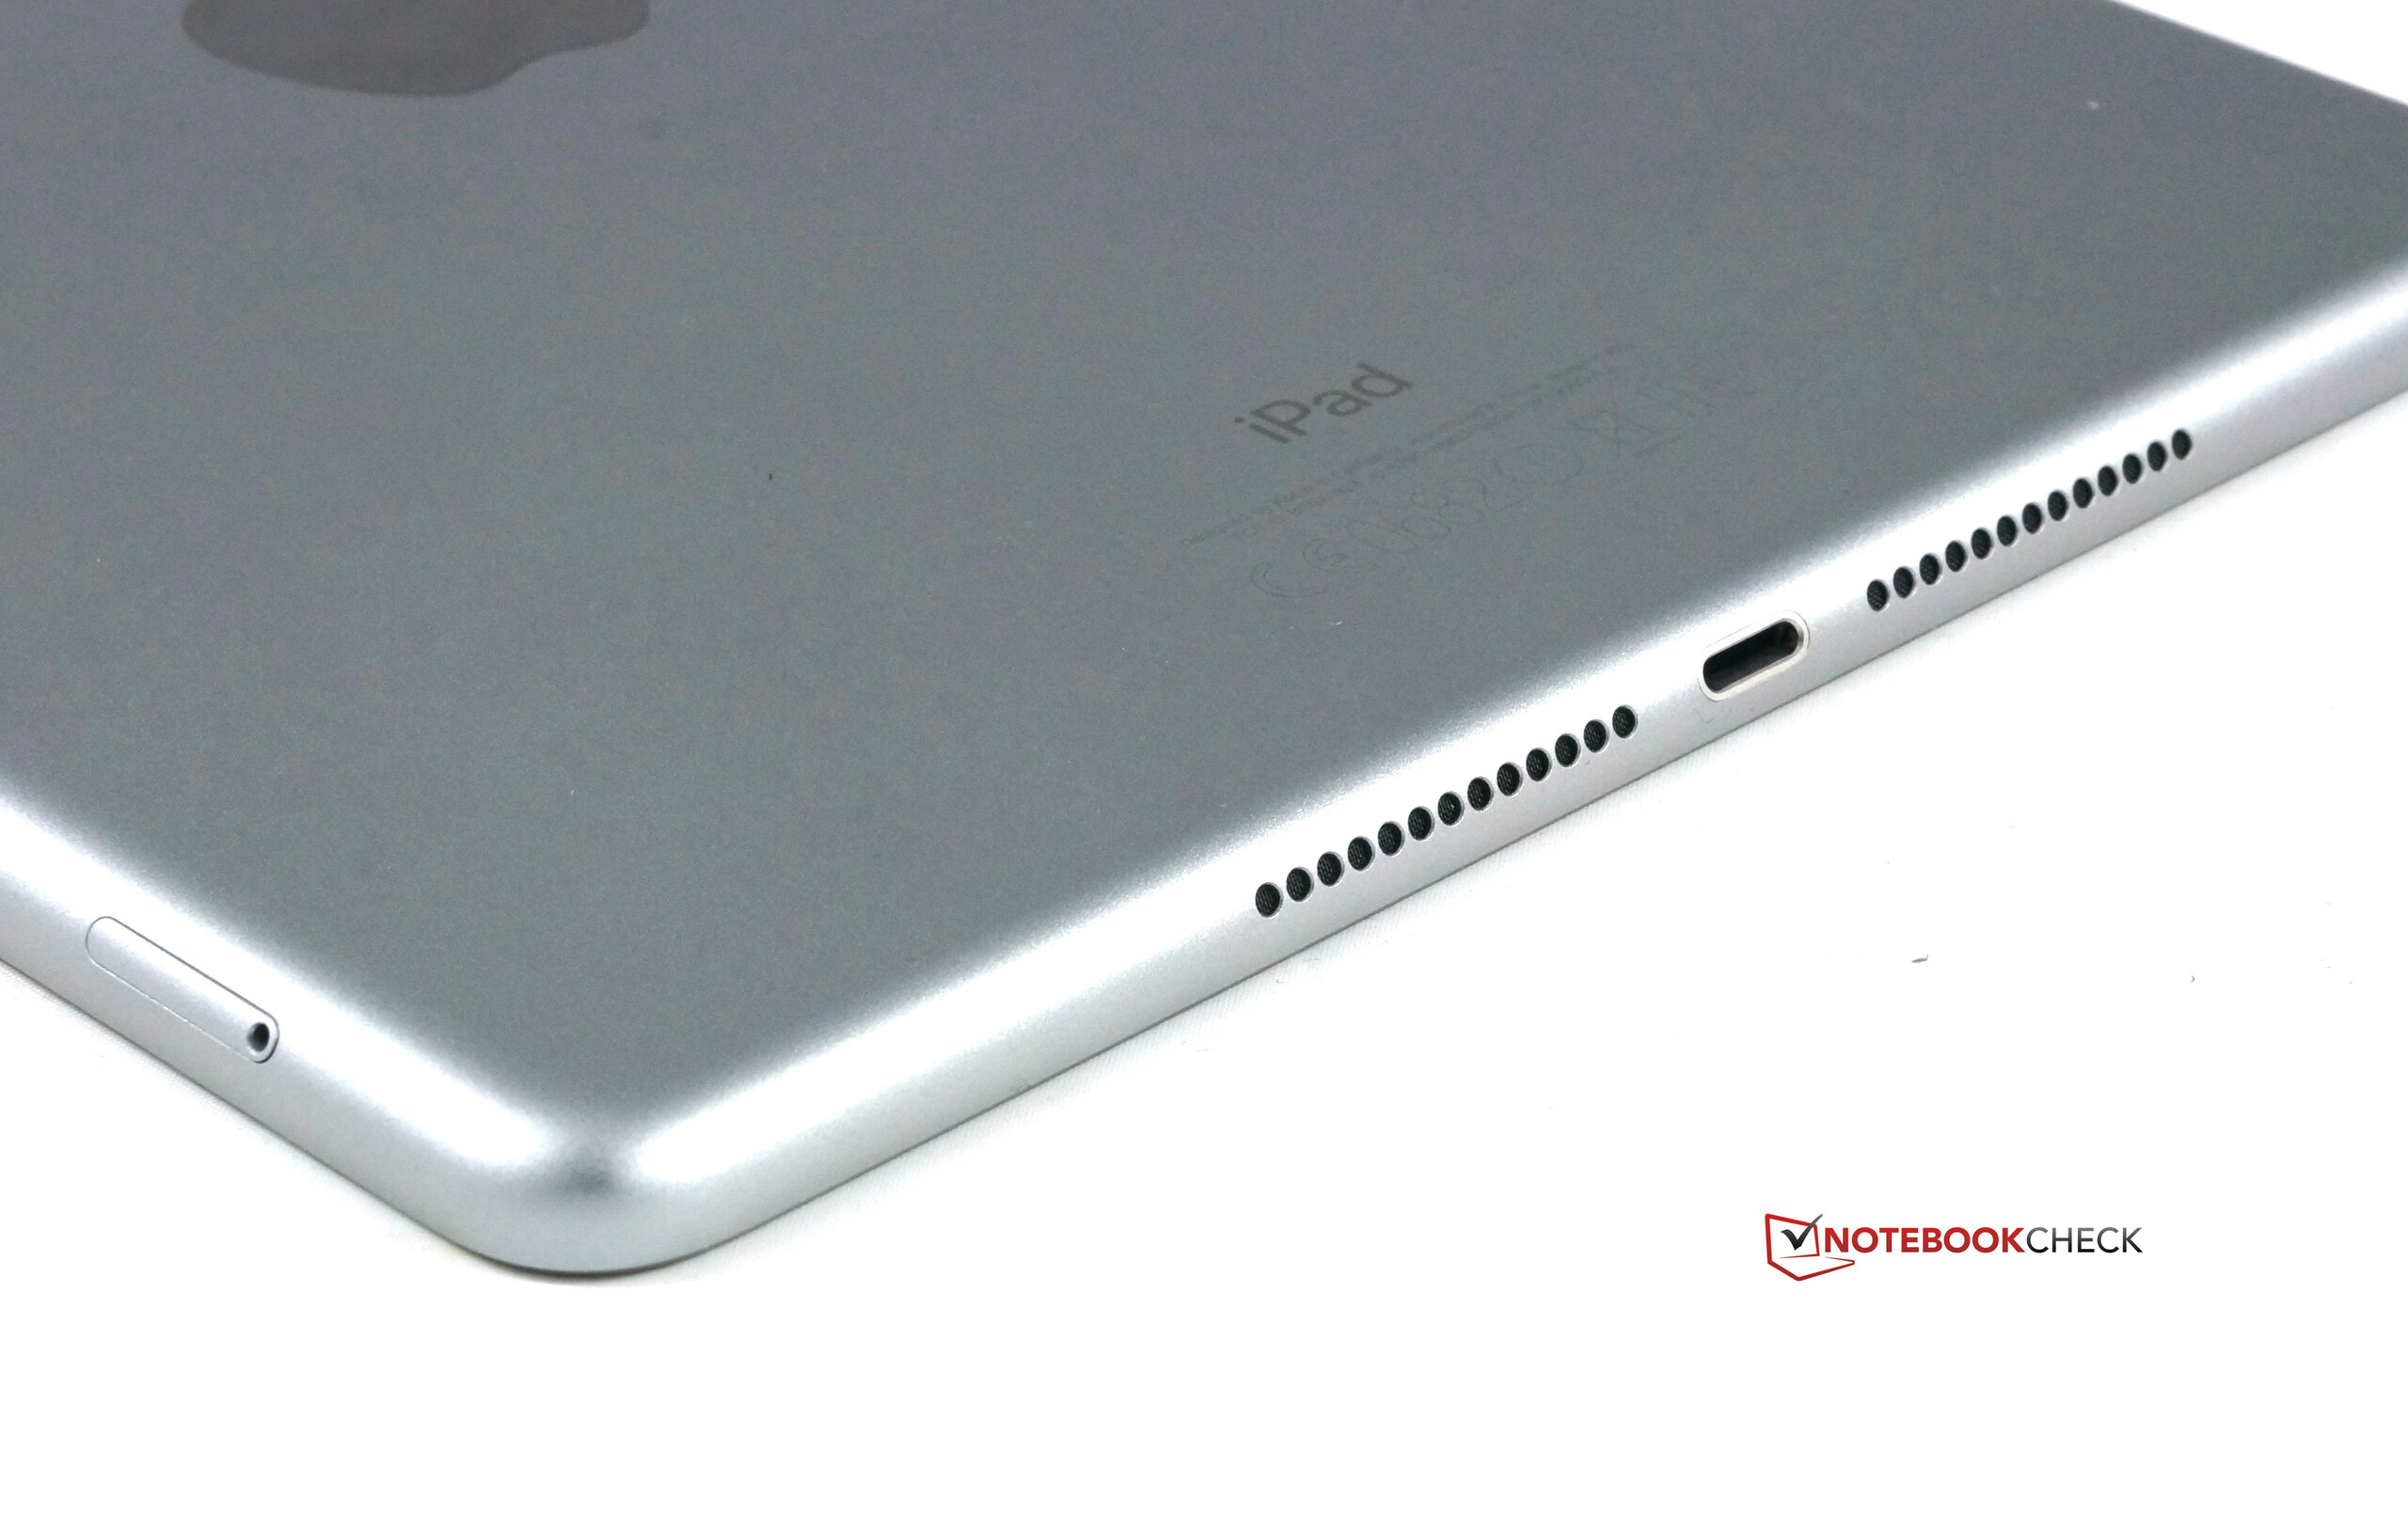
Uma olhada mais de perto, no entanto, irá remover rapidamente muitas das críticas iniciais. Sim, o SoC é antigo, mas o desempenho ainda é muito bom para o segmento de tablets. E sim, o chassi esteve por aqui durante um par de anos e já foi substituído por uma versão mais fina. No entanto, a qualidade de construção e os materiais ainda são de primeira categoria. Achamos que ninguém desejaria um iPad mais fino ou mais leve se não fosse o iPad Air 2 ou o iPad Pro 9.7.
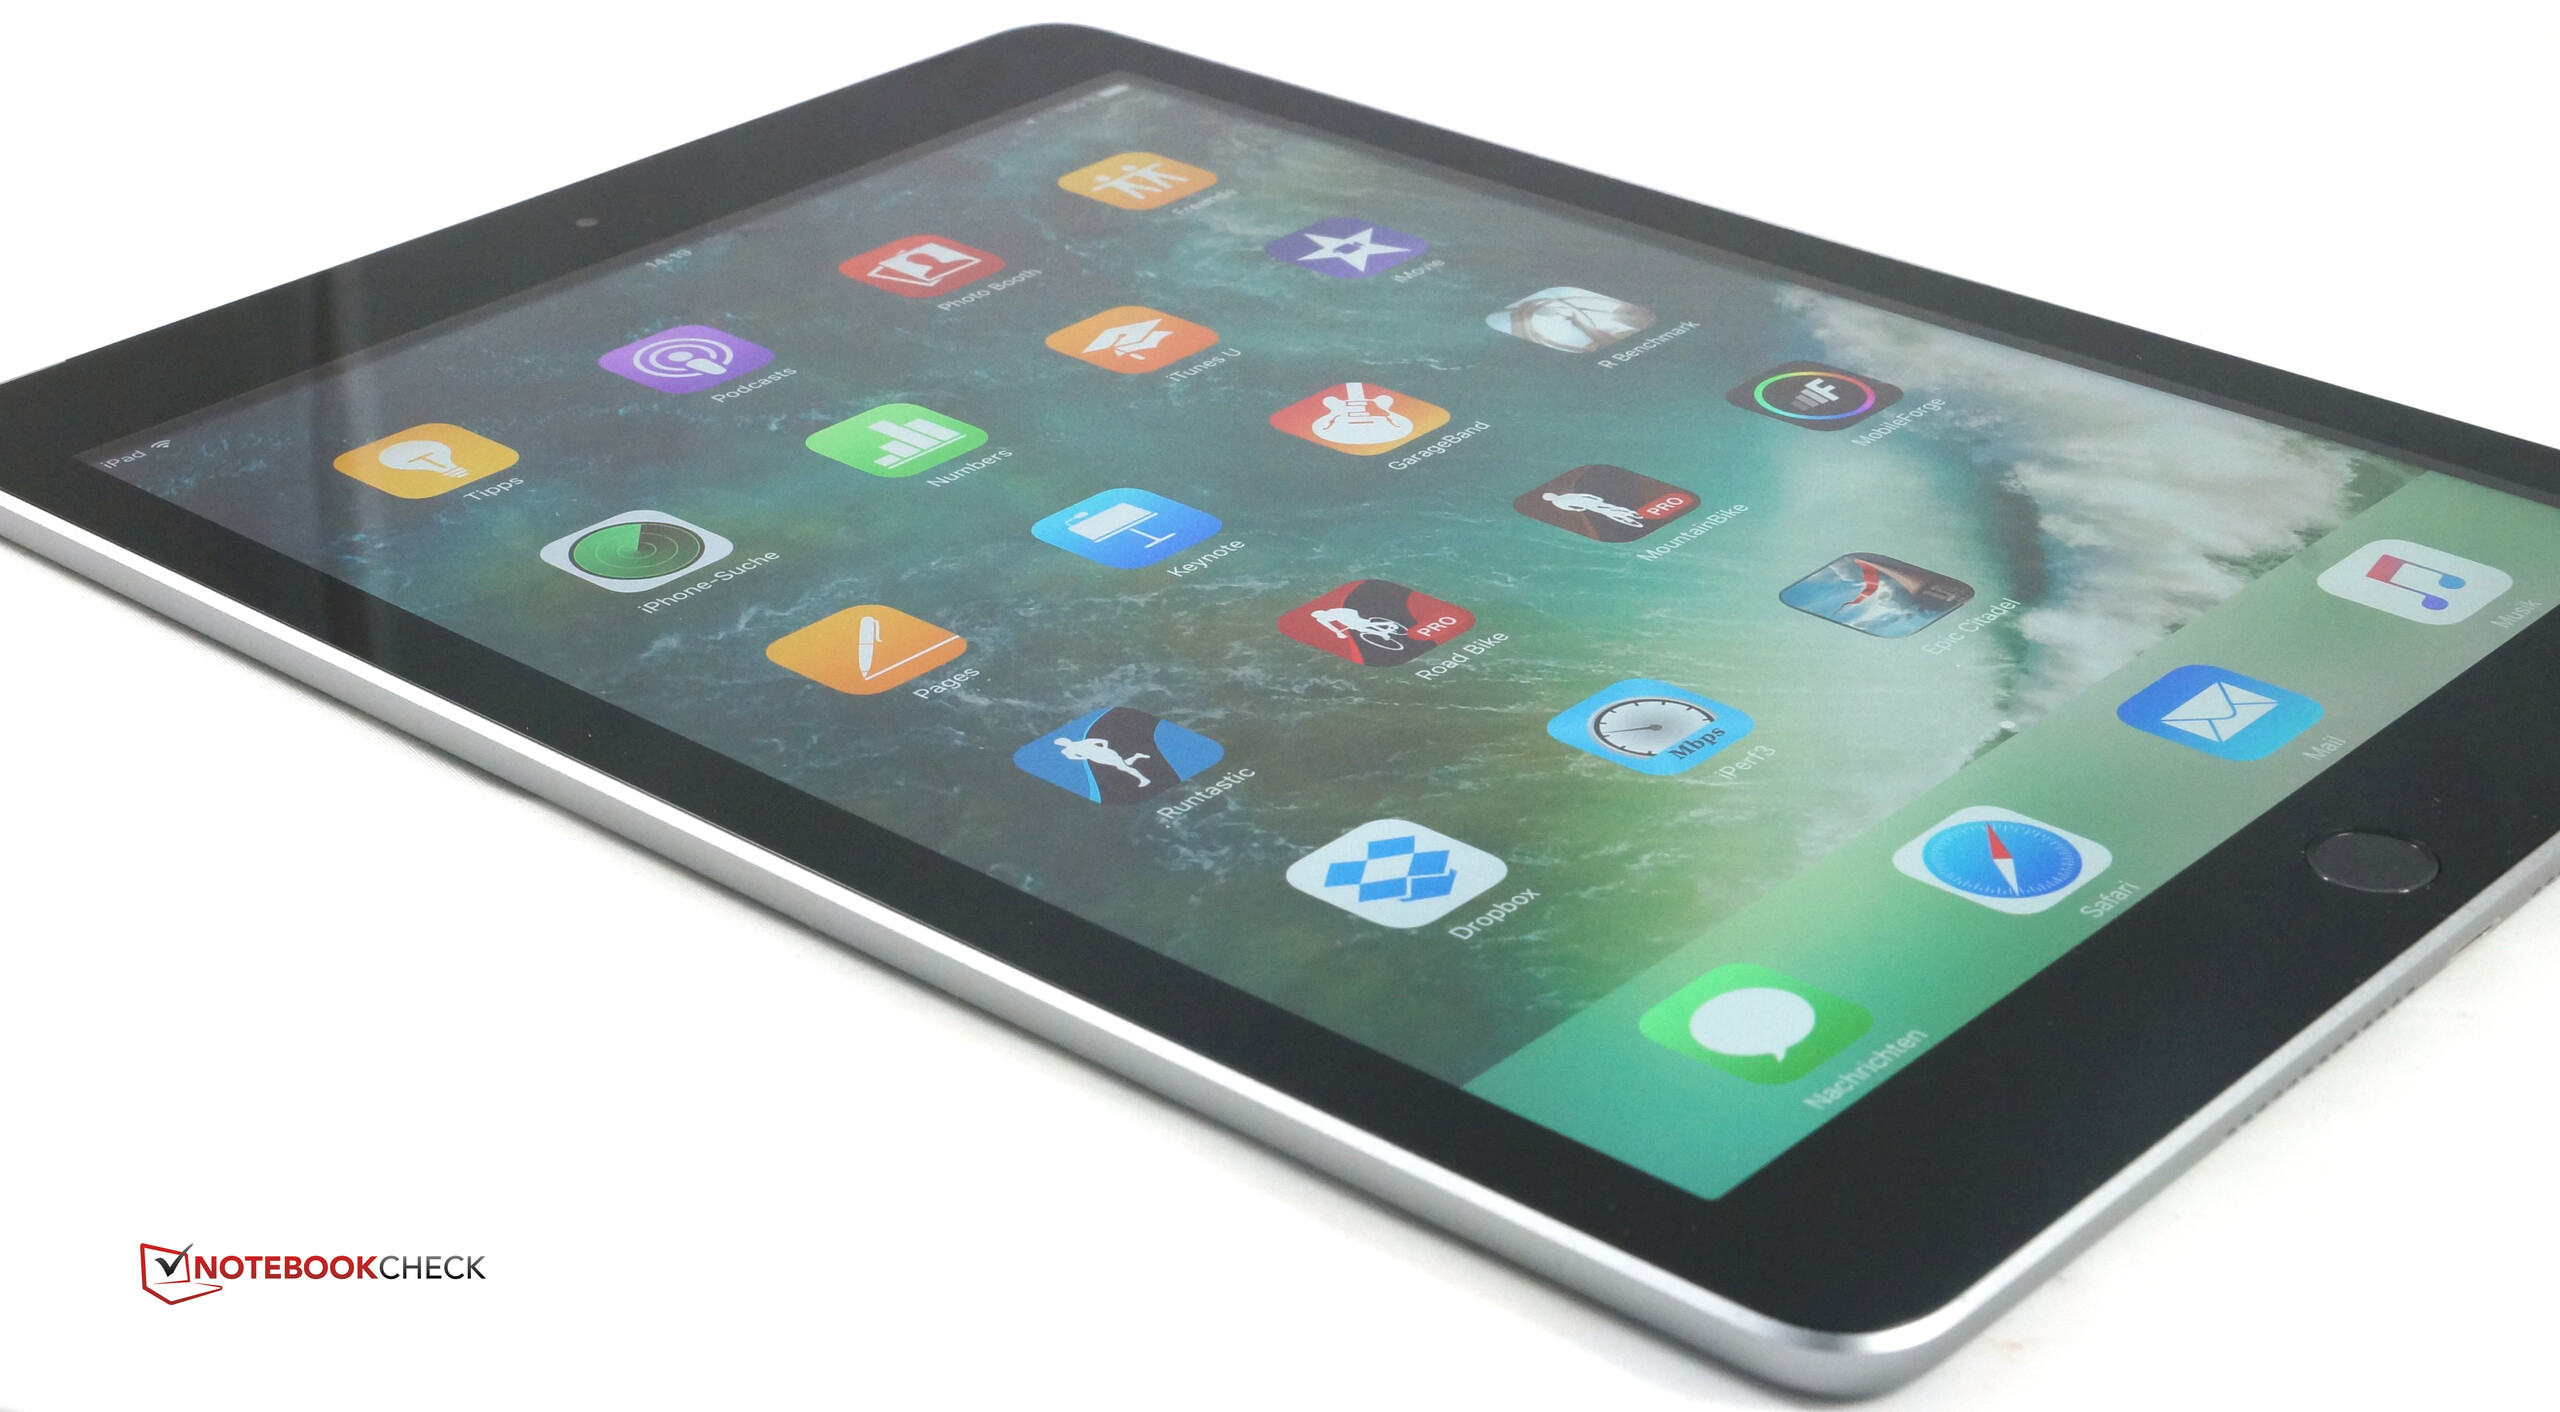
A Apple também melhorou alguns aspectos do novo iPad, em comparação com o iPad Air original. A primeira coisa é o chip mais veloz. A tela também é muito mais brilhante, e as durações da bateria são ainda mais longas. Combinado com o veloz Wi-Fi, diversas bandas LTE, um excelente receptor GPS e câmera utilizável, o velho vinho de repente parece ser mais atraente.
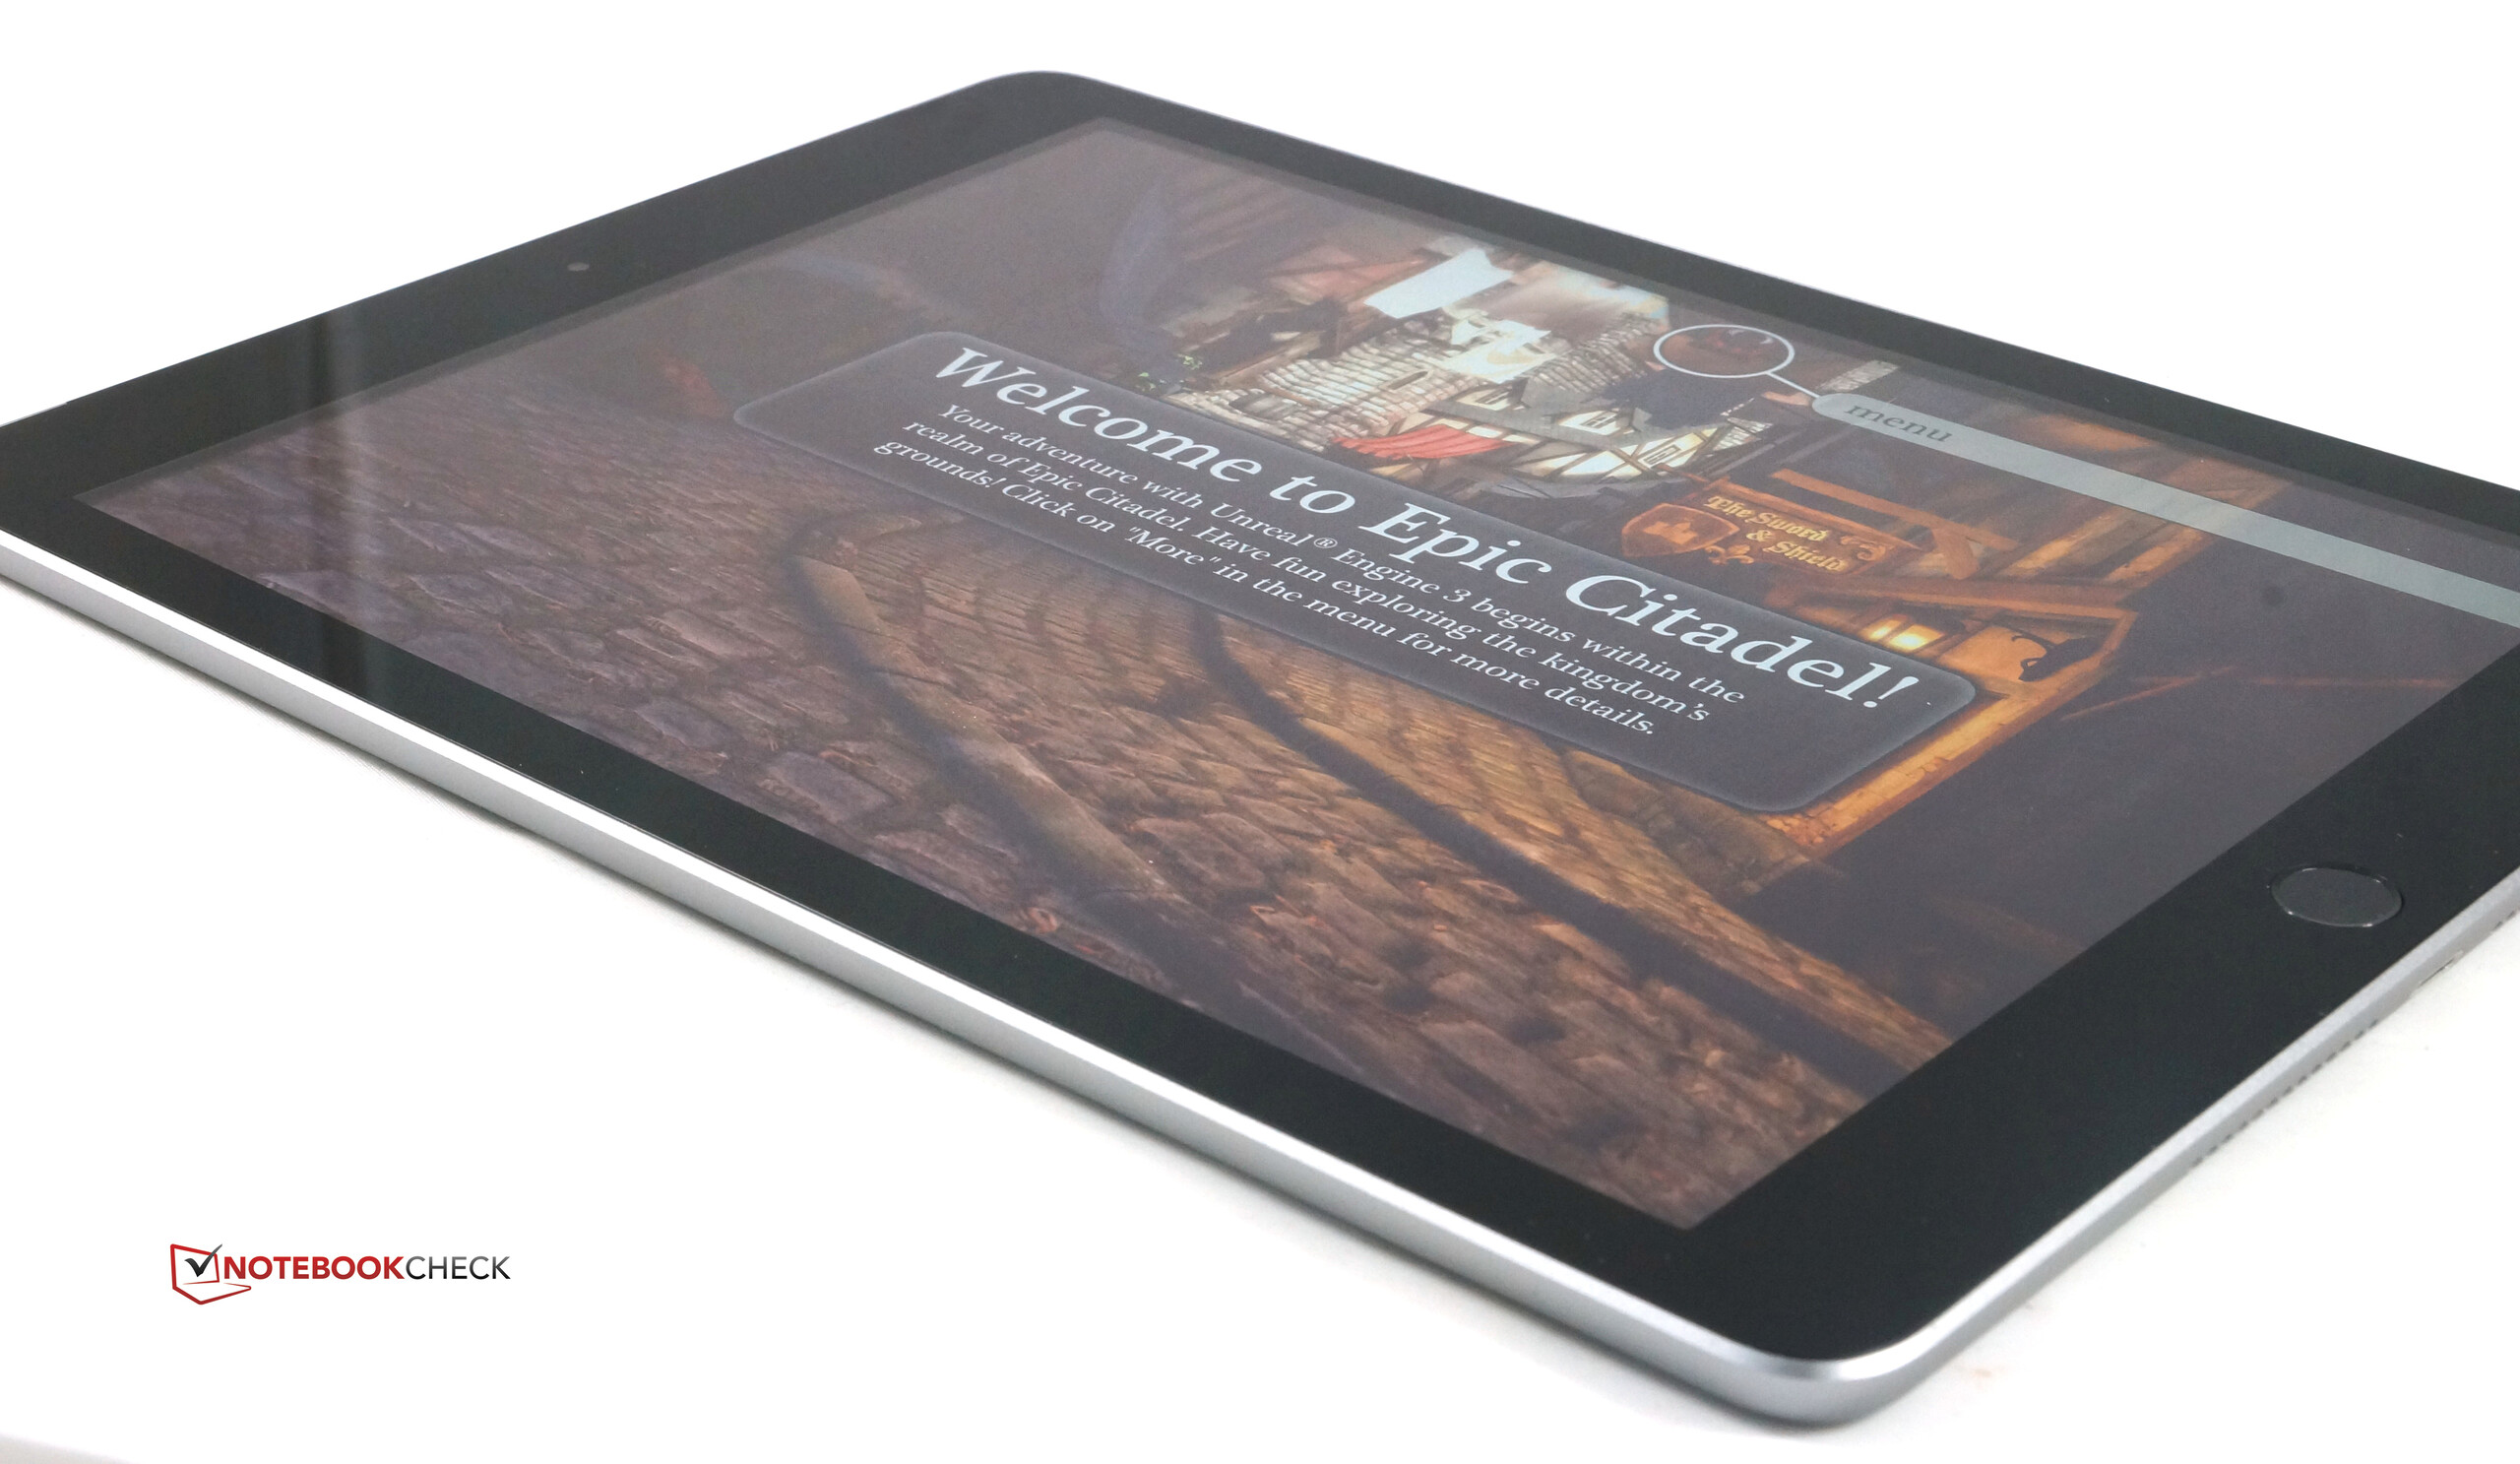
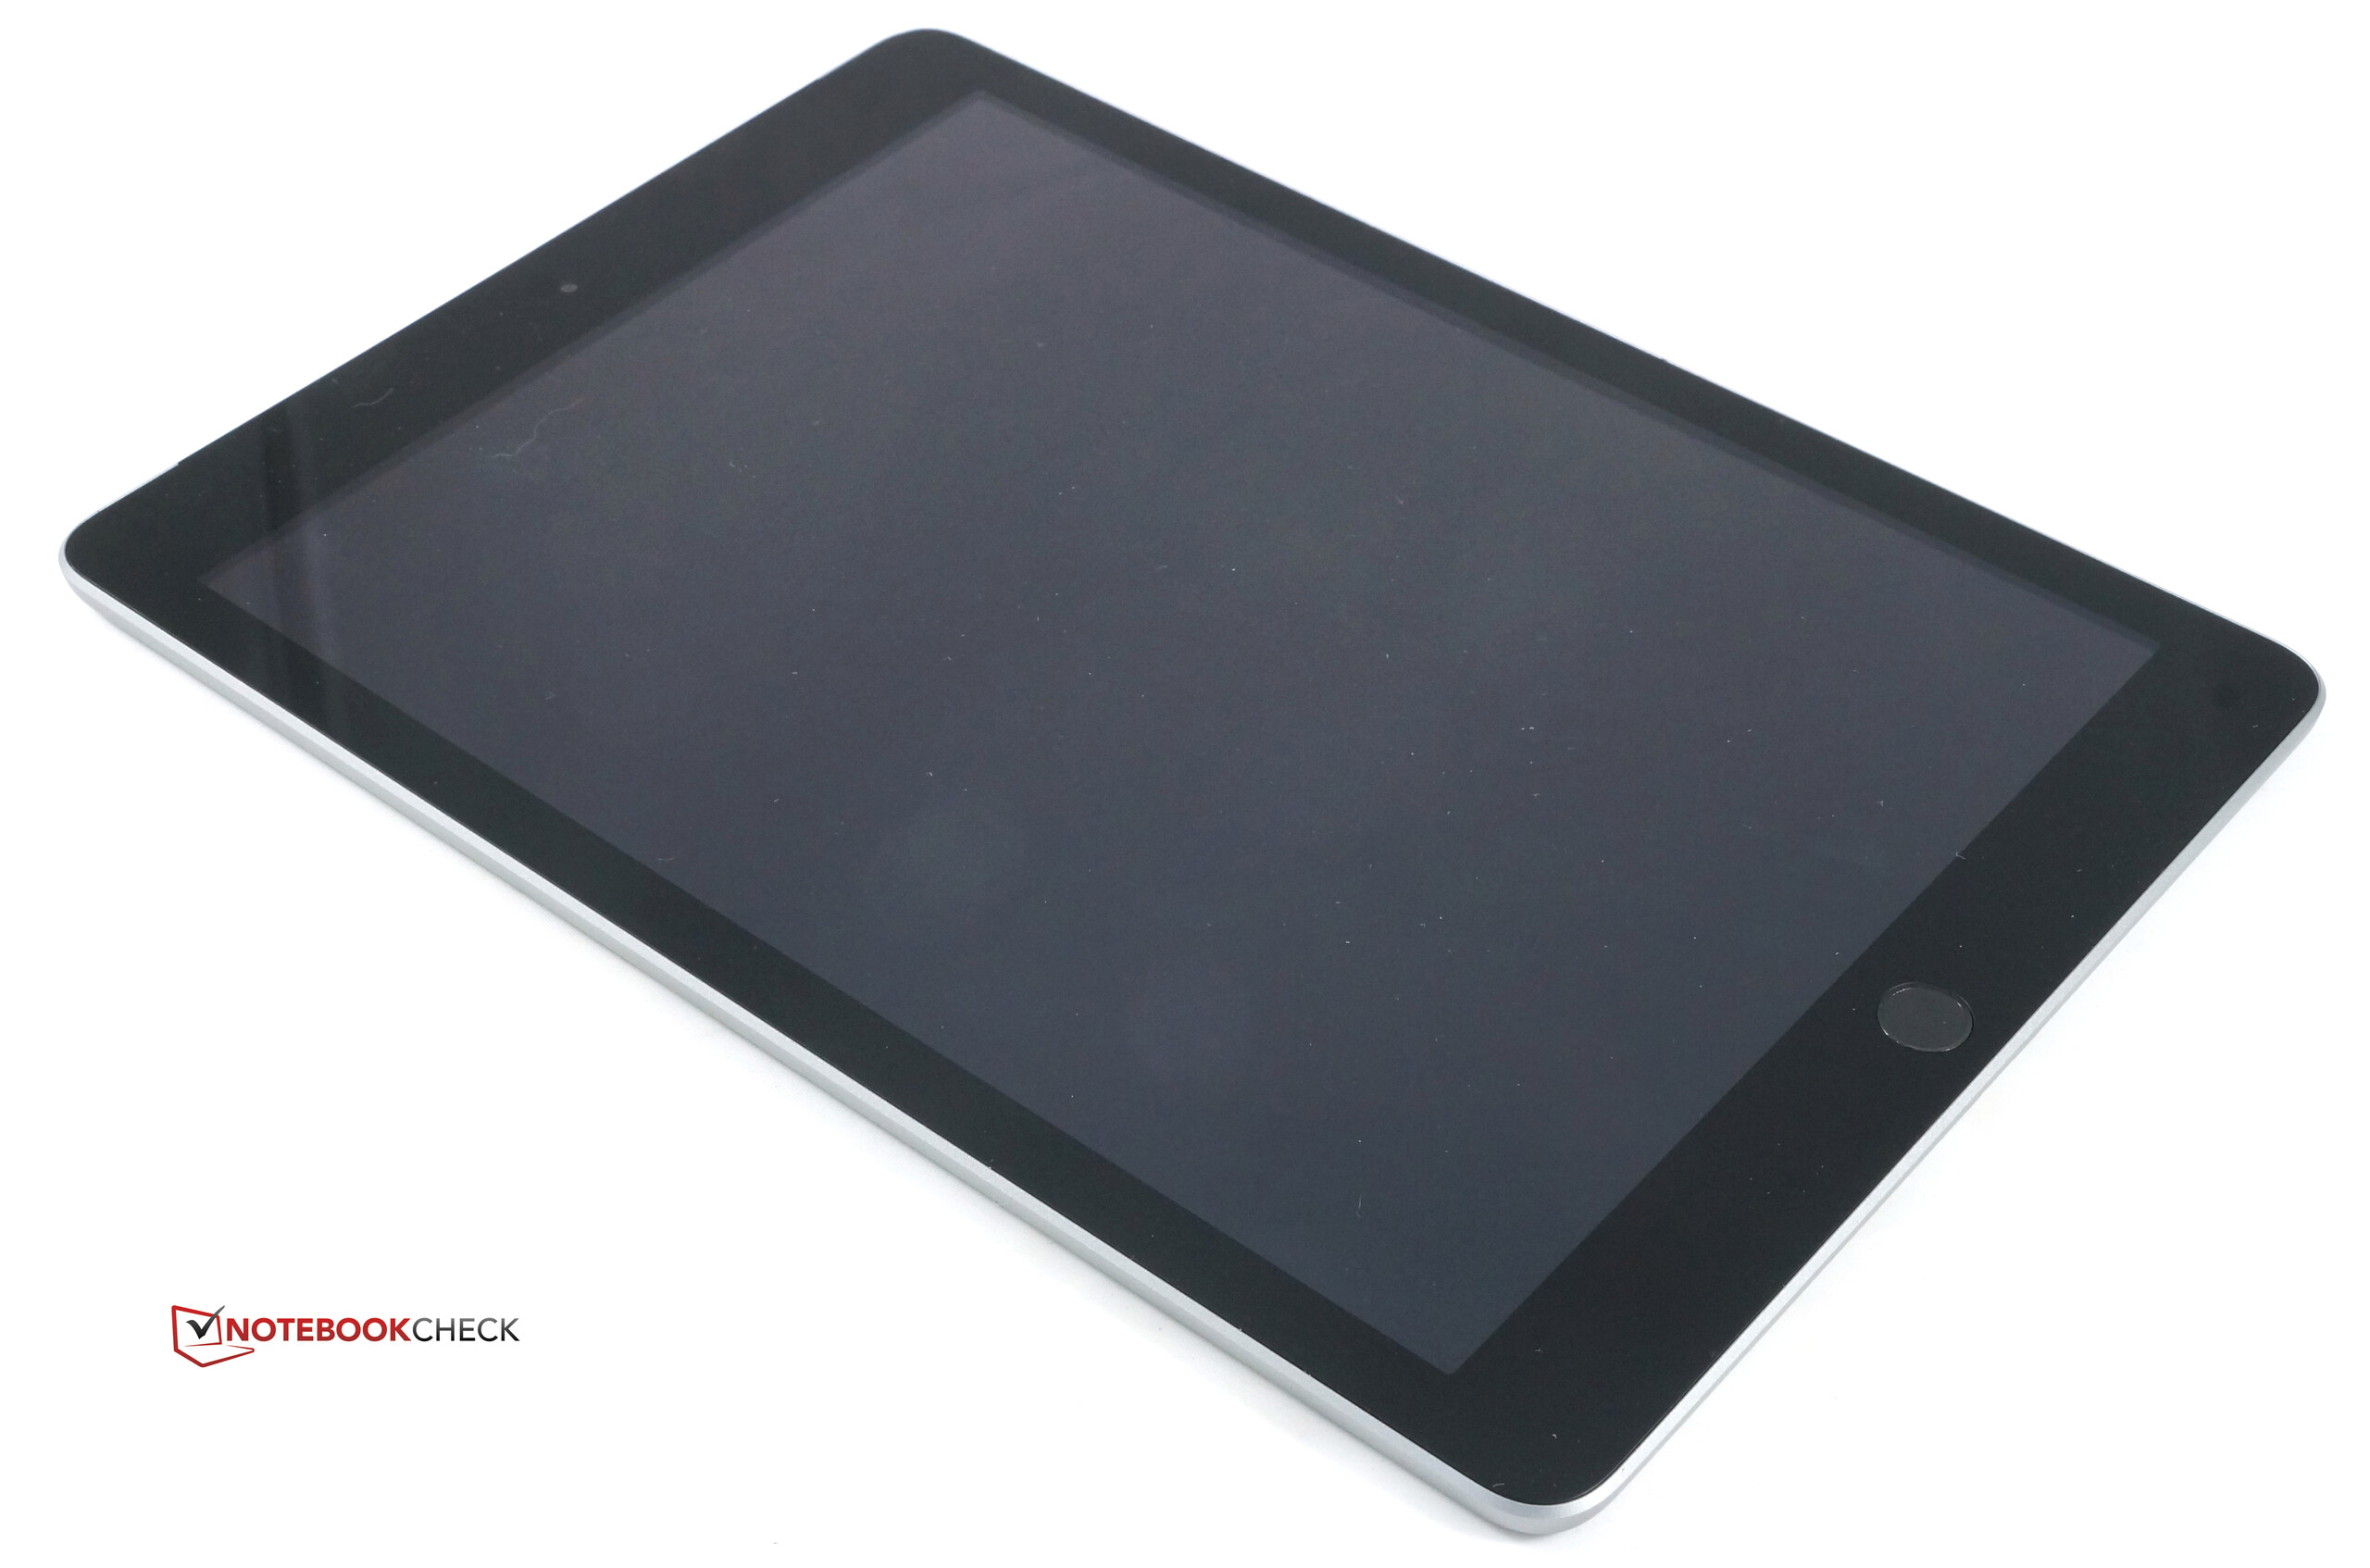
NO entanto, ainda existem algumas falhas. A ausência de uma tela totalmente laminada traz de volta um antigo problema do tablet: A luz direta do sol irá transformar o tablet em um espelho. Este é um passo irritante para trás para todos os que já utilizaram um iPad Mini 4 ou Air 2. Que o novo iPad cubra "apenas" o espaço de cores sRGB – não é algo decisivo. E que você não tenha suporte para o Apple Pencil a 400 Euros – bom, é para isso que estão os modelos Pro mais caros.
Vamos resumir: O novo Apple iPad é quase enjoadamente bom. Quase não existe concorrência em termos de desempenho, exceto por outros tablets da Apple, apesar do hardware datado. A avaliação geral é quase um sonho para o "underdog", mas isto também deve-se , em parte, à fraca concorrência de tablets.
Let's sum it up: The new Apple iPad is almost boringly good. There is hardly any competition in terms of performance except for other Apple tablets, despite the dated hardware. The overall rating is almost dreamlike for the "underdog", but this is in part also a result of the weak tablet competition.
Apple iPad (2017)
- 03/31/2018 v6 (old)
Patrick Afschar Kaboli
Price comparison
