Análise do Schenker Work 14 Base - O laptop de escritório acessível com muitas portas e uma tela IPS brilhante
O Work 14 Base da Schenker é um laptop de escritório compacto que, além de uma tela IPS brilhante e fosca, oferece opções de atualização muito boas e uma ampla variedade de portas, incluindo Ethernet, o que não é mais um dado adquirido hoje em dia, mesmo em laptops de escritório ou de negócios. Os preços do Work 14 começam em US$ 750 e nosso dispositivo de teste com 16 GB de RAM pode ser encontrado atualmente por cerca de US$ 770.
Possíveis concorrentes em comparação
Avaliação | Data | Modelo | Peso | Altura | Size | Resolução | Preço |
|---|---|---|---|---|---|---|---|
| 82 % v7 (old) | 05/2024 | Schenker Work 14 Base i5-1235U, Iris Xe G7 80EUs | 1.3 kg | 20.2 mm | 14.00" | 1920x1080 | |
| 85.6 % v7 (old) | 11/2023 | Acer Swift Go 14 SFG14-71 i5-1335U, Iris Xe G7 80EUs | 1.3 kg | 14.9 mm | 14.00" | 2880x1800 | |
| 84.6 % v7 (old) | 10/2023 | HP ProBook 445 G10 R5 7530U, Vega 7 | 1.3 kg | 20 mm | 14.00" | 1920x1080 | |
| 85.3 % v7 (old) | 06/2023 | Dell Latitude 3440 i5-1345U, Iris Xe G7 80EUs | 1.5 kg | 19.4 mm | 14.00" | 1920x1080 | |
| 88.6 % v7 (old) | 08/2023 | Lenovo ThinkPad L14 G4 21H6S00900 R5 7530U, Vega 7 | 1.5 kg | 19.83 mm | 14.00" | 1920x1080 |
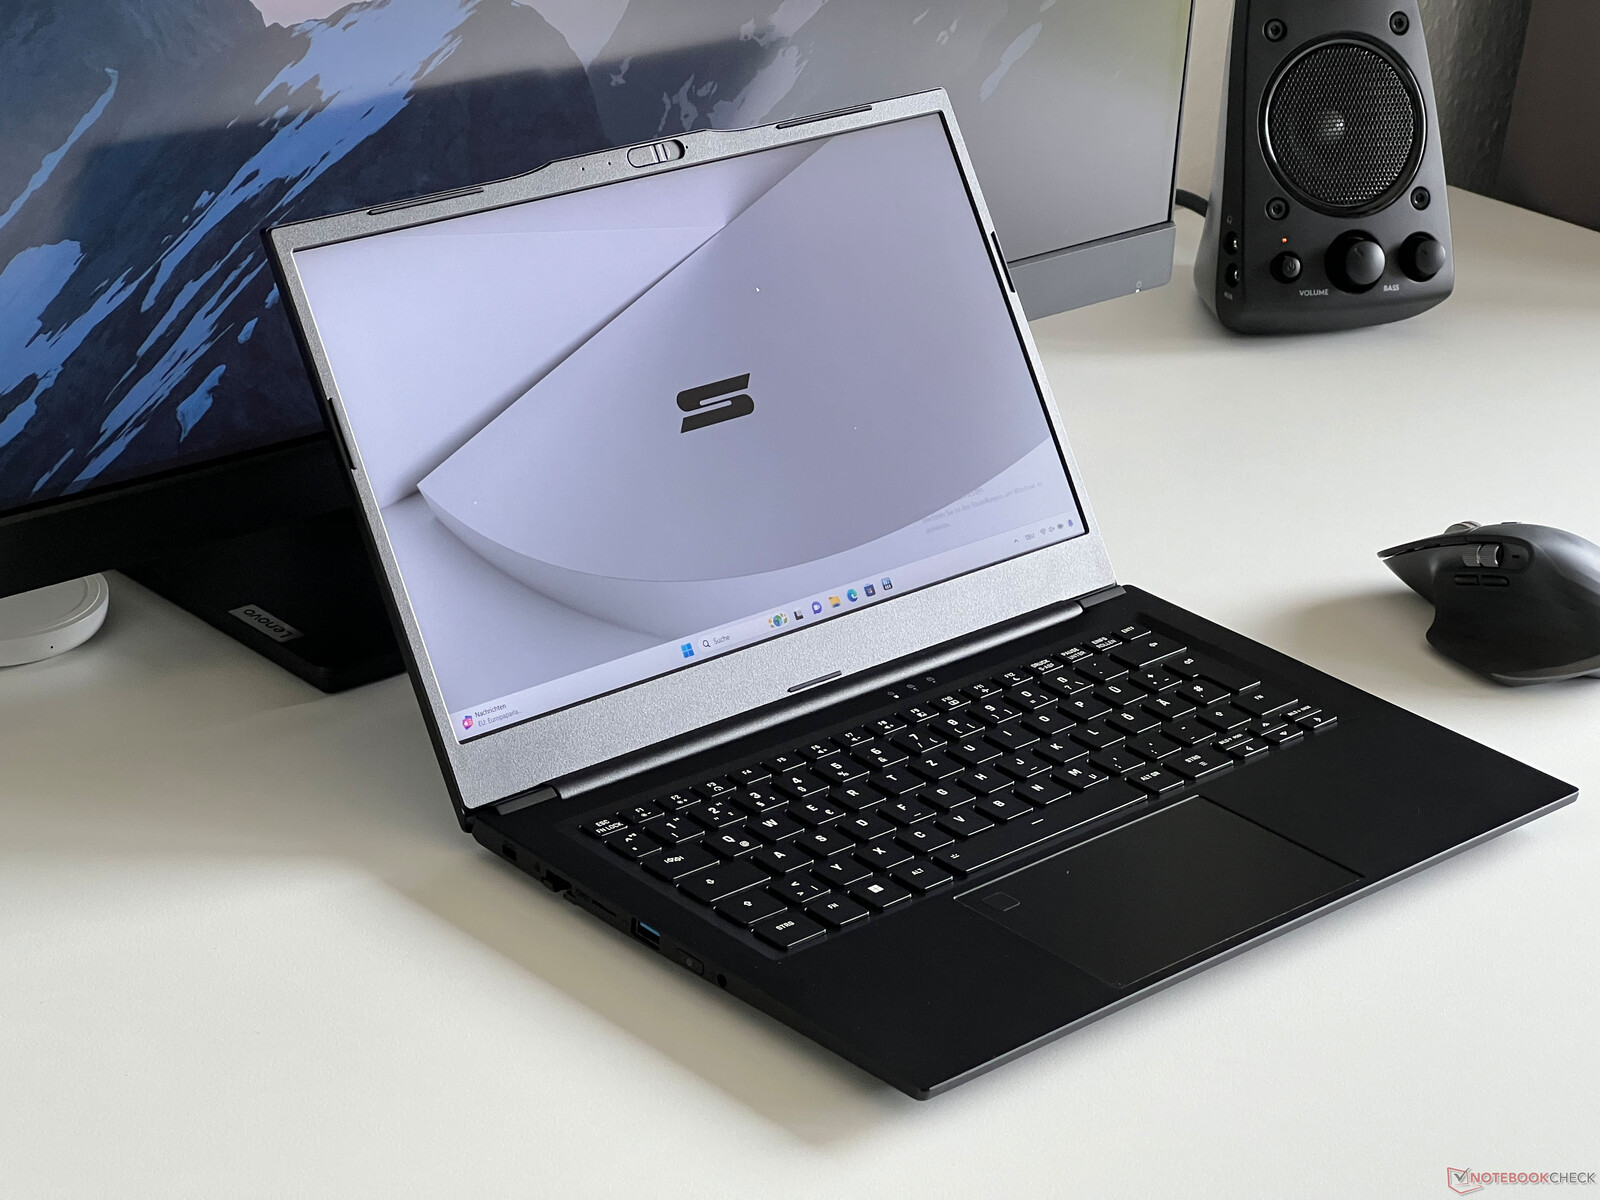
Estojo e conectividade
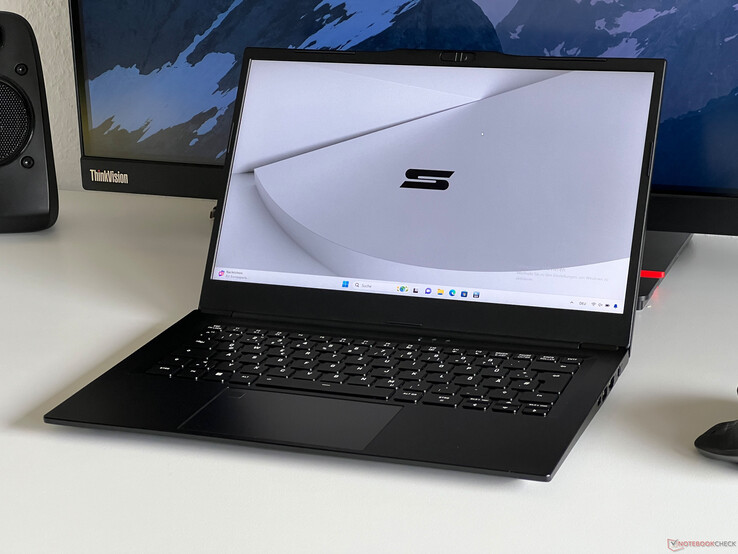
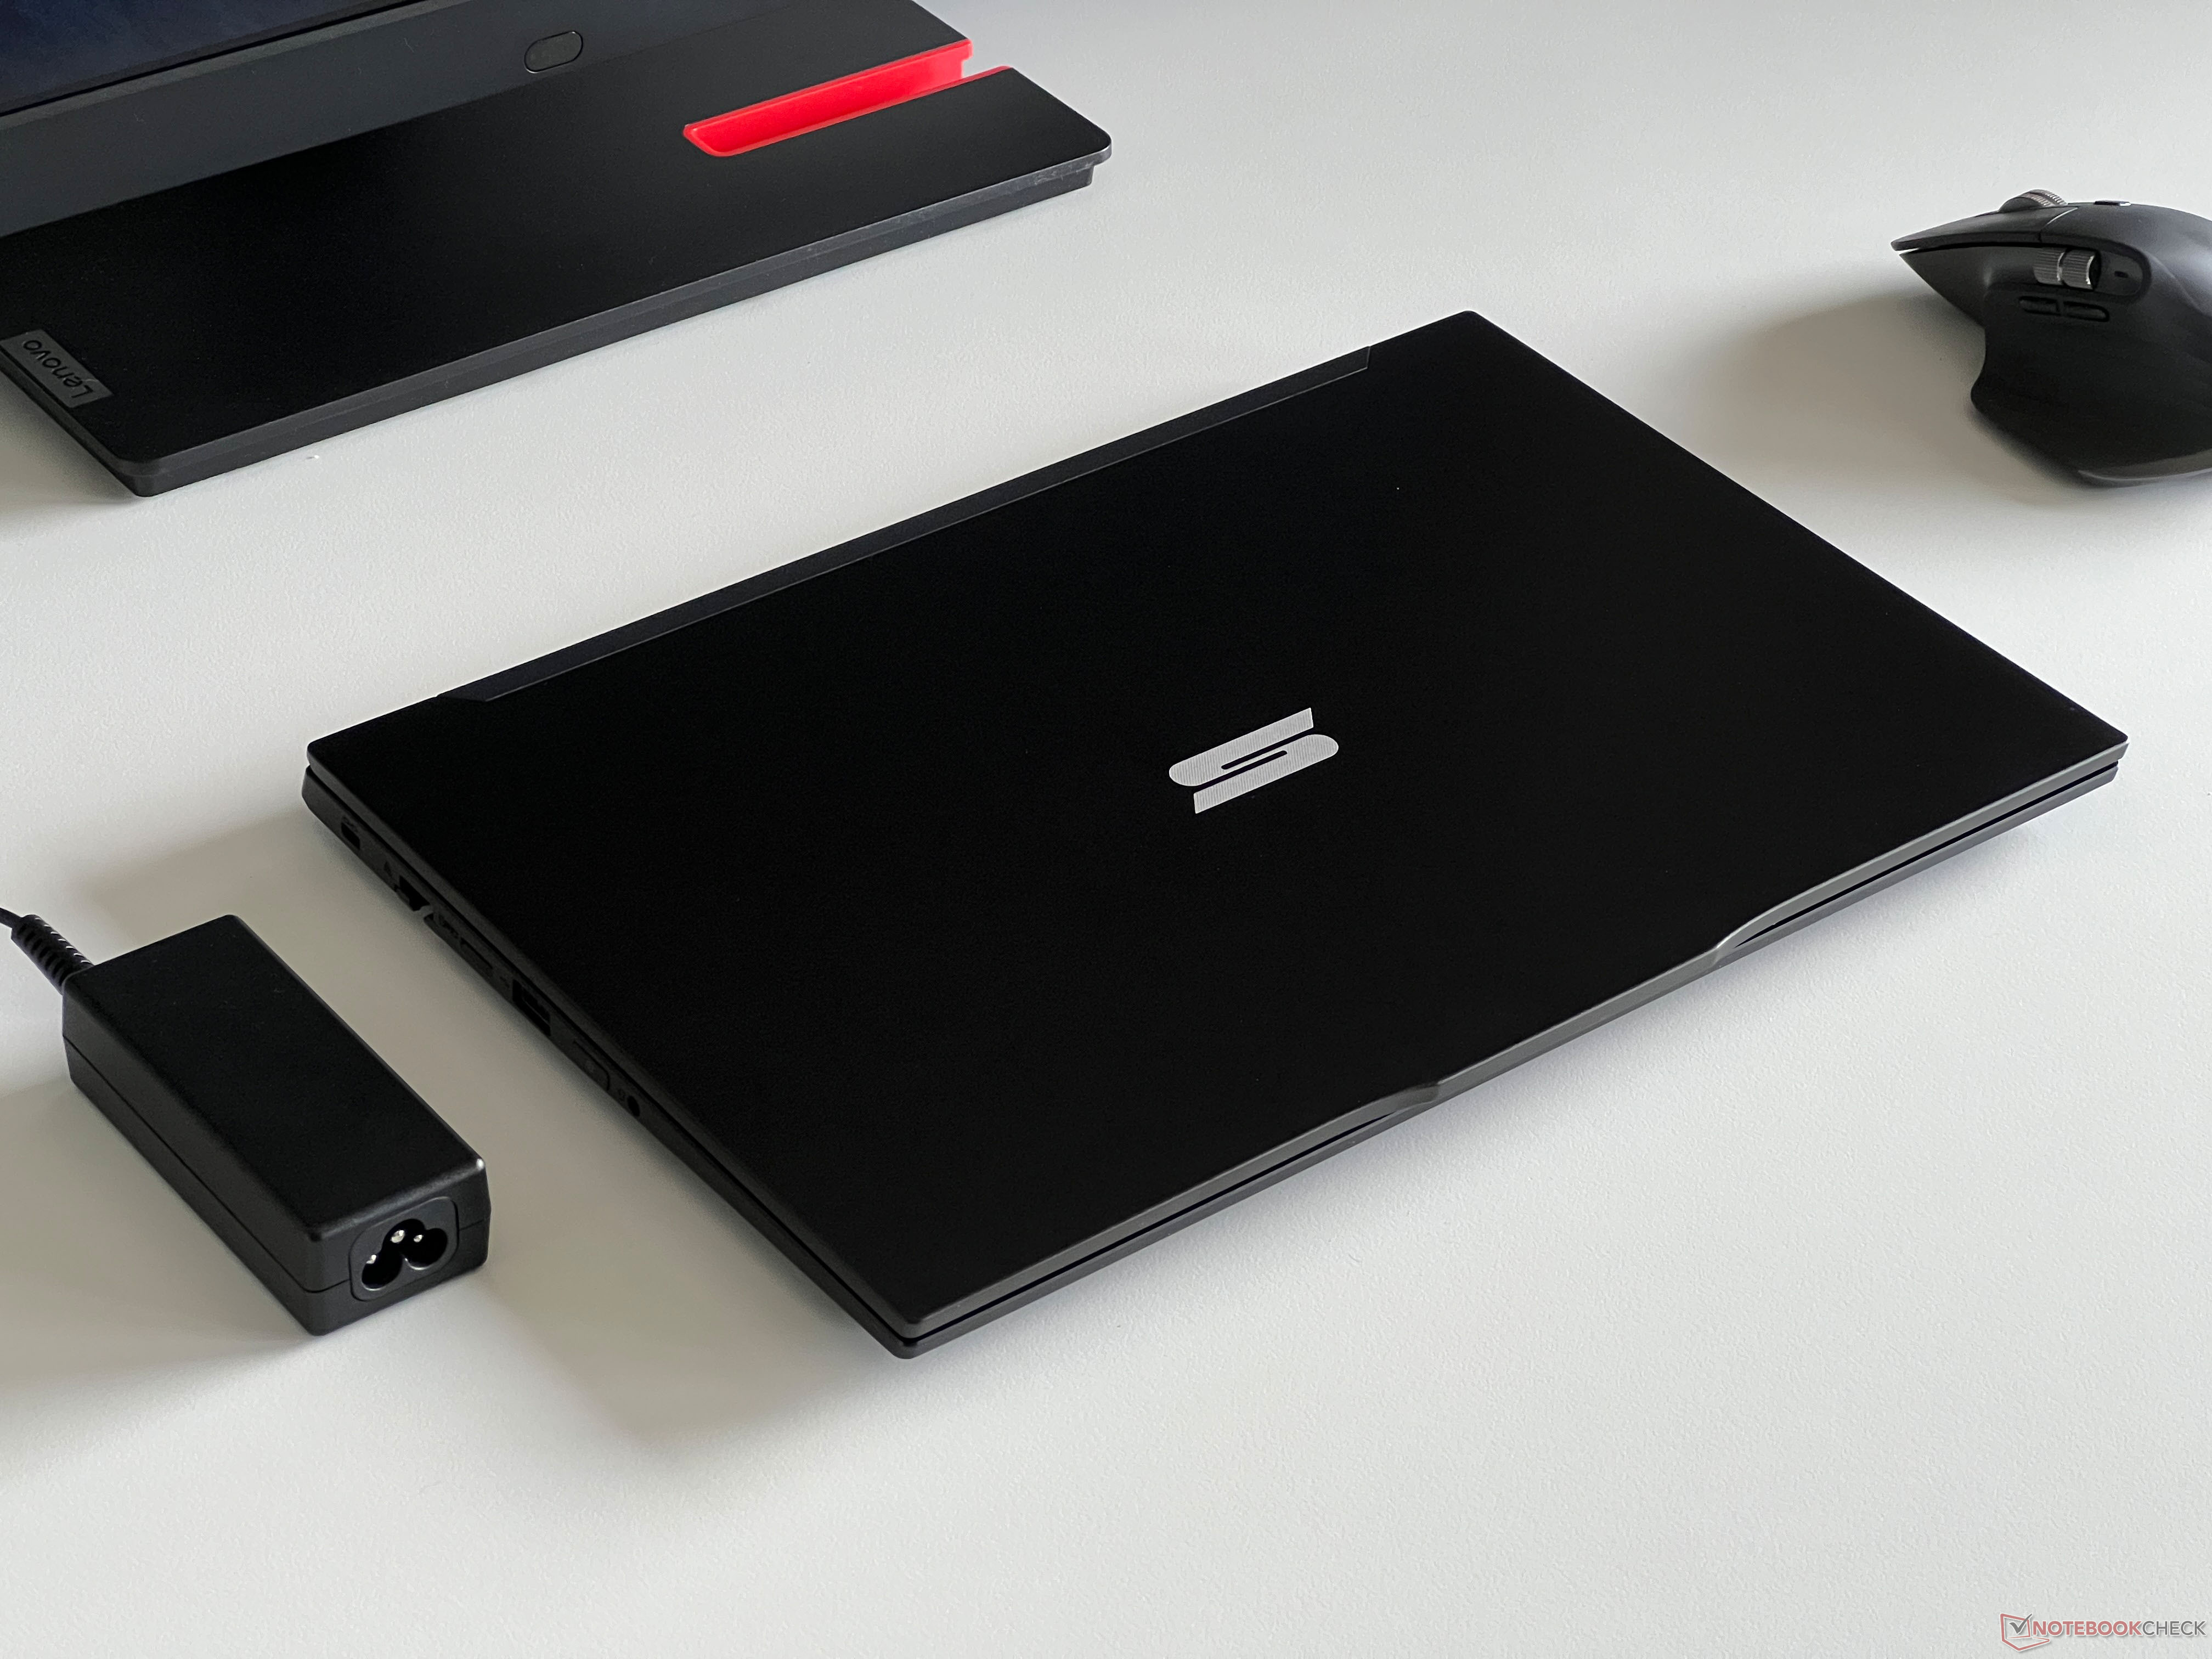
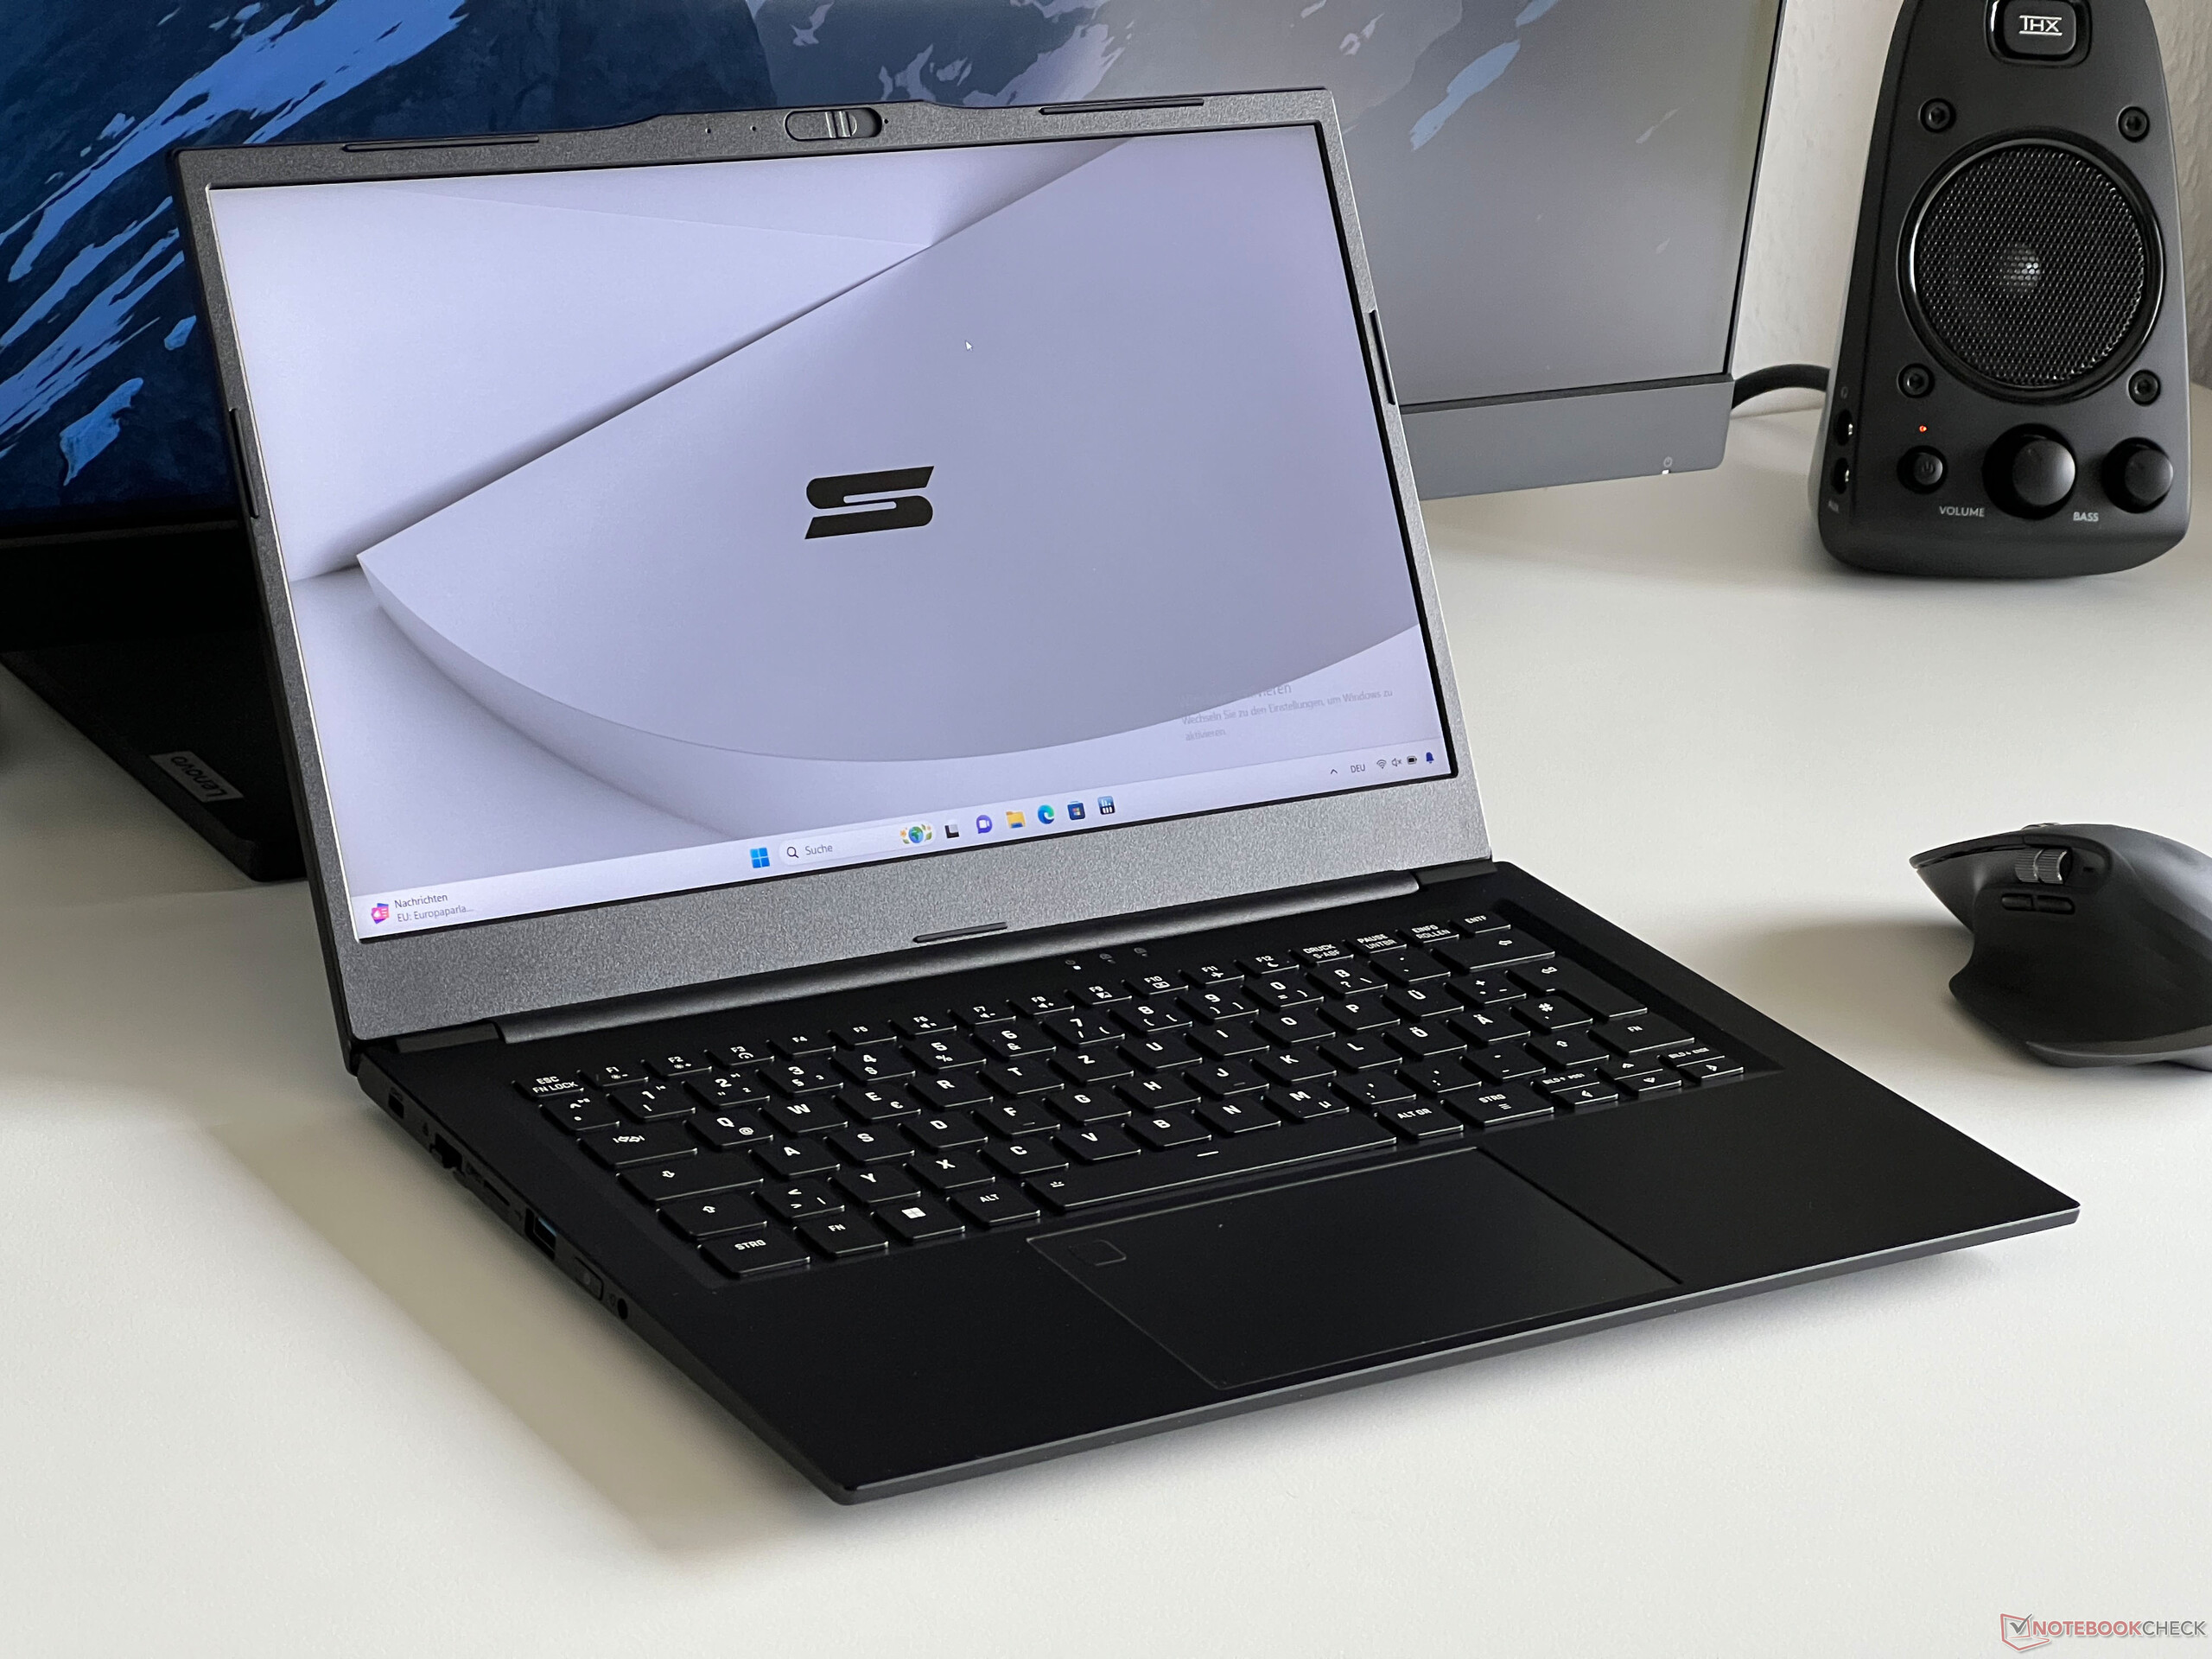
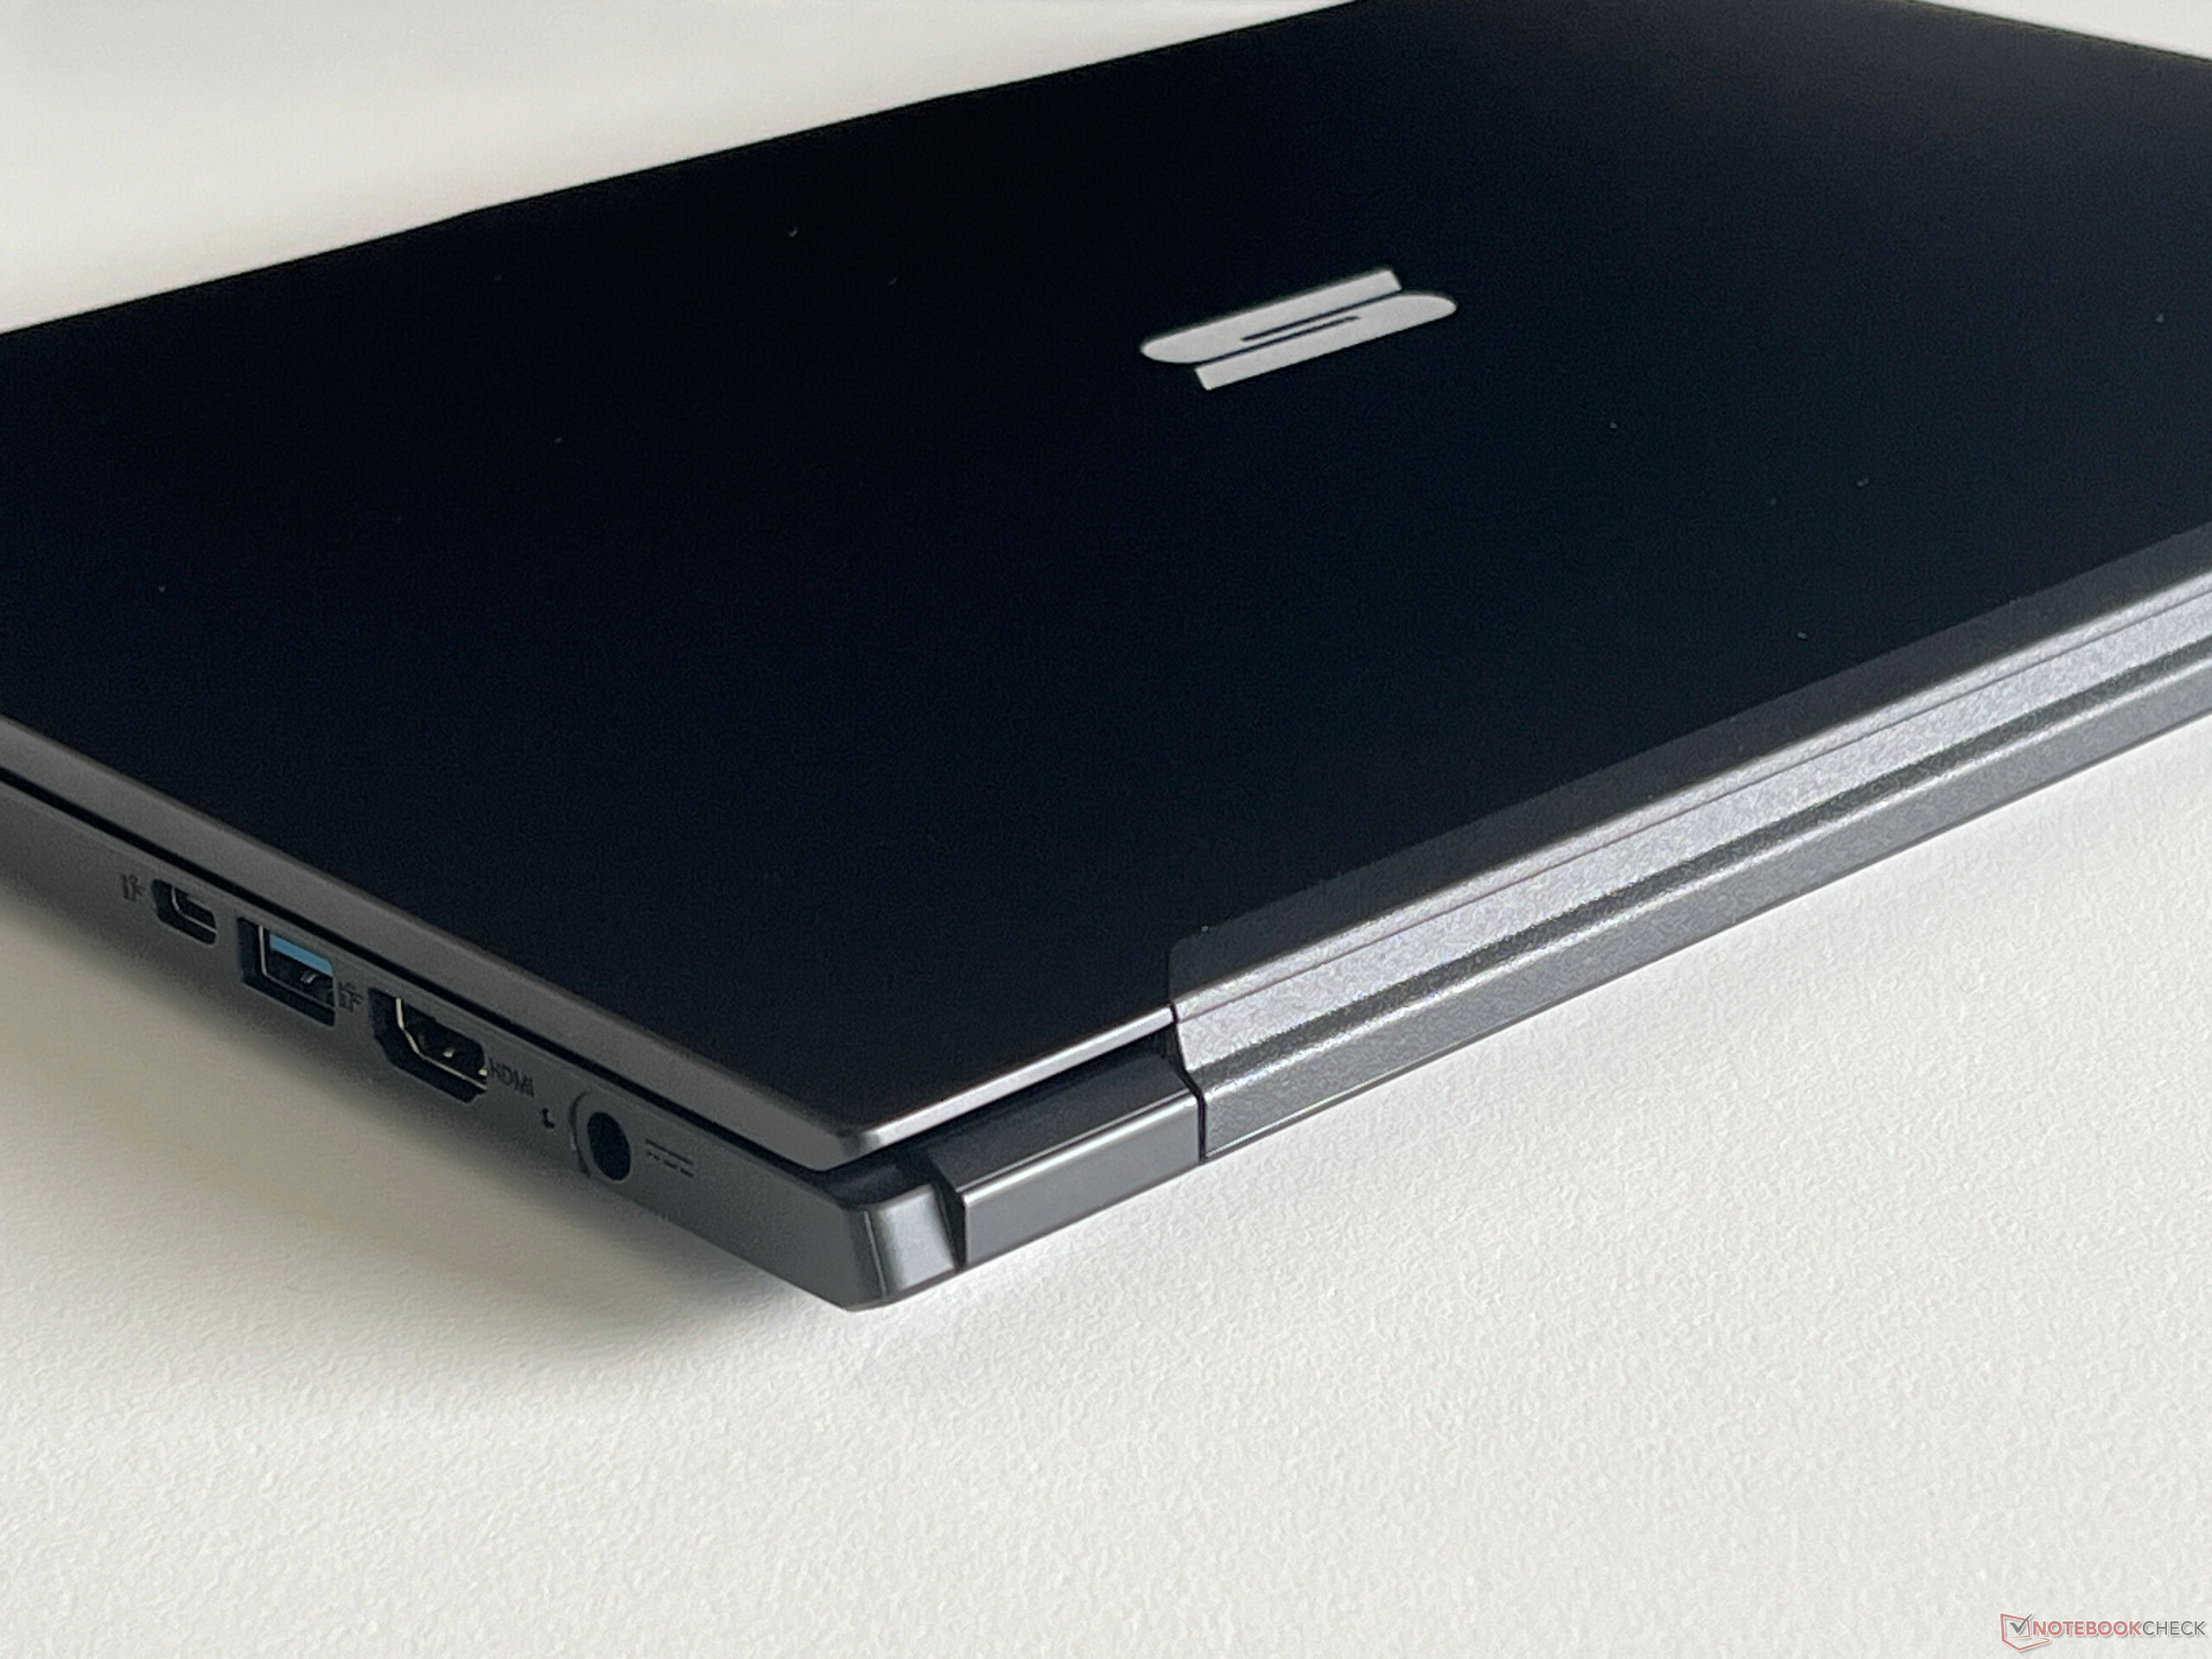
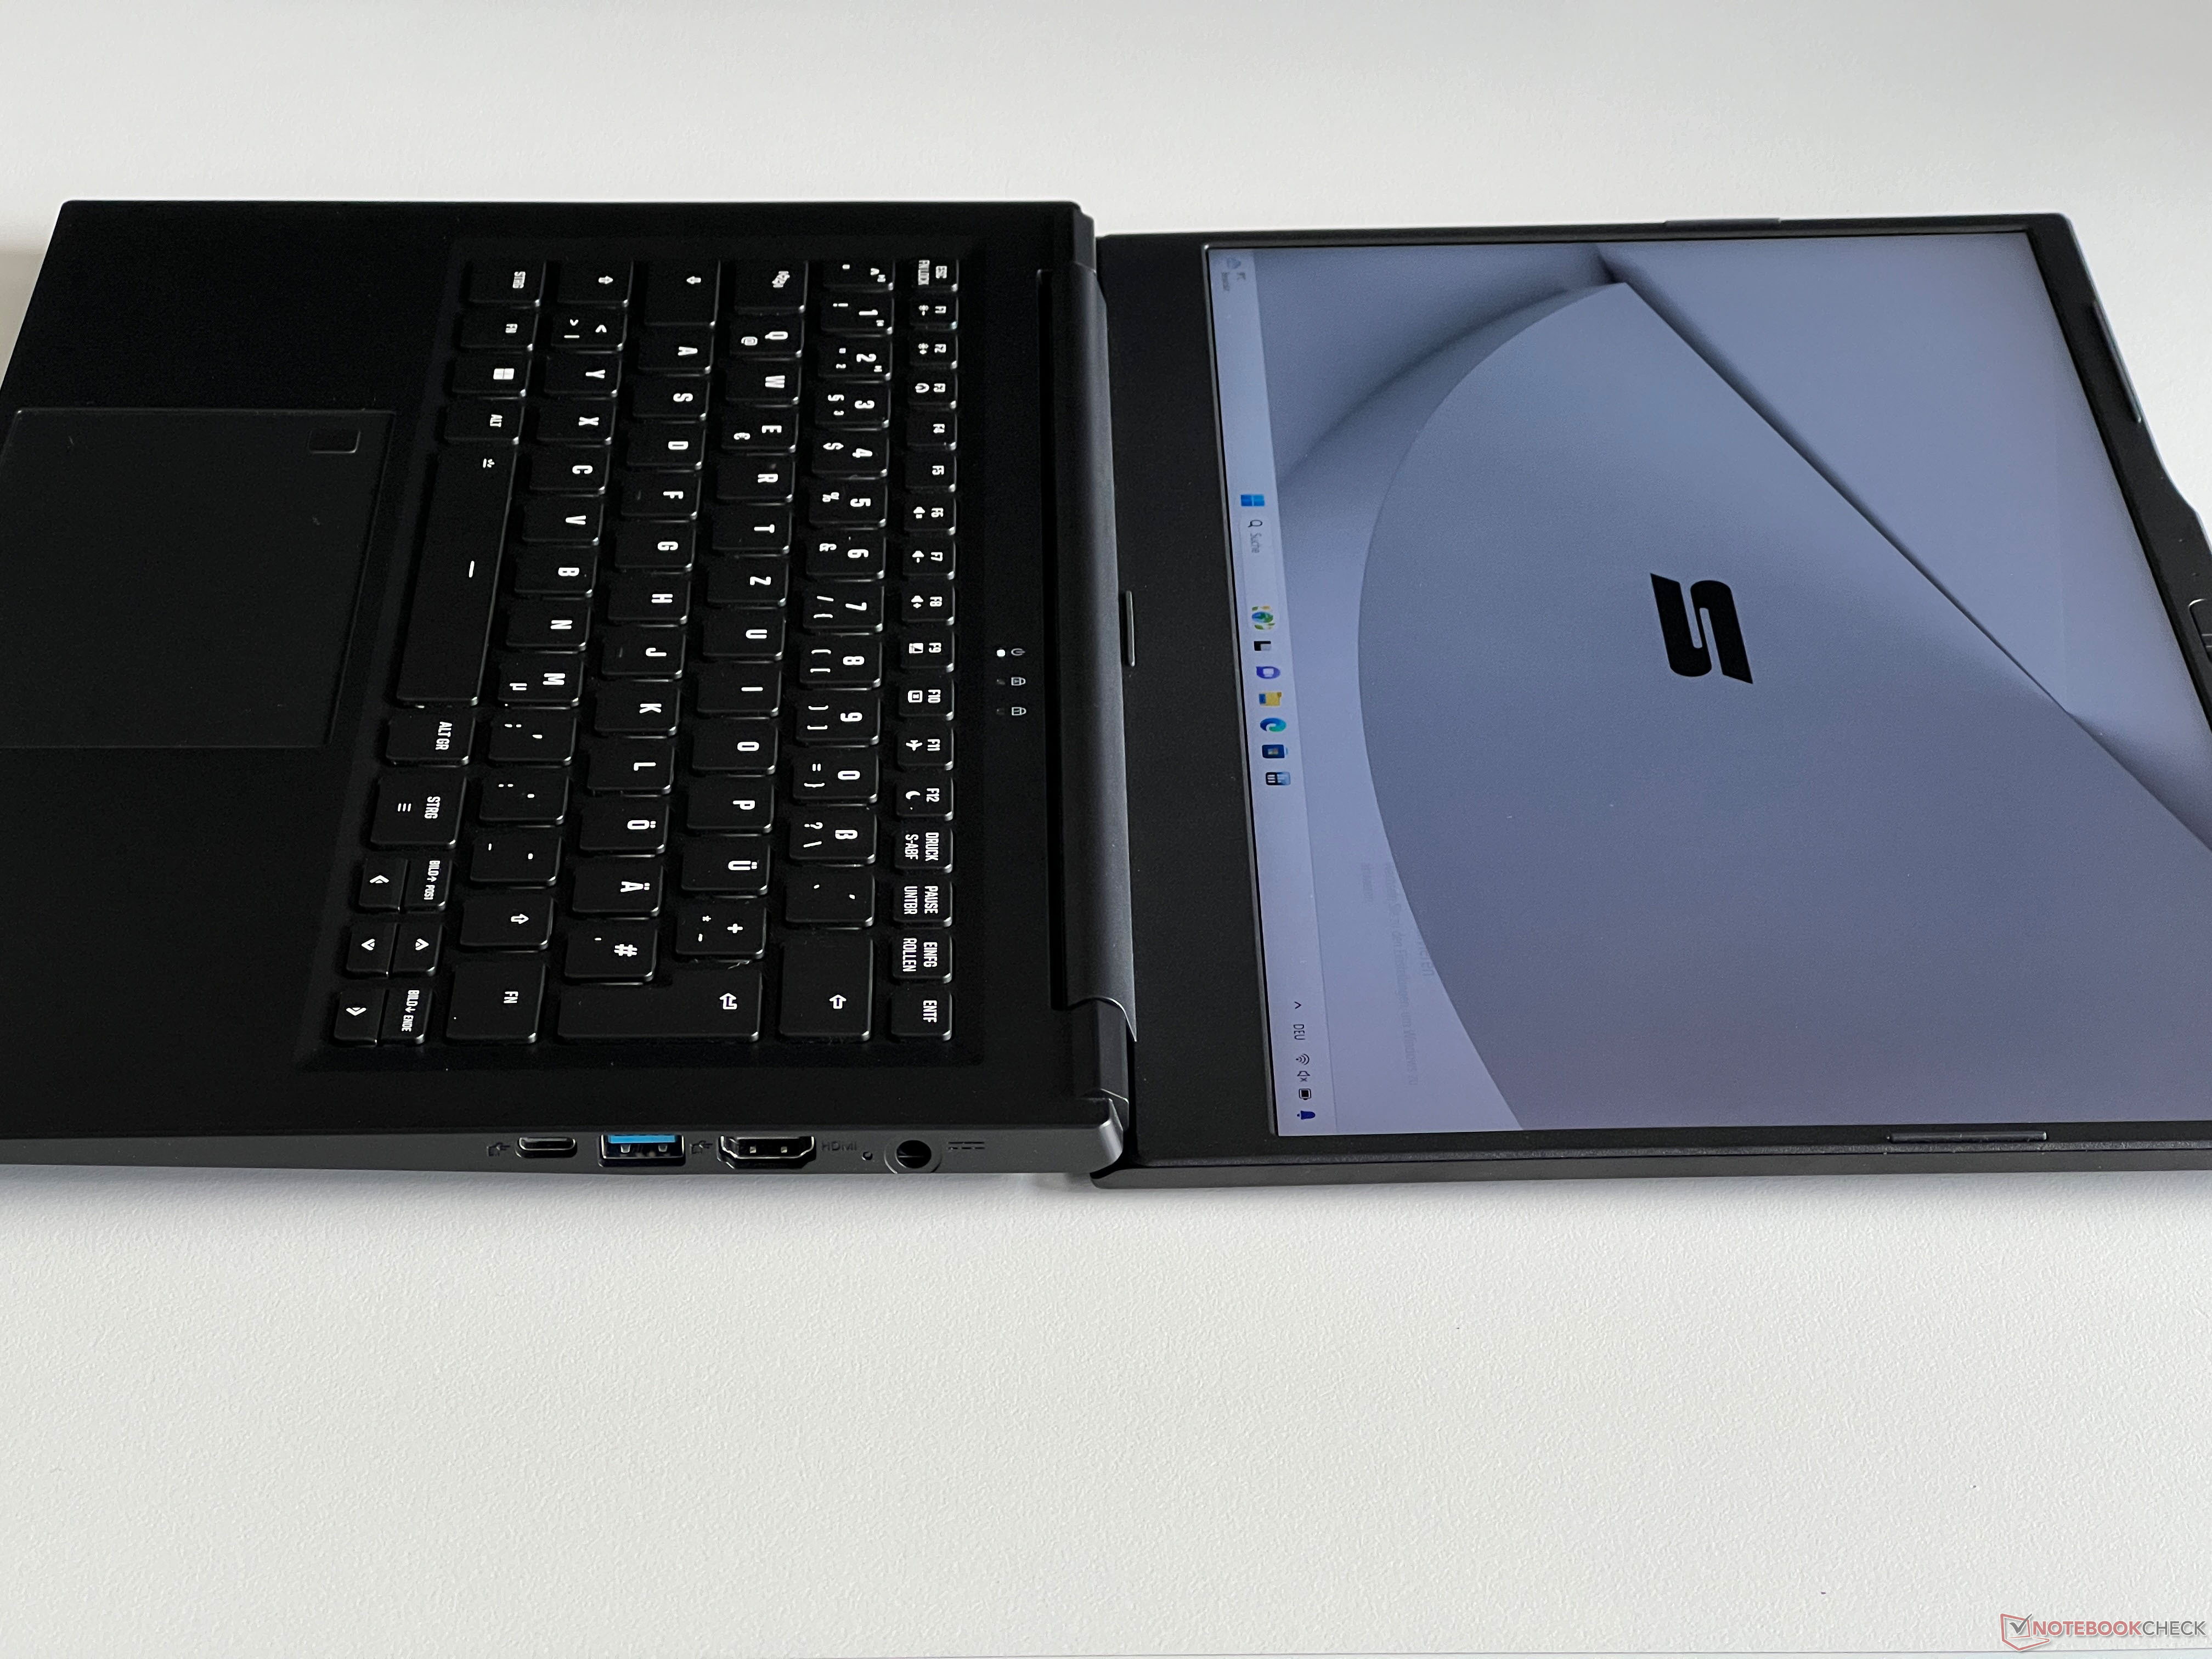
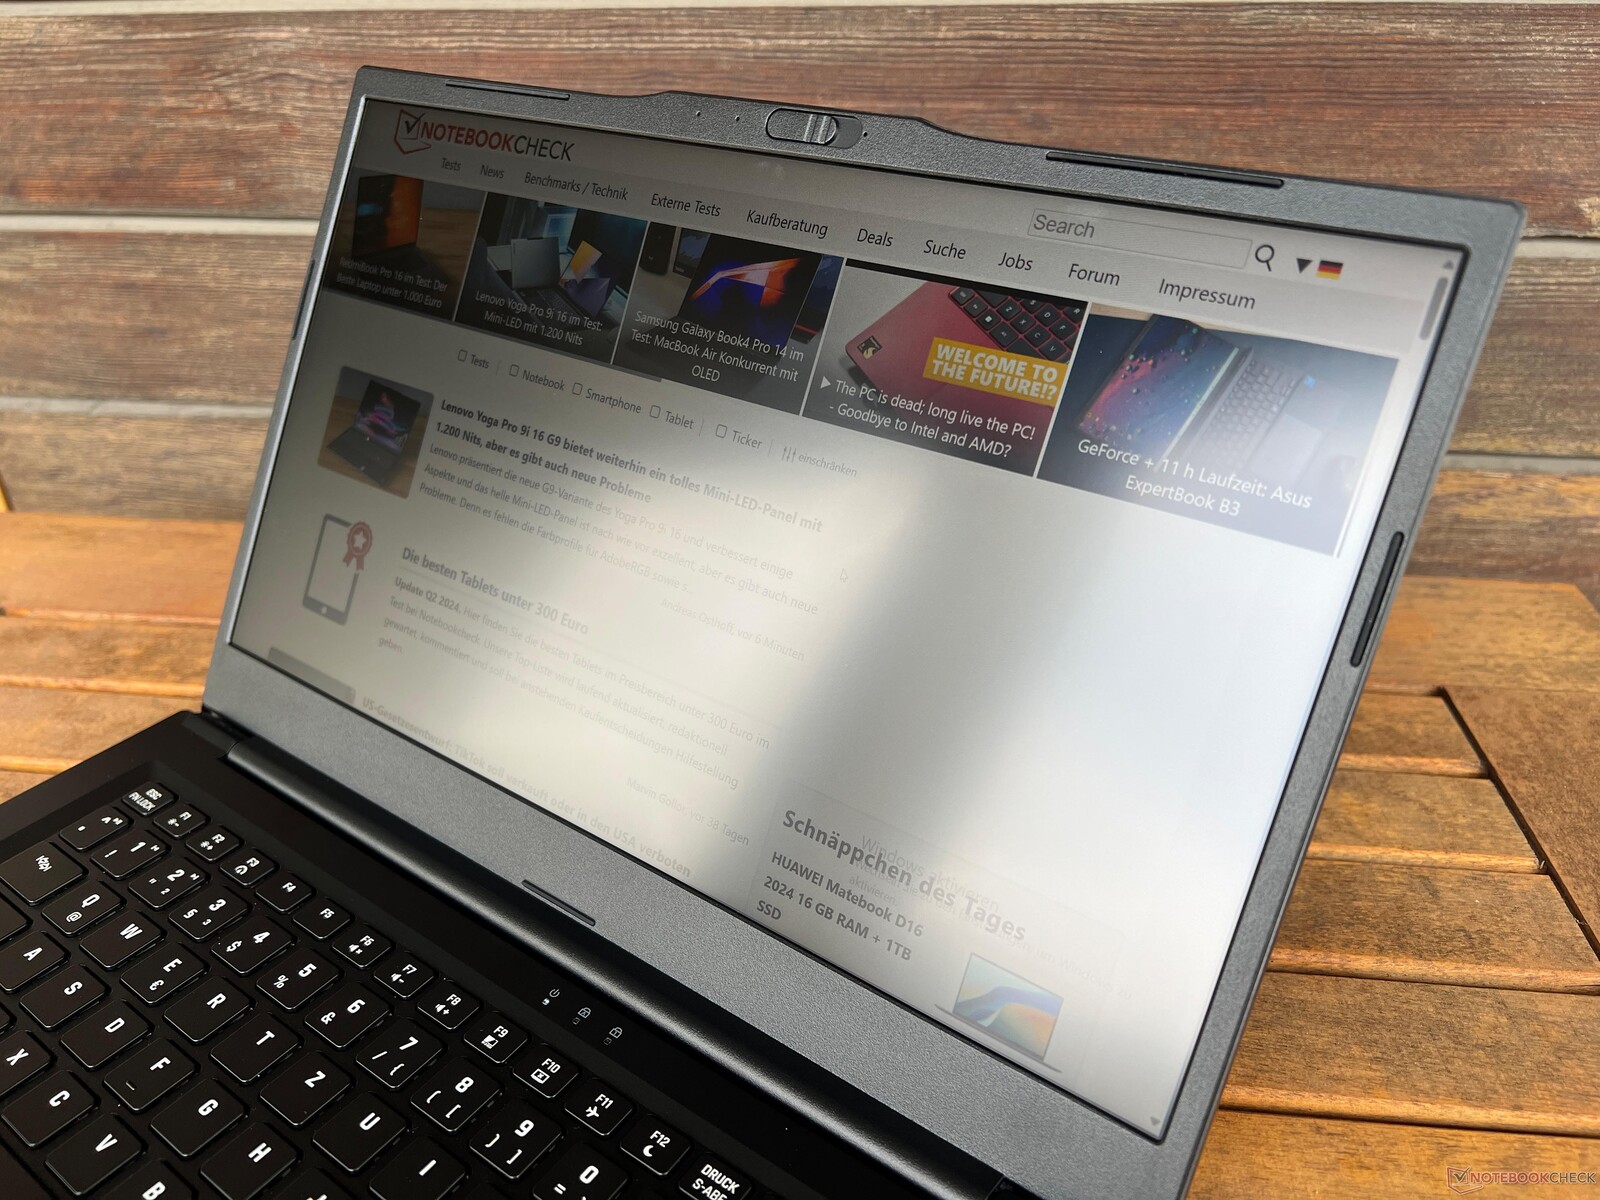
O Work 14 Base usa um gabinete de alumínio preto e, à primeira vista, causa uma impressão de alta qualidade. No entanto, suas superfícies lisas são imãs de impressões digitais e exigem limpeza frequente. Por uma taxa adicional, o senhor pode obter o laptop sem o logotipo da Schenker na tampa. Assim que o senhor abre a tampa, que funciona com muita facilidade graças à saliência da câmera, que não é muito atraente, é recebido por um painel 16:9 com uma moldura larga na parte inferior, feita de plástico áspero. Isso não parece mais particularmente moderno. A estabilidade é boa, no entanto, notamos alguns ruídos de rangidos leves ao girar o laptop e, mais notavelmente, ao abrir a tela (ângulo máximo de abertura de 180 graus).
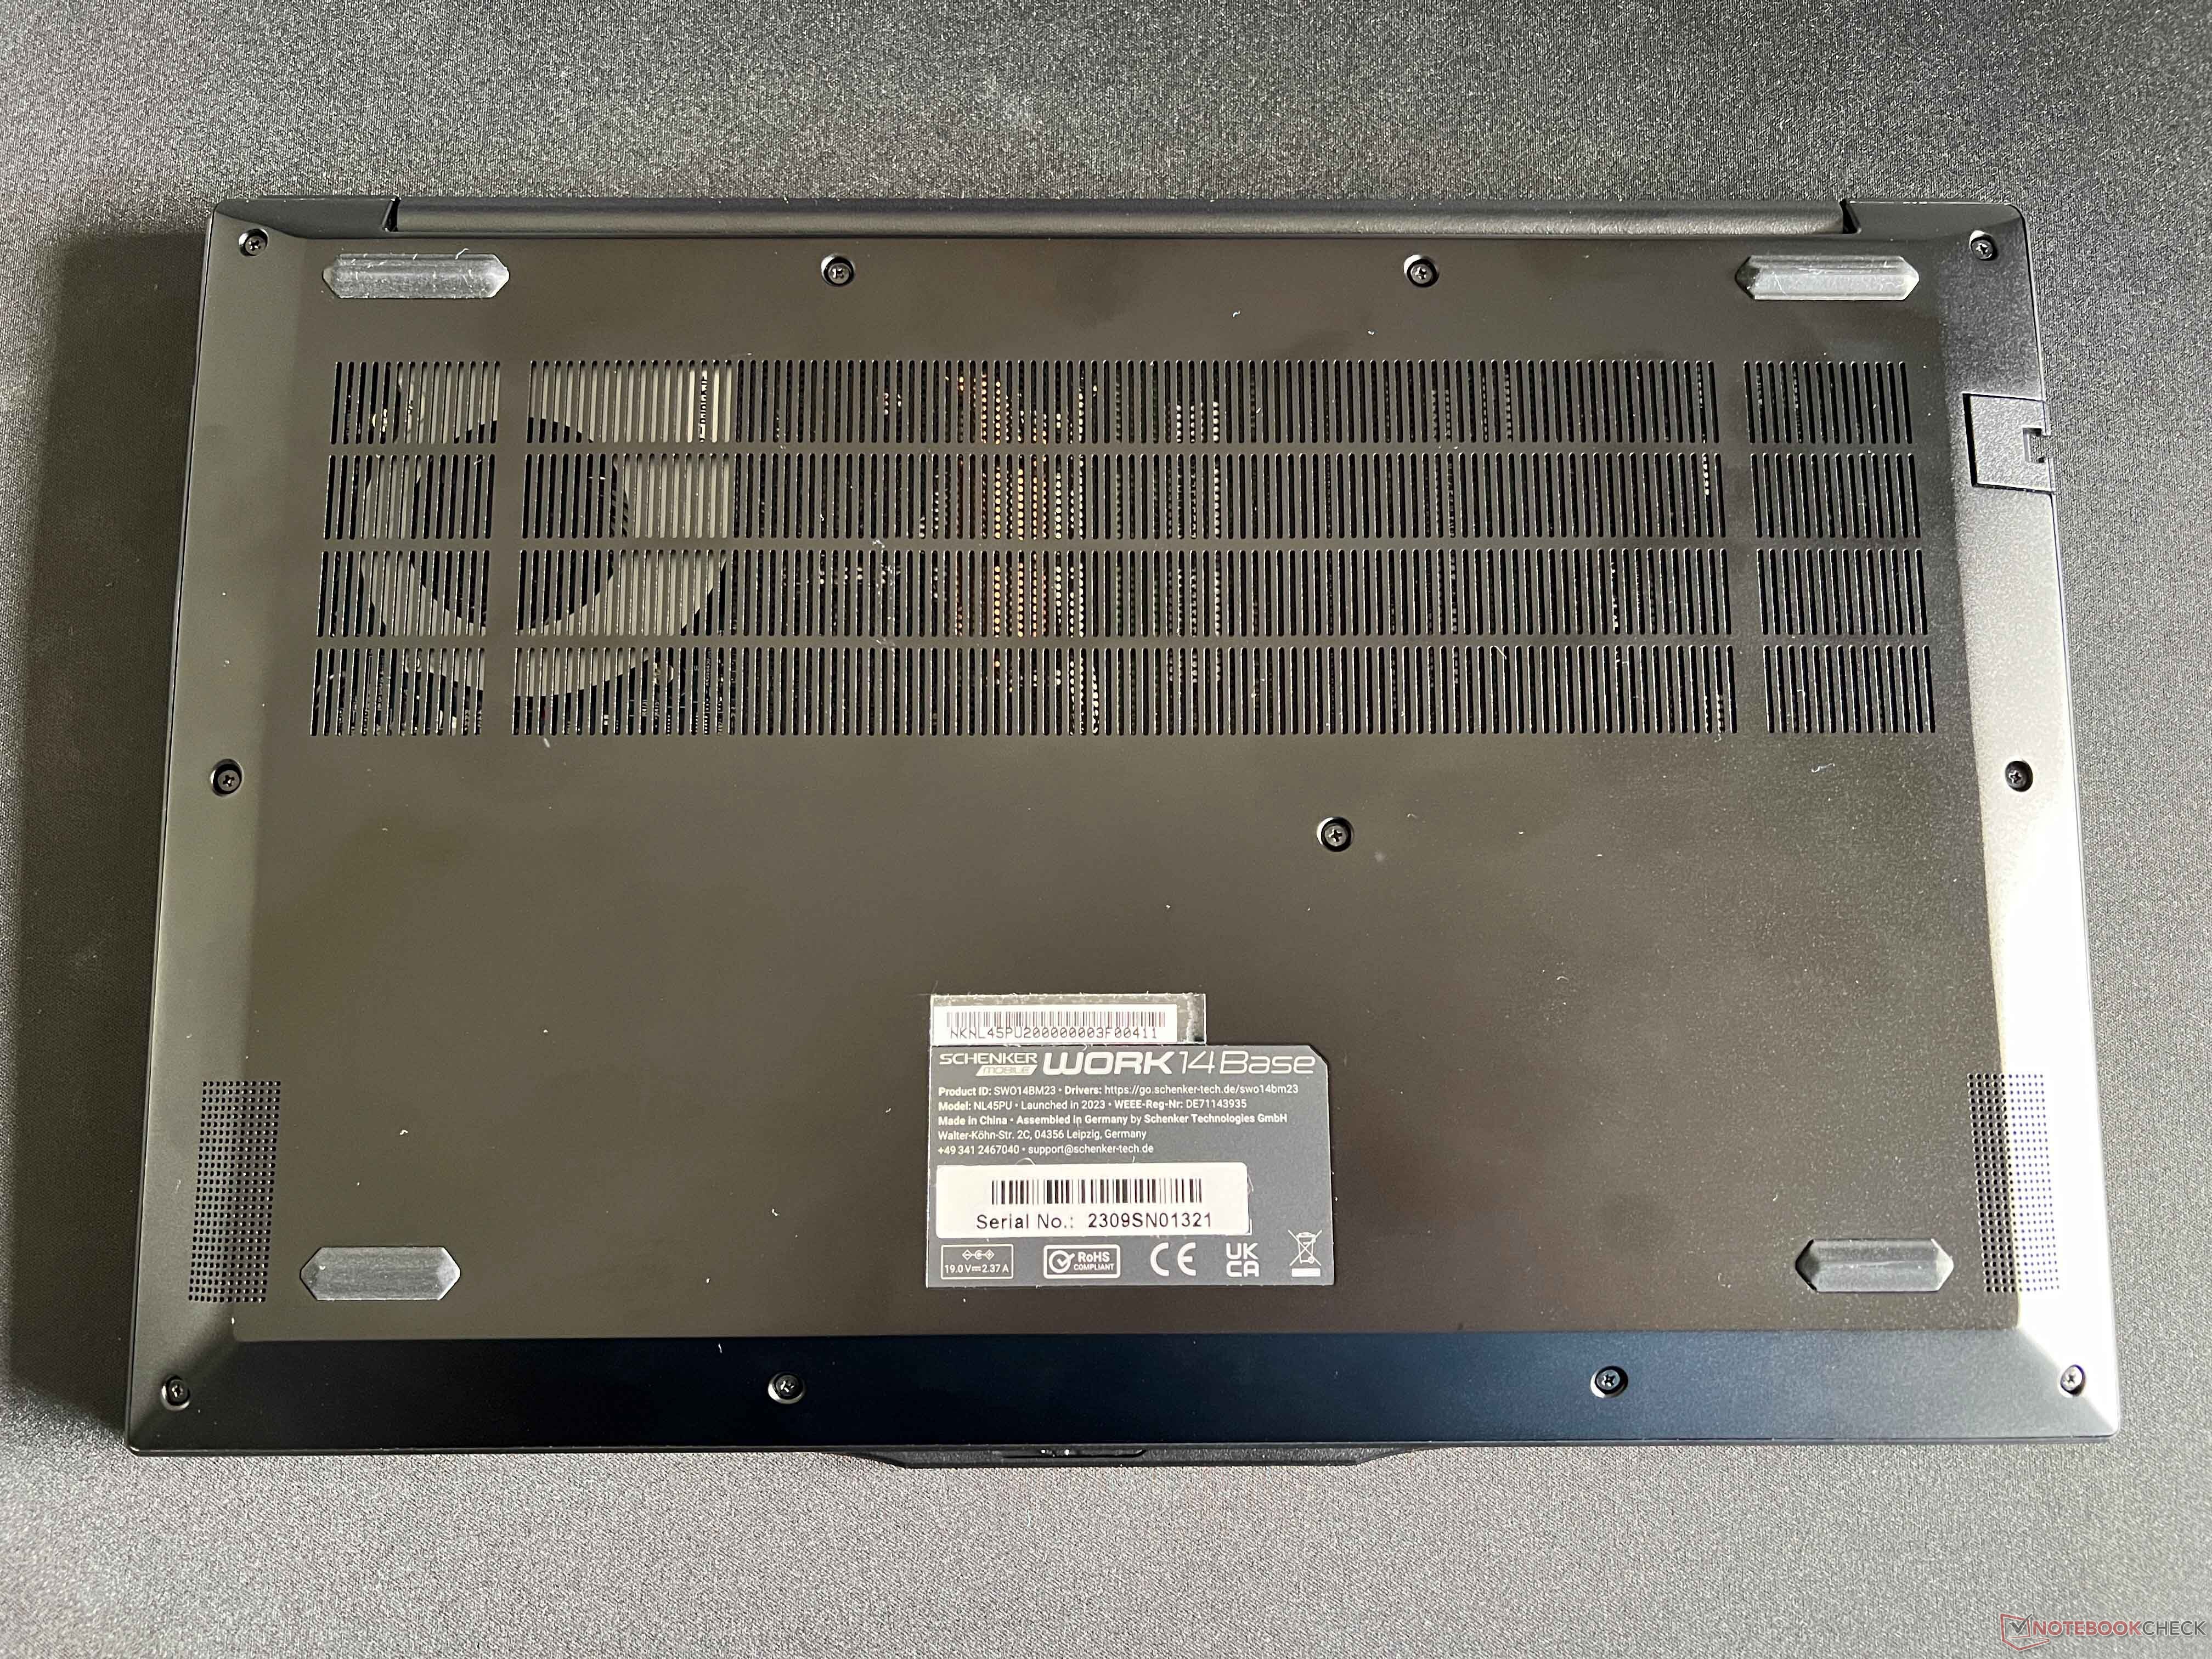
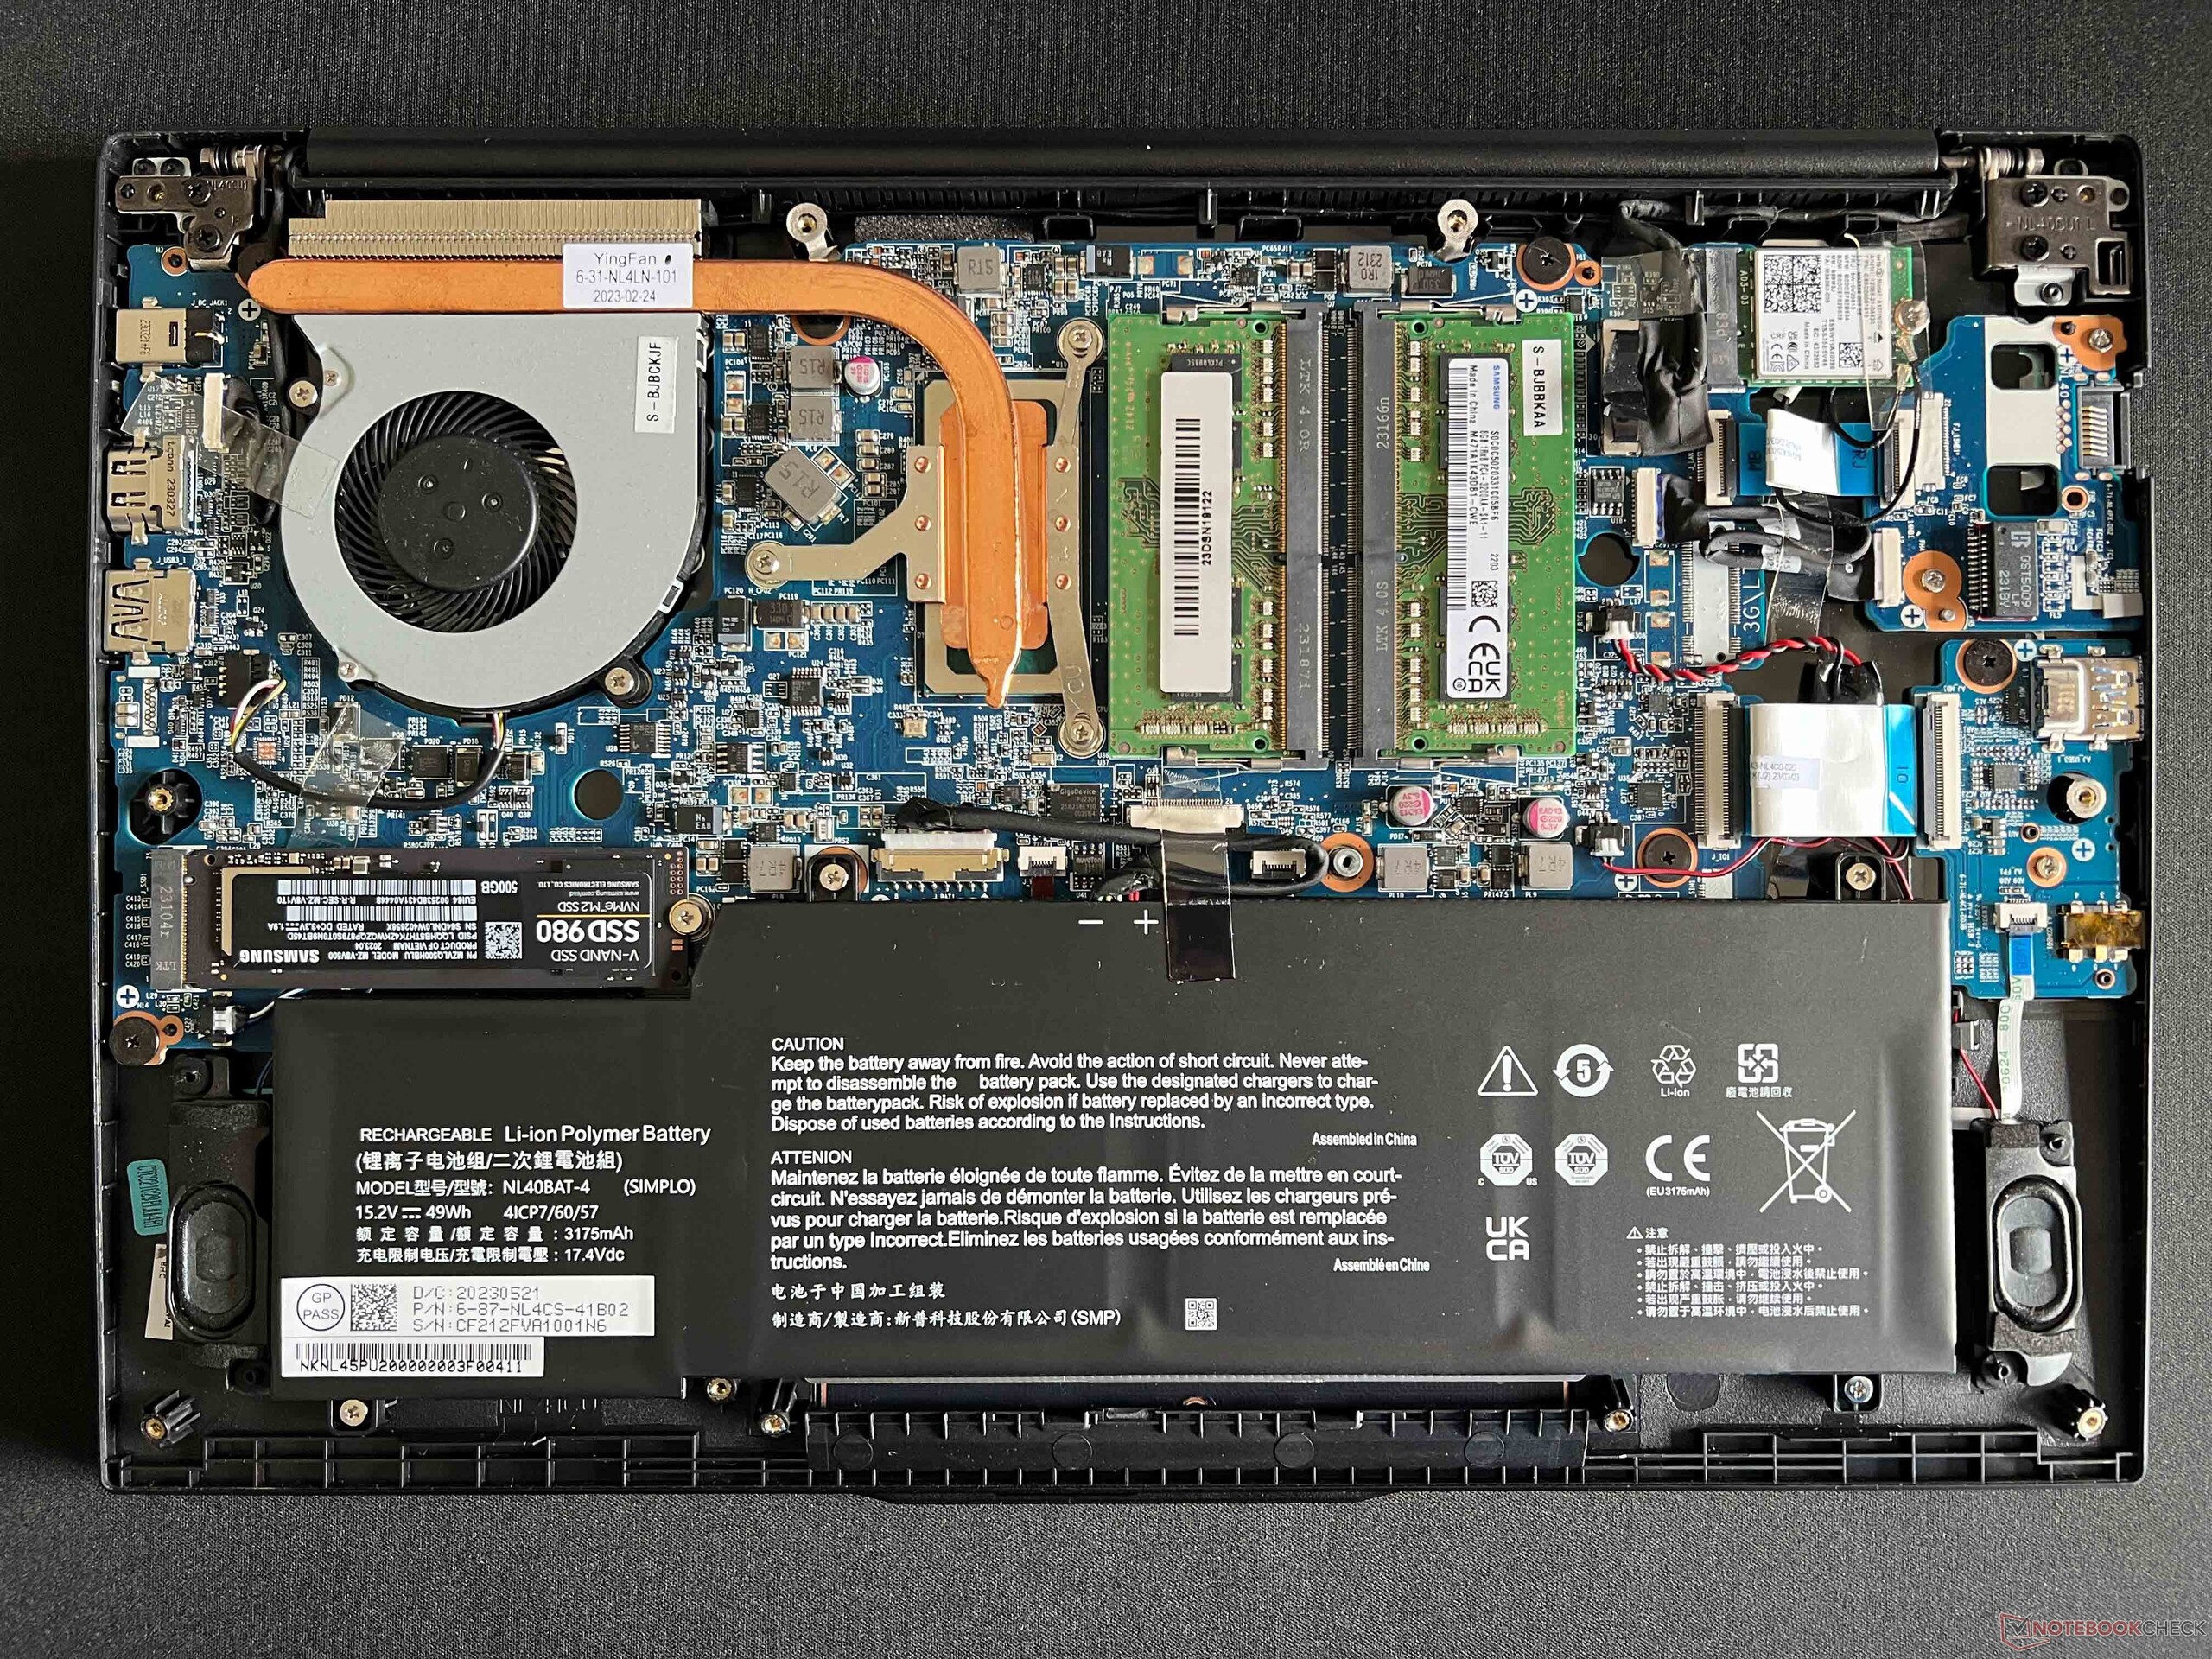
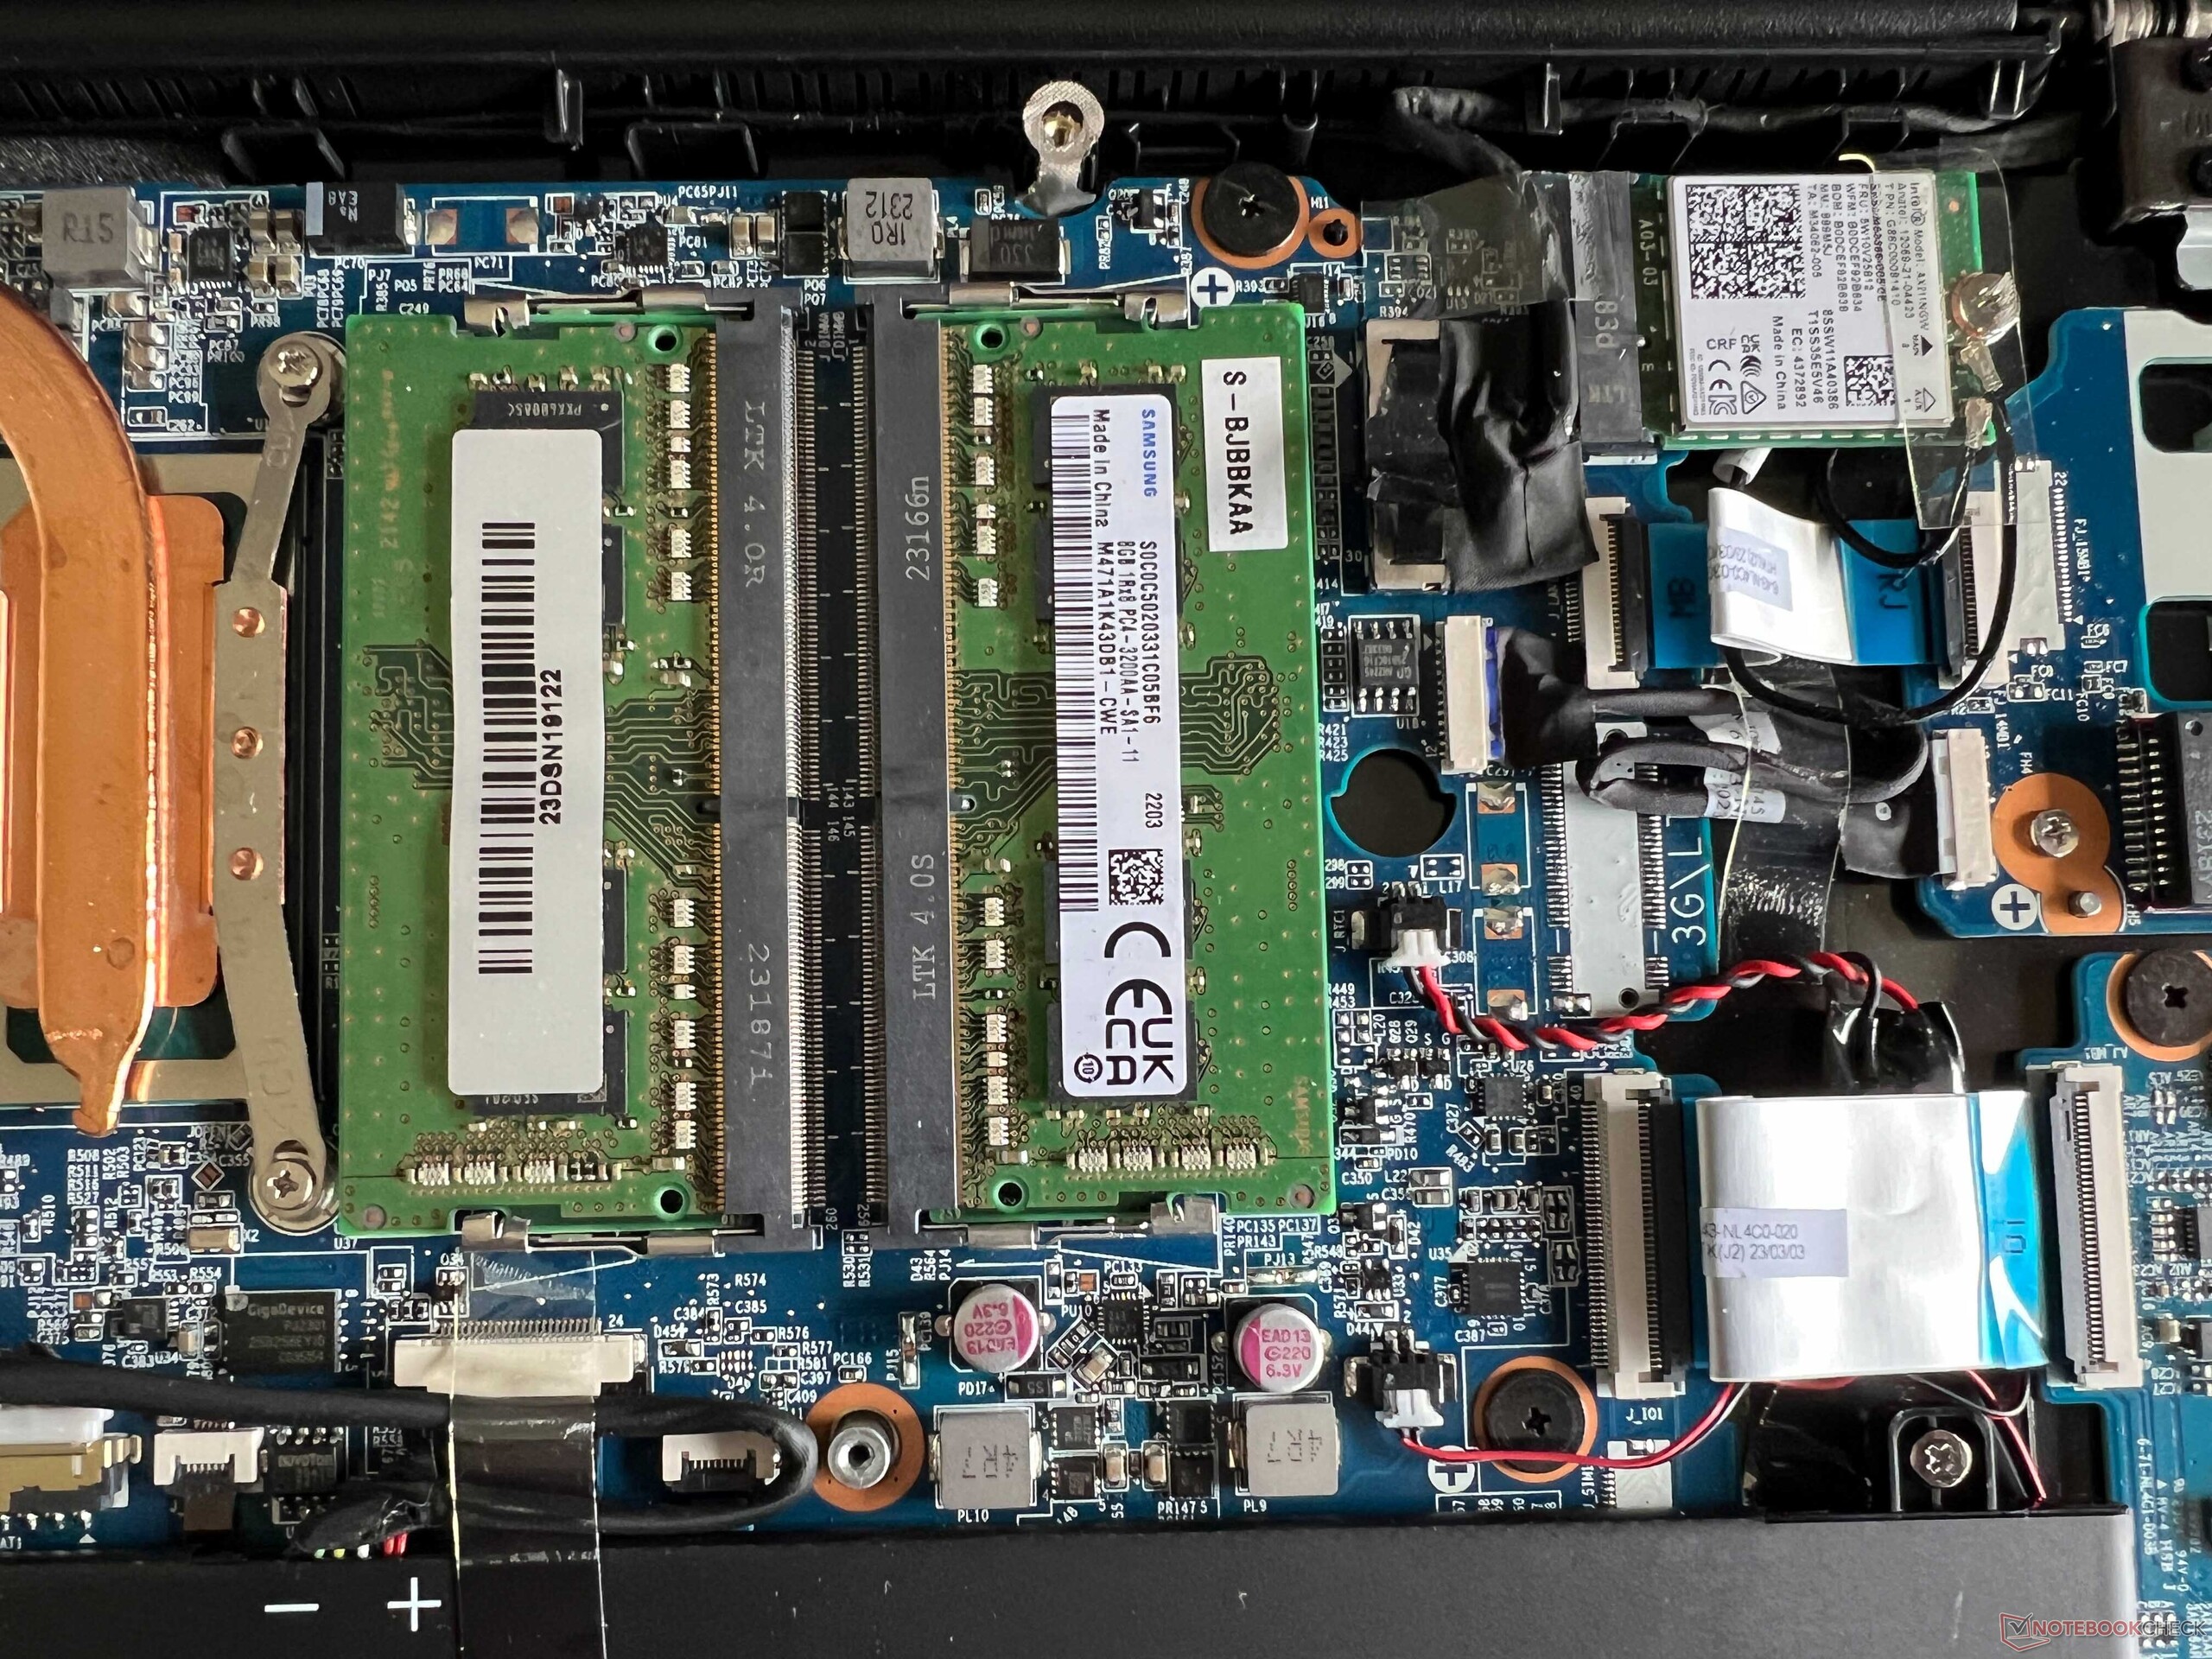
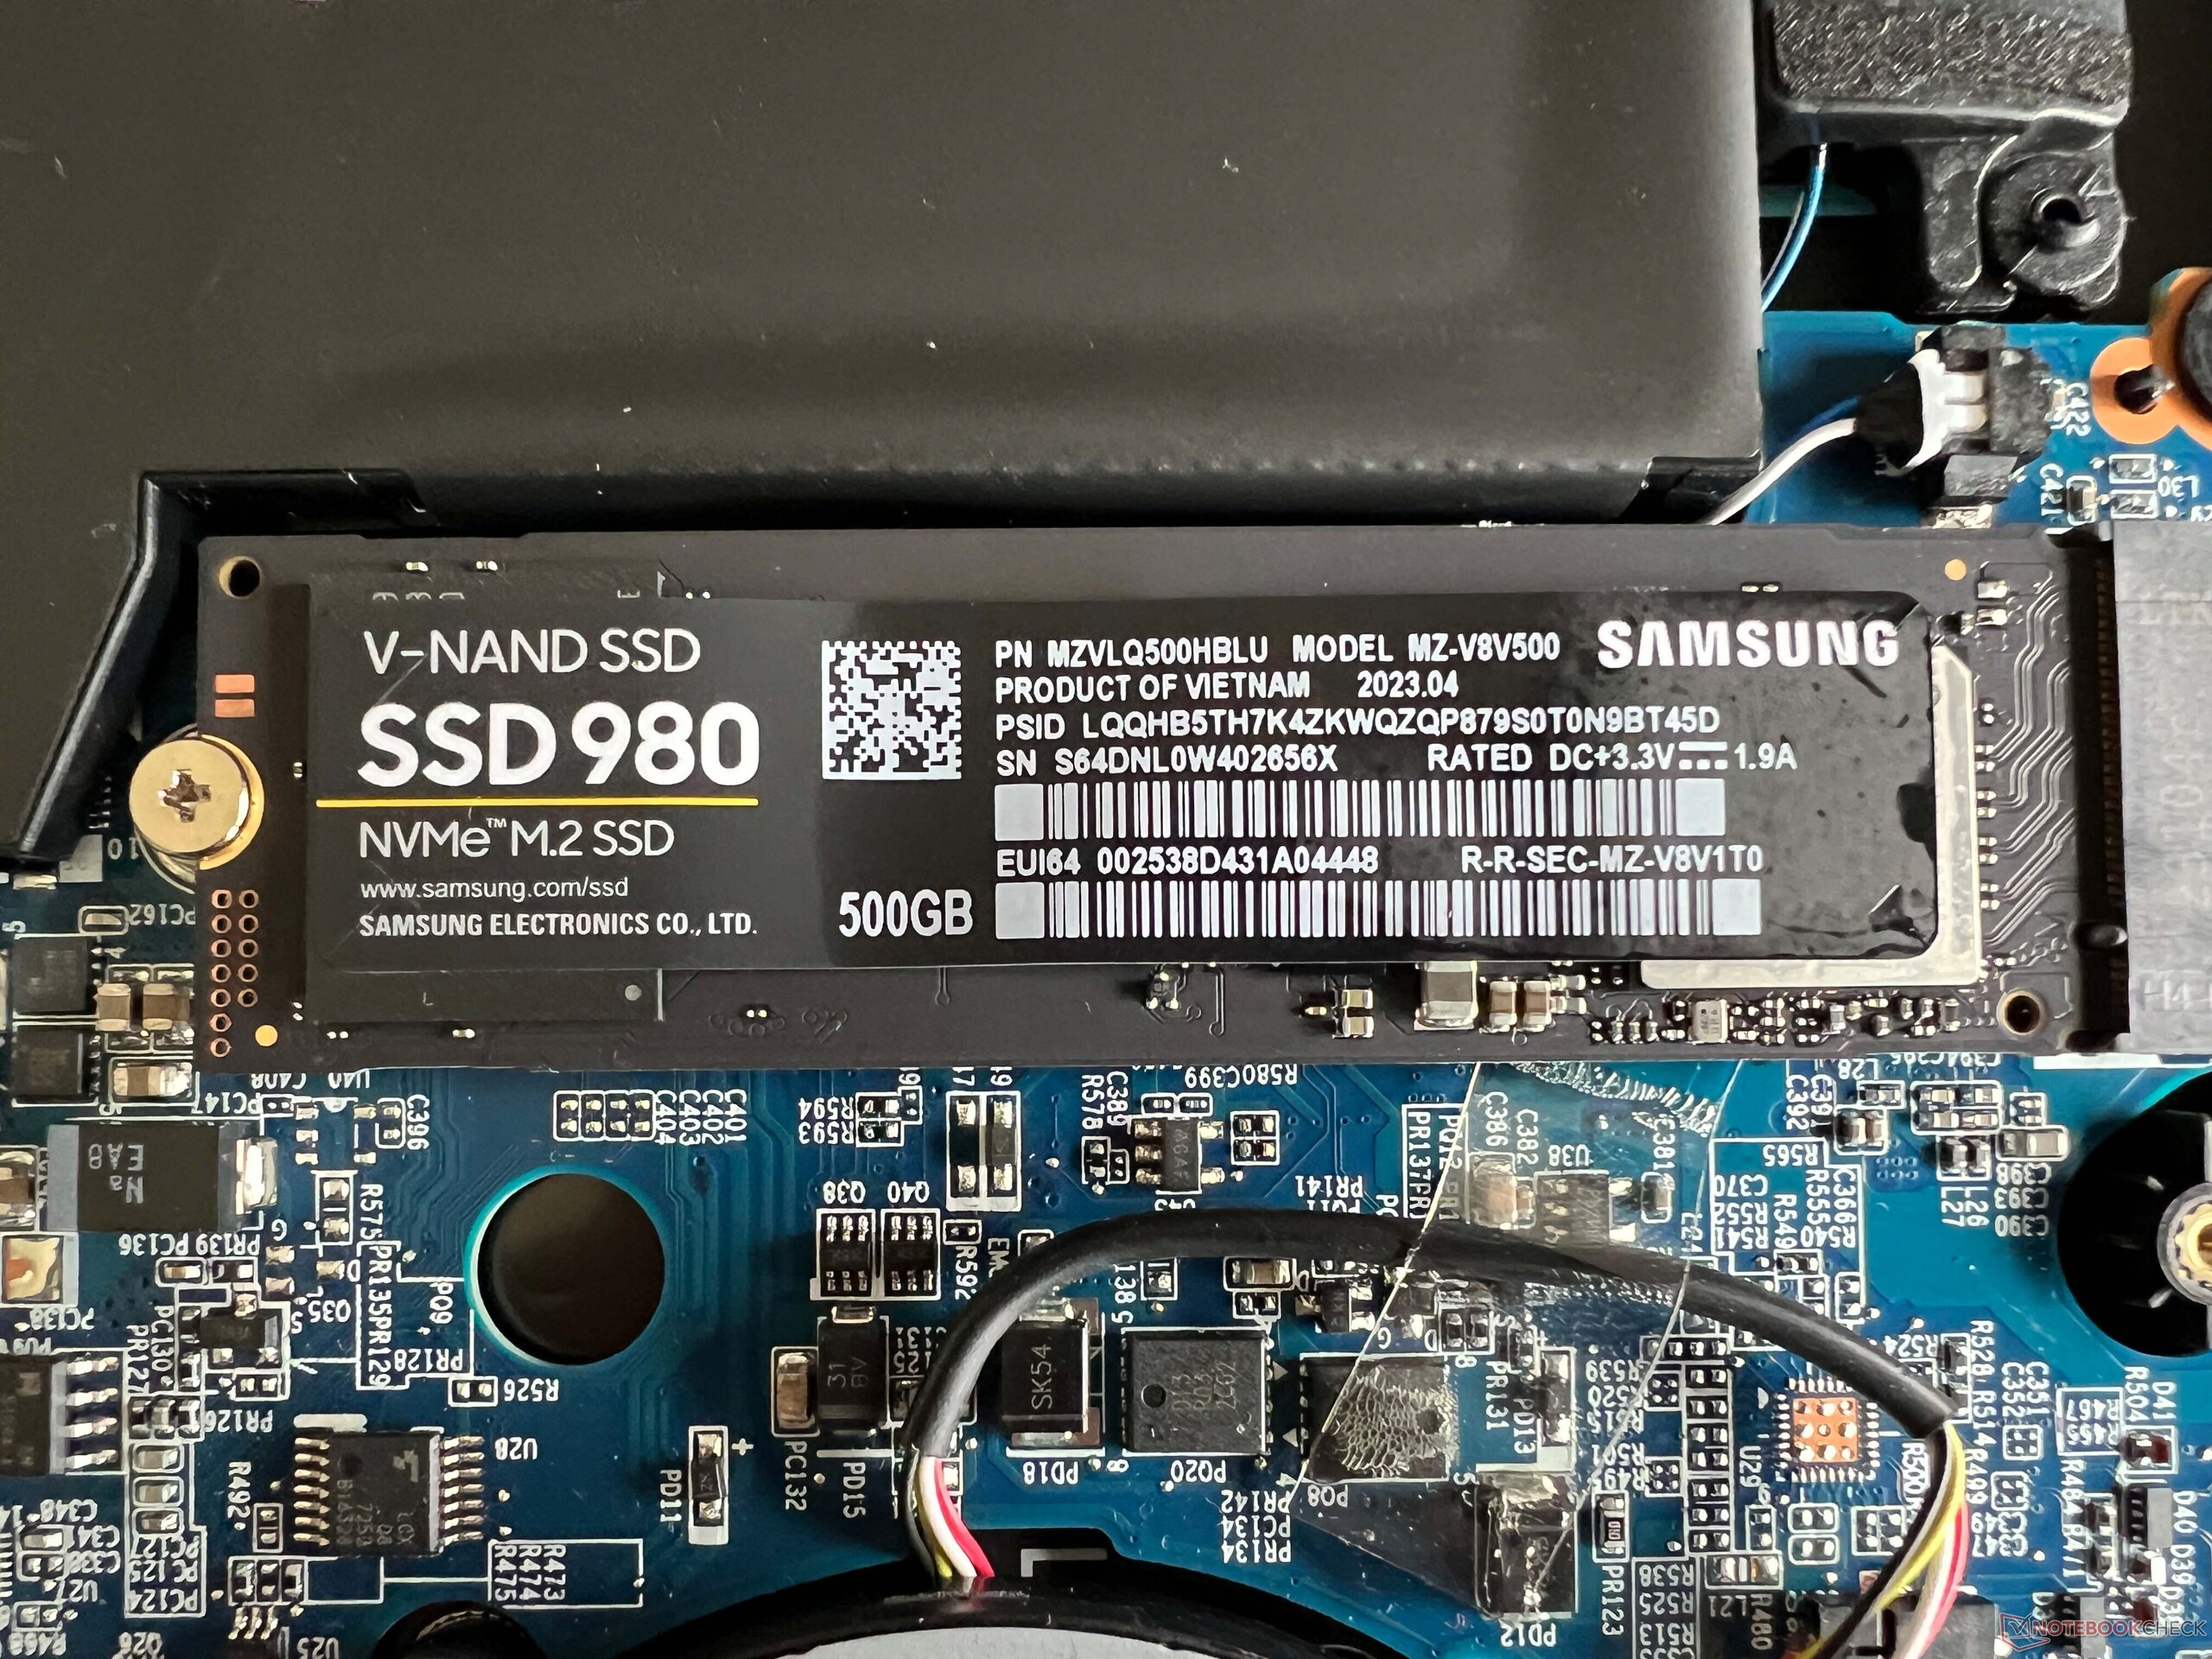
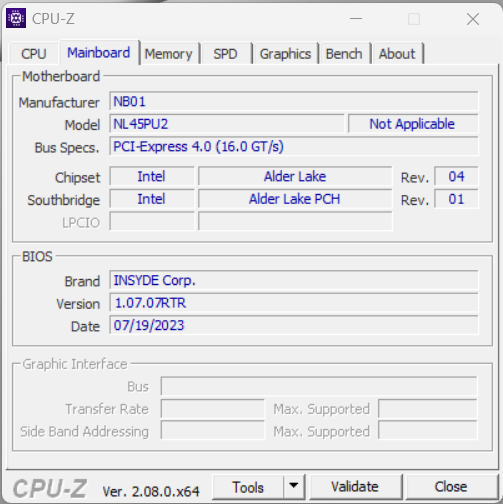
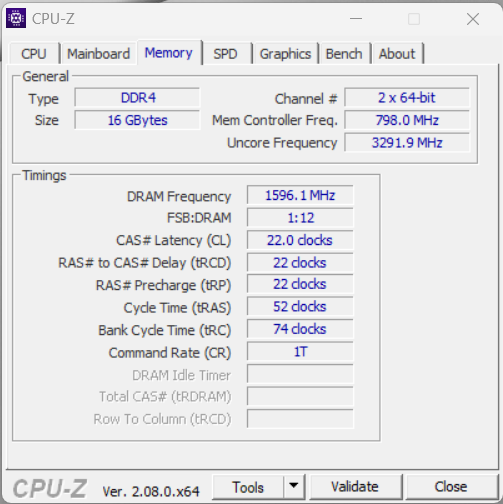
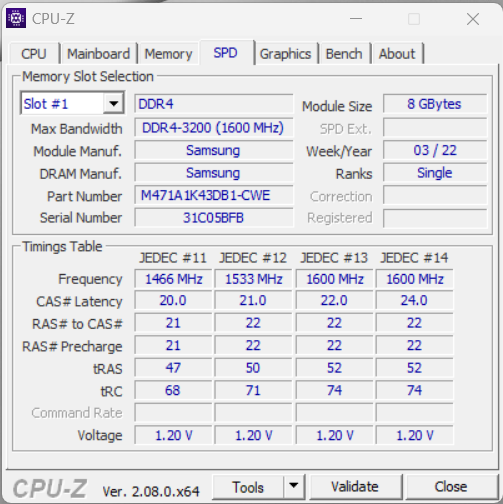
A tampa inferior é fixada por parafusos Philips normais e pode ser removida facilmente. As opções de atualização do laptop são excelentes, pois há dois slots de RAM disponíveis e, é claro, os modelos SSD e WLAN também podem ser atualizados. Na verdade, esse dispositivo já está equipado com um módulo WLAN bastante moderno da Intel (AX211) e suas taxas de transferência também são excelentes.
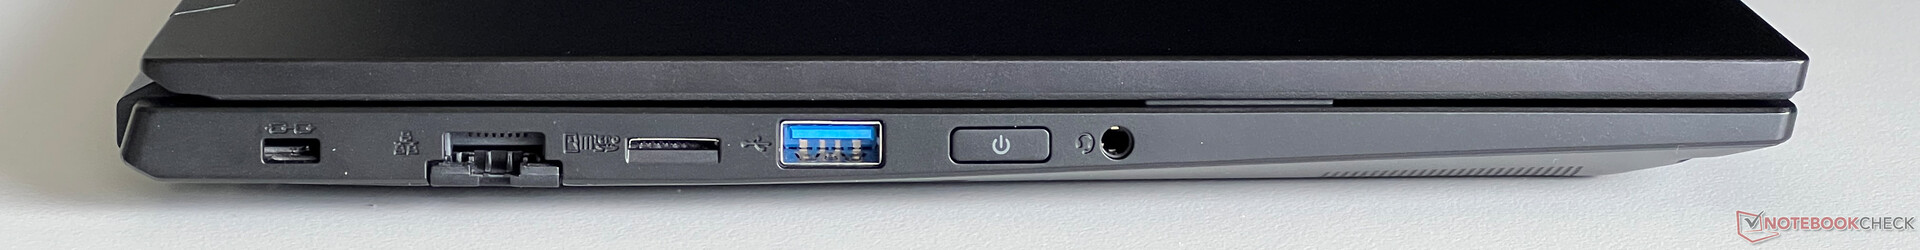
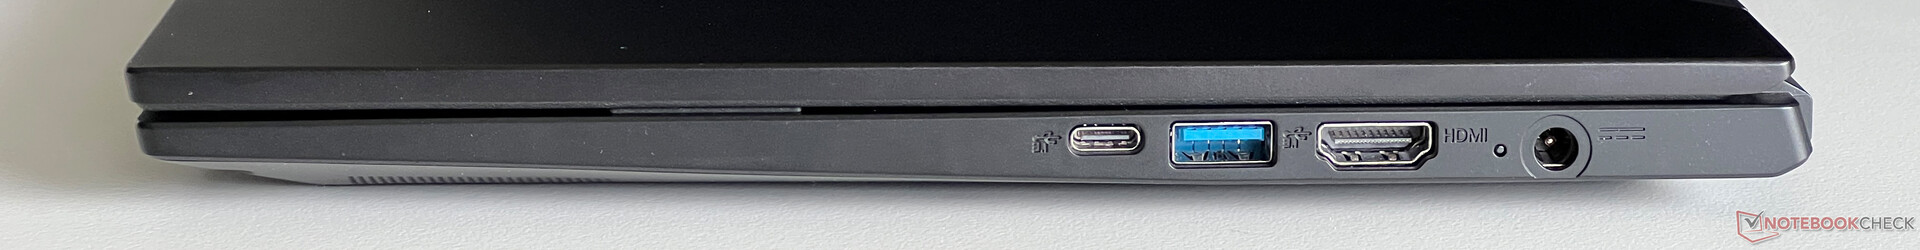
As opções de conectividade são outro ponto forte do Work 14. Embora o senhor tenha que ficar sem USB 4.0 e Thunderbolt, ele tem conexões USB suficientes e também pode usar estações de acoplamento USB-C sem problemas. Além disso, ele conta com uma porta Gigabit Ethernet. Sua webcam de 1080p, incluindo uma tampa mecânica, tira fotos de aparência mediana.
| SD Card Reader | |
| average JPG Copy Test (av. of 3 runs) | |
| Schenker Work 14 Base (Angelbird AV Pro V60) | |
| Lenovo ThinkPad L14 G4 21H6S00900 | |
| Média da turma Office (22.4 - 198.5, n=22, últimos 2 anos) | |
| Acer Swift Go 14 SFG14-71 | |
| maximum AS SSD Seq Read Test (1GB) | |
| Lenovo ThinkPad L14 G4 21H6S00900 (AV Pro V60) | |
| Schenker Work 14 Base (Angelbird AV Pro V60) | |
| Média da turma Office (27.4 - 249, n=20, últimos 2 anos) | |
| Acer Swift Go 14 SFG14-71 (AV Pro SD microSD 128 GB V60) | |
| Networking | |
| Schenker Work 14 Base | |
| iperf3 transmit AXE11000 | |
| iperf3 receive AXE11000 | |
| Acer Swift Go 14 SFG14-71 | |
| iperf3 transmit AXE11000 | |
| iperf3 receive AXE11000 | |
| iperf3 transmit AXE11000 6GHz | |
| iperf3 receive AXE11000 6GHz | |
| HP ProBook 445 G10 | |
| iperf3 transmit AXE11000 | |
| iperf3 receive AXE11000 | |
| Dell Latitude 3440 | |
| iperf3 transmit AXE11000 | |
| iperf3 receive AXE11000 | |
| iperf3 transmit AXE11000 6GHz | |
| iperf3 receive AXE11000 6GHz | |
| Lenovo ThinkPad L14 G4 21H6S00900 | |
| iperf3 transmit AXE11000 | |
| iperf3 receive AXE11000 | |
| iperf3 transmit AXE11000 6GHz | |
| iperf3 receive AXE11000 6GHz | |

")
")
Dispositivos de entrada
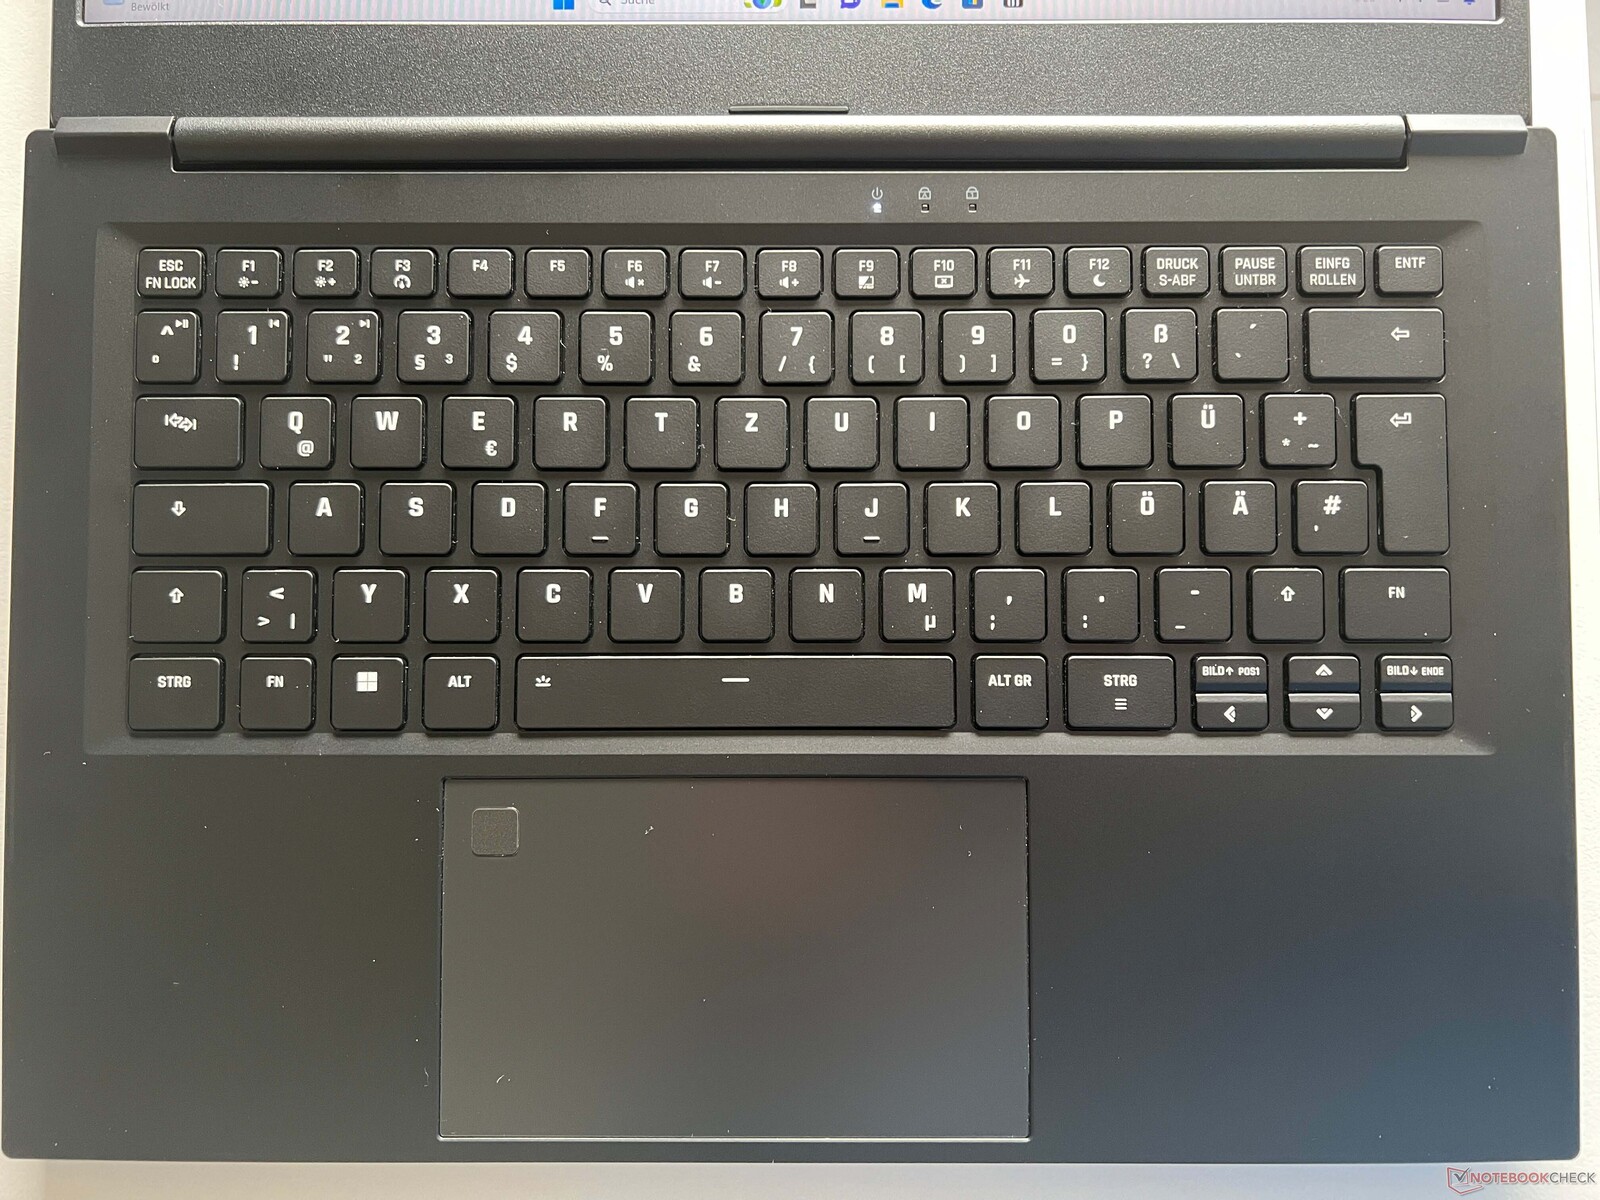
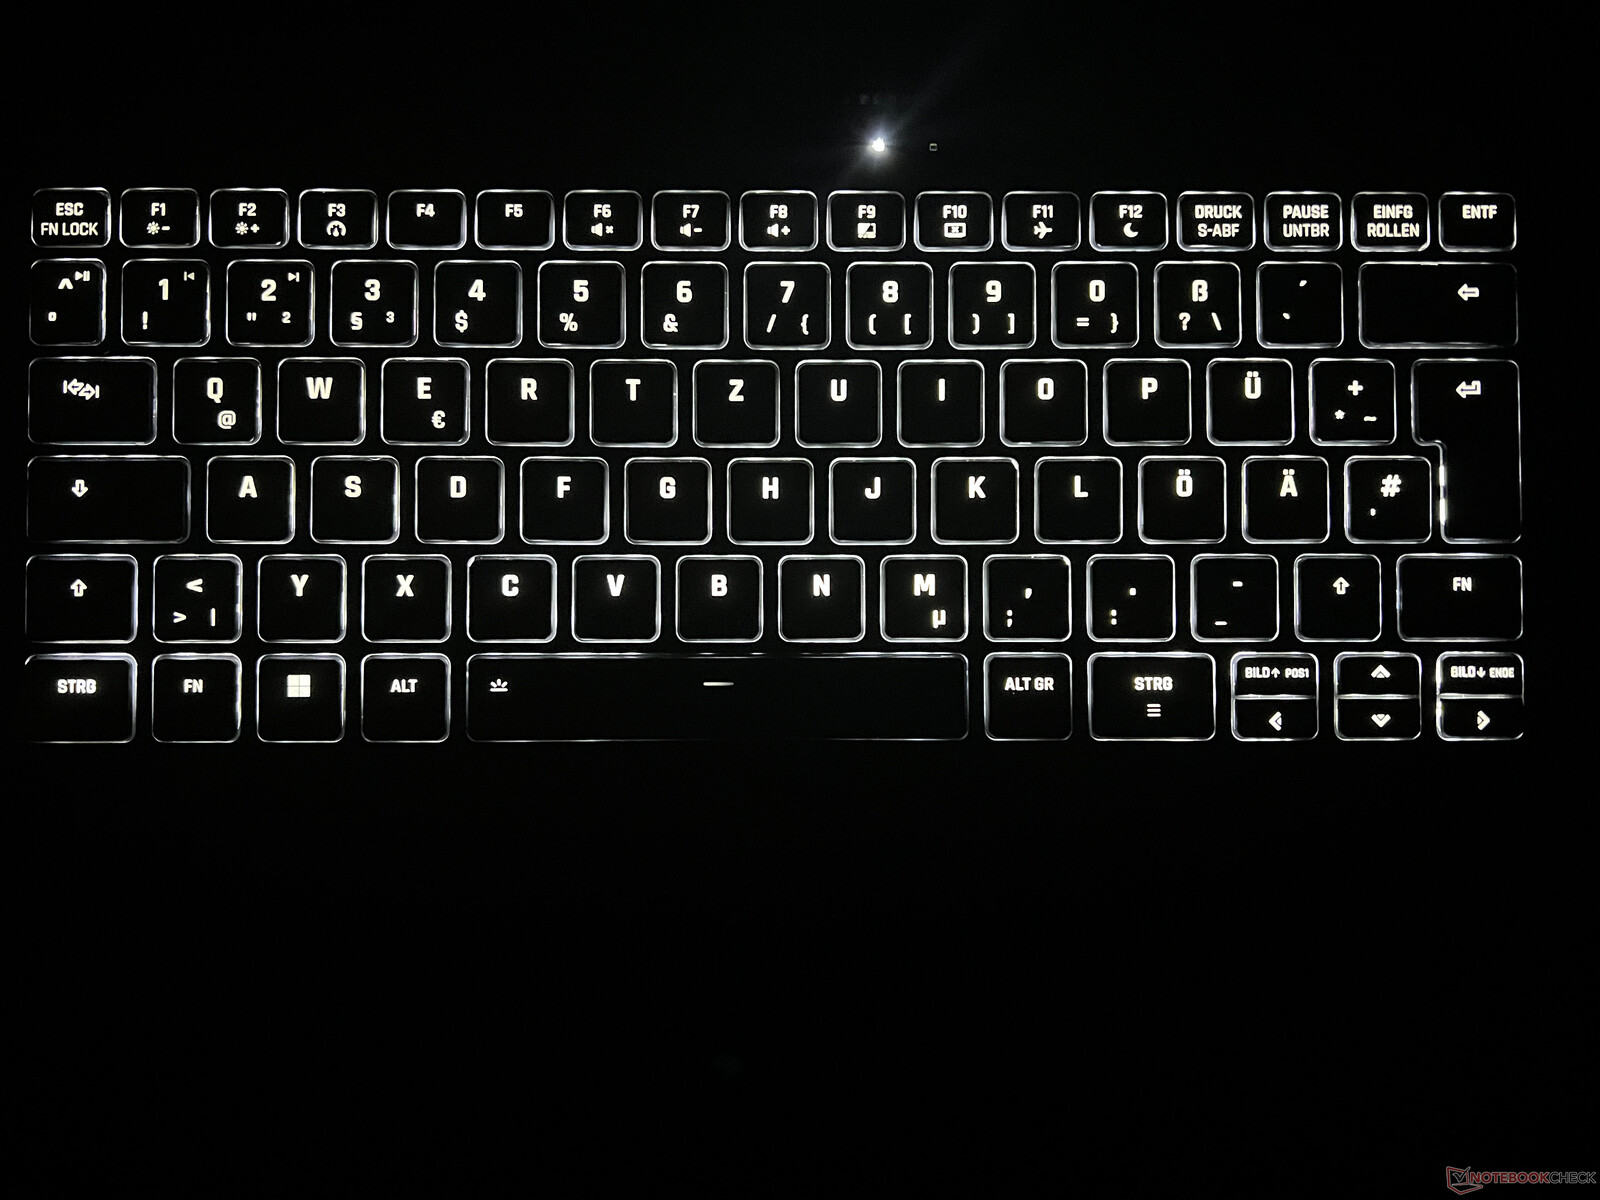
O teclado chiclet preto do laptop tem luz de fundo e é confortável para digitar, mas as teclas são um pouco mais finas do que o normal e, em geral, são bem pequenas. As teclas de seta são, na verdade, ainda menores, mas há pelo menos teclas dedicadas para aumentar e diminuir a imagem. O touchpad Microsoft Precision é grande o suficiente para ser usado confortavelmente (12,1 x 7,3 cm) e é equipado com um scanner de impressões digitais no canto superior esquerdo. Por outro lado, ele não é totalmente suave e o senhor perceberá um pouco de resistência durante o uso. Além disso, os ruídos de clique soam muito altos e baratos, o que significa que recomendamos apenas tocar no teclado para fazer entradas em vez de pressioná-lo.
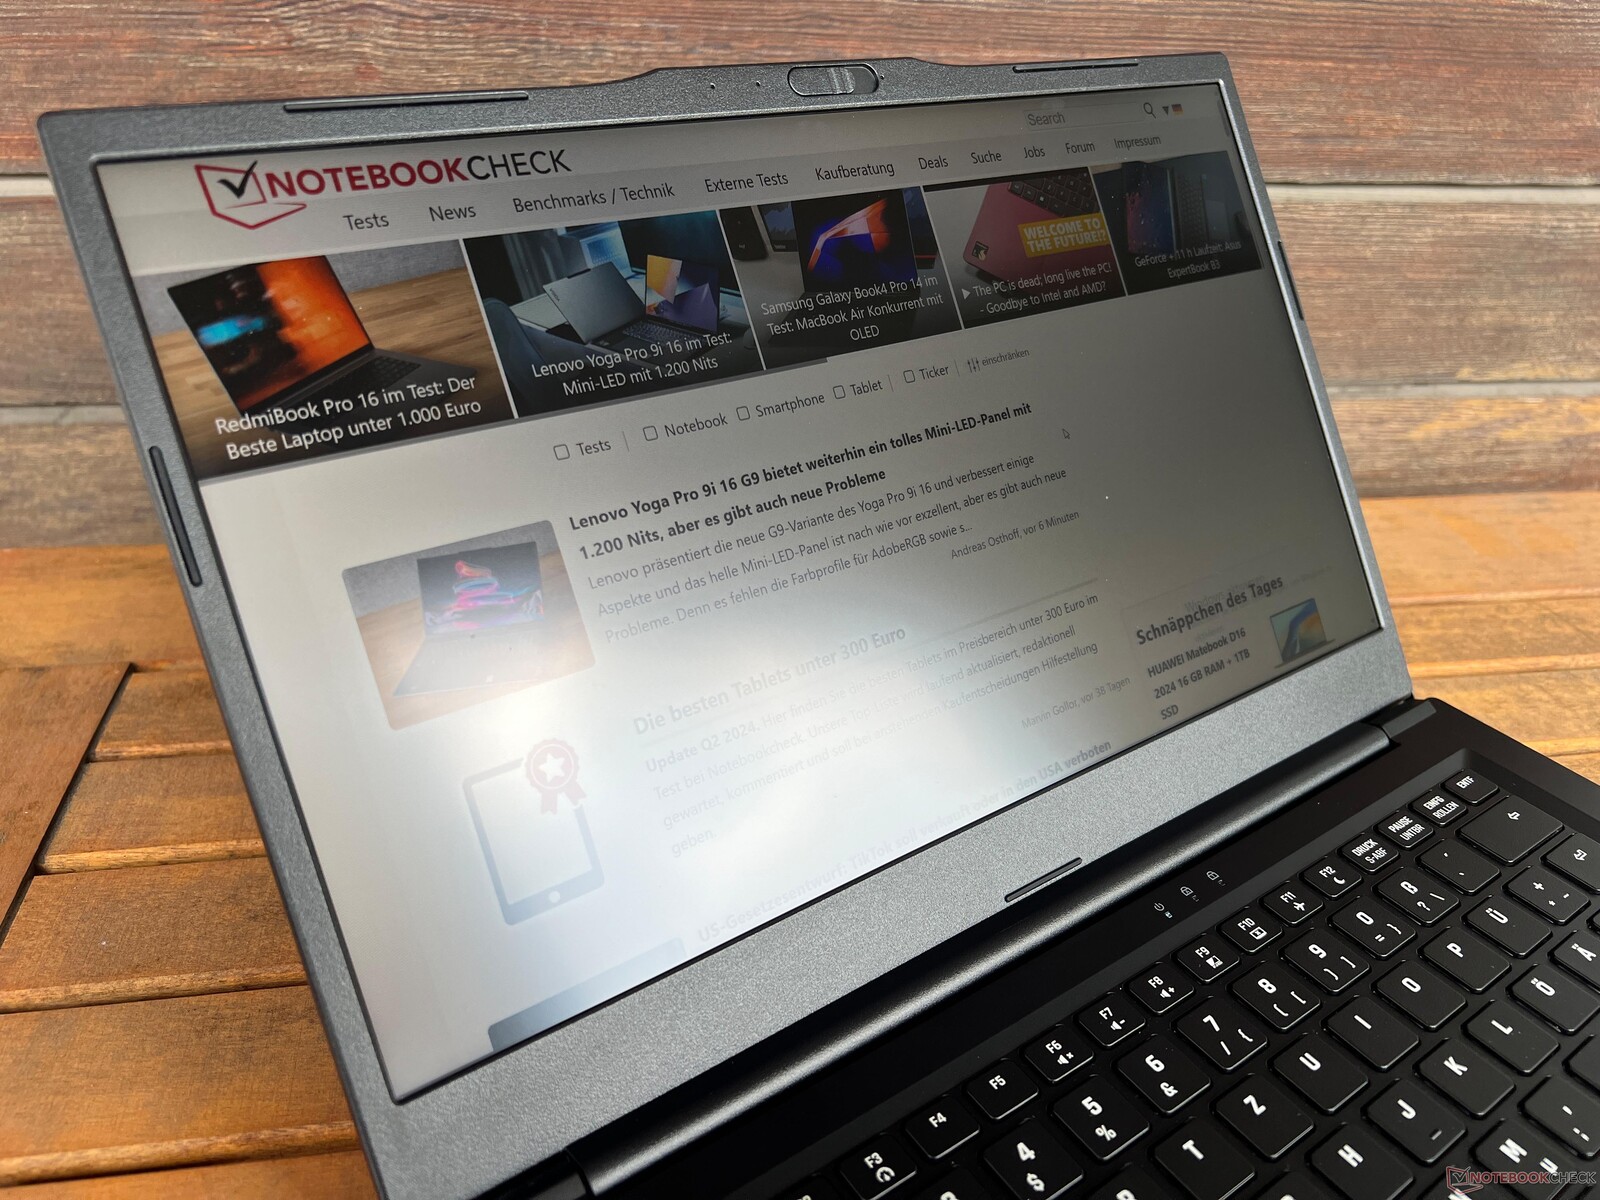
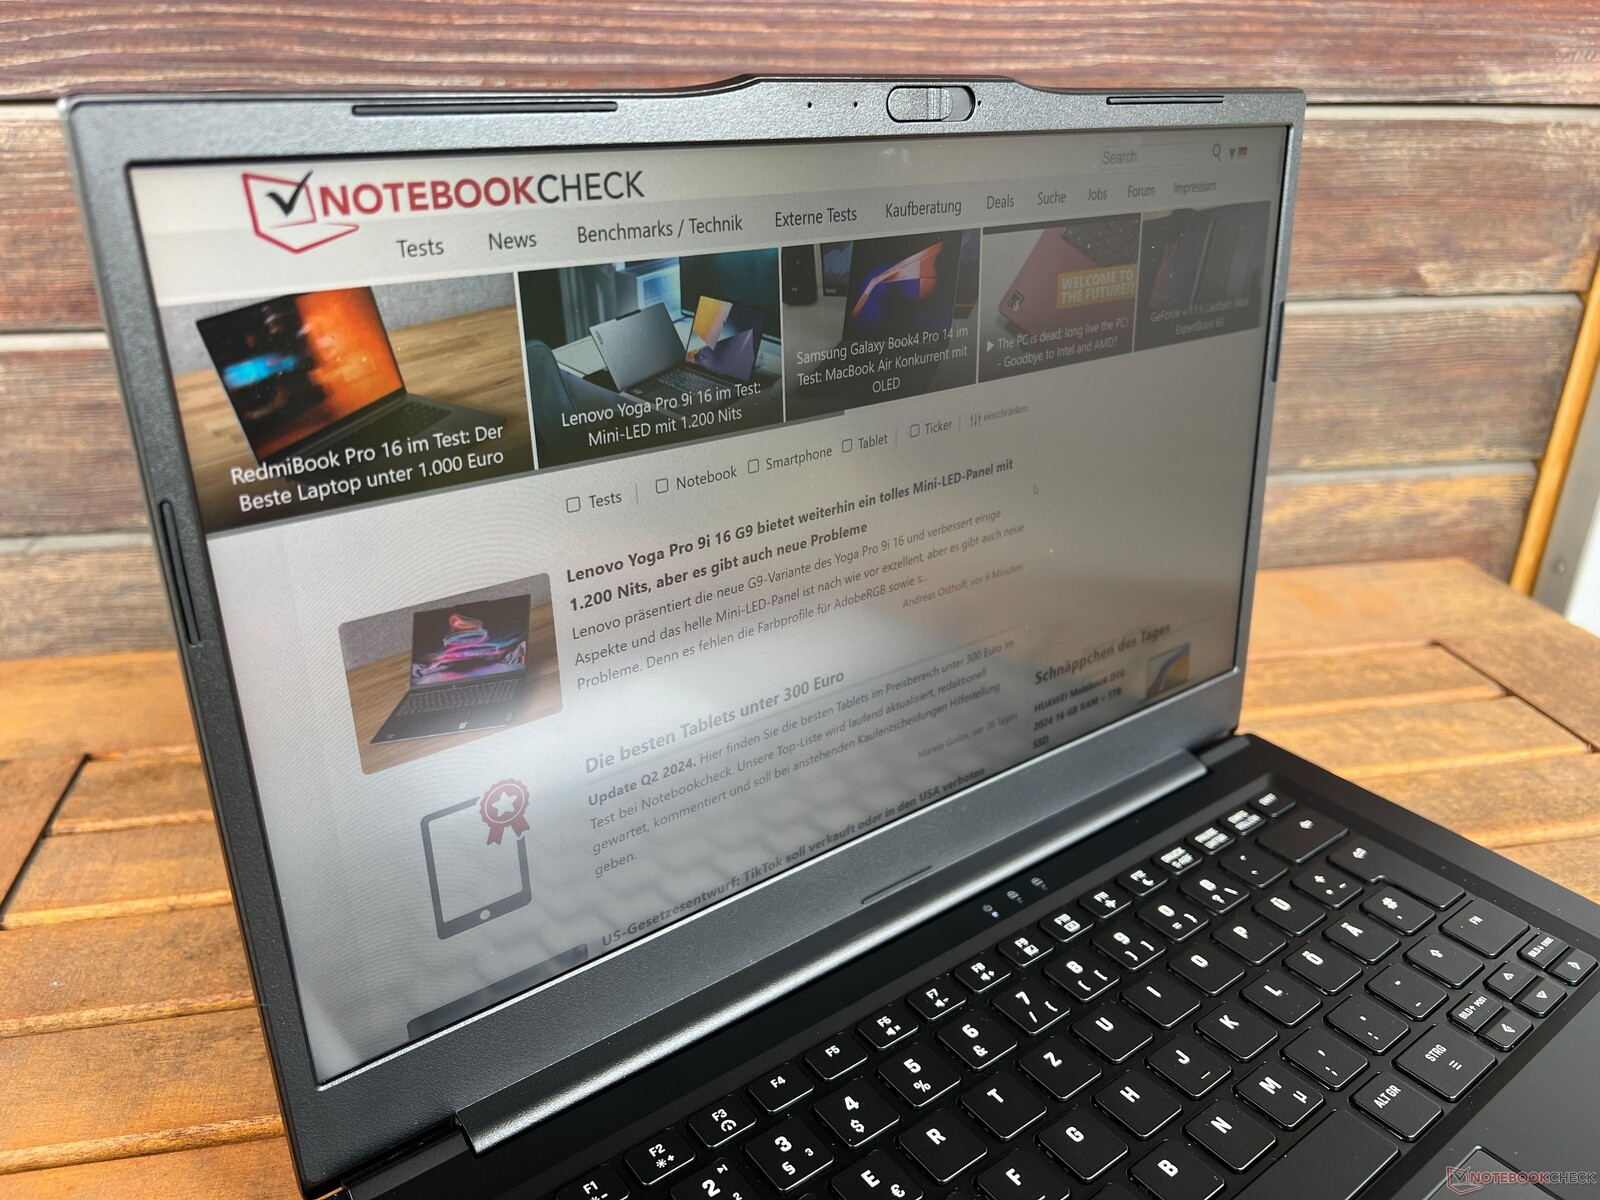
Tela - Painel IPS fosco
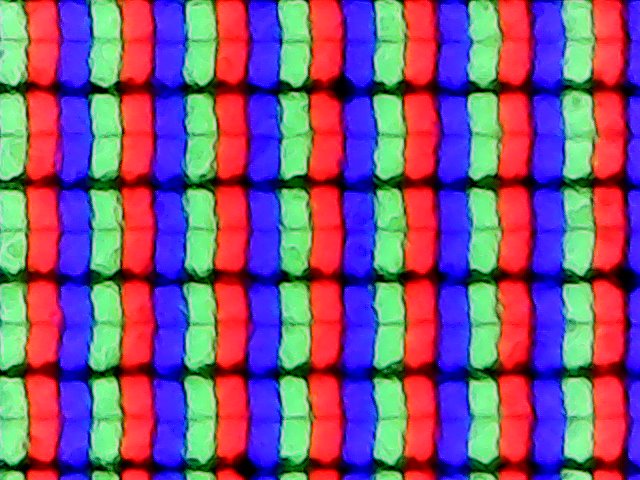
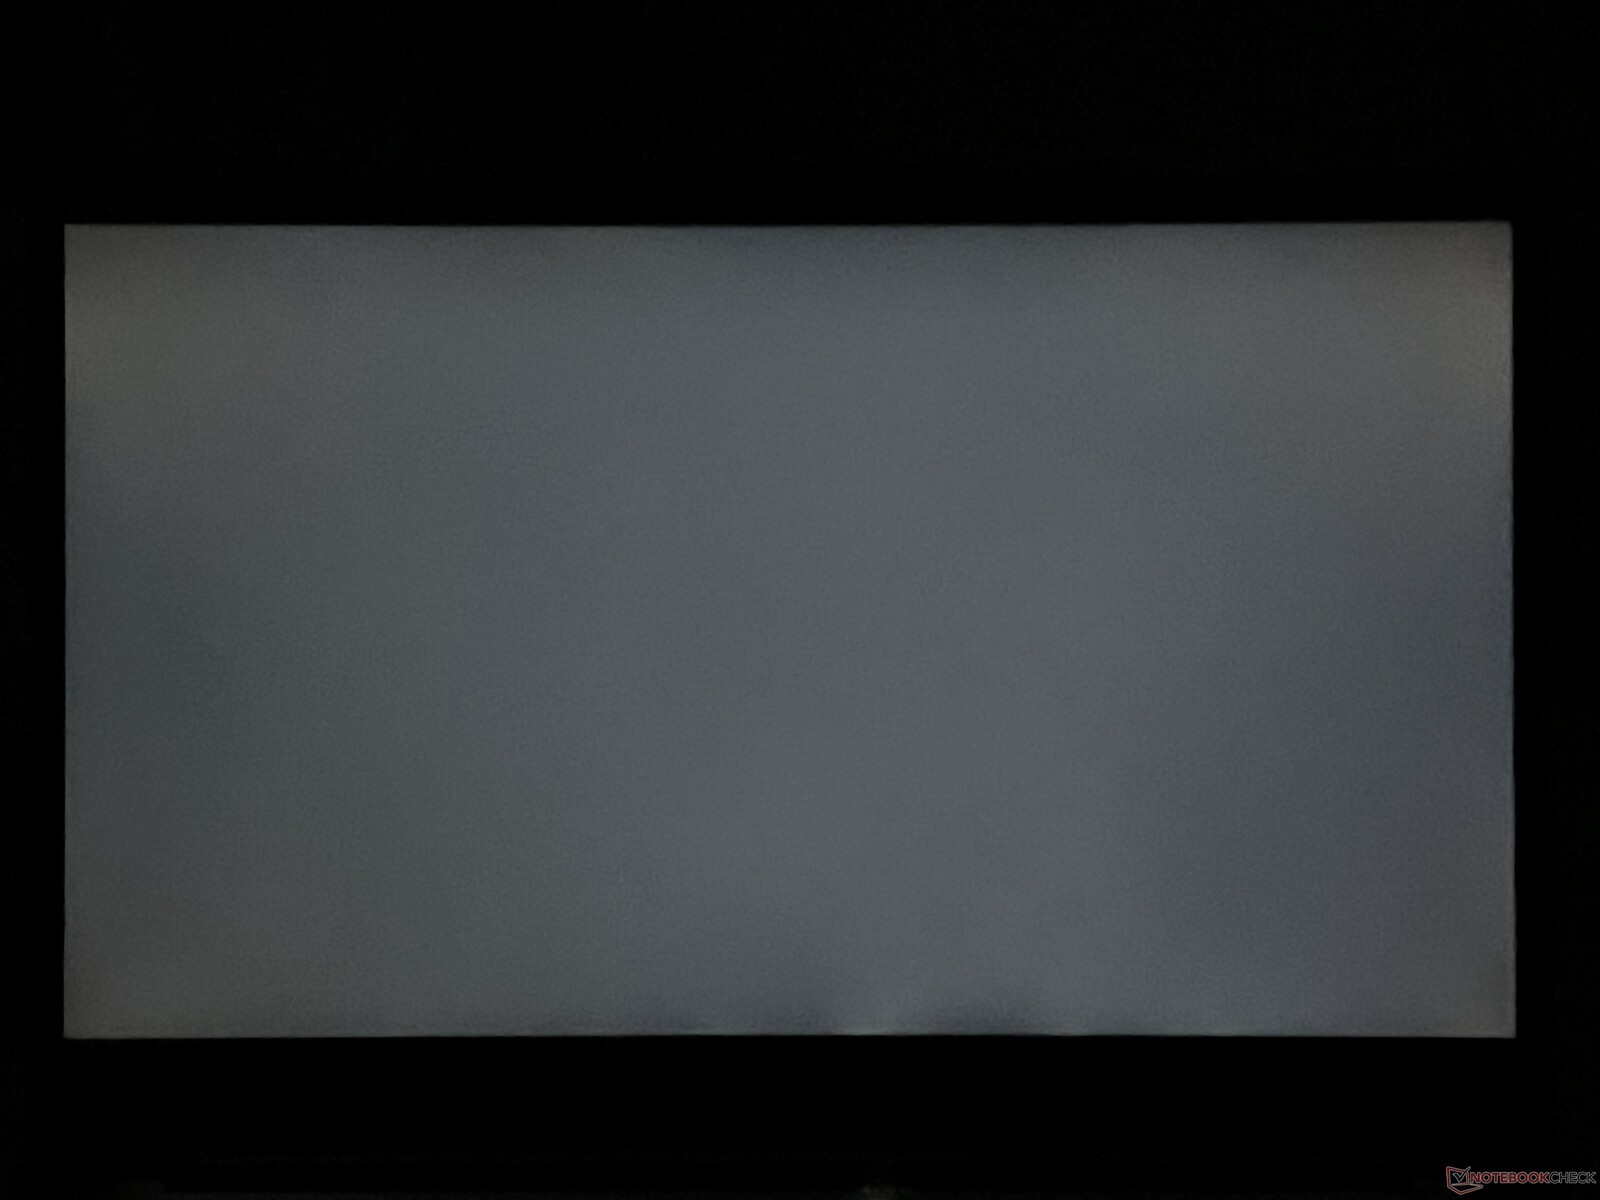
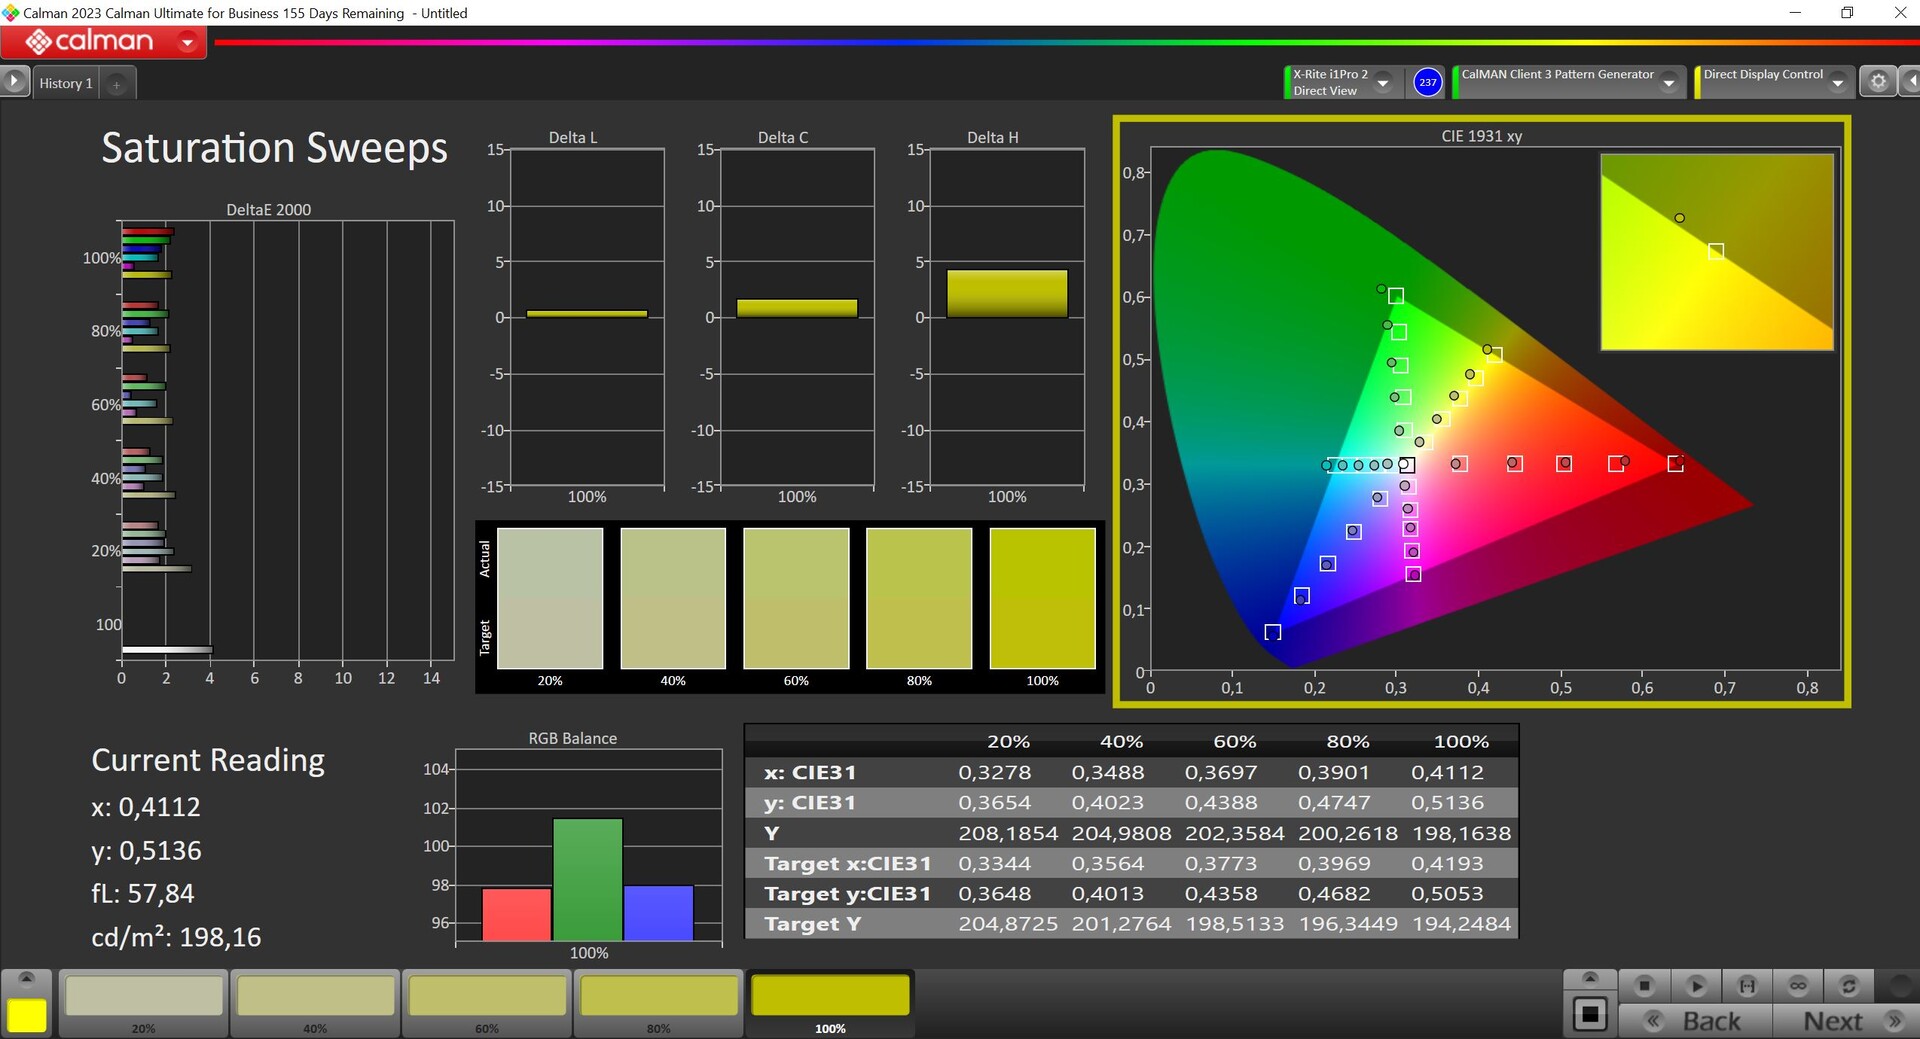
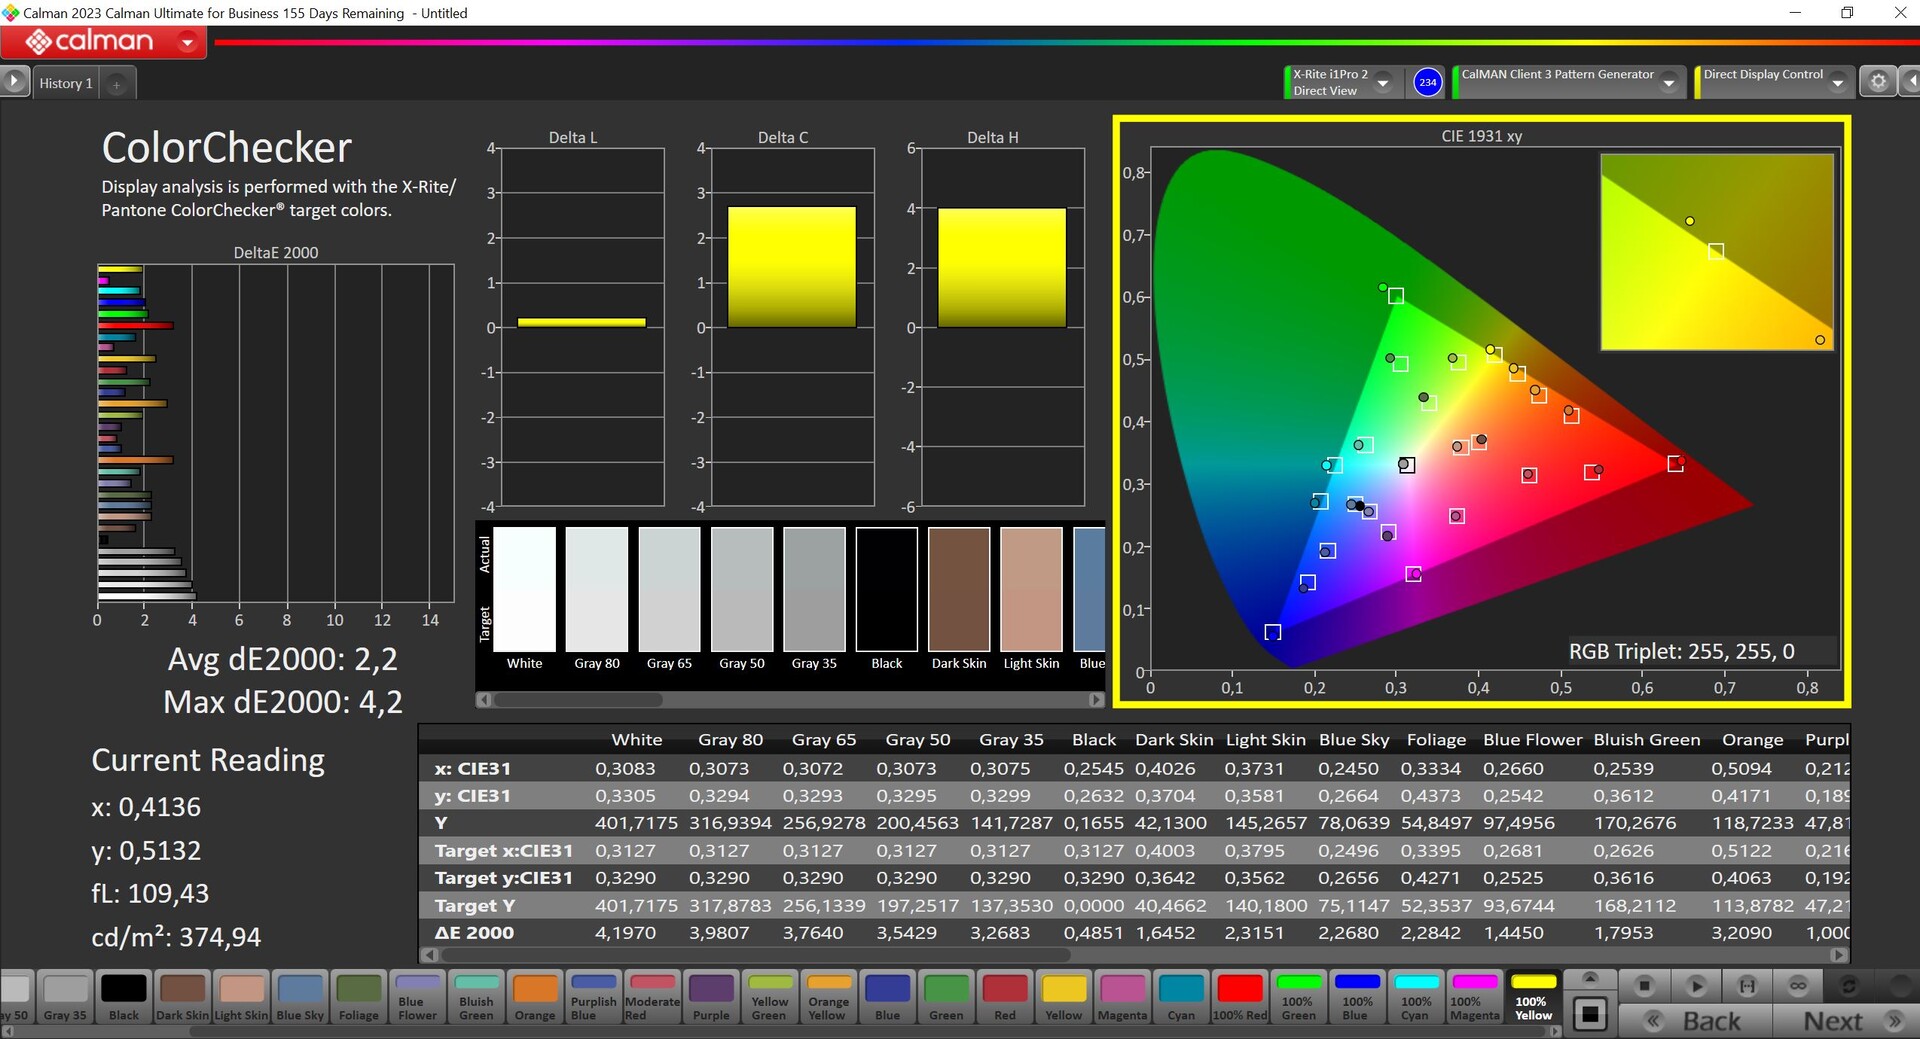
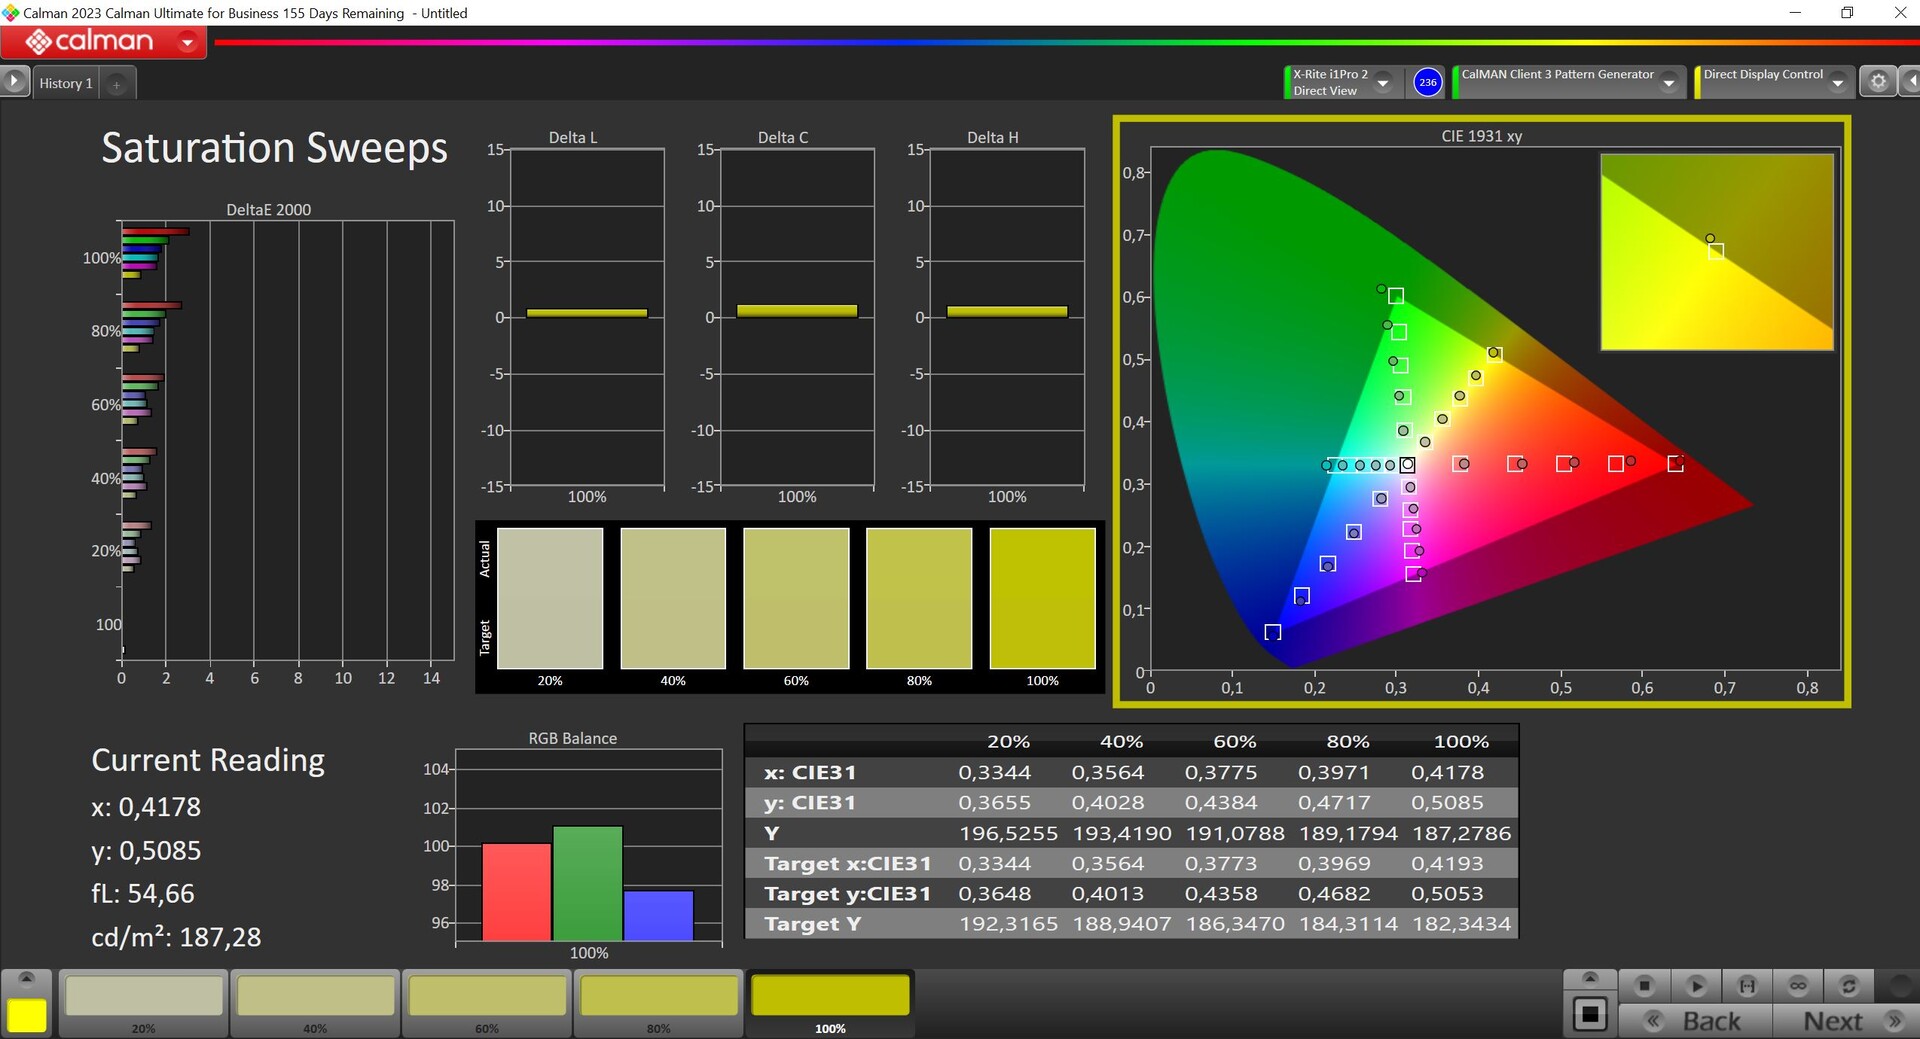
O Work 14 é equipado com um painel IPS fosco (60 Hz) da AU Optronics que apresenta uma resolução de 1.920 x 1.080 pixels. Isso significa que ainda é um painel 16:9, mas a maioria das telas de seus concorrentes tem a mesma proporção. Subjetivamente, a qualidade da imagem sofre um pouco com a aparência granulada, mas o conteúdo é suficientemente nítido e a tela não usa PWM. O sangramento da luz de fundo não é um problema, mas os tempos de resposta são muito lentos e notamos uma quantidade considerável de fantasmas. Em comparação direta, o Acer Swift Go oferece uma qualidade de imagem subjetiva muito melhor com seu painel OLED, mas, em contrapartida, os usuários têm de lidar com a constante oscilação de PWM.
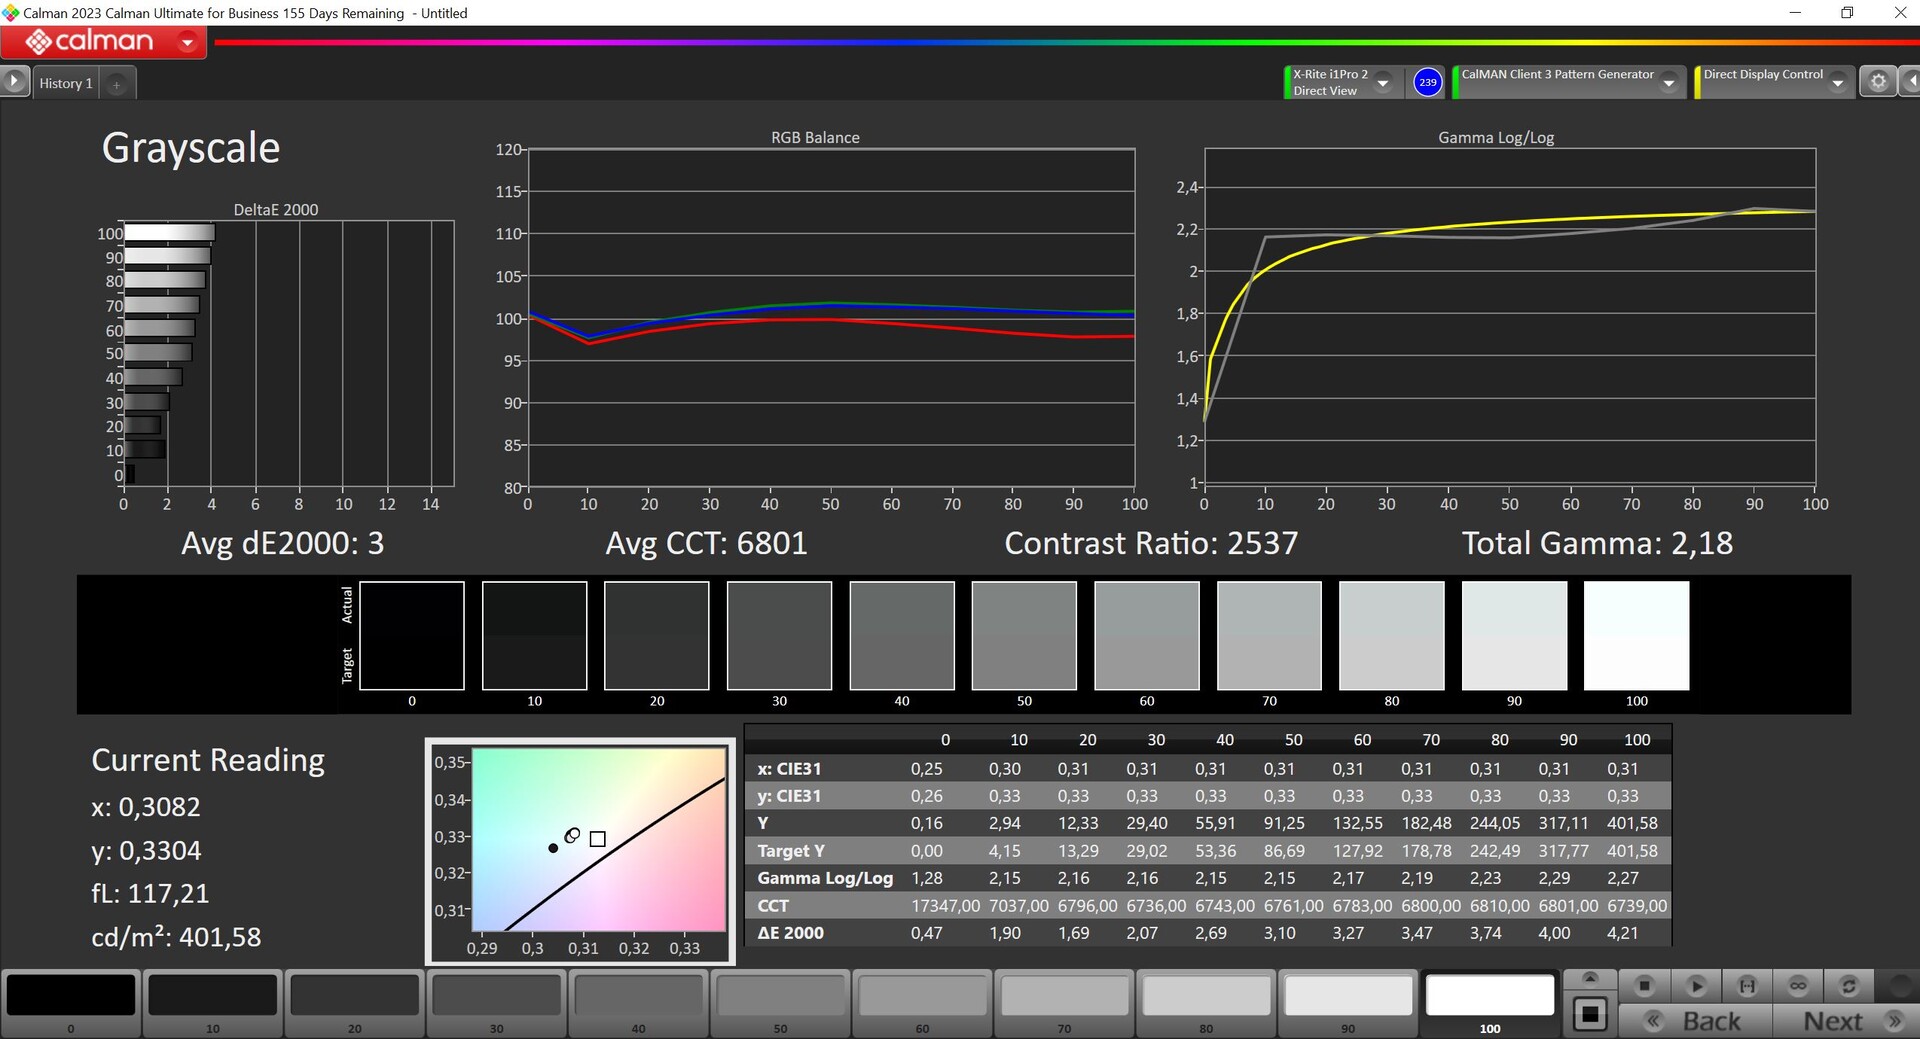
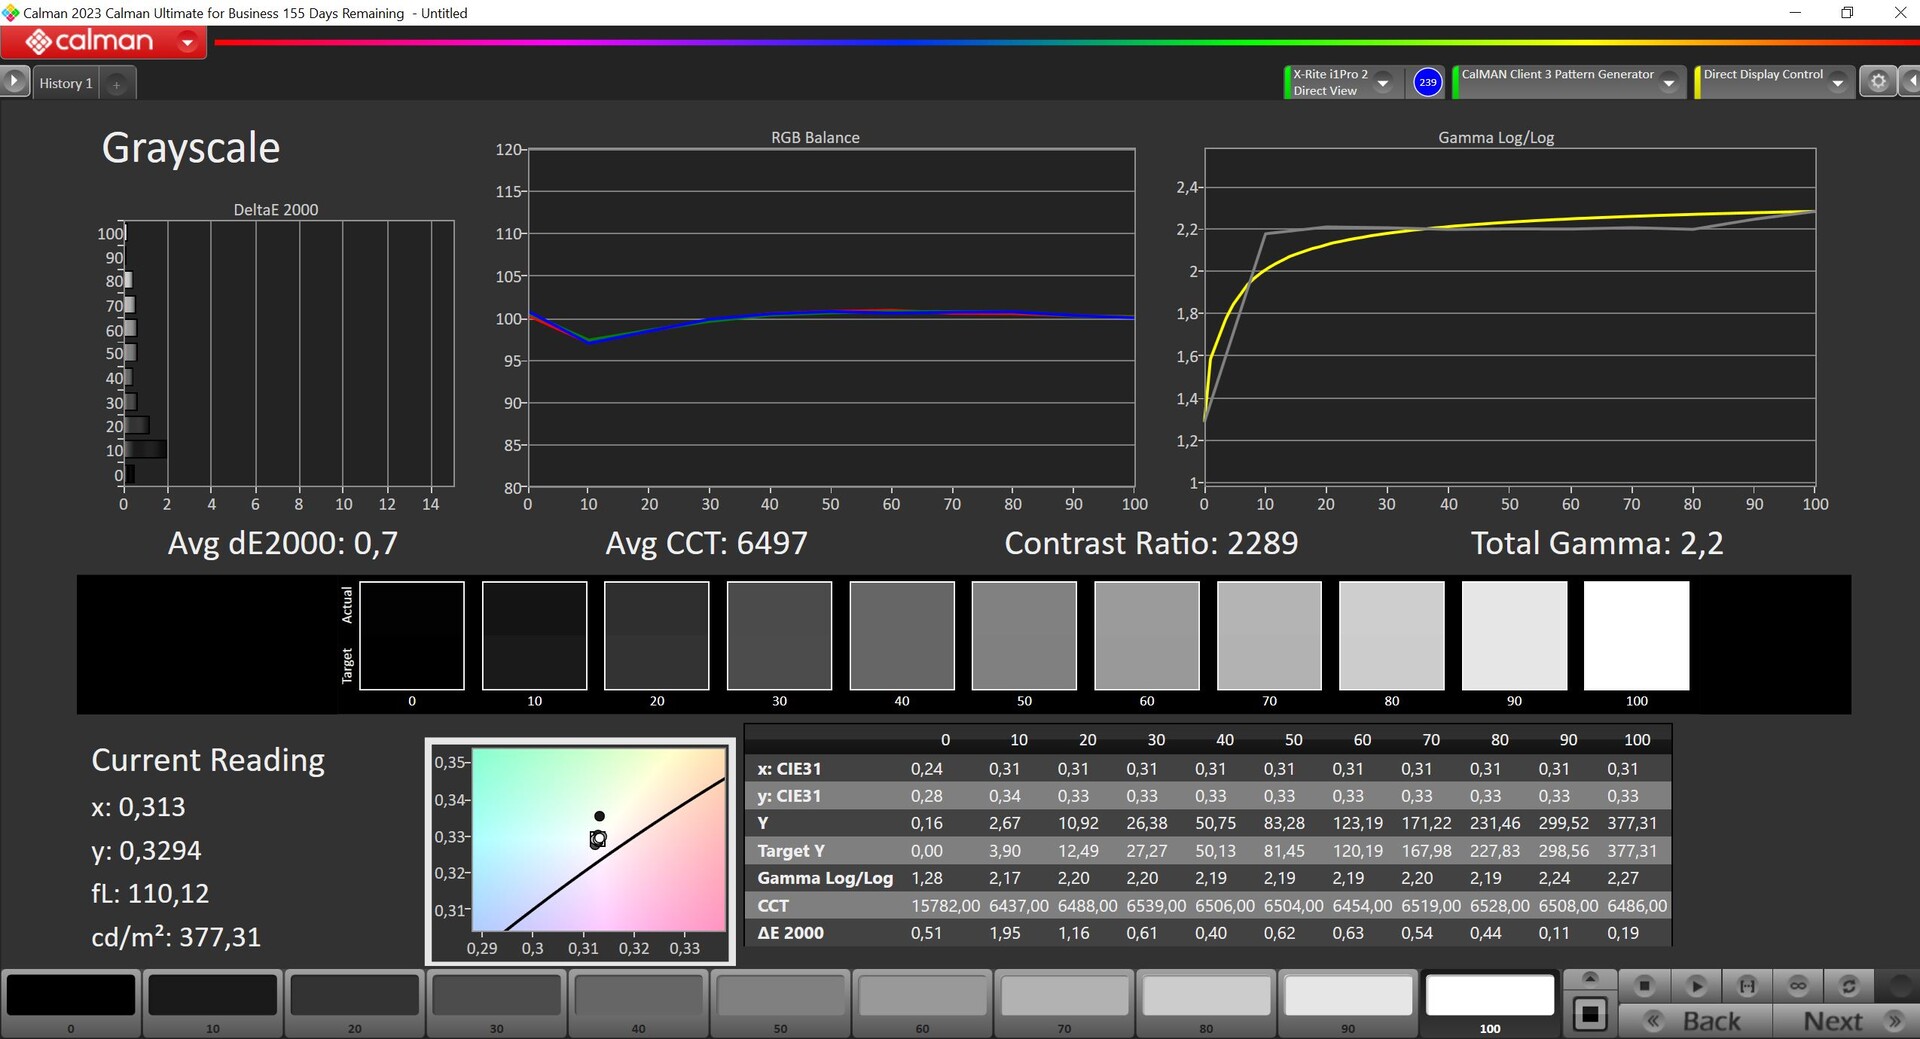
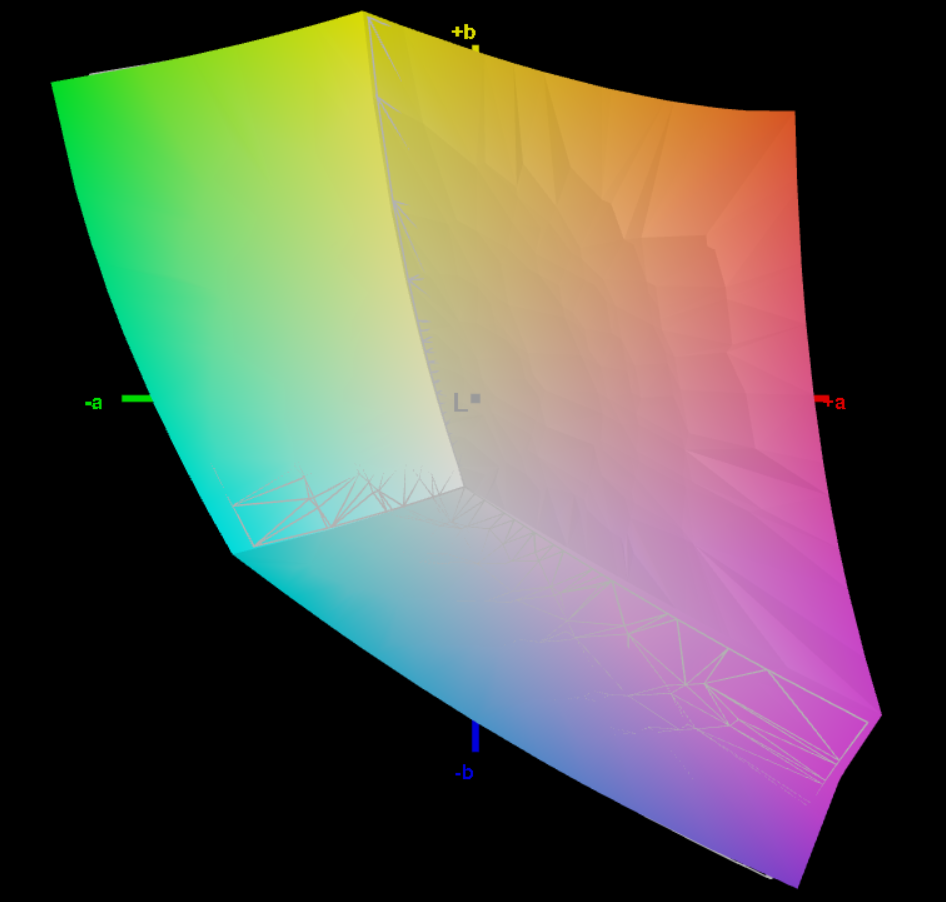
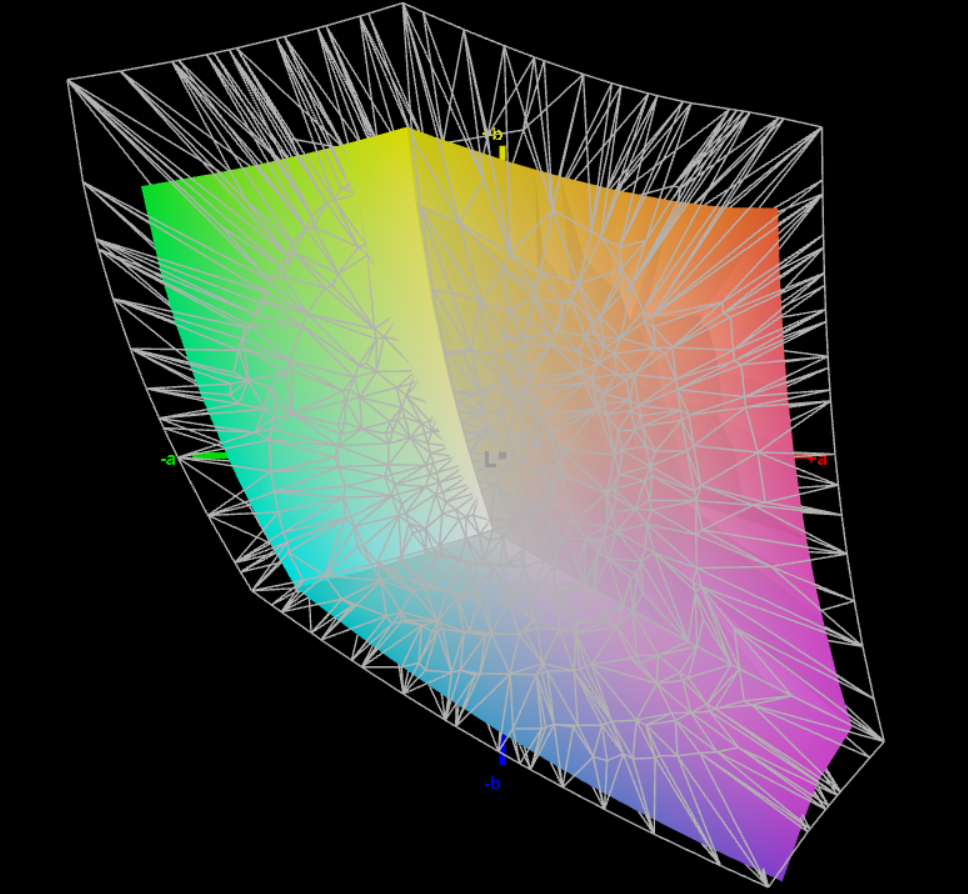
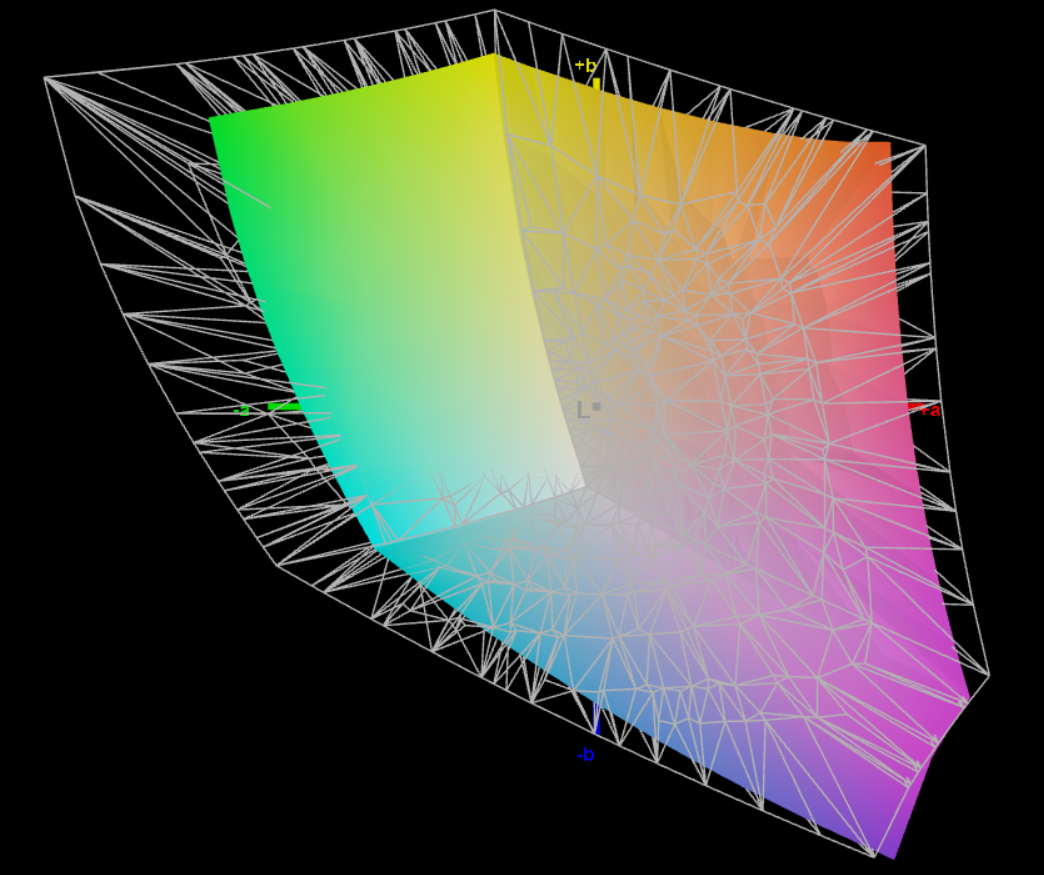
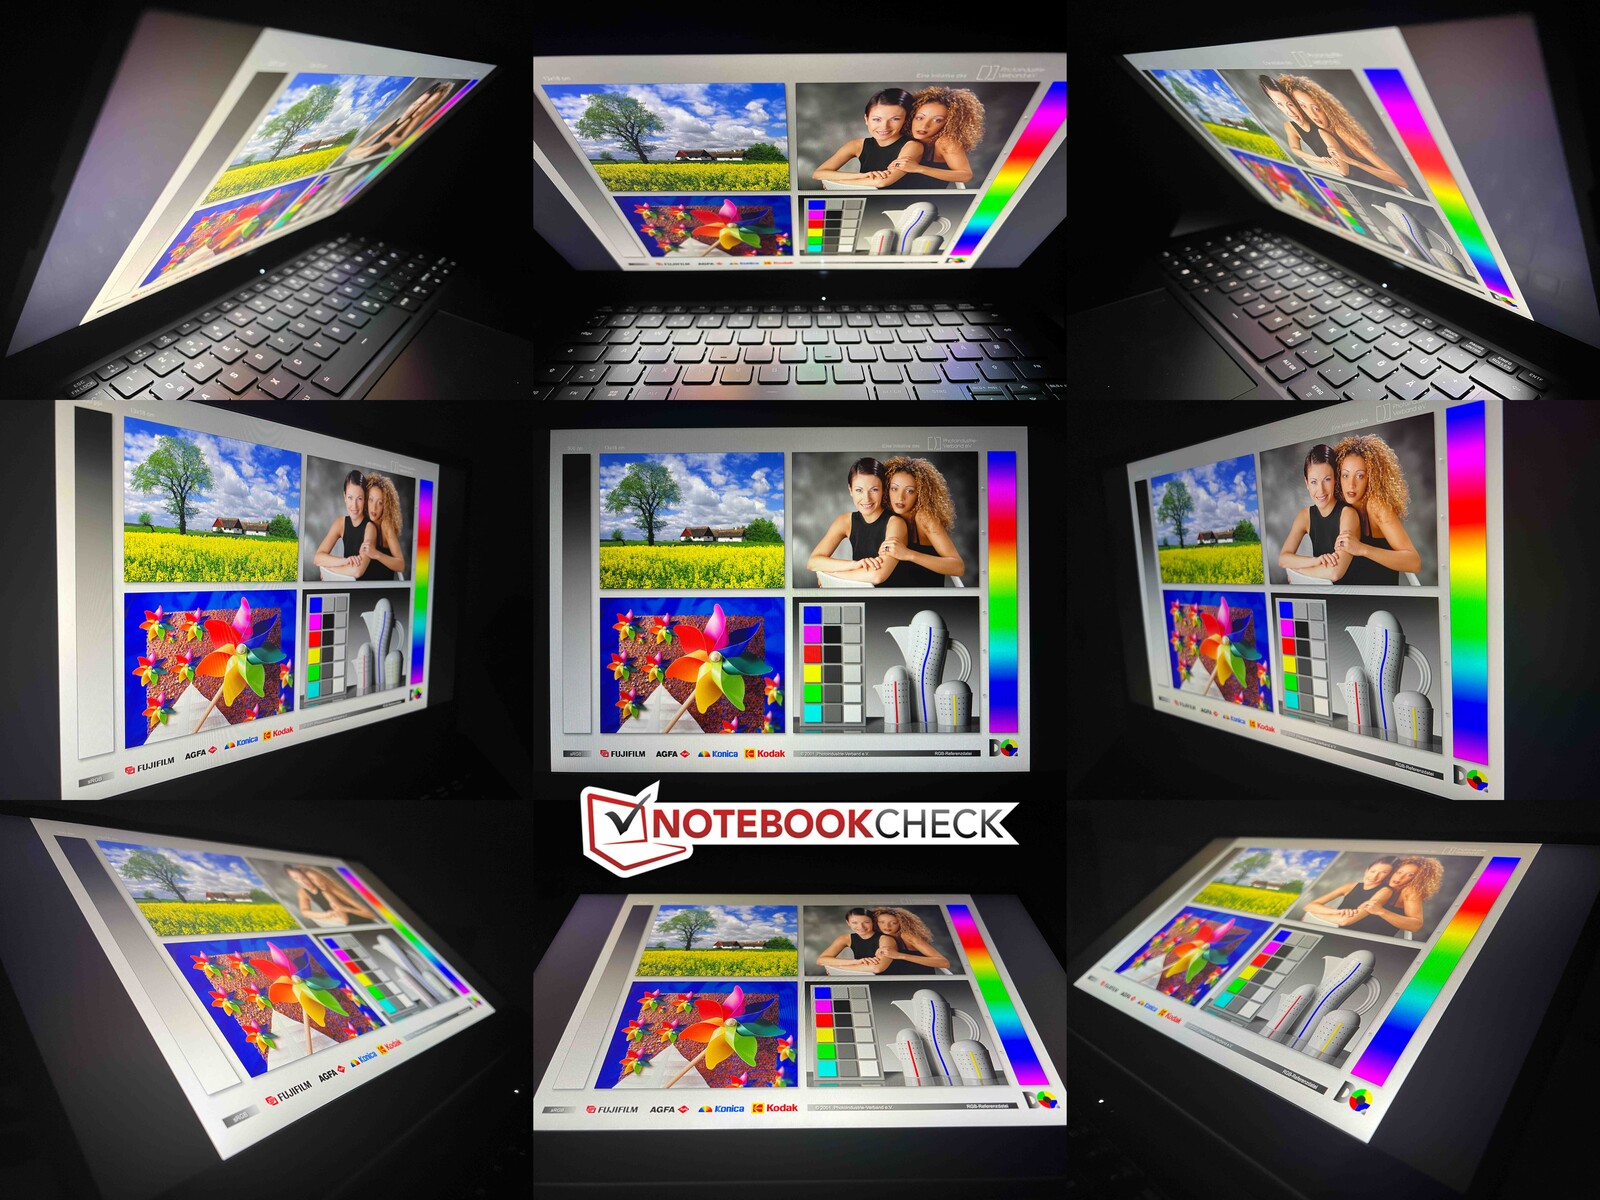
O fabricante indica um brilho típico de 300 cd/m² e nosso dispositivo de teste até apresentou resultados muito melhores em média, ou seja, acima de 400 cd/m². Além disso, seu valor de preto é muito baixo, 0,16 cd/m², o que leva a uma alta taxa de contraste máximo. Sua calibração é decente logo que sai da caixa e isso não deve causar problemas no uso diário. Se o senhor mesmo calibrar a tela, poderá melhorar um pouco a representação, mas isso implica o custo de um pouco de brilho. Ela cobre quase completamente o espaço de cores sRGB menor. Por fora, o painel causa uma boa impressão e a estabilidade do ângulo de visão é excelente.
| |||||||||||||||||||||||||
iluminação: 89 %
iluminação com acumulador: 402 cd/m²
Contraste: 2513:1 (Preto: 0.16 cd/m²)
ΔE ColorChecker Calman: 2.2 | ∀{0.5-29.43 Ø4.73}
calibrated: 1.3
ΔE Greyscale Calman: 3 | ∀{0.09-98 Ø4.97}
73.8% AdobeRGB 1998 (Argyll 3D)
99.8% sRGB (Argyll 3D)
72.4% Display P3 (Argyll 3D)
Gamma: 2.18
CCT: 6801 K
| Schenker Work 14 Base B140HAN06.8, IPS, 1920x1080, 14" | Acer Swift Go 14 SFG14-71 Samsung ATNA40YK11-0, OLED, 2880x1800, 14" | HP ProBook 445 G10 AUO2FA6, IPS, 1920x1080, 14" | Dell Latitude 3440 BOE NE140FH, IPS, 1920x1080, 14" | Lenovo ThinkPad L14 G4 21H6S00900 B140HAN06.9, IPS LED, 1920x1080, 14" | |
|---|---|---|---|---|---|
| Display | 22% | -5% | -42% | 0% | |
| Display P3 Coverage (%) | 72.4 | 99.9 38% | 68.4 -6% | 40.4 -44% | 73.2 1% |
| sRGB Coverage (%) | 99.8 | 100 0% | 95.2 -5% | 60.7 -39% | 98.9 -1% |
| AdobeRGB 1998 Coverage (%) | 73.8 | 95.4 29% | 70.6 -4% | 41.8 -43% | 73.9 0% |
| Response Times | 96% | 24% | 28% | 5% | |
| Response Time Grey 50% / Grey 80% * (ms) | 60 ? | 1.85 ? 97% | 53.4 ? 11% | 35.3 ? 41% | 58.1 ? 3% |
| Response Time Black / White * (ms) | 34.7 ? | 2 ? 94% | 21.8 ? 37% | 29.8 ? 14% | 32.7 ? 6% |
| PWM Frequency (Hz) | 357 ? | ||||
| Screen | -8% | -15% | -67% | -18% | |
| Brightness middle (cd/m²) | 402 | 278 -31% | 501 25% | 292.6 -27% | 430 7% |
| Brightness (cd/m²) | 404 | 279 -31% | 464 15% | 270 -33% | 409 1% |
| Brightness Distribution (%) | 89 | 96 8% | 87 -2% | 88 -1% | 88 -1% |
| Black Level * (cd/m²) | 0.16 | 0.04 75% | 0.26 -63% | 0.19 -19% | 0.31 -94% |
| Contrast (:1) | 2513 | 6950 177% | 1927 -23% | 1540 -39% | 1387 -45% |
| Colorchecker dE 2000 * | 2.2 | 3.01 -37% | 2.64 -20% | 4.63 -110% | 2.4 -9% |
| Colorchecker dE 2000 max. * | 4.2 | 4.43 -5% | 5.06 -20% | 17.1 -307% | 4.7 -12% |
| Colorchecker dE 2000 calibrated * | 1.3 | 4.14 -218% | 1.57 -21% | 2.13 -64% | 1.4 -8% |
| Greyscale dE 2000 * | 3 | 3.2 -7% | 3.8 -27% | 3.2 -7% | 3 -0% |
| Gamma | 2.18 101% | 2.194 100% | 2.103 105% | 2.34 94% | 2.3 96% |
| CCT | 6801 96% | 6126 106% | 6562 99% | 7184 90% | 6489 100% |
| Média Total (Programa/Configurações) | 37% /
14% | 1% /
-7% | -27% /
-48% | -4% /
-11% |
* ... menor é melhor

Exibir tempos de resposta
| ↔ Tempo de resposta preto para branco | ||
|---|---|---|
| 34.7 ms ... ascensão ↗ e queda ↘ combinadas | ↗ 17 ms ascensão | 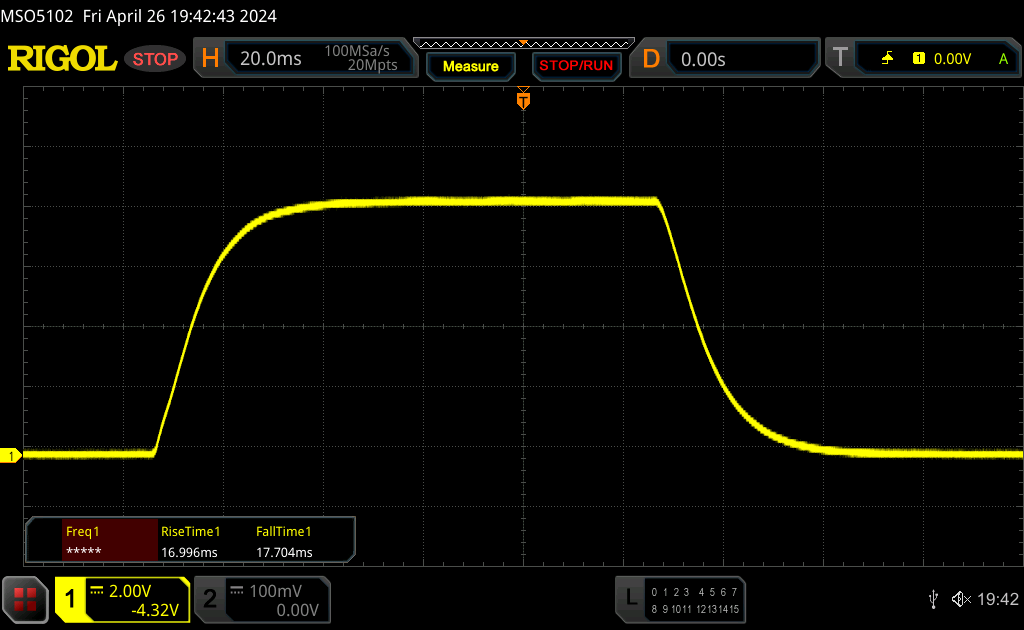 |
| ↘ 17.7 ms queda | ||
| A tela mostra taxas de resposta lentas em nossos testes e será insatisfatória para os jogadores. Em comparação, todos os dispositivos testados variam de 0.1 (mínimo) a 240 (máximo) ms. » 92 % de todos os dispositivos são melhores. Isso significa que o tempo de resposta medido é pior que a média de todos os dispositivos testados (19.9 ms). | ||
| ↔ Tempo de resposta 50% cinza a 80% cinza | ||
| 60 ms ... ascensão ↗ e queda ↘ combinadas | ↗ 27.5 ms ascensão | 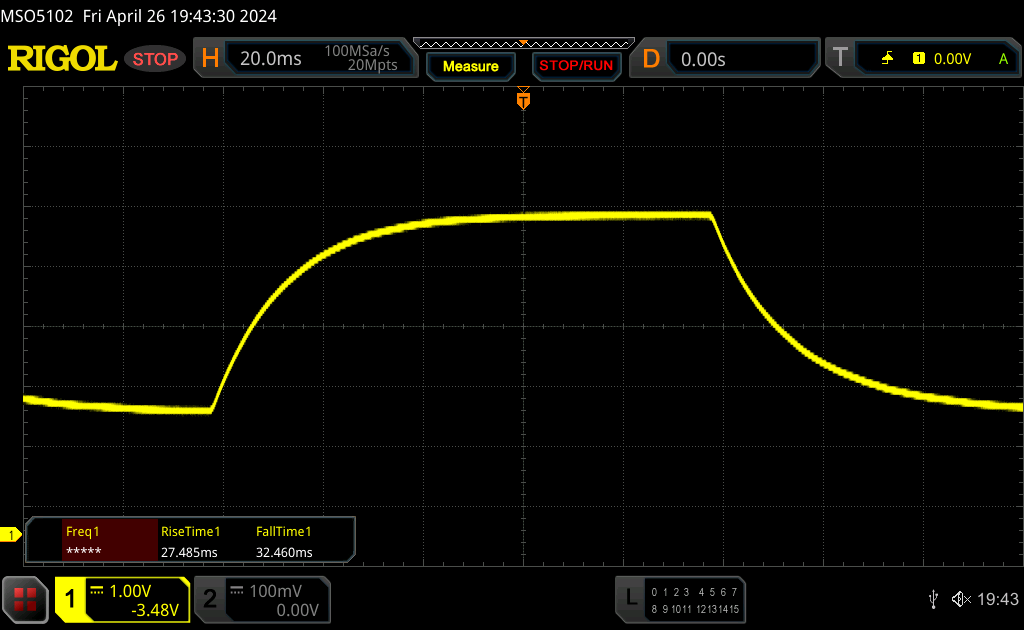 |
| ↘ 32.5 ms queda | ||
| A tela mostra taxas de resposta lentas em nossos testes e será insatisfatória para os jogadores. Em comparação, todos os dispositivos testados variam de 0.165 (mínimo) a 636 (máximo) ms. » 96 % de todos os dispositivos são melhores. Isso significa que o tempo de resposta medido é pior que a média de todos os dispositivos testados (31.1 ms). | ||
Cintilação da tela / PWM (modulação por largura de pulso)
| Tela tremeluzindo / PWM não detectado | 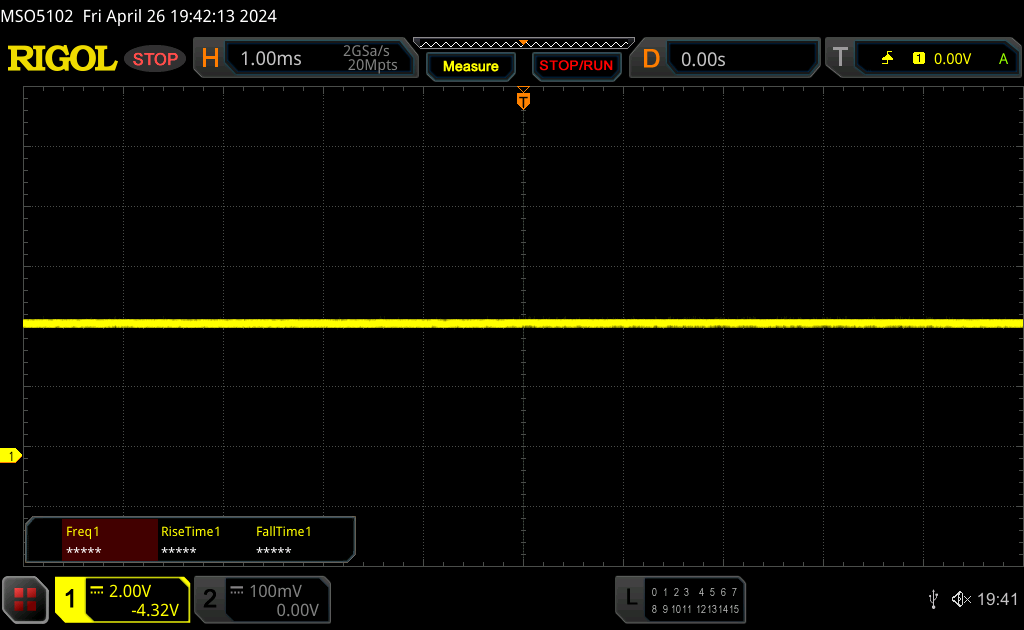 | ||
[pwm_comparison] Em comparação: 52 % de todos os dispositivos testados não usam PWM para escurecer a tela. Se PWM foi detectado, uma média de 7798 (mínimo: 5 - máximo: 343500) Hz foi medida. | |||
Desempenho - The Work 14 com Alder Lake
Condições de teste
O Schenker oferece vários perfis de desempenho. Realizamos os seguintes benchmarks e medições usando o modo de entretenimento, que está ativo por padrão.
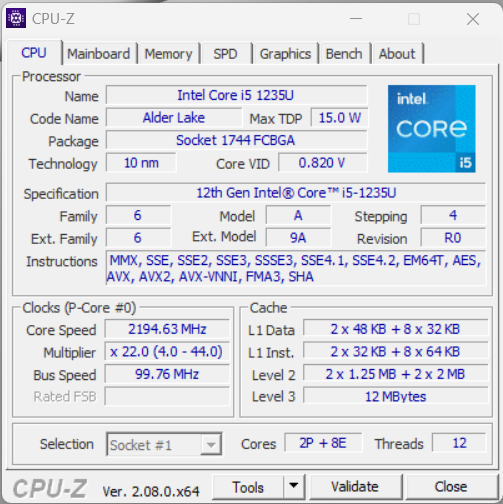
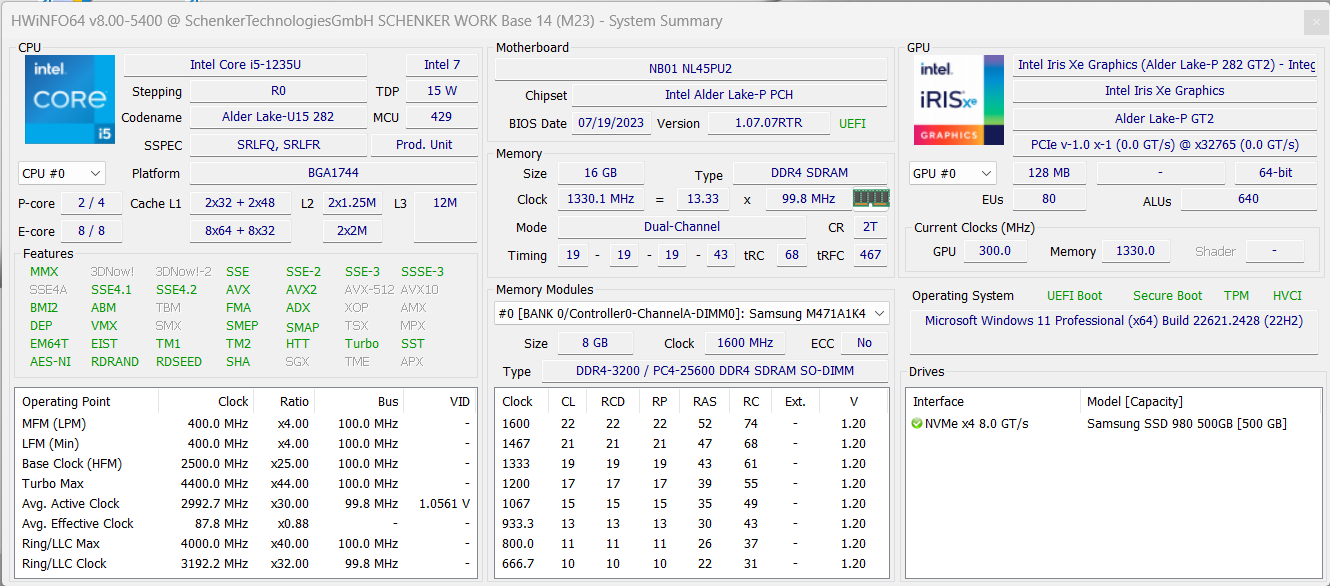
Processador - Core i5-1235U
O Core i5-1235U é da geração Alder Lake da Intel, apresenta 10 núcleos (desempenho 2x, eficiência 8x) e é executado a 25/20 watts no Work 14. É claro que o senhor não deve esperar nenhum milagre de desempenho, no entanto, seu desempenho geral é comparável ao do Core i5-1345U no interior do Dell Latitude 14. O desempenho da CPU é definitivamente bom o suficiente para tarefas diárias simples quando o senhor trabalha em casa ou no escritório e, além disso, o laptop não parece muito lento. Por outro lado, o senhor terá que se contentar com uma NPU para aplicativos de IA. No uso da bateria, o processador pode consumir no máximo 15 watts, e é por isso que seu desempenho é 20% menor. Outros benchmarks de CPU podem ser encontrados aqui.
Cinebench R15 Multi continuous test
Cinebench R23: Multi Core | Single Core
Cinebench R20: CPU (Multi Core) | CPU (Single Core)
Cinebench R15: CPU Multi 64Bit | CPU Single 64Bit
Blender: v2.79 BMW27 CPU
7-Zip 18.03: 7z b 4 | 7z b 4 -mmt1
Geekbench 6.7: Multi-Core | Single-Core
Geekbench 5.5: Multi-Core | Single-Core
HWBOT x265 Benchmark v2.2: 4k Preset
LibreOffice : 20 Documents To PDF
R Benchmark 2.5: Overall mean
| CPU Performance rating | |
| Média da turma Office | |
| Acer Swift Go 14 SFG14-71 | |
| Dell Latitude 3440 -2! | |
| Lenovo ThinkPad L14 G4 21H6S00900 -2! | |
| HP ProBook 445 G10 | |
| Schenker Work 14 Base | |
| Média Intel Core i5-1235U | |
| Cinebench R23 / Multi Core | |
| Média da turma Office (1673 - 22808, n=73, últimos 2 anos) | |
| Lenovo ThinkPad L14 G4 21H6S00900 | |
| HP ProBook 445 G10 | |
| Acer Swift Go 14 SFG14-71 | |
| Dell Latitude 3440 | |
| Schenker Work 14 Base | |
| Média Intel Core i5-1235U (2485 - 9208, n=8) | |
| Cinebench R23 / Single Core | |
| Dell Latitude 3440 | |
| Média da turma Office (708 - 2130, n=73, últimos 2 anos) | |
| Média Intel Core i5-1235U (1444 - 1698, n=8) | |
| Schenker Work 14 Base | |
| Acer Swift Go 14 SFG14-71 | |
| HP ProBook 445 G10 | |
| Lenovo ThinkPad L14 G4 21H6S00900 | |
| Cinebench R20 / CPU (Multi Core) | |
| Média da turma Office (648 - 8840, n=72, últimos 2 anos) | |
| Lenovo ThinkPad L14 G4 21H6S00900 | |
| HP ProBook 445 G10 | |
| Acer Swift Go 14 SFG14-71 | |
| Dell Latitude 3440 | |
| Schenker Work 14 Base | |
| Média Intel Core i5-1235U (1783 - 3537, n=8) | |
| Cinebench R20 / CPU (Single Core) | |
| Dell Latitude 3440 | |
| Média da turma Office (345 - 816, n=72, últimos 2 anos) | |
| Schenker Work 14 Base | |
| Média Intel Core i5-1235U (566 - 651, n=8) | |
| Acer Swift Go 14 SFG14-71 | |
| HP ProBook 445 G10 | |
| Lenovo ThinkPad L14 G4 21H6S00900 | |
| Cinebench R15 / CPU Multi 64Bit | |
| Média da turma Office (250 - 3380, n=74, últimos 2 anos) | |
| Lenovo ThinkPad L14 G4 21H6S00900 | |
| Acer Swift Go 14 SFG14-71 | |
| HP ProBook 445 G10 | |
| Dell Latitude 3440 | |
| Média Intel Core i5-1235U (785 - 1587, n=8) | |
| Schenker Work 14 Base | |
| Cinebench R15 / CPU Single 64Bit | |
| Média da turma Office (99.5 - 312, n=74, últimos 2 anos) | |
| Dell Latitude 3440 | |
| Acer Swift Go 14 SFG14-71 | |
| HP ProBook 445 G10 | |
| Lenovo ThinkPad L14 G4 21H6S00900 | |
| Schenker Work 14 Base | |
| Média Intel Core i5-1235U (151.5 - 242, n=8) | |
| Blender / v2.79 BMW27 CPU | |
| Schenker Work 14 Base | |
| Média Intel Core i5-1235U (366 - 662, n=8) | |
| Dell Latitude 3440 | |
| Acer Swift Go 14 SFG14-71 | |
| Lenovo ThinkPad L14 G4 21H6S00900 | |
| HP ProBook 445 G10 | |
| Média da turma Office (158 - 1940, n=73, últimos 2 anos) | |
| 7-Zip 18.03 / 7z b 4 | |
| Média da turma Office (7098 - 76886, n=75, últimos 2 anos) | |
| HP ProBook 445 G10 | |
| Lenovo ThinkPad L14 G4 21H6S00900 | |
| Dell Latitude 3440 | |
| Acer Swift Go 14 SFG14-71 | |
| Média Intel Core i5-1235U (20166 - 38643, n=8) | |
| Schenker Work 14 Base | |
| 7-Zip 18.03 / 7z b 4 -mmt1 | |
| Dell Latitude 3440 | |
| HP ProBook 445 G10 | |
| Média da turma Office (3387 - 6469, n=74, últimos 2 anos) | |
| Lenovo ThinkPad L14 G4 21H6S00900 | |
| Schenker Work 14 Base | |
| Acer Swift Go 14 SFG14-71 | |
| Média Intel Core i5-1235U (4371 - 5233, n=8) | |
| Geekbench 6.7 / Multi-Core | |
| Média da turma Office (757 - 17846, n=82, últimos 2 anos) | |
| Acer Swift Go 14 SFG14-71 | |
| Média Intel Core i5-1235U (6703 - 7046, n=2) | |
| Schenker Work 14 Base | |
| HP ProBook 445 G10 | |
| Geekbench 6.7 / Single-Core | |
| Média da turma Office (462 - 2894, n=83, últimos 2 anos) | |
| Acer Swift Go 14 SFG14-71 | |
| Média Intel Core i5-1235U (1981 - 2208, n=2) | |
| Schenker Work 14 Base | |
| HP ProBook 445 G10 | |
| Geekbench 5.5 / Multi-Core | |
| Média da turma Office (1483 - 16999, n=71, últimos 2 anos) | |
| Acer Swift Go 14 SFG14-71 | |
| Média Intel Core i5-1235U (5528 - 8571, n=10) | |
| Dell Latitude 3440 | |
| Schenker Work 14 Base | |
| HP ProBook 445 G10 | |
| Lenovo ThinkPad L14 G4 21H6S00900 | |
| Geekbench 5.5 / Single-Core | |
| Média da turma Office (811 - 2128, n=71, últimos 2 anos) | |
| Dell Latitude 3440 | |
| Acer Swift Go 14 SFG14-71 | |
| Schenker Work 14 Base | |
| Média Intel Core i5-1235U (1426 - 1643, n=10) | |
| HP ProBook 445 G10 | |
| Lenovo ThinkPad L14 G4 21H6S00900 | |
| HWBOT x265 Benchmark v2.2 / 4k Preset | |
| Média da turma Office (2.21 - 26, n=73, últimos 2 anos) | |
| Lenovo ThinkPad L14 G4 21H6S00900 | |
| HP ProBook 445 G10 | |
| Acer Swift Go 14 SFG14-71 | |
| Dell Latitude 3440 | |
| Schenker Work 14 Base | |
| Média Intel Core i5-1235U (4.99 - 9.43, n=8) | |
| LibreOffice / 20 Documents To PDF | |
| Média da turma Office (41.5 - 102.3, n=73, últimos 2 anos) | |
| Acer Swift Go 14 SFG14-71 | |
| HP ProBook 445 G10 | |
| Média Intel Core i5-1235U (42.4 - 65.5, n=8) | |
| Dell Latitude 3440 | |
| Schenker Work 14 Base | |
| Lenovo ThinkPad L14 G4 21H6S00900 | |
| R Benchmark 2.5 / Overall mean | |
| Lenovo ThinkPad L14 G4 21H6S00900 | |
| Média da turma Office (0.4098 - 0.888, n=73, últimos 2 anos) | |
| HP ProBook 445 G10 | |
| Média Intel Core i5-1235U (0.4986 - 0.603, n=8) | |
| Acer Swift Go 14 SFG14-71 | |
| Schenker Work 14 Base | |
| Dell Latitude 3440 | |
* ... menor é melhor
AIDA64: FP32 Ray-Trace | FPU Julia | CPU SHA3 | CPU Queen | FPU SinJulia | FPU Mandel | CPU AES | CPU ZLib | FP64 Ray-Trace | CPU PhotoWorxx
| Performance rating | |
| Média da turma Office | |
| Lenovo ThinkPad L14 G4 21H6S00900 | |
| HP ProBook 445 G10 | |
| Dell Latitude 3440 | |
| Acer Swift Go 14 SFG14-71 | |
| Média Intel Core i5-1235U | |
| Schenker Work 14 Base | |
| AIDA64 / FP32 Ray-Trace | |
| Média da turma Office (2083 - 31245, n=79, últimos 2 anos) | |
| HP ProBook 445 G10 | |
| Lenovo ThinkPad L14 G4 21H6S00900 | |
| Dell Latitude 3440 | |
| Acer Swift Go 14 SFG14-71 | |
| Schenker Work 14 Base | |
| Média Intel Core i5-1235U (3078 - 7457, n=8) | |
| AIDA64 / FPU Julia | |
| Média da turma Office (8191 - 125394, n=79, últimos 2 anos) | |
| Lenovo ThinkPad L14 G4 21H6S00900 | |
| HP ProBook 445 G10 | |
| Dell Latitude 3440 | |
| Acer Swift Go 14 SFG14-71 | |
| Schenker Work 14 Base | |
| Média Intel Core i5-1235U (15838 - 37760, n=8) | |
| AIDA64 / CPU SHA3 | |
| Média da turma Office (433 - 5755, n=79, últimos 2 anos) | |
| Lenovo ThinkPad L14 G4 21H6S00900 | |
| HP ProBook 445 G10 | |
| Dell Latitude 3440 | |
| Schenker Work 14 Base | |
| Acer Swift Go 14 SFG14-71 | |
| Média Intel Core i5-1235U (978 - 2072, n=8) | |
| AIDA64 / CPU Queen | |
| Lenovo ThinkPad L14 G4 21H6S00900 | |
| HP ProBook 445 G10 | |
| Média da turma Office (22784 - 115197, n=69, últimos 2 anos) | |
| Dell Latitude 3440 | |
| Média Intel Core i5-1235U (45680 - 62404, n=8) | |
| Acer Swift Go 14 SFG14-71 | |
| Schenker Work 14 Base | |
| AIDA64 / FPU SinJulia | |
| HP ProBook 445 G10 | |
| Lenovo ThinkPad L14 G4 21H6S00900 | |
| Média da turma Office (1378 - 18321, n=79, últimos 2 anos) | |
| Dell Latitude 3440 | |
| Média Intel Core i5-1235U (3099 - 4644, n=8) | |
| Acer Swift Go 14 SFG14-71 | |
| Schenker Work 14 Base | |
| AIDA64 / FPU Mandel | |
| Lenovo ThinkPad L14 G4 21H6S00900 | |
| HP ProBook 445 G10 | |
| Média da turma Office (4601 - 66922, n=79, últimos 2 anos) | |
| Dell Latitude 3440 | |
| Acer Swift Go 14 SFG14-71 | |
| Schenker Work 14 Base | |
| Média Intel Core i5-1235U (8046 - 18819, n=8) | |
| AIDA64 / CPU AES | |
| Lenovo ThinkPad L14 G4 21H6S00900 | |
| Média da turma Office (4854 - 155900, n=79, últimos 2 anos) | |
| Dell Latitude 3440 | |
| Média Intel Core i5-1235U (23386 - 67140, n=8) | |
| Acer Swift Go 14 SFG14-71 | |
| HP ProBook 445 G10 | |
| Schenker Work 14 Base | |
| AIDA64 / CPU ZLib | |
| Média da turma Office (114.6 - 1366, n=79, últimos 2 anos) | |
| Dell Latitude 3440 | |
| HP ProBook 445 G10 | |
| Lenovo ThinkPad L14 G4 21H6S00900 | |
| Schenker Work 14 Base | |
| Média Intel Core i5-1235U (329 - 633, n=8) | |
| Acer Swift Go 14 SFG14-71 | |
| AIDA64 / FP64 Ray-Trace | |
| Média da turma Office (1109 - 17834, n=79, últimos 2 anos) | |
| HP ProBook 445 G10 | |
| Lenovo ThinkPad L14 G4 21H6S00900 | |
| Dell Latitude 3440 | |
| Schenker Work 14 Base | |
| Acer Swift Go 14 SFG14-71 | |
| Média Intel Core i5-1235U (1670 - 3928, n=8) | |
| AIDA64 / CPU PhotoWorxx | |
| Média da turma Office (11090 - 65229, n=79, últimos 2 anos) | |
| Acer Swift Go 14 SFG14-71 | |
| Média Intel Core i5-1235U (15933 - 41909, n=8) | |
| Schenker Work 14 Base | |
| Dell Latitude 3440 | |
| HP ProBook 445 G10 | |
| Lenovo ThinkPad L14 G4 21H6S00900 | |
Desempenho do sistema
No uso diário, o desempenho do laptop é decente, embora o SSD PCIe também tenha um papel importante nisso. Durante nosso teste, em nenhum momento notamos problemas com a estabilidade do sistema e, se necessário, a RAM do dispositivo pode ser expandida para até 64 GB.
CrossMark: Overall | Productivity | Creativity | Responsiveness
WebXPRT 3: Overall
WebXPRT 4: Overall
Mozilla Kraken 1.1: Total
| PCMark 10 / Score | |
| Média da turma Office (2601 - 9298, n=63, últimos 2 anos) | |
| Lenovo ThinkPad L14 G4 21H6S00900 | |
| HP ProBook 445 G10 | |
| Acer Swift Go 14 SFG14-71 | |
| Dell Latitude 3440 | |
| Média Intel Core i5-1235U, Intel Iris Xe Graphics G7 80EUs (4528 - 5543, n=8) | |
| Schenker Work 14 Base | |
| PCMark 10 / Essentials | |
| Lenovo ThinkPad L14 G4 21H6S00900 | |
| Dell Latitude 3440 | |
| HP ProBook 445 G10 | |
| Acer Swift Go 14 SFG14-71 | |
| Média da turma Office (3245 - 11594, n=63, últimos 2 anos) | |
| Média Intel Core i5-1235U, Intel Iris Xe Graphics G7 80EUs (9143 - 11273, n=8) | |
| Schenker Work 14 Base | |
| PCMark 10 / Productivity | |
| HP ProBook 445 G10 | |
| Média da turma Office (5336 - 17243, n=63, últimos 2 anos) | |
| Lenovo ThinkPad L14 G4 21H6S00900 | |
| Acer Swift Go 14 SFG14-71 | |
| Dell Latitude 3440 | |
| Média Intel Core i5-1235U, Intel Iris Xe Graphics G7 80EUs (6440 - 7354, n=8) | |
| Schenker Work 14 Base | |
| PCMark 10 / Digital Content Creation | |
| Média da turma Office (2049 - 13541, n=63, últimos 2 anos) | |
| Acer Swift Go 14 SFG14-71 | |
| Dell Latitude 3440 | |
| Schenker Work 14 Base | |
| Lenovo ThinkPad L14 G4 21H6S00900 | |
| Média Intel Core i5-1235U, Intel Iris Xe Graphics G7 80EUs (4220 - 5839, n=8) | |
| HP ProBook 445 G10 | |
| CrossMark / Overall | |
| Média da turma Office (381 - 2010, n=74, últimos 2 anos) | |
| Acer Swift Go 14 SFG14-71 | |
| Dell Latitude 3440 | |
| Média Intel Core i5-1235U, Intel Iris Xe Graphics G7 80EUs (983 - 1644, n=8) | |
| Schenker Work 14 Base | |
| Lenovo ThinkPad L14 G4 21H6S00900 | |
| CrossMark / Productivity | |
| Acer Swift Go 14 SFG14-71 | |
| Média da turma Office (464 - 1880, n=74, últimos 2 anos) | |
| Dell Latitude 3440 | |
| Média Intel Core i5-1235U, Intel Iris Xe Graphics G7 80EUs (1026 - 1676, n=8) | |
| Schenker Work 14 Base | |
| Lenovo ThinkPad L14 G4 21H6S00900 | |
| CrossMark / Creativity | |
| Média da turma Office (319 - 2361, n=74, últimos 2 anos) | |
| Dell Latitude 3440 | |
| Acer Swift Go 14 SFG14-71 | |
| Média Intel Core i5-1235U, Intel Iris Xe Graphics G7 80EUs (1032 - 1618, n=8) | |
| Schenker Work 14 Base | |
| Lenovo ThinkPad L14 G4 21H6S00900 | |
| CrossMark / Responsiveness | |
| Acer Swift Go 14 SFG14-71 | |
| Média Intel Core i5-1235U, Intel Iris Xe Graphics G7 80EUs (746 - 1867, n=8) | |
| Média da turma Office (360 - 1690, n=74, últimos 2 anos) | |
| Dell Latitude 3440 | |
| Schenker Work 14 Base | |
| Lenovo ThinkPad L14 G4 21H6S00900 | |
| WebXPRT 3 / Overall | |
| Média da turma Office (129.9 - 455, n=73, últimos 2 anos) | |
| Dell Latitude 3440 | |
| Média Intel Core i5-1235U, Intel Iris Xe Graphics G7 80EUs (233 - 305, n=11) | |
| Lenovo ThinkPad L14 G4 21H6S00900 | |
| Acer Swift Go 14 SFG14-71 | |
| Schenker Work 14 Base | |
| WebXPRT 4 / Overall | |
| Dell Latitude 3440 | |
| Média da turma Office (104.2 - 313, n=75, últimos 2 anos) | |
| Média Intel Core i5-1235U, Intel Iris Xe Graphics G7 80EUs (206 - 236, n=10) | |
| Schenker Work 14 Base | |
| Lenovo ThinkPad L14 G4 21H6S00900 | |
| Mozilla Kraken 1.1 / Total | |
| Lenovo ThinkPad L14 G4 21H6S00900 | |
| Schenker Work 14 Base | |
| Média Intel Core i5-1235U, Intel Iris Xe Graphics G7 80EUs (486 - 634, n=11) | |
| Média da turma Office (391 - 1297, n=76, últimos 2 anos) | |
| Acer Swift Go 14 SFG14-71 | |
| Acer Swift Go 14 SFG14-71 | |
| Dell Latitude 3440 | |
* ... menor é melhor
| PCMark 10 Score | 4873 pontos | |
Ajuda | ||
| AIDA64 / Memory Copy | |
| Média da turma Office (20075 - 110930, n=76, últimos 2 anos) | |
| Acer Swift Go 14 SFG14-71 | |
| Média Intel Core i5-1235U (24653 - 61921, n=8) | |
| Schenker Work 14 Base | |
| Dell Latitude 3440 | |
| HP ProBook 445 G10 | |
| Lenovo ThinkPad L14 G4 21H6S00900 | |
| AIDA64 / Memory Read | |
| Média da turma Office (10084 - 128030, n=77, últimos 2 anos) | |
| Média Intel Core i5-1235U (24441 - 66108, n=8) | |
| Schenker Work 14 Base | |
| Acer Swift Go 14 SFG14-71 | |
| Dell Latitude 3440 | |
| HP ProBook 445 G10 | |
| Lenovo ThinkPad L14 G4 21H6S00900 | |
| AIDA64 / Memory Write | |
| Média da turma Office (20073 - 119858, n=77, últimos 2 anos) | |
| Acer Swift Go 14 SFG14-71 | |
| Média Intel Core i5-1235U (25156 - 75808, n=8) | |
| Schenker Work 14 Base | |
| Dell Latitude 3440 | |
| HP ProBook 445 G10 | |
| Lenovo ThinkPad L14 G4 21H6S00900 | |
| AIDA64 / Memory Latency | |
| Acer Swift Go 14 SFG14-71 | |
| Média da turma Office (7.6 - 162.9, n=72, últimos 2 anos) | |
| Lenovo ThinkPad L14 G4 21H6S00900 | |
| HP ProBook 445 G10 | |
| Média Intel Core i5-1235U (76.3 - 119, n=8) | |
| Schenker Work 14 Base | |
| Dell Latitude 3440 | |
* ... menor é melhor
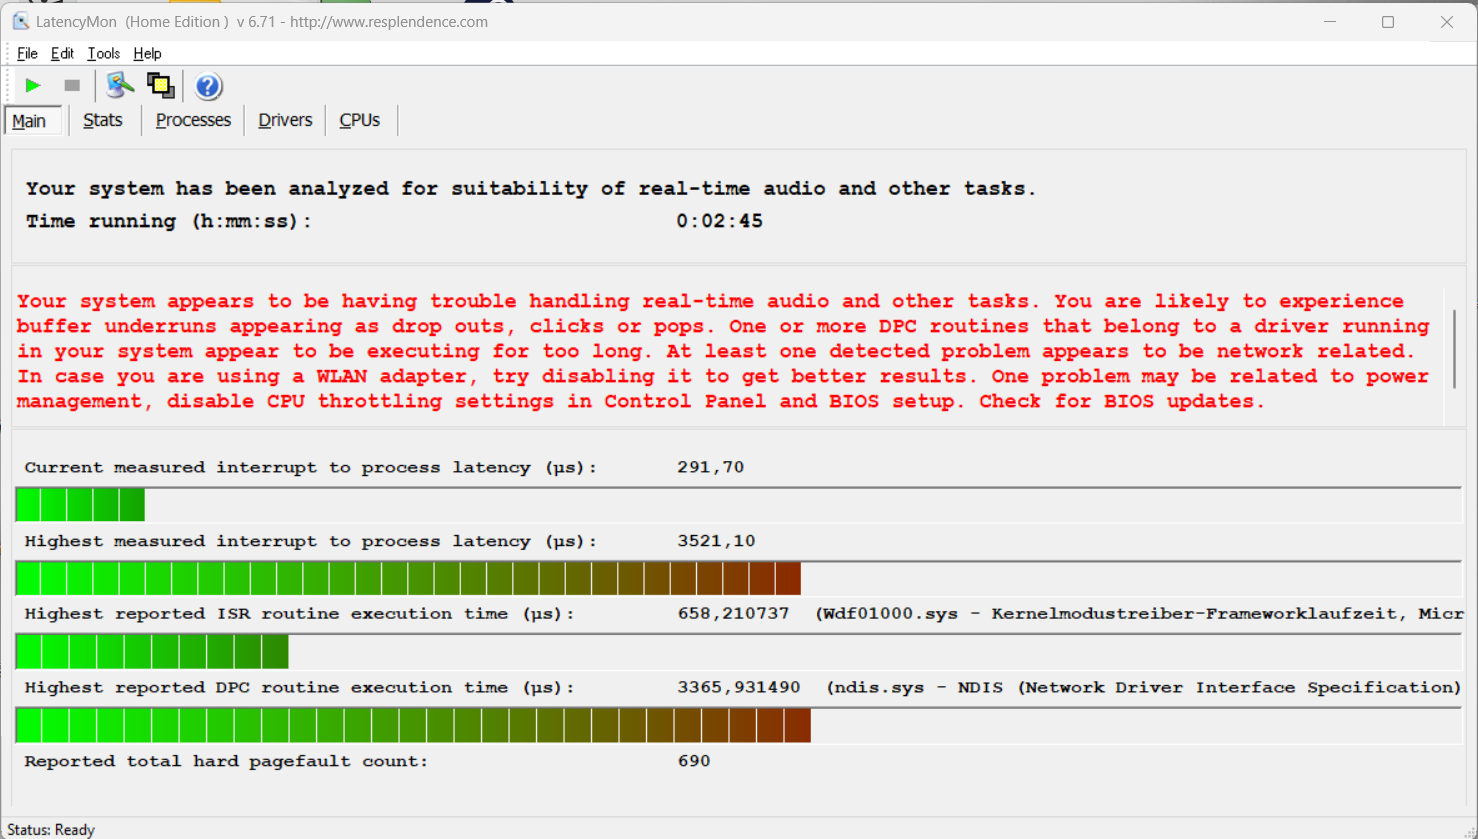
Latências de DPC
Durante nosso teste de latência padronizado, o dispositivo de teste com a versão atual do BIOS mostrou limitações ao usar aplicativos de áudio em tempo real.
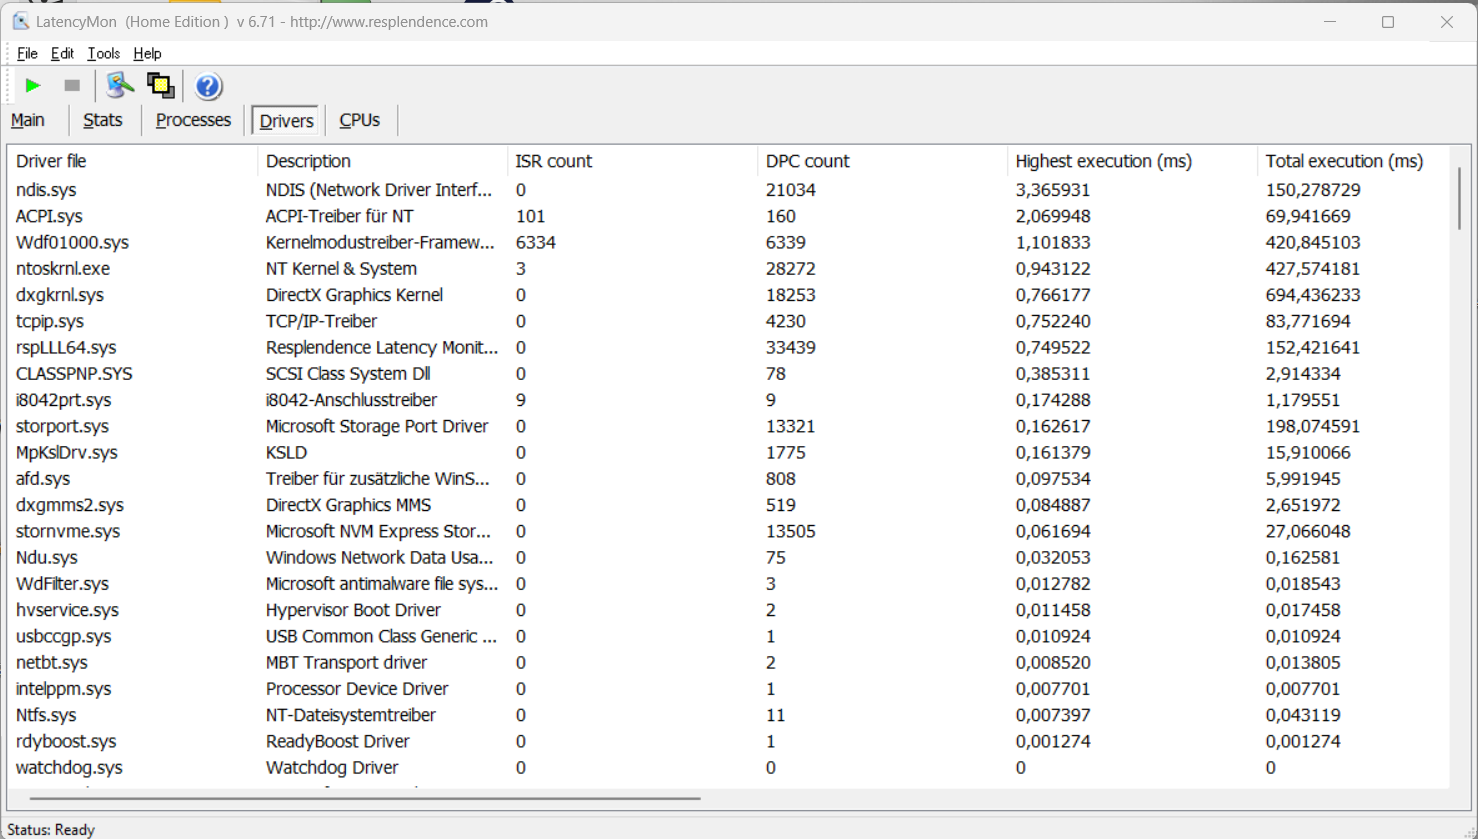
| DPC Latencies / LatencyMon - interrupt to process latency (max), Web, Youtube, Prime95 | |
| Schenker Work 14 Base | |
| Dell Latitude 3440 | |
| Lenovo ThinkPad L14 G4 21H6S00900 | |
| HP ProBook 445 G10 | |
| Acer Swift Go 14 SFG14-71 | |
* ... menor é melhor
Dispositivo de armazenamento
O Work 14 apresenta um slot PCIe 4.0 rápido para SSDs M.2-2280. Nosso dispositivo de teste está equipado com a versão de 500 GB do Samsung 980, que oferece taxas de transferência decentes e estáveis. Após a primeira inicialização do laptop, os usuários têm 422 GB disponíveis para uso. Outros benchmarks de SSDs podem ser encontrados aqui.

* ... menor é melhor
Reading continuous performance: DiskSpd Read Loop, Queue Depth 8
Placa de vídeo
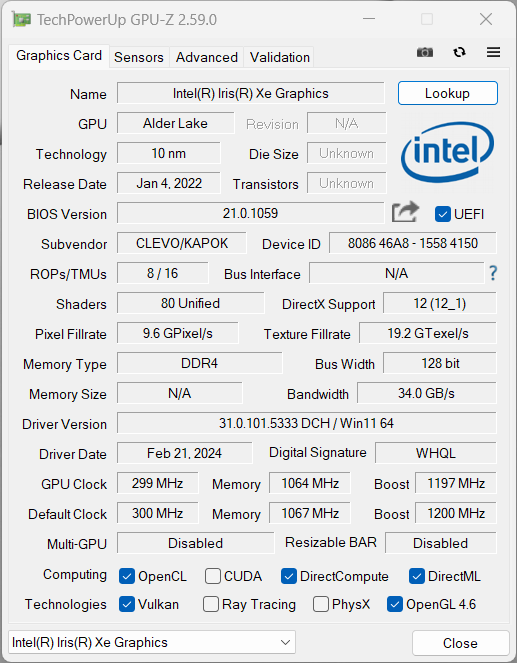
Os cálculos gráficos ficam a cargo da placa de vídeo integrada Iris Xe Graphics G7 (80 EUs). A iGPU lida bem com as tarefas diárias, incluindo a reprodução de vídeos de alta resolução, mas o senhor não deve esperar muito mais dela. No entanto, o mesmo pode ser dito de seus concorrentes que também estão equipados com a GPU Iris ou, no caso do HP ProBook 445a desatualizada AMD RX Vega 7.
Nossos benchmarks de jogos mostraram claramente que o Work 14 Base é pouco adequado para jogos. Mesmo ao executar jogos mais antigos ou menos exigentes, o senhor geralmente fica limitado a níveis de detalhes baixos.
Sob carga permanente, seu desempenho gráfico não permanece completamente estável e cai cerca de 10%. Durante o uso da bateria, não notamos nenhuma outra queda no desempenho. Outros benchmarks de GPU podem ser encontrados em aqui.
| 3DMark 11 Performance | 5431 pontos | |
| 3DMark Fire Strike Score | 3537 pontos | |
| 3DMark Time Spy Score | 1331 pontos | |
Ajuda | ||
| Blender / v3.3 Classroom HIP/AMD | |
| Lenovo ThinkPad L14 G4 21H6S00900 | |
| HP ProBook 445 G10 | |
| Média da turma Office (296 - 507, n=5, últimos 2 anos) | |
| Blender / v3.3 Classroom CPU | |
| Schenker Work 14 Base | |
| Média Intel Iris Xe Graphics G7 80EUs (463 - 3047, n=53) | |
| Dell Latitude 3440 | |
| Lenovo ThinkPad L14 G4 21H6S00900 | |
| Acer Swift Go 14 SFG14-71 | |
| HP ProBook 445 G10 | |
| Média da turma Office (245 - 3219, n=72, últimos 2 anos) | |
* ... menor é melhor
| Performance rating - Percent | |
| Média da turma Office | |
| Acer Swift Go 14 SFG14-71 | |
| Dell Latitude 3440 | |
| Schenker Work 14 Base | |
| HP ProBook 445 G10 | |
| Lenovo ThinkPad L14 G4 21H6S00900 | |
| The Witcher 3 - 1920x1080 Ultra Graphics & Postprocessing (HBAO+) | |
| Média da turma Office (14.8 - 18.1, n=4, últimos 2 anos) | |
| Acer Swift Go 14 SFG14-71 | |
| HP ProBook 445 G10 | |
| Dell Latitude 3440 | |
| Schenker Work 14 Base | |
| Lenovo ThinkPad L14 G4 21H6S00900 | |
| GTA V - 1920x1080 Highest AA:4xMSAA + FX AF:16x | |
| Média da turma Office (5.77 - 45.3, n=65, últimos 2 anos) | |
| Acer Swift Go 14 SFG14-71 | |
| Lenovo ThinkPad L14 G4 21H6S00900 | |
| Schenker Work 14 Base | |
| HP ProBook 445 G10 | |
| Dell Latitude 3440 | |
| Final Fantasy XV Benchmark - 1920x1080 High Quality | |
| Média da turma Office (8.09 - 79.5, n=67, últimos 2 anos) | |
| Acer Swift Go 14 SFG14-71 | |
| Dell Latitude 3440 | |
| Schenker Work 14 Base | |
| HP ProBook 445 G10 | |
| Lenovo ThinkPad L14 G4 21H6S00900 | |
| Strange Brigade - 1920x1080 ultra AA:ultra AF:16 | |
| Média da turma Office (12.9 - 142.1, n=50, últimos 2 anos) | |
| Acer Swift Go 14 SFG14-71 | |
| Dell Latitude 3440 | |
| Schenker Work 14 Base | |
| HP ProBook 445 G10 | |
| Lenovo ThinkPad L14 G4 21H6S00900 | |
| Dota 2 Reborn - 1920x1080 ultra (3/3) best looking | |
| Acer Swift Go 14 SFG14-71 | |
| Média da turma Office (14.6 - 135, n=73, últimos 2 anos) | |
| Dell Latitude 3440 | |
| Schenker Work 14 Base | |
| HP ProBook 445 G10 | |
| Lenovo ThinkPad L14 G4 21H6S00900 | |
| X-Plane 11.11 - 1920x1080 high (fps_test=3) | |
| Média da turma Office (12 - 82.4, n=64, últimos 2 anos) | |
| Dell Latitude 3440 | |
| HP ProBook 445 G10 | |
| Lenovo ThinkPad L14 G4 21H6S00900 | |
| Schenker Work 14 Base | |
| Acer Swift Go 14 SFG14-71 | |
Witcher 3 FPS diagram
| baixo | média | alto | ultra | |
|---|---|---|---|---|
| GTA V (2015) | 76.2 | 66.4 | 15.8 | 6.87 |
| The Witcher 3 (2015) | 66 | 43 | 23 | 9.6 |
| Dota 2 Reborn (2015) | 82.5 | 60 | 46.6 | 41.9 |
| Final Fantasy XV Benchmark (2018) | 30.2 | 17.4 | 12.1 | |
| X-Plane 11.11 (2018) | 30.2 | 23.7 | 21.8 | |
| Far Cry 5 (2018) | 36 | 20 | 19 | 17 |
| Strange Brigade (2018) | 64.6 | 28.3 | 22.4 | 17.6 |
| F1 23 (2023) | 29.3 | 26.7 | 18.3 |
Emissões e energia
Emissões de ruído
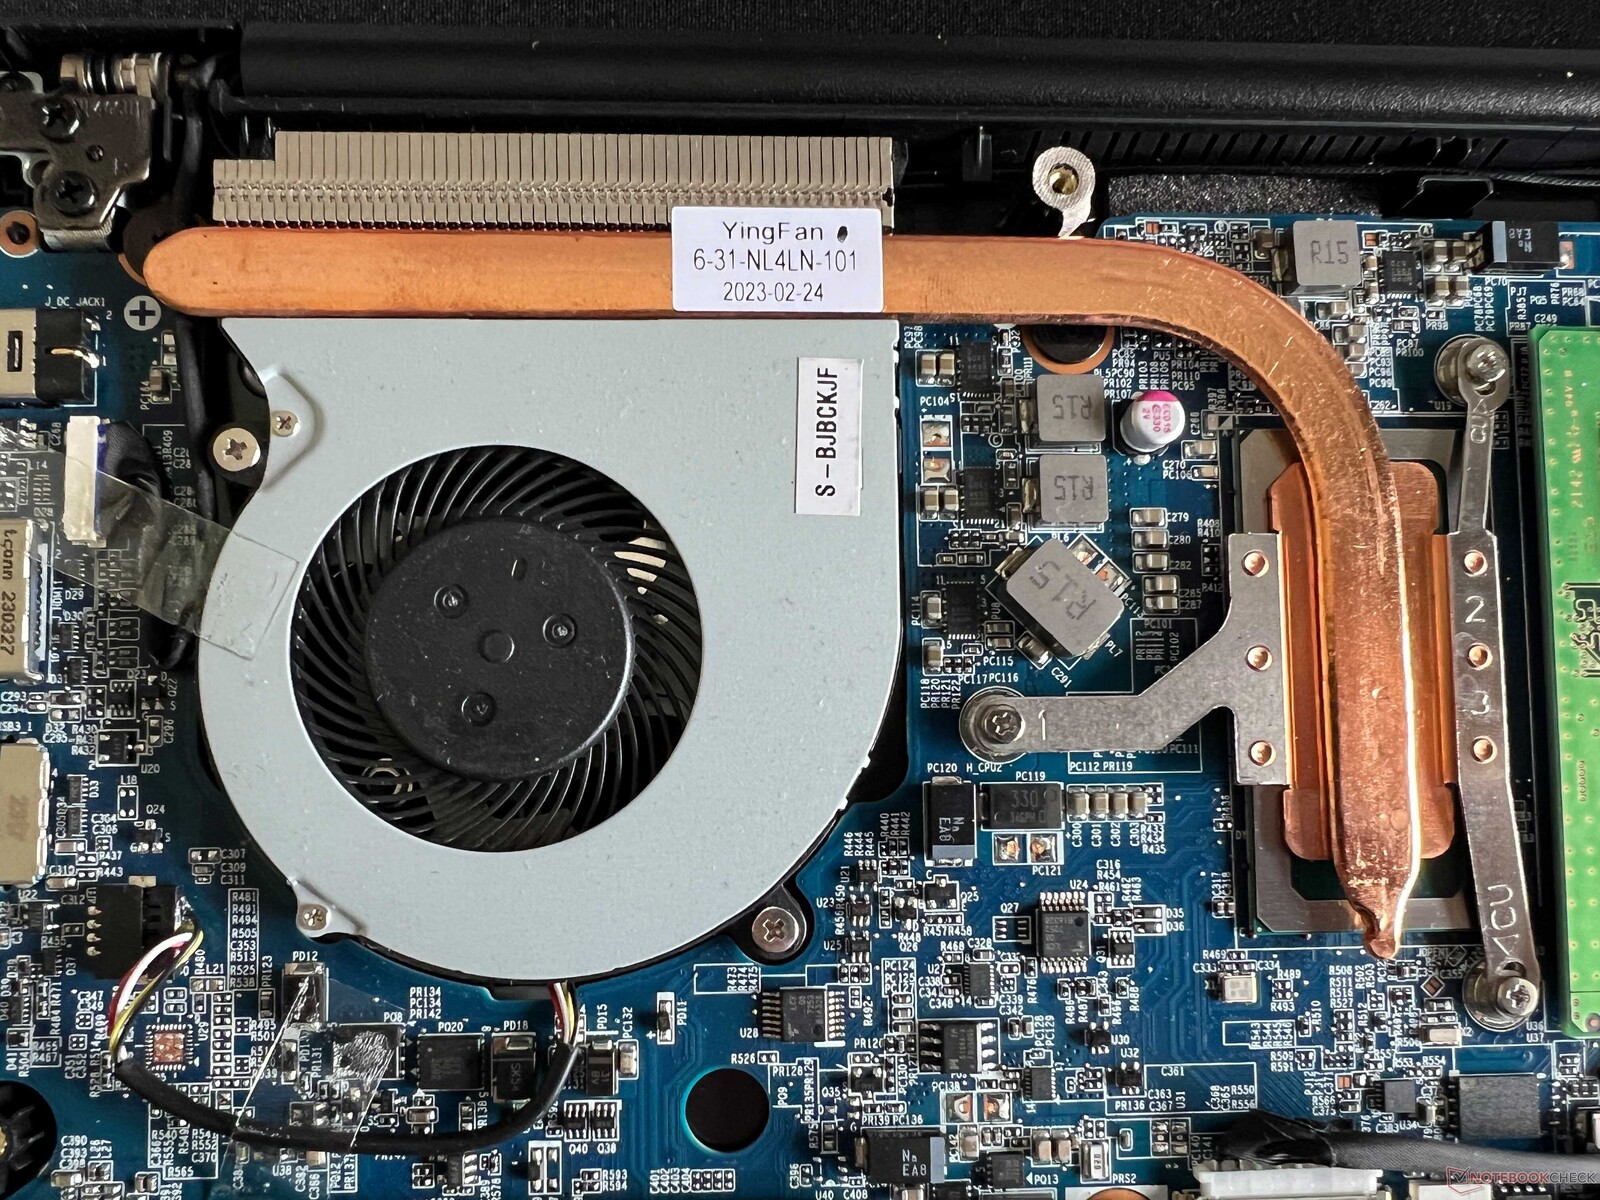
Uma única ventoinha é usada para resfriar o laptop. Quando em marcha lenta e com pouca carga, ela permanece bastante silenciosa, mas se o sistema for mais exigido, a ventoinha fica bastante alta (35 dB(A)) e, além disso, emite um ruído de alta frequência. Durante o teste de estresse, seus 43 dB(A) são muito altos, principalmente quando o senhor leva em conta o baixo desempenho do laptop. Não notamos nenhum ruído eletrônico adicional vindo do nosso dispositivo de teste.
Barulho
| Ocioso |
| 23.6 / 23.6 / 24.8 dB |
| Carga |
| 34.2 / 42.9 dB |
 | ||
30 dB silencioso 40 dB(A) audível 50 dB(A) ruidosamente alto |
||
min: | ||
| Schenker Work 14 Base Iris Xe G7 80EUs, i5-1235U, Samsung SSD 980 500GB (MZ-V8V500BW) | Acer Swift Go 14 SFG14-71 Iris Xe G7 80EUs, i5-1335U, WD PC SN740 SDDQNQD-512G-1014 | HP ProBook 445 G10 Vega 7, R5 7530U, Kioxia BG5 KBG50ZNS512G | Dell Latitude 3440 Iris Xe G7 80EUs, i5-1345U, Samsung PM9A1 MZVL2512HCJQ | Lenovo ThinkPad L14 G4 21H6S00900 Vega 7, R5 7530U, Kioxia BG5 KBG5AZNT512G | |
|---|---|---|---|---|---|
| Noise | -5% | -1% | -3% | -3% | |
| desligado / ambiente * (dB) | 23.6 | 24.9 -6% | 24 -2% | 23.9 -1% | 25.2 -7% |
| Idle Minimum * (dB) | 23.6 | 24.9 -6% | 24 -2% | 24.4 -3% | 25.2 -7% |
| Idle Average * (dB) | 23.6 | 24.9 -6% | 25 -6% | 24.4 -3% | 25.2 -7% |
| Idle Maximum * (dB) | 24.8 | 24.9 -0% | 28 -13% | 24.4 2% | 27.3 -10% |
| Load Average * (dB) | 34.2 | 31.9 7% | 33 4% | 37.1 -8% | 32.1 6% |
| Witcher 3 ultra * (dB) | 34.2 | 43.2 -26% | 36 -5% | 38.2 -12% | 35.7 -4% |
| Load Maximum * (dB) | 42.9 | 43.2 -1% | 36 16% | 40.2 6% | 38.3 11% |
* ... menor é melhor
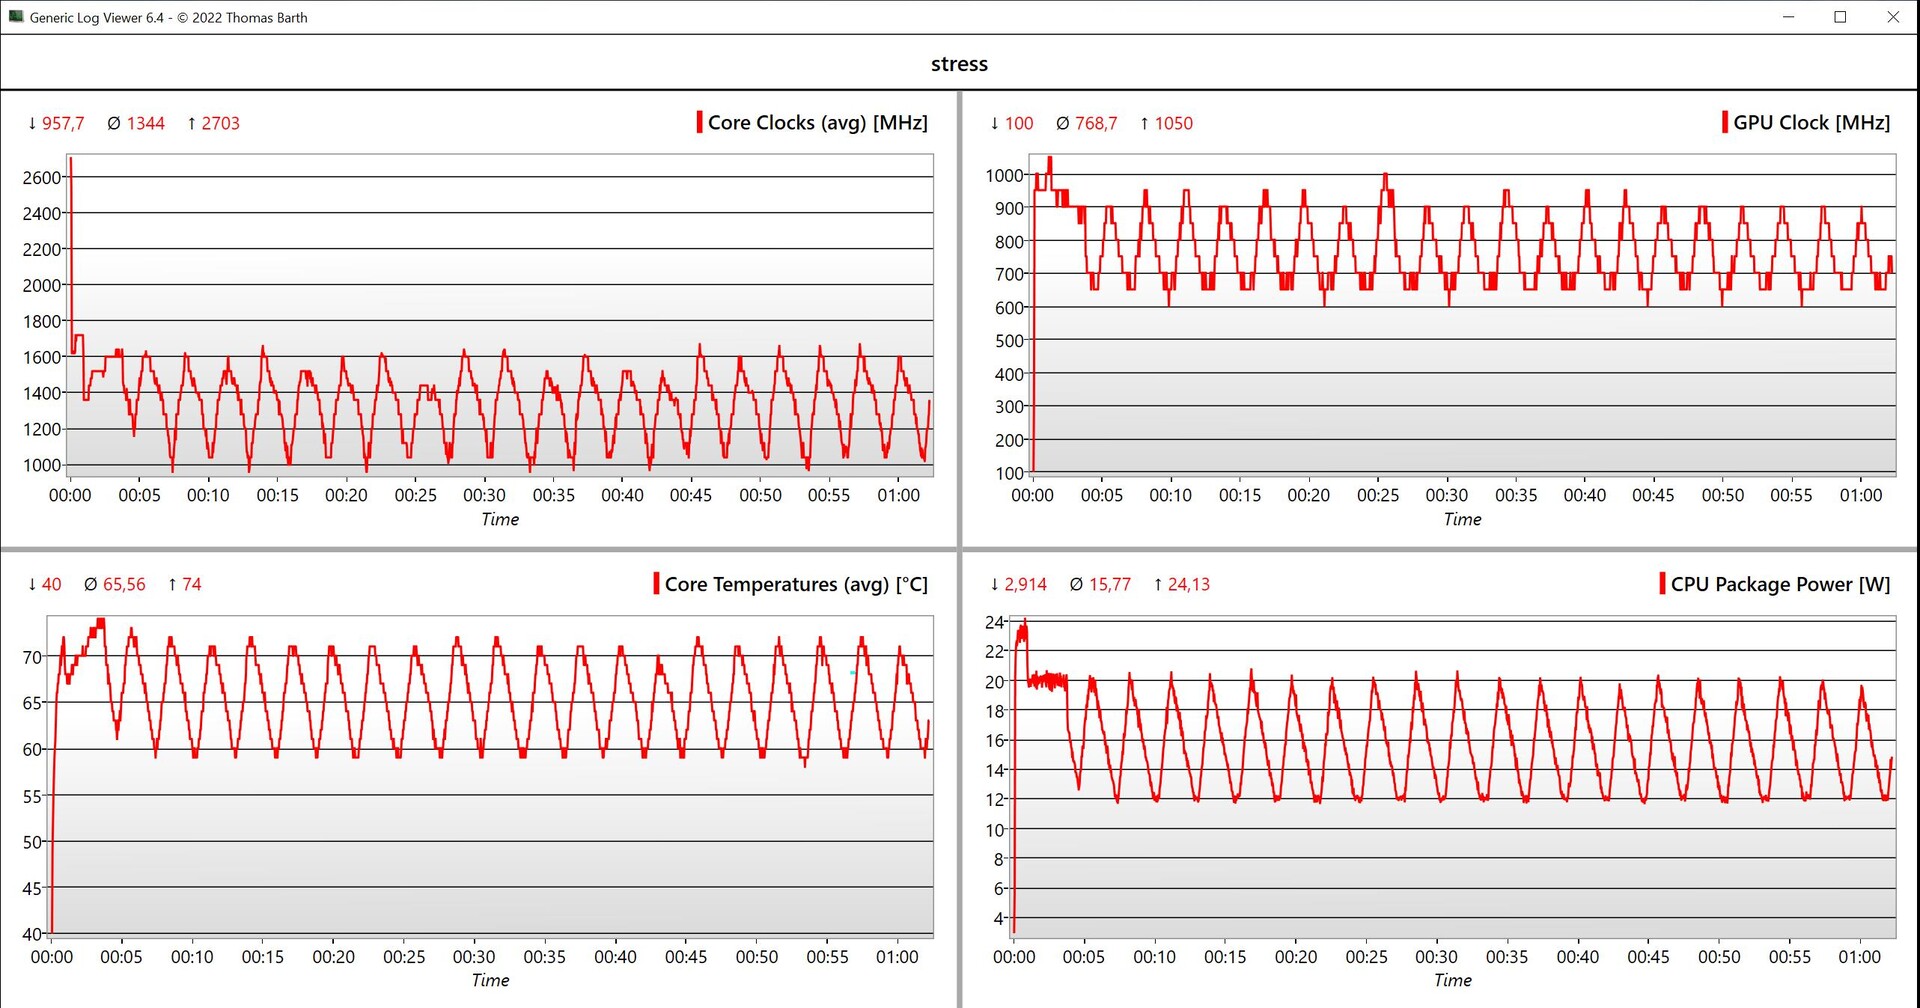
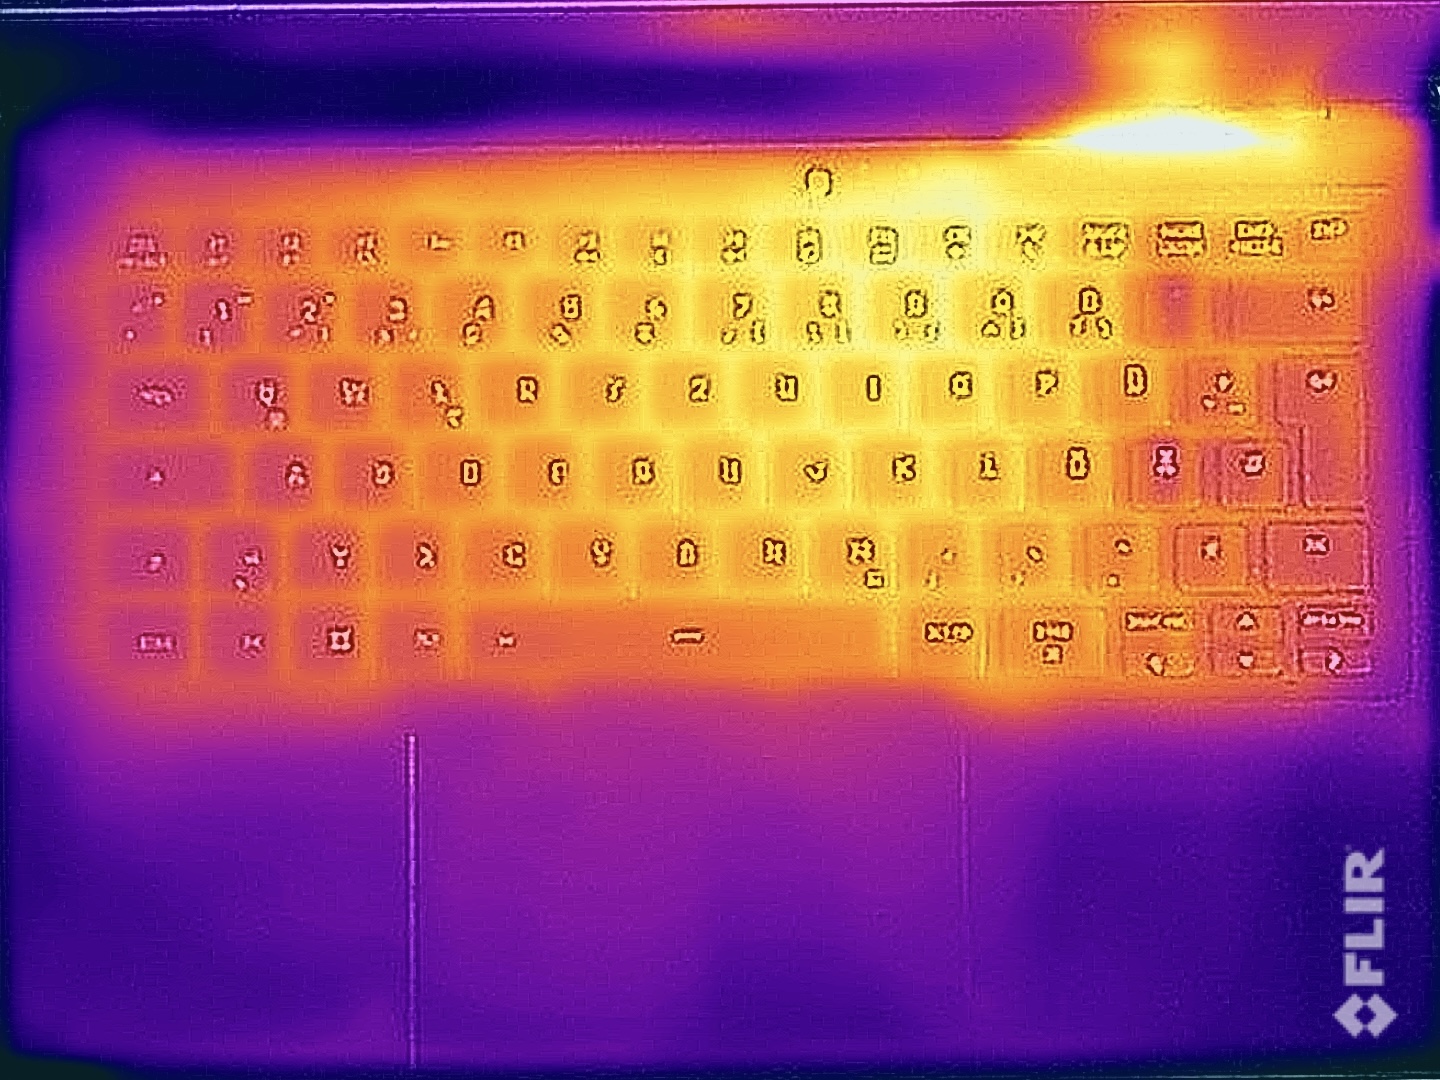
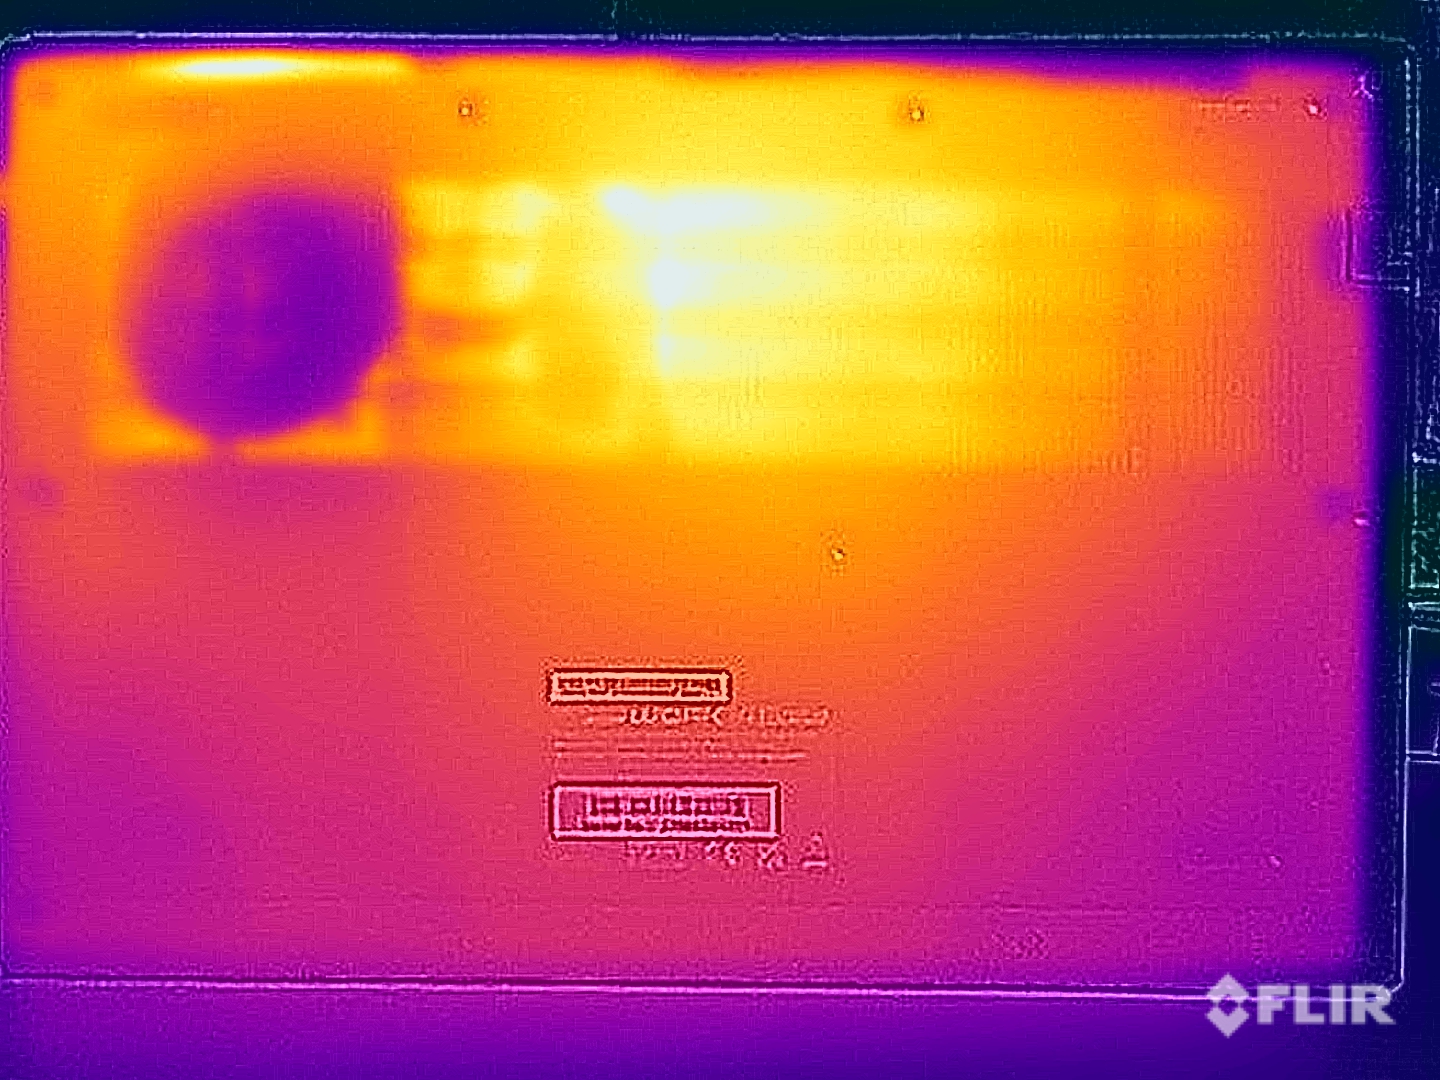
Temperatura
As temperaturas da superfície não são críticas e, mesmo sob carga total, é possível colocar o Work 14 sobre as coxas sem problemas, além disso, os dedos não ficam quentes ao digitar. Durante o teste de estresse, o processador consumiu 20 watts por alguns minutos e, durante o curso seguinte, equilibrou-se entre 12 e 20 watts.
(+) A temperatura máxima no lado superior é 39.2 °C / 103 F, em comparação com a média de 34.3 °C / 94 F , variando de 21.2 a 62.5 °C para a classe Office.
(±) A parte inferior aquece até um máximo de 40.4 °C / 105 F, em comparação com a média de 36.8 °C / 98 F
(+) Em uso inativo, a temperatura média para o lado superior é 24.4 °C / 76 F, em comparação com a média do dispositivo de 29.5 °C / ### class_avg_f### F.
(±) Jogando The Witcher 3, a temperatura média para o lado superior é 33.3 °C / 92 F, em comparação com a média do dispositivo de 29.5 °C / ## #class_avg_f### F.
(+) Os apoios para as mãos e o touchpad são mais frios que a temperatura da pele, com um máximo de 27 °C / 80.6 F e, portanto, são frios ao toque.
(±) A temperatura média da área do apoio para as mãos de dispositivos semelhantes foi 27.5 °C / 81.5 F (+0.5 °C / 0.9 F).
| Schenker Work 14 Base Intel Core i5-1235U, Intel Iris Xe Graphics G7 80EUs | Acer Swift Go 14 SFG14-71 Intel Core i5-1335U, Intel Iris Xe Graphics G7 80EUs | HP ProBook 445 G10 AMD Ryzen 5 7530U, AMD Radeon RX Vega 7 | Dell Latitude 3440 Intel Core i5-1345U, Intel Iris Xe Graphics G7 80EUs | Lenovo ThinkPad L14 G4 21H6S00900 AMD Ryzen 5 7530U, AMD Radeon RX Vega 7 | |
|---|---|---|---|---|---|
| Heat | -12% | -15% | -8% | -16% | |
| Maximum Upper Side * (°C) | 39.2 | 44.8 -14% | 43 -10% | 35.2 10% | 39 1% |
| Maximum Bottom * (°C) | 40.4 | 34.8 14% | 51 -26% | 41 -1% | 46.3 -15% |
| Idle Upper Side * (°C) | 25.3 | 30.7 -21% | 27 -7% | 29.8 -18% | 26.3 -4% |
| Idle Bottom * (°C) | 25.8 | 32.5 -26% | 30 -16% | 32 -24% | 37.5 -45% |
* ... menor é melhor
Alto-falantes
Os dois alto-falantes estéreo do laptop podem atingir um volume máximo alto, mas sua qualidade geral é extremamente fraca e é um dos principais pontos fracos do Work 14. Embora os laptops de escritório baratos nunca sejam realmente famosos por seu som impressionante, o Dell Latitude 14 da Dell mostra que é possível fazer mais. O restante da concorrência também está em vantagem nesse aspecto.
Schenker Work 14 Base análise de áudio
(+) | os alto-falantes podem tocar relativamente alto (###valor### dB)
Graves 100 - 315Hz
(-) | quase nenhum baixo - em média 22.8% menor que a mediana
(±) | a linearidade dos graves é média (8.6% delta para a frequência anterior)
Médios 400 - 2.000 Hz
(±) | médios mais altos - em média 9.7% maior que a mediana
(±) | a linearidade dos médios é média (11.7% delta para frequência anterior)
Altos 2 - 16 kHz
(+) | agudos equilibrados - apenas 4.6% longe da mediana
(±) | a linearidade dos máximos é média (8.5% delta para frequência anterior)
Geral 100 - 16.000 Hz
(±) | a linearidade do som geral é média (25.9% diferença em relação à mediana)
Comparado com a mesma classe
» 79% de todos os dispositivos testados nesta classe foram melhores, 7% semelhantes, 14% piores
» O melhor teve um delta de 7%, a média foi 21%, o pior foi 53%
Comparado com todos os dispositivos testados
» 80% de todos os dispositivos testados foram melhores, 4% semelhantes, 16% piores
» O melhor teve um delta de 4%, a média foi 24%, o pior foi 134%
Dell Latitude 3440 análise de áudio
(+) | os alto-falantes podem tocar relativamente alto (###valor### dB)
Graves 100 - 315Hz
(±) | graves reduzidos - em média 14.6% menor que a mediana
(±) | a linearidade dos graves é média (9.8% delta para a frequência anterior)
Médios 400 - 2.000 Hz
(+) | médios equilibrados - apenas 3% longe da mediana
(+) | médios são lineares (3.5% delta para frequência anterior)
Altos 2 - 16 kHz
(+) | agudos equilibrados - apenas 4.2% longe da mediana
(+) | os máximos são lineares (5.9% delta da frequência anterior)
Geral 100 - 16.000 Hz
(+) | o som geral é linear (11.6% diferença em relação à mediana)
Comparado com a mesma classe
» 3% de todos os dispositivos testados nesta classe foram melhores, 2% semelhantes, 95% piores
» O melhor teve um delta de 7%, a média foi 21%, o pior foi 53%
Comparado com todos os dispositivos testados
» 8% de todos os dispositivos testados foram melhores, 2% semelhantes, 90% piores
» O melhor teve um delta de 4%, a média foi 24%, o pior foi 134%
Consumo de energia
Não notamos nenhuma surpresa com relação aos valores de consumo de energia do dispositivo e a fonte de alimentação de 45 watts é mais do que suficiente.
| desligado | |
| Ocioso | |
| Carga |
|
Key:
min: | |
Power consumption Witcher 3 / stress test
Power consumption with external monitor
Tempos de execução
O Work 14 possui uma bateria de 49 Wh, resultando em tempos de execução práticos de 7:38 horas a 150 cd/m² (38% do brilho máximo do nosso dispositivo de teste) e 5:33 horas com brilho máximo durante nosso teste WLAN. Como resultado, esse dispositivo ficou atrás da maioria dos concorrentes e o Work 14 não conseguirá passar um dia inteiro de trabalho sem precisar do carregador. O carregamento completo do dispositivo leva cerca de 2,5 horas com ele ligado.
| Battery Runtime | |
| WiFi Websurfing | |
| Lenovo ThinkPad L14 G4 21H6S00900 | |
| Média da turma Office (3.83 - 31.5, n=75, últimos 2 anos) | |
| HP ProBook 445 G10 | |
| Dell Latitude 3440 | |
| Schenker Work 14 Base | |
| Acer Swift Go 14 SFG14-71 | |
| WiFi Websurfing max. Brightness | |
| Lenovo ThinkPad L14 G4 21H6S00900 | |
| Média da turma Office (5.7 - 14.9, n=27, últimos 2 anos) | |
| Schenker Work 14 Base | |
Pro
Contra
Veredicto - Um laptop de escritório com boas opções de manutenção
O Schenker Work 14 Base é um laptop de escritório de nível básico que, além do gabinete de alumínio, oferece opções de manutenção muito boas e uma ampla seleção de portas. Infelizmente, o senhor terá que abrir mão de padrões modernos, como USB4 e Thunderbolt, mas, por outro lado, ele tem portas USB suficientes e uma conexão Gigabit Ethernet - o que nem sempre é oferecido em laptops de escritório atualmente. Seu gabinete de alumínio parece ser de mais alta qualidade do que os de plástico dos concorrentes; no entanto, suas superfícies atraem muitas marcas de impressões digitais e notamos alguns ruídos leves de rangidos durante nosso teste.
O laptop é equipado com um Core i5-1235U desatualizado que usa limites de baixa potência, de modo que seu desempenho é totalmente suficiente para tarefas simples do dia a dia. Em parte, o SSD PCIe também é responsável por essa boa impressão subjetiva. Por outro lado, sua pequena ventoinha é bastante irritante sob carga, pois emite um ruído agudo e, de modo geral, fica muito alto. A tela IPS fosca do laptop com resolução Full HD é muito brilhante, com 400 cd/m².
O Schenker Work 14 Base é um laptop de escritório simples com um gabinete de alumínio, boas opções de manutenção e uma tela IPS fosca. No entanto, o senhor terá que conviver com uma imagem granulada e um padrão de desempenho geralmente baixo.
O Work 14 Base também não é fácil competir com seus concorrentes, que geralmente oferecem desempenho um pouco melhor, maior autonomia e melhores alto-falantes. as telas 16:9, no entanto, ainda são a norma nessa classe de preço e, em geral, o senhor terá que fazer algumas concessões nesse segmento no que diz respeito ao desempenho.
Preço e disponibilidade
Atualmente, a Schenker Work 14 Base é vendida por cerca de US$ 750, mas não está disponível para compra nos Estados Unidos.
Schenker Work 14 Base
- 05/01/2024 v7 (old)
Andreas Osthoff
Transparência
A seleção dos dispositivos a serem analisados é feita pela nossa equipe editorial. A amostra de teste foi fornecida ao autor como empréstimo pelo fabricante ou varejista para fins desta revisão. O credor não teve influência nesta revisão, nem o fabricante recebeu uma cópia desta revisão antes da publicação. Não houve obrigação de publicar esta revisão. Como empresa de mídia independente, a Notebookcheck não está sujeita à autoridade de fabricantes, varejistas ou editores.
É assim que o Notebookcheck está testando
Todos os anos, o Notebookcheck analisa de forma independente centenas de laptops e smartphones usando procedimentos padronizados para garantir que todos os resultados sejam comparáveis. Desenvolvemos continuamente nossos métodos de teste há cerca de 20 anos e definimos padrões da indústria no processo. Em nossos laboratórios de teste, equipamentos de medição de alta qualidade são utilizados por técnicos e editores experientes. Esses testes envolvem um processo de validação em vários estágios. Nosso complexo sistema de classificação é baseado em centenas de medições e benchmarks bem fundamentados, o que mantém a objetividade.Price comparison

