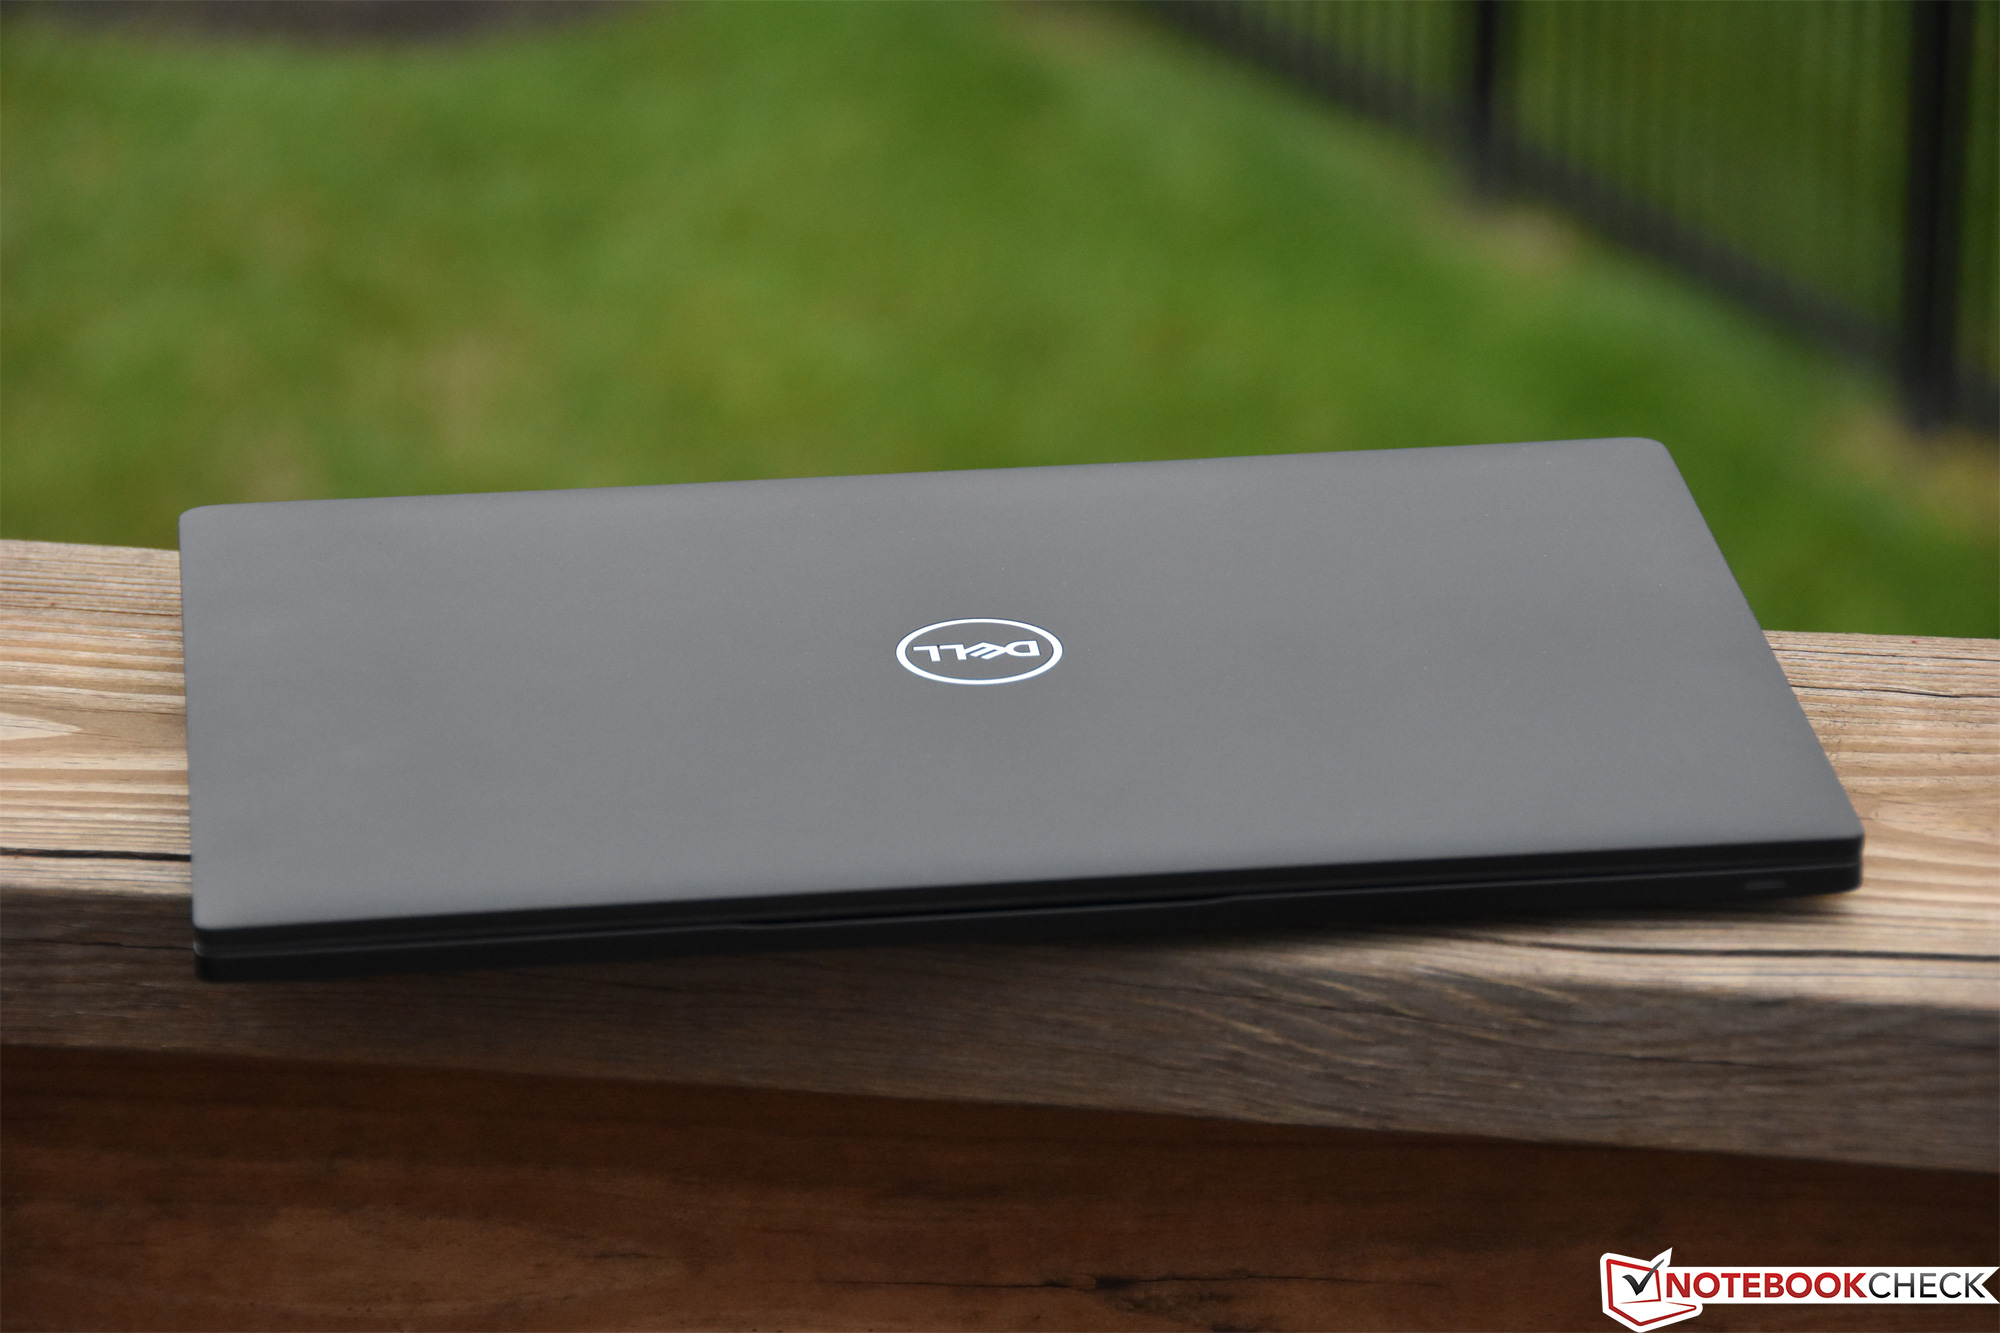
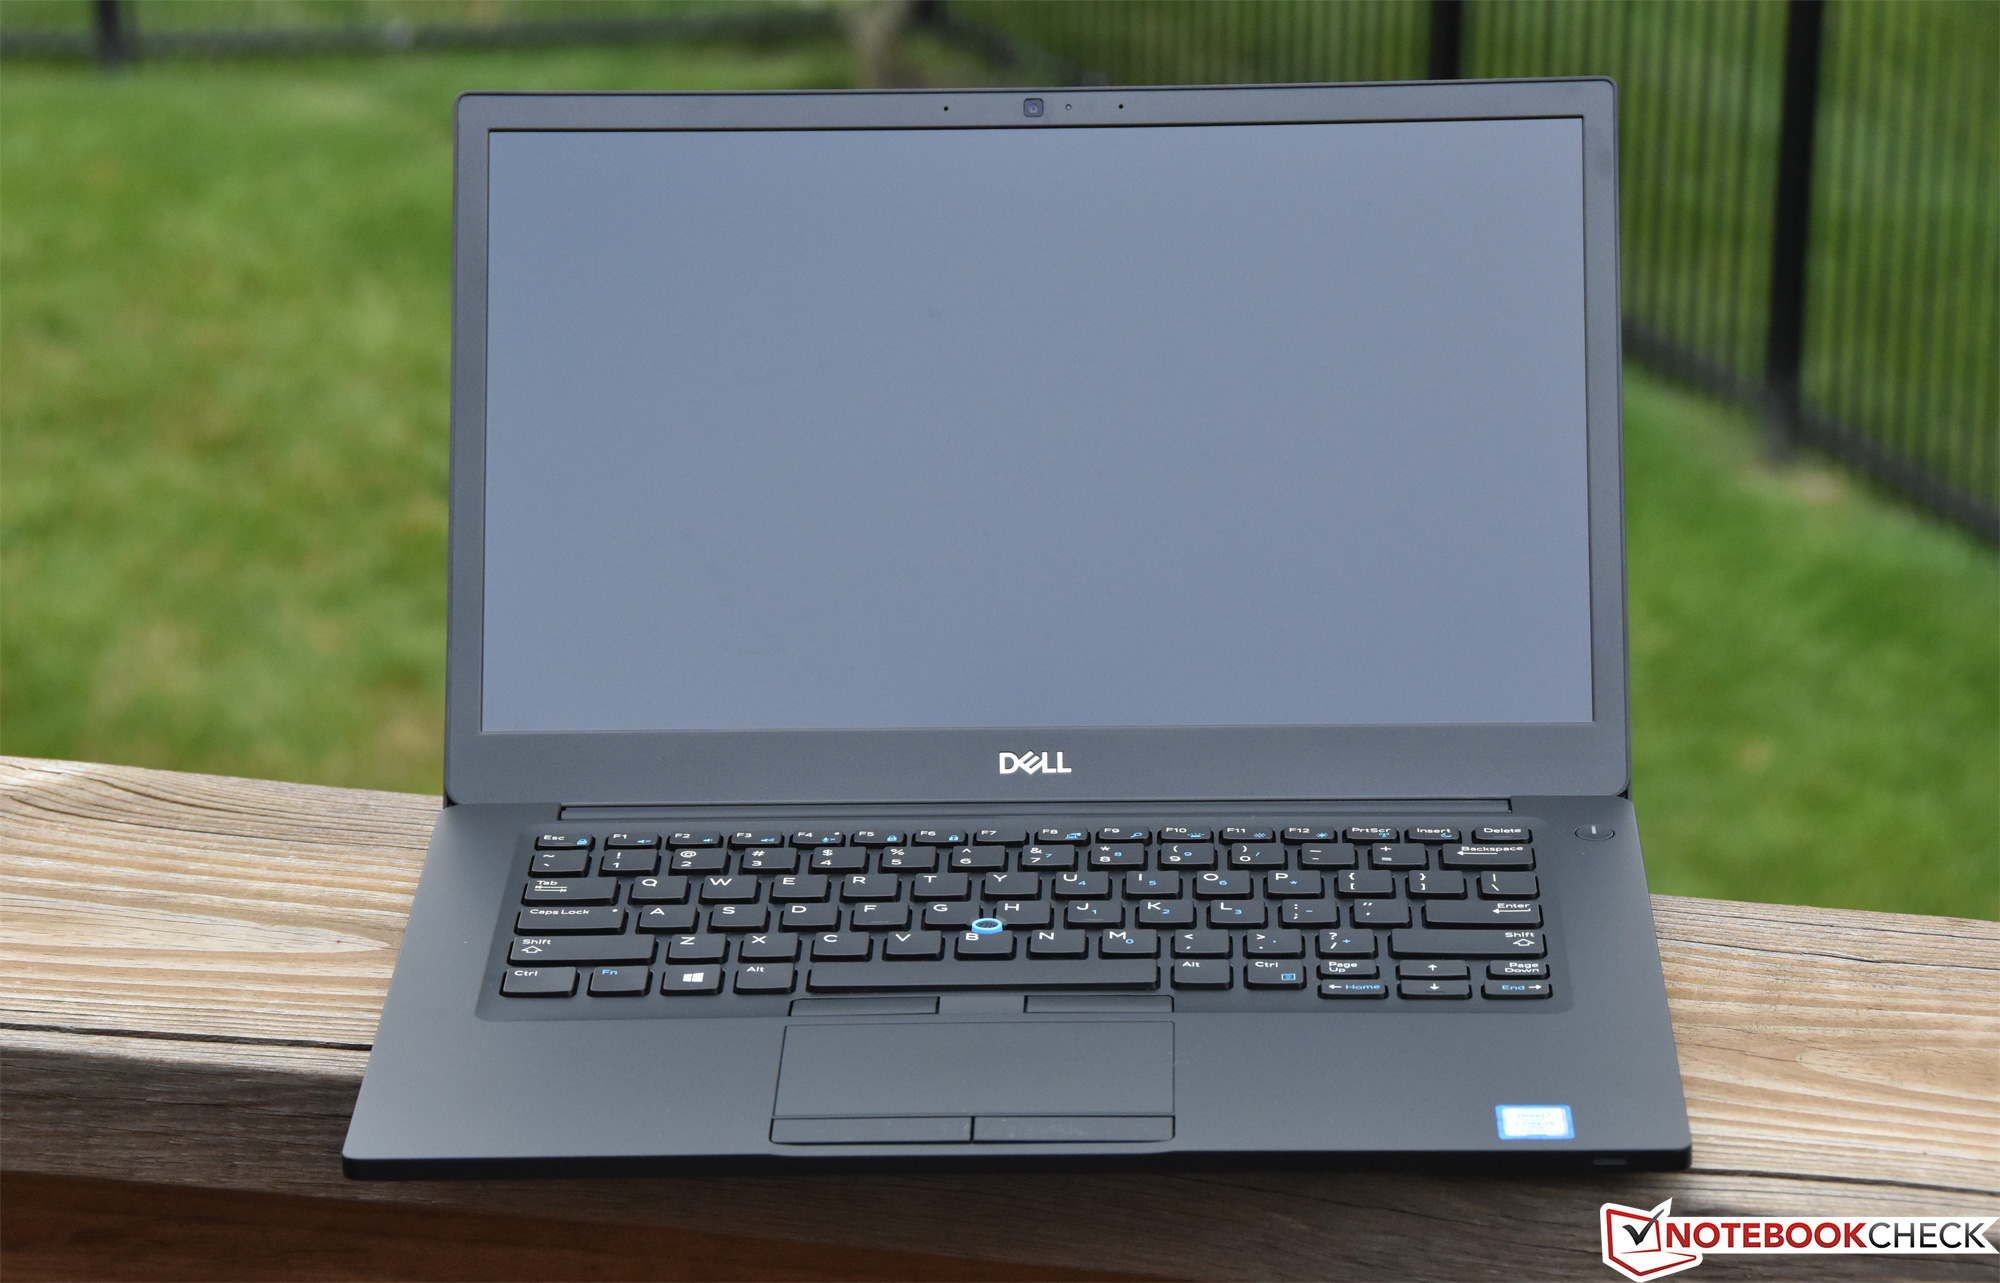
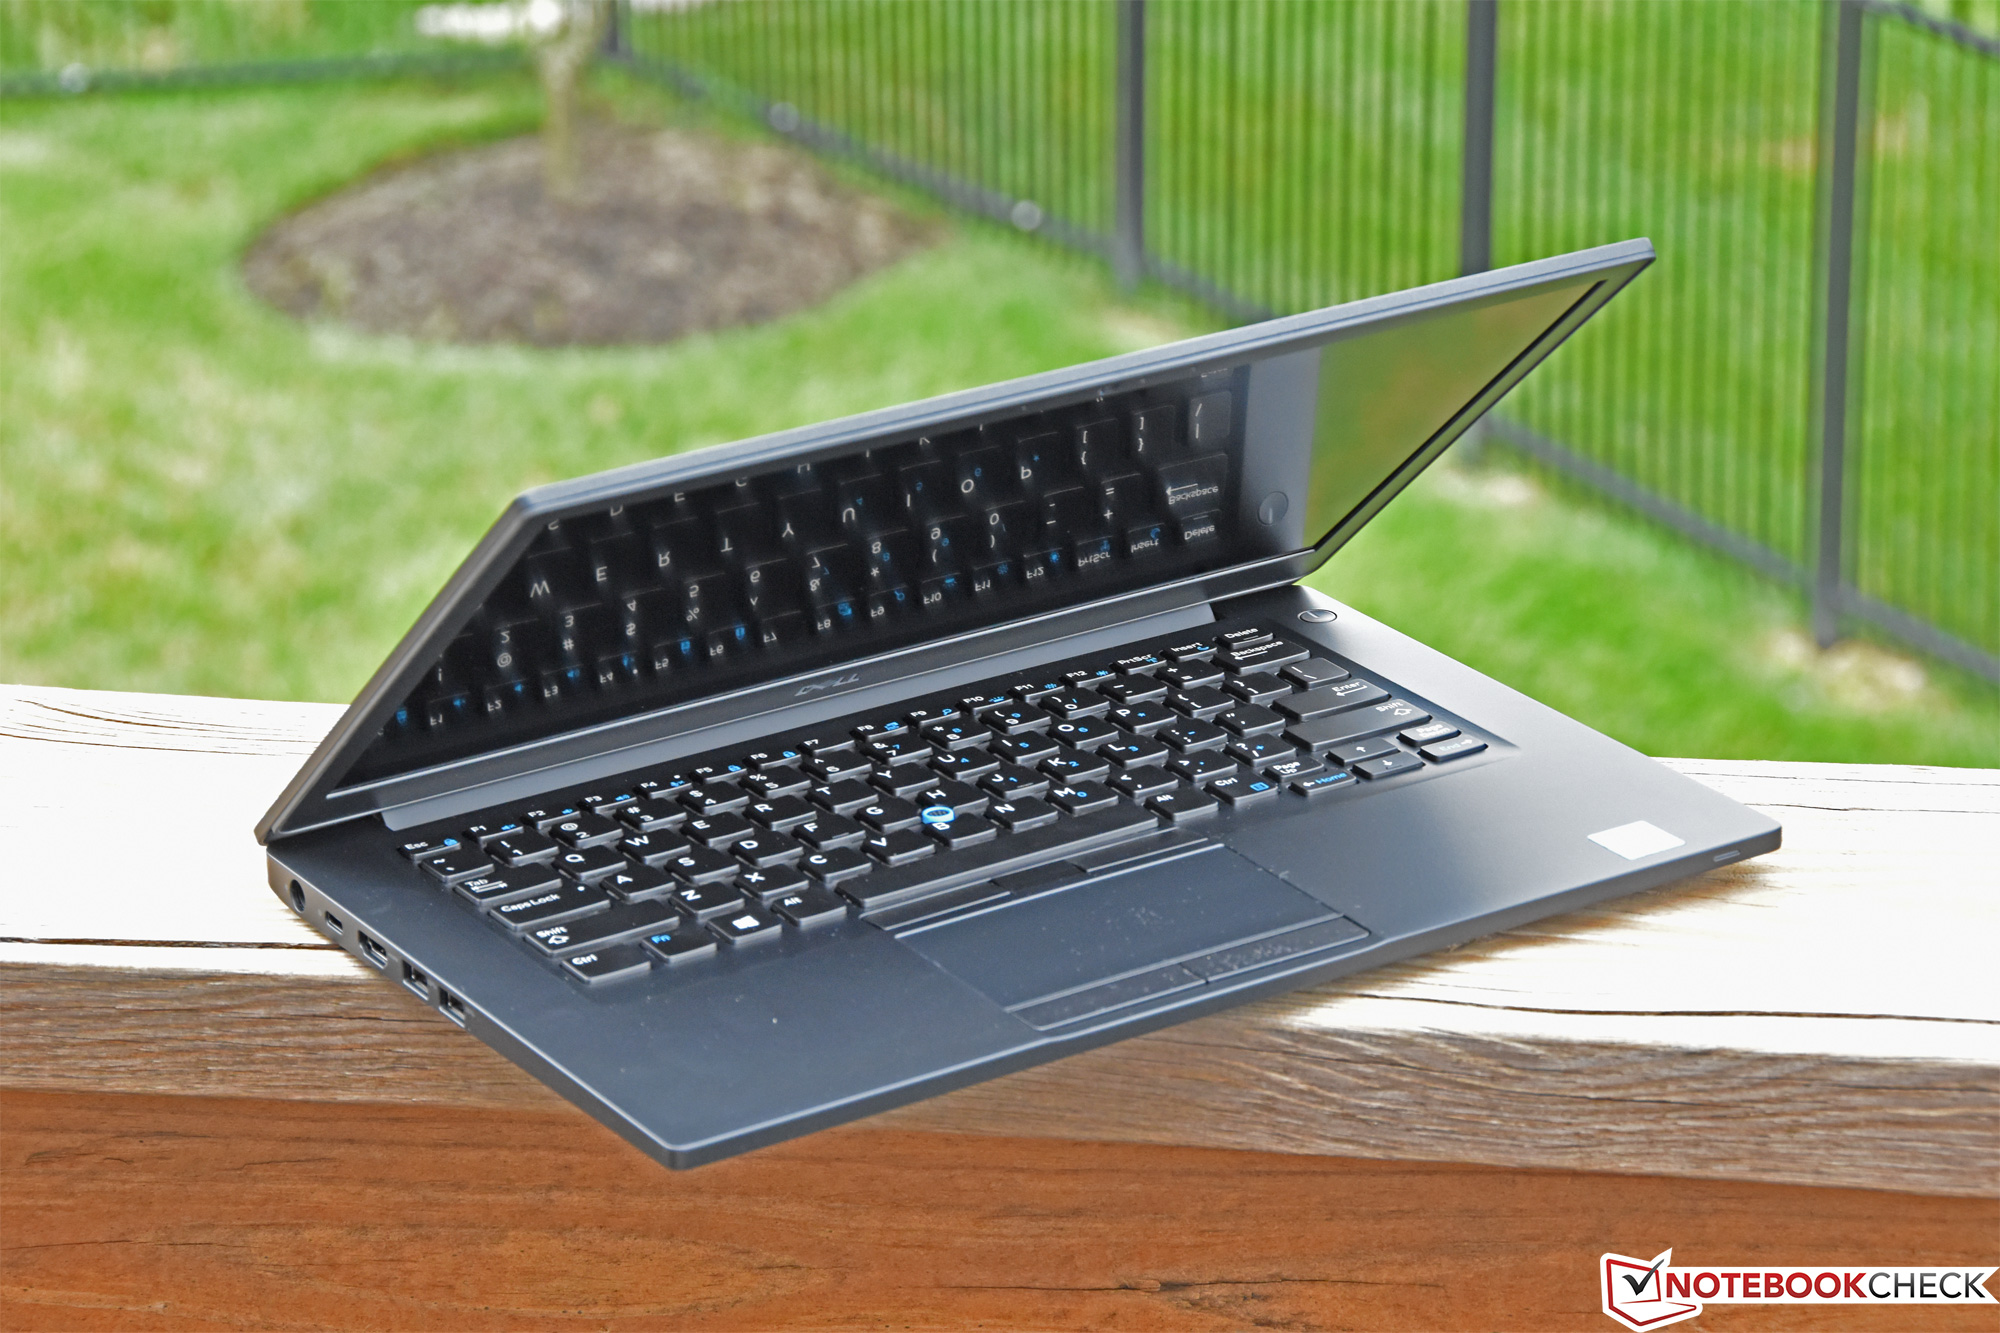
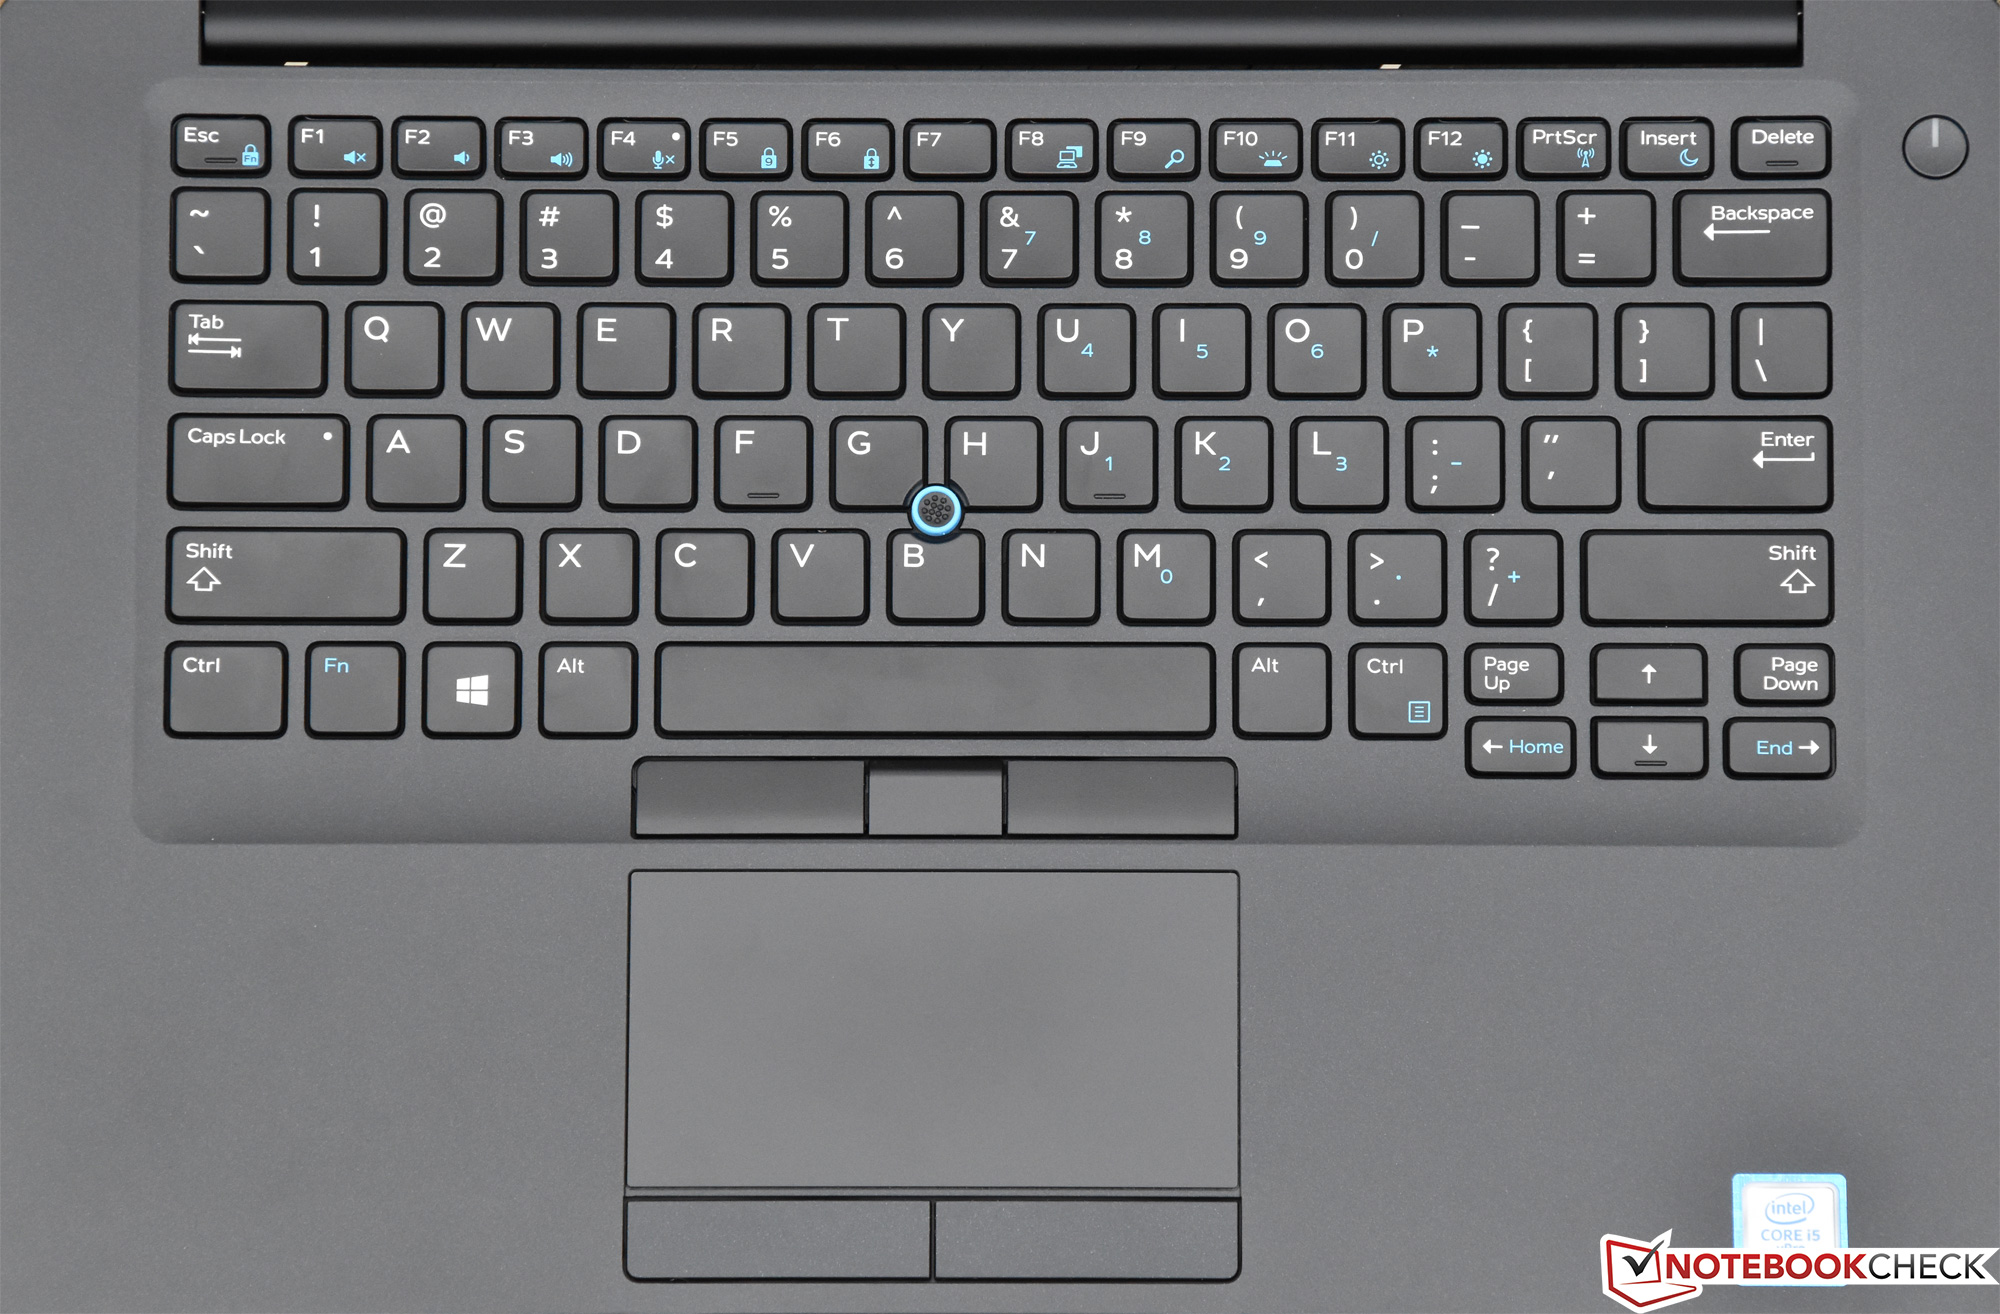
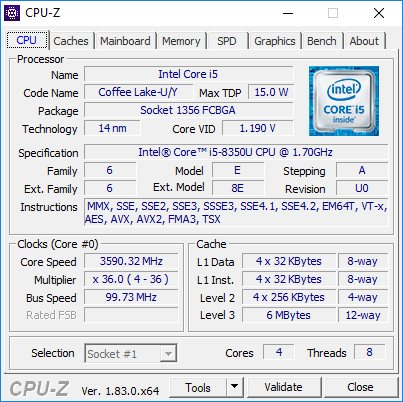
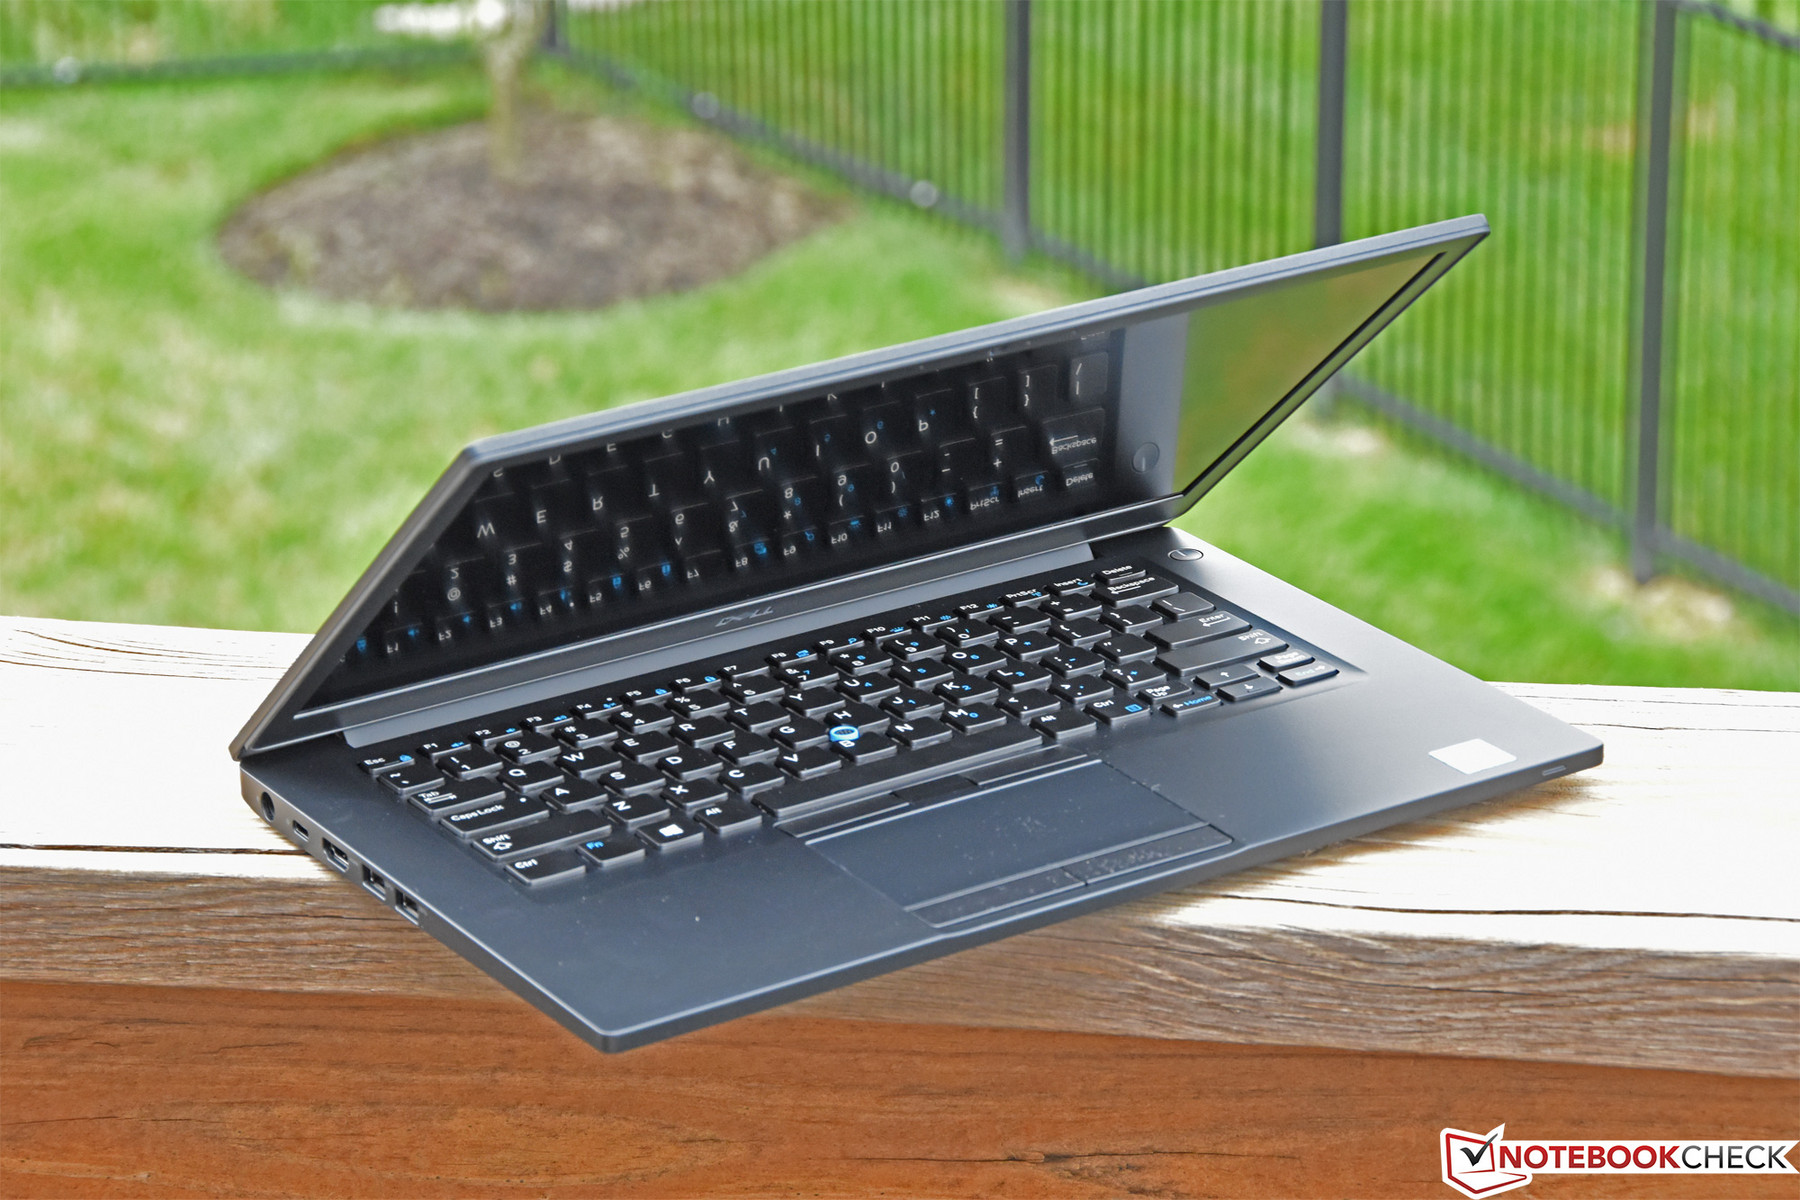
Breve Análise do Portátil Dell Latitude 7490 (i5-8350U, FHD)
| SD Card Reader | |
| average JPG Copy Test (av. of 3 runs) | |
| Lenovo ThinkPad X1 Carbon 2018-20KGS03900 (Toshiba Exceria Pro M501) | |
| Dell Latitude 7390 (Toshiba Exceria Pro M501 UHS-II) | |
| Dell Latitude 7490 (Toshiba Exceria Pro M501 UHS-II) | |
| Lenovo ThinkPad T480s-20L8S02D00 (Toshiba Exceria Pro SDXC 64 GB UHS-II) | |
| Média da turma Office (19.8 - 198.5, n=22, últimos 2 anos) | |
| maximum AS SSD Seq Read Test (1GB) | |
| Lenovo ThinkPad X1 Carbon 2018-20KGS03900 (Toshiba Exceria Pro M501) | |
| Dell Latitude 7390 (Toshiba Exceria Pro M501 UHS-II) | |
| Dell Latitude 7490 (Toshiba Exceria Pro M501 UHS-II) | |
| Lenovo ThinkPad T480s-20L8S02D00 (Toshiba Exceria Pro SDXC 64 GB UHS-II) | |
| Média da turma Office (27.4 - 249, n=21, últimos 2 anos) | |
| |||||||||||||||||||||||||
iluminação: 89 %
iluminação com acumulador: 308.6 cd/m²
Contraste: 1342:1 (Preto: 0.23 cd/m²)
ΔE ColorChecker Calman: 6.07 | ∀{0.5-29.43 Ø4.71}
calibrated: 1.67
ΔE Greyscale Calman: 7.3 | ∀{0.09-98 Ø4.96}
97% sRGB (Argyll 1.6.3 3D)
62% AdobeRGB 1998 (Argyll 1.6.3 3D)
67.9% AdobeRGB 1998 (Argyll 3D)
96.8% sRGB (Argyll 3D)
66.6% Display P3 (Argyll 3D)
Gamma: 2.061
CCT: 7269 K
| Dell Latitude 7490 AUO503D (D04YD_B140HAN), IPS, 14", 1920x1080 | HP EliteBook 840 G5-3JX66EA AUO3B3D, IPS, 14", 1920x1080 | Dell Latitude 7390 LGD059B, IPS, 13.3", 1920x1080 | Lenovo ThinkPad T480s-20L8S02D00 LP140QH2-SPB1, IPS, 14", 2560x1440 | Lenovo ThinkPad X1 Carbon 2018-20KGS03900 B140QAN02.0, IPS, 14", 2560x1440 | Dell Latitude 7490 AU Optronics AU0223D, IPS, 14", 1920x1080 | |
|---|---|---|---|---|---|---|
| Display | -10% | 0% | 6% | 27% | -6% | |
| Display P3 Coverage (%) | 66.6 | 60.2 -10% | 67.8 2% | 72.8 9% | 87.7 32% | 63.6 -5% |
| sRGB Coverage (%) | 96.8 | 88.2 -9% | 95.1 -2% | 97.9 1% | 100 3% | 88.8 -8% |
| AdobeRGB 1998 Coverage (%) | 67.9 | 61.3 -10% | 67.8 0% | 74.1 9% | 99.9 47% | 64.8 -5% |
| Response Times | -1% | 9% | 10% | -25% | -9% | |
| Response Time Grey 50% / Grey 80% * (ms) | 41.6 ? | 42.4 ? -2% | 36.8 ? 12% | 38.4 ? 8% | 59.2 ? -42% | 48.4 ? -16% |
| Response Time Black / White * (ms) | 32 ? | 31.6 ? 1% | 30.4 ? 5% | 28.4 ? 11% | 34.4 ? -8% | 32.4 ? -1% |
| PWM Frequency (Hz) | ||||||
| Screen | 5% | 7% | 1% | 36% | -6% | |
| Brightness middle (cd/m²) | 308.6 | 414 34% | 303.8 -2% | 352 14% | 578 87% | 328.2 6% |
| Brightness (cd/m²) | 294 | 387 32% | 289 -2% | 343 17% | 533 81% | 305 4% |
| Brightness Distribution (%) | 89 | 87 -2% | 86 -3% | 91 2% | 84 -6% | 87 -2% |
| Black Level * (cd/m²) | 0.23 | 0.25 -9% | 0.31 -35% | 0.46 -100% | 0.38 -65% | 0.37 -61% |
| Contrast (:1) | 1342 | 1656 23% | 980 -27% | 765 -43% | 1521 13% | 887 -34% |
| Colorchecker dE 2000 * | 6.07 | 5.5 9% | 2.9 52% | 3.3 46% | 1.9 69% | 3.82 37% |
| Colorchecker dE 2000 max. * | 10.58 | 9.9 6% | 5.79 45% | 7.3 31% | 3.8 64% | 5.58 47% |
| Colorchecker dE 2000 calibrated * | 1.67 | 2.3 -38% | 1.72 -3% | 0.8 52% | 3.5 -110% | |
| Greyscale dE 2000 * | 7.3 | 6.4 12% | 3.7 49% | 5.3 27% | 3 59% | 3 59% |
| Gamma | 2.061 107% | 2.31 95% | 2.118 104% | 2.22 99% | 2.14 103% | 2.36 93% |
| CCT | 7269 89% | 7811 83% | 6323 103% | 6452 101% | 6377 102% | 6962 93% |
| Color Space (Percent of AdobeRGB 1998) (%) | 62 | 56.9 -8% | 63 2% | 68.4 10% | 88.8 43% | 58 -6% |
| Color Space (Percent of sRGB) (%) | 97 | 88.1 -9% | 95 -2% | 98 1% | 100 3% | 88 -9% |
| Média Total (Programa/Configurações) | -2% /
1% | 5% /
6% | 6% /
3% | 13% /
27% | -7% /
-7% |
* ... menor é melhor
Exibir tempos de resposta
| ↔ Tempo de resposta preto para branco | ||
|---|---|---|
| 32 ms ... ascensão ↗ e queda ↘ combinadas | ↗ 16.4 ms ascensão | 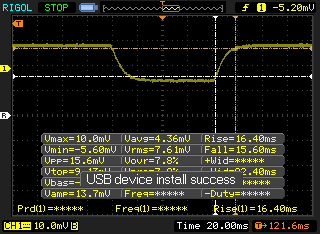 |
| ↘ 15.6 ms queda | ||
| A tela mostra taxas de resposta lentas em nossos testes e será insatisfatória para os jogadores. Em comparação, todos os dispositivos testados variam de 0.1 (mínimo) a 240 (máximo) ms. » 86 % de todos os dispositivos são melhores. Isso significa que o tempo de resposta medido é pior que a média de todos os dispositivos testados (19.8 ms). | ||
| ↔ Tempo de resposta 50% cinza a 80% cinza | ||
| 41.6 ms ... ascensão ↗ e queda ↘ combinadas | ↗ 22 ms ascensão | 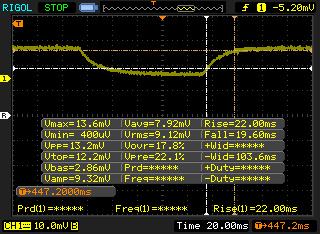 |
| ↘ 19.6 ms queda | ||
| A tela mostra taxas de resposta lentas em nossos testes e será insatisfatória para os jogadores. Em comparação, todos os dispositivos testados variam de 0.165 (mínimo) a 636 (máximo) ms. » 67 % de todos os dispositivos são melhores. Isso significa que o tempo de resposta medido é pior que a média de todos os dispositivos testados (31 ms). | ||
Cintilação da tela / PWM (modulação por largura de pulso)
| Tela tremeluzindo / PWM não detectado | 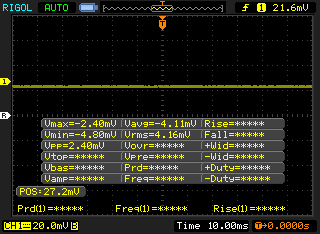 | ||
[pwm_comparison] Em comparação: 52 % de todos os dispositivos testados não usam PWM para escurecer a tela. Se PWM foi detectado, uma média de 7757 (mínimo: 5 - máximo: 343500) Hz foi medida. | |||
| PCMark 8 Home Score Accelerated v2 | 3723 pontos | |
| PCMark 8 Work Score Accelerated v2 | 4906 pontos | |
| PCMark 10 Score | 3564 pontos | |
Ajuda | ||
| Dell Latitude 7490 Toshiba KSG60ZMV256G | Dell Latitude 7490 Samsung PM961 MZVLW256HEHP | HP EliteBook 840 G5-3JX66EA Toshiba XG5 KXG50ZNV256G | Dell Latitude 7390 Samsung PM961 MZVLW256HEHP | Lenovo ThinkPad X1 Carbon 2018-20KGS03900 Samsung SSD PM981 MZVLB512HAJQ | Média Toshiba KSG60ZMV256G | |
|---|---|---|---|---|---|---|
| AS SSD | 135% | 19% | 113% | 238% | 0% | |
| Copy Game MB/s (MB/s) | 382.3 | 309.3 | 352 | 1107 | ||
| Copy Program MB/s (MB/s) | 227.1 | 168.2 | 247.4 | 460.2 | ||
| Copy ISO MB/s (MB/s) | 872 | 319.2 | 818 | 1247 | ||
| Score Total (Points) | 947 | 2350 148% | 1232 30% | 2215 134% | 3529 273% | 947 ? 0% |
| Score Write (Points) | 357 | 536 50% | 376 5% | 501 40% | 1801 404% | 357 ? 0% |
| Score Read (Points) | 391 | 1242 218% | 603 54% | 1158 196% | 1168 199% | 391 ? 0% |
| Access Time Write * (ms) | 0.056 | 0.03 46% | 0.053 5% | 0.032 43% | 0.027 52% | 0.056 ? -0% |
| Access Time Read * (ms) | 0.112 | 0.04 64% | 0.321 -187% | 0.063 44% | 0.029 74% | 0.112 ? -0% |
| 4K-64 Write (MB/s) | 248.1 | 329.6 33% | 248.3 0% | 302.4 22% | 1529 516% | 248 ? 0% |
| 4K-64 Read (MB/s) | 316.1 | 955 202% | 413.3 31% | 932 195% | 876 177% | 316 ? 0% |
| 4K Write (MB/s) | 79.2 | 114.9 45% | 93.6 18% | 115.2 45% | 134.3 70% | 79.2 ? 0% |
| 4K Read (MB/s) | 26.66 | 48.13 81% | 29.01 9% | 49.43 85% | 52.4 97% | 26.7 ? 0% |
| Seq Write (MB/s) | 294.9 | 919 212% | 339 15% | 830 181% | 1376 367% | 295 ? 0% |
| Seq Read (MB/s) | 486.2 | 2385 391% | 1611 231% | 1761 262% | 2396 393% | 486 ? 0% |
* ... menor é melhor

| 3DMark 11 Performance | 1797 pontos | |
| 3DMark Cloud Gate Standard Score | 7414 pontos | |
| 3DMark Fire Strike Score | 934 pontos | |
Ajuda | ||
| Metro: Last Light | |
| 1024x768 Low (DX10) AF:4x (classificar por valor) | |
| Dell Latitude 7490 | |
| Média Intel UHD Graphics 620 (23.3 - 41, n=5) | |
| 1366x768 Medium (DX10) AF:4x (classificar por valor) | |
| Dell Latitude 7490 | |
| Média Intel UHD Graphics 620 (16.4 - 28, n=4) | |
| 1366x768 High (DX11) AF:16x (classificar por valor) | |
| Dell Latitude 7490 | |
| Média Intel UHD Graphics 620 (13 - 16, n=3) | |
| 1920x1080 Very High (DX11) AF:16x (classificar por valor) | |
| Dell Latitude 7490 | |
| Média Intel UHD Graphics 620 (6 - 8, n=3) | |
| Rise of the Tomb Raider | |
| 1024x768 Lowest Preset (classificar por valor) | |
| Dell Latitude 7490 | |
| HP EliteBook 840 G5-3JX66EA | |
| Lenovo ThinkPad X1 Carbon 2018-20KGS03900 | |
| Média Intel UHD Graphics 620 (10.4 - 110.7, n=82) | |
| 1366x768 Medium Preset AF:2x (classificar por valor) | |
| Dell Latitude 7490 | |
| HP EliteBook 840 G5-3JX66EA | |
| Lenovo ThinkPad X1 Carbon 2018-20KGS03900 | |
| Média Intel UHD Graphics 620 (6.5 - 49.3, n=62) | |
| 1920x1080 High Preset AA:FX AF:4x (classificar por valor) | |
| Dell Latitude 7490 | |
| HP EliteBook 840 G5-3JX66EA | |
| Lenovo ThinkPad X1 Carbon 2018-20KGS03900 | |
| Média Intel UHD Graphics 620 (4.9 - 32, n=42) | |
| baixo | média | alto | ultra | |
|---|---|---|---|---|
| BioShock Infinite (2013) | 52 | 35 | 24 | 8 |
| Metro: Last Light (2013) | 31 | 23 | 15 | 6 |
| Rise of the Tomb Raider (2016) | 17 | 11 | 6 |
Barulho
| Ocioso |
| 28.2 / 28.2 / 28.7 dB |
| Carga |
| 29.9 / 40.2 dB |
 | ||
30 dB silencioso 40 dB(A) audível 50 dB(A) ruidosamente alto |
||
min: | ||
| Dell Latitude 7490 UHD Graphics 620, i5-8350U, Toshiba KSG60ZMV256G | HP EliteBook 840 G5-3JX66EA UHD Graphics 620, i5-8250U, Toshiba XG5 KXG50ZNV256G | Dell Latitude 7390 UHD Graphics 620, i7-8650U, Samsung PM961 MZVLW256HEHP | Lenovo ThinkPad T480s-20L8S02D00 UHD Graphics 620, i5-8250U, Samsung SSD PM981 MZVLB512HAJQ | Lenovo ThinkPad X1 Carbon 2018-20KGS03900 UHD Graphics 620, i5-8550U, Samsung SSD PM981 MZVLB512HAJQ | Dell Latitude 7490 UHD Graphics 620, i7-8650U, Samsung PM961 MZVLW256HEHP | |
|---|---|---|---|---|---|---|
| Noise | -5% | -2% | -5% | -4% | -3% | |
| desligado / ambiente * (dB) | 28.2 | 28.8 -2% | 28.2 -0% | 28.9 -2% | 28.9 -2% | 28.2 -0% |
| Idle Minimum * (dB) | 28.2 | 28.8 -2% | 28.2 -0% | 28.9 -2% | 28.9 -2% | 28.2 -0% |
| Idle Average * (dB) | 28.2 | 28.8 -2% | 28.2 -0% | 28.9 -2% | 28.9 -2% | 28.2 -0% |
| Idle Maximum * (dB) | 28.7 | 33.1 -15% | 28.2 2% | 28.9 -1% | 32.5 -13% | 31.4 -9% |
| Load Average * (dB) | 29.9 | 35.2 -18% | 31.5 -5% | 36.9 -23% | 35.1 -17% | 31.7 -6% |
| Load Maximum * (dB) | 40.2 | 35.2 12% | 42.7 -6% | 38.9 3% | 35.1 13% | 41.2 -2% |
* ... menor é melhor
(-) A temperatura máxima no lado superior é 45.2 °C / 113 F, em comparação com a média de 34.3 °C / 94 F , variando de 21.2 a 62.5 °C para a classe Office.
(-) A parte inferior aquece até um máximo de 51.6 °C / 125 F, em comparação com a média de 36.8 °C / 98 F
(+) Em uso inativo, a temperatura média para o lado superior é 28.7 °C / 84 F, em comparação com a média do dispositivo de 29.5 °C / ### class_avg_f### F.
(+) Os apoios para as mãos e o touchpad são mais frios que a temperatura da pele, com um máximo de 30.4 °C / 86.7 F e, portanto, são frios ao toque.
(-) A temperatura média da área do apoio para as mãos de dispositivos semelhantes foi 27.5 °C / 81.5 F (-2.9 °C / -5.2 F).
Dell Latitude 7490 análise de áudio
(±) | o volume do alto-falante é médio, mas bom (###valor### dB)
Graves 100 - 315Hz
(±) | graves reduzidos - em média 13.6% menor que a mediana
(±) | a linearidade dos graves é média (10.5% delta para a frequência anterior)
Médios 400 - 2.000 Hz
(+) | médios equilibrados - apenas 3.9% longe da mediana
(±) | a linearidade dos médios é média (7.3% delta para frequência anterior)
Altos 2 - 16 kHz
(+) | agudos equilibrados - apenas 3.4% longe da mediana
(±) | a linearidade dos máximos é média (8.8% delta para frequência anterior)
Geral 100 - 16.000 Hz
(±) | a linearidade do som geral é média (18.8% diferença em relação à mediana)
Comparado com a mesma classe
» 35% de todos os dispositivos testados nesta classe foram melhores, 7% semelhantes, 58% piores
» O melhor teve um delta de 7%, a média foi 21%, o pior foi 53%
Comparado com todos os dispositivos testados
» 43% de todos os dispositivos testados foram melhores, 8% semelhantes, 49% piores
» O melhor teve um delta de 4%, a média foi 23%, o pior foi 134%
Lenovo ThinkPad X1 Carbon 2018-20KGS03900 análise de áudio
(+) | os alto-falantes podem tocar relativamente alto (###valor### dB)
Graves 100 - 315Hz
(-) | quase nenhum baixo - em média 25.9% menor que a mediana
(±) | a linearidade dos graves é média (9.8% delta para a frequência anterior)
Médios 400 - 2.000 Hz
(+) | médios equilibrados - apenas 3.8% longe da mediana
(±) | a linearidade dos médios é média (9% delta para frequência anterior)
Altos 2 - 16 kHz
(+) | agudos equilibrados - apenas 2.1% longe da mediana
(+) | os máximos são lineares (4% delta da frequência anterior)
Geral 100 - 16.000 Hz
(±) | a linearidade do som geral é média (18.7% diferença em relação à mediana)
Comparado com a mesma classe
» 35% de todos os dispositivos testados nesta classe foram melhores, 6% semelhantes, 59% piores
» O melhor teve um delta de 7%, a média foi 21%, o pior foi 53%
Comparado com todos os dispositivos testados
» 43% de todos os dispositivos testados foram melhores, 8% semelhantes, 49% piores
» O melhor teve um delta de 4%, a média foi 23%, o pior foi 134%
| desligado | |
| Ocioso | |
| Carga |
|
Key:
min: | |
| Dell Latitude 7490 i5-8350U, UHD Graphics 620, Toshiba KSG60ZMV256G, IPS, 1920x1080, 14" | HP EliteBook 840 G5-3JX66EA i5-8250U, UHD Graphics 620, Toshiba XG5 KXG50ZNV256G, IPS, 1920x1080, 14" | Dell Latitude 7390 i7-8650U, UHD Graphics 620, Samsung PM961 MZVLW256HEHP, IPS, 1920x1080, 13.3" | Lenovo ThinkPad T480s-20L8S02D00 i5-8250U, UHD Graphics 620, Samsung SSD PM981 MZVLB512HAJQ, IPS, 2560x1440, 14" | Lenovo ThinkPad X1 Carbon 2018-20KGS03900 i5-8550U, UHD Graphics 620, Samsung SSD PM981 MZVLB512HAJQ, IPS, 2560x1440, 14" | Dell Latitude 7490 i7-8650U, UHD Graphics 620, Samsung PM961 MZVLW256HEHP, IPS, 1920x1080, 14" | |
|---|---|---|---|---|---|---|
| Power Consumption | -46% | -26% | -55% | -69% | -30% | |
| Idle Minimum * (Watt) | 2 | 3.2 -60% | 3.3 -65% | 3.1 -55% | 3.8 -90% | 3.1 -55% |
| Idle Average * (Watt) | 4.7 | 6.6 -40% | 5.9 -26% | 6.8 -45% | 8.9 -89% | 6.5 -38% |
| Idle Maximum * (Watt) | 5.7 | 9.5 -67% | 6.2 -9% | 10.1 -77% | 11.9 -109% | 7.6 -33% |
| Load Average * (Watt) | 38.4 | 36.2 6% | 43.2 -13% | 48.4 -26% | 47.5 -24% | 43 -12% |
| Load Maximum * (Watt) | 38.9 | 65.6 -69% | 45.2 -16% | 67.1 -72% | 52.5 -35% | 43.8 -13% |
* ... menor é melhor
| Dell Latitude 7490 i5-8350U, UHD Graphics 620, 60 Wh | HP EliteBook 840 G5-3JX66EA i5-8250U, UHD Graphics 620, 50 Wh | Dell Latitude 7390 i7-8650U, UHD Graphics 620, 60 Wh | Lenovo ThinkPad T480s-20L8S02D00 i5-8250U, UHD Graphics 620, 57 Wh | Lenovo ThinkPad X1 Carbon 2018-20KGS03900 i5-8550U, UHD Graphics 620, 57 Wh | Dell Latitude 7490 i7-8650U, UHD Graphics 620, 60 Wh | |
|---|---|---|---|---|---|---|
| Duração da bateria | ||||||
| WiFi v1.3 (h) | 9.1 | 7.5 -18% | 11.1 22% | 9 -1% | 8.7 -4% | 9.4 3% |
Pro
Contra
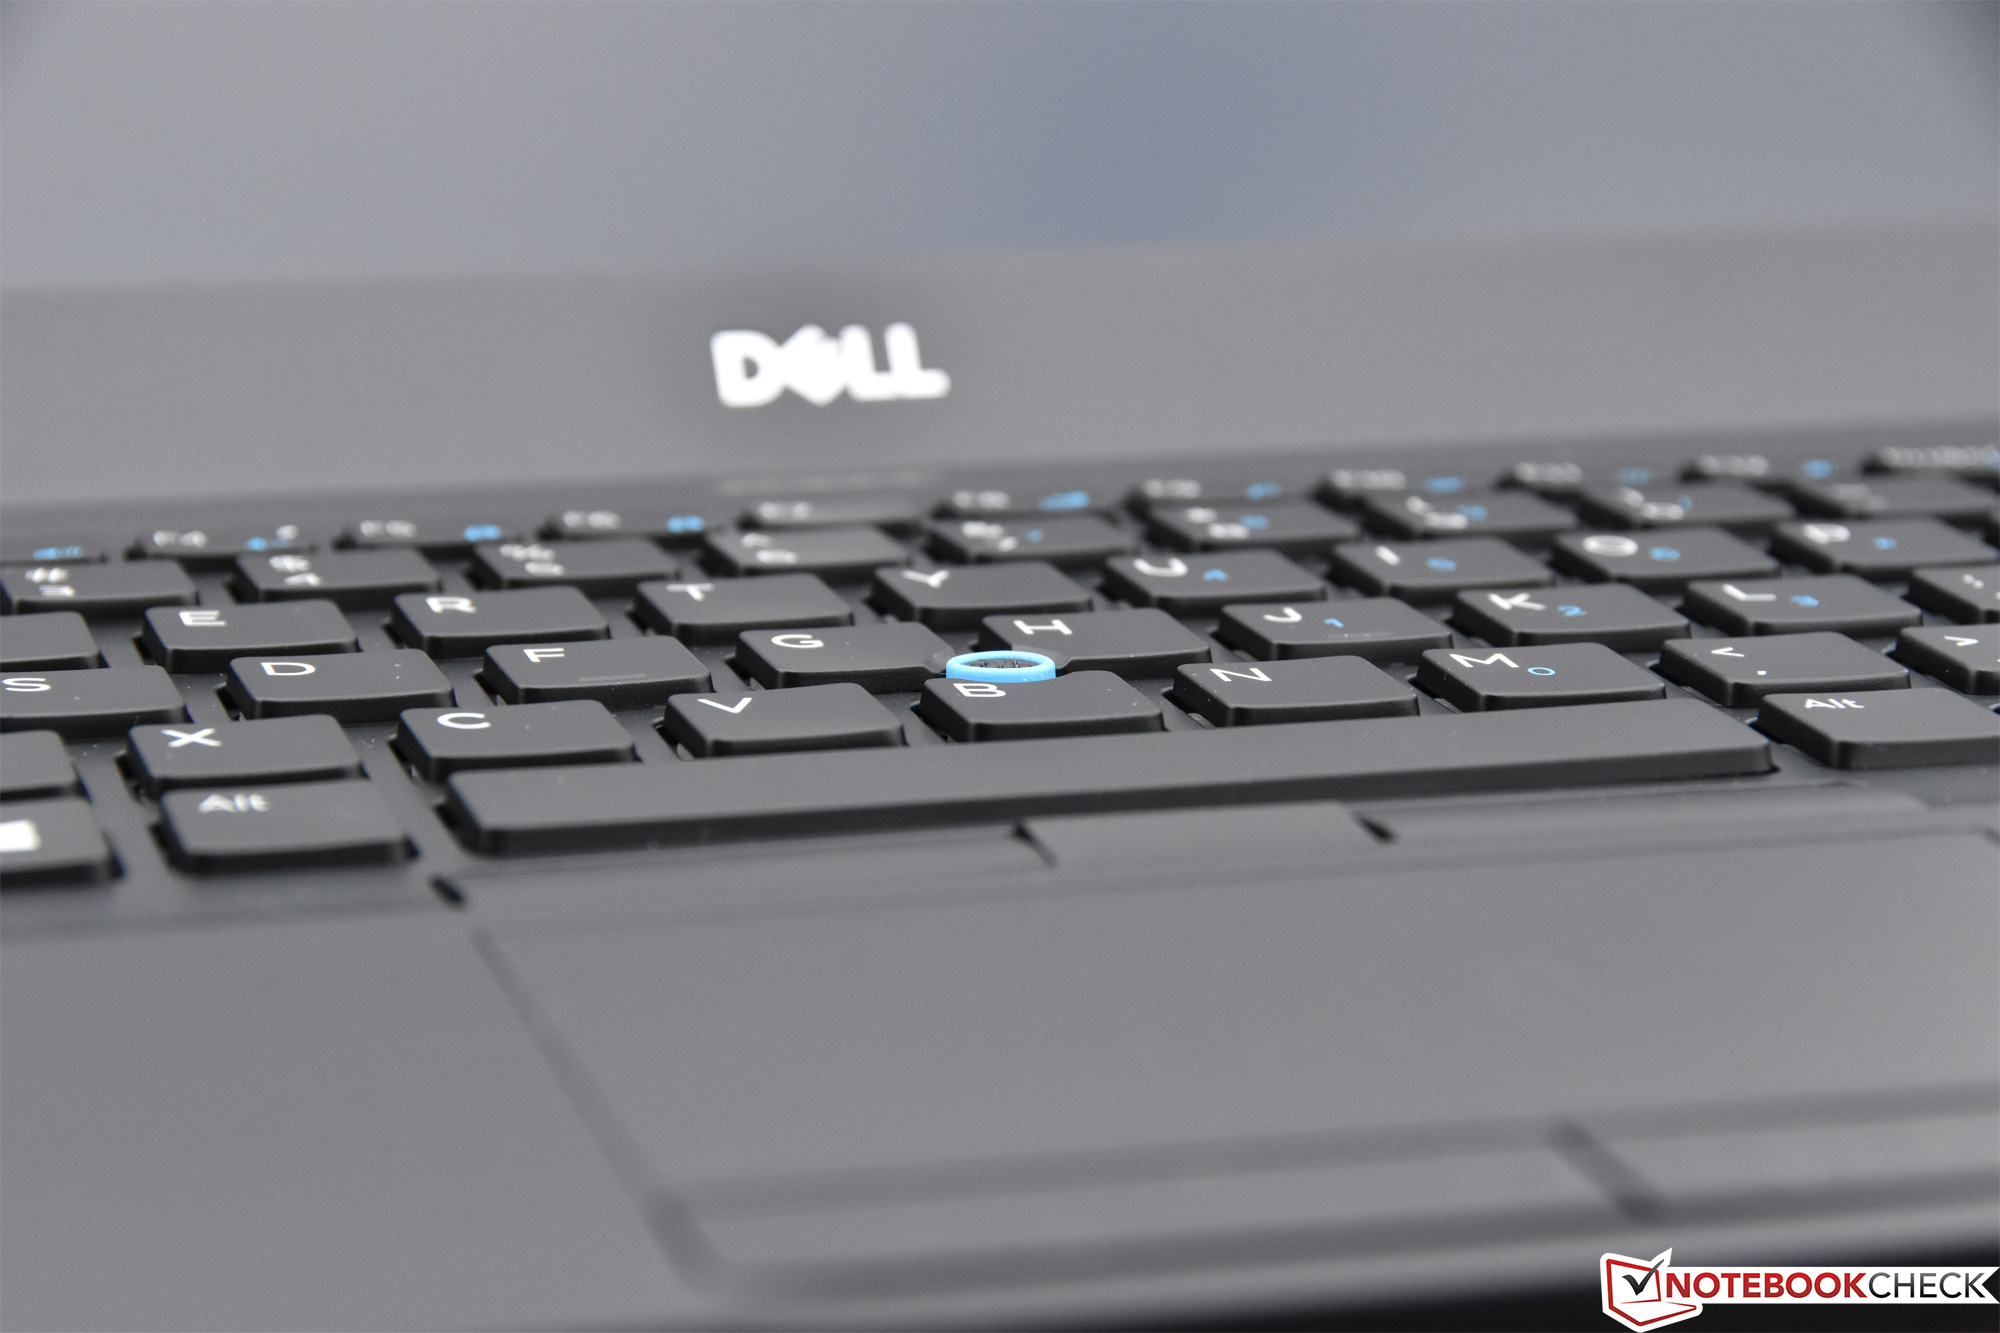
Mais uma vez, uma máquina da série Dell Latitude 7000 nos deixa completamente impressionados. Juntamente com os ThinkPads da Lenovo e os EliteBooks da HP, os Latitudes sobressaem do resto da concorrência empresarial. Eles são cuidadosamente projetados, atualizados com inteligência e revisados com cuidado. Enquanto o 7490 é uma mera atualização iterativa do 7480 em todos os sentidos, realmente deixa pouco a desejar. A carcaça é robusta, discreta e atraente, o peso é aceitável, os dispositivos de entrada são excelentes, o desempenho é muito bom, a duração da bateria é longa e é um companheiro silencioso. As poucas áreas de melhoria que gostaríamos de ver são opções de tela para igualar seus concorrentes, melhor gerenciamento térmico e melhores alto-falantes.
Mais uma vez, uma máquina da série Dell Latitude 7000 nos deixa completamente impressionados. O Latitude 7490 de $1.709 hoje, é absolutamente digno de consideração por qualquer pessoa no mercado em busca de um portátil corporativo premium.
A configuração menos cara de hoje não tem o Core i7, o armazenamento NVMe, a tela sensível ao toque e alguns dos recursos biométricos e de segurança da unidade de teste de abril, mas também é de apenas $1.709 (comparado os $2.000 do modelo anterior). Aqueles que não precisam de memória dual-channel ou de qualquer das omissões listadas anteriormente, não encontram muito do que reclamar nesta configuração. Junto com o X1 Carbon, T480s, HP EliteBook 840 G1, e Latitude 7390, o Latitude 7490 merece consideração por qualquer pessoa no mercado à procura de um portátil corporativo premium.
Dell Latitude 7490
- 06/21/2018 v6 (old)
Steve Schardein
Price comparison
