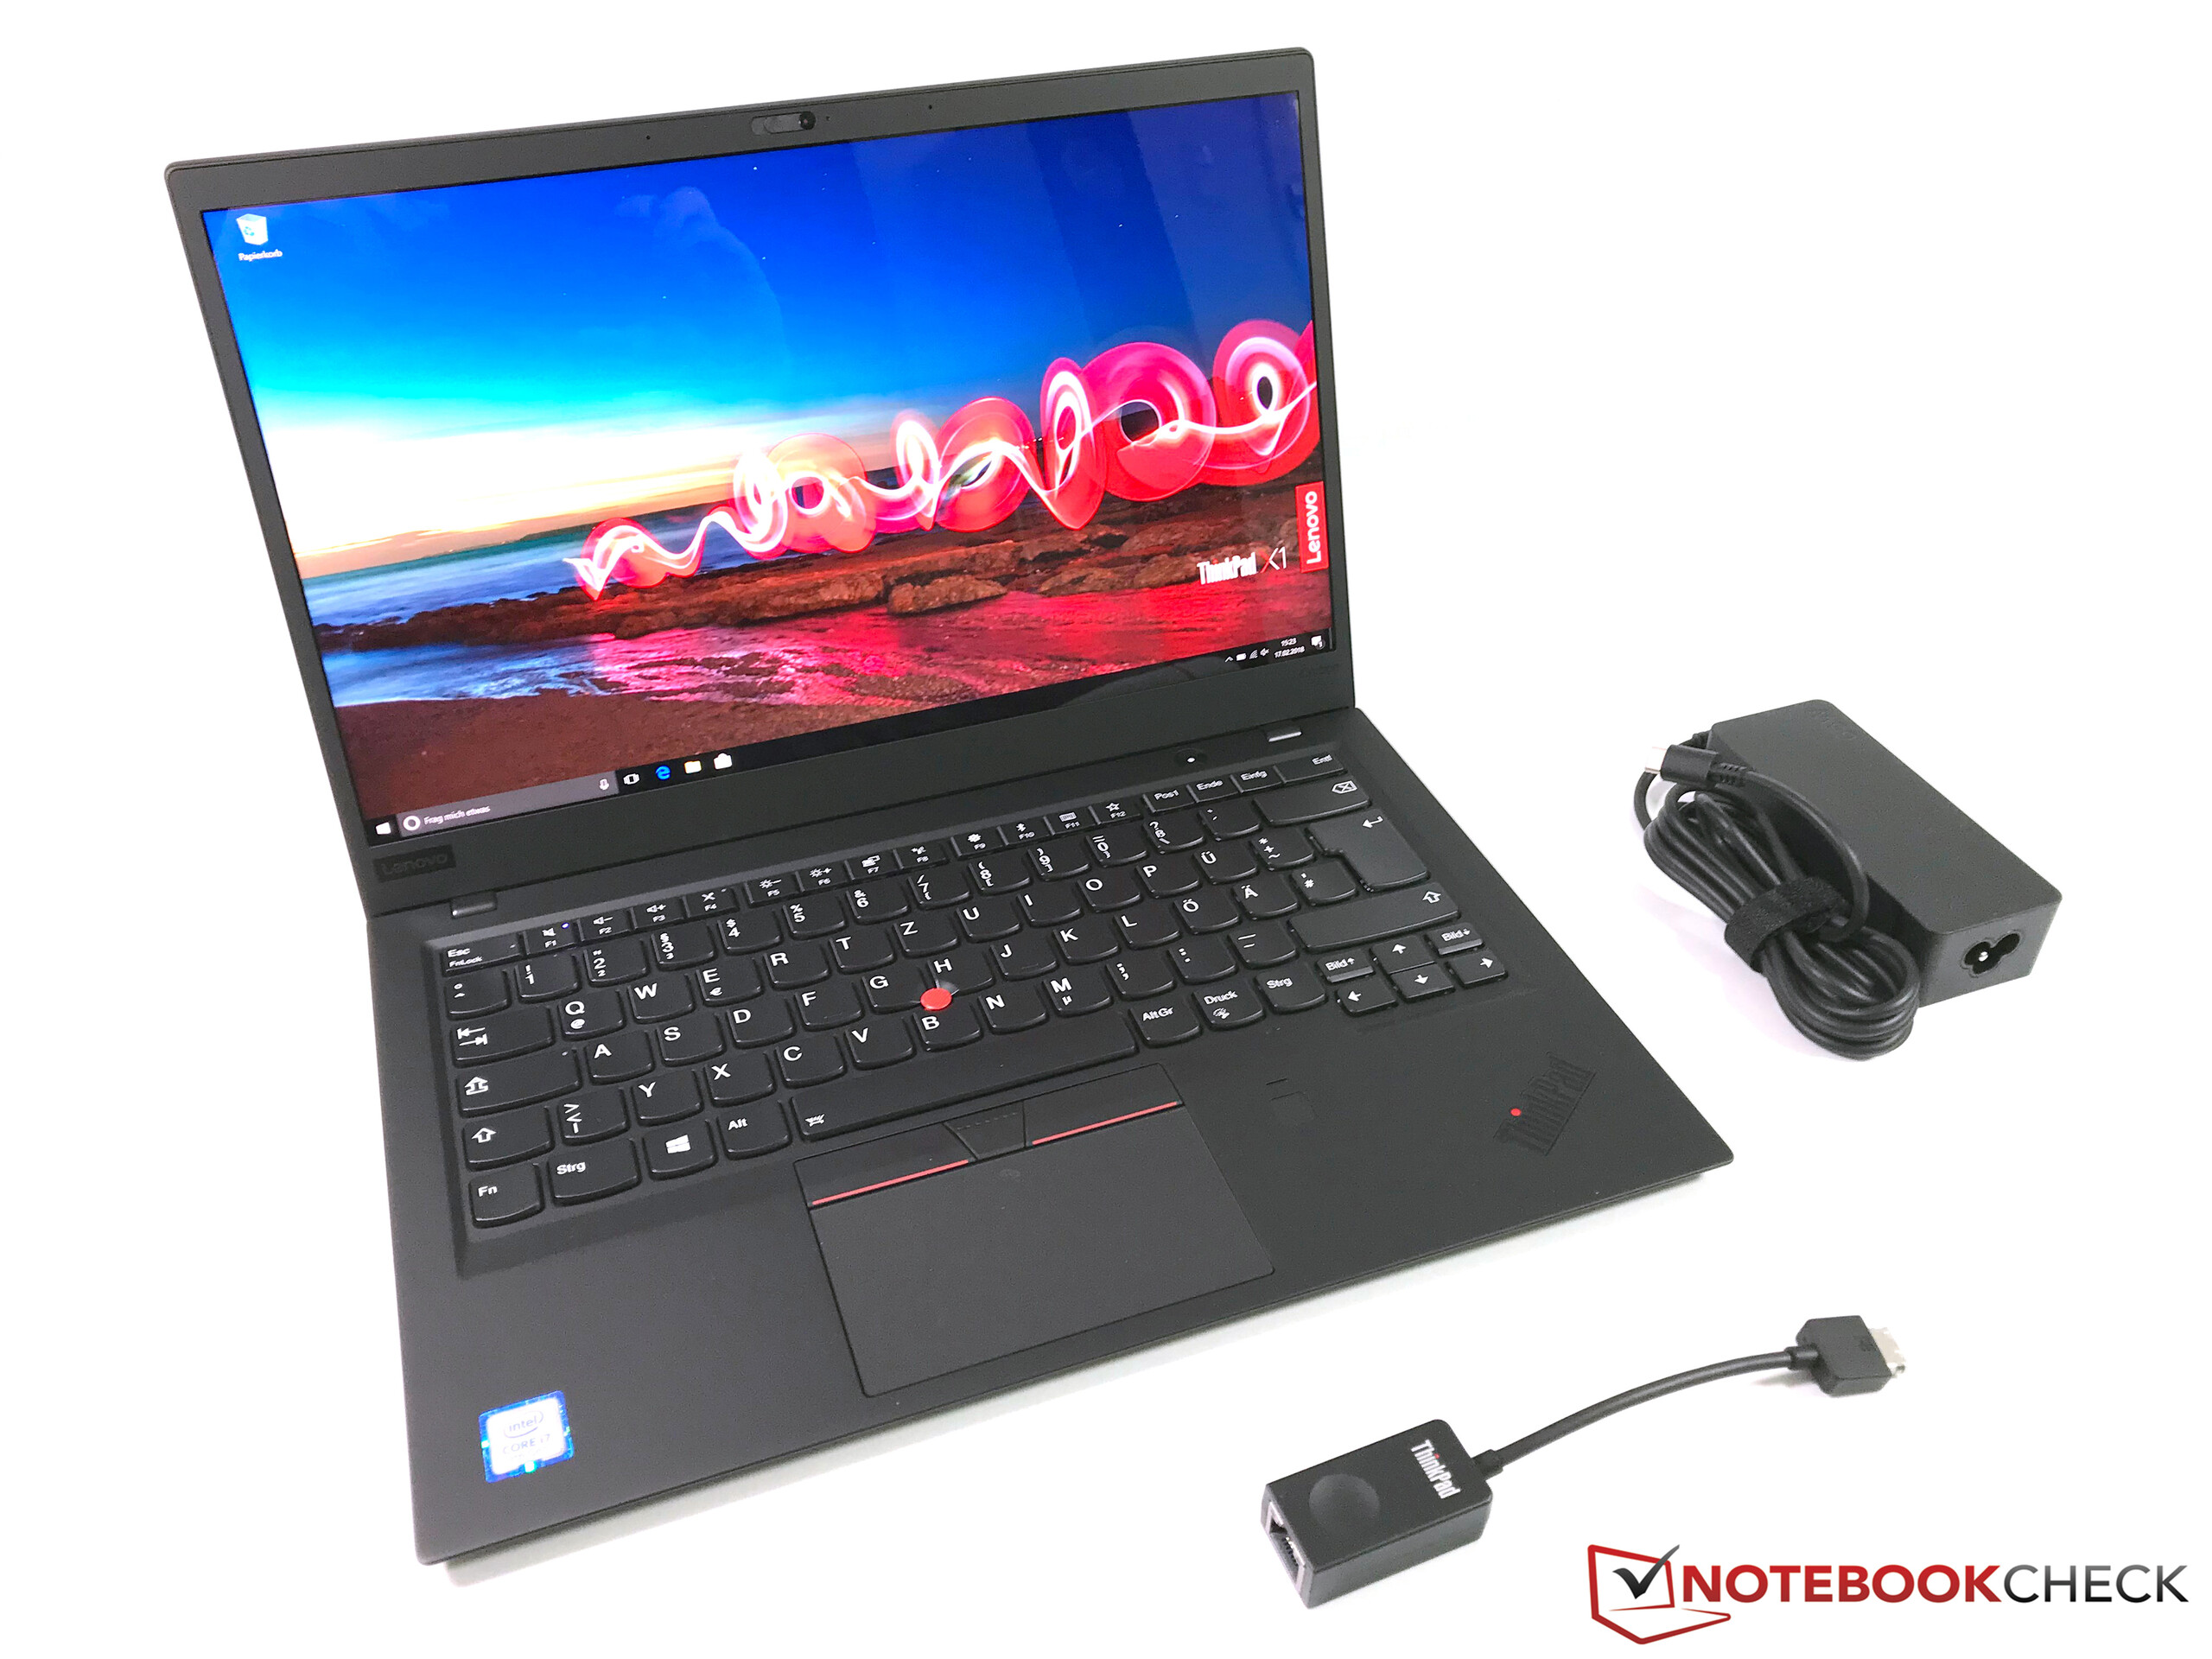
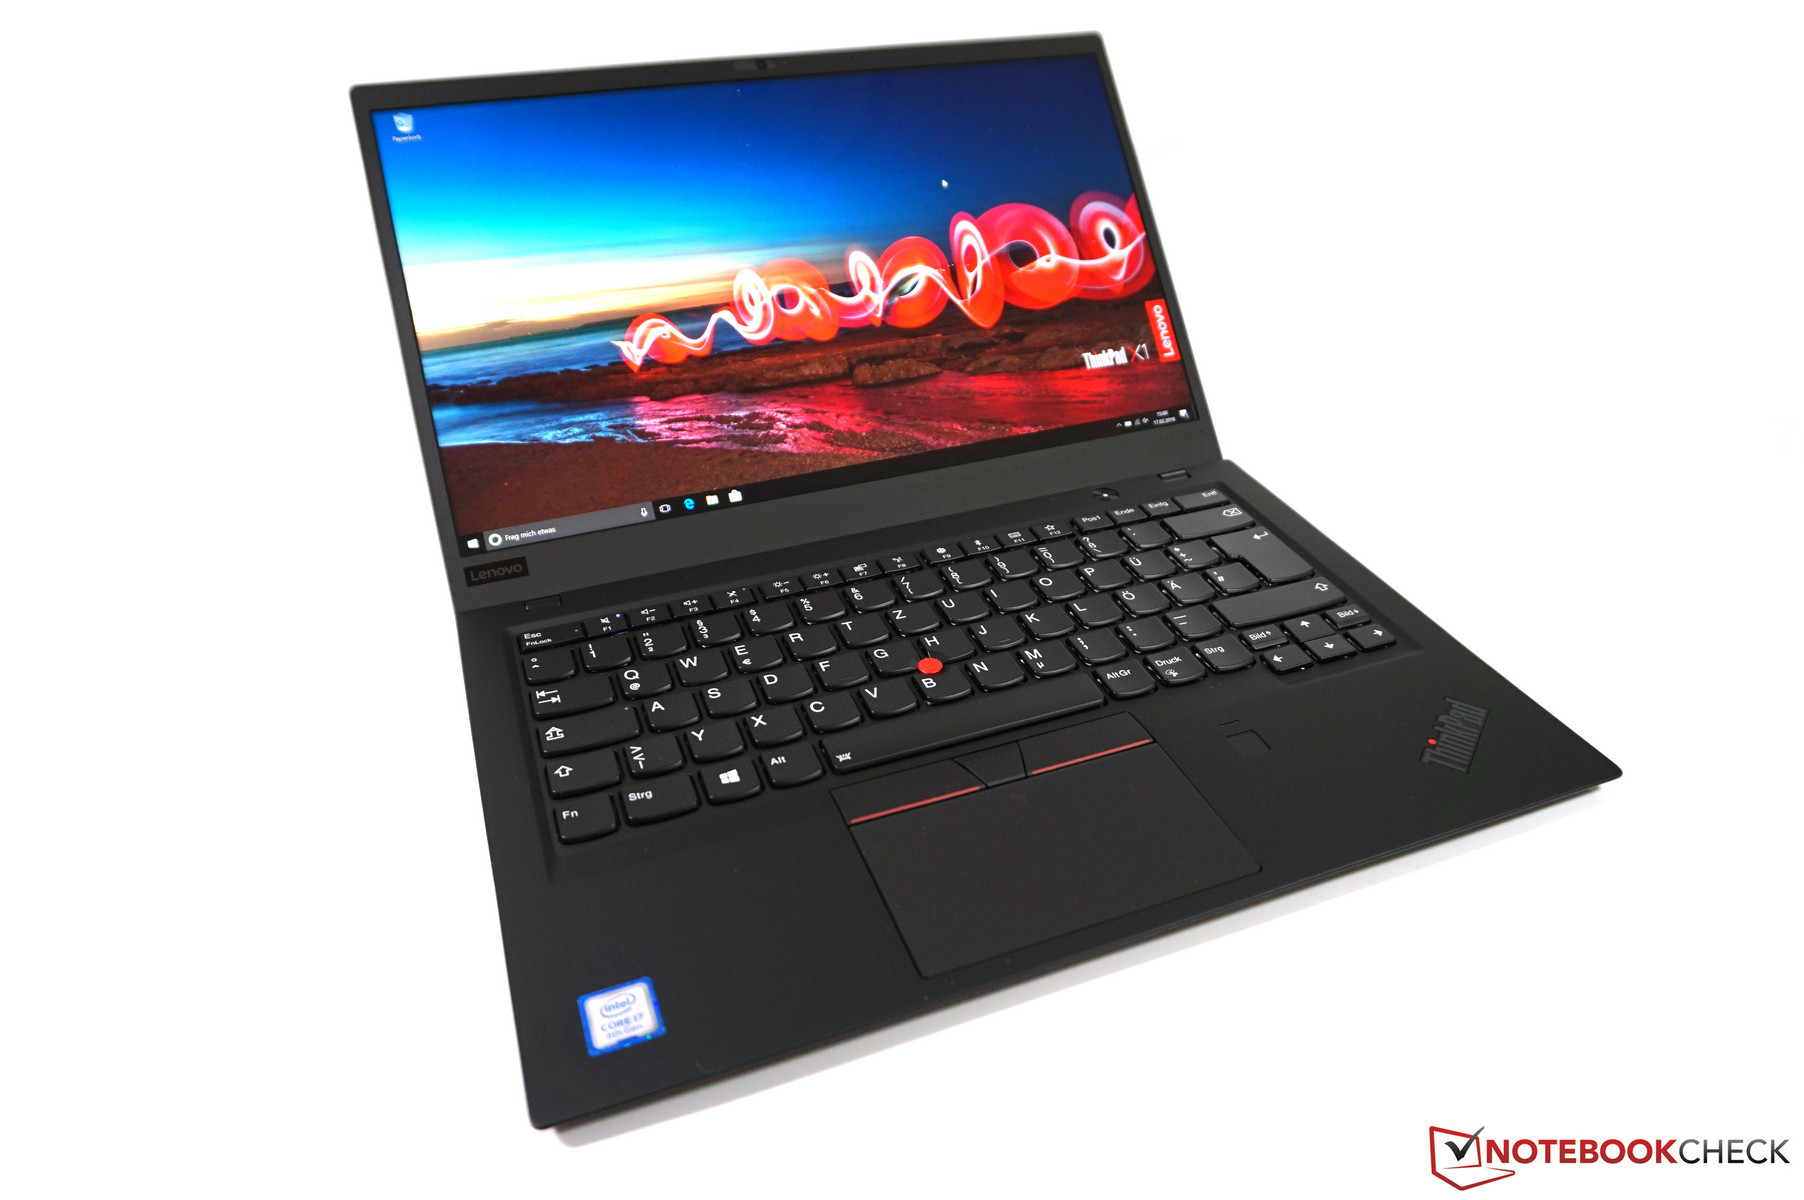
Breve Análise do Portátil Lenovo ThinkPad X1 Carbon 2018 (WQHD HDR, i7)
| |||||||||||||||||||||||||
iluminação: 84 %
iluminação com acumulador: 579 cd/m²
Contraste: 1521:1 (Preto: 0.38 cd/m²)
ΔE ColorChecker Calman: 1.9 | ∀{0.5-29.43 Ø4.71}
calibrated: 0.8
ΔE Greyscale Calman: 3 | ∀{0.09-98 Ø4.96}
100% sRGB (Argyll 1.6.3 3D)
88.8% AdobeRGB 1998 (Argyll 1.6.3 3D)
99.9% AdobeRGB 1998 (Argyll 3D)
100% sRGB (Argyll 3D)
87.7% Display P3 (Argyll 3D)
Gamma: 2.14
CCT: 6377 K
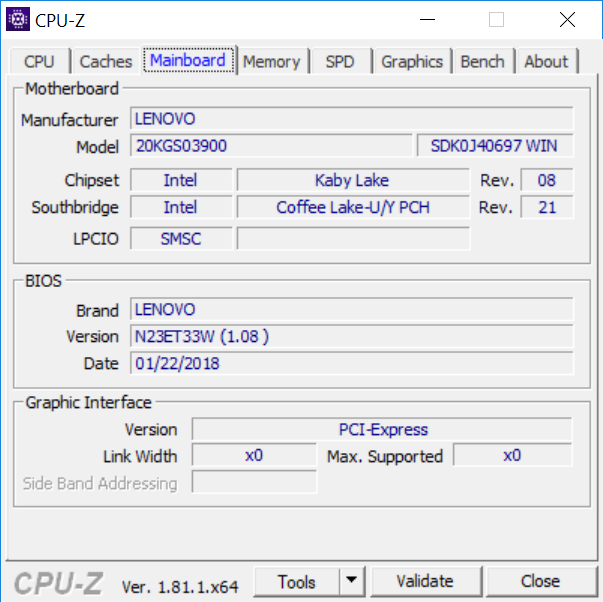
| Lenovo ThinkPad X1 Carbon 2018-20KGS03900 B140QAN02.0, , 2560x1440, 14" | Lenovo ThinkPad X1 Carbon 2017-20HR006FGE LEN40AA (LP140QH2-SPB1), , 2560x1440, 14" | Lenovo ThinkPad X1 Carbon 2017-20HQS03P00 B140HAN03_1, , 1920x1080, 14" | HP EliteBook 840 G4-Z2V49ET ABD AUO123D, , 1920x1080, 14" | Dell Latitude 13 7380 LGD0589, , 1920x1080, 13.3" | Apple MacBook Pro 13 2017 Touchbar i5 APPA034, , 2560x1600, 13.3" | Dell Latitude 7480 LG Philips LGD0557, , 1920x1080, 14" | Fujitsu LifeBook U747 LG LP140WF3, , 1920x1080, 14" | |
|---|---|---|---|---|---|---|---|---|
| Display | -14% | -27% | -32% | -22% | -0% | -22% | -26% | |
| Display P3 Coverage (%) | 87.7 | 73.5 -16% | 61.4 -30% | 55.8 -36% | 65.5 -25% | 98.6 12% | 65.4 -25% | 66.1 -25% |
| sRGB Coverage (%) | 100 | 98.4 -2% | 85.9 -14% | 80.7 -19% | 91.8 -8% | 100 0% | 92.3 -8% | 84.8 -15% |
| AdobeRGB 1998 Coverage (%) | 99.9 | 74.5 -25% | 62.4 -38% | 57.7 -42% | 65.8 -34% | 86.5 -13% | 65.8 -34% | 62 -38% |
| Response Times | 38% | 19% | 34% | 29% | 11% | 20% | 36% | |
| Response Time Grey 50% / Grey 80% * (ms) | 59.2 ? | 35.6 ? 40% | 41.6 ? 30% | 39 ? 34% | 34 ? 43% | 48 ? 19% | 40.8 ? 31% | 36 ? 39% |
| Response Time Black / White * (ms) | 34.4 ? | 22.4 ? 35% | 31.6 ? 8% | 23 ? 33% | 29.6 ? 14% | 33.6 ? 2% | 31.2 ? 9% | 23.2 ? 33% |
| PWM Frequency (Hz) | 119000 ? | |||||||
| Screen | -42% | -55% | -123% | -70% | 17% | -26% | -44% | |
| Brightness middle (cd/m²) | 578 | 342 -41% | 311 -46% | 346 -40% | 317 -45% | 551 -5% | 344 -40% | 291 -50% |
| Brightness (cd/m²) | 533 | 337 -37% | 288 -46% | 317 -41% | 295 -45% | 514 -4% | 321 -40% | 296 -44% |
| Brightness Distribution (%) | 84 | 87 4% | 85 1% | 86 2% | 87 4% | 88 5% | 85 1% | 84 0% |
| Black Level * (cd/m²) | 0.38 | 0.37 3% | 0.24 37% | 0.86 -126% | 0.3 21% | 0.48 -26% | 0.32 16% | 0.32 16% |
| Contrast (:1) | 1521 | 924 -39% | 1296 -15% | 402 -74% | 1057 -31% | 1148 -25% | 1075 -29% | 909 -40% |
| Colorchecker dE 2000 * | 1.9 | 3.6 -89% | 5.5 -189% | 8.64 -355% | 6.3 -232% | 0.8 58% | 2.6 -37% | 4.3 -126% |
| Colorchecker dE 2000 max. * | 3.8 | 7.7 -103% | 9 -137% | 13.58 -257% | 10.4 -174% | 1.4 63% | 7.8 -105% | 7.5 -97% |
| Colorchecker dE 2000 calibrated * | 0.8 | |||||||
| Greyscale dE 2000 * | 3 | 5.8 -93% | 6.2 -107% | 11.24 -275% | 7.8 -160% | 1 67% | 2.6 13% | 4.3 -43% |
| Gamma | 2.14 103% | 2.2 100% | 2.02 109% | 2.62 84% | 1.81 122% | 2.16 102% | 2.28 96% | 2.31 95% |
| CCT | 6377 102% | 6693 97% | 5950 109% | 12530 52% | 7120 91% | 6672 97% | 7050 92% | 6529 100% |
| Color Space (Percent of AdobeRGB 1998) (%) | 88.8 | 68.8 -23% | 55.96 -37% | 52 -41% | 61 -31% | 65.82 -26% | 55.46 -38% | |
| Color Space (Percent of sRGB) (%) | 100 | 98.5 -1% | 85.77 -14% | 80 -20% | 92 -8% | 92.27 -8% | 84.77 -15% | |
| Média Total (Programa/Configurações) | -6% /
-26% | -21% /
-40% | -40% /
-84% | -21% /
-47% | 9% /
12% | -9% /
-19% | -11% /
-30% |
* ... menor é melhor
Exibir tempos de resposta
| ↔ Tempo de resposta preto para branco | ||
|---|---|---|
| 34.4 ms ... ascensão ↗ e queda ↘ combinadas | ↗ 16.4 ms ascensão | 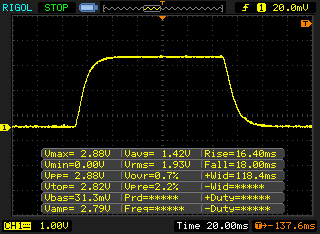 |
| ↘ 18 ms queda | ||
| A tela mostra taxas de resposta lentas em nossos testes e será insatisfatória para os jogadores. Em comparação, todos os dispositivos testados variam de 0.1 (mínimo) a 240 (máximo) ms. » 92 % de todos os dispositivos são melhores. Isso significa que o tempo de resposta medido é pior que a média de todos os dispositivos testados (19.8 ms). | ||
| ↔ Tempo de resposta 50% cinza a 80% cinza | ||
| 59.2 ms ... ascensão ↗ e queda ↘ combinadas | ↗ 28.4 ms ascensão | 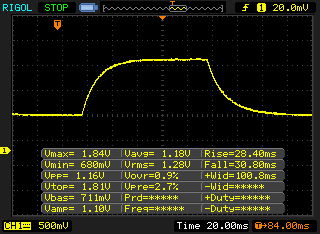 |
| ↘ 30.8 ms queda | ||
| A tela mostra taxas de resposta lentas em nossos testes e será insatisfatória para os jogadores. Em comparação, todos os dispositivos testados variam de 0.165 (mínimo) a 636 (máximo) ms. » 95 % de todos os dispositivos são melhores. Isso significa que o tempo de resposta medido é pior que a média de todos os dispositivos testados (31 ms). | ||
Cintilação da tela / PWM (modulação por largura de pulso)
| Tela tremeluzindo / PWM não detectado | 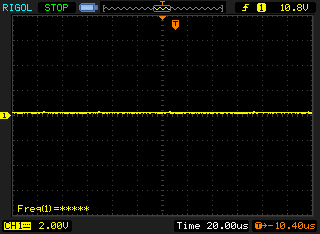 | ||
[pwm_comparison] Em comparação: 52 % de todos os dispositivos testados não usam PWM para escurecer a tela. Se PWM foi detectado, uma média de 7757 (mínimo: 5 - máximo: 343500) Hz foi medida. | |||


| desligado | |
| Ocioso | |
| Carga |
|
Key:
min: | |
| Lenovo ThinkPad X1 Carbon 2018-20KGS03900 i5-8550U, UHD Graphics 620, Samsung SSD PM981 MZVLB512HAJQ, IPS, 2560x1440, 14" | HP EliteBook 840 G4-Z2V49ET ABD i5-7200U, HD Graphics 620, Samsung PM961 MZVLW256HEHP, TN, 1920x1080, 14" | Dell Latitude 13 7380 i7-7600U, HD Graphics 620, Samsung PM961 MZVLW256HEHP, IPS, 1920x1080, 13.3" | Apple MacBook Pro 13 2017 Touchbar i5 i5-7267U, Iris Plus Graphics 650, Apple SSD AP0256, IPS, 2560x1600, 13.3" | Dell Latitude 7480 i7-7600U, HD Graphics 620, Intel SSDSCKKF256H6, IPS, 1920x1080, 14" | Fujitsu LifeBook U747 i5-7200U, HD Graphics 620, Samsung MZYTY256HDHP, IPS LED, 1920x1080, 14" | |
|---|---|---|---|---|---|---|
| Power Consumption | 34% | 36% | -4% | 28% | 21% | |
| Idle Minimum * (Watt) | 3.8 | 2.9 24% | 3.2 16% | 2.8 26% | 4.32 -14% | 4.11 -8% |
| Idle Average * (Watt) | 8.9 | 5.6 37% | 5.5 38% | 10.9 -22% | 6.27 30% | 7.87 12% |
| Idle Maximum * (Watt) | 11.9 | 8.15 32% | 6.1 49% | 11.4 4% | 6.35 47% | 8.74 27% |
| Load Average * (Watt) | 47.5 | 30.6 36% | 29.5 38% | 55.4 -17% | 29.82 37% | 30.2 36% |
| Load Maximum * (Watt) | 52.5 | 31 41% | 32 39% | 57.5 -10% | 30.64 42% | 32.4 38% |
* ... menor é melhor
Fomos entusiasmados com a profundidade e qualidade das cores assim que vimos pela primeira vez a cor do fundo padrão da área de trabalho. Essa impressão foi agravada assistindo alguns vídeos curtos. Finalmente, há um ThinkPad com uma tela excelente que também não decepciona em outras áreas. A tela WQHD HDR do X1 Carbon também supera o já bom painel 4K encontrado no workstation móvel ThinkPad P71. O acabamento brilhante é uma desvantagem para a tela WQHD HDR, especialmente se você planeja usar o dispositivo quando viaja. Felizmente, a Lenovo ainda oferece o painel WQHD mate do modelo do ano passado.
No entanto, estamos confusos com as mudanças nos limites de temperatura. Enquanto ao remover os limites de temperatura da CPU do modelo do ano passado beneficia o desempenho e o sistema permanece estável, as temperaturas da superfície atingem mais de 50 °C sob carga. Talvez, então, a Lenovo melhor não deveria remover completamente esses limites de temperatura. Vamos monitorar isso de perto com testes adicionais, já que não podemos concluir definitivamente depois de um pouco mais de meio dia de testes.
Estamos curiosos para ver como o novo X1 Carbon se compara com o X280 e T480s revisados que também estão atualmente em teste. Também esperamos suas perguntas e sugestões.
Price comparison
