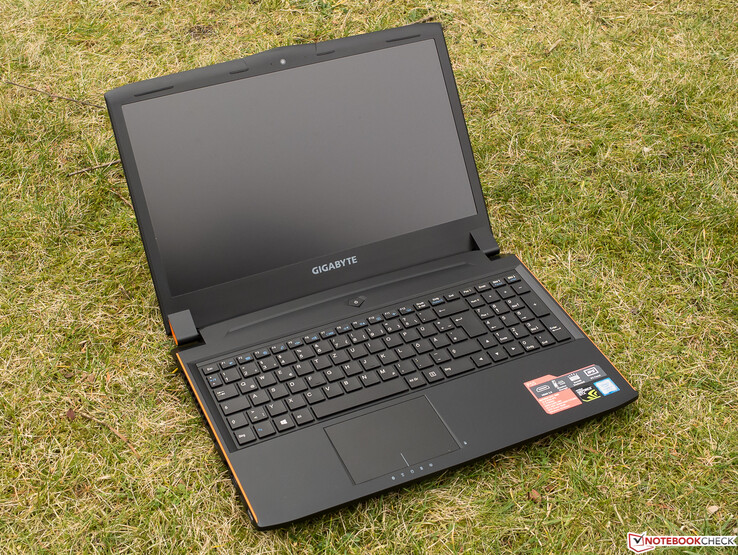
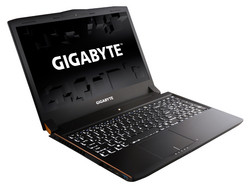
Breve Análise do Portátil Gigabyte P55W v7
Os Top 10
» Os Top 10 Portáteis Multimídia
» Os Top 10 Portáteis de Jogos
» Os Top 10 Portáteis Leves para Jogos
» Os Top 10 Portáteis Acessíveis de Escritório/Empresariais
» Os Top 10 Portáteis Premium de Escritório/Empresariais
» Os Top 10 dos Portáteis Workstation
» Os Top 10 Subportáteis
» Os Top 10 Ultrabooks
» Os Top 10 Conversíveis
» Os Top 10 Tablets
» Os Top 10 Smartphones
» A melhores Telas de Portáteis Analisadas Pela Notebookcheck
» Top 10 dos portáteis abaixo dos 500 Euros da Notebookcheck
» Top 10 dos Portáteis abaixo dos 300 Euros
Size Comparison
| SD Card Reader | |
| average JPG Copy Test (av. of 3 runs) | |
| Schenker XMG P507 | |
| Gigabyte P55W v7 | |
| Asus Strix GL502VM-FY039T | |
| Gigabyte P55W v6 | |
| MSI GE62VR 6RF-001US | |
| maximum AS SSD Seq Read Test (1GB) | |
| Gigabyte P55W v7 | |
| Gigabyte P55W v6 | |
| Schenker XMG P507 | |
| Asus Strix GL502VM-FY039T | |
| MSI GE62VR 6RF-001US | |
| Networking | |
| iperf3 transmit AX12 | |
| Asus Strix GL502VM-FY039T | |
| Gigabyte P55W v6 | |
| Gigabyte P55W v7 | |
| iperf3 receive AX12 | |
| Asus Strix GL502VM-FY039T | |
| Gigabyte P55W v7 | |
| Gigabyte P55W v6 | |
| |||||||||||||||||||||||||
iluminação: 87 %
iluminação com acumulador: 287 cd/m²
Contraste: 990:1 (Preto: 0.29 cd/m²)
ΔE ColorChecker Calman: 4.92 | ∀{0.5-29.43 Ø4.77}
ΔE Greyscale Calman: 3.66 | ∀{0.09-98 Ø5}
82% sRGB (Argyll 1.6.3 3D)
54% AdobeRGB 1998 (Argyll 1.6.3 3D)
59.9% AdobeRGB 1998 (Argyll 3D)
82% sRGB (Argyll 3D)
63.5% Display P3 (Argyll 3D)
Gamma: 2.32
CCT: 6482 K
| Gigabyte P55W v7 LG Philips LP156WF6 (LGD046F), 1920x1080, 15.6" | Asus Strix GL502VM-FY039T LG Philips LP156WF6-SPB6 (LGD046F), 1920x1080, 15.6" | MSI GE62VR 6RF-001US 1920x1080, 15.6" | Schenker XMG P507 LG Philips LP156WF6 (LGD046F), 1920x1080, 15.6" | Gigabyte P55W v6 LG Philips LP156WF4 (LGD040E), 1920x1080, 15.6" | |
|---|---|---|---|---|---|
| Display | 2% | 3% | 2% | -1% | |
| Display P3 Coverage (%) | 63.5 | 64.5 2% | 65.6 3% | 64.5 2% | 63.2 0% |
| sRGB Coverage (%) | 82 | 83.4 2% | 84.3 3% | 83.4 2% | 80.6 -2% |
| AdobeRGB 1998 Coverage (%) | 59.9 | 60.9 2% | 61.7 3% | 61 2% | 59 -2% |
| Response Times | -4% | -3% | 6% | -38% | |
| Response Time Grey 50% / Grey 80% * (ms) | 37 ? | 40 ? -8% | 36.8 ? 1% | 36 ? 3% | 56 ? -51% |
| Response Time Black / White * (ms) | 25 ? | 25 ? -0% | 26.4 ? -6% | 23 ? 8% | 31 ? -24% |
| PWM Frequency (Hz) | |||||
| Screen | 3% | 16% | -1% | -6% | |
| Brightness middle (cd/m²) | 287 | 321 12% | 302 5% | 288 0% | 280 -2% |
| Brightness (cd/m²) | 289 | 296 2% | 303 5% | 292 1% | 294 2% |
| Brightness Distribution (%) | 87 | 88 1% | 87 0% | 87 0% | 82 -6% |
| Black Level * (cd/m²) | 0.29 | 0.33 -14% | 0.169 42% | 0.3 -3% | 0.46 -59% |
| Contrast (:1) | 990 | 973 -2% | 1787 81% | 960 -3% | 609 -38% |
| Colorchecker dE 2000 * | 4.92 | 4.42 10% | 4.61 6% | 5.1 -4% | 4.48 9% |
| Colorchecker dE 2000 max. * | 11 | 9.78 11% | 9.98 9% | 9.44 14% | 10.16 8% |
| Greyscale dE 2000 * | 3.66 | 3.34 9% | 3.32 9% | 4.43 -21% | 2.69 27% |
| Gamma | 2.32 95% | 2.4 92% | 2.24 98% | 2.46 89% | 2.37 93% |
| CCT | 6482 100% | 6213 105% | 6358 102% | 6687 97% | 6455 101% |
| Color Space (Percent of AdobeRGB 1998) (%) | 54 | 55 2% | 55.4 3% | 55 2% | 53 -2% |
| Color Space (Percent of sRGB) (%) | 82 | 83 1% | 84.4 3% | 83 1% | 80 -2% |
| Média Total (Programa/Configurações) | 0% /
2% | 5% /
11% | 2% /
0% | -15% /
-9% |
* ... menor é melhor
Exibir tempos de resposta
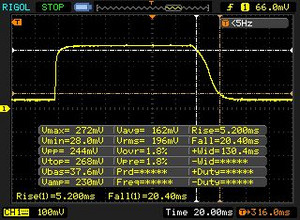
| ↔ Tempo de resposta preto para branco | ||
|---|---|---|
| 25 ms ... ascensão ↗ e queda ↘ combinadas | ↗ 5 ms ascensão | |
| ↘ 20 ms queda | ||
| A tela mostra taxas de resposta relativamente lentas em nossos testes e pode ser muito lenta para os jogadores. Em comparação, todos os dispositivos testados variam de 0.1 (mínimo) a 240 (máximo) ms. » 58 % de todos os dispositivos são melhores. Isso significa que o tempo de resposta medido é pior que a média de todos os dispositivos testados (20.2 ms). | ||
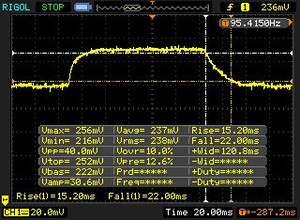
| ↔ Tempo de resposta 50% cinza a 80% cinza | ||
| 37 ms ... ascensão ↗ e queda ↘ combinadas | ↗ 15 ms ascensão | |
| ↘ 22 ms queda | ||
| A tela mostra taxas de resposta lentas em nossos testes e será insatisfatória para os jogadores. Em comparação, todos os dispositivos testados variam de 0.165 (mínimo) a 636 (máximo) ms. » 52 % de todos os dispositivos são melhores. Isso significa que o tempo de resposta medido é pior que a média de todos os dispositivos testados (31.6 ms). | ||
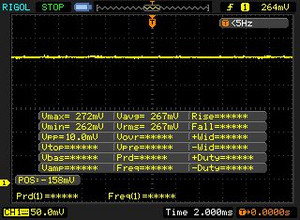
Cintilação da tela / PWM (modulação por largura de pulso)
| Tela tremeluzindo / PWM não detectado | |||
[pwm_comparison] Em comparação: 53 % de todos os dispositivos testados não usam PWM para escurecer a tela. Se PWM foi detectado, uma média de 8084 (mínimo: 5 - máximo: 343500) Hz foi medida. | |||
| PCMark 8 | |
| Home Score Accelerated v2 | |
| Asus Strix GL502VM-FY039T | |
| MSI GE62VR 6RF-001US | |
| Gigabyte P55W v6 | |
| Gigabyte P55W v7 | |
| Work Score Accelerated v2 | |
| Gigabyte P55W v7 | |
| Asus Strix GL502VM-FY039T | |
| MSI GE62VR 6RF-001US | |
| Gigabyte P55W v6 | |
| PCMark 8 Home Score Accelerated v2 | 4013 pontos | |
| PCMark 8 Work Score Accelerated v2 | 5317 pontos | |
Ajuda | ||
| Gigabyte P55W v7 Liteonit CV3-8D256 | Asus Strix GL502VM-FY039T Micron SSD 1100 (MTFDDAV256TBN) | MSI GE62VR 6RF-001US Samsung SM951 MZVPV512HDGL m.2 PCI-e | Schenker XMG P507 Samsung SM951 MZVPV256HDGL m.2 PCI-e | Gigabyte P55W v6 Transcend MTS800 128GB M.2 (TS128GMTS800) | |
|---|---|---|---|---|---|
| CrystalDiskMark 3.0 | 28% | 249% | 227% | -6% | |
| Read Seq (MB/s) | 466.2 | 462.5 -1% | 1696 264% | 1857 298% | 511 10% |
| Write Seq (MB/s) | 261.9 | 462.7 77% | 1584 505% | 1240 373% | 161.1 -38% |
| Read 512 (MB/s) | 252.5 | 335 33% | 1044 313% | 971 285% | 338 34% |
| Write 512 (MB/s) | 254.8 | 407.1 60% | 1562 513% | 1239 386% | 160.8 -37% |
| Read 4k (MB/s) | 25.4 | 25.61 1% | 50.8 100% | 54.1 113% | 26.2 3% |
| Write 4k (MB/s) | 55 | 86.3 57% | 139.2 153% | 167.4 204% | 76.7 39% |
| Read 4k QD32 (MB/s) | 358.5 | 246.7 -31% | 591 65% | 695 94% | 264.7 -26% |
| Write 4k QD32 (MB/s) | 240.1 | 301.5 26% | 422.8 76% | 386.8 61% | 160.3 -33% |
| 3DMark - 1920x1080 Fire Strike Graphics | |
| MSI GE62VR 6RF-001US | |
| Asus Strix GL502VM-FY039T | |
| Gigabyte P55W v7 | |
| Gigabyte P55W v6 | |
| Schenker XMG P507 | |
| 3DMark 11 - 1280x720 Performance GPU | |
| MSI GE62VR 6RF-001US | |
| Asus Strix GL502VM-FY039T | |
| Gigabyte P55W v6 | |
| Gigabyte P55W v7 | |
| Schenker XMG P507 | |
| 3DMark 11 Performance | 11778 pontos | |
| 3DMark Cloud Gate Standard Score | 21839 pontos | |
| 3DMark Fire Strike Score | 9669 pontos | |
Ajuda | ||
| baixo | média | alto | ultra | |
|---|---|---|---|---|
| The Witcher 3 (2015) | 70.4 | 38.4 | ||
| Rise of the Tomb Raider (2016) | 72.6 | 61.8 | ||
| Battlefield 1 (2016) | 77.6 | 73.6 | ||
| Dishonored 2 (2016) | 80.2 | 60.2 | 46.5 | |
| Resident Evil 7 (2017) | 98.5 | 83 |
Barulho
| Ocioso |
| 33 / 34 / 35 dB |
| HDD |
| 34 dB |
| DVD |
| 37 / dB |
| Carga |
| 39 / 50 dB |
 | ||
30 dB silencioso 40 dB(A) audível 50 dB(A) ruidosamente alto |
||
min: | ||
(-) A temperatura máxima no lado superior é 49.6 °C / 121 F, em comparação com a média de 40.4 °C / 105 F , variando de 21.2 a 68.8 °C para a classe Gaming.
(-) A parte inferior aquece até um máximo de 47.7 °C / 118 F, em comparação com a média de 43.3 °C / 110 F
(+) Em uso inativo, a temperatura média para o lado superior é 22.8 °C / 73 F, em comparação com a média do dispositivo de 33.9 °C / ### class_avg_f### F.
(-) Os apoios para as mãos e o touchpad podem ficar muito quentes ao toque, com um máximo de 45.1 °C / 113.2 F.
(-) A temperatura média da área do apoio para as mãos de dispositivos semelhantes foi 28.8 °C / 83.8 F (-16.3 °C / -29.4 F).
Gigabyte P55W v7 análise de áudio
(±) | o volume do alto-falante é médio, mas bom (###valor### dB)
Graves 100 - 315Hz
(-) | quase nenhum baixo - em média 15.9% menor que a mediana
(±) | a linearidade dos graves é média (11.3% delta para a frequência anterior)
Médios 400 - 2.000 Hz
(+) | médios equilibrados - apenas 4.7% longe da mediana
(±) | a linearidade dos médios é média (8.8% delta para frequência anterior)
Altos 2 - 16 kHz
(+) | agudos equilibrados - apenas 3.6% longe da mediana
(±) | a linearidade dos máximos é média (10.1% delta para frequência anterior)
Geral 100 - 16.000 Hz
(±) | a linearidade do som geral é média (18.8% diferença em relação à mediana)
Comparado com a mesma classe
» 62% de todos os dispositivos testados nesta classe foram melhores, 8% semelhantes, 30% piores
» O melhor teve um delta de 6%, a média foi 18%, o pior foi 132%
Comparado com todos os dispositivos testados
» 43% de todos os dispositivos testados foram melhores, 8% semelhantes, 50% piores
» O melhor teve um delta de 4%, a média foi 24%, o pior foi 134%
Asus Strix GL502VM-FY039T análise de áudio
(±) | o volume do alto-falante é médio, mas bom (###valor### dB)
Graves 100 - 315Hz
(-) | quase nenhum baixo - em média 19.1% menor que a mediana
(-) | graves não são lineares (18.1% delta para frequência anterior)
Médios 400 - 2.000 Hz
(+) | médios equilibrados - apenas 2.9% longe da mediana
(+) | médios são lineares (4% delta para frequência anterior)
Altos 2 - 16 kHz
(±) | máximos mais altos - em média 5.6% maior que a mediana
(±) | a linearidade dos máximos é média (8% delta para frequência anterior)
Geral 100 - 16.000 Hz
(±) | a linearidade do som geral é média (23% diferença em relação à mediana)
Comparado com a mesma classe
» 83% de todos os dispositivos testados nesta classe foram melhores, 5% semelhantes, 12% piores
» O melhor teve um delta de 6%, a média foi 18%, o pior foi 132%
Comparado com todos os dispositivos testados
» 68% de todos os dispositivos testados foram melhores, 6% semelhantes, 27% piores
» O melhor teve um delta de 4%, a média foi 24%, o pior foi 134%
MSI GE62VR 6RF-001US análise de áudio
(±) | o volume do alto-falante é médio, mas bom (###valor### dB)
Graves 100 - 315Hz
(±) | graves reduzidos - em média 13.1% menor que a mediana
(±) | a linearidade dos graves é média (12% delta para a frequência anterior)
Médios 400 - 2.000 Hz
(+) | médios equilibrados - apenas 3% longe da mediana
(±) | a linearidade dos médios é média (12% delta para frequência anterior)
Altos 2 - 16 kHz
(+) | agudos equilibrados - apenas 4.4% longe da mediana
(±) | a linearidade dos máximos é média (10.1% delta para frequência anterior)
Geral 100 - 16.000 Hz
(±) | a linearidade do som geral é média (18.6% diferença em relação à mediana)
Comparado com a mesma classe
» 60% de todos os dispositivos testados nesta classe foram melhores, 9% semelhantes, 31% piores
» O melhor teve um delta de 6%, a média foi 18%, o pior foi 132%
Comparado com todos os dispositivos testados
» 41% de todos os dispositivos testados foram melhores, 8% semelhantes, 51% piores
» O melhor teve um delta de 4%, a média foi 24%, o pior foi 134%
Schenker XMG P507 análise de áudio
(±) | o volume do alto-falante é médio, mas bom (###valor### dB)
Graves 100 - 315Hz
(-) | quase nenhum baixo - em média 20.7% menor que a mediana
(±) | a linearidade dos graves é média (8.8% delta para a frequência anterior)
Médios 400 - 2.000 Hz
(+) | médios equilibrados - apenas 2.2% longe da mediana
(±) | a linearidade dos médios é média (7.6% delta para frequência anterior)
Altos 2 - 16 kHz
(+) | agudos equilibrados - apenas 2.3% longe da mediana
(+) | os máximos são lineares (5.3% delta da frequência anterior)
Geral 100 - 16.000 Hz
(±) | a linearidade do som geral é média (19% diferença em relação à mediana)
Comparado com a mesma classe
» 63% de todos os dispositivos testados nesta classe foram melhores, 8% semelhantes, 29% piores
» O melhor teve um delta de 6%, a média foi 18%, o pior foi 132%
Comparado com todos os dispositivos testados
» 44% de todos os dispositivos testados foram melhores, 8% semelhantes, 48% piores
» O melhor teve um delta de 4%, a média foi 24%, o pior foi 134%
| desligado | |
| Ocioso | |
| Carga |
|
Key:
min: | |
| Gigabyte P55W v7 i7-7700HQ, GeForce GTX 1060 Mobile | Asus Strix GL502VM-FY039T 6700HQ, GeForce GTX 1060 Mobile | MSI GE62VR 6RF-001US 6700HQ, GeForce GTX 1060 Mobile | Schenker XMG P507 6700HQ, GeForce GTX 1060 Mobile | Gigabyte P55W v6 6700HQ, GeForce GTX 1060 Mobile | |
|---|---|---|---|---|---|
| Power Consumption | -35% | -97% | -21% | -0% | |
| Idle Minimum * (Watt) | 8 | 16 -100% | 25.4 -218% | 11 -38% | 8 -0% |
| Idle Average * (Watt) | 13 | 19 -46% | 30.3 -133% | 16 -23% | 13 -0% |
| Idle Maximum * (Watt) | 18 | 23 -28% | 31.5 -75% | 21 -17% | 17 6% |
| Load Average * (Watt) | 76 | 68 11% | 111.8 -47% | 80 -5% | 71 7% |
| Load Maximum * (Watt) | 143 | 157 -10% | 163.2 -14% | 174 -22% | 165 -15% |
* ... menor é melhor
| Gigabyte P55W v7 i7-7700HQ, GeForce GTX 1060 Mobile, 63 Wh | Asus Strix GL502VM-FY039T 6700HQ, GeForce GTX 1060 Mobile, 64 Wh | MSI GE62VR 6RF-001US 6700HQ, GeForce GTX 1060 Mobile, 51 Wh | Schenker XMG P507 6700HQ, GeForce GTX 1060 Mobile, 60 Wh | Gigabyte P55W v6 6700HQ, GeForce GTX 1060 Mobile, 63 Wh | |
|---|---|---|---|---|---|
| Duração da bateria | -34% | -72% | -13% | -7% | |
| Reader / Idle (h) | 13.2 | 5.3 -60% | 2.3 -83% | 6.8 -48% | 10.2 -23% |
| WiFi v1.3 (h) | 5.8 | 3.7 -36% | 1.7 -71% | 4.6 -21% | 5.9 2% |
| Load (h) | 1.6 | 1.5 -6% | 0.6 -62% | 2.1 31% | 1.6 0% |
| H.264 (h) | 3.9 | 5.6 |
Pro
Contra
A Gigabyte mais uma vez fez recortes nos lugares corretos e coloca um bom portátil de jogos na corrida, com o P55W v7. Omitir recursos, como Thunderbolt 3 e G-Sync, torna possível para os compradores, economizar algumas centenas de Euros - e isto sem compromissos no desempenho.
Apenas pelo preço relativamente baixo, nós particularmente gostamos dos dispositivos de entrada e, com algumas restrições, o painel IPS. isto também se aplica à sólida carcaça de plástico com sua placa inferior fácil de remover. O posicionamento das interfaces, os tempos de resposta relativamente lentos da tela, e o SSD não muito convincente, não são tão favoráveis. Os ruídos de alta frequência durante o uso intenso são a única desvantagem do Gigabyte P55W v7. No entanto, este fenômeno poderia ser um caso isolado. Por isso, ele consegue facilmente uma recomendação de compra, mas com uma clausula de verificação do som.
Gigabyte P55W v7
- 02/28/2017 v6 (old)
Sven Kloevekorn


