Breve Análise do Portátil HP ProBook 440 G5 (i5-8250U, FHD)

| SD Card Reader | |
| average JPG Copy Test (av. of 3 runs) | |
| HP ProBook 440 G5-3KX87ES (Toshiba Exceria Pro SDXC 64 GB UHS-II) | |
| Lenovo ThinkPad E480-20KQS00000 (Toshiba Exceria Pro M501) | |
| HP ProBook 440 G4-Y8B51EA (Toshiba Exceria Pro SDXC 64 GB UHS-II) | |
| Média da turma Office (19.8 - 198.5, n=22, últimos 2 anos) | |
| Acer TravelMate P449-G2-M-56CD (Toshiba Exceria Pro SDXC 64 GB UHS-II) | |
| Dell Latitude 14 3470 (Toshiba Exceria Pro SDXC 64 GB UHS-II) | |
| maximum AS SSD Seq Read Test (1GB) | |
| HP ProBook 440 G5-3KX87ES (Toshiba Exceria Pro SDXC 64 GB UHS-II) | |
| HP ProBook 440 G4-Y8B51EA (Toshiba Exceria Pro SDXC 64 GB UHS-II) | |
| Lenovo ThinkPad E480-20KQS00000 (Toshiba Exceria Pro M501) | |
| Média da turma Office (27.4 - 249, n=21, últimos 2 anos) | |
| Dell Latitude 14 3470 (Toshiba Exceria Pro SDXC 64 GB UHS-II) | |
| Acer TravelMate P449-G2-M-56CD (Toshiba Exceria Pro SDXC 64 GB UHS-II) | |
| Networking | |
| iperf3 transmit AX12 | |
| Acer TravelMate P449-G2-M-56CD | |
| HP ProBook 440 G5-3KX87ES | |
| Lenovo ThinkPad E480-20KQS00000 | |
| iperf3 receive AX12 | |
| Lenovo ThinkPad E480-20KQS00000 | |
| HP ProBook 440 G5-3KX87ES | |
| Acer TravelMate P449-G2-M-56CD | |
| |||||||||||||||||||||||||
iluminação: 88 %
iluminação com acumulador: 234 cd/m²
Contraste: 908:1 (Preto: 0.26 cd/m²)
ΔE ColorChecker Calman: 5.7 | ∀{0.5-29.43 Ø4.71}
ΔE Greyscale Calman: 3.8 | ∀{0.09-98 Ø4.96}
59.2% sRGB (Argyll 1.6.3 3D)
37.7% AdobeRGB 1998 (Argyll 1.6.3 3D)
40.88% AdobeRGB 1998 (Argyll 3D)
59.3% sRGB (Argyll 3D)
39.56% Display P3 (Argyll 3D)
Gamma: 2.1
CCT: 7318 K
| HP ProBook 440 G5-3KX87ES LGD04B2, , 1920x1080, 14" | Lenovo ThinkPad E480-20KQS00000 Innolux N140HCA-EAC, , 1920x1080, 14" | Dell Latitude 14 3470 Innolux N140BGE, , 1366x768, 14" | Acer TravelMate P449-G2-M-56CD N140HCA-EAB, , 1920x1080, 14" | HP ProBook 440 G4-Y8B51EA AUO1E3D, , 1920x1080, 14" | Lenovo ThinkPad E480-20KNCTO1WW Innolux N140HCA-EAC, , 1920x1080, 14" | |
|---|---|---|---|---|---|---|
| Display | 6% | 2% | 4% | -5% | 5% | |
| Display P3 Coverage (%) | 39.56 | 41.88 6% | 40.21 2% | 41.04 4% | 37.6 -5% | 41.56 5% |
| sRGB Coverage (%) | 59.3 | 62.8 6% | 60.5 2% | 61.2 3% | 56.6 -5% | 62.2 5% |
| AdobeRGB 1998 Coverage (%) | 40.88 | 43.29 6% | 41.55 2% | 42.47 4% | 38.85 -5% | 42.96 5% |
| Response Times | -9% | -4% | 3% | 4% | -10% | |
| Response Time Grey 50% / Grey 80% * (ms) | 40 ? | 44 ? -10% | 47 ? -18% | 39 ? 2% | 43.2 ? -8% | 44.8 ? -12% |
| Response Time Black / White * (ms) | 28.8 ? | 31.2 ? -8% | 26 ? 10% | 28 ? 3% | 24.4 ? 15% | 31.2 ? -8% |
| PWM Frequency (Hz) | 24880 ? | 25000 ? | 25000 ? | |||
| Screen | 13% | -45% | -1% | -34% | 1% | |
| Brightness middle (cd/m²) | 236 | 251 6% | 206 -13% | 271 15% | 216 -8% | 262 11% |
| Brightness (cd/m²) | 221 | 231 5% | 193 -13% | 256 16% | 203 -8% | 245 11% |
| Brightness Distribution (%) | 88 | 80 -9% | 87 -1% | 85 -3% | 83 -6% | 83 -6% |
| Black Level * (cd/m²) | 0.26 | 0.19 27% | 0.48 -85% | 0.43 -65% | 0.47 -81% | 0.19 27% |
| Contrast (:1) | 908 | 1321 45% | 429 -53% | 630 -31% | 460 -49% | 1379 52% |
| Colorchecker dE 2000 * | 5.7 | 5.1 11% | 11 -93% | 5.03 12% | 8.98 -58% | 7 -23% |
| Colorchecker dE 2000 max. * | 22 | 10.6 52% | 19.57 11% | 11.9 46% | 14.07 36% | 23.6 -7% |
| Greyscale dE 2000 * | 3.8 | 4.5 -18% | 11.51 -203% | 4.02 -6% | 9.61 -153% | 6.4 -68% |
| Gamma | 2.1 105% | 2.18 101% | 2.23 99% | 2.31 95% | 2.63 84% | 2.14 103% |
| CCT | 7318 89% | 6146 106% | 13671 48% | 6659 98% | 11265 58% | 6065 107% |
| Color Space (Percent of AdobeRGB 1998) (%) | 37.7 | 39.8 6% | 38.46 2% | 39 3% | 35.9 -5% | 39.5 5% |
| Color Space (Percent of sRGB) (%) | 59.2 | 62.5 6% | 60.61 2% | 61 3% | 56.7 -4% | 61.9 5% |
| Média Total (Programa/Configurações) | 3% /
9% | -16% /
-30% | 2% /
0% | -12% /
-23% | -1% /
0% |
* ... menor é melhor
Exibir tempos de resposta
| ↔ Tempo de resposta preto para branco | ||
|---|---|---|
| 28.8 ms ... ascensão ↗ e queda ↘ combinadas | ↗ 17.2 ms ascensão | 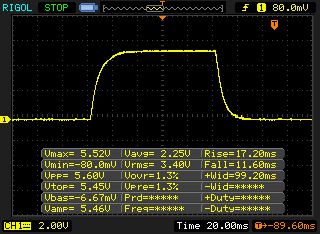 |
| ↘ 11.6 ms queda | ||
| A tela mostra taxas de resposta relativamente lentas em nossos testes e pode ser muito lenta para os jogadores. Em comparação, todos os dispositivos testados variam de 0.1 (mínimo) a 240 (máximo) ms. » 76 % de todos os dispositivos são melhores. Isso significa que o tempo de resposta medido é pior que a média de todos os dispositivos testados (19.8 ms). | ||
| ↔ Tempo de resposta 50% cinza a 80% cinza | ||
| 40 ms ... ascensão ↗ e queda ↘ combinadas | ↗ 21.2 ms ascensão | 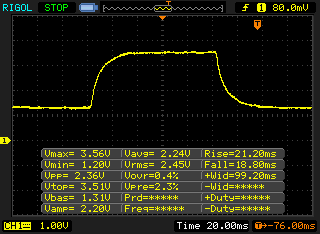 |
| ↘ 18.8 ms queda | ||
| A tela mostra taxas de resposta lentas em nossos testes e será insatisfatória para os jogadores. Em comparação, todos os dispositivos testados variam de 0.165 (mínimo) a 636 (máximo) ms. » 61 % de todos os dispositivos são melhores. Isso significa que o tempo de resposta medido é pior que a média de todos os dispositivos testados (31 ms). | ||
Cintilação da tela / PWM (modulação por largura de pulso)
| Tela tremeluzindo / PWM não detectado |  | ||
[pwm_comparison] Em comparação: 52 % de todos os dispositivos testados não usam PWM para escurecer a tela. Se PWM foi detectado, uma média de 7754 (mínimo: 5 - máximo: 343500) Hz foi medida. | |||
| Cinebench R15 | |
| CPU Single 64Bit | |
| Média da turma Office (99.5 - 316, n=77, últimos 2 anos) | |
| HP ProBook 440 G5-3KX87ES | |
| HP ProBook 440 G4-Y8B51EA | |
| Lenovo ThinkPad E480-20KQS00000 | |
| Média Intel Core i5-8250U (81 - 147, n=97) | |
| Acer TravelMate P449-G2-M-56CD | |
| Dell Latitude 14 3470 | |
| CPU Multi 64Bit | |
| Média da turma Office (250 - 3380, n=77, últimos 2 anos) | |
| HP ProBook 440 G5-3KX87ES | |
| Média Intel Core i5-8250U (320 - 730, n=101) | |
| Lenovo ThinkPad E480-20KQS00000 | |
| HP ProBook 440 G4-Y8B51EA | |
| Acer TravelMate P449-G2-M-56CD | |
| Dell Latitude 14 3470 | |
| PCMark 8 | |
| Home Score Accelerated v2 | |
| Média da turma Office (n=1últimos 2 anos) | |
| Lenovo ThinkPad E480-20KQS00000 | |
| HP ProBook 440 G5-3KX87ES | |
| HP ProBook 440 G4-Y8B51EA | |
| Média Intel Core i5-8250U, Intel UHD Graphics 620 (2986 - 4458, n=69) | |
| Acer TravelMate P449-G2-M-56CD | |
| Dell Latitude 14 3470 | |
| Work Score Accelerated v2 | |
| Média da turma Office (n=1últimos 2 anos) | |
| Lenovo ThinkPad E480-20KQS00000 | |
| HP ProBook 440 G5-3KX87ES | |
| HP ProBook 440 G4-Y8B51EA | |
| Média Intel Core i5-8250U, Intel UHD Graphics 620 (2699 - 5106, n=58) | |
| Acer TravelMate P449-G2-M-56CD | |
| Dell Latitude 14 3470 | |
| PCMark 10 | |
| Digital Content Creation | |
| Média da turma Office (2049 - 13541, n=68, últimos 2 anos) | |
| Lenovo ThinkPad E480-20KQS00000 | |
| HP ProBook 440 G5-3KX87ES | |
| Média Intel Core i5-8250U, Intel UHD Graphics 620 (2613 - 3082, n=67) | |
| Acer TravelMate P449-G2-M-56CD | |
| Productivity | |
| Média da turma Office (5336 - 17243, n=68, últimos 2 anos) | |
| Lenovo ThinkPad E480-20KQS00000 | |
| HP ProBook 440 G5-3KX87ES | |
| Média Intel Core i5-8250U, Intel UHD Graphics 620 (3851 - 6653, n=67) | |
| Acer TravelMate P449-G2-M-56CD | |
| Essentials | |
| Média da turma Office (3245 - 11594, n=68, últimos 2 anos) | |
| Lenovo ThinkPad E480-20KQS00000 | |
| HP ProBook 440 G5-3KX87ES | |
| Média Intel Core i5-8250U, Intel UHD Graphics 620 (5855 - 9289, n=67) | |
| Acer TravelMate P449-G2-M-56CD | |
| Score | |
| Média da turma Office (2601 - 9298, n=68, últimos 2 anos) | |
| Lenovo ThinkPad E480-20KQS00000 | |
| HP ProBook 440 G5-3KX87ES | |
| Média Intel Core i5-8250U, Intel UHD Graphics 620 (3358 - 4081, n=67) | |
| Acer TravelMate P449-G2-M-56CD | |
| PCMark 8 Home Score Accelerated v2 | 3774 pontos | |
| PCMark 8 Work Score Accelerated v2 | 4922 pontos | |
| PCMark 10 Score | 3577 pontos | |
Ajuda | ||
| HP ProBook 440 G5-3KX87ES Intel SSD 600p SSDPEKKW256G7 | Lenovo ThinkPad E480-20KQS00000 Lenovo LENSE20256GMSP34MEAT2TA | Dell Latitude 14 3470 Toshiba MQ01ACF050 | Acer TravelMate P449-G2-M-56CD Intel SSD 600p SSDPEKKW512G7 | HP ProBook 440 G4-Y8B51EA SanDisk SD8SNAT256G1002 | Média Intel SSD 600p SSDPEKKW256G7 | |
|---|---|---|---|---|---|---|
| CrystalDiskMark 3.0 | -31% | -95% | 2% | -51% | -12% | |
| Read Seq (MB/s) | 1181 | 1295 10% | 108.9 -91% | 1086 -8% | 491.2 -58% | 1122 ? -5% |
| Write Seq (MB/s) | 602 | 160.6 -73% | 103.2 -83% | 581 -3% | 322.2 -46% | 524 ? -13% |
| Read 512 (MB/s) | 923 | 872 -6% | 869 -6% | 310.1 -66% | 767 ? -17% | |
| Write 512 (MB/s) | 600 | 122 -80% | 584 -3% | 276 -54% | 541 ? -10% | |
| Read 4k (MB/s) | 35.48 | 25.72 -28% | 0.362 -99% | 35.89 1% | 19.57 -45% | 29.9 ? -16% |
| Write 4k (MB/s) | 139.8 | 95.2 -32% | 0.946 -99% | 122.4 -12% | 77.8 -44% | 114.5 ? -18% |
| Read 4k QD32 (MB/s) | 287.8 | 389.9 35% | 0.721 -100% | 462.9 61% | 146.3 -49% | 279 ? -3% |
| Write 4k QD32 (MB/s) | 417.1 | 118.3 -72% | 0.901 -100% | 370.9 -11% | 241.4 -42% | 356 ? -15% |

| 3DMark 11 - 1280x720 Performance GPU | |
| Média da turma Office (2551 - 18313, n=72, últimos 2 anos) | |
| Lenovo ThinkPad E480-20KQS00000 | |
| Lenovo ThinkPad E480-20KQS00000 | |
| HP ProBook 440 G4-Y8B51EA | |
| Média Intel UHD Graphics 620 (1144 - 3432, n=244) | |
| HP ProBook 440 G5-3KX87ES | |
| Acer TravelMate P449-G2-M-56CD | |
| Dell Latitude 14 3470 | |
| 3DMark | |
| 1280x720 Cloud Gate Standard Graphics | |
| Média da turma Office (11640 - 118515, n=38, últimos 2 anos) | |
| Lenovo ThinkPad E480-20KQS00000 | |
| Média Intel UHD Graphics 620 (6205 - 16400, n=225) | |
| HP ProBook 440 G4-Y8B51EA | |
| HP ProBook 440 G5-3KX87ES | |
| Acer TravelMate P449-G2-M-56CD | |
| Dell Latitude 14 3470 | |
| 1920x1080 Fire Strike Graphics | |
| Média da turma Office (736 - 21871, n=75, últimos 2 anos) | |
| Lenovo ThinkPad E480-20KQS00000 | |
| HP ProBook 440 G4-Y8B51EA | |
| Média Intel UHD Graphics 620 (557 - 2608, n=213) | |
| HP ProBook 440 G5-3KX87ES | |
| Acer TravelMate P449-G2-M-56CD | |
| Dell Latitude 14 3470 | |
| 3DMark 11 Performance | 1736 pontos | |
| 3DMark Cloud Gate Standard Score | 7127 pontos | |
| 3DMark Fire Strike Score | 873 pontos | |
Ajuda | ||
| baixo | média | alto | ultra | |
|---|---|---|---|---|
| BioShock Infinite (2013) | 53.6 | 28.19 | 23.14 | |
| Company of Heroes 2 (2013) | 25 | |||
| Rise of the Tomb Raider (2016) | 20.26 |
Barulho
| Ocioso |
| 29.1 / 29.1 / 30.7 dB |
| Carga |
| 34.5 / 36 dB |
 | ||
30 dB silencioso 40 dB(A) audível 50 dB(A) ruidosamente alto |
||
min: | ||
(+) A temperatura máxima no lado superior é 39 °C / 102 F, em comparação com a média de 34.3 °C / 94 F , variando de 21.2 a 62.5 °C para a classe Office.
(-) A parte inferior aquece até um máximo de 45.5 °C / 114 F, em comparação com a média de 36.8 °C / 98 F
(+) Em uso inativo, a temperatura média para o lado superior é 22.9 °C / 73 F, em comparação com a média do dispositivo de 29.5 °C / ### class_avg_f### F.
(+) Os apoios para as mãos e o touchpad são mais frios que a temperatura da pele, com um máximo de 24.5 °C / 76.1 F e, portanto, são frios ao toque.
(+) A temperatura média da área do apoio para as mãos de dispositivos semelhantes foi 27.5 °C / 81.5 F (+3 °C / 5.4 F).
HP ProBook 440 G5-3KX87ES análise de áudio
(±) | o volume do alto-falante é médio, mas bom (###valor### dB)
Graves 100 - 315Hz
(-) | quase nenhum baixo - em média 25.3% menor que a mediana
(±) | a linearidade dos graves é média (13.4% delta para a frequência anterior)
Médios 400 - 2.000 Hz
(+) | médios equilibrados - apenas 3.5% longe da mediana
(+) | médios são lineares (5.6% delta para frequência anterior)
Altos 2 - 16 kHz
(+) | agudos equilibrados - apenas 4.1% longe da mediana
(+) | os máximos são lineares (3.3% delta da frequência anterior)
Geral 100 - 16.000 Hz
(±) | a linearidade do som geral é média (23.1% diferença em relação à mediana)
Comparado com a mesma classe
» 65% de todos os dispositivos testados nesta classe foram melhores, 7% semelhantes, 29% piores
» O melhor teve um delta de 7%, a média foi 21%, o pior foi 53%
Comparado com todos os dispositivos testados
» 69% de todos os dispositivos testados foram melhores, 5% semelhantes, 26% piores
» O melhor teve um delta de 4%, a média foi 23%, o pior foi 134%
Lenovo ThinkPad E480-20KQS00000 análise de áudio
(±) | o volume do alto-falante é médio, mas bom (###valor### dB)
Graves 100 - 315Hz
(±) | graves reduzidos - em média 13.2% menor que a mediana
(±) | a linearidade dos graves é média (12.4% delta para a frequência anterior)
Médios 400 - 2.000 Hz
(±) | médios mais altos - em média 5.2% maior que a mediana
(±) | a linearidade dos médios é média (9.6% delta para frequência anterior)
Altos 2 - 16 kHz
(+) | agudos equilibrados - apenas 3.8% longe da mediana
(±) | a linearidade dos máximos é média (10.2% delta para frequência anterior)
Geral 100 - 16.000 Hz
(±) | a linearidade do som geral é média (19.9% diferença em relação à mediana)
Comparado com a mesma classe
» 42% de todos os dispositivos testados nesta classe foram melhores, 9% semelhantes, 49% piores
» O melhor teve um delta de 7%, a média foi 21%, o pior foi 53%
Comparado com todos os dispositivos testados
» 51% de todos os dispositivos testados foram melhores, 7% semelhantes, 42% piores
» O melhor teve um delta de 4%, a média foi 23%, o pior foi 134%
HP ProBook 450 G5-2UB53EA análise de áudio
(±) | o volume do alto-falante é médio, mas bom (###valor### dB)
Graves 100 - 315Hz
(-) | quase nenhum baixo - em média 21.6% menor que a mediana
(±) | a linearidade dos graves é média (12.4% delta para a frequência anterior)
Médios 400 - 2.000 Hz
(+) | médios equilibrados - apenas 4.5% longe da mediana
(±) | a linearidade dos médios é média (7% delta para frequência anterior)
Altos 2 - 16 kHz
(+) | agudos equilibrados - apenas 4.8% longe da mediana
(+) | os máximos são lineares (4.6% delta da frequência anterior)
Geral 100 - 16.000 Hz
(±) | a linearidade do som geral é média (22.3% diferença em relação à mediana)
Comparado com a mesma classe
» 59% de todos os dispositivos testados nesta classe foram melhores, 9% semelhantes, 32% piores
» O melhor teve um delta de 7%, a média foi 21%, o pior foi 53%
Comparado com todos os dispositivos testados
» 65% de todos os dispositivos testados foram melhores, 6% semelhantes, 29% piores
» O melhor teve um delta de 4%, a média foi 23%, o pior foi 134%
| desligado | |
| Ocioso | |
| Carga |
|
Key:
min: | |
| HP ProBook 440 G5-3KX87ES i5-8250U, UHD Graphics 620, Intel SSD 600p SSDPEKKW256G7, IPS LED, 1920x1080, 14" | Lenovo ThinkPad E480-20KNCTO1WW i5-8250U, UHD Graphics 620, Toshiba KBG30ZMT128G, IPS LED, 1920x1080, 14" | Dell Latitude 14 3470 6100U, HD Graphics 520, Toshiba MQ01ACF050, TN LED, 1366x768, 14" | Acer TravelMate P449-G2-M-56CD i5-7200U, HD Graphics 620, Intel SSD 600p SSDPEKKW512G7, IPS, 1920x1080, 14" | HP ProBook 440 G4-Y8B51EA i7-7500U, GeForce 930MX, SanDisk SD8SNAT256G1002, TN, 1920x1080, 14" | |
|---|---|---|---|---|---|
| Power Consumption | 23% | 13% | 10% | 13% | |
| Idle Minimum * (Watt) | 4.4 | 3.5 20% | 5 -14% | 4.5 -2% | 3 32% |
| Idle Average * (Watt) | 7.1 | 5.3 25% | 6.8 4% | 7.1 -0% | 5.4 24% |
| Idle Maximum * (Watt) | 10.2 | 6.1 40% | 8.9 13% | 10.2 -0% | 6.3 38% |
| Load Average * (Watt) | 36.5 | 30 18% | 26.2 28% | 29.8 18% | 37.5 -3% |
| Load Maximum * (Watt) | 48.7 | 42.3 13% | 31.8 35% | 31 36% | 61.1 -25% |
* ... menor é melhor
| HP ProBook 440 G5-3KX87ES i5-8250U, UHD Graphics 620, 48 Wh | Lenovo ThinkPad E480-20KQS00000 i5-8250U, Radeon RX 550 (Laptop), 48 Wh | Dell Latitude 14 3470 6100U, HD Graphics 520, 41 Wh | Acer TravelMate P449-G2-M-56CD i5-7200U, HD Graphics 620, 48 Wh | HP ProBook 440 G4-Y8B51EA i7-7500U, GeForce 930MX, 48 Wh | Média da turma Office | |
|---|---|---|---|---|---|---|
| Duração da bateria | 29% | -26% | 21% | 43% | 112% | |
| Reader / Idle (h) | 13.7 | 19.4 42% | 11.1 -19% | 16.3 19% | 18.1 32% | 24.5 ? 79% |
| H.264 (h) | 3.7 | 8.9 141% | 8.4 127% | 9.5 157% | 15.5 ? 319% | |
| WiFi v1.3 (h) | 6.9 | 5.7 -17% | 4.6 -33% | 5.7 -17% | 6.9 0% | 13.2 ? 91% |
| Load (h) | 3.1 | 1.5 -52% | 2.3 -26% | 1.7 -45% | 2.5 -19% | 1.808 ? -42% |
Pro
Contra
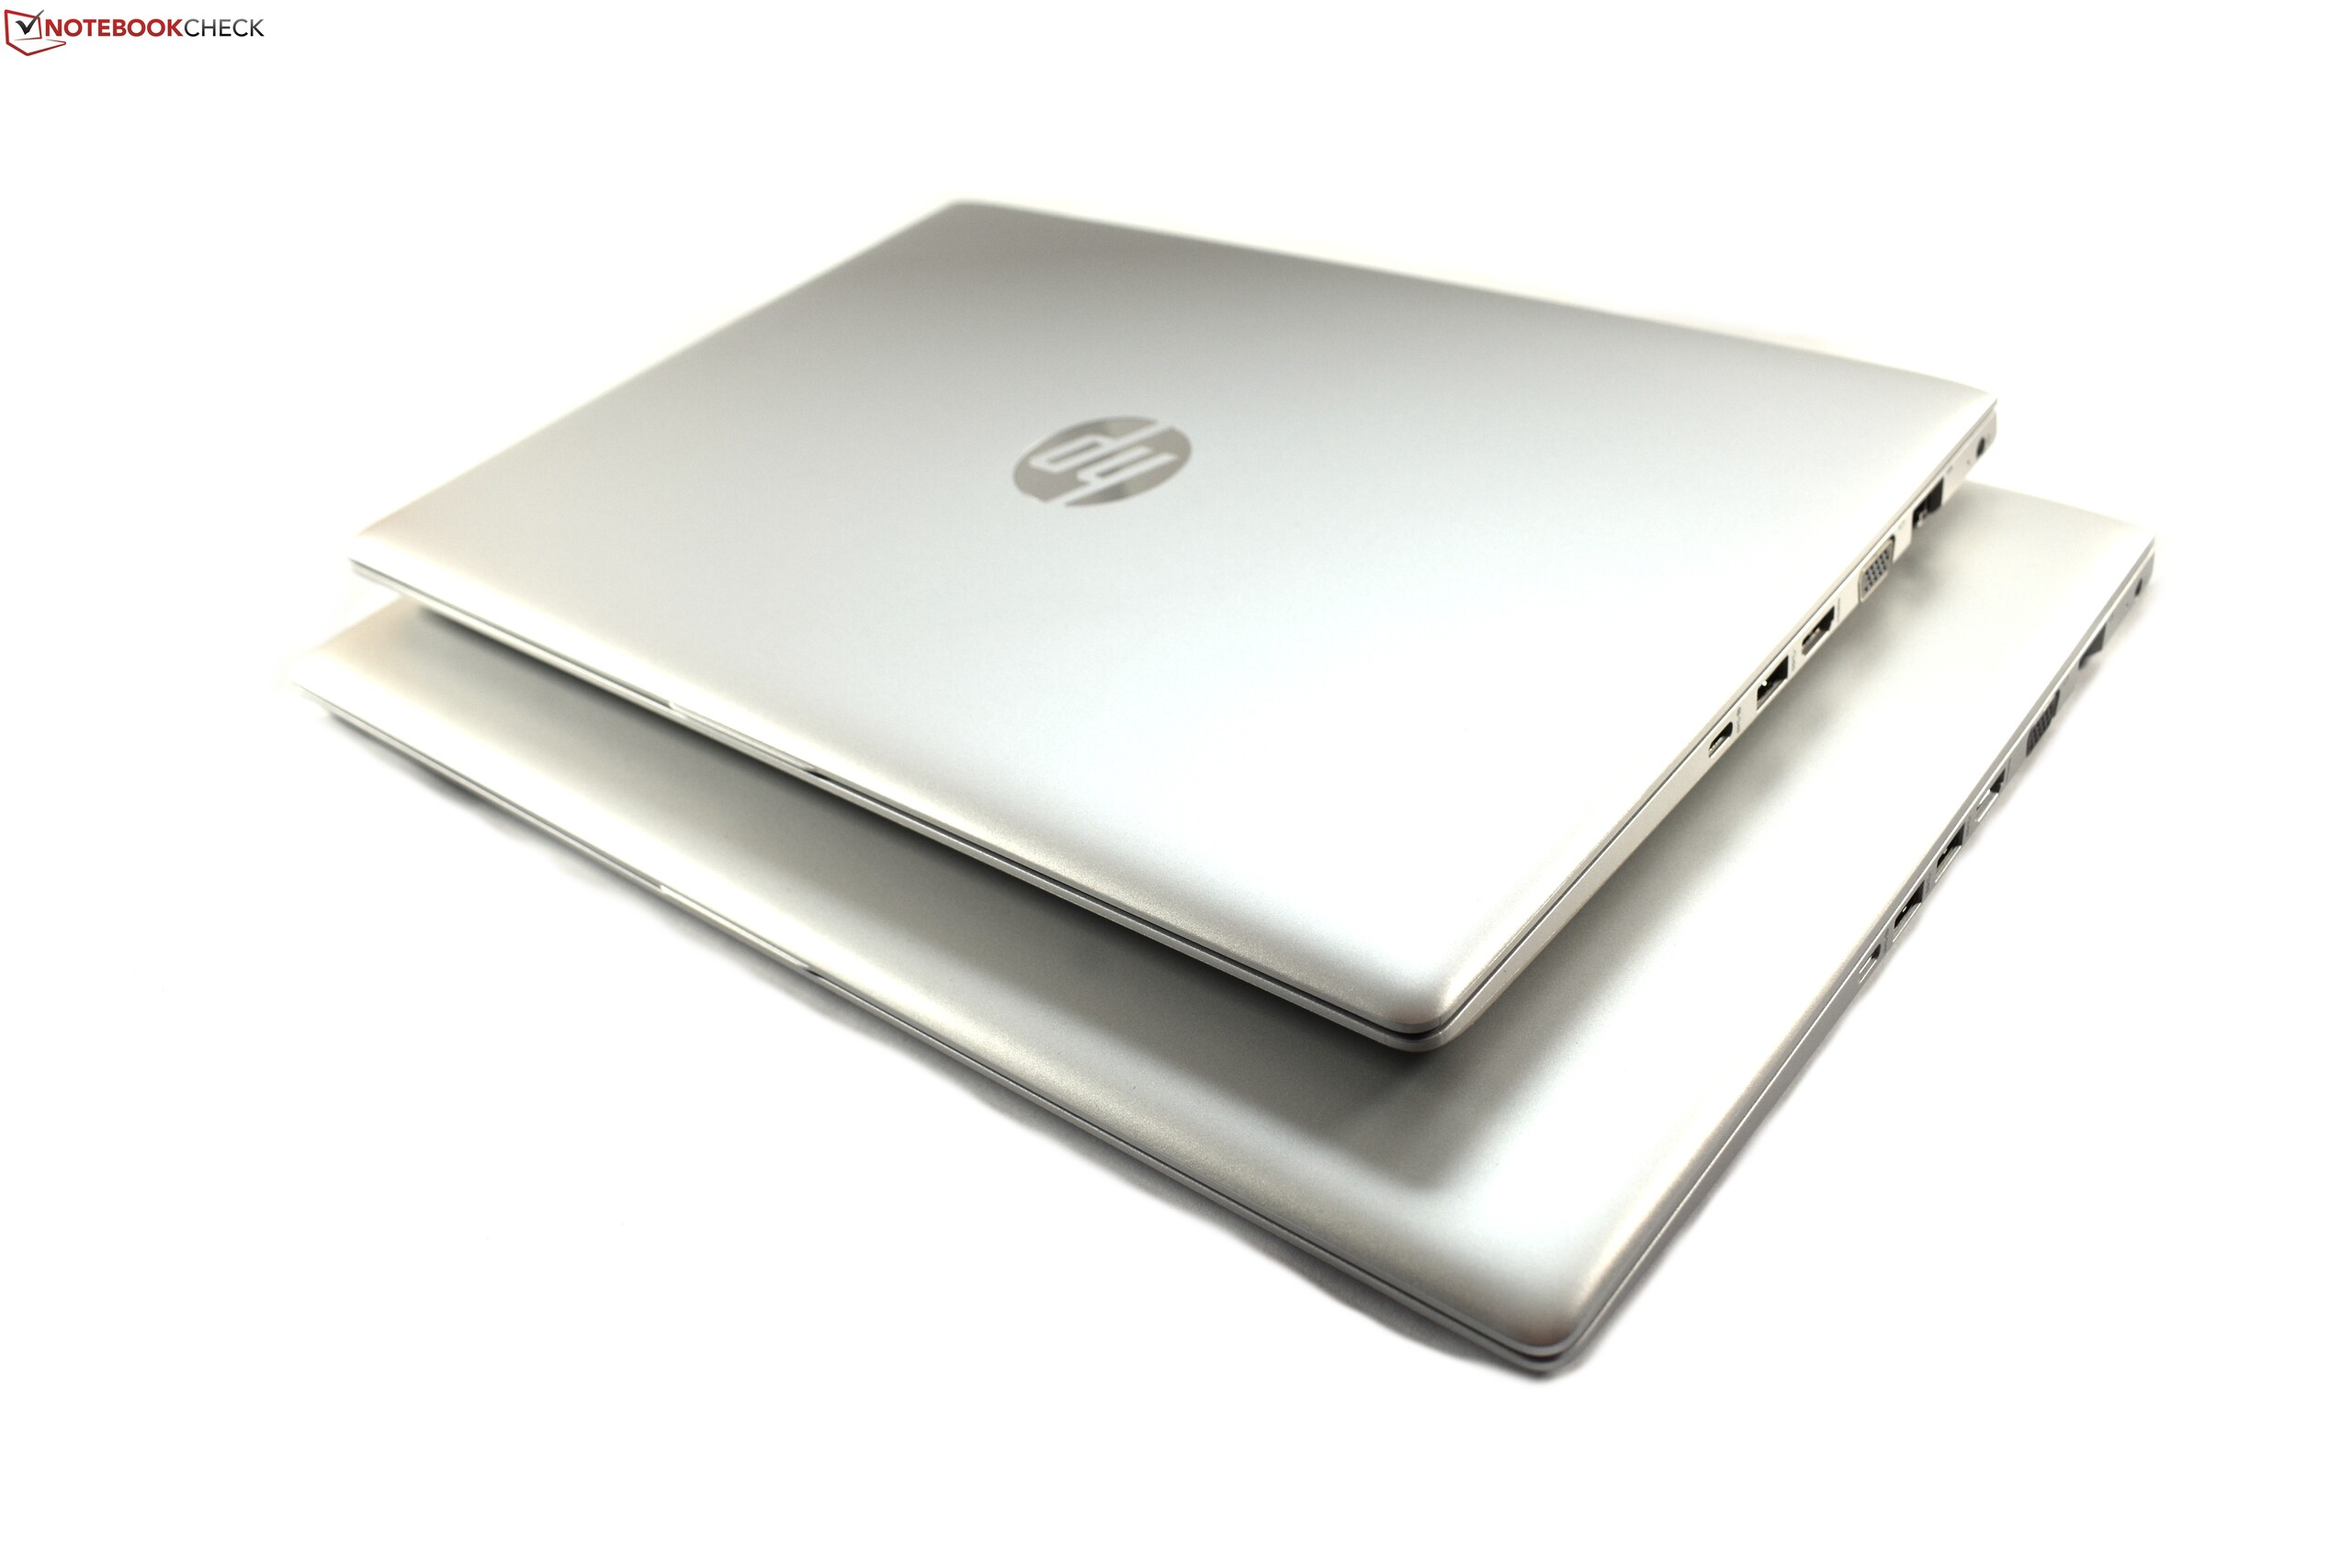
Como o seu irmão maior, o ProBook 440 G5 oferece uma boa relação de preço-desempenho. É uma pena que a HP estrague o seu bom trabalho permitindo que o teclado se flexione sob pressão.
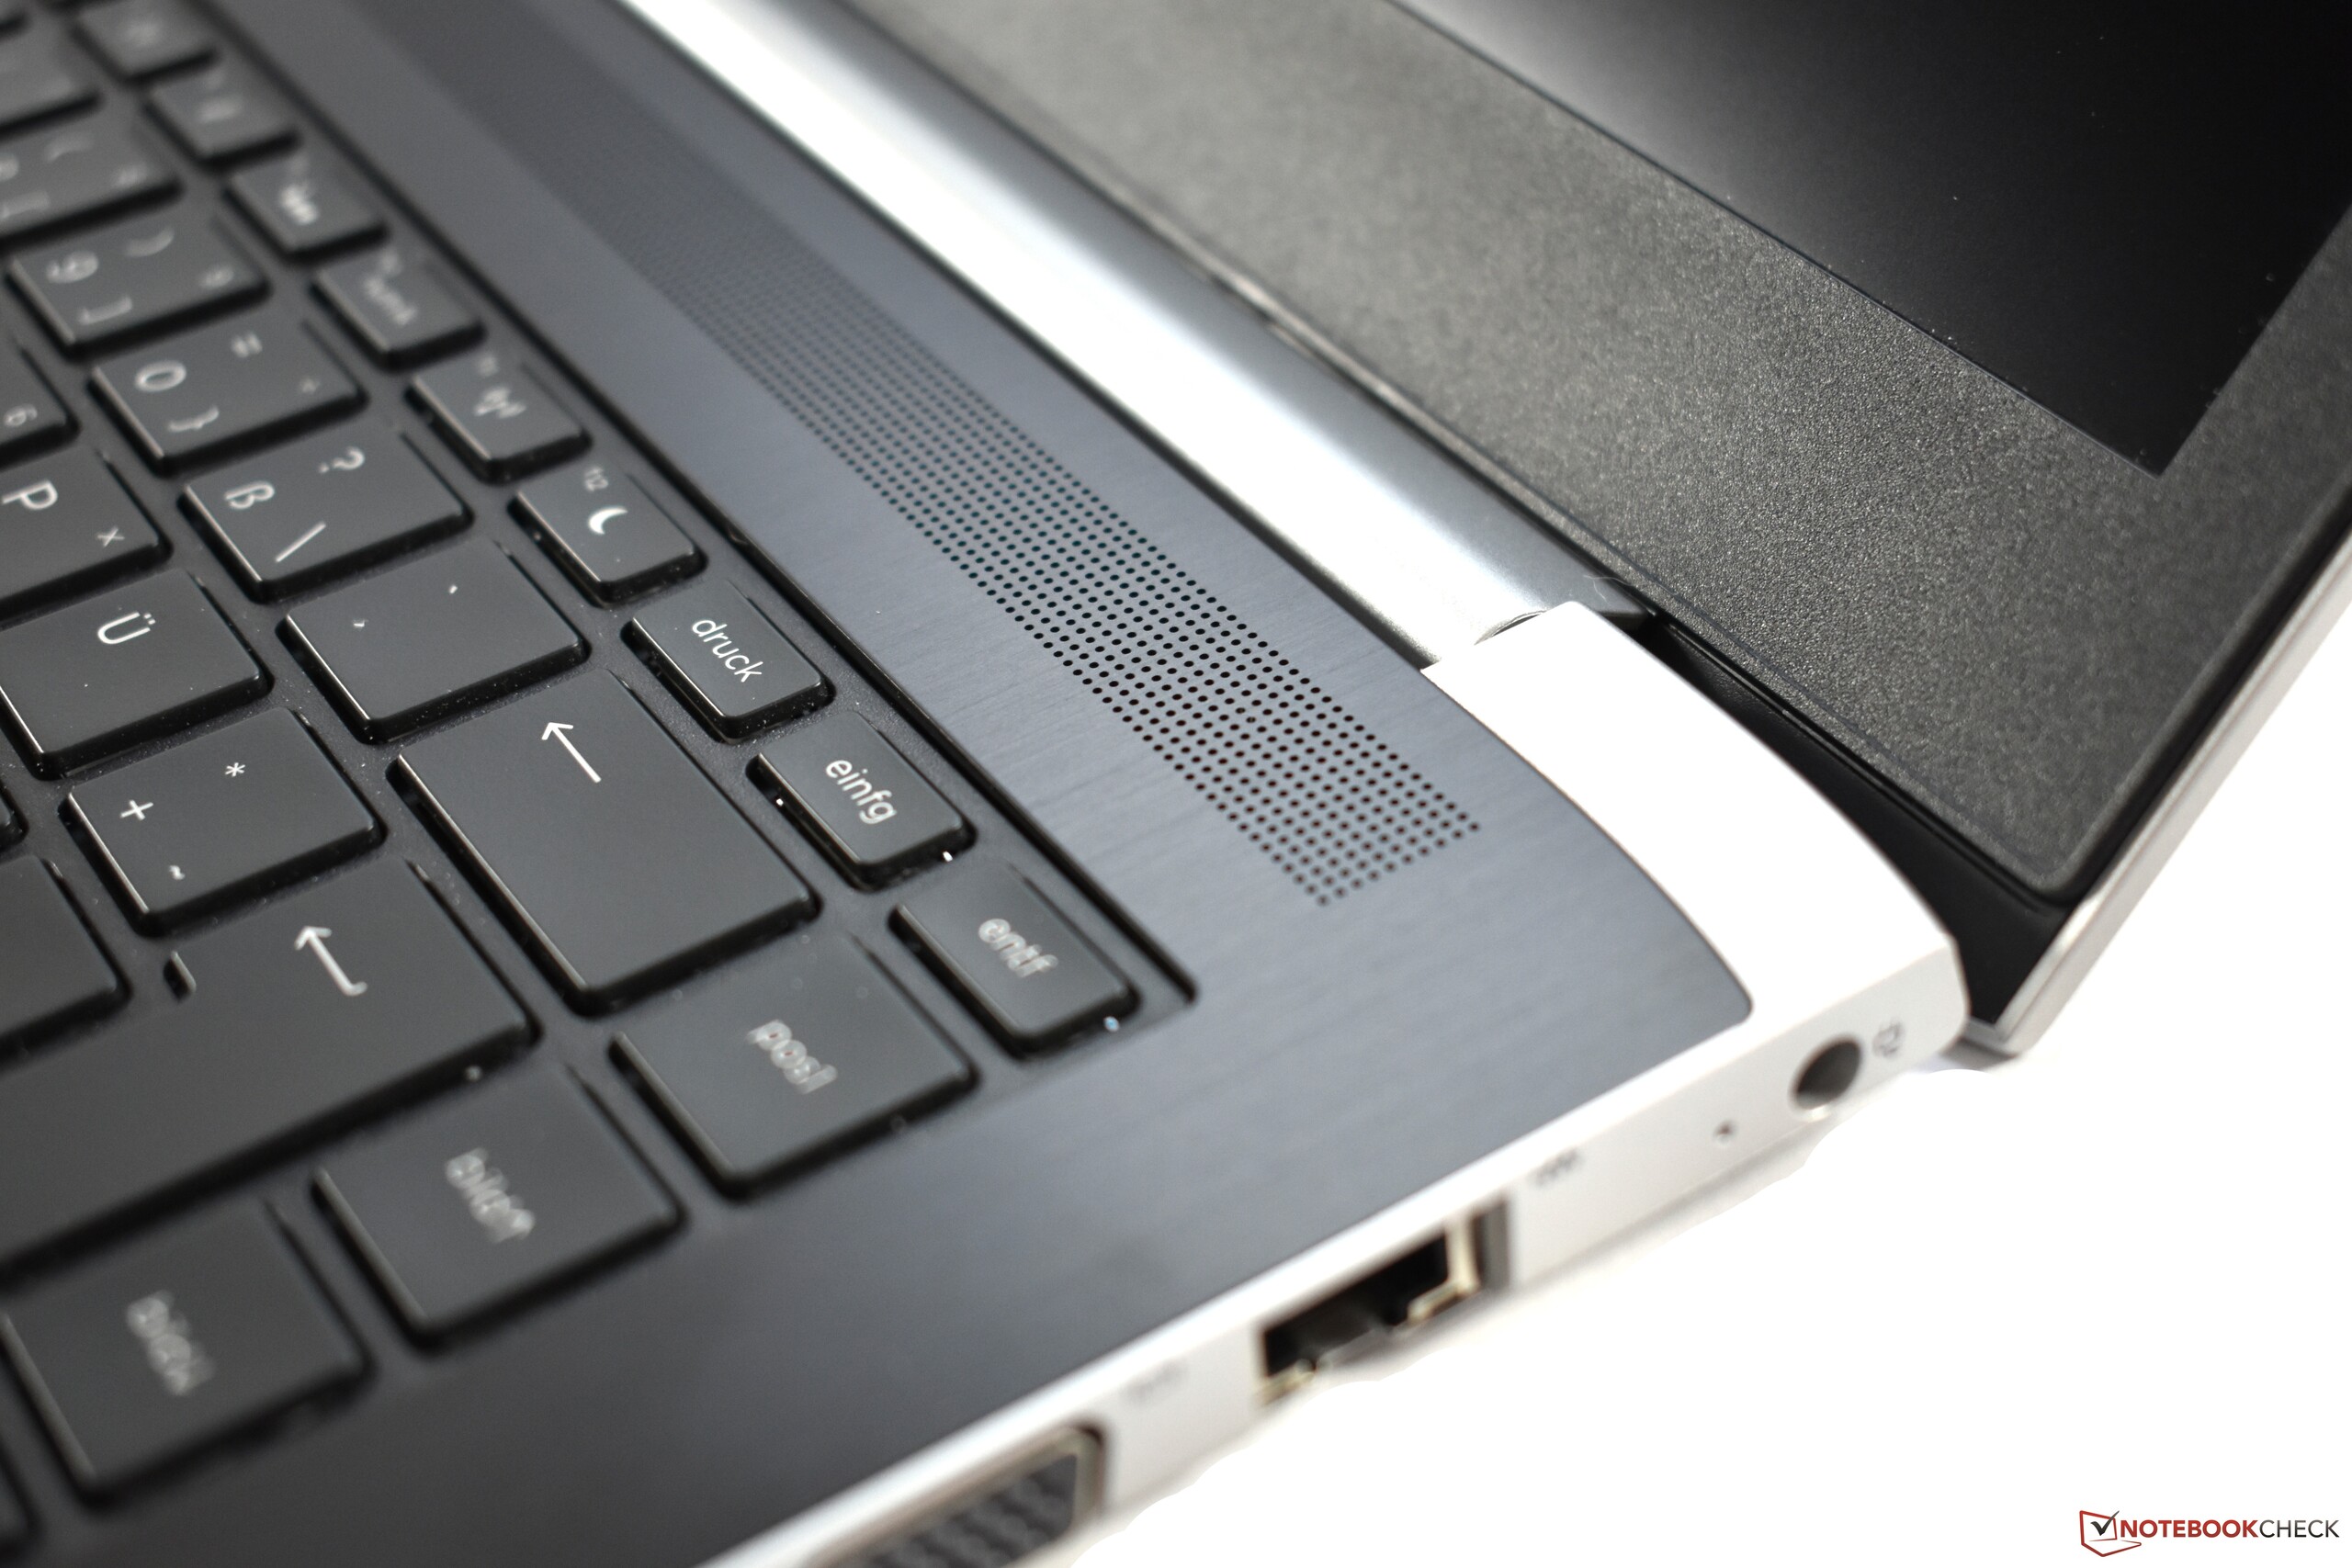
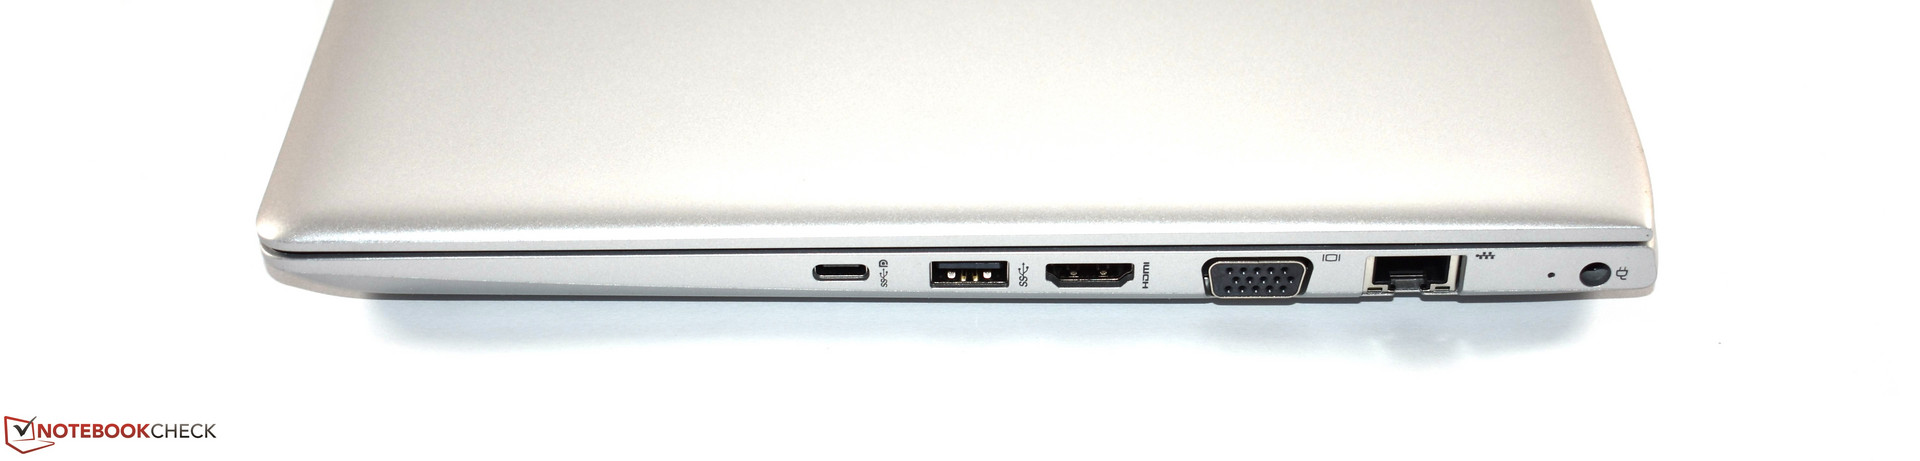
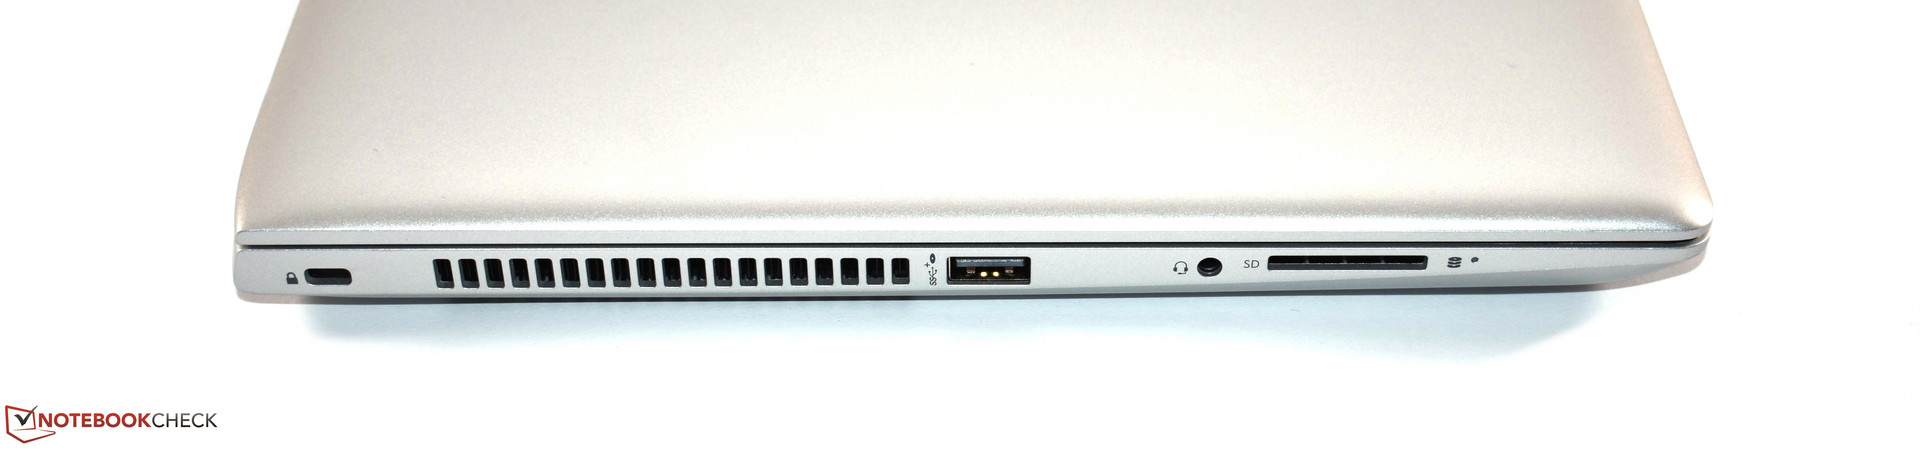
Mas vamos começar com os aspectos positivos: Definitivamente gostamos do touchpad do ProBook, bem como do desempenho da GPU, que está muito na frente daquele de seu concorrente da Lenovo. O ProBook também pode oferecer uma seleção de portas um pouco melhor que a do ThinkPad E480, dado que ele oferece não apenas VGA, HDMI e DisplayPort (via USB Type-C), mas também oferece um leitor de cartões de tamanho completo. Como no ProBook maior, podemos elogiar os alto-falantes, bem como a expansibilidade do aparelho - embora haja um signo de interrogação atrás do slot de 2,5 polegadas devido ao caddy faltante. Infelizmente é aqui onde as vantagens acabam. Embora a tela seja finalmente um painel IPS, não podemos realmente elogiá-la devido aos seus baixos níveis de brilho. O ventilador é significativamente mais barulhento e tem uma frequência maior do que o do ProBook 450 G5. Portanto, o sistema de resfriamento e a tela não são aspectos positivos deste dispositivo.
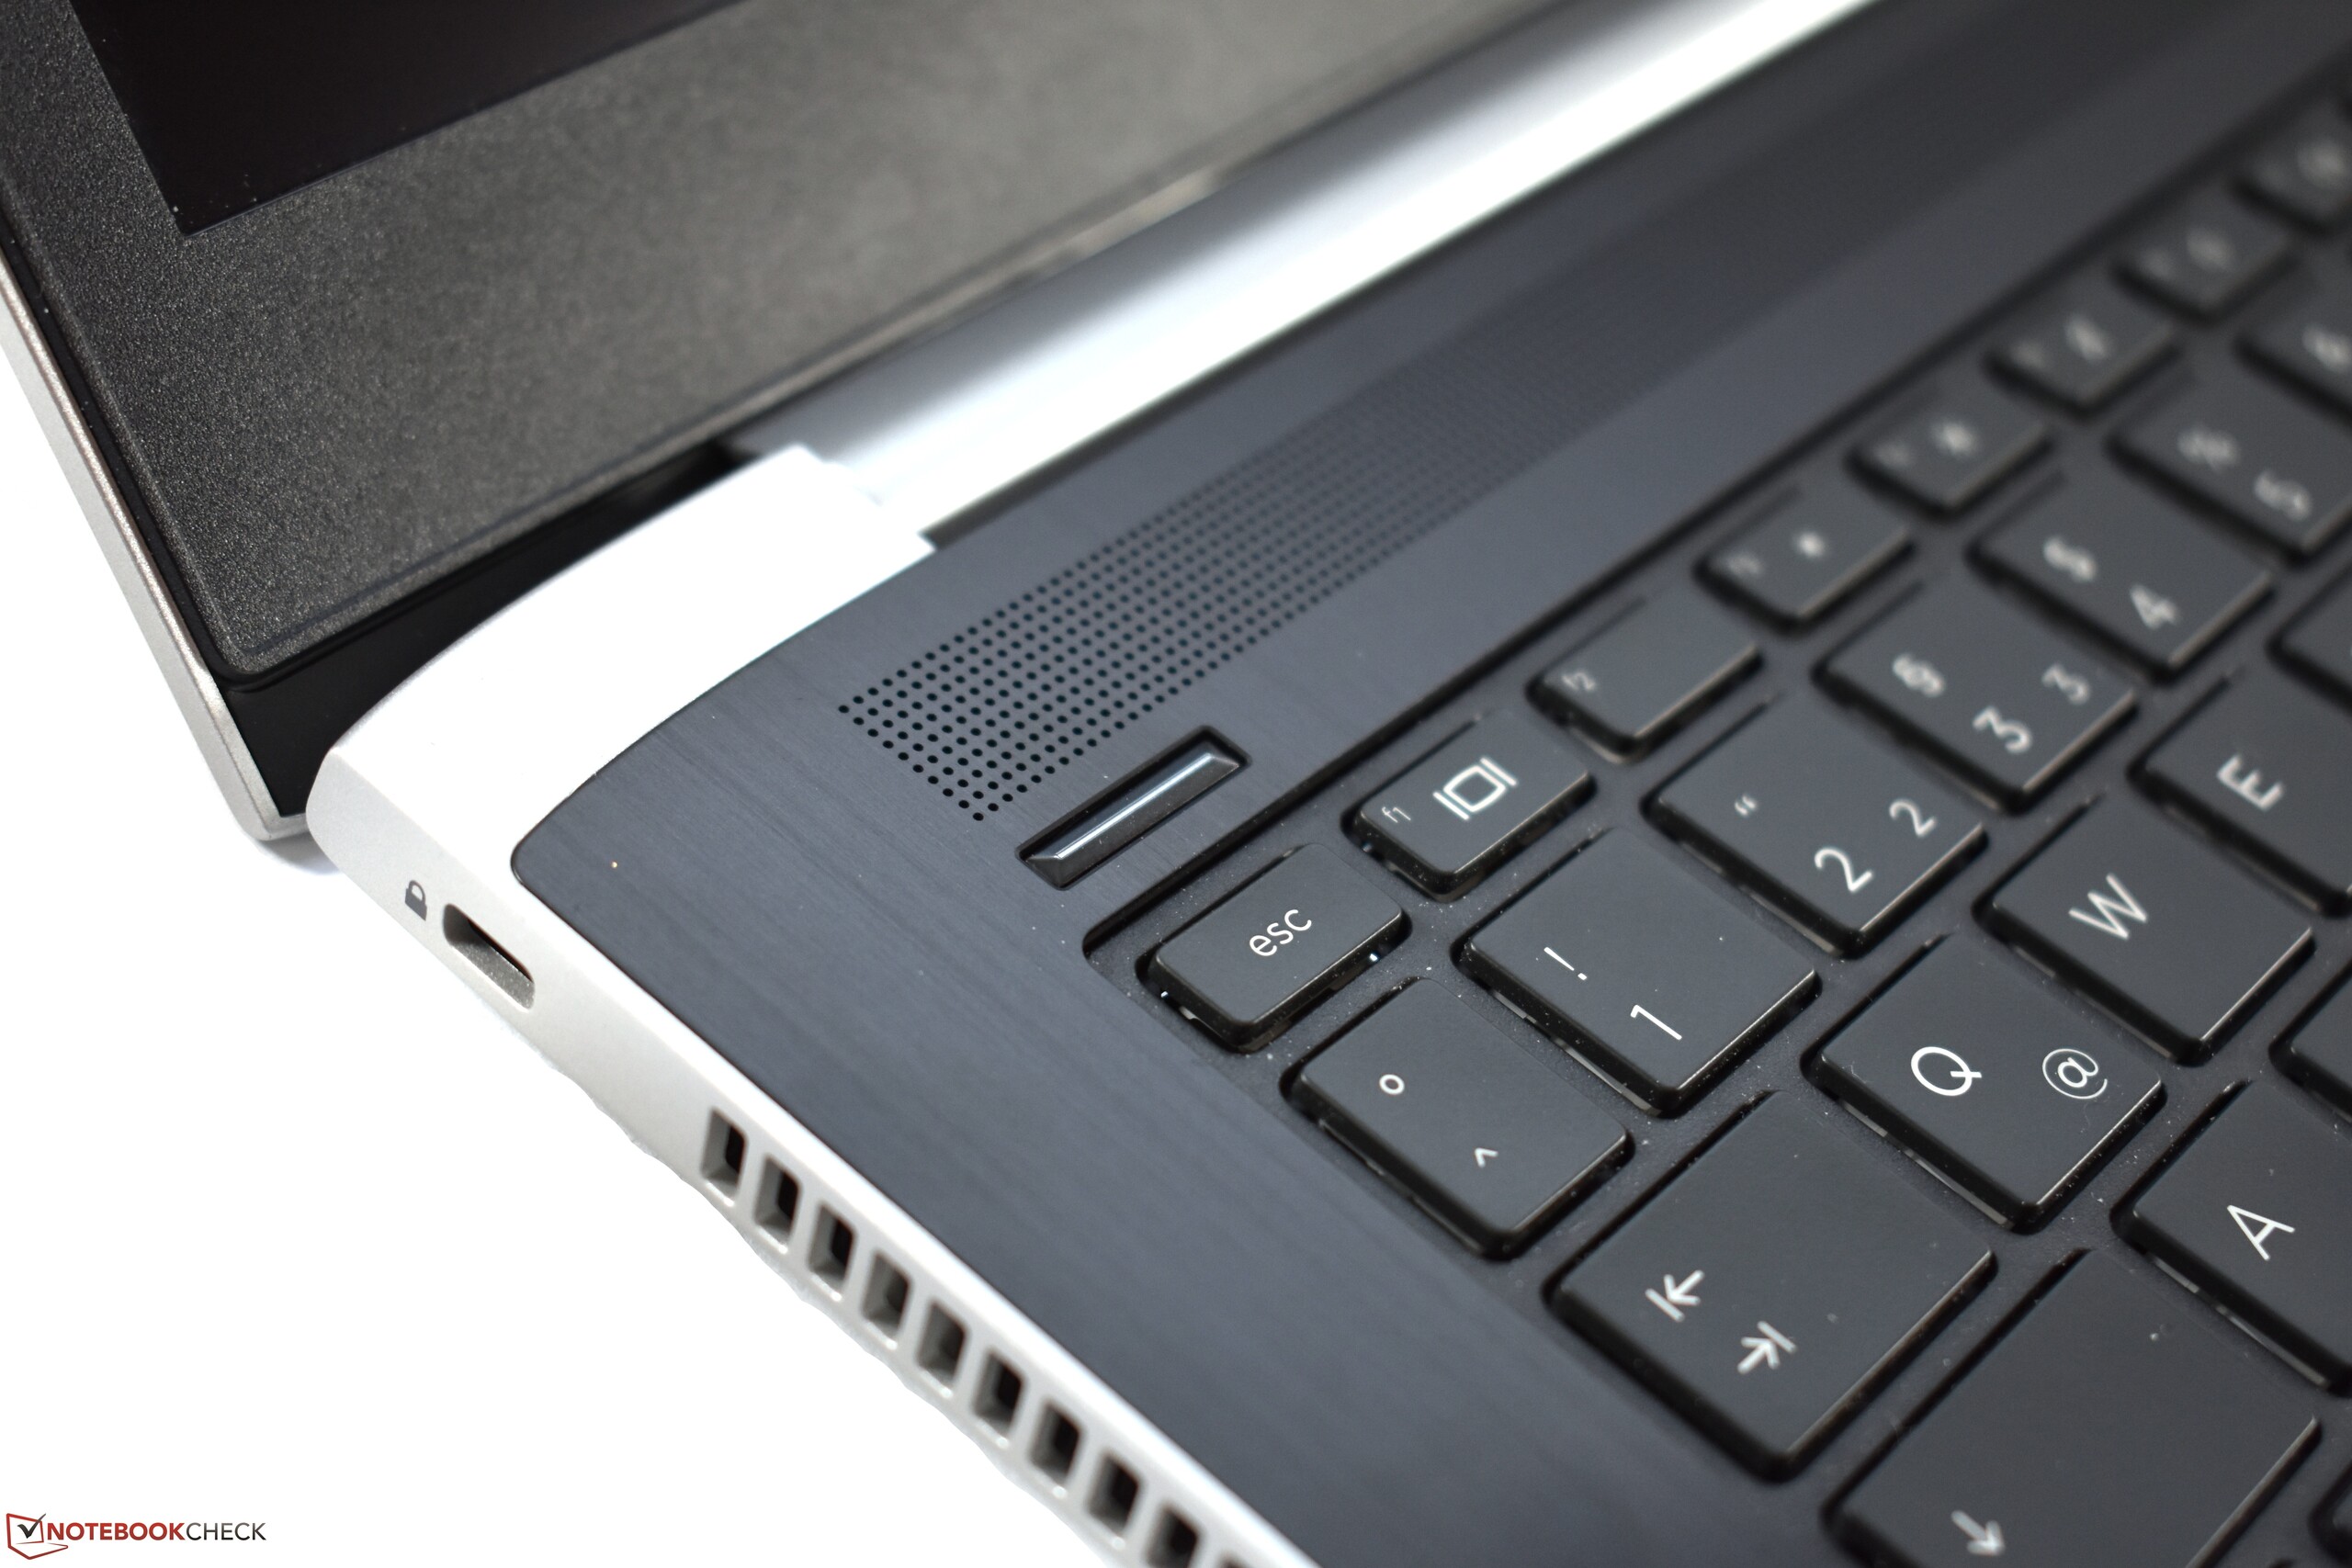
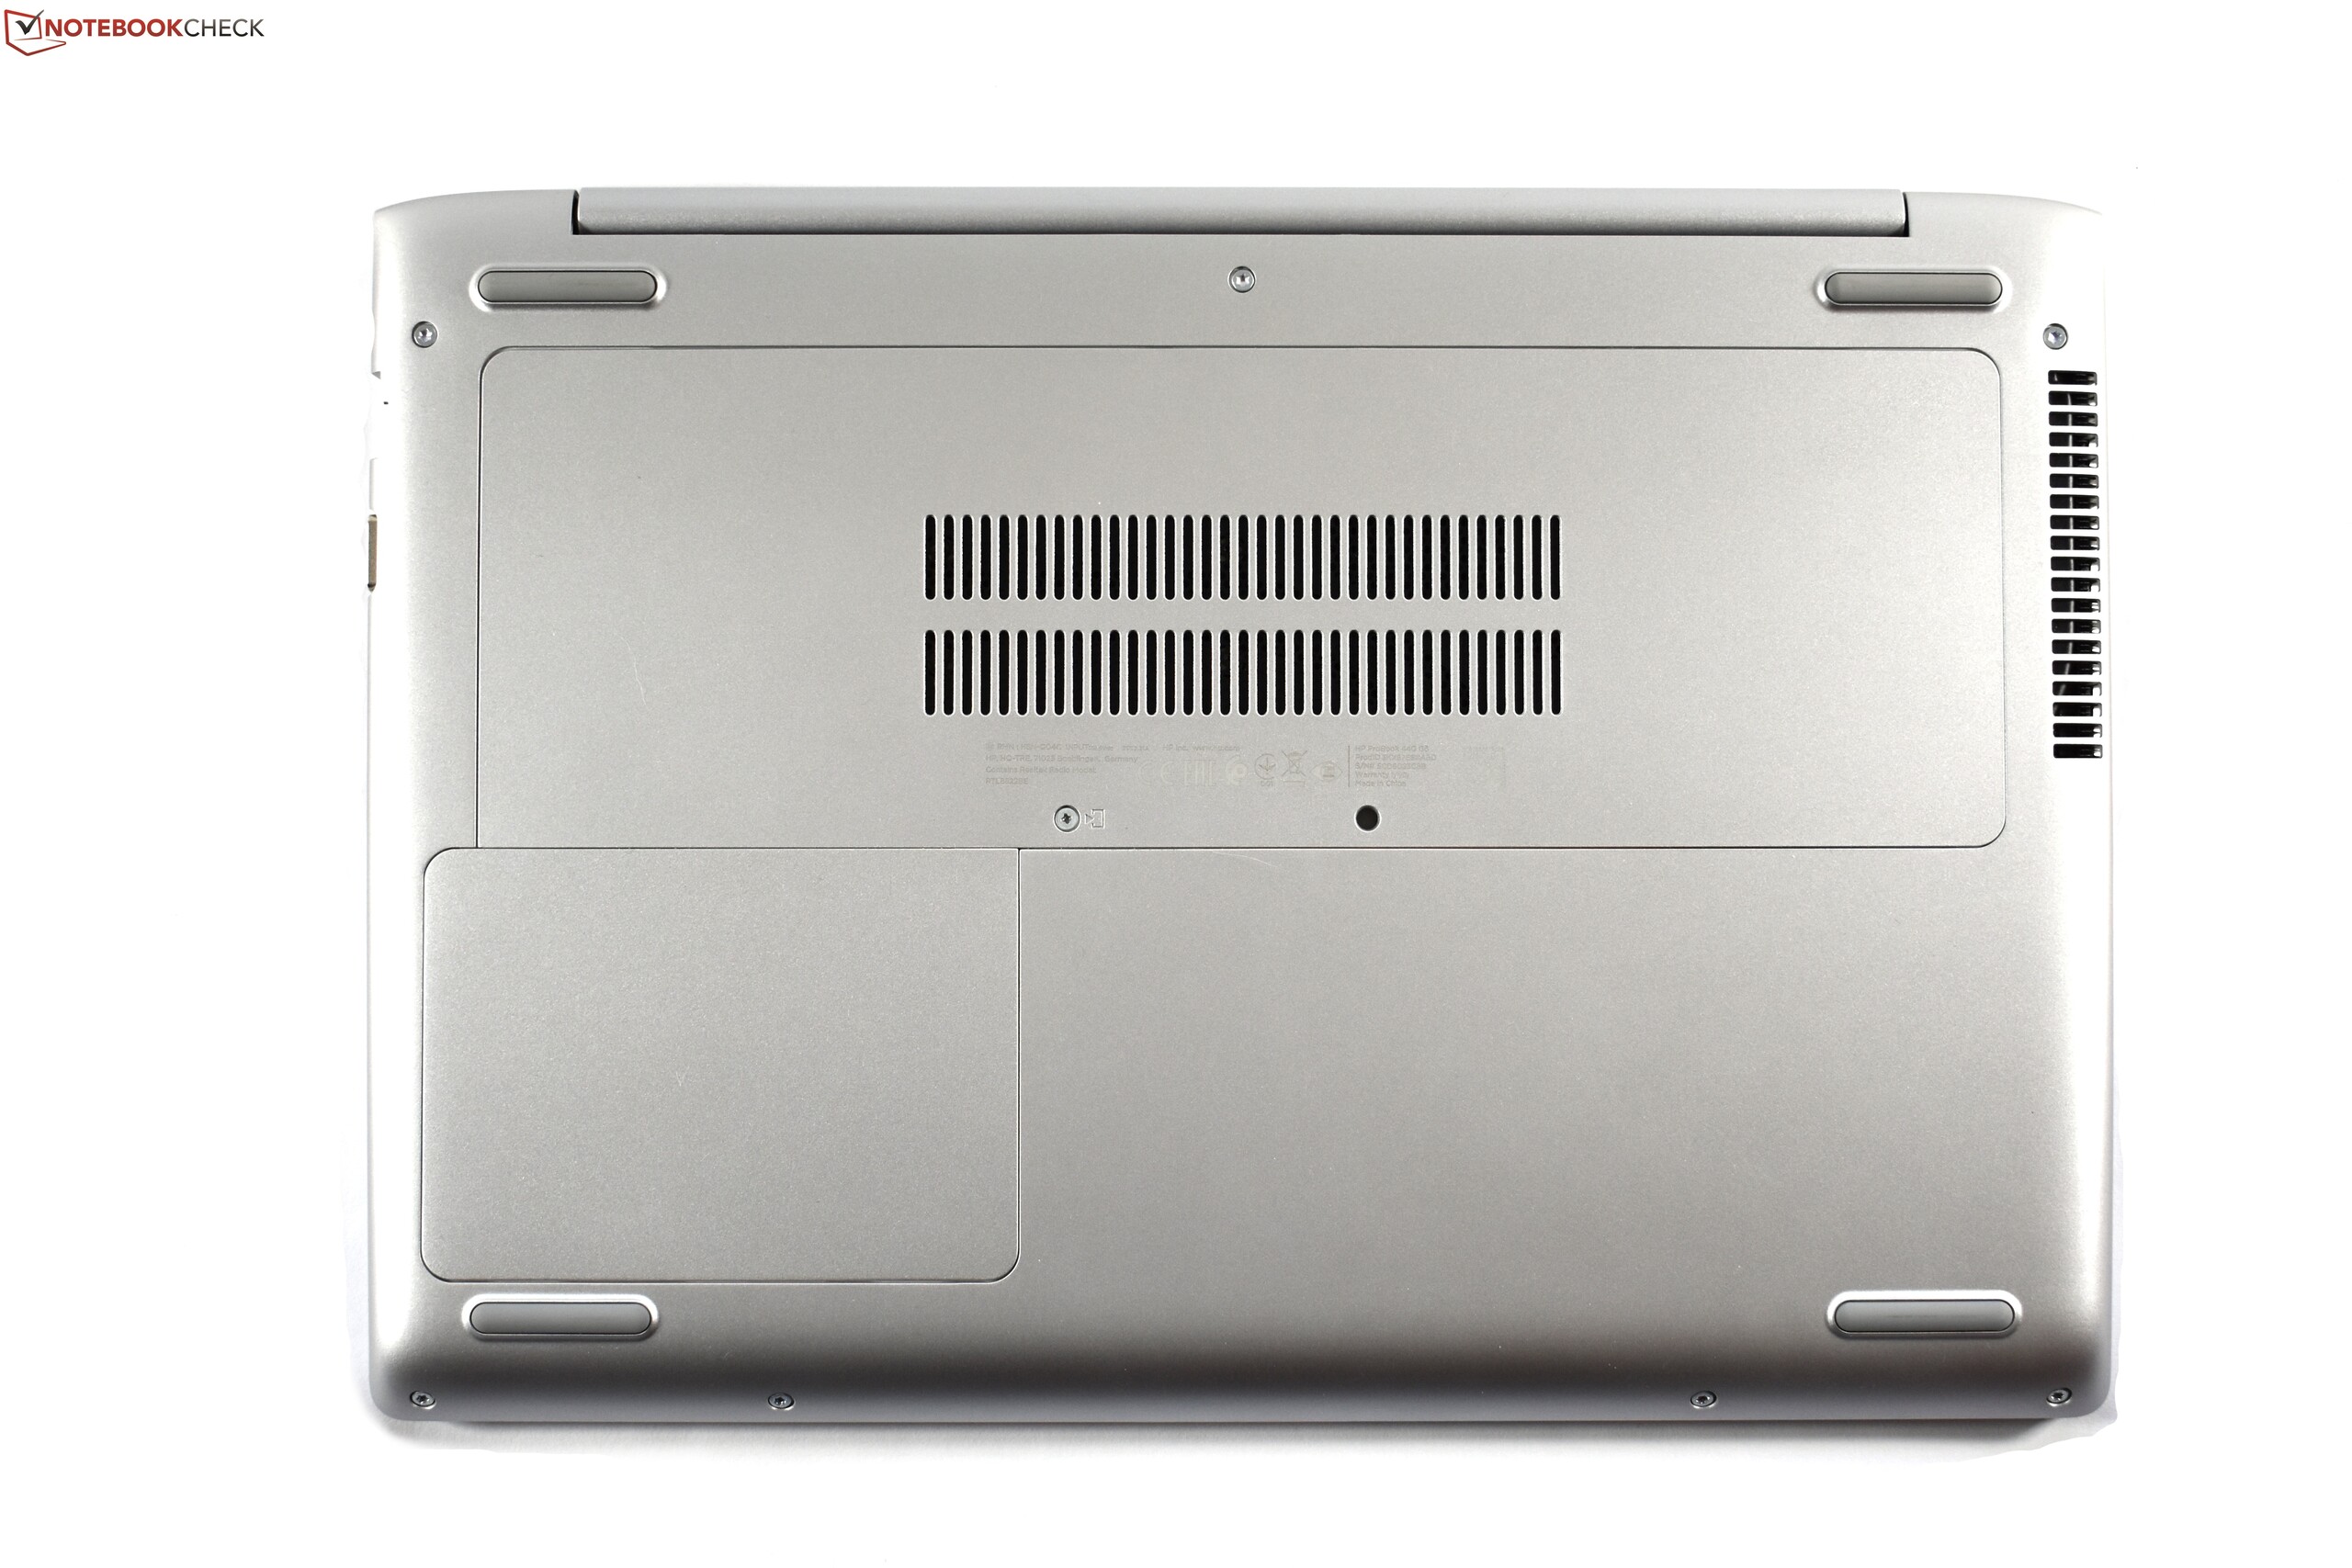
O teclado foi uma decepção clara, porque dá lugar à pressão. Isso estraga a experiência de digitação, o que é um grande problema para um portátil de escritório. Também nos incomodou o acabamento do ProBook 450 G5 em torno do repouso do pousa palmas, exatamente onde você costuma colocar as mãos. Assim como a boa seleção de portas, a HP poderia ter escolhido melhores posições para elas. Particularmente, a porta USB C é colocada muito longe na frente. A capacidade de expansão é boa, mas a manutenção geral é decepcionante, pois é difícil acessar a bateria e a ventoinha de resfriamento. Finalmente, também temos que mencionar a garantia curta de um ano.
O ProBook 440 G5 poderia ser uma boa opção se não fosse pelo teclado fraco.
No geral, não podemos realmente recomendar o ProBook devido ao seu teclado instável. Esperamos que o teclado de um portátil de escritório permaneça estável ao digitar normalmente, o que não é o caso aqui. Boas alternativas podem ser o Lenovo ThinkPad E480 com uma GPU Intel, que estamos testando atualmente, ou o Dell Latitude 3490 (análise disponível em breve).
HP ProBook 440 G5-3KX87ES
- 02/23/2018 v6 (old)
Benjamin Herzig
Price comparison
