Breve Análise do Portátil Vaio SX14 (i5-8265U, FHD)
| Networking | |
| iperf3 transmit AX12 | |
| Fujitsu Lifebook U938 | |
| VAIO SX14 | |
| Lenovo ThinkPad X1 Carbon 2018-20KGS03900 | |
| Asus ASUSPRO B9440UA-GV0100T | |
| iperf3 receive AX12 | |
| Lenovo ThinkPad X1 Carbon 2018-20KGS03900 | |
| Asus ASUSPRO B9440UA-GV0100T | |
| VAIO SX14 | |
| Fujitsu Lifebook U938 | |
| |||||||||||||||||||||||||
iluminação: 86 %
Contraste: 1108:1 (Preto: 0.25 cd/m²)
ΔE ColorChecker Calman: 5.05 | ∀{0.5-29.43 Ø4.71}
ΔE Greyscale Calman: 6.25 | ∀{0.09-98 Ø4.96}
95% sRGB (Argyll 1.6.3 3D)
62% AdobeRGB 1998 (Argyll 1.6.3 3D)
69.8% AdobeRGB 1998 (Argyll 3D)
95.3% sRGB (Argyll 3D)
72.4% Display P3 (Argyll 3D)
Gamma: 2.43
CCT: 7227 K
| VAIO SX14 HV140FHM-N61, , 1920x1080, 14" | Lenovo ThinkPad X1 Carbon G6-20KG0025UK Lenovo LEN40A9 / AUO B140HAK02.3, , 1920x1080, 14" | Dell Latitude 7390 LGD059B, , 1920x1080, 13.3" | Asus ASUSPRO B9440UA-GV0100T AU Optronics AUO353D / B140HAN03.5, , 1920x1080, 14" | Fujitsu Lifebook U938 Sharp LQ133M1JW28, , 1920x1080, 13.3" | |
|---|---|---|---|---|---|
| Display | -2% | -3% | -9% | -3% | |
| Display P3 Coverage (%) | 72.4 | 68.3 -6% | 67.8 -6% | 64 -12% | 67.5 -7% |
| sRGB Coverage (%) | 95.3 | 94.9 0% | 95.1 0% | 89.1 -7% | 94.5 -1% |
| AdobeRGB 1998 Coverage (%) | 69.8 | 69.3 -1% | 67.8 -3% | 65.2 -7% | 68.7 -2% |
| Response Times | 17% | 13% | -2% | 8% | |
| Response Time Grey 50% / Grey 80% * (ms) | 43 ? | 40 ? 7% | 36.8 ? 14% | 48.8 ? -13% | 43 ? -0% |
| Response Time Black / White * (ms) | 34 ? | 25 ? 26% | 30.4 ? 11% | 30.8 ? 9% | 29 ? 15% |
| PWM Frequency (Hz) | 2000 ? | 217 ? | |||
| Screen | 25% | 10% | -15% | 14% | |
| Brightness middle (cd/m²) | 277 | 298 8% | 303.8 10% | 319 15% | 344 24% |
| Brightness (cd/m²) | 262 | 287 10% | 289 10% | 294 12% | 320 22% |
| Brightness Distribution (%) | 86 | 91 6% | 86 0% | 87 1% | 77 -10% |
| Black Level * (cd/m²) | 0.25 | 0.2 20% | 0.31 -24% | 0.26 -4% | 0.31 -24% |
| Contrast (:1) | 1108 | 1490 34% | 980 -12% | 1227 11% | 1110 0% |
| Colorchecker dE 2000 * | 5.05 | 2.19 57% | 2.9 43% | 7.1 -41% | 2.72 46% |
| Colorchecker dE 2000 max. * | 8.63 | 4.39 49% | 5.79 33% | 13.7 -59% | 5.92 31% |
| Greyscale dE 2000 * | 6.25 | 1.97 68% | 3.7 41% | 9.61 -54% | 2.74 56% |
| Gamma | 2.43 91% | 2.43 91% | 2.118 104% | 2.33 94% | 2.38 92% |
| CCT | 7227 90% | 6571 99% | 6323 103% | 6021 108% | 6794 96% |
| Color Space (Percent of AdobeRGB 1998) (%) | 62 | 62 0% | 63 2% | 54.01 -13% | 61 -2% |
| Color Space (Percent of sRGB) (%) | 95 | 95 0% | 95 0% | 83.02 -13% | 94 -1% |
| Colorchecker dE 2000 calibrated * | 1.67 | 1.72 | |||
| Média Total (Programa/Configurações) | 13% /
19% | 7% /
8% | -9% /
-12% | 6% /
10% |
* ... menor é melhor
Exibir tempos de resposta
| ↔ Tempo de resposta preto para branco | ||
|---|---|---|
| 34 ms ... ascensão ↗ e queda ↘ combinadas | ↗ 19 ms ascensão | 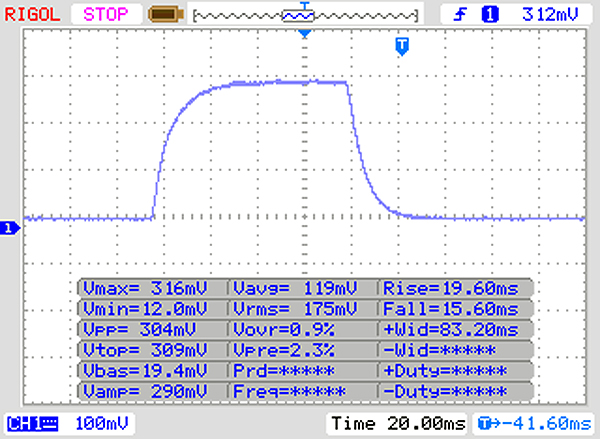 |
| ↘ 15 ms queda | ||
| A tela mostra taxas de resposta lentas em nossos testes e será insatisfatória para os jogadores. Em comparação, todos os dispositivos testados variam de 0.1 (mínimo) a 240 (máximo) ms. » 91 % de todos os dispositivos são melhores. Isso significa que o tempo de resposta medido é pior que a média de todos os dispositivos testados (19.8 ms). | ||
| ↔ Tempo de resposta 50% cinza a 80% cinza | ||
| 43 ms ... ascensão ↗ e queda ↘ combinadas | ↗ 22 ms ascensão | 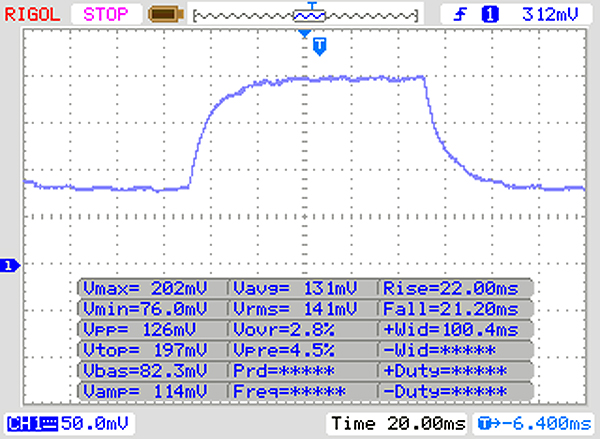 |
| ↘ 21 ms queda | ||
| A tela mostra taxas de resposta lentas em nossos testes e será insatisfatória para os jogadores. Em comparação, todos os dispositivos testados variam de 0.165 (mínimo) a 636 (máximo) ms. » 71 % de todos os dispositivos são melhores. Isso significa que o tempo de resposta medido é pior que a média de todos os dispositivos testados (30.9 ms). | ||
Cintilação da tela / PWM (modulação por largura de pulso)
| Tela tremeluzindo/PWM detectado | 2000 Hz | ≤ 90 % configuração de brilho | 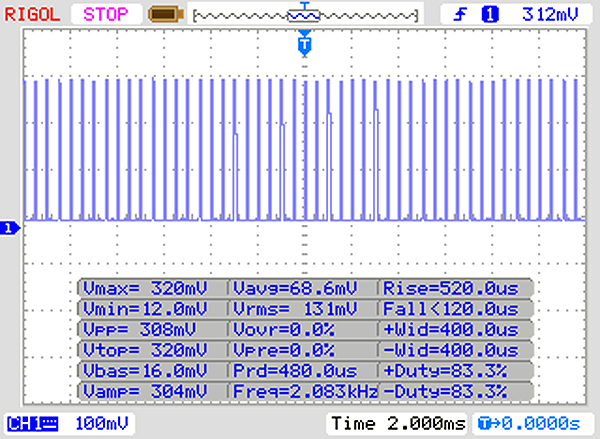 |
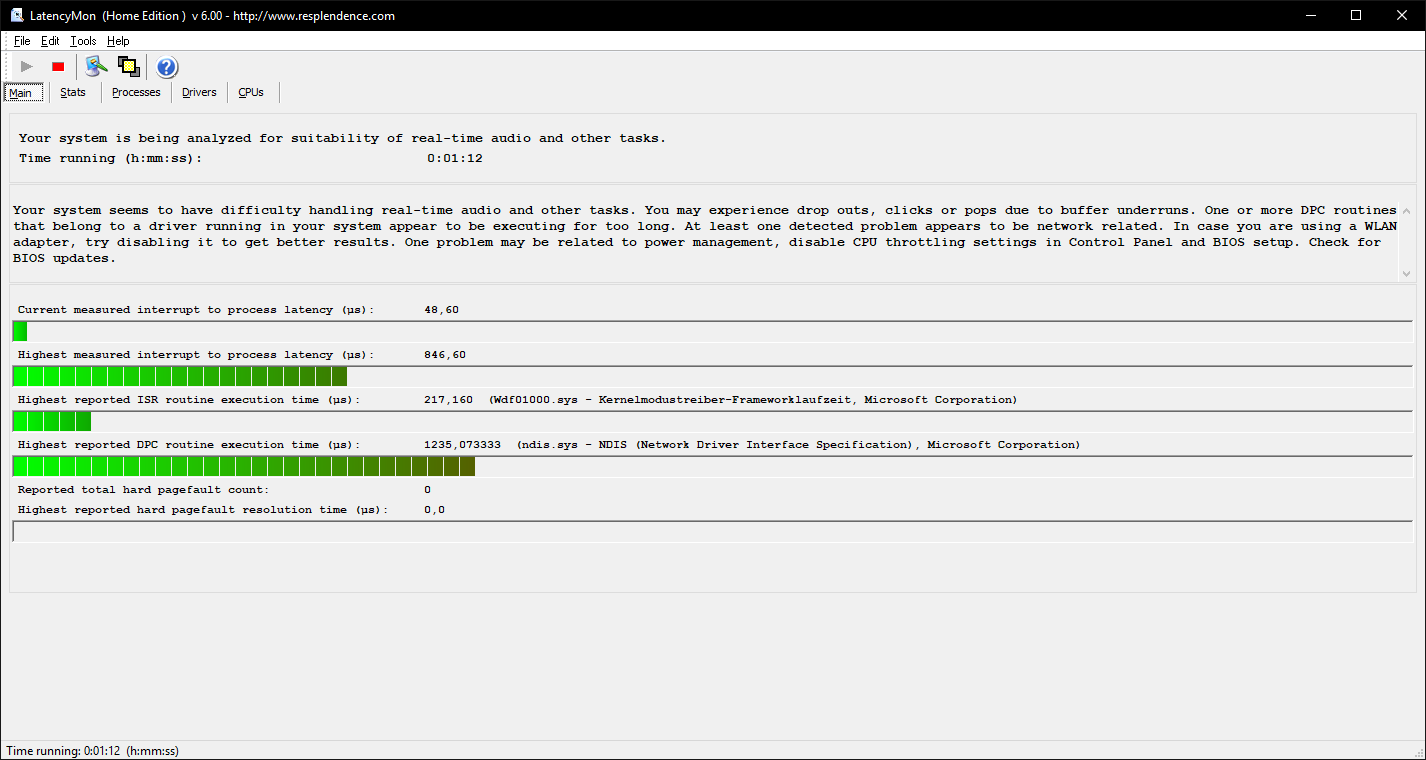
A luz de fundo da tela pisca em 2000 Hz (pior caso, por exemplo, utilizando PWM) Cintilação detectada em uma configuração de brilho de 90 % e abaixo. Não deve haver cintilação ou PWM acima desta configuração de brilho. A frequência de 2000 Hz é bastante alta, então a maioria dos usuários sensíveis ao PWM não deve notar nenhuma oscilação. [pwm_comparison] Em comparação: 52 % de todos os dispositivos testados não usam PWM para escurecer a tela. Se PWM foi detectado, uma média de 7741 (mínimo: 5 - máximo: 343500) Hz foi medida. | |||
| PCMark 8 Home Score Accelerated v2 | 3496 pontos | |
| PCMark 8 Work Score Accelerated v2 | 4919 pontos | |
| PCMark 10 Score | 3846 pontos | |
Ajuda | ||
| VAIO SX14 Samsung SSD PM981 MZVLB256HAHQ | Lenovo ThinkPad X1 Carbon 2018-20KGS03900 Samsung SSD PM981 MZVLB512HAJQ | Dell Latitude 7390 Samsung PM961 MZVLW256HEHP | Fujitsu Lifebook U938 Micron 1100 MTFDDAV256TBN | Média Samsung SSD PM981 MZVLB256HAHQ | |
|---|---|---|---|---|---|
| CrystalDiskMark 5.2 / 6 | 14% | 8% | -52% | 52% | |
| Write 4K (MB/s) | 101.8 | 131.9 30% | 139.4 37% | 80.5 -21% | 116.1 ? 14% |
| Read 4K (MB/s) | 37.63 | 44.6 19% | 43.18 15% | 26.14 -31% | 189.5 ? 404% |
| Write Seq (MB/s) | 1384 | 1824 32% | 1075 -22% | 396.8 -71% | 1409 ? 2% |
| Read Seq (MB/s) | 2061 | 2163 5% | 1639 -20% | 473.1 -77% | 1624 ? -21% |
| Write 4K Q32T1 (MB/s) | 489.3 | 338.1 -31% | 662 35% | 264.2 -46% | 360 ? -26% |
| Read 4K Q32T1 (MB/s) | 281.2 | 351.9 25% | 413.9 47% | 244 -13% | 396 ? 41% |
| Write Seq Q32T1 (MB/s) | 1515 | 1972 30% | 1195 -21% | 464.6 -69% | 1492 ? -2% |
| Read Seq Q32T1 (MB/s) | 3324 | 3387 2% | 3116 -6% | 525 -84% | 3313 ? 0% |

| 3DMark 11 Performance | 2114 pontos | |
| 3DMark Cloud Gate Standard Score | 9208 pontos | |
| 3DMark Fire Strike Score | 1176 pontos | |
Ajuda | ||
| baixo | média | alto | ultra | |
|---|---|---|---|---|
| BioShock Infinite (2013) | 78.7 | 39.7 | 33.5 | 10.2 |
| The Witcher 3 (2015) | 17.4 | |||
| Rise of the Tomb Raider (2016) | 24.5 | 14.9 |
Barulho
| Ocioso |
| 32.5 / 32.5 / 32.5 dB |
| Carga |
| 43.3 / 43.9 dB |
 | ||
30 dB silencioso 40 dB(A) audível 50 dB(A) ruidosamente alto |
||
min: | ||
(+) A temperatura máxima no lado superior é 38.7 °C / 102 F, em comparação com a média de 35.9 °C / 97 F , variando de 21.4 a 59 °C para a classe Subnotebook.
(±) A parte inferior aquece até um máximo de 42 °C / 108 F, em comparação com a média de 39.2 °C / 103 F
(+) Em uso inativo, a temperatura média para o lado superior é 25.5 °C / 78 F, em comparação com a média do dispositivo de 30.8 °C / ### class_avg_f### F.
(+) Os apoios para as mãos e o touchpad são mais frios que a temperatura da pele, com um máximo de 28.1 °C / 82.6 F e, portanto, são frios ao toque.
(±) A temperatura média da área do apoio para as mãos de dispositivos semelhantes foi 28.2 °C / 82.8 F (+0.1 °C / 0.2 F).
VAIO SX14 análise de áudio
(-) | alto-falantes não muito altos (###valor### dB)
Graves 100 - 315Hz
(-) | quase nenhum baixo - em média 31.9% menor que a mediana
(+) | o baixo é linear (4.8% delta para a frequência anterior)
Médios 400 - 2.000 Hz
(±) | médios mais altos - em média 7.7% maior que a mediana
(±) | a linearidade dos médios é média (11.6% delta para frequência anterior)
Altos 2 - 16 kHz
(+) | agudos equilibrados - apenas 3.8% longe da mediana
(+) | os máximos são lineares (5.6% delta da frequência anterior)
Geral 100 - 16.000 Hz
(-) | o som geral não é linear (32.3% diferença em relação à mediana)
Comparado com a mesma classe
» 94% de todos os dispositivos testados nesta classe foram melhores, 2% semelhantes, 4% piores
» O melhor teve um delta de 5%, a média foi 18%, o pior foi 53%
Comparado com todos os dispositivos testados
» 91% de todos os dispositivos testados foram melhores, 2% semelhantes, 7% piores
» O melhor teve um delta de 4%, a média foi 23%, o pior foi 134%
Lenovo ThinkPad X1 Carbon 2018-20KGS03900 análise de áudio
(+) | os alto-falantes podem tocar relativamente alto (###valor### dB)
Graves 100 - 315Hz
(-) | quase nenhum baixo - em média 25.9% menor que a mediana
(±) | a linearidade dos graves é média (9.8% delta para a frequência anterior)
Médios 400 - 2.000 Hz
(+) | médios equilibrados - apenas 3.8% longe da mediana
(±) | a linearidade dos médios é média (9% delta para frequência anterior)
Altos 2 - 16 kHz
(+) | agudos equilibrados - apenas 2.1% longe da mediana
(+) | os máximos são lineares (4% delta da frequência anterior)
Geral 100 - 16.000 Hz
(±) | a linearidade do som geral é média (18.7% diferença em relação à mediana)
Comparado com a mesma classe
» 35% de todos os dispositivos testados nesta classe foram melhores, 6% semelhantes, 59% piores
» O melhor teve um delta de 7%, a média foi 21%, o pior foi 53%
Comparado com todos os dispositivos testados
» 43% de todos os dispositivos testados foram melhores, 8% semelhantes, 49% piores
» O melhor teve um delta de 4%, a média foi 23%, o pior foi 134%
| desligado | |
| Ocioso | |
| Carga |
|
Key:
min: | |
| VAIO SX14 i5-8265U, UHD Graphics 620, Samsung SSD PM981 MZVLB256HAHQ, IPS LED, 1920x1080, 14" | Lenovo ThinkPad X1 Carbon 2018-20KGS03900 i5-8550U, UHD Graphics 620, Samsung SSD PM981 MZVLB512HAJQ, IPS, 2560x1440, 14" | Dell Latitude 7390 i7-8650U, UHD Graphics 620, Samsung PM961 MZVLW256HEHP, IPS, 1920x1080, 13.3" | Asus ASUSPRO B9440UA-GV0100T i5-7200U, HD Graphics 620, Micron SSD 1100 (MTFDDAV256TBN), IPS, 1920x1080, 14" | Fujitsu Lifebook U938 i5-8250U, UHD Graphics 620, Micron 1100 MTFDDAV256TBN, IPS, 1920x1080, 13.3" | Média Intel UHD Graphics 620 | Média da turma Subnotebook | |
|---|---|---|---|---|---|---|---|
| Power Consumption | -18% | 11% | 20% | 29% | 4% | -5% | |
| Idle Minimum * (Watt) | 4.4 | 3.8 14% | 3.3 25% | 3.1 30% | 2.4 45% | 3.81 ? 13% | 3.73 ? 15% |
| Idle Average * (Watt) | 7.9 | 8.9 -13% | 5.9 25% | 6.1 23% | 5.5 30% | 6.94 ? 12% | 6.57 ? 17% |
| Idle Maximum * (Watt) | 8 | 11.9 -49% | 6.2 22% | 6.8 15% | 6 25% | 8.75 ? -9% | 7.93 ? 1% |
| Load Average * (Watt) | 38 | 47.5 -25% | 43.2 -14% | 27.4 28% | 31 18% | 35 ? 8% | 42.1 ? -11% |
| Load Maximum * (Watt) | 44.9 | 52.5 -17% | 45.2 -1% | 43.7 3% | 32.6 27% | 47.5 ? -6% | 65.1 ? -45% |
* ... menor é melhor
| VAIO SX14 i5-8265U, UHD Graphics 620, 38 Wh | Lenovo ThinkPad X1 Carbon 2018-20KGS03900 i5-8550U, UHD Graphics 620, 57 Wh | Dell Latitude 7390 i7-8650U, UHD Graphics 620, 60 Wh | Asus ASUSPRO B9440UA-GV0100T i5-7200U, HD Graphics 620, 48 Wh | Fujitsu Lifebook U938 i5-8250U, UHD Graphics 620, 50 Wh | Média da turma Subnotebook | |
|---|---|---|---|---|---|---|
| Duração da bateria | 58% | 95% | 58% | 46% | 117% | |
| Reader / Idle (h) | 10.1 | 22.1 119% | 19 88% | 19.5 93% | 26.4 ? 161% | |
| H.264 (h) | 6.5 | 9.4 45% | 7.2 11% | 15.3 ? 135% | ||
| WiFi v1.3 (h) | 5.7 | 8.7 53% | 11.1 95% | 8.9 56% | 8.4 47% | 13.9 ? 144% |
| Load (h) | 1.6 | 1.8 13% | 2.1 31% | 2.1 31% | 2.04 ? 27% |
Pro
Contra
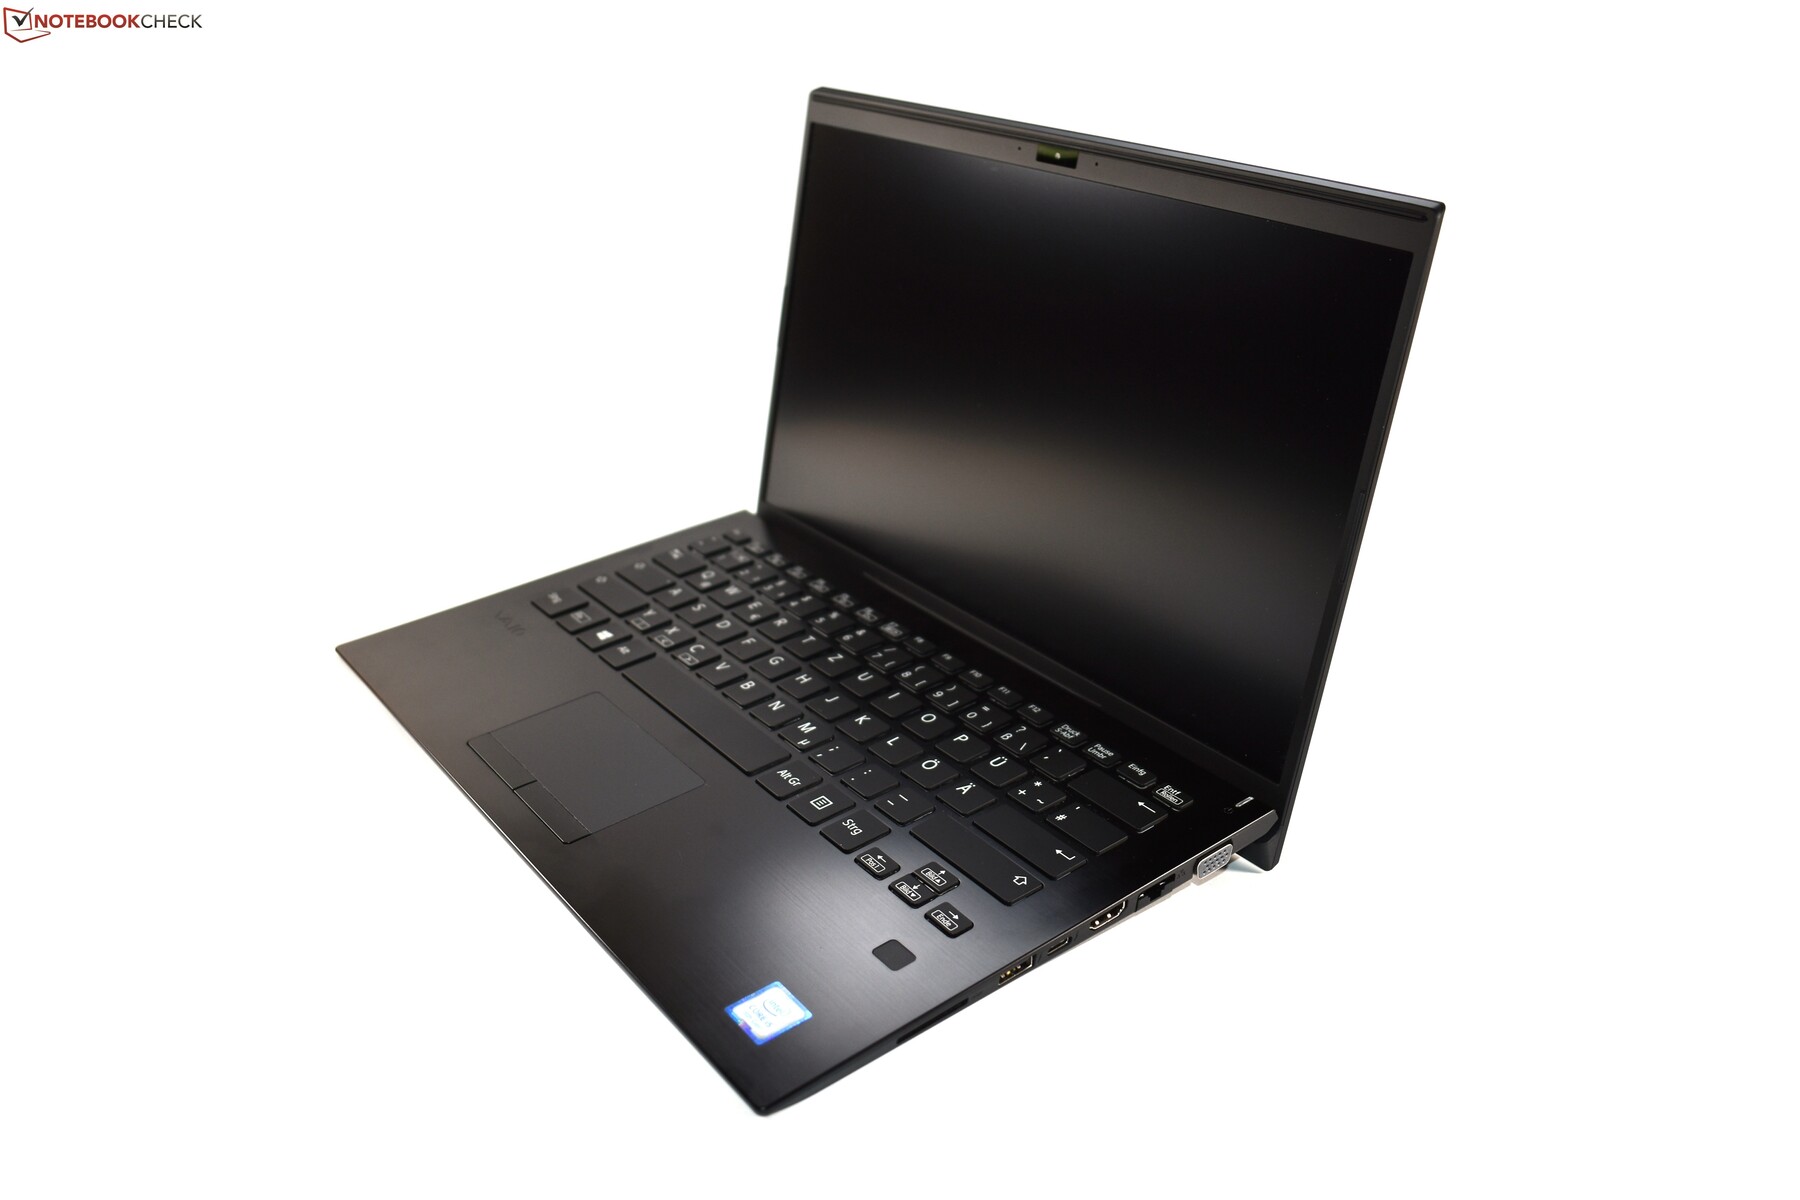
O Vaio SX14 deve ser o grande retorno do Vaio ao mercado de PC ocidental. Este retorno é uma história de sucesso? Em alguns aspectos sim, mas infelizmente o Vaio cometeu dois grandes erros.
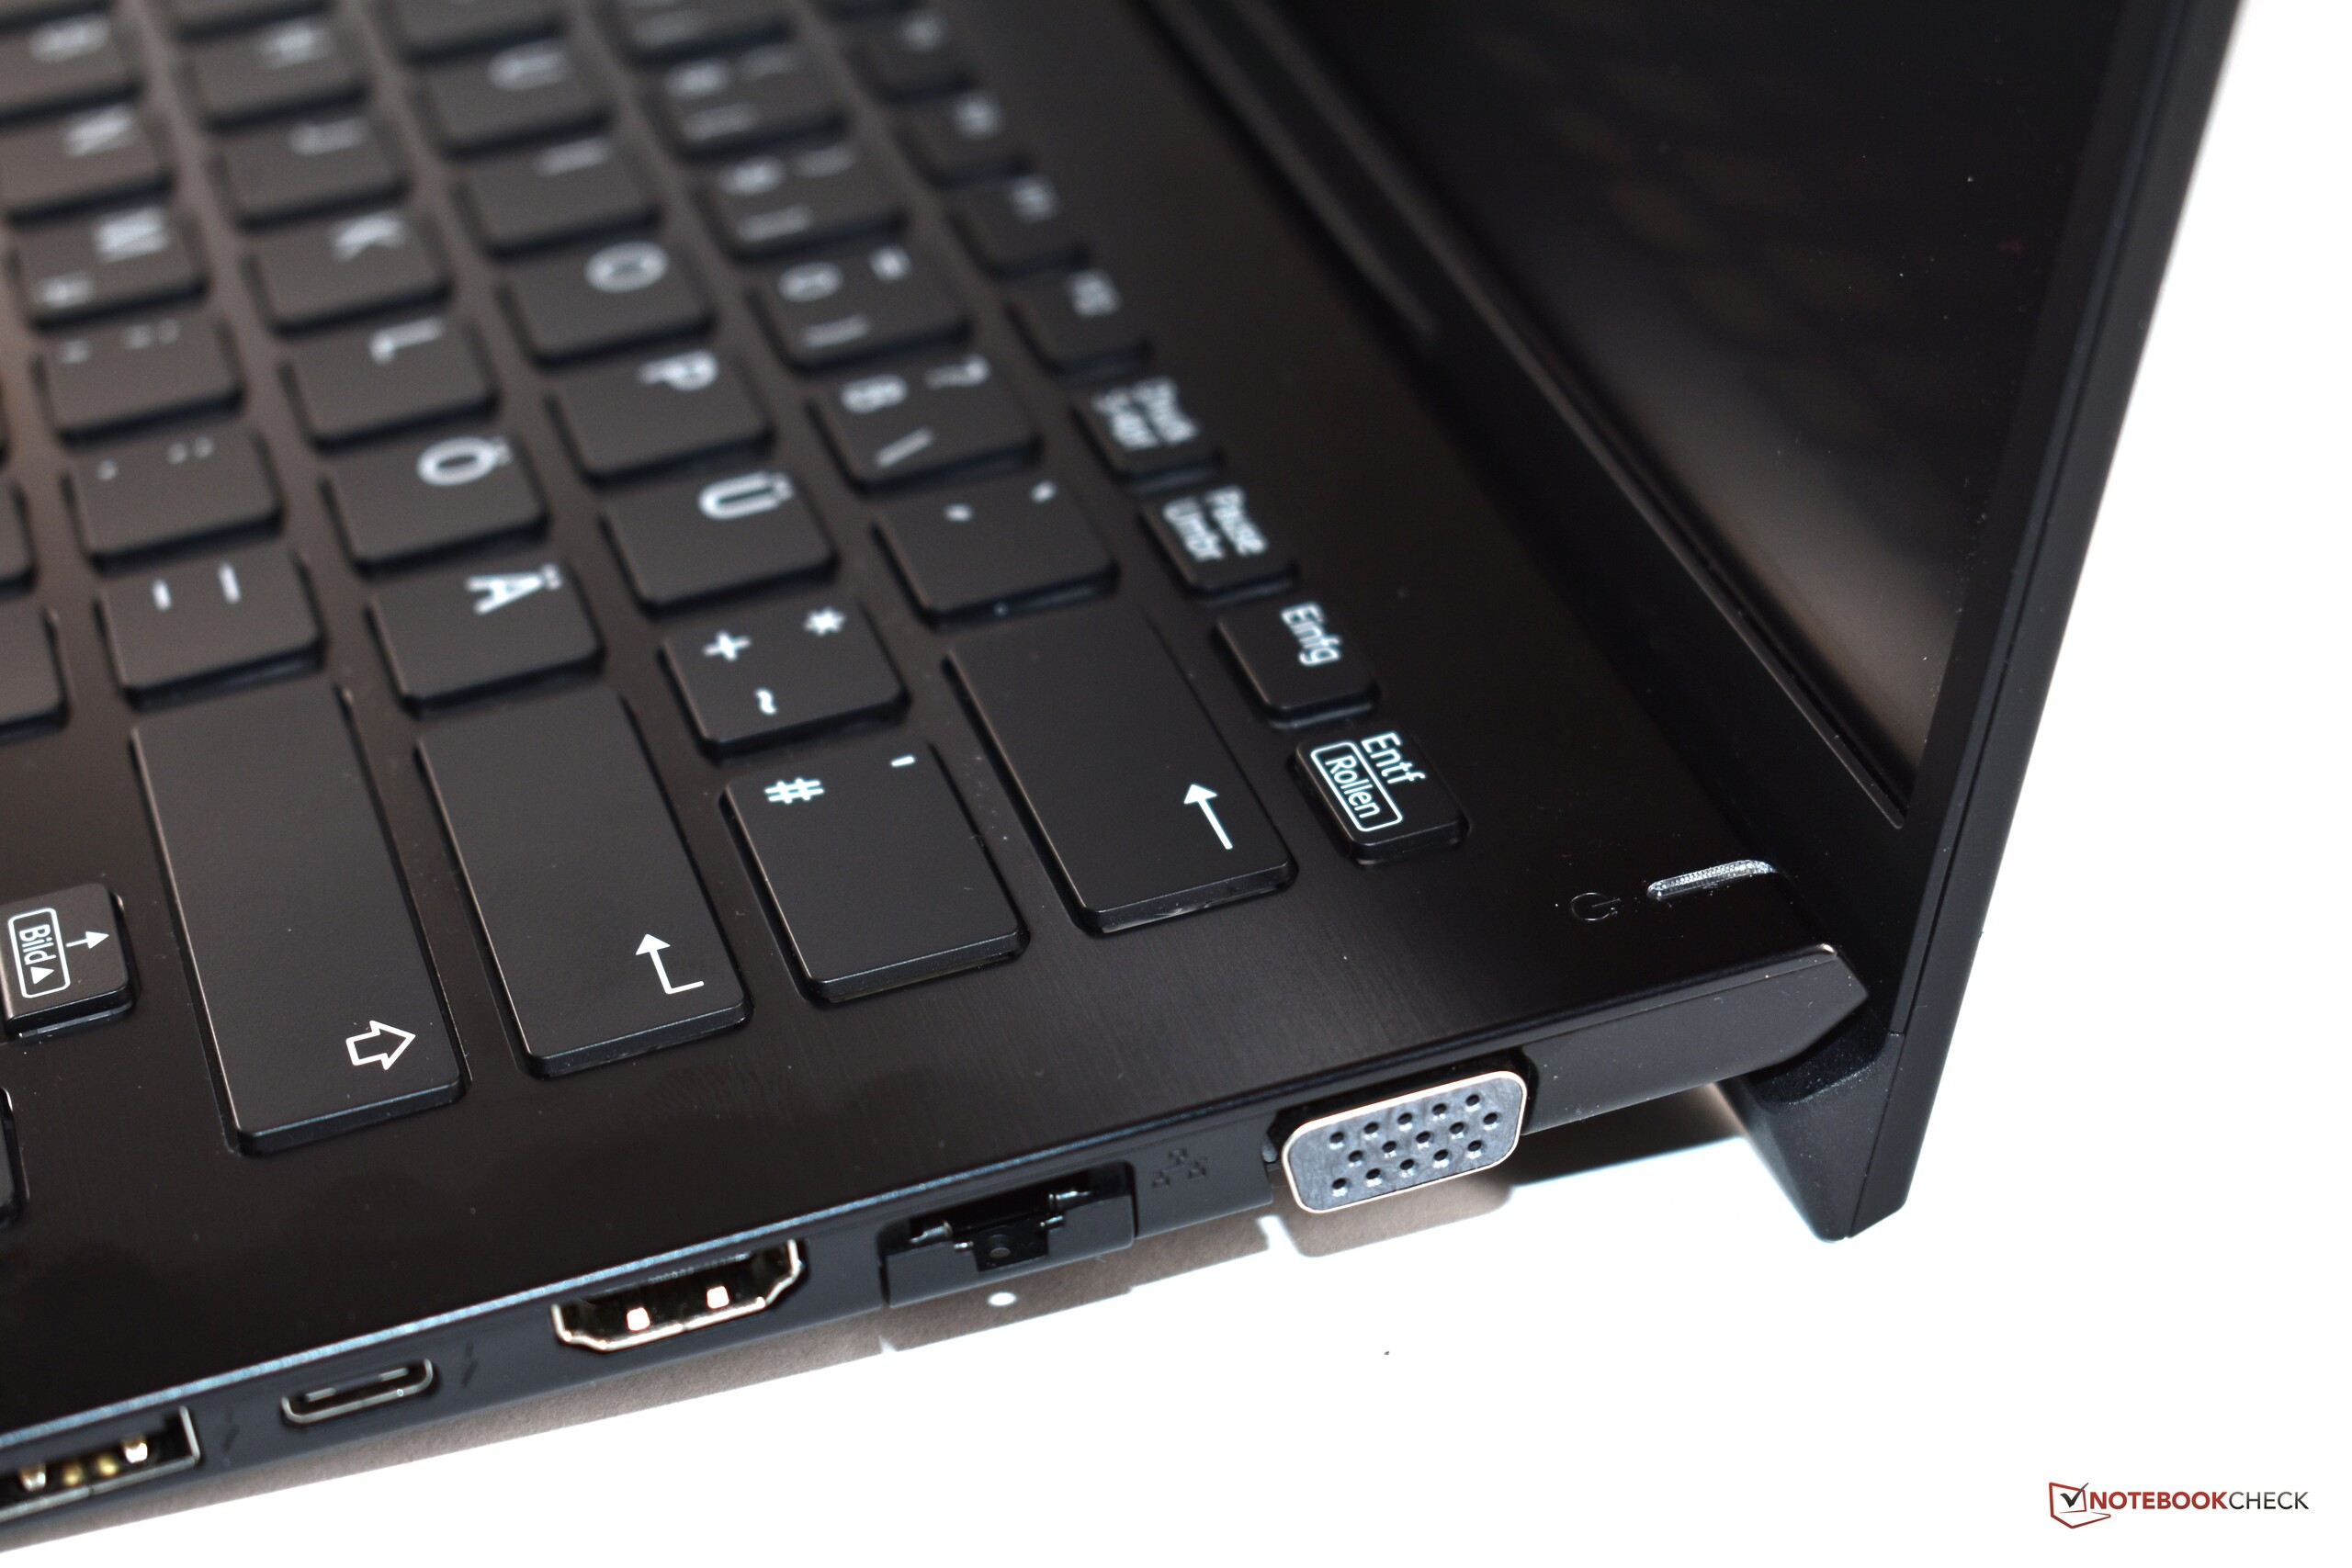
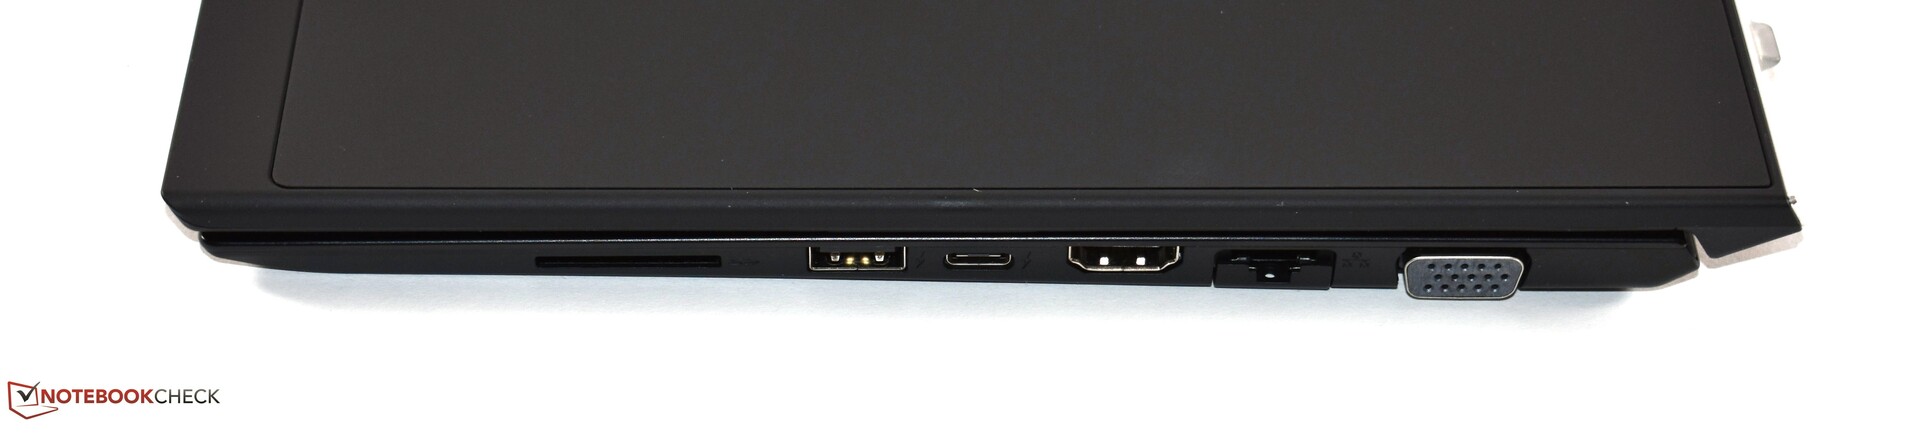
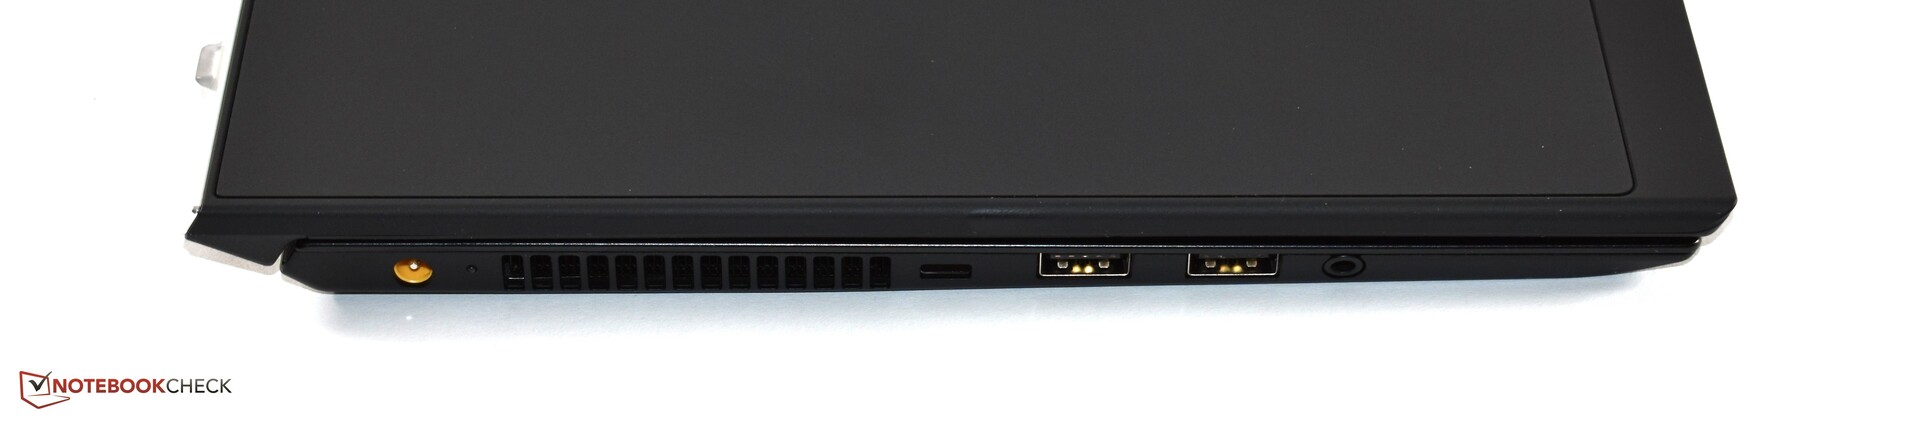
Vamos nos concentrar nos aspectos positivos do sucessor do Sony Vaio moderno primeiro. Nós gostamos muito do chassi extremamente leve, que também tem um certo nível de estabilidade, apesar de sua leveza. Também gostamos do teclado confortável. A tela mate não é muito brilhante, mas possui uma cobertura suficientemente alta da gama de cores sRGB para permitir a edição de fotos. A seleção de portas é abundante. A porta VGA em particular é algo que você não vai encontrar na maioria dos outros portáteis atualmente. Também é louvável que todos os modelos (pelo menos aqui na Alemanha) apresentem LTE - que não é o caso de todos os concorrentes. Por último, mas não menos importante, o Vaio SX14 oferece um bom desempenho da CPU e mantém-se frio no exterior, mesmo sob uso intenso.
Um portátil ultra leve com internet móvel e muitas portas - isso soa como uma excelente máquina de trabalho móvel, mas de que adianta a grande conectividade em movimento se o dispositivo tiver uma bateria com pouca duração? Infelizmente, a bateria interna é muito pequena e nem consegue manter o Vaio SX14 funcionando por 5 horas no teste de WiFi. Parece que Vaio colocou muita ênfase no baixo peso, propositalmente colocando uma bateria menor para economizar peso. Isso significa que o Vaio não é utilizável por muito tempo em movimento sem um banco de energia. A segunda grande desvantagem é o controle do ventilador: Achamos extremamente irritante que o ventilador sempre funcione, não importa se o dispositivo está ocioso ou sob uso intenso. Isto é simplesmente desnecessário. Com esses problemas em mente, os problemas remanescentes do Vaio SX14, como a falta da porta Thunderbolt 3, o touchpad pequeno, os alto-falantes ruins, a opção de teclado ISO ausente e o alto preço parecem pequenos.
A duração da bateria ruim e um ventilador irritante resultam em um xeque-mate contra o Vaio SX14 - apesar de suas qualidades inegáveis.
Gostaríamos de recomendar o Vaio SX14. O design compacto e leve é muito atraente. Infelizmente, nós simplesmente não podemos fazê-lo, devido à duração ruim da bateria e controle irritante do ventilador. Uma pena, porque esse dispositivo tem muito potencial. O Vaio só precisa revisar o controle do ventilador e colocar uma bateria maior na próxima versão - mesmo que isso resulte em um peso ligeiramente maior.
VAIO SX14
- 04/30/2019 v6 (old)
Benjamin Herzig
Price comparison
