Breve Análise do Tablet Microsoft Surface Go (Pentium, 64GB eMMC)

| SD Card Reader | |
| average JPG Copy Test (av. of 3 runs) | |
| Microsoft Surface Go MHN-00003 (Toshiba Exceria Pro M501) | |
| Média da turma Convertible (28.1 - 197, n=23, últimos 2 anos) | |
| Asus Transformer Book T102HA-GR022T (Toshiba Exceria Pro M501 microSDXC 64GB) | |
| Asus VivoBook Flip 14 TP401NA (Toshiba Exceria Pro M501 microSDXC 64GB) | |
| maximum AS SSD Seq Read Test (1GB) | |
| Média da turma Convertible (28.9 - 254, n=22, últimos 2 anos) | |
| Microsoft Surface Go MHN-00003 (Toshiba Exceria Pro M501) | |
| Asus VivoBook Flip 14 TP401NA (Toshiba Exceria Pro M501 microSDXC 64GB) | |
| Trekstor Primetab T13B | |
| Networking | |
| iperf3 transmit AX12 | |
| Acer Switch 3 SW312-31-P5VG | |
| Microsoft Surface Go MHN-00003 | |
| Trekstor Primetab T13B | |
| Lenovo IdeaPad Miix 320-10ICR Pro LTE | |
| Asus VivoBook Flip 14 TP401NA | |
| Asus Transformer Book T102HA-GR022T | |
| iperf3 receive AX12 | |
| Microsoft Surface Go MHN-00003 | |
| Acer Switch 3 SW312-31-P5VG | |
| Asus VivoBook Flip 14 TP401NA | |
| Trekstor Primetab T13B | |
| Asus Transformer Book T102HA-GR022T | |
| Lenovo IdeaPad Miix 320-10ICR Pro LTE | |
| |||||||||||||||||||||||||
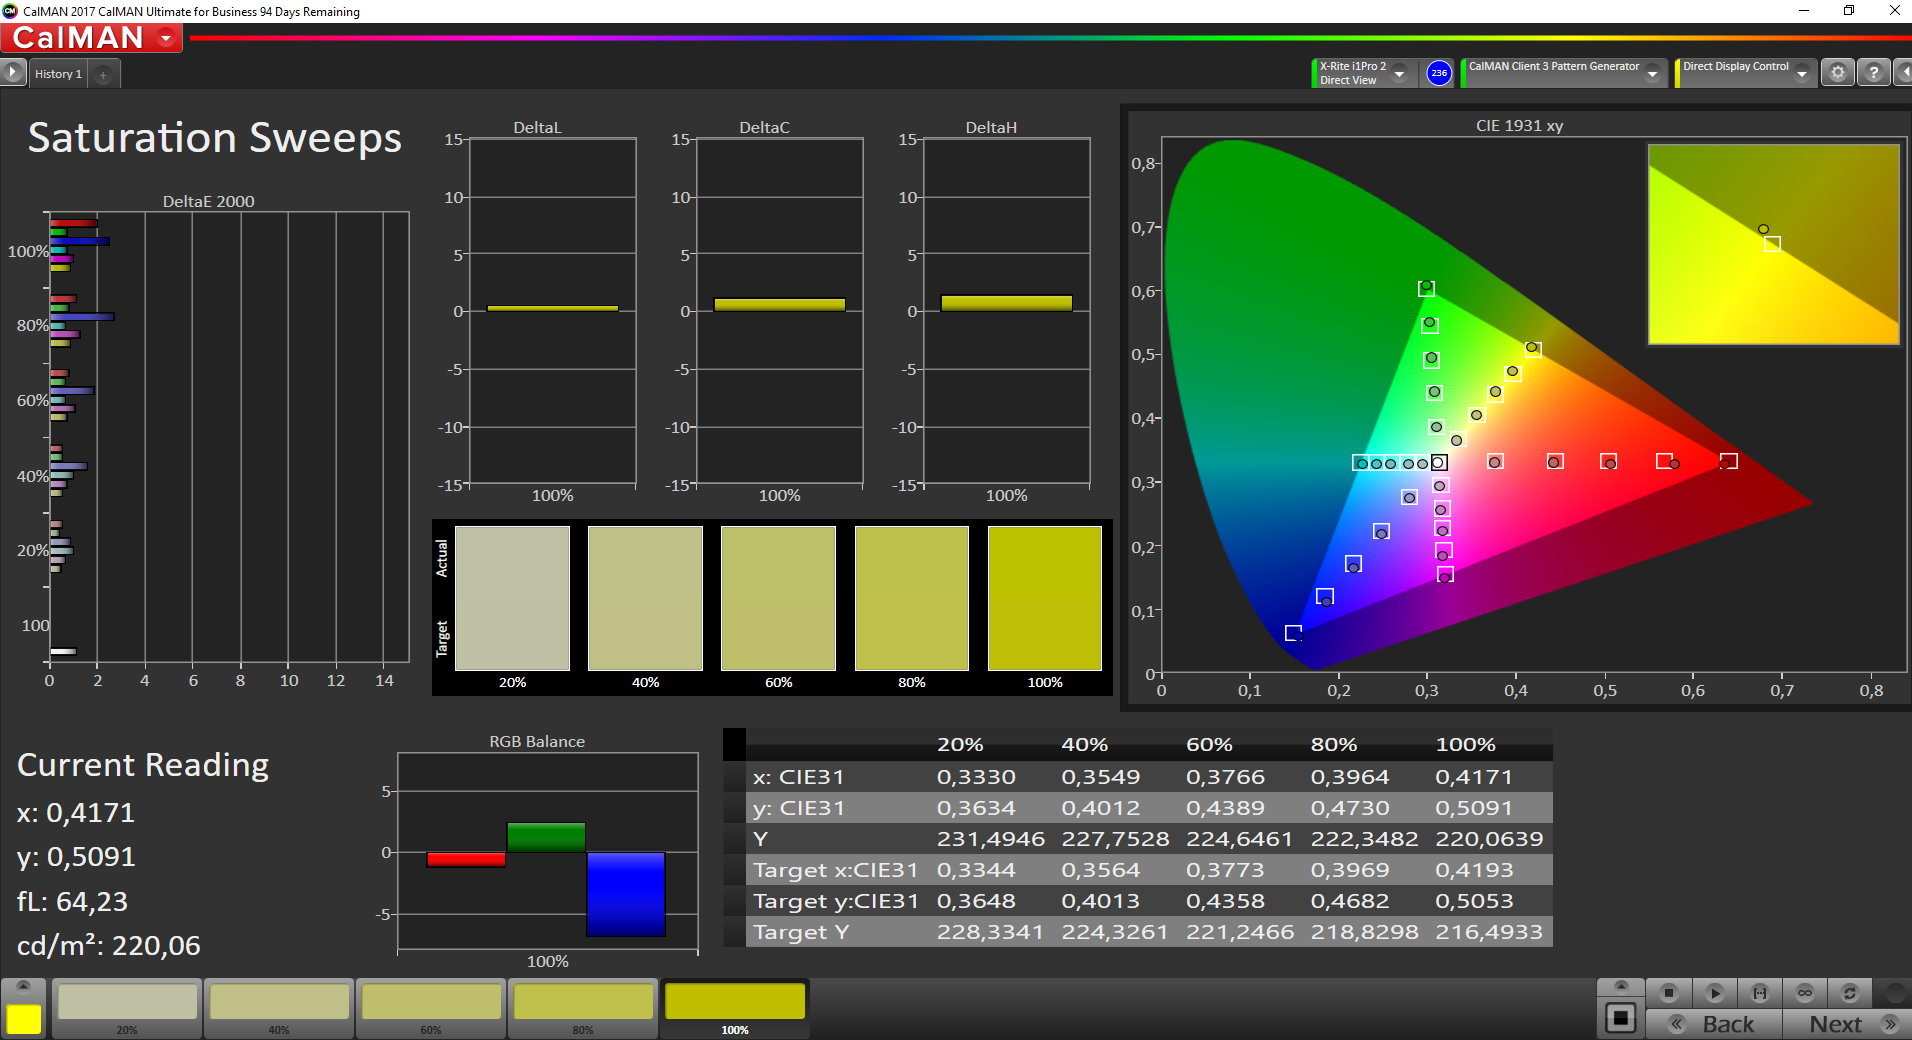
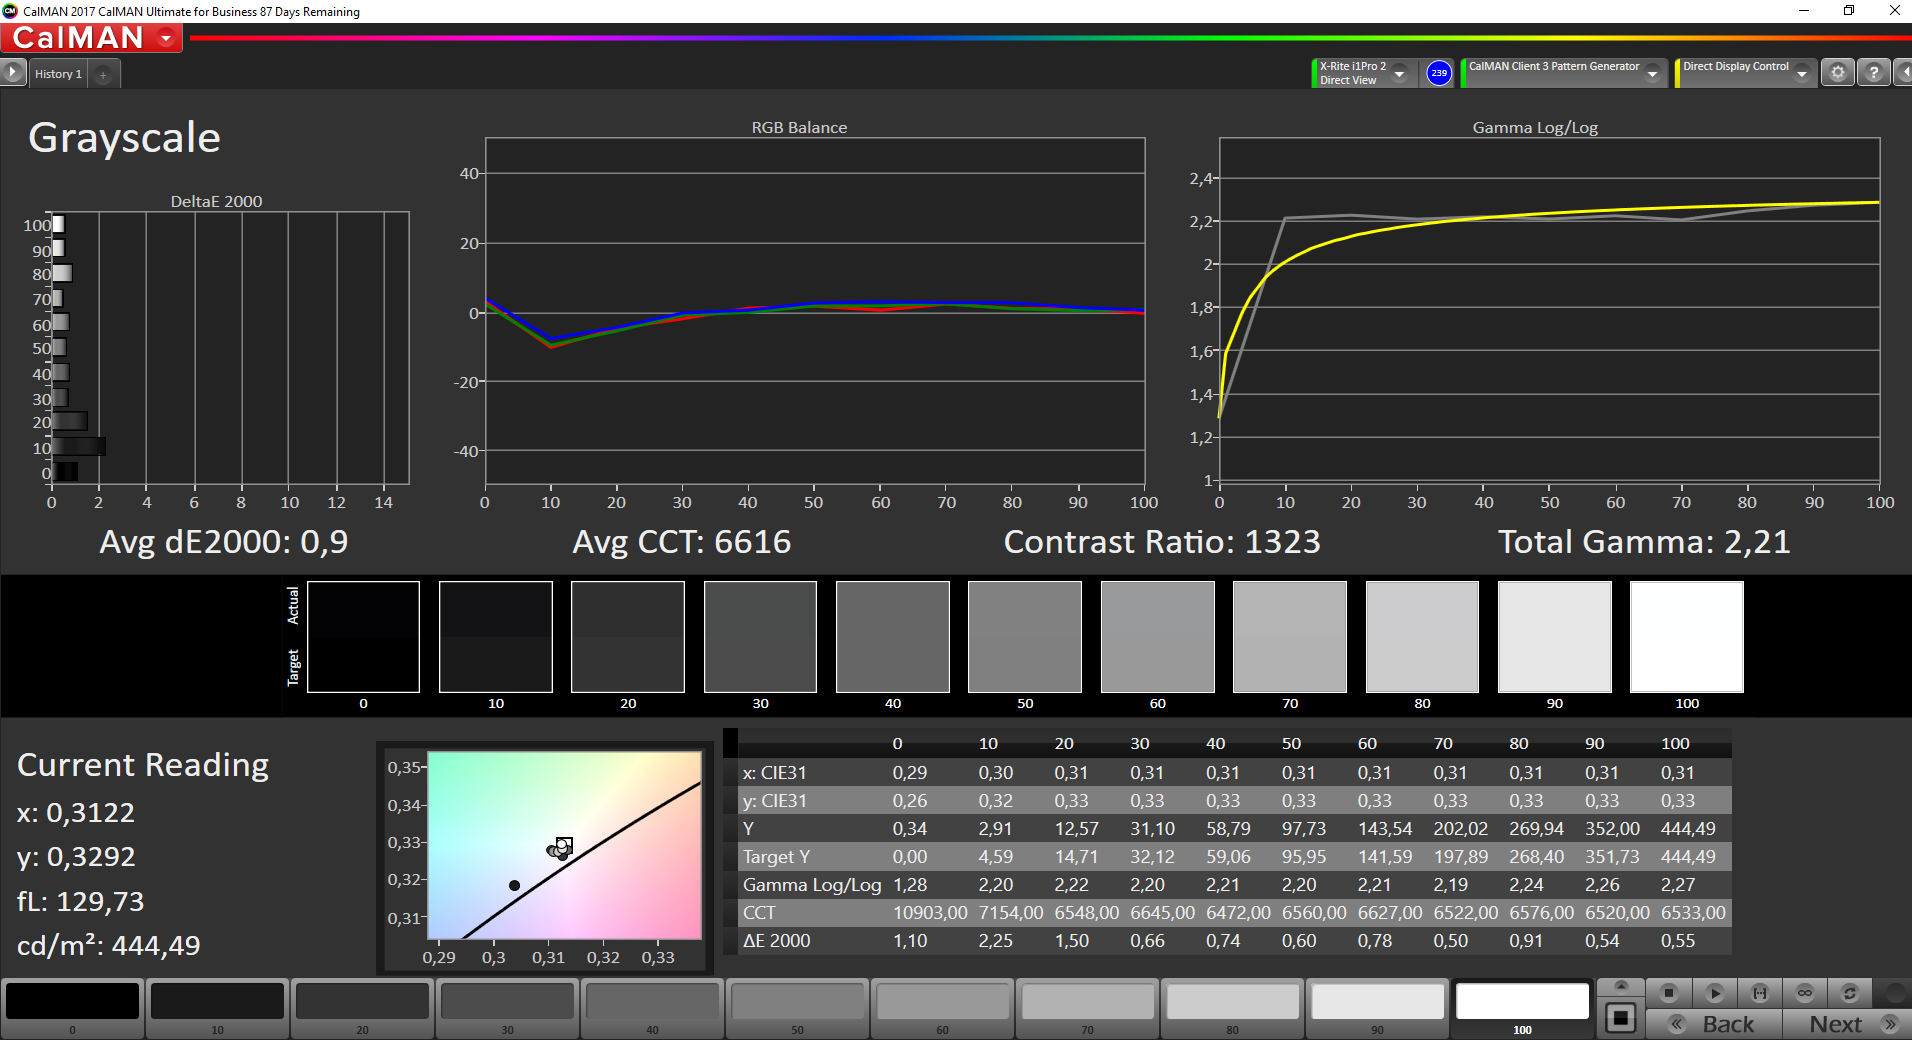
iluminação: 88 %
iluminação com acumulador: 446 cd/m²
Contraste: 1471:1 (Preto: 0.31 cd/m²)
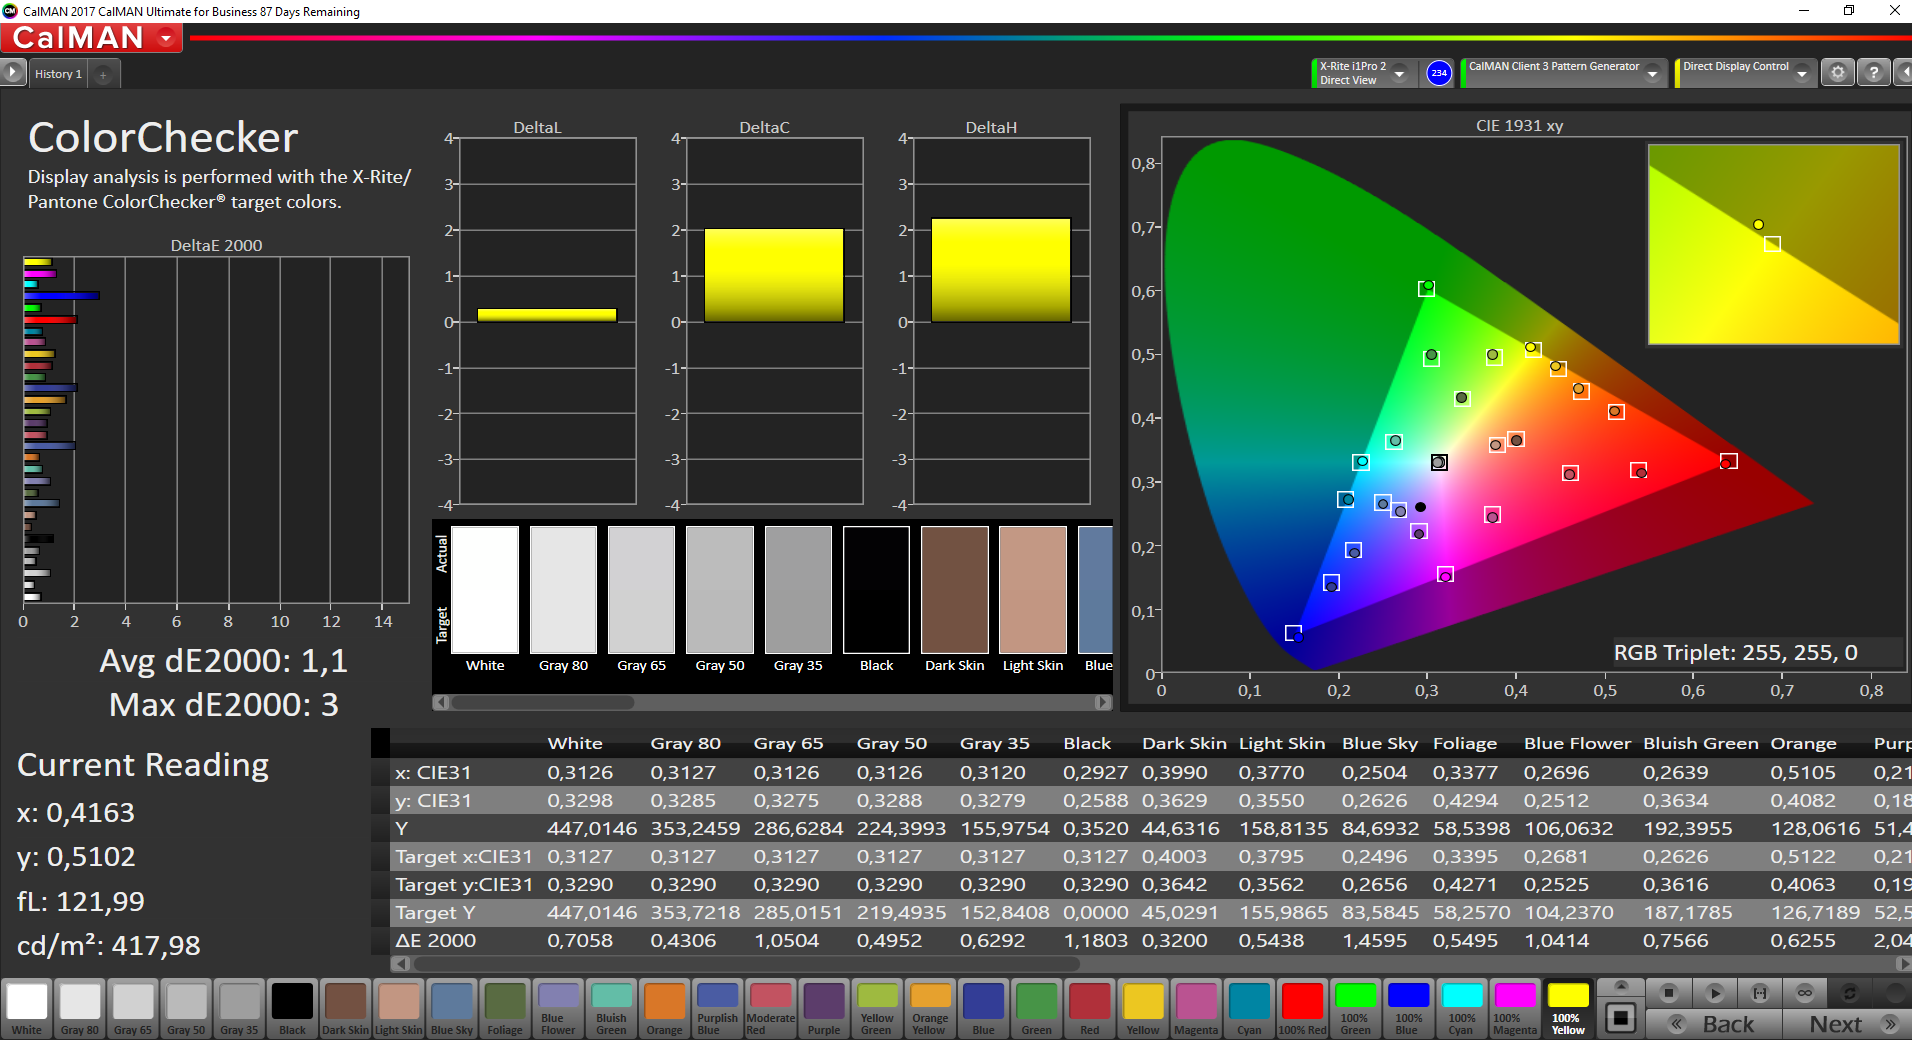
ΔE ColorChecker Calman: 1.3 | ∀{0.5-29.43 Ø4.73}
calibrated: 1.1
ΔE Greyscale Calman: 1.4 | ∀{0.09-98 Ø4.97}
96.8% sRGB (Argyll 1.6.3 3D)
62.3% AdobeRGB 1998 (Argyll 1.6.3 3D)
67.5% AdobeRGB 1998 (Argyll 3D)
97.5% sRGB (Argyll 3D)
66.5% Display P3 (Argyll 3D)
Gamma: 2.24
CCT: 6687 K
| Microsoft Surface Go MHN-00003 Sharp SHP14A6, IPS, 1800x1200, 10" | Asus Transformer Book T102HA-GR022T AU Optronics AUO20D4, IPS, 1280x800, 10.1" | Trekstor Primetab T13B LC133LF4L01, IPS, 1920x1080, 13.3" | Lenovo IdeaPad Miix 320-10ICR Pro LTE YF102, MS_9003, IPS, 1920x1200, 10.1" | Acer Switch 3 SW312-31-P5VG XR122EA2T, IPS, 1920x1200, 12.2" | Asus VivoBook Flip 14 TP401NA BOE CQ NV140FHM-N49, IPS, 1920x1080, 14" | |
|---|---|---|---|---|---|---|
| Display | -20% | -1% | -17% | -6% | -39% | |
| Display P3 Coverage (%) | 66.5 | 53.4 -20% | 66.5 0% | 54.2 -18% | 68 2% 58.8 -12% | 40.21 -40% |
| sRGB Coverage (%) | 97.5 | 76.9 -21% | 95.1 -2% | 81.4 -17% | 91.2 -6% 87.5 -10% | 59.6 -39% |
| AdobeRGB 1998 Coverage (%) | 67.5 | 55.3 -18% | 67.8 0% | 56 -17% | 66.9 -1% 60.6 -10% | 41.54 -38% |
| Response Times | 13% | 1% | 17% | 9% | -14% | |
| Response Time Grey 50% / Grey 80% * (ms) | 44 ? | 29 ? 34% | 38 ? 14% | 32 ? 27% | 37 ? 16% | 42 ? 5% |
| Response Time Black / White * (ms) | 25.6 ? | 28 ? -9% | 29 ? -13% | 24 ? 6% | 25 ? 2% | 34 ? -33% |
| PWM Frequency (Hz) | 1020 ? | 294 ? | 19000 ? | 20000 ? | 960 ? | |
| Screen | -61% | -155% | -106% | -49% | -94% | |
| Brightness middle (cd/m²) | 456 | 530 16% | 324 -29% | 251 -45% | 364 -20% | 253 -45% |
| Brightness (cd/m²) | 426 | 491 15% | 333 -22% | 244 -43% | 341 -20% | 239 -44% |
| Brightness Distribution (%) | 88 | 88 0% | 87 -1% | 79 -10% | 85 -3% | 76 -14% |
| Black Level * (cd/m²) | 0.31 | 0.46 -48% | 0.39 -26% | 0.33 -6% | 0.47 -52% | 0.21 32% |
| Contrast (:1) | 1471 | 1152 -22% | 831 -44% | 761 -48% | 774 -47% | 1205 -18% |
| Colorchecker dE 2000 * | 1.3 | 4.33 -233% | 8.42 -548% | 5.34 -311% | 3.4 -162% | 4.29 -230% |
| Colorchecker dE 2000 max. * | 3 | 7.32 -144% | 15.11 -404% | 9.91 -230% | 7.61 -154% | 8.74 -191% |
| Colorchecker dE 2000 calibrated * | 1.1 | 1.85 -68% | 5.93 -439% | |||
| Greyscale dE 2000 * | 1.4 | 3.51 -151% | 9.18 -556% | 6.04 -331% | 1.7 -21% | 1.49 -6% |
| Gamma | 2.24 98% | 2.36 93% | 2.34 94% | 3.23 68% | 2.36 93% | 2.29 96% |
| CCT | 6687 97% | 7007 93% | 8841 74% | 7491 87% | 6750 96% | 6611 98% |
| Color Space (Percent of AdobeRGB 1998) (%) | 62.3 | 50 -20% | 62 0% | 51 -18% | 59 -5% | 38 -39% |
| Color Space (Percent of sRGB) (%) | 96.8 | 77 -20% | 95 -2% | 81 -16% | 91 -6% | 59 -39% |
| Média Total (Programa/Configurações) | -23% /
-43% | -52% /
-106% | -35% /
-72% | -15% /
-28% | -49% /
-74% |
* ... menor é melhor


Exibir tempos de resposta
| ↔ Tempo de resposta preto para branco | ||
|---|---|---|
| 25.6 ms ... ascensão ↗ e queda ↘ combinadas | ↗ 11.6 ms ascensão | 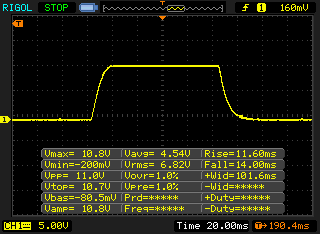 |
| ↘ 14 ms queda | ||
| A tela mostra taxas de resposta relativamente lentas em nossos testes e pode ser muito lenta para os jogadores. Em comparação, todos os dispositivos testados variam de 0.1 (mínimo) a 240 (máximo) ms. » 61 % de todos os dispositivos são melhores. Isso significa que o tempo de resposta medido é pior que a média de todos os dispositivos testados (19.9 ms). | ||
| ↔ Tempo de resposta 50% cinza a 80% cinza | ||
| 44 ms ... ascensão ↗ e queda ↘ combinadas | ↗ 22 ms ascensão | 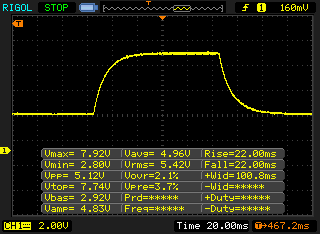 |
| ↘ 22 ms queda | ||
| A tela mostra taxas de resposta lentas em nossos testes e será insatisfatória para os jogadores. Em comparação, todos os dispositivos testados variam de 0.165 (mínimo) a 636 (máximo) ms. » 73 % de todos os dispositivos são melhores. Isso significa que o tempo de resposta medido é pior que a média de todos os dispositivos testados (31.1 ms). | ||
Cintilação da tela / PWM (modulação por largura de pulso)
| Tela tremeluzindo/PWM detectado | 1020 Hz | ≤ 99 % configuração de brilho | 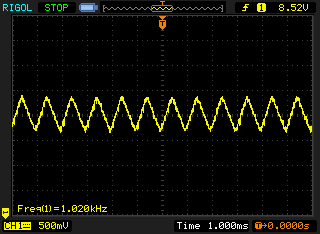 |
A luz de fundo da tela pisca em 1020 Hz (pior caso, por exemplo, utilizando PWM) Cintilação detectada em uma configuração de brilho de 99 % e abaixo. Não deve haver cintilação ou PWM acima desta configuração de brilho. A frequência de 1020 Hz é bastante alta, então a maioria dos usuários sensíveis ao PWM não deve notar nenhuma oscilação. [pwm_comparison] Em comparação: 52 % de todos os dispositivos testados não usam PWM para escurecer a tela. Se PWM foi detectado, uma média de 7794 (mínimo: 5 - máximo: 343500) Hz foi medida. | |||
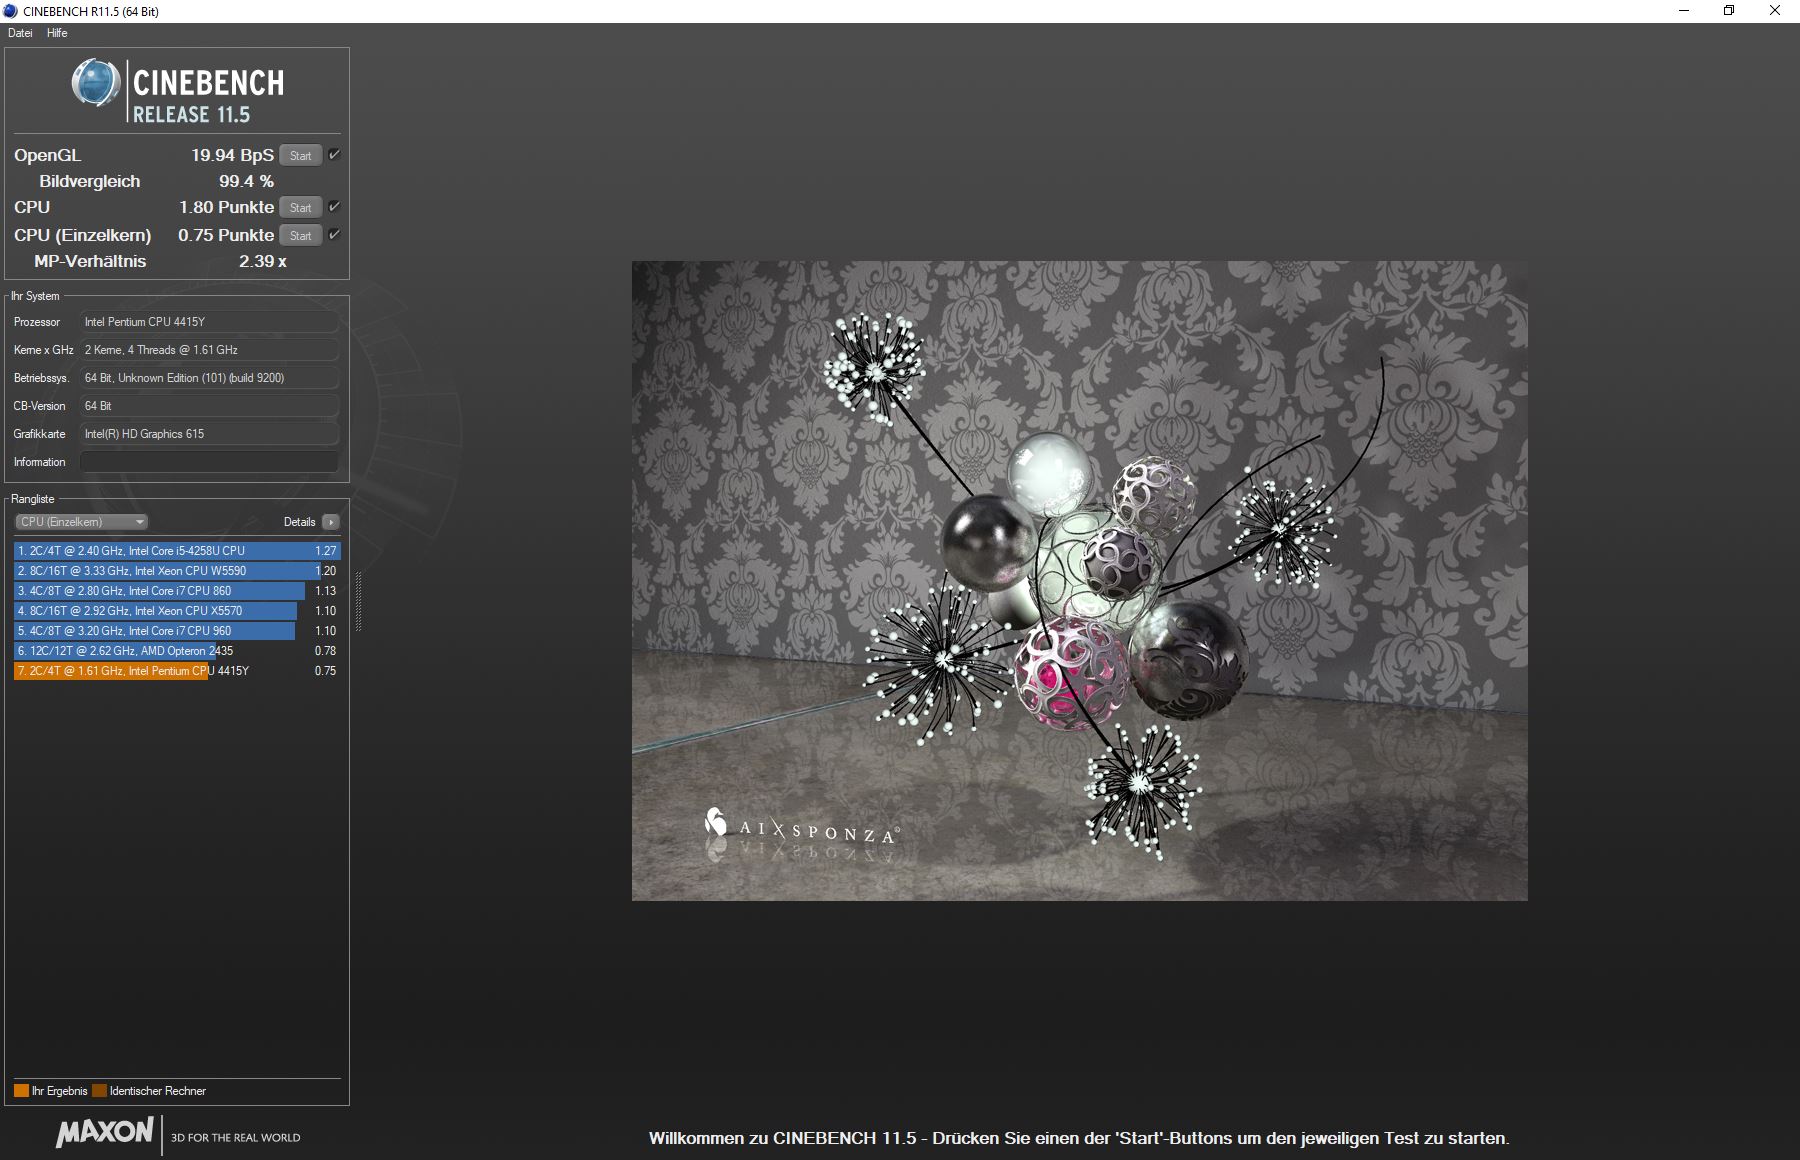
| Cinebench R15 | |
| CPU Single 64Bit | |
| Média da turma Convertible (149.8 - 317, n=49, últimos 2 anos) | |
| Microsoft Surface Go MHN-00003 | |
| Média Intel Pentium Gold 4415Y (n=1) | |
| Asus VivoBook Flip 14 TP401NA | |
| Acer Switch 3 SW312-31-P5VG | |
| Trekstor Primetab T13B | |
| Asus Transformer Book T102HA-GR022T | |
| Lenovo IdeaPad Miix 320-10ICR Pro LTE | |
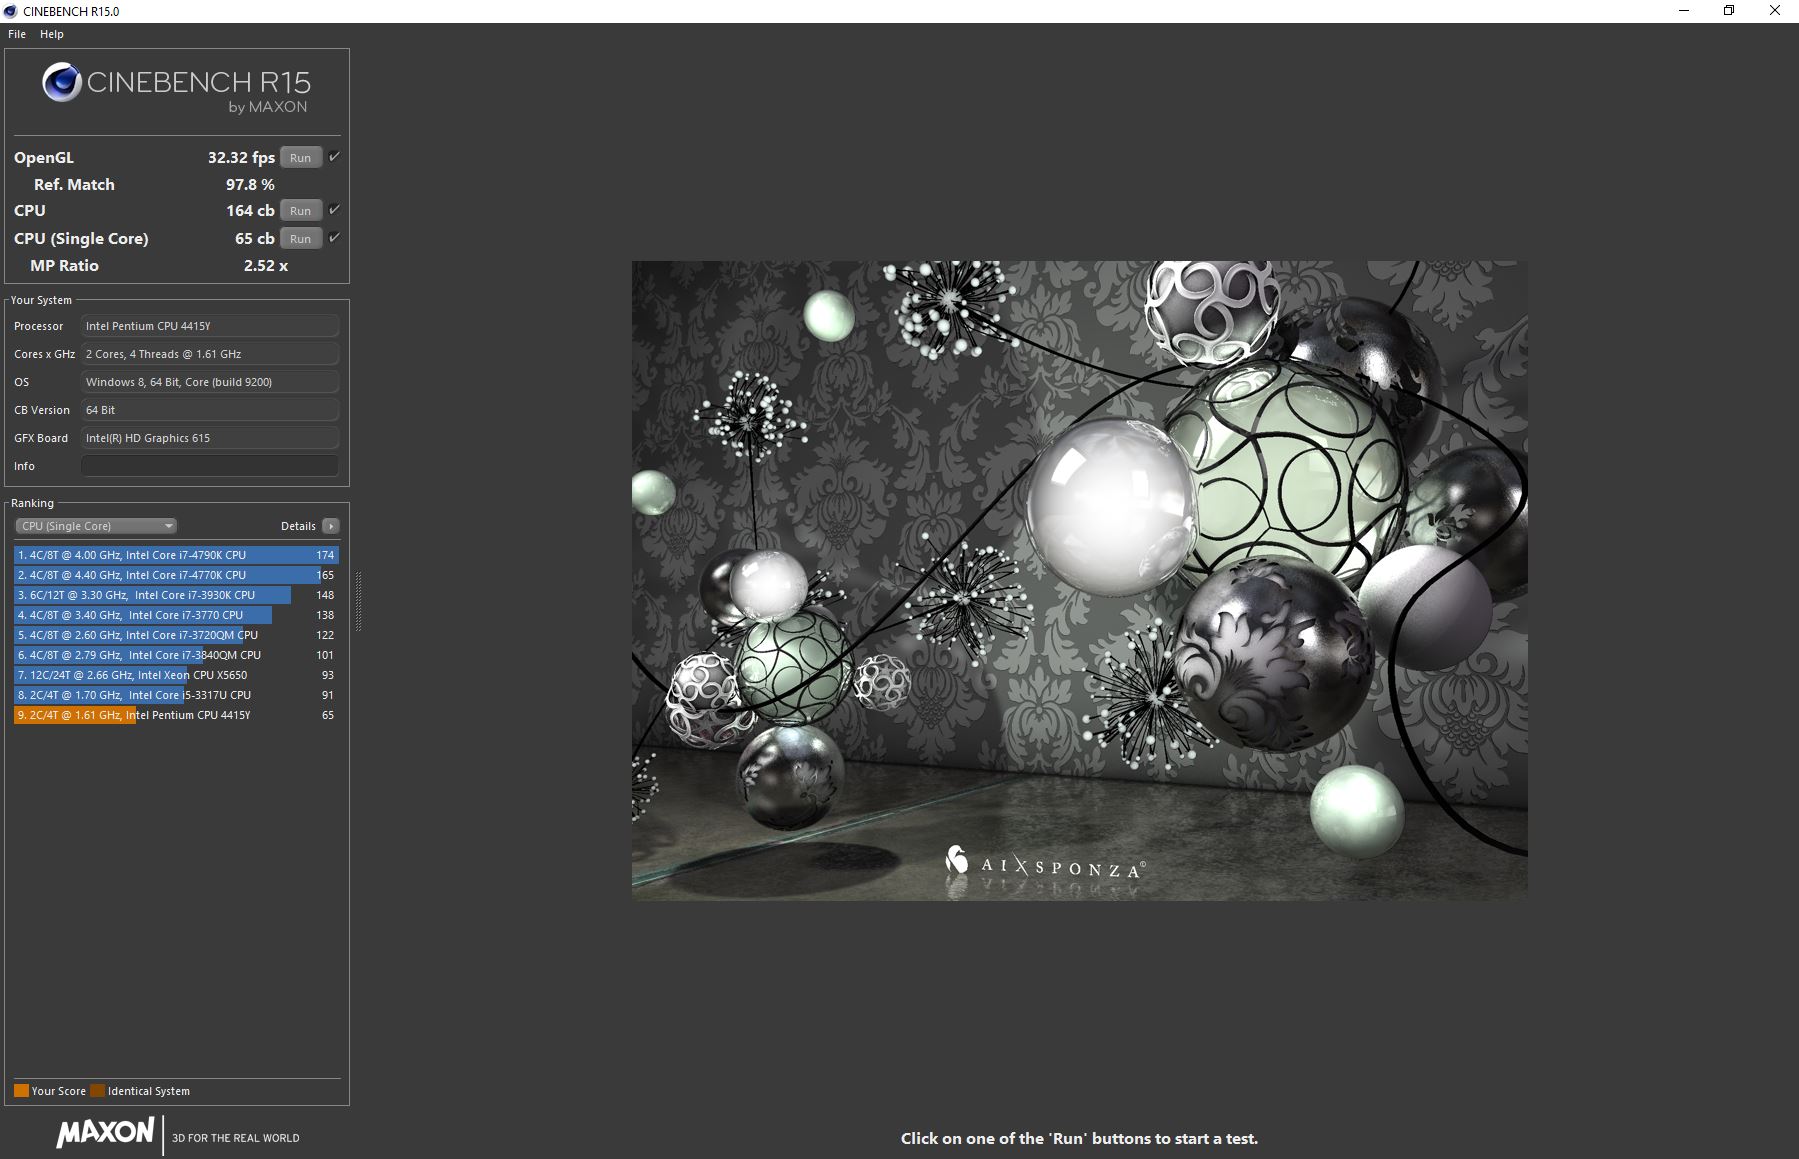
| CPU Multi 64Bit | |
| Média da turma Convertible (478 - 4940, n=49, últimos 2 anos) | |
| Microsoft Surface Go MHN-00003 | |
| Média Intel Pentium Gold 4415Y (n=1) | |
| Asus VivoBook Flip 14 TP401NA | |
| Acer Switch 3 SW312-31-P5VG | |
| Trekstor Primetab T13B | |
| Asus Transformer Book T102HA-GR022T | |
| Lenovo IdeaPad Miix 320-10ICR Pro LTE | |
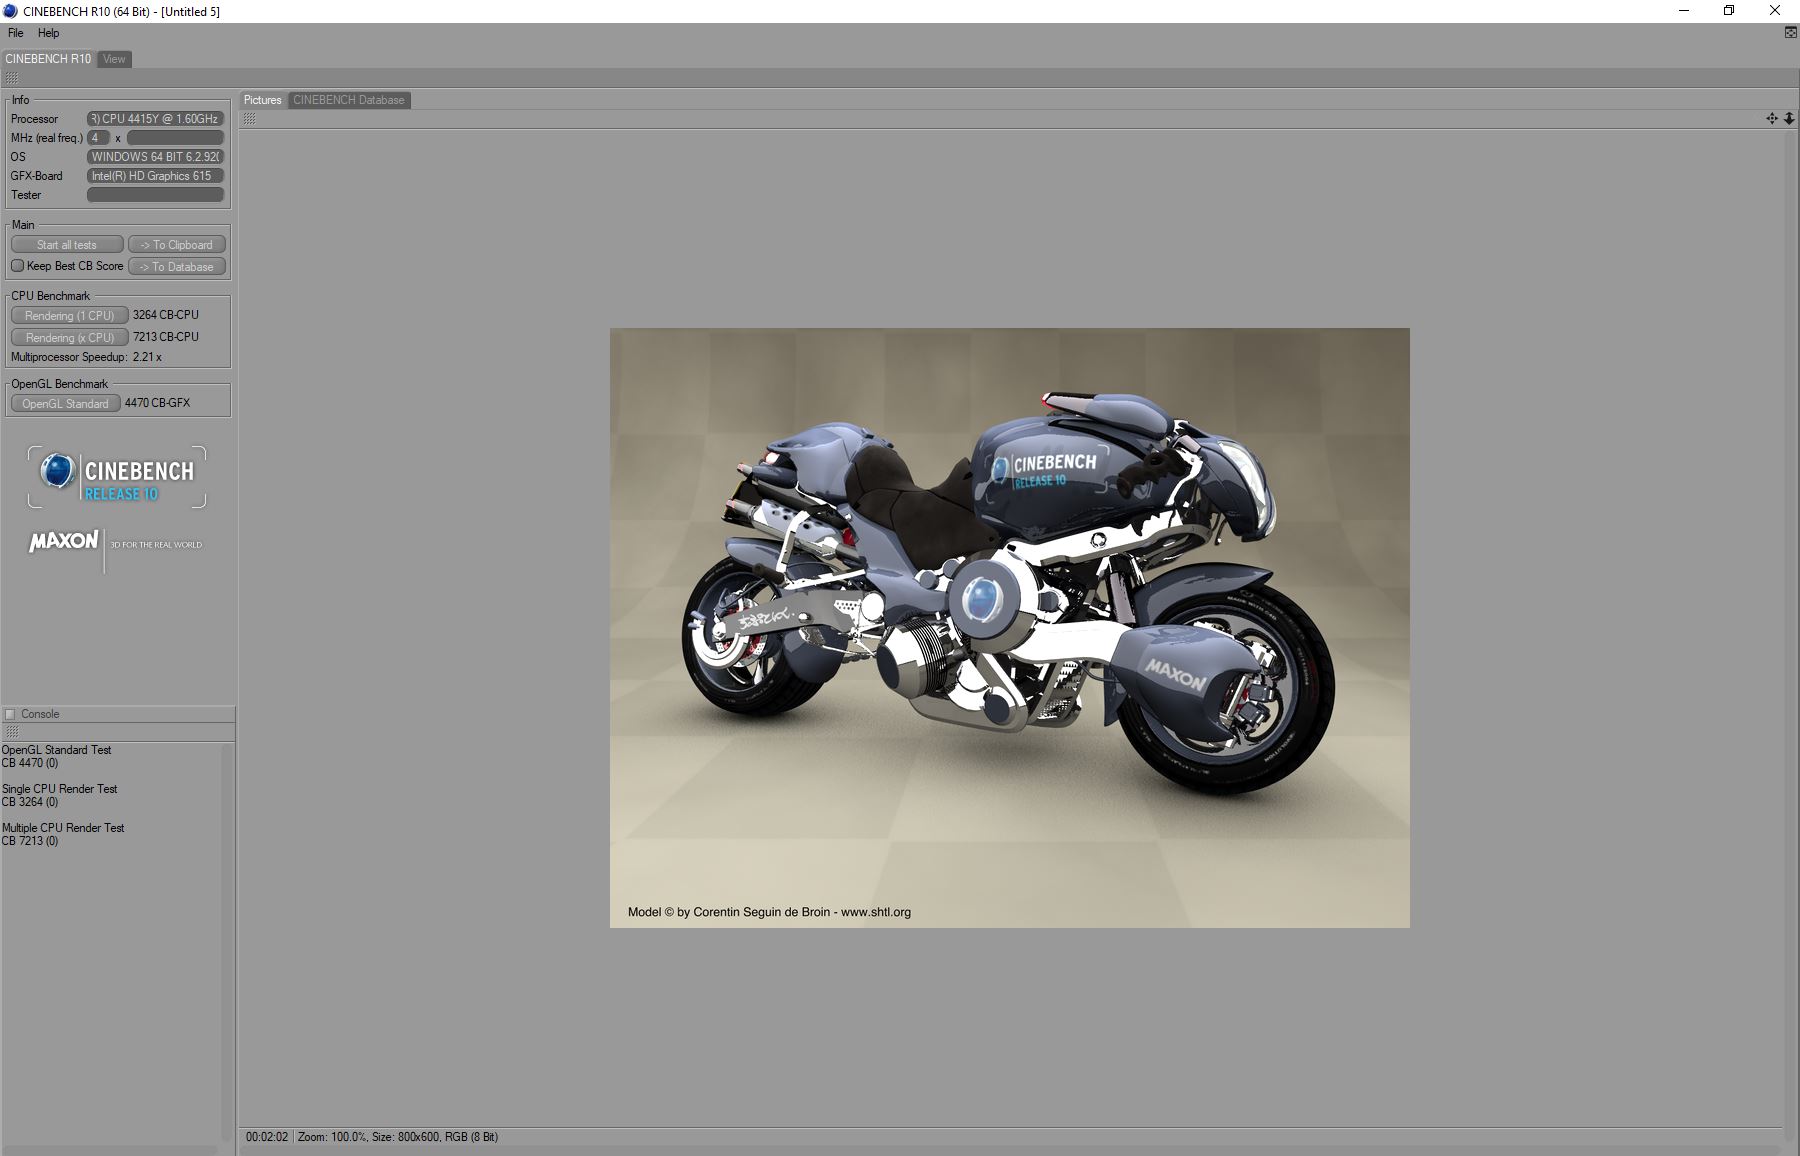
| Cinebench R10 | |
| Rendering Single CPUs 64Bit | |
| Média da turma Convertible (12127 - 12555, n=2, últimos 2 anos) | |
| Microsoft Surface Go MHN-00003 | |
| Média Intel Pentium Gold 4415Y (n=1) | |
| Rendering Multiple CPUs 64Bit | |
| Média da turma Convertible (36094 - 50439, n=2, últimos 2 anos) | |
| Microsoft Surface Go MHN-00003 | |
| Média Intel Pentium Gold 4415Y (n=1) | |
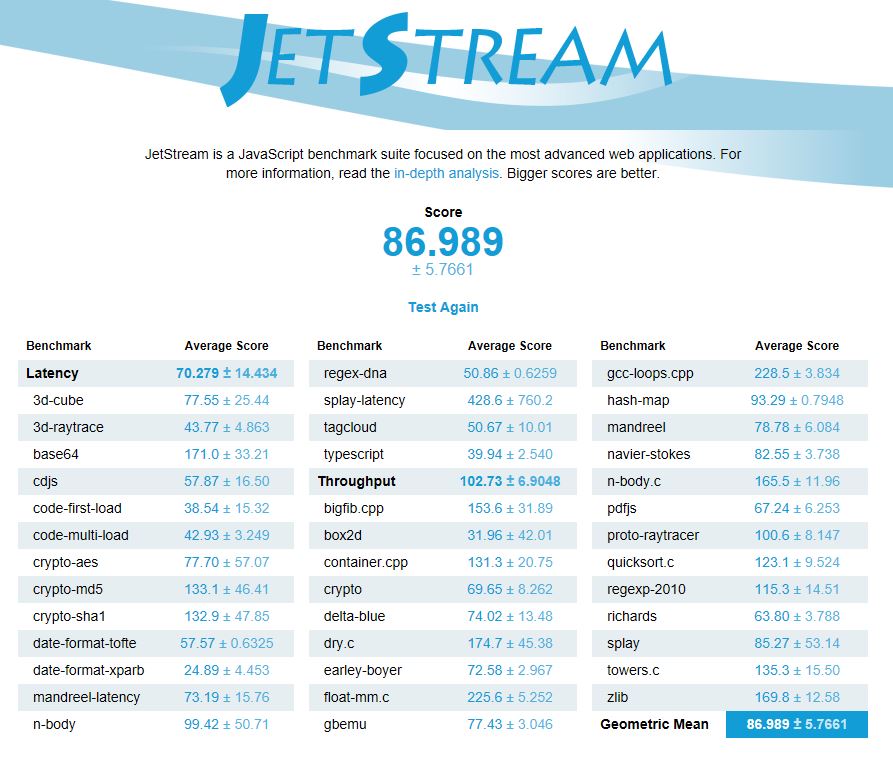
| JetStream 1.1 - 1.1 Total | |
| Microsoft Surface Go MHN-00003 | |
| Média Intel Pentium Gold 4415Y (n=1) | |
| Acer Switch 3 SW312-31-P5VG | |
| Asus VivoBook Flip 14 TP401NA | |
| Trekstor Primetab T13B | |
| Lenovo IdeaPad Miix 320-10ICR Pro LTE | |
| Asus Transformer Book T102HA-GR022T | |
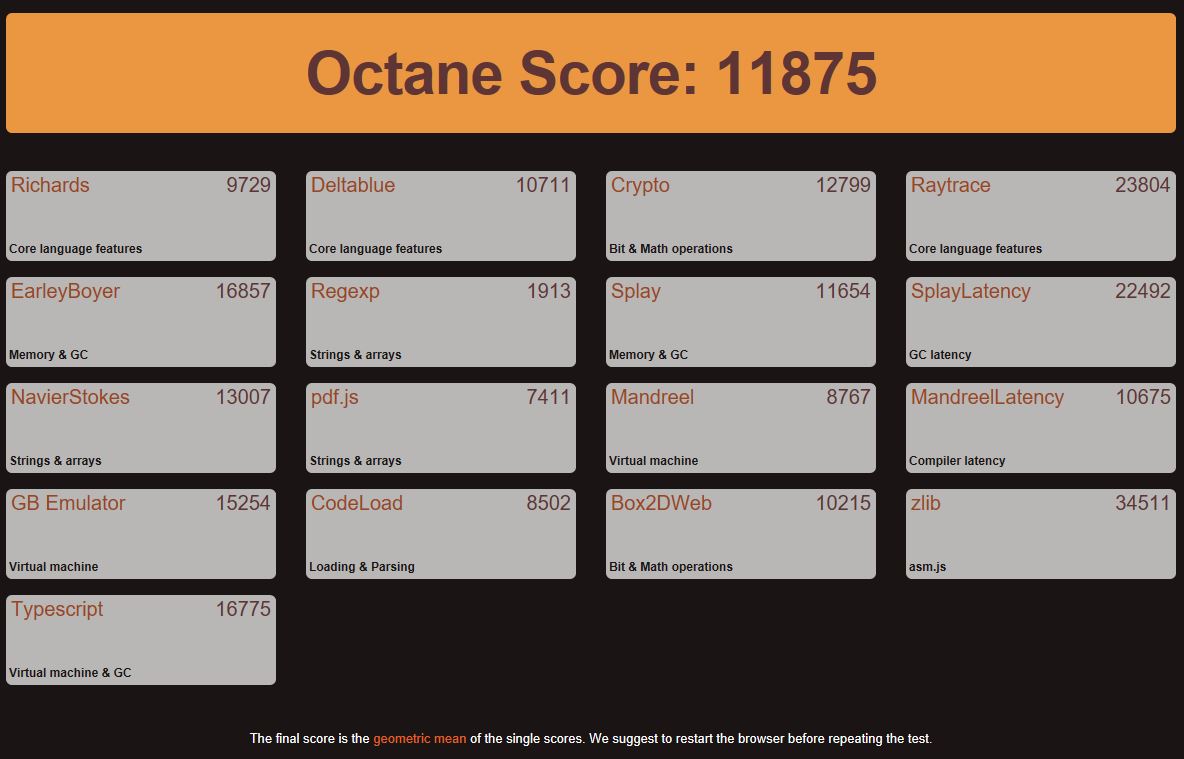
| Octane V2 - Total Score | |
| Média da turma Convertible (50984 - 123023, n=13, últimos 2 anos) | |
| Microsoft Surface Go MHN-00003 | |
| Média Intel Pentium Gold 4415Y (n=1) | |
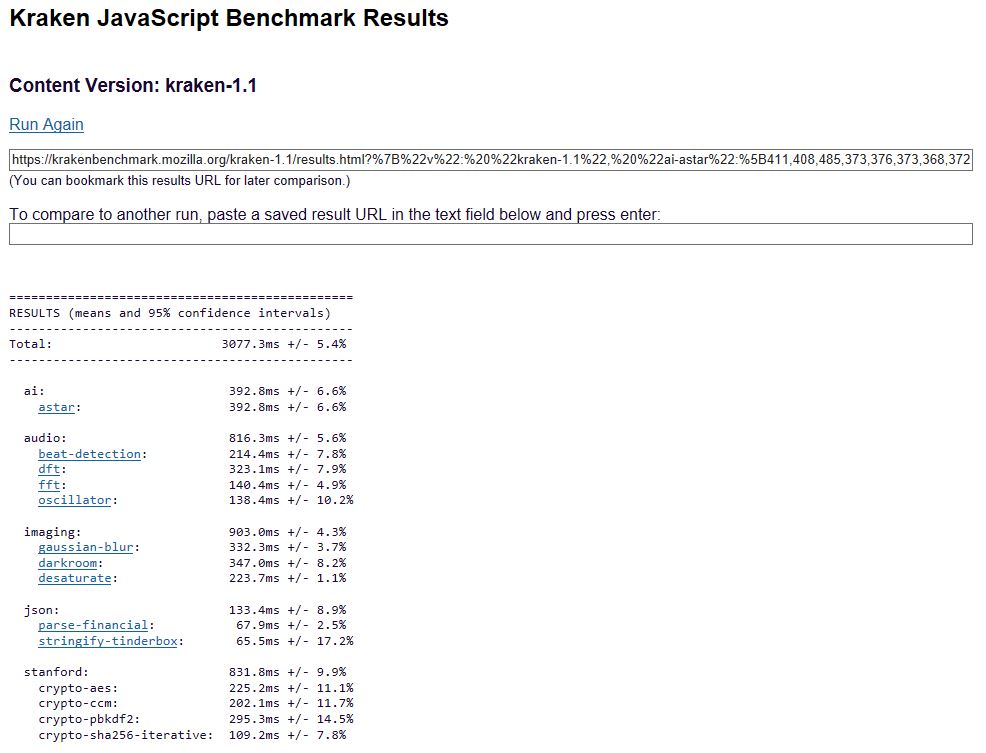
| Mozilla Kraken 1.1 - Total | |
| Microsoft Surface Go MHN-00003 | |
| Média Intel Pentium Gold 4415Y (n=1) | |
| Média da turma Convertible (386 - 1089, n=53, últimos 2 anos) | |
* ... menor é melhor
| PCMark 8 - Home Score Accelerated v2 | |
| Média da turma Convertible (n=1últimos 2 anos) | |
| Acer Switch 3 SW312-31-P5VG | |
| Asus VivoBook Flip 14 TP401NA | |
| Asus Transformer Book T102HA-GR022T | |
| Trekstor Primetab T13B | |
| Lenovo IdeaPad Miix 320-10ICR Pro LTE | |
| Microsoft Surface Go MHN-00003 | |
| Média Intel Pentium Gold 4415Y, Intel UHD Graphics 615 (n=1) | |
| PCMark 8 Home Score Accelerated v2 | 741 pontos | |
Ajuda | ||
| Microsoft Surface Go MHN-00003 64 GB eMMC Flash | Asus Transformer Book T102HA-GR022T 128 GB eMMC Flash | Trekstor Primetab T13B SanDisk SEM64G | Lenovo IdeaPad Miix 320-10ICR Pro LTE SanDisk DF4128 | Acer Switch 3 SW312-31-P5VG Hynix HCG4a2 64 GB | Asus VivoBook Flip 14 TP401NA 128 GB eMMC Flash | Média 64 GB eMMC Flash | |
|---|---|---|---|---|---|---|---|
| CrystalDiskMark 3.0 | -48% | -71% | -56% | 5% | 12% | -46% | |
| Read Seq (MB/s) | 259.6 | 139 -46% | 123.6 -52% | 92.7 -64% | 272.2 5% | 263.1 1% | 145.5 ? -44% |
| Write Seq (MB/s) | 122.4 | 54.1 -56% | 41.03 -66% | 54.5 -55% | 149.3 22% | 191.5 56% | 60.7 ? -50% |
| Read 512 (MB/s) | 190.6 | 121 -37% | 99.2 -48% | 68.6 -64% | 231.6 22% | 218.4 15% | 127.2 ? -33% |
| Write 512 (MB/s) | 107.1 | 44.39 -59% | 23.89 -78% | 39.86 -63% | 140 31% | 178.5 67% | 49.3 ? -54% |
| Read 4k (MB/s) | 19.06 | 9.935 -48% | 4.327 -77% | 6.705 -65% | 11.43 -40% | 24.11 26% | 12.2 ? -36% |
| Write 4k (MB/s) | 24.27 | 9.877 -59% | 2.929 -88% | 8.555 -65% | 26.31 8% | 19.36 -20% | 9.29 ? -62% |
| Read 4k QD32 (MB/s) | 34.45 | 30.03 -13% | 11 -68% | 32.71 -5% | 30.39 -12% | 28.6 -17% | 24.8 ? -28% |
| Write 4k QD32 (MB/s) | 33.64 | 10.67 -68% | 3.808 -89% | 11.5 -66% | 33.54 0% | 22.65 -33% | 12.1 ? -64% |

| 3DMark 11 - 1280x720 Performance GPU | |
| Média da turma Convertible (1505 - 40732, n=49, últimos 2 anos) | |
| Microsoft Surface Go MHN-00003 | |
| Média Intel UHD Graphics 615 (821 - 1378, n=10) | |
| Acer Switch 3 SW312-31-P5VG | |
| Asus VivoBook Flip 14 TP401NA | |
| Trekstor Primetab T13B | |
| Asus Transformer Book T102HA-GR022T | |
| Lenovo IdeaPad Miix 320-10ICR Pro LTE | |
| 3DMark | |
| 1280x720 Cloud Gate Standard Graphics | |
| Média da turma Convertible (7885 - 57566, n=33, últimos 2 anos) | |
| Microsoft Surface Go MHN-00003 | |
| Média Intel UHD Graphics 615 (4521 - 7568, n=10) | |
| Asus VivoBook Flip 14 TP401NA | |
| Asus Transformer Book T102HA-GR022T | |
| 1920x1080 Fire Strike Graphics | |
| Média da turma Convertible (1185 - 27447, n=49, últimos 2 anos) | |
| Microsoft Surface Go MHN-00003 | |
| Média Intel UHD Graphics 615 (563 - 976, n=11) | |
| Asus VivoBook Flip 14 TP401NA | |
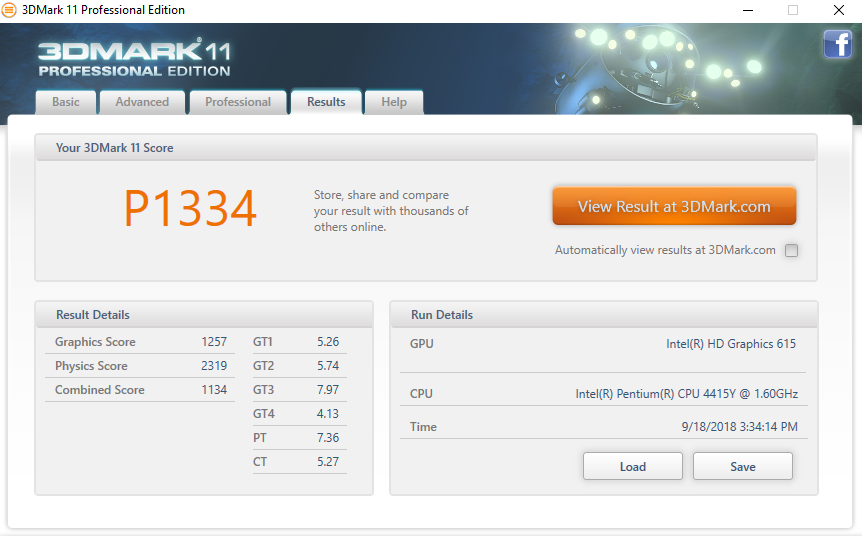
| 3DMark 11 Performance | 1334 pontos | |
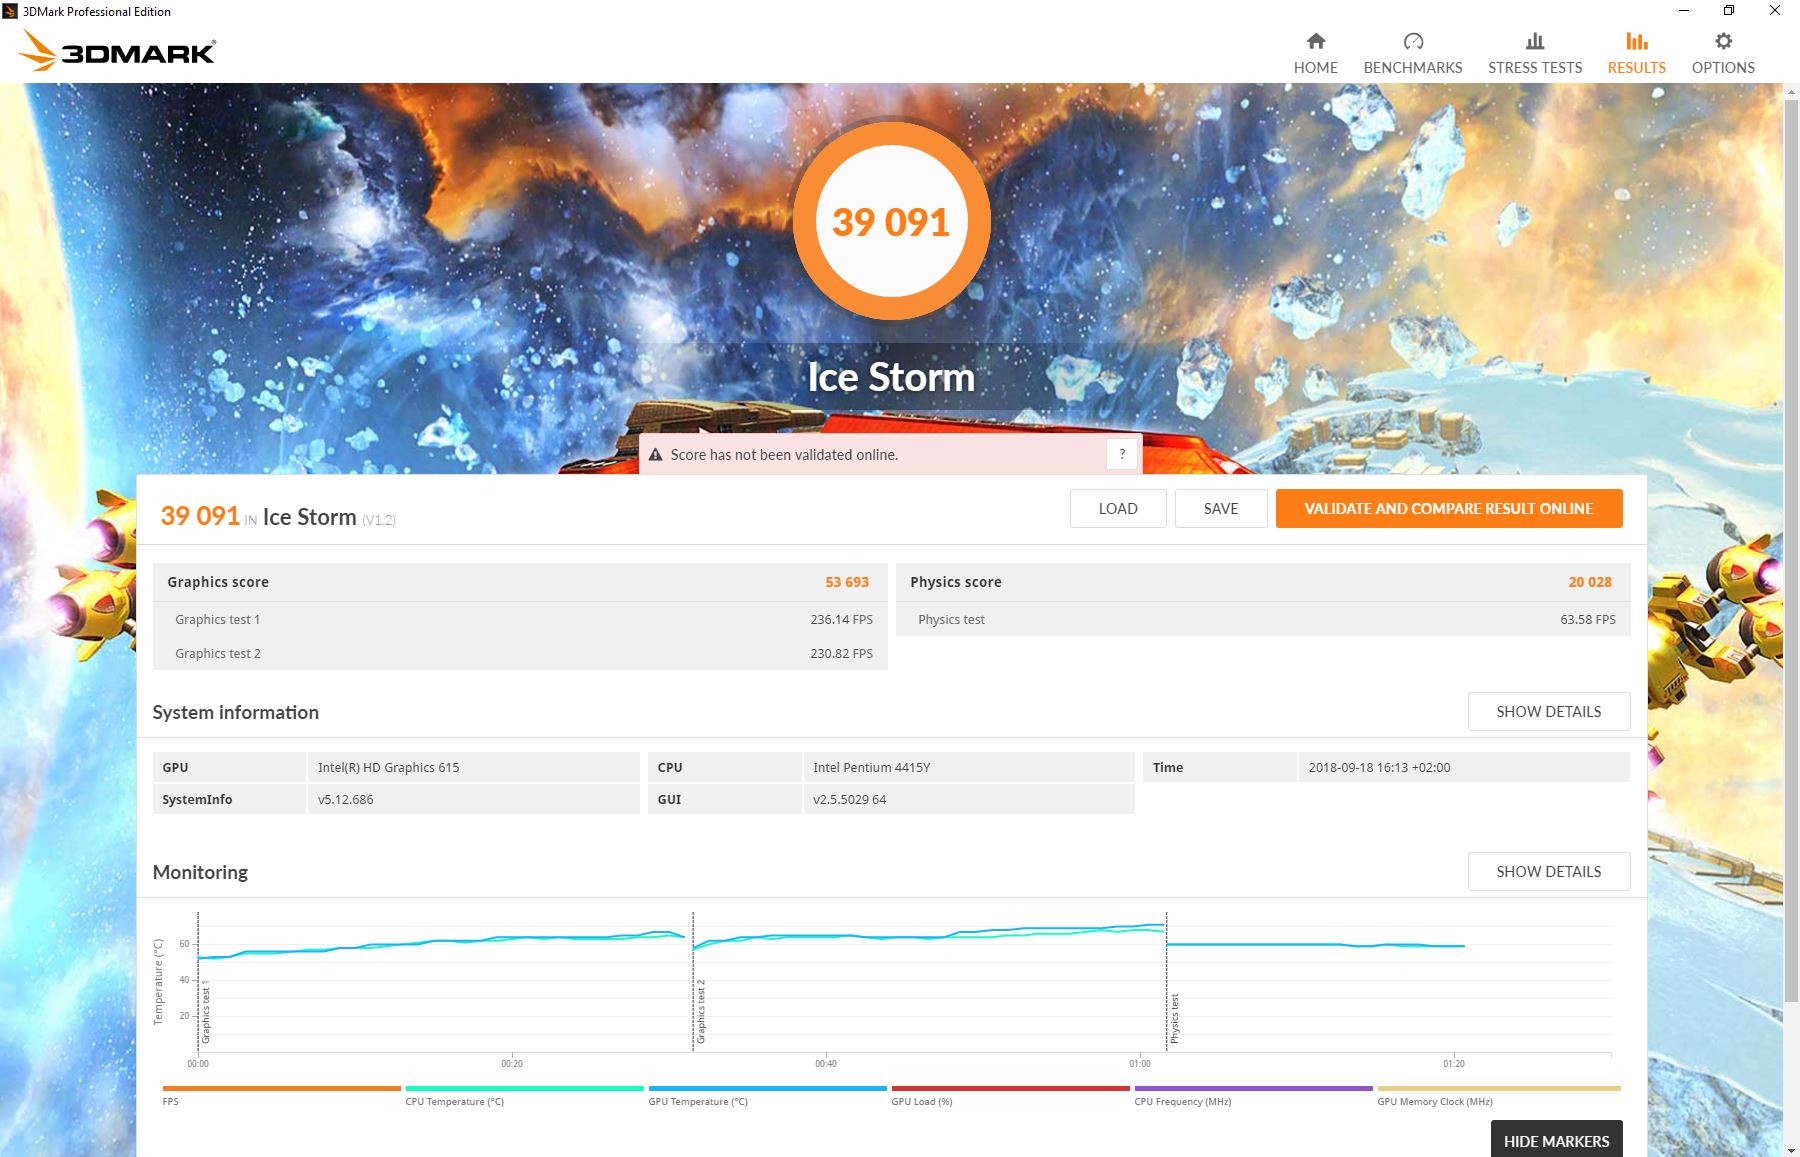
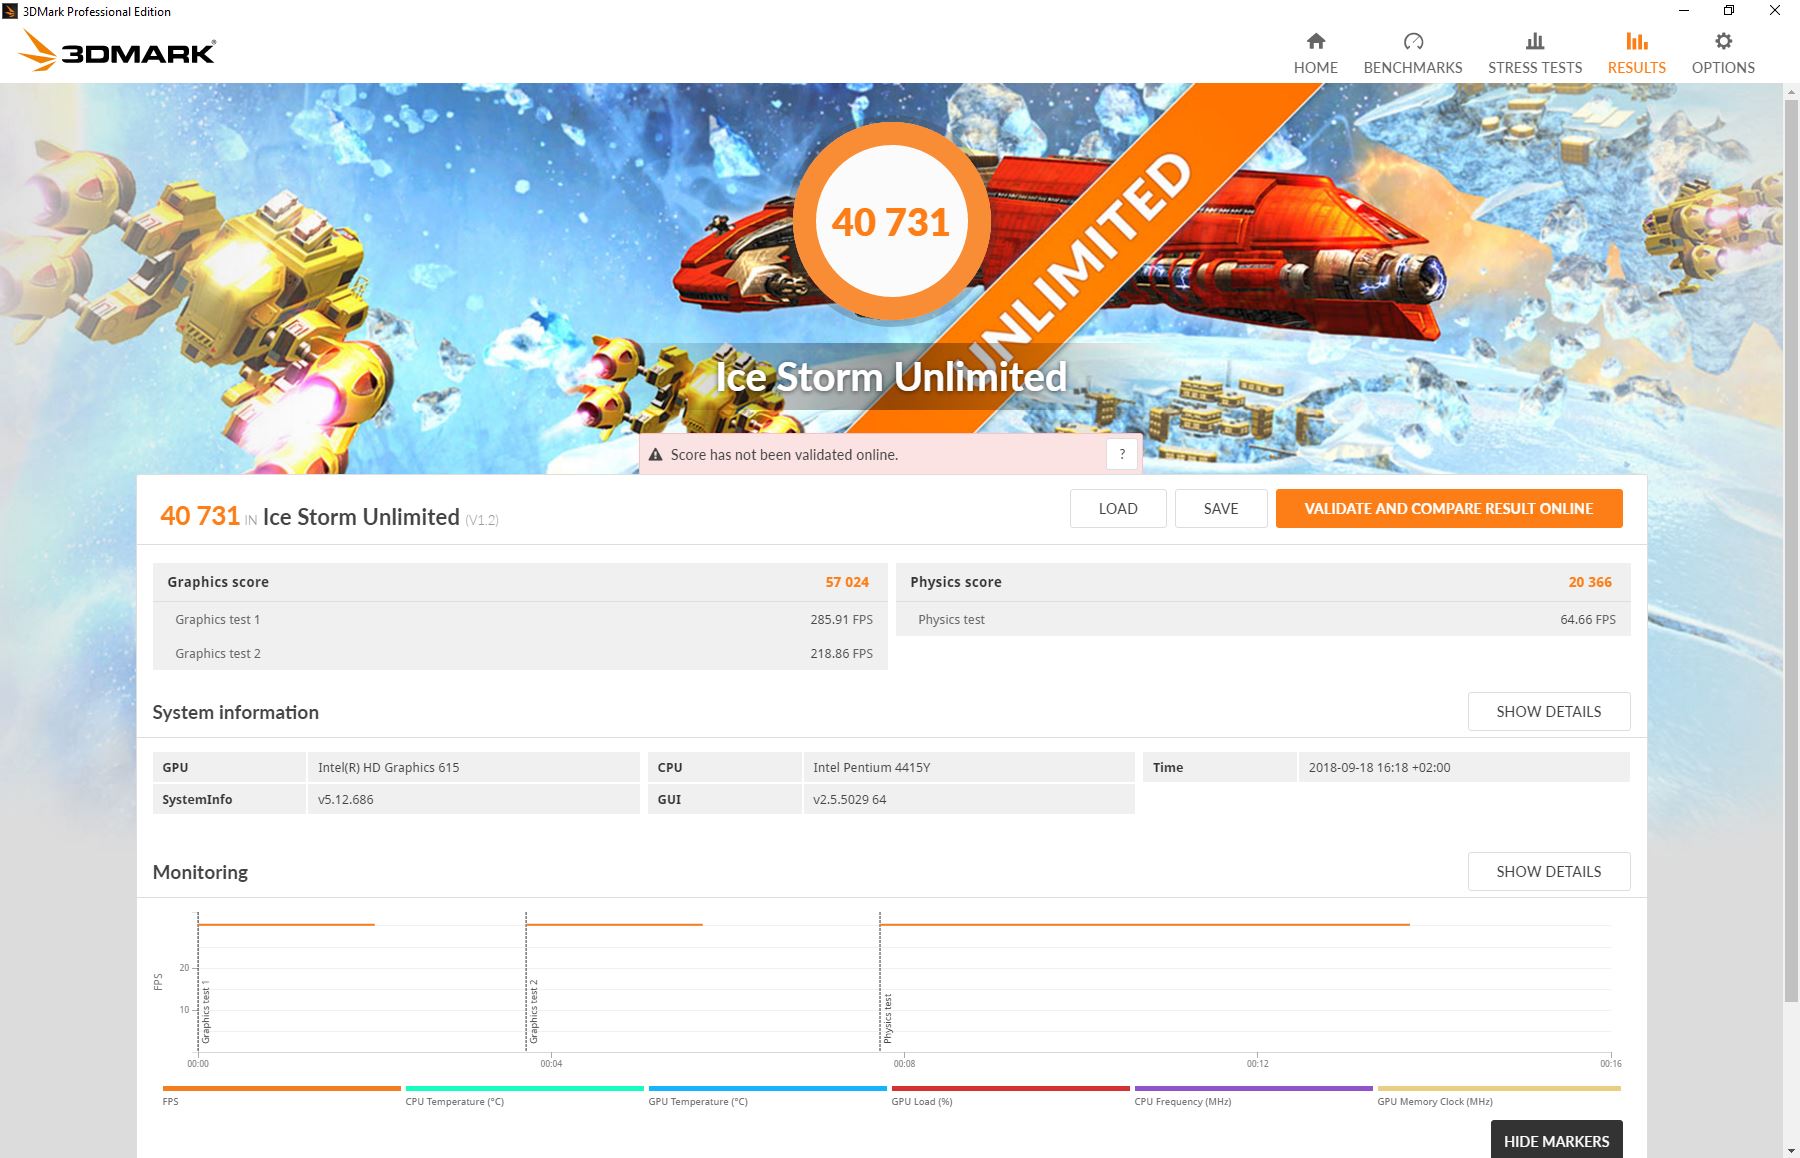
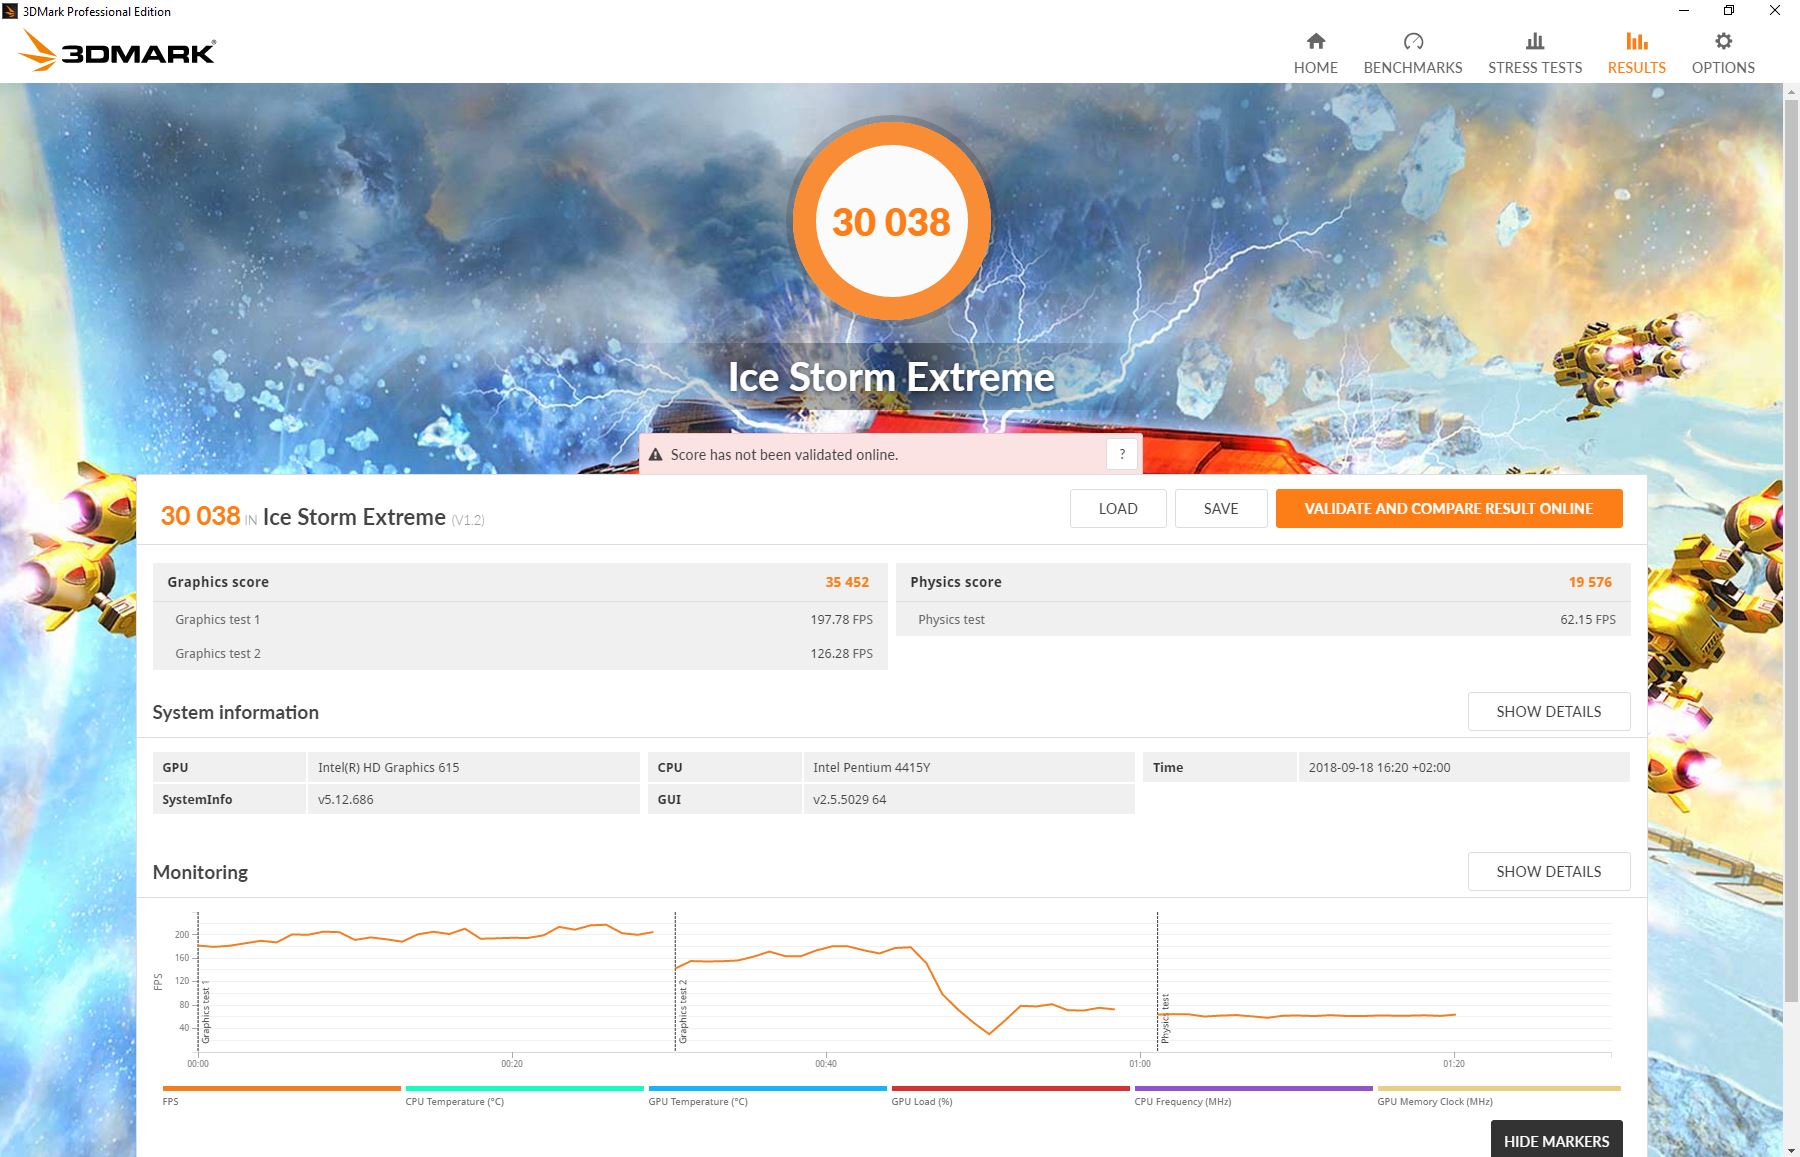
| 3DMark Ice Storm Standard Score | 39091 pontos | |
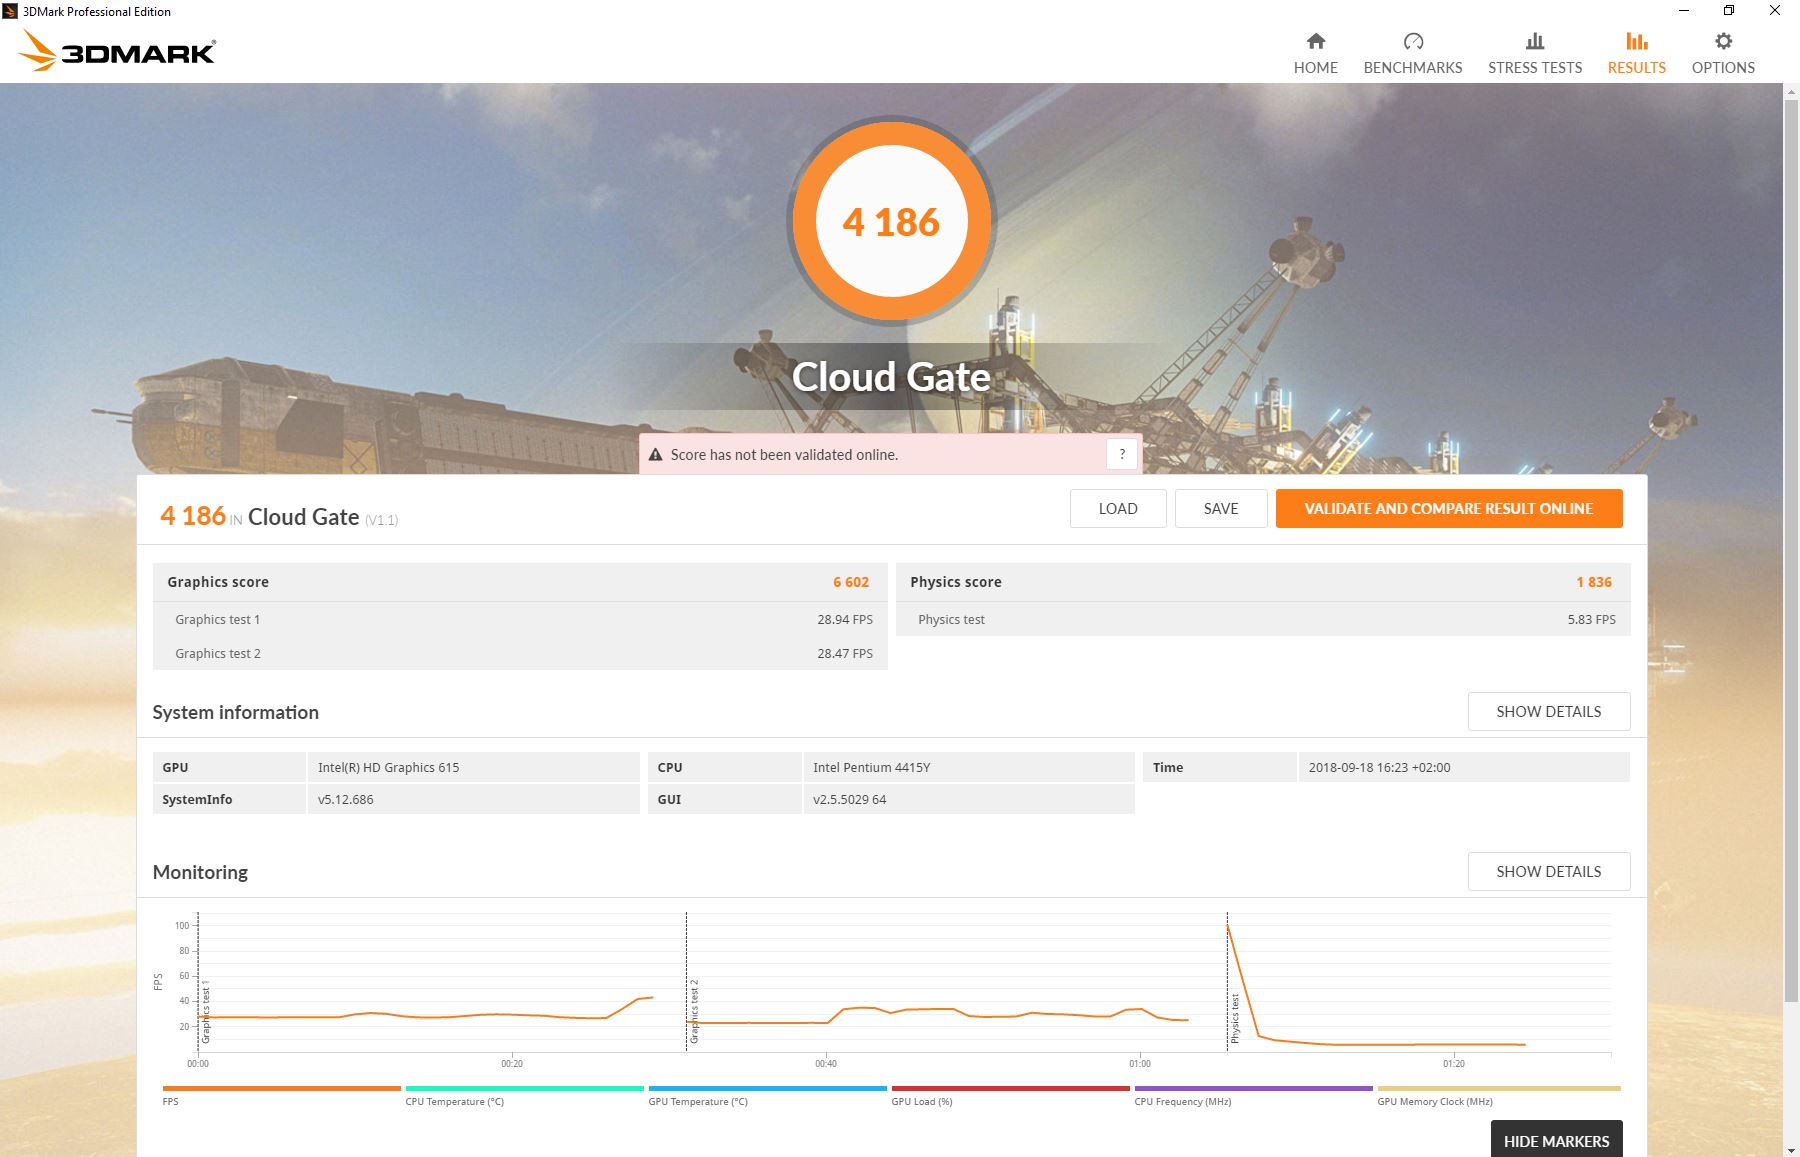
| 3DMark Cloud Gate Standard Score | 4186 pontos | |
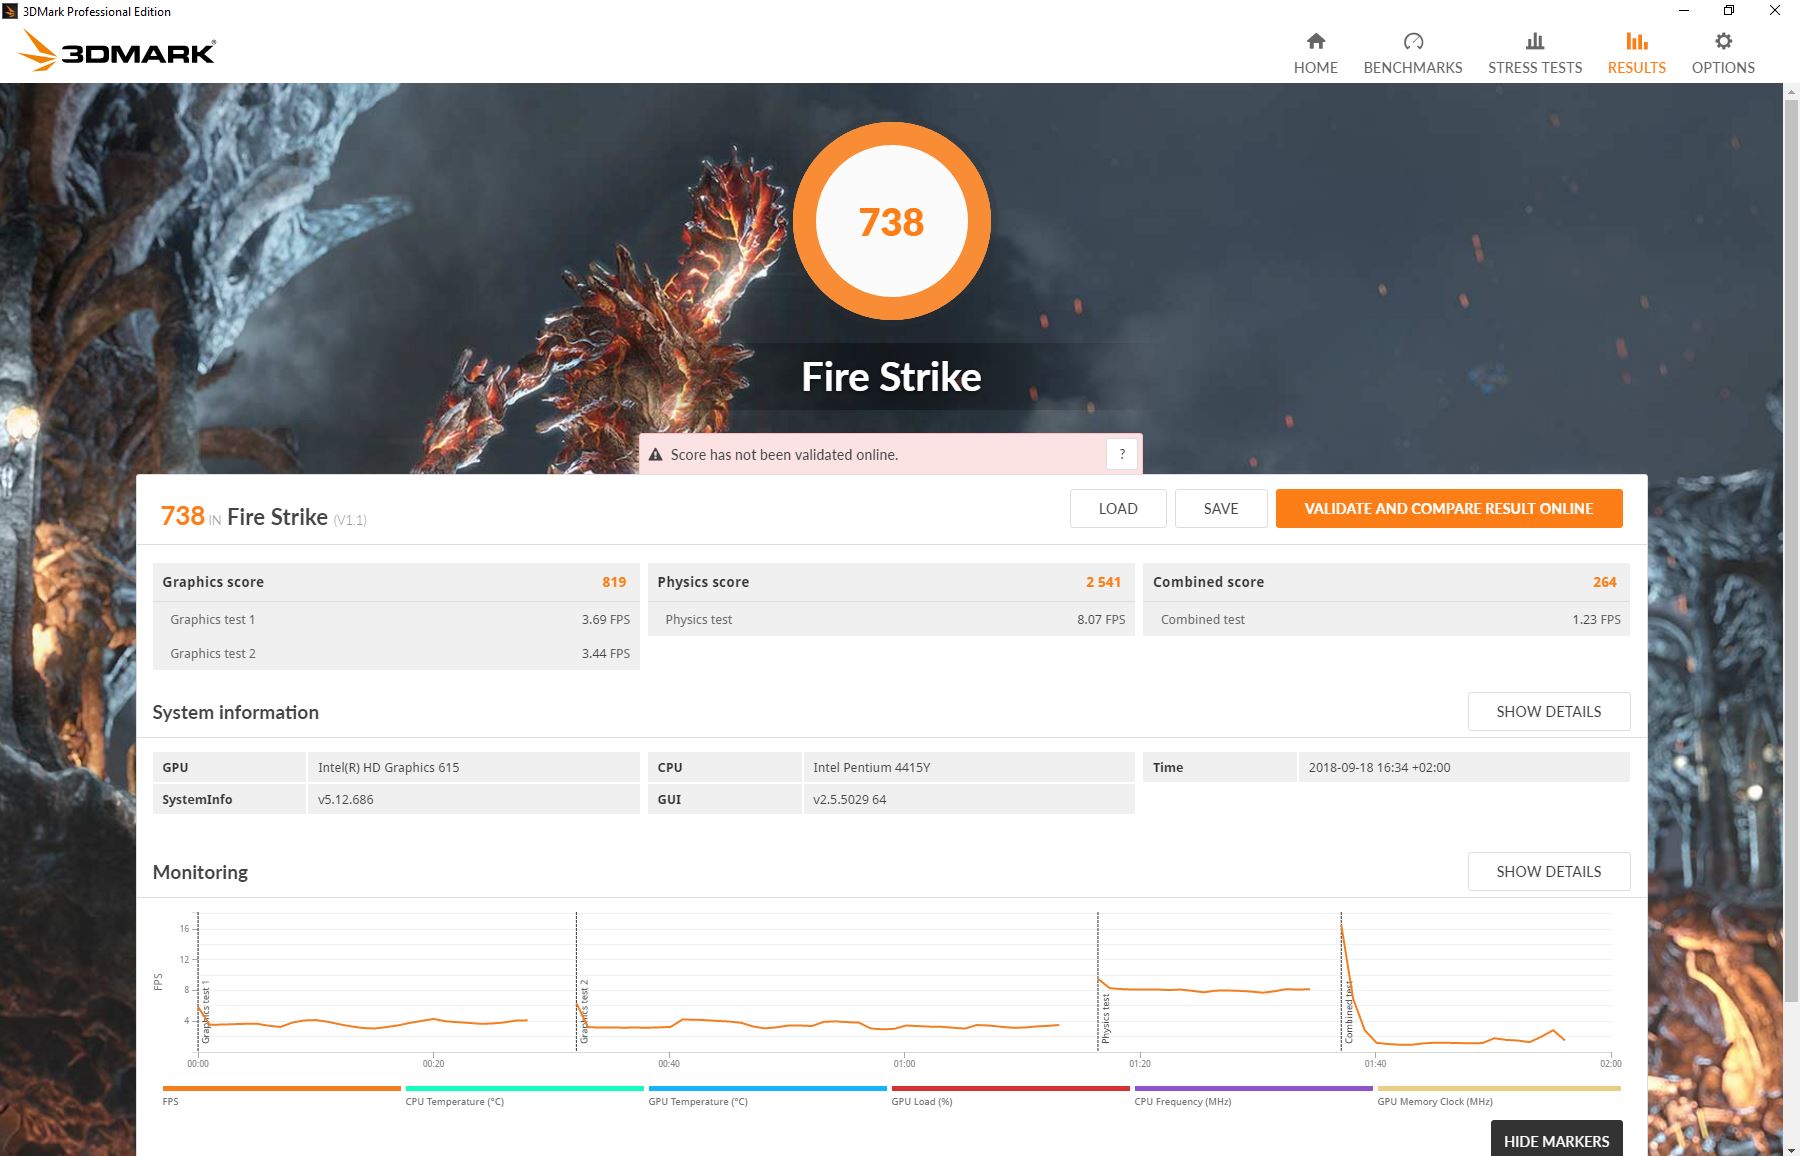
| 3DMark Fire Strike Score | 738 pontos | |
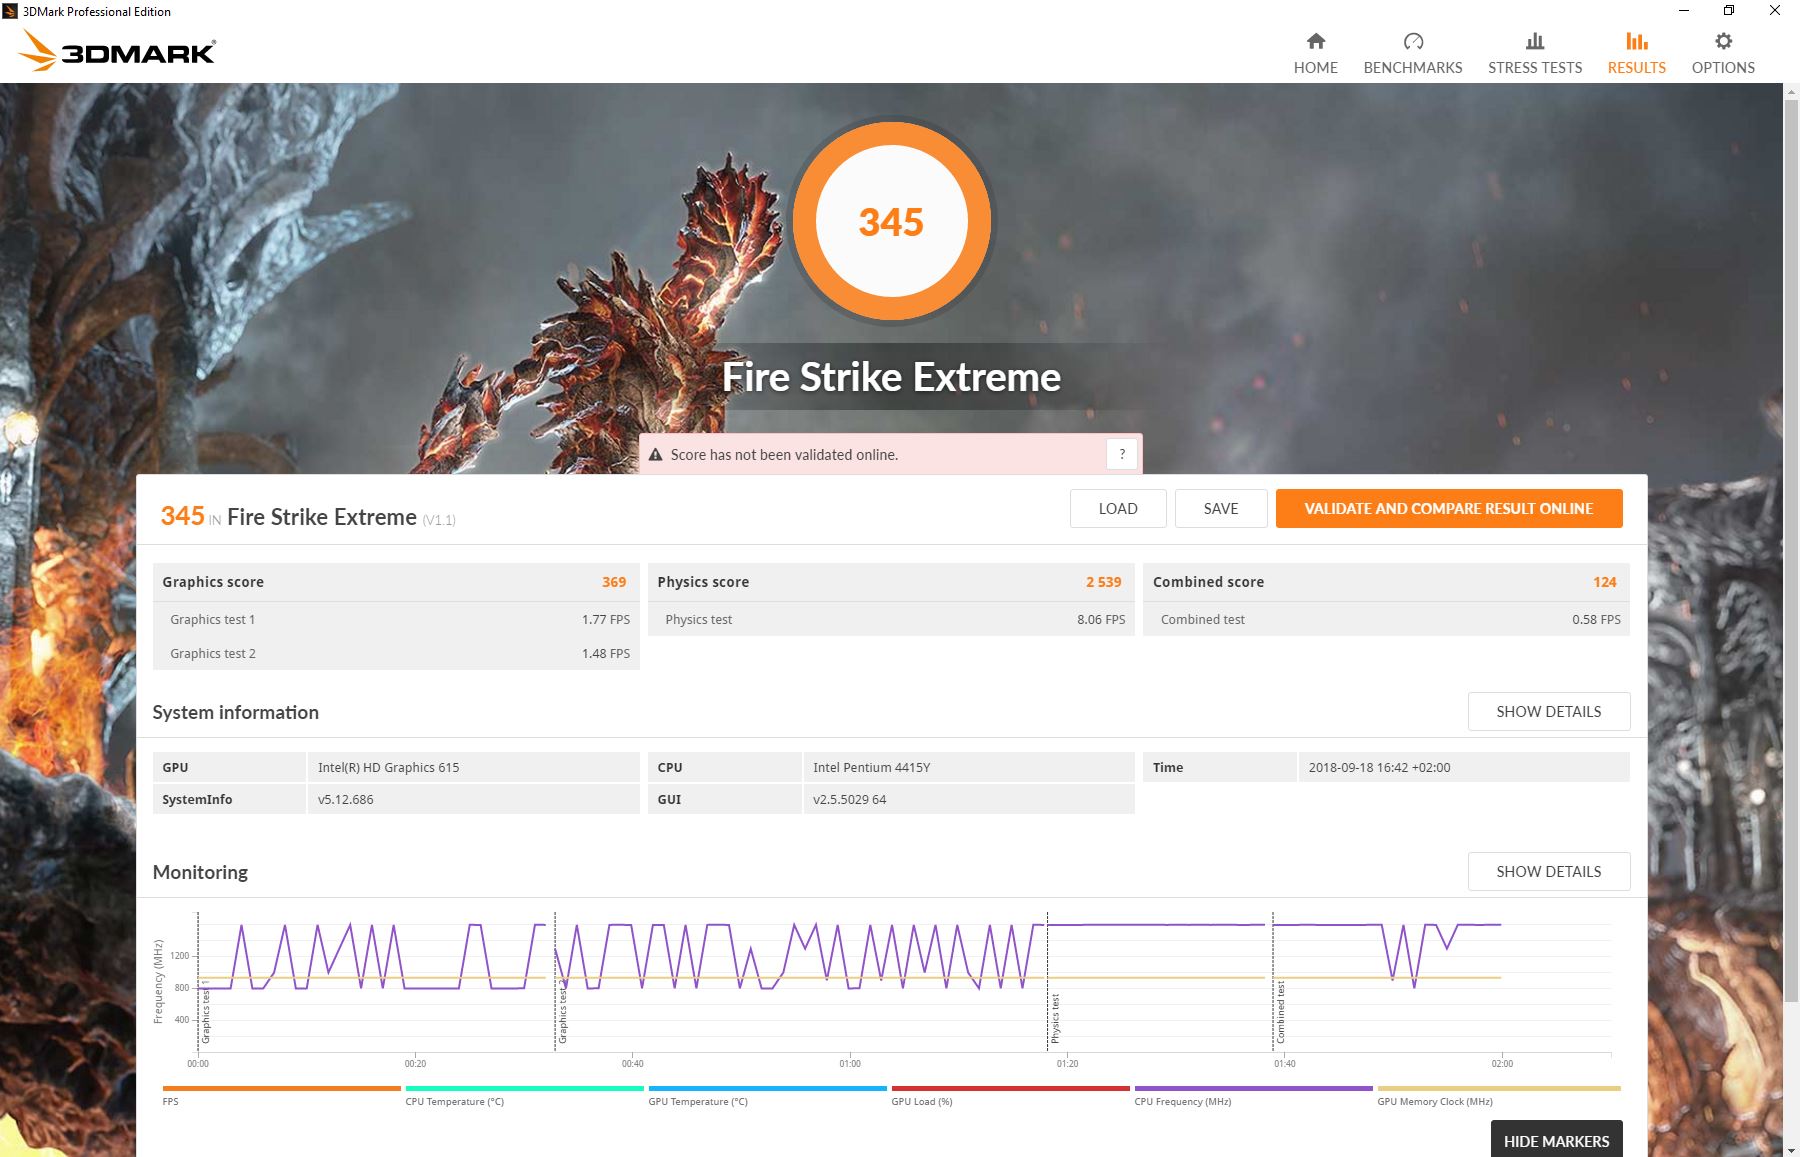
| 3DMark Fire Strike Extreme Score | 345 pontos | |
Ajuda | ||
| baixo | média | alto | ultra | |
|---|---|---|---|---|
| BioShock Infinite (2013) | 38.3 | 22.4 | 17.5 | 0 () |
| Battlefield 4 (2013) | 25.3 | 18.4 | 12.1 | |
| Rise of the Tomb Raider (2016) | 10.5 | 6.3 |
(±) A temperatura máxima no lado superior é 44 °C / 111 F, em comparação com a média de 35.4 °C / 96 F , variando de 19.6 a 60 °C para a classe Convertible.
(±) A parte inferior aquece até um máximo de 43 °C / 109 F, em comparação com a média de 36.9 °C / 98 F
(+) Em uso inativo, a temperatura média para o lado superior é 24.5 °C / 76 F, em comparação com a média do dispositivo de 30.3 °C / ### class_avg_f### F.
(±) Os apoios para as mãos e o touchpad podem ficar muito quentes ao toque, com um máximo de 37.7 °C / 99.9 F.
(-) A temperatura média da área do apoio para as mãos de dispositivos semelhantes foi 28 °C / 82.4 F (-9.7 °C / -17.5 F).
| Microsoft Surface Go MHN-00003 UHD Graphics 615, Pentium 4415Y, 64 GB eMMC Flash | Asus Transformer Book T102HA-GR022T HD Graphics 400 (Braswell), Z8350, 128 GB eMMC Flash | Trekstor Primetab T13B HD Graphics 505, Pentium N4200, SanDisk SEM64G | Lenovo IdeaPad Miix 320-10ICR Pro LTE HD Graphics 400 (Braswell), Z8350, SanDisk DF4128 | Acer Switch 3 SW312-31-P5VG HD Graphics 505, Pentium N4200, Hynix HCG4a2 64 GB | Asus VivoBook Flip 14 TP401NA HD Graphics 505, Pentium N4200, 128 GB eMMC Flash | |
|---|---|---|---|---|---|---|
| Heat | -0% | -13% | -2% | -11% | -12% | |
| Maximum Upper Side * (°C) | 44 | 38.7 12% | 42 5% | 36.6 17% | 39.4 10% | 40 9% |
| Maximum Bottom * (°C) | 43 | 36.3 16% | 41.8 3% | 38.9 10% | 38.6 10% | 39.5 8% |
| Idle Upper Side * (°C) | 26 | 30.6 -18% | 35.8 -38% | 30 -15% | 36.5 -40% | 34.1 -31% |
| Idle Bottom * (°C) | 24.4 | 27.1 -11% | 30.1 -23% | 29.6 -21% | 30.2 -24% | 33 -35% |
* ... menor é melhor
Microsoft Surface Go MHN-00003 análise de áudio
(-) | alto-falantes não muito altos (###valor### dB)
Graves 100 - 315Hz
(±) | graves reduzidos - em média 12.6% menor que a mediana
(±) | a linearidade dos graves é média (12.2% delta para a frequência anterior)
Médios 400 - 2.000 Hz
(±) | médios mais altos - em média 7% maior que a mediana
(±) | a linearidade dos médios é média (11.4% delta para frequência anterior)
Altos 2 - 16 kHz
(+) | agudos equilibrados - apenas 4.7% longe da mediana
(±) | a linearidade dos máximos é média (12.4% delta para frequência anterior)
Geral 100 - 16.000 Hz
(±) | a linearidade do som geral é média (27.9% diferença em relação à mediana)
Comparado com a mesma classe
» 85% de todos os dispositivos testados nesta classe foram melhores, 2% semelhantes, 13% piores
» O melhor teve um delta de 6%, a média foi 20%, o pior foi 57%
Comparado com todos os dispositivos testados
» 85% de todos os dispositivos testados foram melhores, 3% semelhantes, 12% piores
» O melhor teve um delta de 4%, a média foi 24%, o pior foi 134%
Asus Transformer Book T102HA-GR022T análise de áudio
(-) | alto-falantes não muito altos (###valor### dB)
Graves 100 - 315Hz
(-) | quase nenhum baixo - em média 19.8% menor que a mediana
(±) | a linearidade dos graves é média (11.4% delta para a frequência anterior)
Médios 400 - 2.000 Hz
(+) | médios equilibrados - apenas 2.4% longe da mediana
(±) | a linearidade dos médios é média (9.7% delta para frequência anterior)
Altos 2 - 16 kHz
(±) | máximos mais altos - em média 6.8% maior que a mediana
(±) | a linearidade dos máximos é média (11.6% delta para frequência anterior)
Geral 100 - 16.000 Hz
(±) | a linearidade do som geral é média (24.6% diferença em relação à mediana)
Comparado com a mesma classe
» 74% de todos os dispositivos testados nesta classe foram melhores, 6% semelhantes, 19% piores
» O melhor teve um delta de 6%, a média foi 20%, o pior foi 57%
Comparado com todos os dispositivos testados
» 75% de todos os dispositivos testados foram melhores, 5% semelhantes, 20% piores
» O melhor teve um delta de 4%, a média foi 24%, o pior foi 134%
| desligado | |
| Ocioso | |
| Carga |
|
Key:
min: | |
| Microsoft Surface Go MHN-00003 Pentium 4415Y, UHD Graphics 615, 64 GB eMMC Flash, IPS, 1800x1200, 10" | Asus Transformer Book T102HA-GR022T Z8350, HD Graphics 400 (Braswell), 128 GB eMMC Flash, IPS, 1280x800, 10.1" | Trekstor Primetab T13B Pentium N4200, HD Graphics 505, SanDisk SEM64G, IPS, 1920x1080, 13.3" | Lenovo IdeaPad Miix 320-10ICR Pro LTE Z8350, HD Graphics 400 (Braswell), SanDisk DF4128, IPS, 1920x1200, 10.1" | Acer Switch 3 SW312-31-P5VG Pentium N4200, HD Graphics 505, Hynix HCG4a2 64 GB, IPS, 1920x1200, 12.2" | Asus VivoBook Flip 14 TP401NA Pentium N4200, HD Graphics 505, 128 GB eMMC Flash, IPS, 1920x1080, 14" | Média Intel UHD Graphics 615 | Média da turma Convertible | |
|---|---|---|---|---|---|---|---|---|
| Power Consumption | 17% | -23% | 18% | -32% | 6% | -14% | -90% | |
| Idle Minimum * (Watt) | 2.88 | 2.5 13% | 3.9 -35% | 3 -4% | 4.1 -42% | 4.26 -48% | 3.55 ? -23% | 4.24 ? -47% |
| Idle Average * (Watt) | 4.8 | 5.7 -19% | 9.3 -94% | 5.3 -10% | 9.3 -94% | 7.1 -48% | 6.17 ? -29% | 7.03 ? -46% |
| Idle Maximum * (Watt) | 7.5 | 5.9 21% | 10.9 -45% | 6.4 15% | 9.8 -31% | 7.44 1% | 7.61 ? -1% | 8.61 ? -15% |
| Load Average * (Watt) | 16.9 | 12 29% | 12.6 25% | 10.9 36% | 18.9 -12% | 1.4 92% | 18.2 ? -8% | 43.9 ? -160% |
| Load Maximum * (Watt) | 23.8 | 13.9 42% | 15.6 34% | 11 54% | 19 20% | 15.6 34% | 25.4 ? -7% | 67.2 ? -182% |
* ... menor é melhor
| Microsoft Surface Go MHN-00003 Pentium 4415Y, UHD Graphics 615, 28 Wh | Asus Transformer Book T102HA-GR022T Z8350, HD Graphics 400 (Braswell), 32 Wh | Trekstor Primetab T13B Pentium N4200, HD Graphics 505, 37 Wh | Lenovo IdeaPad Miix 320-10ICR Pro LTE Z8350, HD Graphics 400 (Braswell), 33.3 Wh | Acer Switch 3 SW312-31-P5VG Pentium N4200, HD Graphics 505, 36 Wh | Asus VivoBook Flip 14 TP401NA Pentium N4200, HD Graphics 505, 39 Wh | Média da turma Convertible | |
|---|---|---|---|---|---|---|---|
| Duração da bateria | 47% | -45% | 3% | -31% | -13% | 69% | |
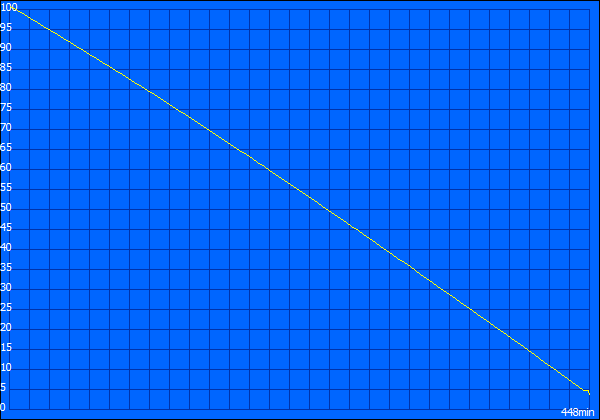
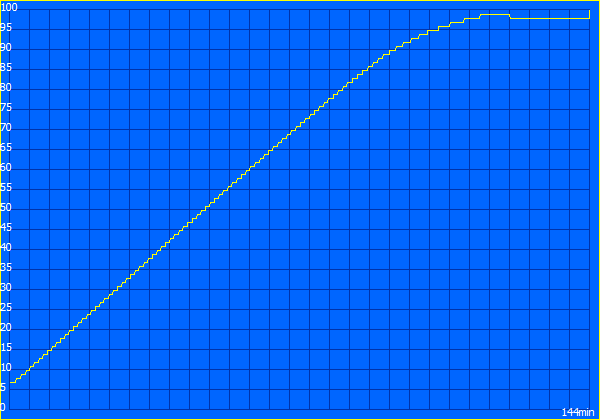
| Reader / Idle (h) | 12.9 | 27.7 ? 115% | |||||
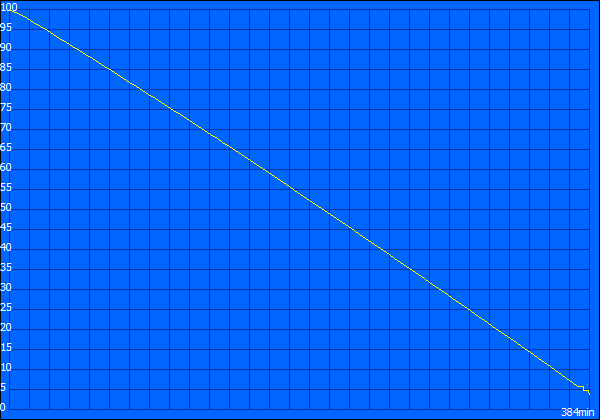
| H.264 (h) | 6.4 | 15.3 ? 139% | |||||
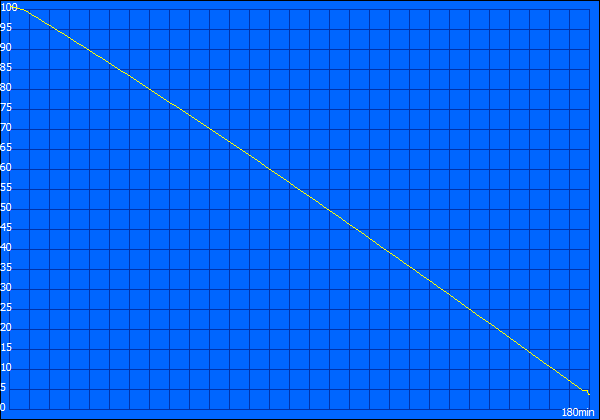
| WiFi v1.3 (h) | 7.5 | 11 47% | 4.1 -45% | 7.7 3% | 5.2 -31% | 6.5 -13% | 12.1 ? 61% |
| Load (h) | 3 | 1.779 ? -41% |
Pro
Contra
O Microsoft Surface Go é um tablet compacto de alta qualidade disponível a um preço baixo. No entanto, não se deixe enganar pelo preço se você pretende usar o tablet como um portátil completo. Neste caso, os acessórios adicionais somarão rapidamente.
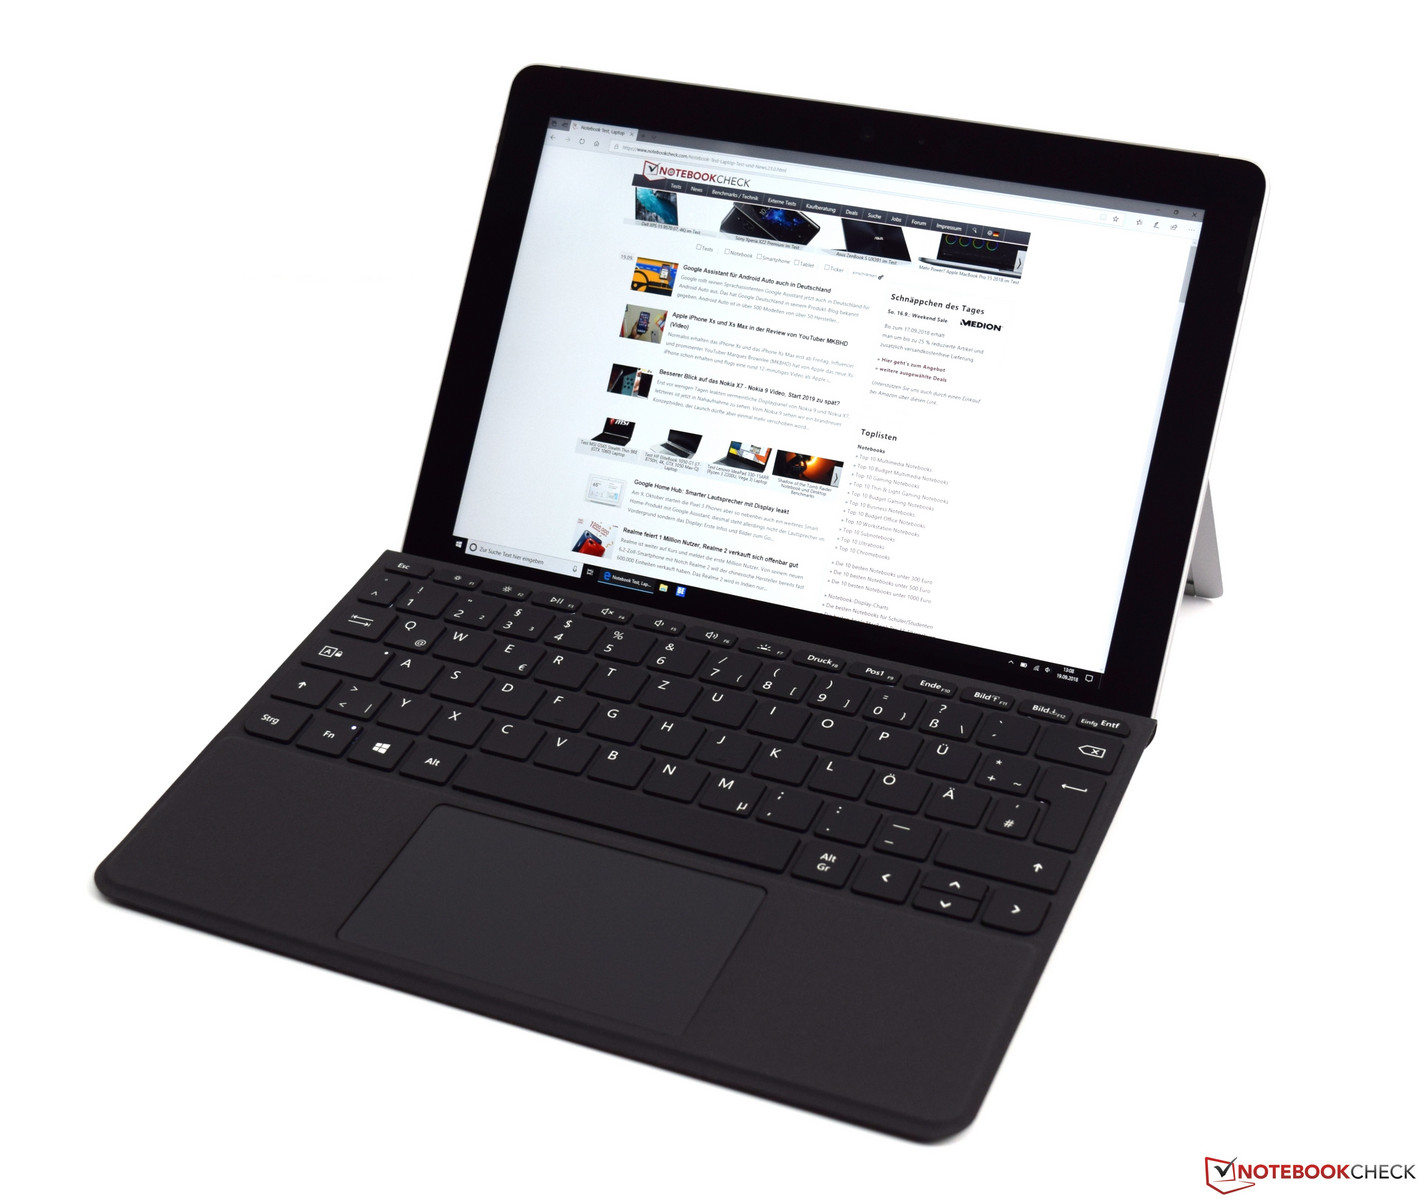
Nossa impressão geral foi de que este é realmente um tablet de alta qualidade excepcionalmente bem feito. A carcaça de magnésio não era apenas surpreendentemente leve, mas também muito resistente, e suas texturas de superfície se sentiram confortáveis de segurar. Ficamos particularmente impressionados com a tela, que agregou muito valor a esse dispositivo econômico.
O Pentium 4415Y da Intel foi rápido o suficiente para um tablet, e a GPU interna foi capaz de reproduzir vídeos de 2160p sem problemas e sem esforço. Independentemente do preço, este é um grande feito e certamente será importante para muitos compradores em potencial.
O Surface Go da Microsoft é um tablet Windows excepcionalmente bem construído a um preço comparativamente baixo (para um tablet Surface). No entanto, os acessórios caros podem se tornar um fator decisivo para alguns usuários.
Por que a Microsoft optou por apenas 64 GB de memória eMMC no SKU de nível de entrada, permanece um mistério para nós. Consequentemente, os potenciais compradores são quase forçados a gastar outros $150 no SKU de 128 GB.
No final do dia, é a decisão individual de cada pessoa se 64 GB são suficientes ou não. Pelo menos o Go possui um leitor de cartão microSD para aqueles que decidem optar pela opção mais barata.
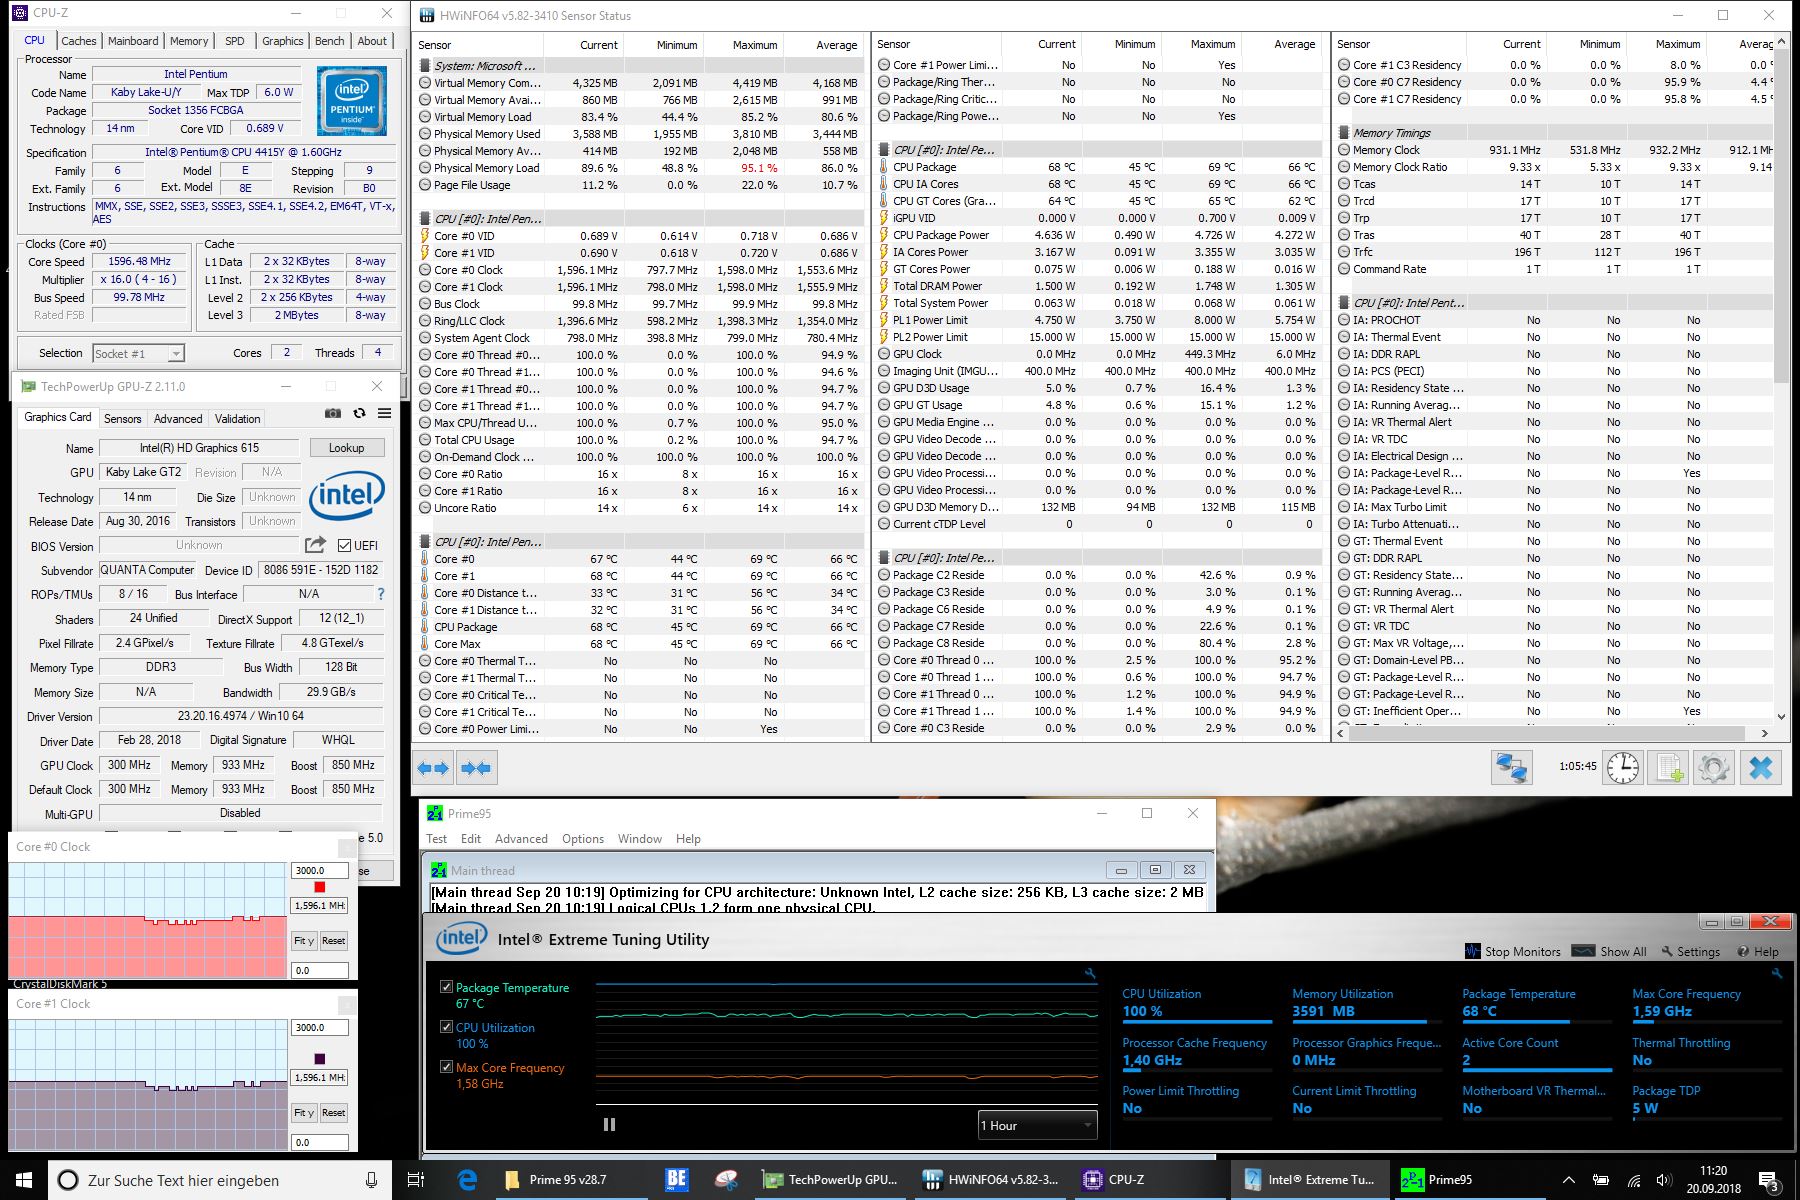
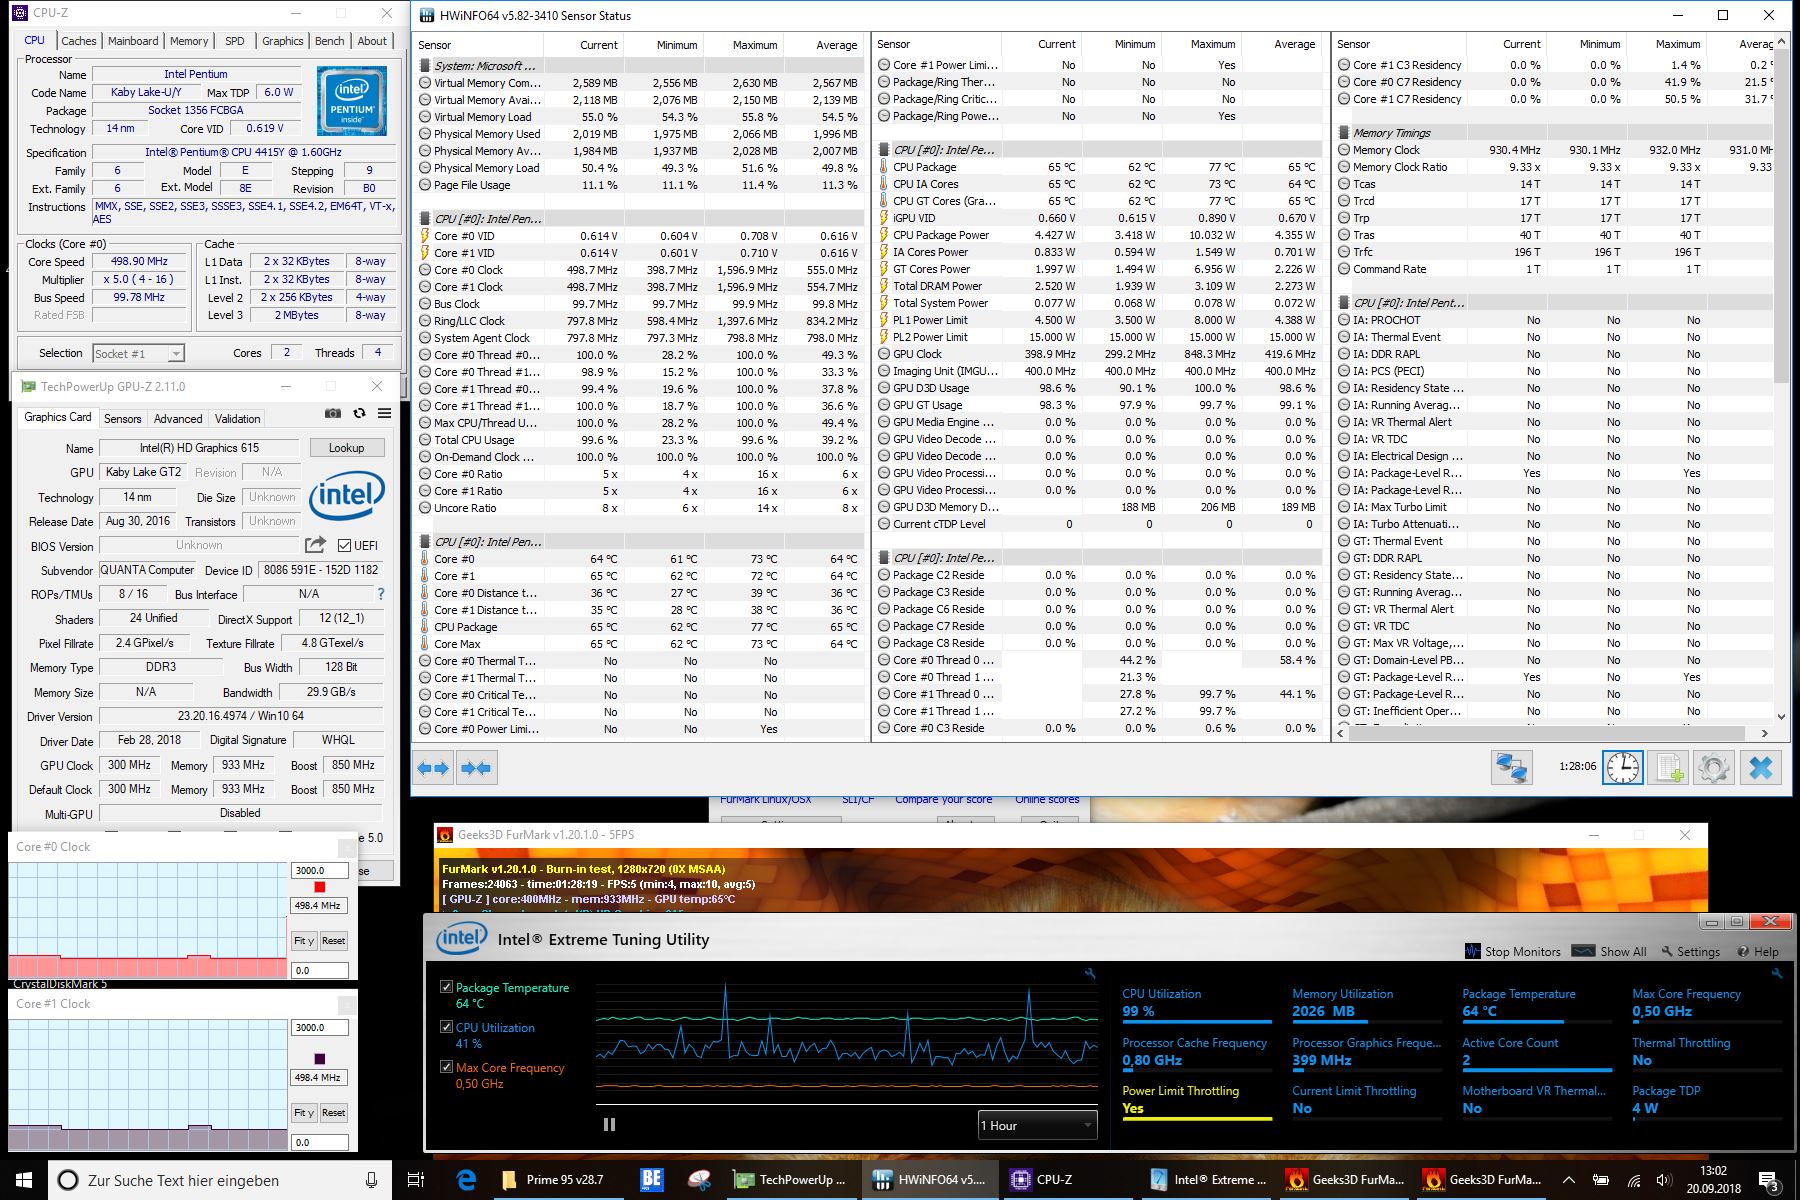
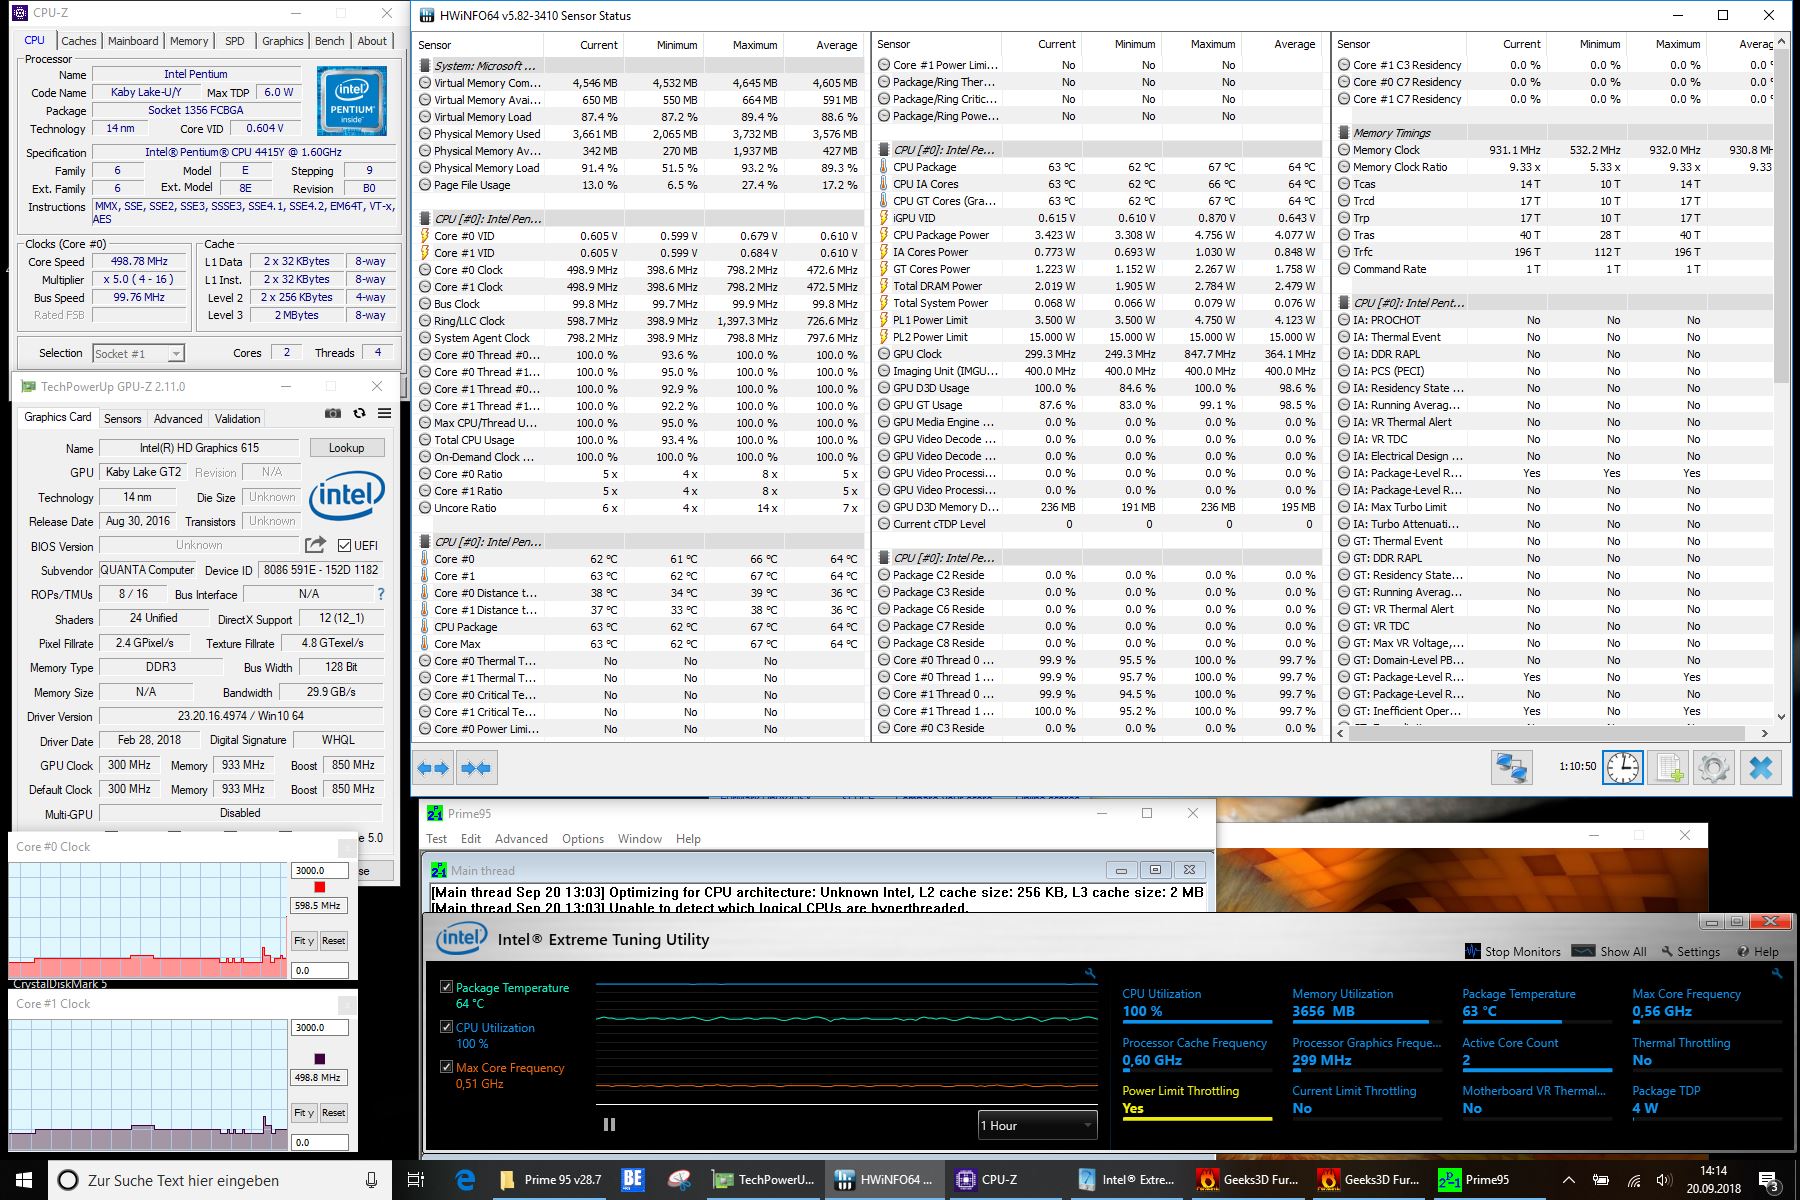
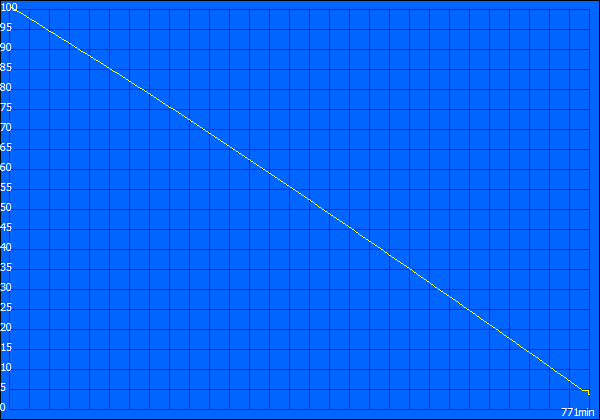
Considerando a solução de resfriamento passiva do Go, achamos o desempenho do dispositivo particularmente atraente durante o nosso teste de estresse. Mesmo sob uso intenso, não encontramos vestígios de afogamento térmico. Apesar de uma bateria bastante pequena, a duração da bateria do tablet também foi surpreendentemente boa.
Nossa maior reclamação são os acessórios quase obrigatórios e caros, como o Surface Go Signature Type Cover, que será muito difícil de resistir e provavelmente será comprado junto com o próprio tablet em muitos casos.
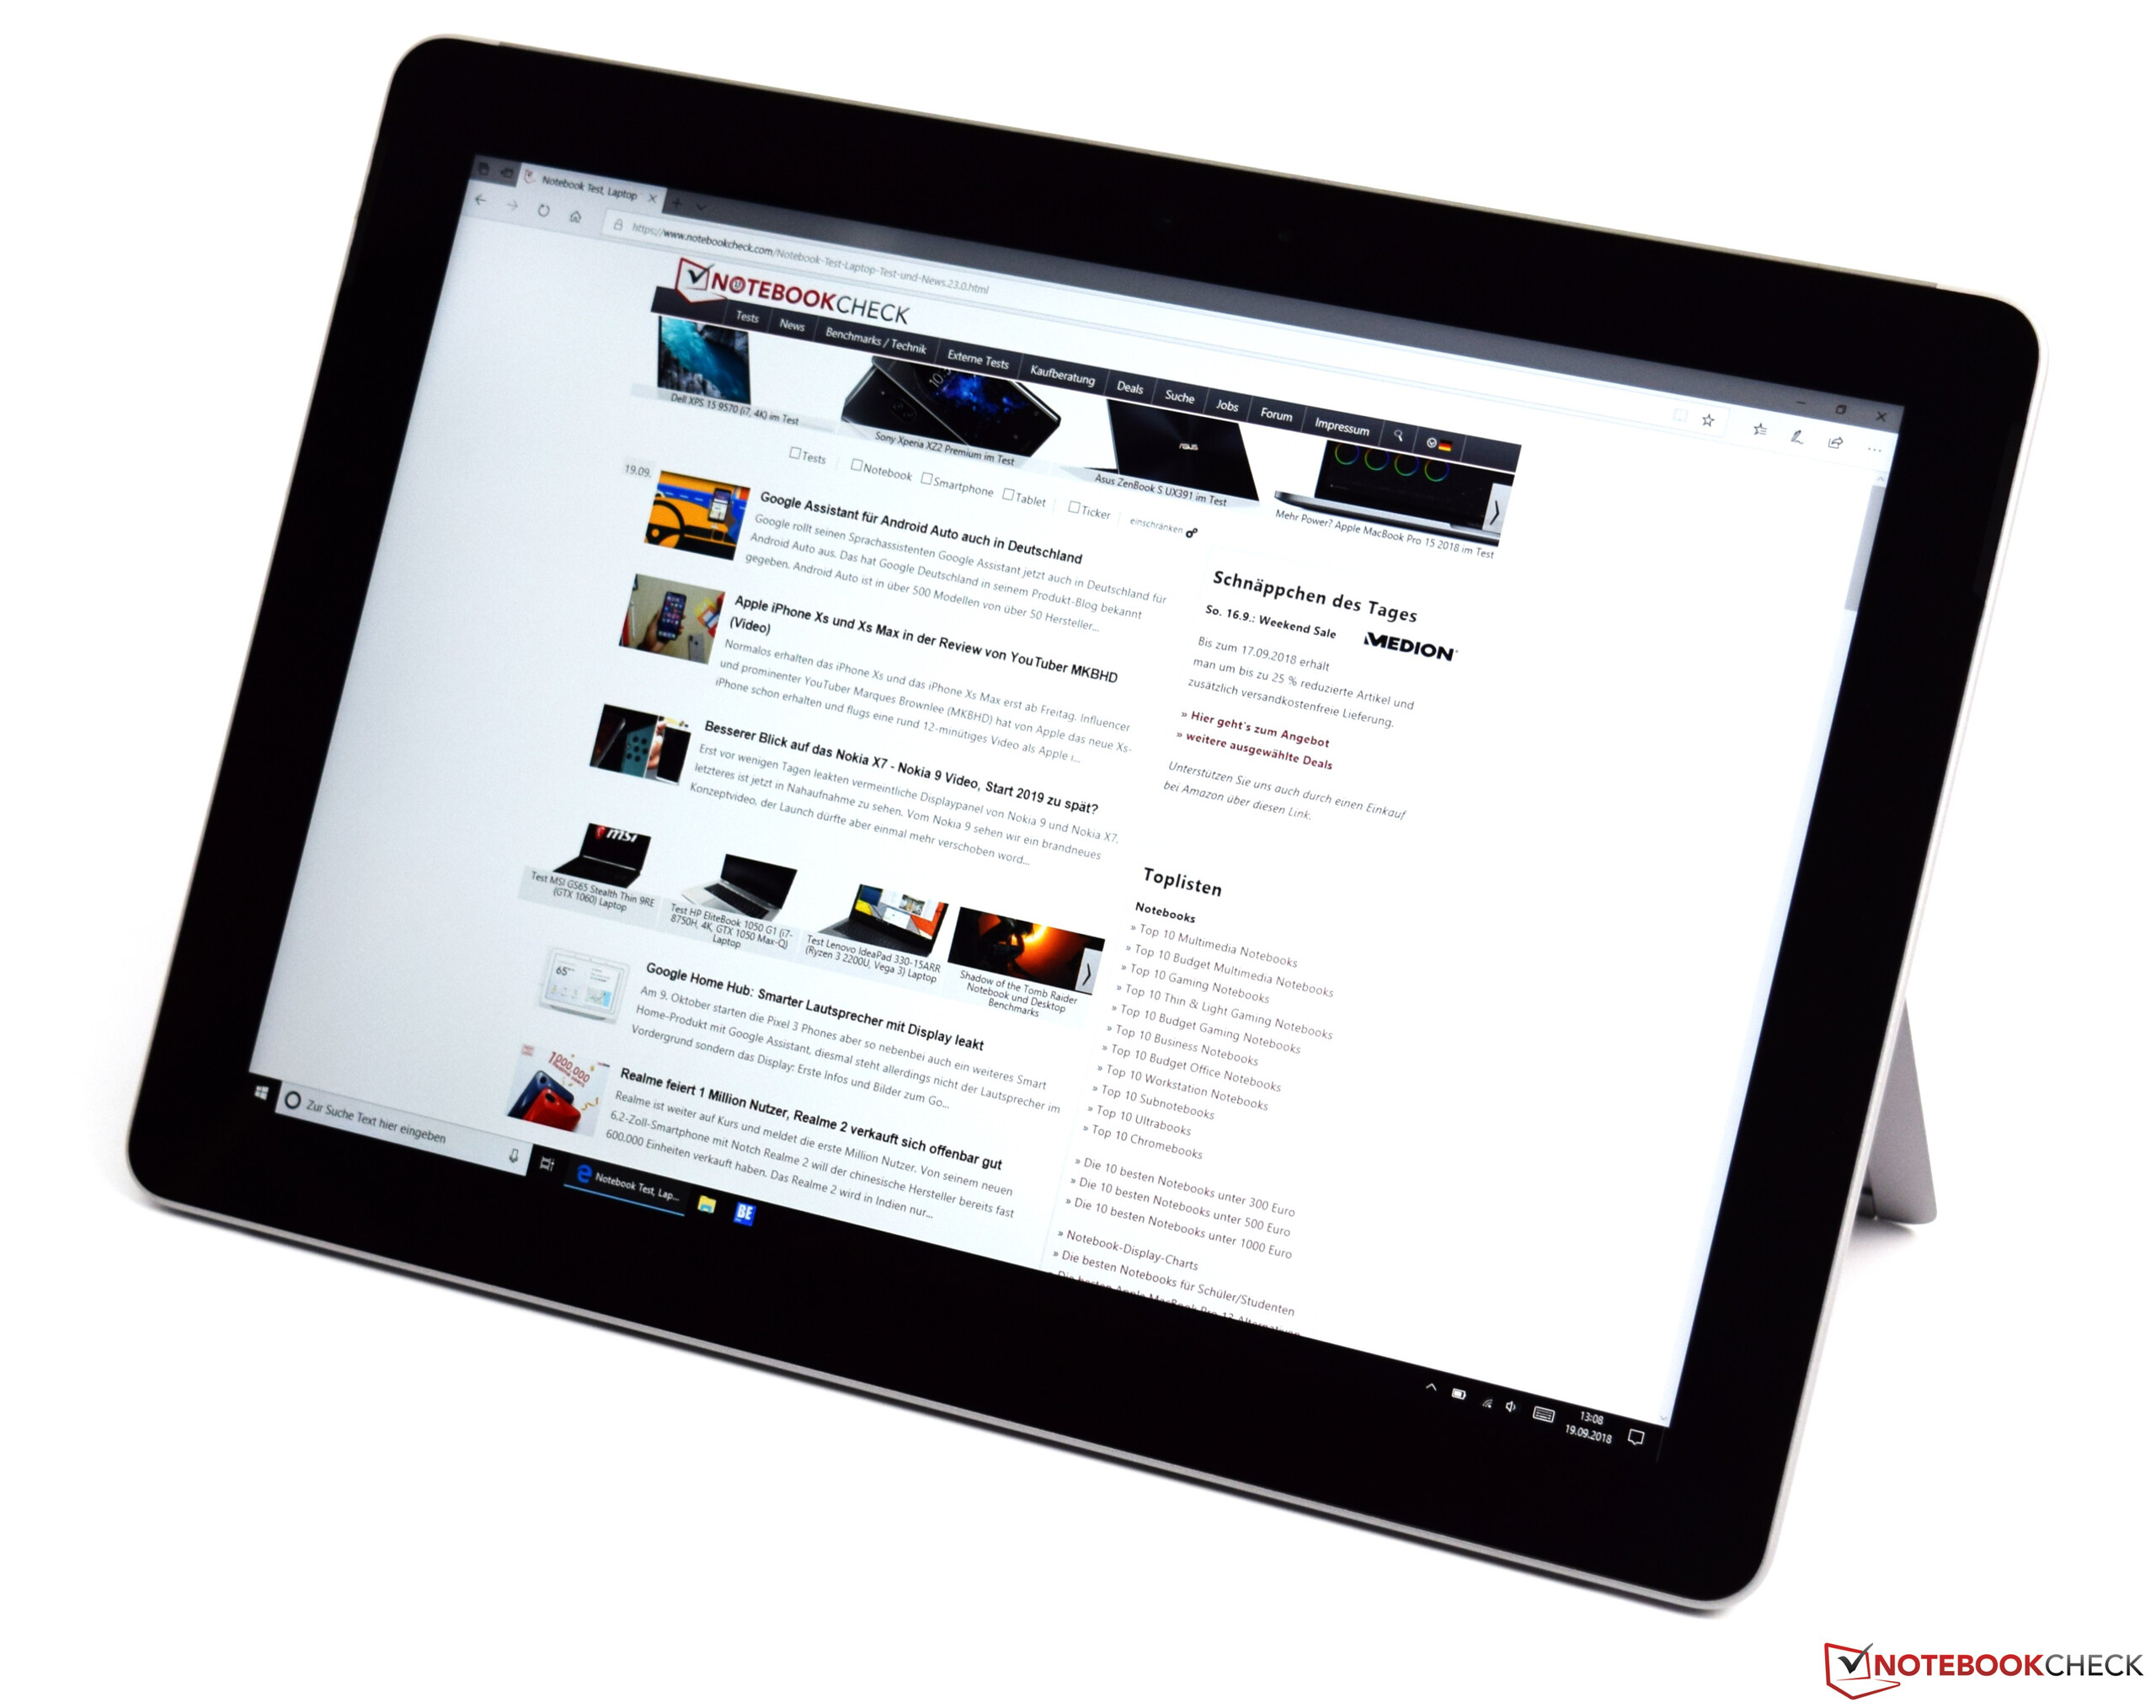
Microsoft Surface Go MHN-00003
- 09/26/2019 v7 (old)
Sebastian Bade
Price comparison
