Breve Análise do mini PC Zotac ZBOX Magnus com GeForce RTX 2080
| Cinebench R15 | |
| CPU Single 64Bit | |
| Intel Core i9-10900K, NVIDIA Titan RTX | |
| Intel Core i9-9980HK, NVIDIA GeForce RTX 2070 (Desktop) | |
| Intel Core i5-10600K, NVIDIA Titan RTX | |
| Média Intel Core i9-9980HK (181 - 215, n=13) | |
| Intel Core i7-9750H, NVIDIA GeForce RTX 2080 Mobile | |
| Média Intel Core i7-9750H (170 - 194, n=82) | |
| Intel Core i5-9400F, NVIDIA Titan RTX | |
| Média Intel Core i5-9300H (169 - 176, n=11) | |
| CPU Multi 64Bit | |
| Intel Core i9-10900K, NVIDIA Titan RTX | |
| Média Intel Core i9-9980HK (1327 - 1930, n=14) | |
| Intel Core i9-9980HK, NVIDIA GeForce RTX 2070 (Desktop) | |
| Intel Core i5-10600K, NVIDIA Titan RTX | |
| Média Intel Core i7-9750H (952 - 1306, n=85) | |
| Intel Core i7-9750H, NVIDIA GeForce RTX 2080 Mobile | |
| Intel Core i5-9400F, NVIDIA Titan RTX | |
| Média Intel Core i5-9300H (717 - 850, n=11) | |
| Cinebench R20 | |
| CPU (Single Core) | |
| Intel Core i9-10900K, NVIDIA Titan RTX | |
| Intel Core i9-9980HK, NVIDIA GeForce RTX 2070 (Desktop) | |
| Intel Core i7-9750H, NVIDIA GeForce RTX 2080 Mobile | |
| Média Intel Core i9-9980HK (431 - 505, n=10) | |
| Intel Core i5-10600K, NVIDIA Titan RTX | |
| Média Intel Core i7-9750H (416 - 486, n=55) | |
| Intel Core i5-9400F, NVIDIA Titan RTX | |
| Média Intel Core i5-9300H (398 - 427, n=9) | |
| CPU (Multi Core) | |
| Intel Core i9-10900K, NVIDIA Titan RTX | |
| Média Intel Core i9-9980HK (2974 - 4150, n=10) | |
| Intel Core i5-10600K, NVIDIA Titan RTX | |
| Intel Core i9-9980HK, NVIDIA GeForce RTX 2070 (Desktop) | |
| Intel Core i7-9750H, NVIDIA GeForce RTX 2080 Mobile | |
| Média Intel Core i7-9750H (2017 - 3133, n=55) | |
| Intel Core i5-9400F, NVIDIA Titan RTX | |
| Média Intel Core i5-9300H (1530 - 1877, n=9) | |
| Cinebench R11.5 | |
| CPU Single 64Bit | |
| Intel Core i9-10900K, NVIDIA Titan RTX | |
| Intel Core i9-9980HK, NVIDIA GeForce RTX 2070 (Desktop) | |
| Média Intel Core i9-9980HK (2.25 - 2.4, n=3) | |
| Intel Core i5-10600K, NVIDIA Titan RTX | |
| Intel Core i7-9750H, NVIDIA GeForce RTX 2080 Mobile | |
| Média Intel Core i7-9750H (1.96 - 2.19, n=10) | |
| Intel Core i5-9400F, NVIDIA Titan RTX | |
| CPU Multi 64Bit | |
| Intel Core i9-10900K, NVIDIA Titan RTX | |
| Intel Core i9-9980HK, NVIDIA GeForce RTX 2070 (Desktop) | |
| Média Intel Core i9-9980HK (14.8 - 18, n=3) | |
| Intel Core i5-10600K, NVIDIA Titan RTX | |
| Média Intel Core i7-9750H (11.3 - 14.1, n=10) | |
| Intel Core i7-9750H, NVIDIA GeForce RTX 2080 Mobile | |
| Intel Core i5-9400F, NVIDIA Titan RTX | |
| Cinebench R10 | |
| Rendering Single CPUs 64Bit | |
| Intel Core i9-10900K, NVIDIA Titan RTX | |
| Intel Core i9-9980HK, NVIDIA GeForce RTX 2070 (Desktop) | |
| Média Intel Core i9-9980HK (n=1) | |
| Intel Core i5-10600K, NVIDIA Titan RTX | |
| Intel Core i7-9750H, NVIDIA GeForce RTX 2080 Mobile | |
| Média Intel Core i7-9750H (9069 - 9346, n=3) | |
| Intel Core i5-9400F, NVIDIA Titan RTX | |
| Rendering Multiple CPUs 64Bit | |
| Intel Core i9-10900K, NVIDIA Titan RTX | |
| Intel Core i9-9980HK, NVIDIA GeForce RTX 2070 (Desktop) | |
| Média Intel Core i9-9980HK (n=1) | |
| Intel Core i5-10600K, NVIDIA Titan RTX | |
| Intel Core i7-9750H, NVIDIA GeForce RTX 2080 Mobile | |
| Média Intel Core i7-9750H (37188 - 44238, n=3) | |
| Intel Core i5-9400F, NVIDIA Titan RTX | |
| Blender - v2.79 BMW27 CPU | |
| Média Intel Core i5-9300H (588 - 643, n=3) | |
| Intel Core i5-9400F, NVIDIA Titan RTX | |
| Média Intel Core i7-9750H (342 - 495, n=21) | |
| Intel Core i7-9750H, NVIDIA GeForce RTX 2080 Mobile | |
| Média Intel Core i9-9980HK (317 - 527, n=3) | |
| Intel Core i9-9980HK, NVIDIA GeForce RTX 2070 (Desktop) | |
| Intel Core i5-10600K, NVIDIA Titan RTX | |
| Intel Core i9-10900K, NVIDIA Titan RTX | |
| wPrime 2.10 | |
| 32m | |
| Intel Core i5-9400F, NVIDIA Titan RTX | |
| Intel Core i7-9750H, NVIDIA GeForce RTX 2080 Mobile | |
| Média Intel Core i7-9750H (n=1) | |
| Intel Core i5-10600K, NVIDIA Titan RTX | |
| Média Intel Core i9-9980HK (3.79 - 4.94, n=2) | |
| Intel Core i9-9980HK, NVIDIA GeForce RTX 2070 (Desktop) | |
| Intel Core i9-10900K, NVIDIA Titan RTX | |
| 1024m | |
| Intel Core i5-9400F, NVIDIA Titan RTX | |
| Intel Core i7-9750H, NVIDIA GeForce RTX 2080 Mobile | |
| Média Intel Core i7-9750H (n=1) | |
| Intel Core i9-9980HK, NVIDIA GeForce RTX 2070 (Desktop) | |
| Média Intel Core i9-9980HK (110.4 - 120.2, n=2) | |
| Intel Core i5-10600K, NVIDIA Titan RTX | |
| Intel Core i9-10900K, NVIDIA Titan RTX | |
| X264 HD Benchmark 4.0 | |
| Pass 1 | |
| Intel Core i9-10900K, NVIDIA Titan RTX | |
| Intel Core i5-10600K, NVIDIA Titan RTX | |
| Média Intel Core i9-9980HK (238 - 239, n=2) | |
| Intel Core i9-9980HK, NVIDIA GeForce RTX 2070 (Desktop) | |
| Intel Core i5-9400F, NVIDIA Titan RTX | |
| Média Intel Core i7-9750H (211 - 219, n=2) | |
| Intel Core i7-9750H, NVIDIA GeForce RTX 2080 Mobile | |
| Média Intel Core i5-9300H (n=1) | |
| Pass 2 | |
| Intel Core i9-10900K, NVIDIA Titan RTX | |
| Média Intel Core i9-9980HK (92.8 - 94.8, n=2) | |
| Intel Core i9-9980HK, NVIDIA GeForce RTX 2070 (Desktop) | |
| Intel Core i5-10600K, NVIDIA Titan RTX | |
| Intel Core i7-9750H, NVIDIA GeForce RTX 2080 Mobile | |
| Média Intel Core i7-9750H (69.6 - 70.9, n=2) | |
| Intel Core i5-9400F, NVIDIA Titan RTX | |
| Média Intel Core i5-9300H (n=1) | |
| WinRAR - Result | |
| Intel Core i9-10900K, NVIDIA Titan RTX | |
| Média Intel Core i9-9980HK (7266 - 7436, n=2) | |
| Intel Core i9-9980HK, NVIDIA GeForce RTX 2070 (Desktop) | |
| Intel Core i5-10600K, NVIDIA Titan RTX | |
| Média Intel Core i7-9750H (6160 - 6631, n=2) | |
| Intel Core i7-9750H, NVIDIA GeForce RTX 2080 Mobile | |
| Intel Core i5-9400F, NVIDIA Titan RTX | |
| Média Intel Core i5-9300H (n=1) | |
| TrueCrypt | |
| AES Mean 100MB | |
| Intel Core i9-10900K, NVIDIA Titan RTX | |
| Média Intel Core i9-9980HK (10.1 - 10.3, n=2) | |
| Intel Core i9-9980HK, NVIDIA GeForce RTX 2070 (Desktop) | |
| Intel Core i5-10600K, NVIDIA Titan RTX | |
| Intel Core i7-9750H, NVIDIA GeForce RTX 2080 Mobile | |
| Média Intel Core i7-9750H (7.3 - 7.4, n=2) | |
| Intel Core i5-9400F, NVIDIA Titan RTX | |
| Média Intel Core i5-9300H (n=1) | |
| Twofish Mean 100MB | |
| Intel Core i9-10900K, NVIDIA Titan RTX | |
| Intel Core i9-9980HK, NVIDIA GeForce RTX 2070 (Desktop) | |
| Média Intel Core i9-9980HK (1.7 - 1.7, n=2) | |
| Intel Core i5-10600K, NVIDIA Titan RTX | |
| Média Intel Core i7-9750H (1.2 - 1.3, n=2) | |
| Intel Core i7-9750H, NVIDIA GeForce RTX 2080 Mobile | |
| Intel Core i5-9400F, NVIDIA Titan RTX | |
| Média Intel Core i5-9300H (n=1) | |
| Serpent Mean 100MB | |
| Intel Core i9-10900K, NVIDIA Titan RTX | |
| Intel Core i9-9980HK, NVIDIA GeForce RTX 2070 (Desktop) | |
| Média Intel Core i9-9980HK (1 - 1, n=2) | |
| Intel Core i5-10600K, NVIDIA Titan RTX | |
| Média Intel Core i7-9750H (0.7 - 0.75, n=2) | |
| Intel Core i7-9750H, NVIDIA GeForce RTX 2080 Mobile | |
| Intel Core i5-9400F, NVIDIA Titan RTX | |
| Média Intel Core i5-9300H (n=1) | |
| Geekbench 5.5 | |
| Multi-Core | |
| Intel Core i9-10900K, NVIDIA Titan RTX | |
| Intel Core i9-9980HK, NVIDIA GeForce RTX 2070 (Desktop) | |
| Média Intel Core i9-9980HK (6945 - 7703, n=3) | |
| Intel Core i5-10600K, NVIDIA Titan RTX | |
| Intel Core i7-9750H, NVIDIA GeForce RTX 2080 Mobile | |
| Intel Core i5-9400F, NVIDIA Titan RTX | |
| Média Intel Core i7-9750H (4859 - 6262, n=13) | |
| Single-Core | |
| Intel Core i9-10900K, NVIDIA Titan RTX | |
| Intel Core i9-9980HK, NVIDIA GeForce RTX 2070 (Desktop) | |
| Média Intel Core i9-9980HK (1314 - 1378, n=2) | |
| Intel Core i5-10600K, NVIDIA Titan RTX | |
| Intel Core i7-9750H, NVIDIA GeForce RTX 2080 Mobile | |
| Média Intel Core i7-9750H (1117 - 1251, n=13) | |
| Intel Core i5-9400F, NVIDIA Titan RTX | |
| Geekbench 5.0 | |
| 5.0 Multi-Core | |
| Intel Core i9-10900K, NVIDIA Titan RTX | |
| Intel Core i9-9980HK, NVIDIA GeForce RTX 2070 (Desktop) | |
| Média Intel Core i9-9980HK (7072 - 7805, n=4) | |
| Intel Core i5-10600K, NVIDIA Titan RTX | |
| Intel Core i7-9750H, NVIDIA GeForce RTX 2080 Mobile | |
| Intel Core i5-9400F, NVIDIA Titan RTX | |
| Média Intel Core i7-9750H (4812 - 6230, n=15) | |
| Média Intel Core i5-9300H (3697 - 4200, n=3) | |
| 5.0 Single-Core | |
| Intel Core i9-10900K, NVIDIA Titan RTX | |
| Intel Core i9-9980HK, NVIDIA GeForce RTX 2070 (Desktop) | |
| Intel Core i5-10600K, NVIDIA Titan RTX | |
| Média Intel Core i9-9980HK (1171 - 1355, n=4) | |
| Intel Core i7-9750H, NVIDIA GeForce RTX 2080 Mobile | |
| Média Intel Core i7-9750H (1105 - 1248, n=15) | |
| Intel Core i5-9400F, NVIDIA Titan RTX | |
| Média Intel Core i5-9300H (1095 - 1137, n=3) | |
| Geekbench 4.4 | |
| 64 Bit Single-Core Score | |
| Intel Core i9-10900K, NVIDIA Titan RTX | |
| Intel Core i9-9980HK, NVIDIA GeForce RTX 2070 (Desktop) | |
| Média Intel Core i9-9980HK (5617 - 5972, n=3) | |
| Intel Core i5-10600K, NVIDIA Titan RTX | |
| Intel Core i7-9750H, NVIDIA GeForce RTX 2080 Mobile | |
| Intel Core i5-9400F, NVIDIA Titan RTX | |
| Média Intel Core i7-9750H (4440 - 5511, n=27) | |
| Média Intel Core i5-9300H (4704 - 5089, n=7) | |
| 64 Bit Multi-Core Score | |
| Intel Core i9-10900K, NVIDIA Titan RTX | |
| Média Intel Core i9-9980HK (28625 - 30849, n=3) | |
| Intel Core i9-9980HK, NVIDIA GeForce RTX 2070 (Desktop) | |
| Intel Core i5-10600K, NVIDIA Titan RTX | |
| Intel Core i7-9750H, NVIDIA GeForce RTX 2080 Mobile | |
| Média Intel Core i7-9750H (17054 - 25043, n=27) | |
| Intel Core i5-9400F, NVIDIA Titan RTX | |
| Média Intel Core i5-9300H (14853 - 17684, n=7) | |
| 3DMark 11 - 1280x720 Performance Physics | |
| Intel Core i9-10900K, NVIDIA Titan RTX | |
| Intel Core i9-9980HK, NVIDIA GeForce RTX 2070 (Desktop) | |
| Intel Core i5-10600K, NVIDIA Titan RTX | |
| Média Intel Core i9-9980HK (9056 - 18260, n=12) | |
| Intel Core i7-9750H, NVIDIA GeForce RTX 2080 Mobile | |
| Média Intel Core i7-9750H (9704 - 14337, n=80) | |
| Intel Core i5-9400F, NVIDIA Titan RTX | |
| Média Intel Core i5-9300H (7499 - 10557, n=12) | |
| 7-Zip 18.03 | |
| 7z b 4 | |
| Intel Core i9-10900K, NVIDIA Titan RTX | |
| Intel Core i9-9980HK, NVIDIA GeForce RTX 2070 (Desktop) | |
| Média Intel Core i9-9980HK (39566 - 44081, n=4) | |
| Intel Core i5-10600K, NVIDIA Titan RTX | |
| Intel Core i7-9750H, NVIDIA GeForce RTX 2080 Mobile | |
| Média Intel Core i7-9750H (28512 - 35174, n=21) | |
| Intel Core i5-9400F, NVIDIA Titan RTX | |
| Média Intel Core i5-9300H (20736 - 23155, n=3) | |
| 7z b 4 -mmt1 | |
| Intel Core i9-10900K, NVIDIA Titan RTX | |
| Intel Core i9-9980HK, NVIDIA GeForce RTX 2070 (Desktop) | |
| Média Intel Core i9-9980HK (5283 - 5642, n=4) | |
| Intel Core i5-10600K, NVIDIA Titan RTX | |
| Intel Core i7-9750H, NVIDIA GeForce RTX 2080 Mobile | |
| Média Intel Core i7-9750H (4580 - 5090, n=21) | |
| Intel Core i5-9400F, NVIDIA Titan RTX | |
| Média Intel Core i5-9300H (4542 - 4626, n=3) | |
| HWBOT x265 Benchmark v2.2 - 4k Preset | |
| Intel Core i9-10900K, NVIDIA Titan RTX | |
| Intel Core i5-10600K, NVIDIA Titan RTX | |
| Média Intel Core i9-9980HK (10.8 - 12.4, n=3) | |
| Intel Core i9-9980HK, NVIDIA GeForce RTX 2070 (Desktop) | |
| Intel Core i5-9400F, NVIDIA Titan RTX | |
| Intel Core i7-9750H, NVIDIA GeForce RTX 2080 Mobile | |
| Média Intel Core i7-9750H (7.1 - 10.7, n=21) | |
| Média Intel Core i5-9300H (5.7 - 6.5, n=3) | |
| R Benchmark 2.5 - Overall mean | |
| Intel Core i5-9400F, NVIDIA Titan RTX | |
| Média Intel Core i7-9750H (0.608 - 0.695, n=14) | |
| Intel Core i7-9750H, NVIDIA GeForce RTX 2080 Mobile | |
| Intel Core i5-10600K, NVIDIA Titan RTX | |
| Intel Core i9-9980HK, NVIDIA GeForce RTX 2070 (Desktop) | |
| Média Intel Core i9-9980HK (n=1) | |
| Intel Core i9-10900K, NVIDIA Titan RTX | |
| LibreOffice - 20 Documents To PDF | |
| Intel Core i9-10900K, NVIDIA Titan RTX | |
| Média Intel Core i7-9750H (54.5 - 64.7, n=9) | |
| Intel Core i5-9400F, NVIDIA Titan RTX | |
| Intel Core i7-9750H, NVIDIA GeForce RTX 2080 Mobile | |
| Média Intel Core i9-9980HK (45.2 - 57.5, n=2) | |
| Intel Core i5-10600K, NVIDIA Titan RTX | |
| Intel Core i9-9980HK, NVIDIA GeForce RTX 2070 (Desktop) | |
| WebXPRT 3 - Overall | |
| Intel Core i9-10900K, NVIDIA Titan RTX | |
| Intel Core i5-10600K, NVIDIA Titan RTX | |
| Intel Core i9-9980HK, NVIDIA GeForce RTX 2070 (Desktop) | |
| Média Intel Core i9-9980HK (n=1) | |
| Média Intel Core i5-9300H (n=1) | |
| Intel Core i7-9750H, NVIDIA GeForce RTX 2080 Mobile | |
| Intel Core i5-9400F, NVIDIA Titan RTX | |
| Média Intel Core i7-9750H (199 - 231, n=10) | |
| Mozilla Kraken 1.1 - Total | |
| Média Intel Core i5-9300H (1079 - 1349, n=8) | |
| Média Intel Core i7-9750H (845 - 1713, n=54) | |
| Média Intel Core i9-9980HK (705 - 999, n=9) | |
| Intel Core i5-9400F, NVIDIA Titan RTX | |
| Intel Core i7-9750H, NVIDIA GeForce RTX 2080 Mobile | |
| Intel Core i5-10600K, NVIDIA Titan RTX | |
| Intel Core i9-9980HK, NVIDIA GeForce RTX 2070 (Desktop) | |
| Intel Core i9-10900K, NVIDIA Titan RTX | |
| 3DMark | |
| 3840x2160 Fire Strike Ultra Physics | |
| Intel Core i9-10900K, NVIDIA Titan RTX | |
| Intel Core i9-9980HK, NVIDIA GeForce RTX 2070 (Desktop) | |
| Média Intel Core i9-9980HK (19832 - 22568, n=8) | |
| Intel Core i5-10600K, NVIDIA Titan RTX | |
| Intel Core i7-9750H, NVIDIA GeForce RTX 2080 Mobile | |
| Média Intel Core i7-9750H (12628 - 17820, n=51) | |
| Intel Core i5-9400F, NVIDIA Titan RTX | |
| Média Intel Core i5-9300H (9749 - 12343, n=6) | |
| 1920x1080 Fire Strike Physics | |
| Intel Core i9-10900K, NVIDIA Titan RTX | |
| Intel Core i9-9980HK, NVIDIA GeForce RTX 2070 (Desktop) | |
| Intel Core i5-10600K, NVIDIA Titan RTX | |
| Média Intel Core i9-9980HK (11758 - 22463, n=11) | |
| Intel Core i7-9750H, NVIDIA GeForce RTX 2080 Mobile | |
| Média Intel Core i7-9750H (12438 - 17788, n=76) | |
| Intel Core i5-9400F, NVIDIA Titan RTX | |
| Média Intel Core i5-9300H (9387 - 12349, n=12) | |
| 2560x1440 Time Spy CPU | |
| Intel Core i9-10900K, NVIDIA Titan RTX | |
| Intel Core i9-9980HK, NVIDIA GeForce RTX 2070 (Desktop) | |
| Média Intel Core i9-9980HK (5540 - 10162, n=12) | |
| Intel Core i5-10600K, NVIDIA Titan RTX | |
| Média Intel Core i7-9750H (4620 - 7171, n=70) | |
| Intel Core i7-9750H, NVIDIA GeForce RTX 2080 Mobile | |
| Intel Core i5-9400F, NVIDIA Titan RTX | |
| Média Intel Core i5-9300H (3165 - 4861, n=10) | |
* ... menor é melhor
| PCMark 10 - Score | |
| AMD Ryzen 9 3950X, AMD Ryzen 9 3950X | |
| Intel Core i9-10900K, Intel Core i9-10900K | |
| Corsair One i160, Intel Core i9-9900K | |
| Intel Core i5-10600K, Intel Core i5-10600K | |
| Intel Ghost Canyon NUC (RTX 2070), Intel Core i9-9980HK | |
| Zotac ZBOX Magnus EN72070V, Intel Core i7-9750H | |
| Média Intel Core i7-9750H (4395 - 6453, n=72) | |
| PCMark 8 | |
| Work Score Accelerated v2 | |
| Média Intel Core i7-9750H (4241 - 6593, n=57) | |
| AMD Ryzen 9 3950X, AMD Ryzen 9 3950X | |
| Corsair One i160, Intel Core i9-9900K | |
| Intel Core i5-10600K, Intel Core i5-10600K | |
| Intel Core i9-10900K, Intel Core i9-10900K | |
| Intel Ghost Canyon NUC (RTX 2070), Intel Core i9-9980HK | |
| Zotac ZBOX Magnus EN72070V, Intel Core i7-9750H | |
| Creative Score Accelerated v2 | |
| Corsair One i160, Intel Core i9-9900K | |
| AMD Ryzen 9 3950X, AMD Ryzen 9 3950X | |
| Intel Core i5-10600K, Intel Core i5-10600K | |
| Intel Core i9-10900K, Intel Core i9-10900K | |
| Intel Ghost Canyon NUC (RTX 2070), Intel Core i9-9980HK | |
| Zotac ZBOX Magnus EN72070V, Intel Core i7-9750H | |
| Média Intel Core i7-9750H (3753 - 8733, n=22) | |
| Home Score Accelerated v2 | |
| Corsair One i160, Intel Core i9-9900K | |
| AMD Ryzen 9 3950X, AMD Ryzen 9 3950X | |
| Intel Ghost Canyon NUC (RTX 2070), Intel Core i9-9980HK | |
| Intel Core i5-10600K, Intel Core i5-10600K | |
| Intel Core i9-10900K, Intel Core i9-10900K | |
| Zotac ZBOX Magnus EN72070V, Intel Core i7-9750H | |
| Média Intel Core i7-9750H (3417 - 5661, n=56) | |
| SPECviewperf 12 | |
| 1900x1060 Solidworks (sw-03) | |
| Intel Core i9-10900K, Intel Core i9-10900K | |
| Intel Core i5-10600K, Intel Core i5-10600K | |
| AMD Ryzen 9 3950X, AMD Ryzen 9 3950X | |
| Média Intel Core i7-9750H (44.7 - 149.1, n=15) | |
| Corsair One i160, Intel Core i9-9900K | |
| Zotac ZBOX Magnus EN72070V, Intel Core i7-9750H | |
| Intel Ghost Canyon NUC (RTX 2070), Intel Core i9-9980HK | |
| 1900x1060 Siemens NX (snx-02) | |
| Intel Core i9-10900K, Intel Core i9-10900K | |
| Intel Core i5-10600K, Intel Core i5-10600K | |
| AMD Ryzen 9 3950X, AMD Ryzen 9 3950X | |
| Média Intel Core i7-9750H (7.7 - 186, n=15) | |
| Corsair One i160, Intel Core i9-9900K | |
| Zotac ZBOX Magnus EN72070V, Intel Core i7-9750H | |
| Intel Ghost Canyon NUC (RTX 2070), Intel Core i9-9980HK | |
| 1900x1060 Showcase (showcase-01) | |
| Intel Core i5-10600K, Intel Core i5-10600K | |
| Intel Core i9-10900K, Intel Core i9-10900K | |
| AMD Ryzen 9 3950X, AMD Ryzen 9 3950X | |
| Corsair One i160, Intel Core i9-9900K | |
| Zotac ZBOX Magnus EN72070V, Intel Core i7-9750H | |
| Intel Ghost Canyon NUC (RTX 2070), Intel Core i9-9980HK | |
| Média Intel Core i7-9750H (25.2 - 122.4, n=15) | |
| 1900x1060 Medical (medical-01) | |
| Intel Core i5-10600K, Intel Core i5-10600K | |
| Intel Core i9-10900K, Intel Core i9-10900K | |
| AMD Ryzen 9 3950X, AMD Ryzen 9 3950X | |
| Corsair One i160, Intel Core i9-9900K | |
| Média Intel Core i7-9750H (14.7 - 65, n=12) | |
| Intel Ghost Canyon NUC (RTX 2070), Intel Core i9-9980HK | |
| Zotac ZBOX Magnus EN72070V, Intel Core i7-9750H | |
| 1900x1060 Maya (maya-04) | |
| Corsair One i160, Intel Core i9-9900K | |
| Intel Core i9-10900K, Intel Core i9-10900K | |
| AMD Ryzen 9 3950X, AMD Ryzen 9 3950X | |
| Intel Ghost Canyon NUC (RTX 2070), Intel Core i9-9980HK | |
| Intel Core i5-10600K, Intel Core i5-10600K | |
| Zotac ZBOX Magnus EN72070V, Intel Core i7-9750H | |
| Média Intel Core i7-9750H (40.7 - 160.6, n=15) | |
| 1900x1060 Energy (energy-01) | |
| Intel Core i5-10600K, Intel Core i5-10600K | |
| Intel Core i9-10900K, Intel Core i9-10900K | |
| AMD Ryzen 9 3950X, AMD Ryzen 9 3950X | |
| Corsair One i160, Intel Core i9-9900K | |
| Zotac ZBOX Magnus EN72070V, Intel Core i7-9750H | |
| Intel Ghost Canyon NUC (RTX 2070), Intel Core i9-9980HK | |
| Média Intel Core i7-9750H (3.93 - 16.1, n=12) | |
| 1900x1060 Creo (creo-01) | |
| Intel Core i9-10900K, Intel Core i9-10900K | |
| Intel Core i5-10600K, Intel Core i5-10600K | |
| AMD Ryzen 9 3950X, AMD Ryzen 9 3950X | |
| Média Intel Core i7-9750H (38.4 - 140.7, n=15) | |
| Corsair One i160, Intel Core i9-9900K | |
| Zotac ZBOX Magnus EN72070V, Intel Core i7-9750H | |
| Intel Ghost Canyon NUC (RTX 2070), Intel Core i9-9980HK | |
| 1900x1060 Catia (catia-04) | |
| Intel Core i9-10900K, Intel Core i9-10900K | |
| AMD Ryzen 9 3950X, AMD Ryzen 9 3950X | |
| Intel Core i5-10600K, Intel Core i5-10600K | |
| Corsair One i160, Intel Core i9-9900K | |
| Média Intel Core i7-9750H (54.2 - 161.9, n=15) | |
| Zotac ZBOX Magnus EN72070V, Intel Core i7-9750H | |
| Intel Ghost Canyon NUC (RTX 2070), Intel Core i9-9980HK | |
| 1900x1060 3ds Max (3dsmax-05) | |
| Intel Core i9-10900K, Intel Core i9-10900K | |
| Intel Core i5-10600K, Intel Core i5-10600K | |
| AMD Ryzen 9 3950X, AMD Ryzen 9 3950X | |
| Corsair One i160, Intel Core i9-9900K | |
| Zotac ZBOX Magnus EN72070V, Intel Core i7-9750H | |
| Intel Ghost Canyon NUC (RTX 2070), Intel Core i9-9980HK | |
| Média Intel Core i7-9750H (57.5 - 207, n=11) | |
| SPECviewperf 13 | |
| Solidworks (sw-04) | |
| Intel Core i9-10900K, Intel Core i9-10900K | |
| Intel Core i5-10600K, Intel Core i5-10600K | |
| AMD Ryzen 9 3950X, AMD Ryzen 9 3950X | |
| Corsair One i160, Intel Core i9-9900K | |
| Média Intel Core i7-9750H (64.8 - 125.4, n=15) | |
| Zotac ZBOX Magnus EN72070V, Intel Core i7-9750H | |
| Intel Ghost Canyon NUC (RTX 2070), Intel Core i9-9980HK | |
| Siemens NX (snx-03) | |
| Intel Core i9-10900K, Intel Core i9-10900K | |
| Intel Core i5-10600K, Intel Core i5-10600K | |
| AMD Ryzen 9 3950X, AMD Ryzen 9 3950X | |
| Média Intel Core i7-9750H (13.9 - 306, n=15) | |
| Corsair One i160, Intel Core i9-9900K | |
| Zotac ZBOX Magnus EN72070V, Intel Core i7-9750H | |
| Intel Ghost Canyon NUC (RTX 2070), Intel Core i9-9980HK | |
| Showcase (showcase-02) | |
| Intel Core i5-10600K, Intel Core i5-10600K | |
| Intel Core i9-10900K, Intel Core i9-10900K | |
| AMD Ryzen 9 3950X, AMD Ryzen 9 3950X | |
| Corsair One i160, Intel Core i9-9900K | |
| Zotac ZBOX Magnus EN72070V, Intel Core i7-9750H | |
| Intel Ghost Canyon NUC (RTX 2070), Intel Core i9-9980HK | |
| Média Intel Core i7-9750H (25.2 - 121.6, n=15) | |
| Medical (medical-02) | |
| AMD Ryzen 9 3950X, AMD Ryzen 9 3950X | |
| Intel Core i5-10600K, Intel Core i5-10600K | |
| Intel Core i9-10900K, Intel Core i9-10900K | |
| Corsair One i160, Intel Core i9-9900K | |
| Zotac ZBOX Magnus EN72070V, Intel Core i7-9750H | |
| Média Intel Core i7-9750H (13.1 - 88.9, n=12) | |
| Intel Ghost Canyon NUC (RTX 2070), Intel Core i9-9980HK | |
| Maya (maya-05) | |
| Intel Core i9-10900K, Intel Core i9-10900K | |
| Corsair One i160, Intel Core i9-9900K | |
| AMD Ryzen 9 3950X, AMD Ryzen 9 3950X | |
| Intel Core i5-10600K, Intel Core i5-10600K | |
| Zotac ZBOX Magnus EN72070V, Intel Core i7-9750H | |
| Intel Ghost Canyon NUC (RTX 2070), Intel Core i9-9980HK | |
| Média Intel Core i7-9750H (68.8 - 295, n=15) | |
| Energy (energy-02) | |
| Intel Core i5-10600K, Intel Core i5-10600K | |
| Intel Core i9-10900K, Intel Core i9-10900K | |
| AMD Ryzen 9 3950X, AMD Ryzen 9 3950X | |
| Corsair One i160, Intel Core i9-9900K | |
| Média Intel Core i7-9750H (7.29 - 38, n=12) | |
| Intel Ghost Canyon NUC (RTX 2070), Intel Core i9-9980HK | |
| Zotac ZBOX Magnus EN72070V, Intel Core i7-9750H | |
| Creo (creo-02) | |
| Intel Core i9-10900K, Intel Core i9-10900K | |
| Intel Core i5-10600K, Intel Core i5-10600K | |
| AMD Ryzen 9 3950X, AMD Ryzen 9 3950X | |
| Corsair One i160, Intel Core i9-9900K | |
| Zotac ZBOX Magnus EN72070V, Intel Core i7-9750H | |
| Intel Ghost Canyon NUC (RTX 2070), Intel Core i9-9980HK | |
| Média Intel Core i7-9750H (67.7 - 218, n=15) | |
| Catia (catia-05) | |
| Intel Core i9-10900K, Intel Core i9-10900K | |
| AMD Ryzen 9 3950X, AMD Ryzen 9 3950X | |
| Intel Core i5-10600K, Intel Core i5-10600K | |
| Corsair One i160, Intel Core i9-9900K | |
| Média Intel Core i7-9750H (77.1 - 215, n=15) | |
| Zotac ZBOX Magnus EN72070V, Intel Core i7-9750H | |
| Intel Ghost Canyon NUC (RTX 2070), Intel Core i9-9980HK | |
| 3ds Max (3dsmax-06) | |
| Intel Core i5-10600K, Intel Core i5-10600K | |
| Intel Core i9-10900K, Intel Core i9-10900K | |
| AMD Ryzen 9 3950X, AMD Ryzen 9 3950X | |
| Corsair One i160, Intel Core i9-9900K | |
| Zotac ZBOX Magnus EN72070V, Intel Core i7-9750H | |
| Intel Ghost Canyon NUC (RTX 2070), Intel Core i9-9980HK | |
| Média Intel Core i7-9750H (56.7 - 203, n=15) | |
| Borderlands 3 | |
| 1280x720 Very Low Overall Quality (DX11) | |
| Intel Ghost Canyon NUC (RTX 2070) | |
| Média NVIDIA GeForce RTX 2080 Mobile (128 - 150, n=2) | |
| Zotac ZBOX Magnus EN72070V | |
| 1920x1080 Badass Overall Quality (DX11) | |
| Zotac ZBOX Magnus EN72070V | |
| Média NVIDIA GeForce RTX 2080 Mobile (79.4 - 89.4, n=4) | |
| Intel Ghost Canyon NUC (RTX 2070) | |
| Metro Exodus | |
| 1280x720 Low Quality AF:4x | |
| Intel Ghost Canyon NUC (RTX 2070) | |
| Média NVIDIA GeForce RTX 2080 Mobile (149 - 165, n=2) | |
| Zotac ZBOX Magnus EN72070V | |
| 1920x1080 Ultra Quality AF:16x | |
| Média NVIDIA GeForce RTX 2080 Mobile (67.7 - 77.4, n=5) | |
| Zotac ZBOX Magnus EN72070V | |
| Intel Ghost Canyon NUC (RTX 2070) | |
| Far Cry New Dawn | |
| 1280x720 Low Preset | |
| Intel Ghost Canyon NUC (RTX 2070) | |
| Zotac ZBOX Magnus EN72070V | |
| Média NVIDIA GeForce RTX 2080 Mobile (109 - 117, n=2) | |
| 1920x1080 Ultra Preset | |
| Média NVIDIA GeForce RTX 2080 Mobile (82 - 108, n=5) | |
| Zotac ZBOX Magnus EN72070V | |
| Intel Ghost Canyon NUC (RTX 2070) | |
| Forza Horizon 4 | |
| 1280x720 Very Low Preset | |
| Intel Ghost Canyon NUC (RTX 2070) | |
| Zotac ZBOX Magnus EN72070V | |
| Média NVIDIA GeForce RTX 2080 Mobile (n=1) | |
| 1920x1080 Ultra Preset AA:2xMS | |
| Zotac ZBOX Magnus EN72070V | |
| Média NVIDIA GeForce RTX 2080 Mobile (n=1) | |
| Intel Ghost Canyon NUC (RTX 2070) | |
| Far Cry 5 | |
| 1280x720 Low Preset AA:T | |
| Intel Ghost Canyon NUC (RTX 2070) | |
| Zotac ZBOX Magnus EN72070V | |
| Média NVIDIA GeForce RTX 2080 Mobile (123 - 123, n=2) | |
| 1920x1080 Ultra Preset AA:T | |
| Média NVIDIA GeForce RTX 2080 Mobile (73 - 115, n=3) | |
| Intel Ghost Canyon NUC (RTX 2070) | |
| Zotac ZBOX Magnus EN72070V | |
| X-Plane 11.11 | |
| 1280x720 low (fps_test=1) | |
| Intel Ghost Canyon NUC (RTX 2070) | |
| Zotac ZBOX Magnus EN72070V | |
| Média NVIDIA GeForce RTX 2080 Mobile (98.2 - 114, n=3) | |
| 1920x1080 high (fps_test=3) | |
| Intel Ghost Canyon NUC (RTX 2070) | |
| Zotac ZBOX Magnus EN72070V | |
| Média NVIDIA GeForce RTX 2080 Mobile (73.1 - 84.7, n=3) | |
| Final Fantasy XV Benchmark | |
| 1280x720 Lite Quality | |
| Intel Ghost Canyon NUC (RTX 2070) | |
| Zotac ZBOX Magnus EN72070V | |
| Média NVIDIA GeForce RTX 2080 Mobile (n=1) | |
| 1920x1080 High Quality | |
| Média NVIDIA GeForce RTX 2080 Mobile (90.6 - 108, n=3) | |
| Intel Ghost Canyon NUC (RTX 2070) | |
| Zotac ZBOX Magnus EN72070V | |
| Dota 2 Reborn | |
| 1280x720 min (0/3) fastest | |
| Intel Ghost Canyon NUC (RTX 2070) | |
| Zotac ZBOX Magnus EN72070V | |
| Média NVIDIA GeForce RTX 2080 Mobile (134.8 - 152.8, n=3) | |
| 1920x1080 ultra (3/3) best looking | |
| Intel Ghost Canyon NUC (RTX 2070) | |
| Zotac ZBOX Magnus EN72070V | |
| Média NVIDIA GeForce RTX 2080 Mobile (103.9 - 133.8, n=3) | |
| The Witcher 3 | |
| 1024x768 Low Graphics & Postprocessing | |
| Zotac ZBOX Magnus EN72070V | |
| Média NVIDIA GeForce RTX 2080 Mobile (195.8 - 414, n=9) | |
| Intel Ghost Canyon NUC (RTX 2070) | |
| 1920x1080 Ultra Graphics & Postprocessing (HBAO+) | |
| Zotac ZBOX Magnus EN72070V | |
| Média NVIDIA GeForce RTX 2080 Mobile (82.2 - 105, n=16) | |
| Intel Ghost Canyon NUC (RTX 2070) | |
| 3DMark | |
| Fire Strike Extreme Graphics | |
| Média NVIDIA GeForce RTX 2080 Mobile (11133 - 12514, n=2) | |
| Zotac ZBOX Magnus EN72070V | |
| Intel Ghost Canyon NUC (RTX 2070) | |
| 1920x1080 Fire Strike Graphics | |
| Média NVIDIA GeForce RTX 2080 Mobile (22504 - 27319, n=16) | |
| Zotac ZBOX Magnus EN72070V | |
| Intel Ghost Canyon NUC (RTX 2070) | |
| 2560x1440 Time Spy Graphics | |
| Média NVIDIA GeForce RTX 2080 Mobile (9411 - 10992, n=15) | |
| Zotac ZBOX Magnus EN72070V | |
| Intel Ghost Canyon NUC (RTX 2070) | |
| 3DMark 11 | |
| 1280x720 Performance GPU | |
| Média NVIDIA GeForce RTX 2080 Mobile (31826 - 38809, n=17) | |
| Zotac ZBOX Magnus EN72070V | |
| Intel Ghost Canyon NUC (RTX 2070) | |
| 1280x720 Performance | |
| Média NVIDIA GeForce RTX 2080 Mobile (20224 - 29759, n=19) | |
| Intel Ghost Canyon NUC (RTX 2070) | |
| Zotac ZBOX Magnus EN72070V | |
| baixo | média | alto | ultra | QHD | 4K | |
|---|---|---|---|---|---|---|
| The Witcher 3 (2015) | 338 | 279 | 175 | 95.9 | 63.9 | |
| Dota 2 Reborn (2015) | 145.2 | 135.5 | 130.5 | 124.6 | 119 | |
| Final Fantasy XV Benchmark (2018) | 150 | 117 | 90.6 | 67.7 | 39.5 | |
| X-Plane 11.11 (2018) | 114 | 102 | 84.7 | 73 | ||
| Far Cry 5 (2018) | 123 | 72 | 84 | 73 | 67 | 52 |
| Forza Horizon 4 (2018) | 169 | 147 | 145 | 139 | 122 | 82 |
| Far Cry New Dawn (2019) | 117 | 102 | 97 | 88 | 82 | 54 |
| Metro Exodus (2019) | 149 | 112 | 88.1 | 69.5 | 54.8 | 35.1 |
| Borderlands 3 (2019) | 128 | 117 | 93.4 | 84.3 | 61.4 | 33.2 |
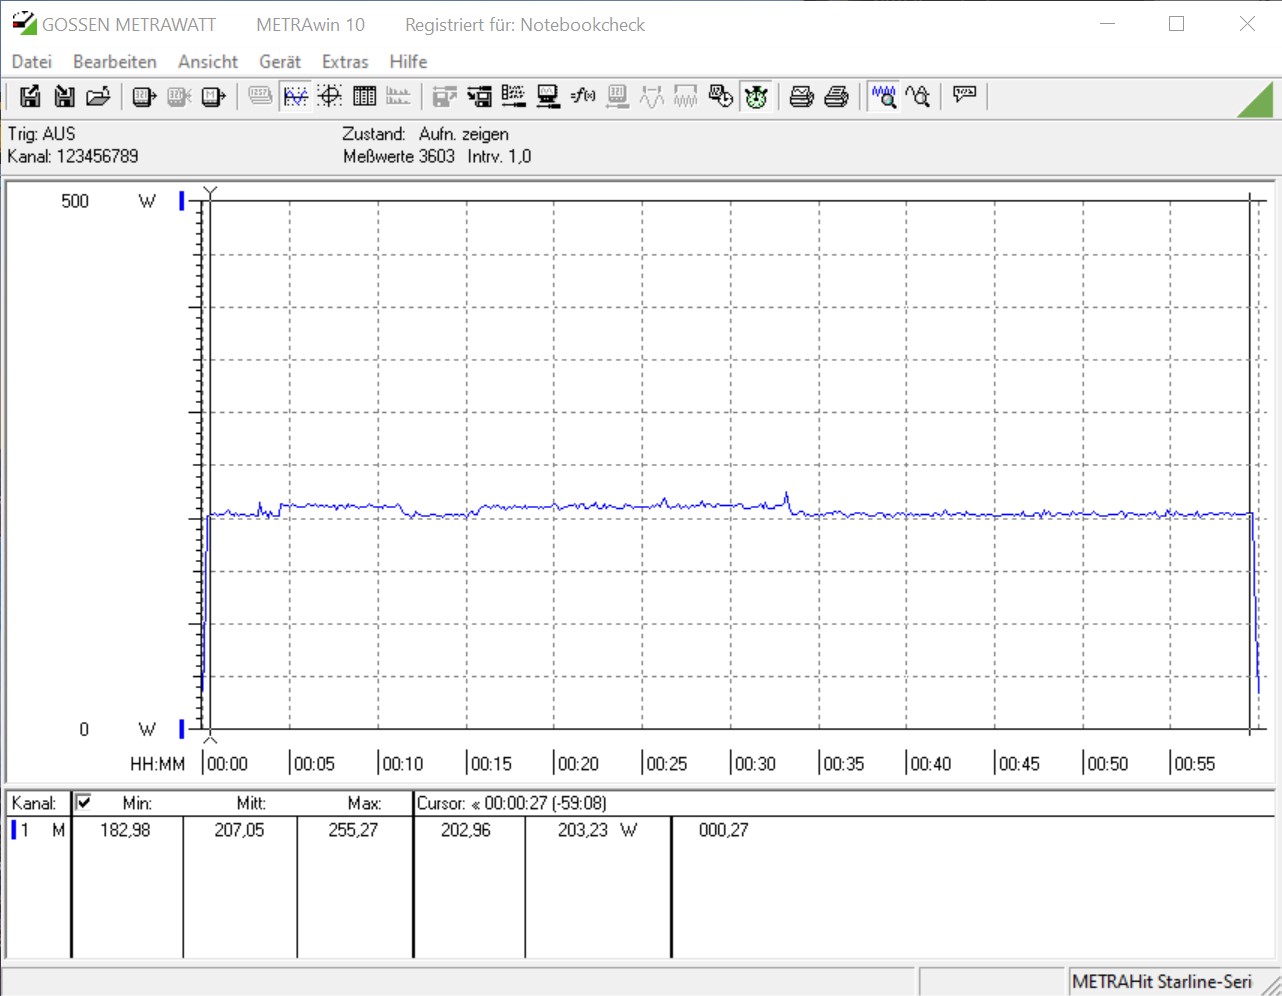
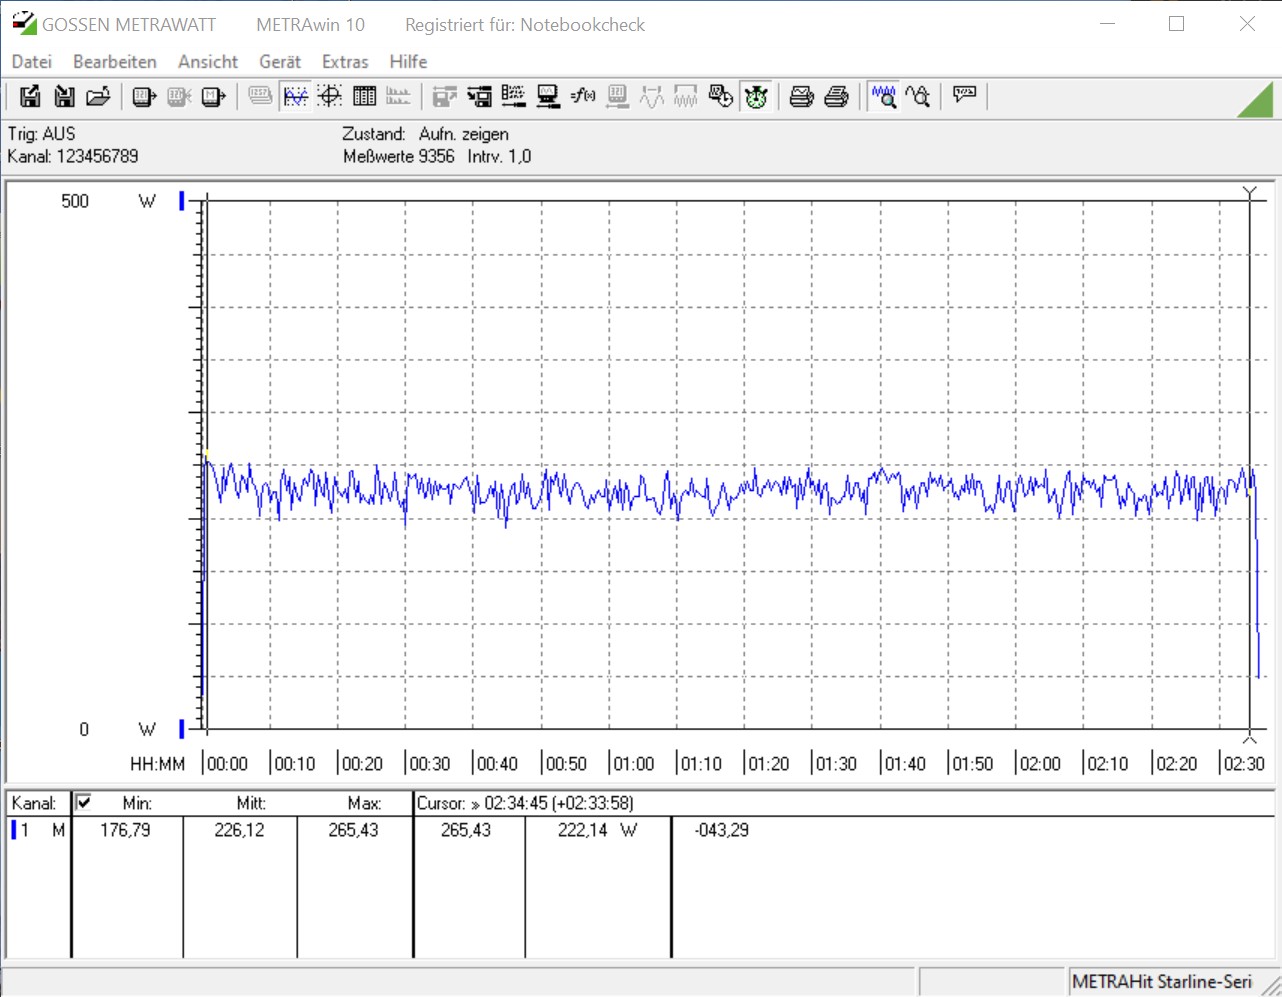
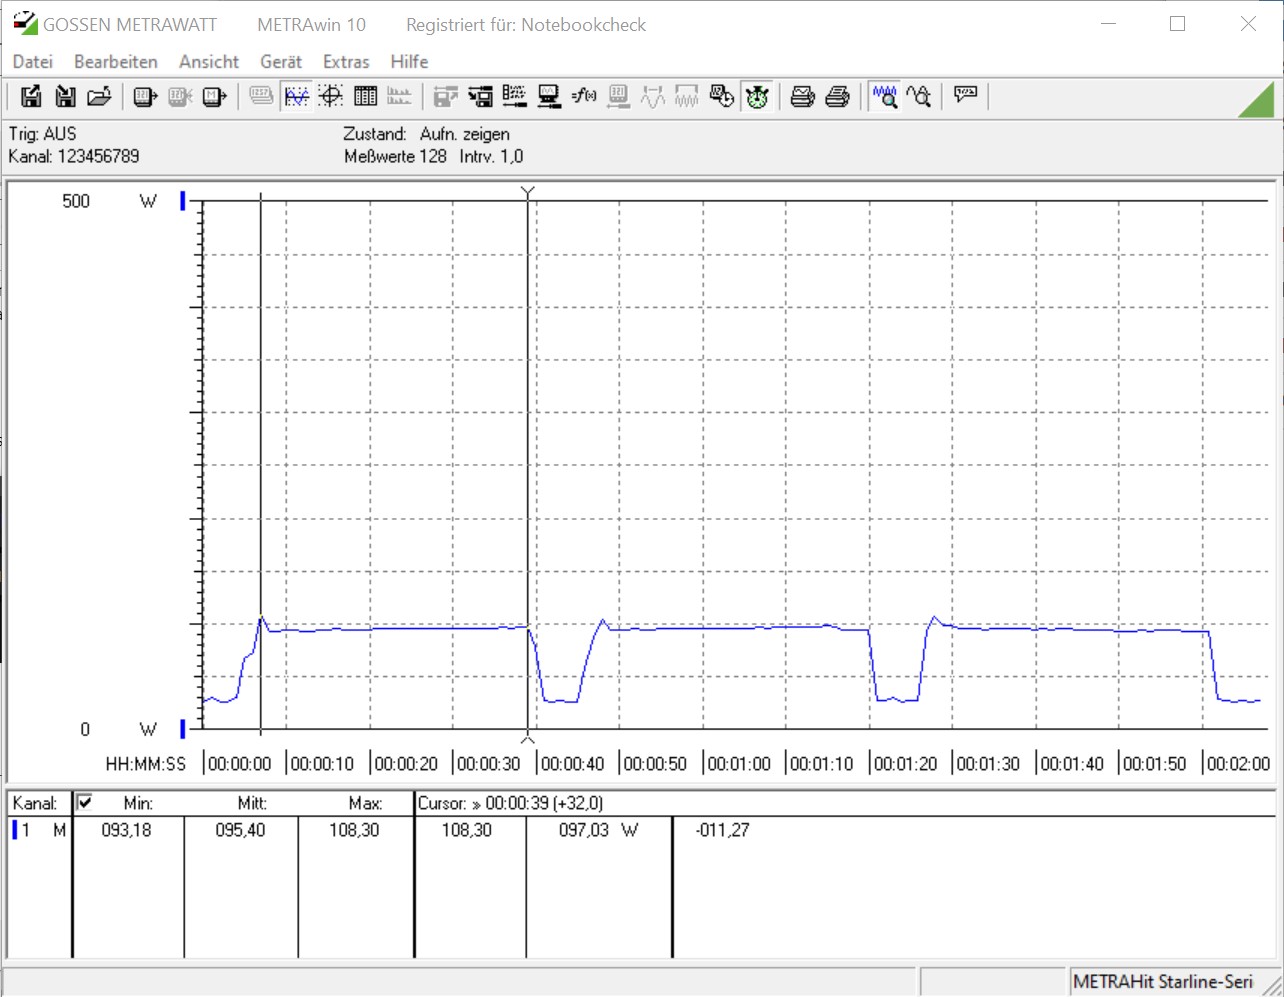
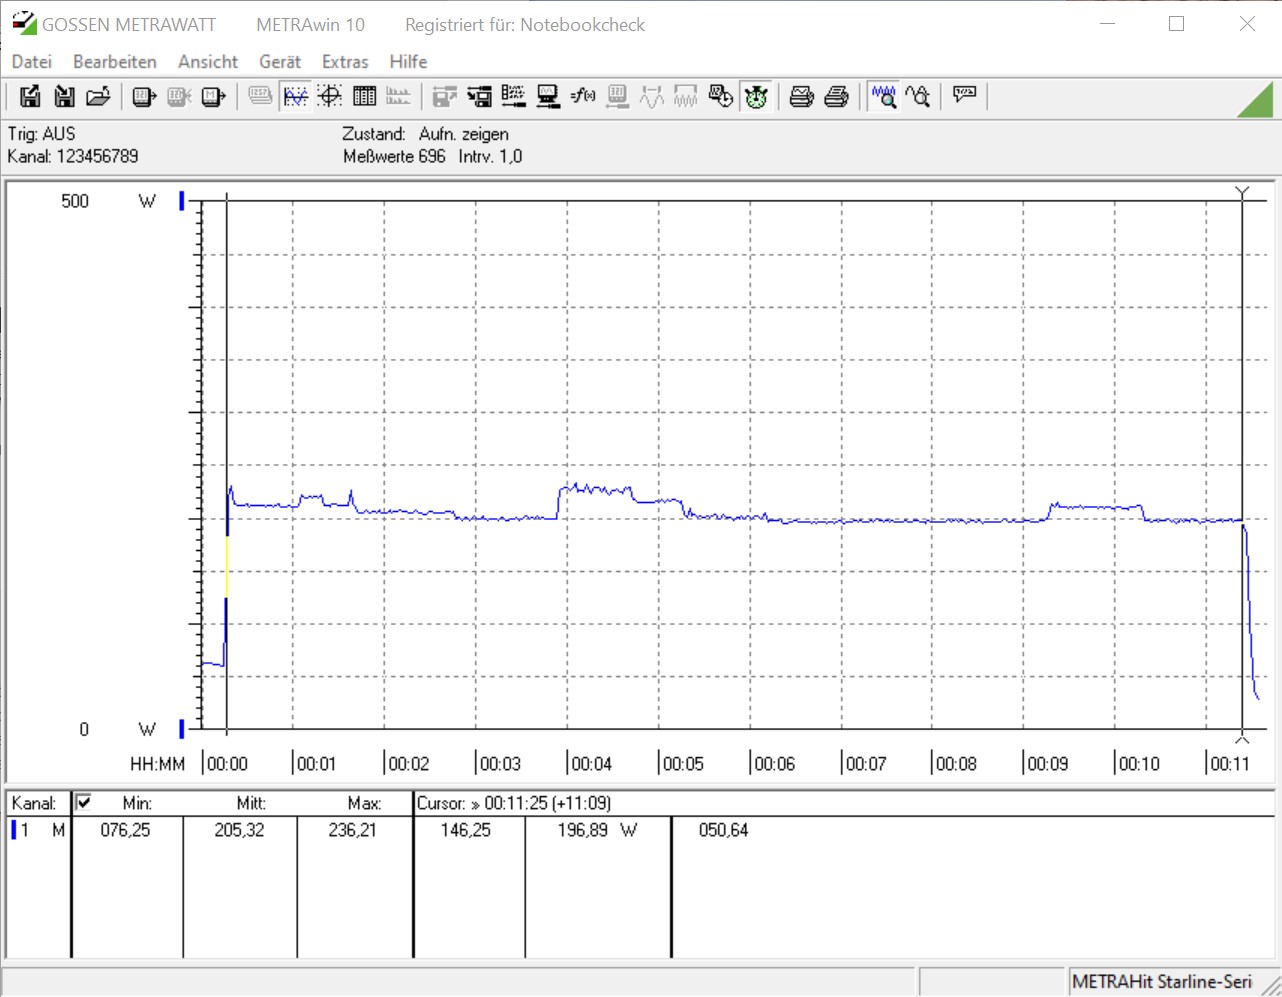
| Power Consumption | |
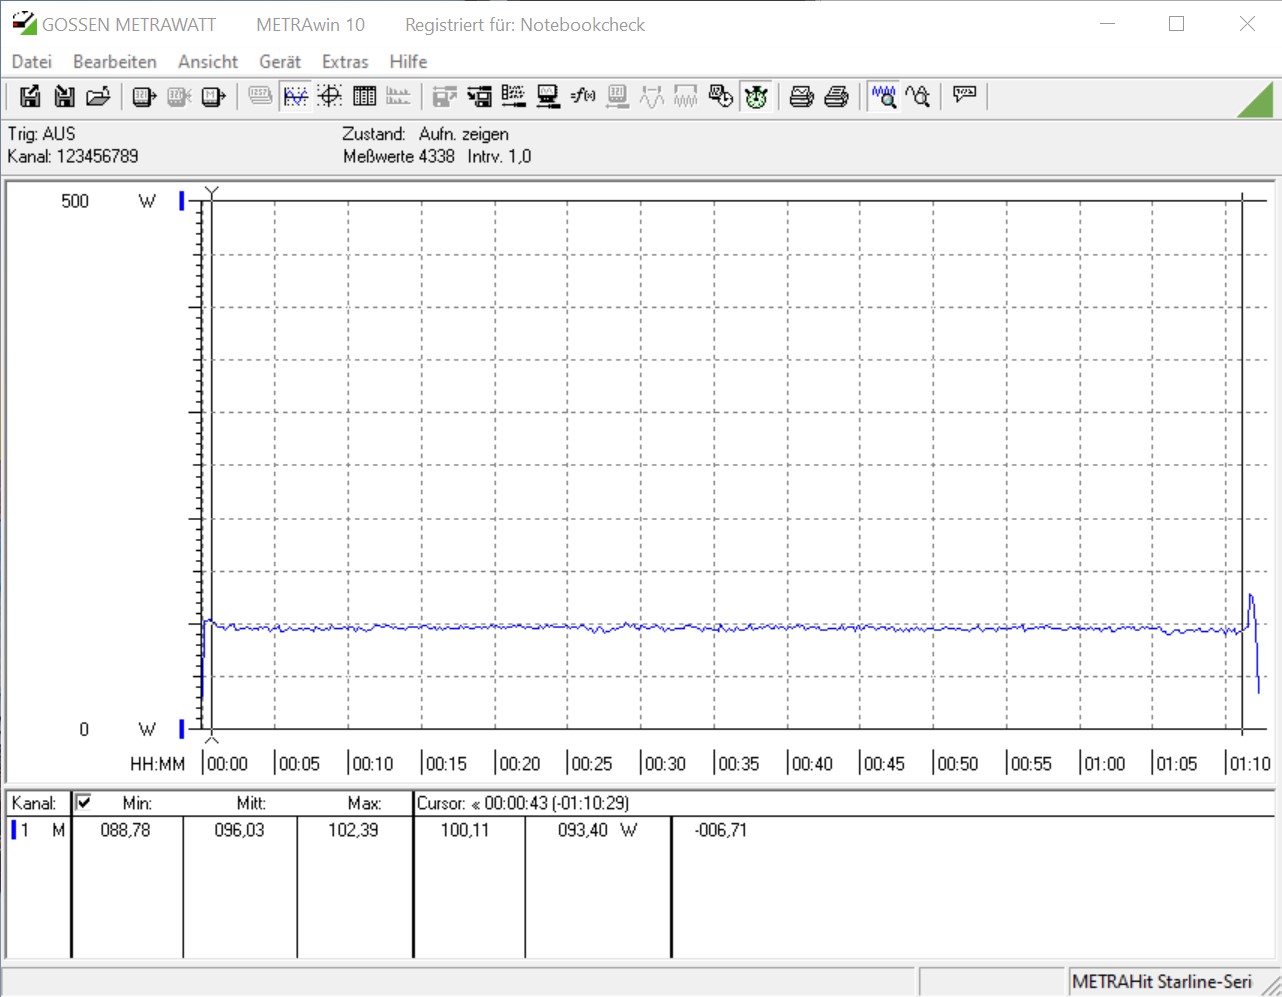
| 1920x1080 The Witcher 3 ultra (external Monitor) | |
| AMD Ryzen 9 3950X (Idle: 95 W) | |
| Intel Core i9-10900K (Idle: 52.3 W) | |
| Intel Core i5-10600K (Idle: 52.2 W) | |
| Intel Core i5 9400F (Idle: 57 W) | |
| Intel Ghost Canyon NUC (RTX 2070) (Idle: 33.1 W) | |
| Zotac ZBOX Magnus EN72070V (Idle: 25.7 W) | |
| Prime95 V2810 Stress (external Monitor) | |
| Intel Core i9-10900K (Idle: 52.3 W) | |
| Intel Core i5-10600K (Idle: 52.2 W) | |
| AMD Ryzen 9 3950X (Idle: 95 W) | |
| Intel Core i5 9400F (Idle: 57 W) | |
| Intel Ghost Canyon NUC (RTX 2070) (Idle: 33.1 W) | |
| Zotac ZBOX Magnus EN72070V (Idle: 25.7 W) | |
| Cinebench R15 Multi (external Monitor) | |
| Intel Core i9-10900K (Idle: 52.3 W) | |
| AMD Ryzen 9 3950X (Idle: 95 W) | |
| Intel Core i5-10600K (Idle: 52.2 W) | |
| Intel Core i5 9400F (Idle: 57 W) | |
| Zotac ZBOX Magnus EN72070V (Idle: 25.7 W) | |
| Temperatures - CPU Temperature Prime95 | |
| Intel Core i9-10900K | |
| Zotac ZBOX Magnus EN72070V | |
| AMD Ryzen 9 3950X | |
| Intel Core i5-10600K | |
| Intel Core i5 9400F | |
* ... menor é melhor
Pro
Contra
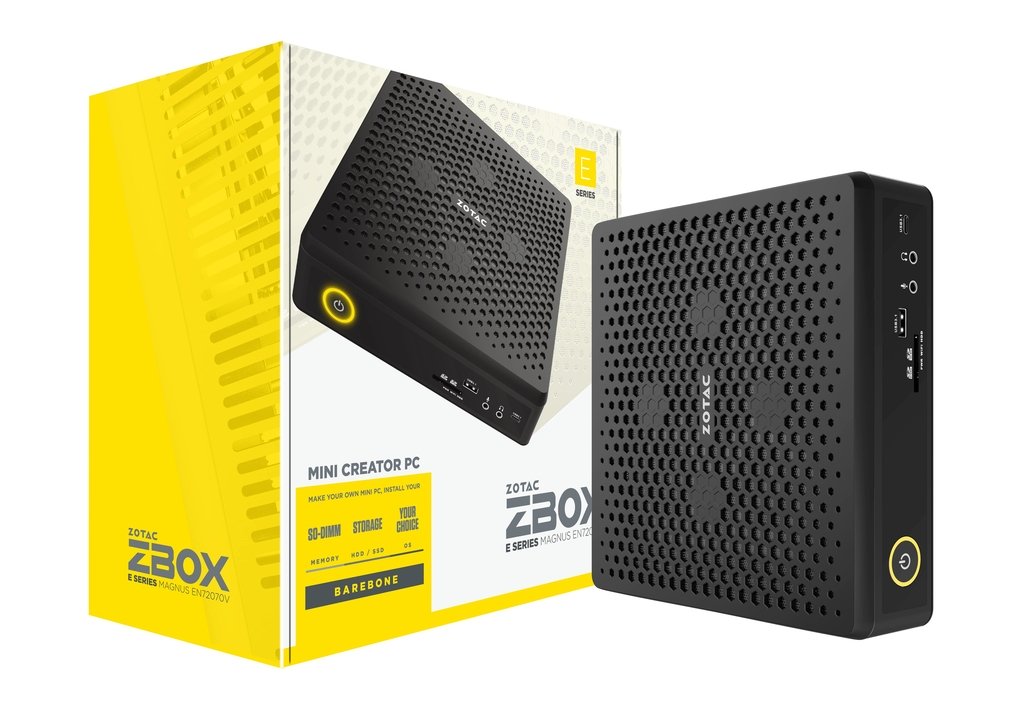
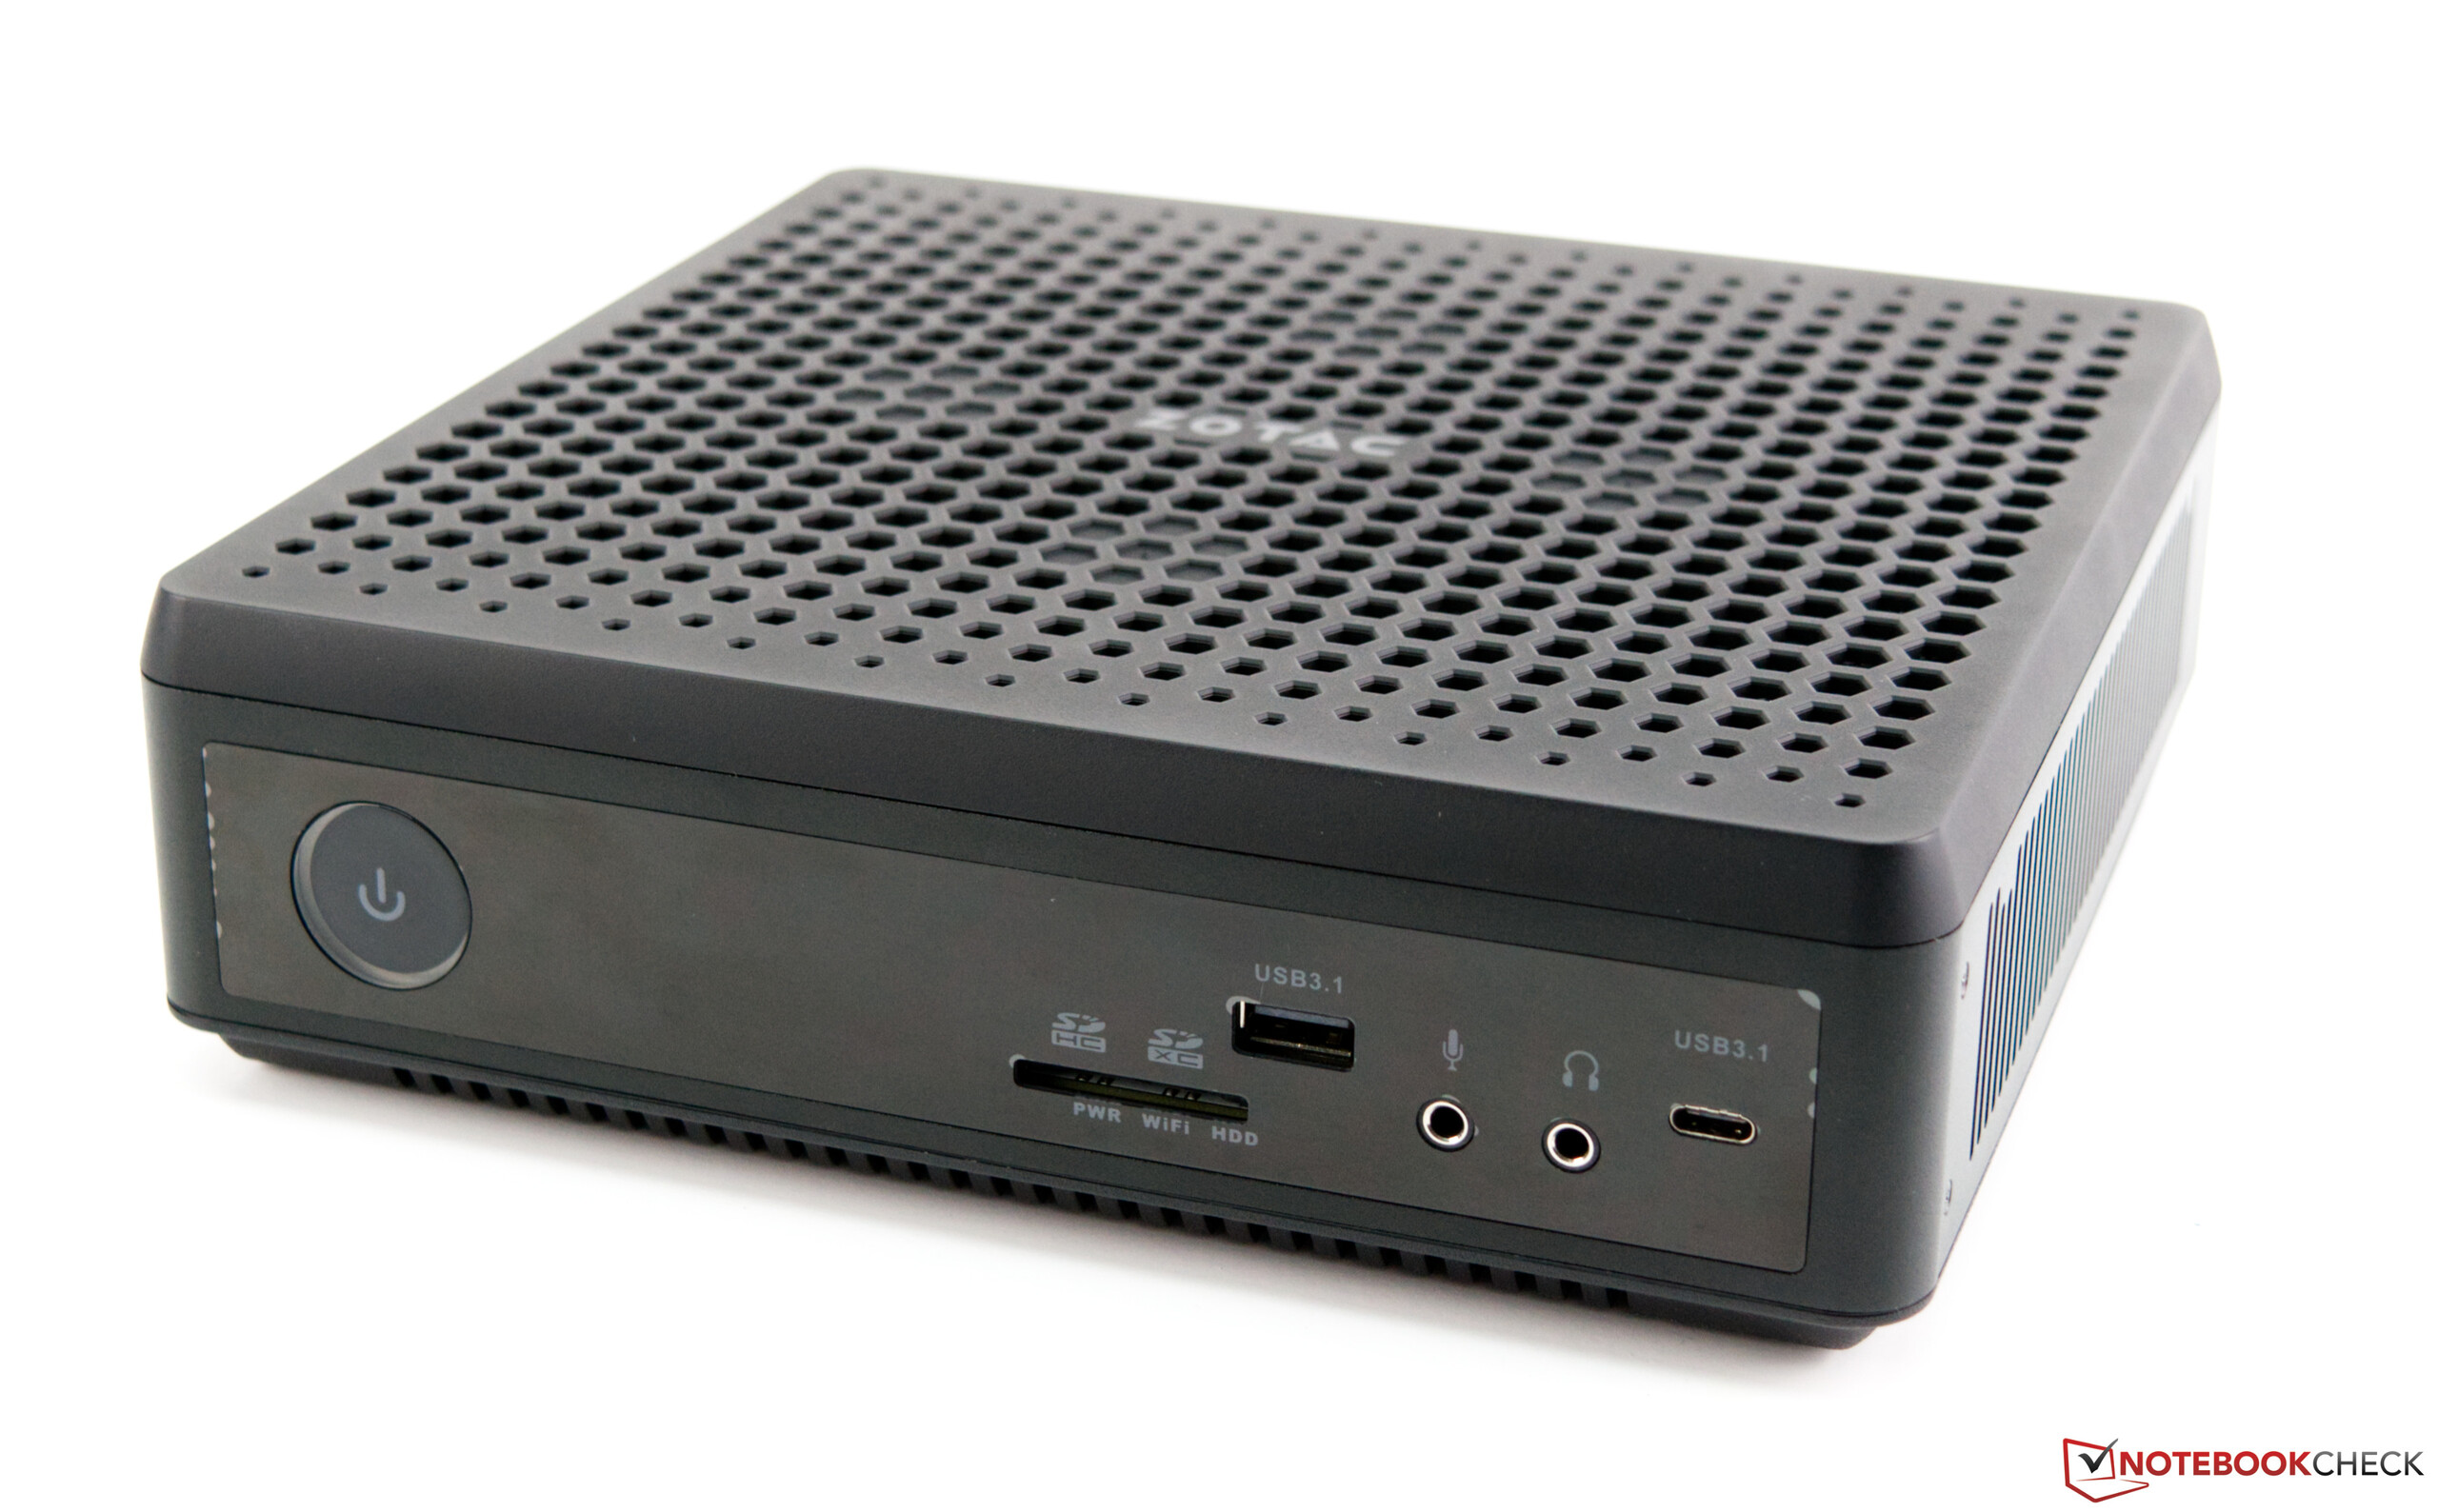
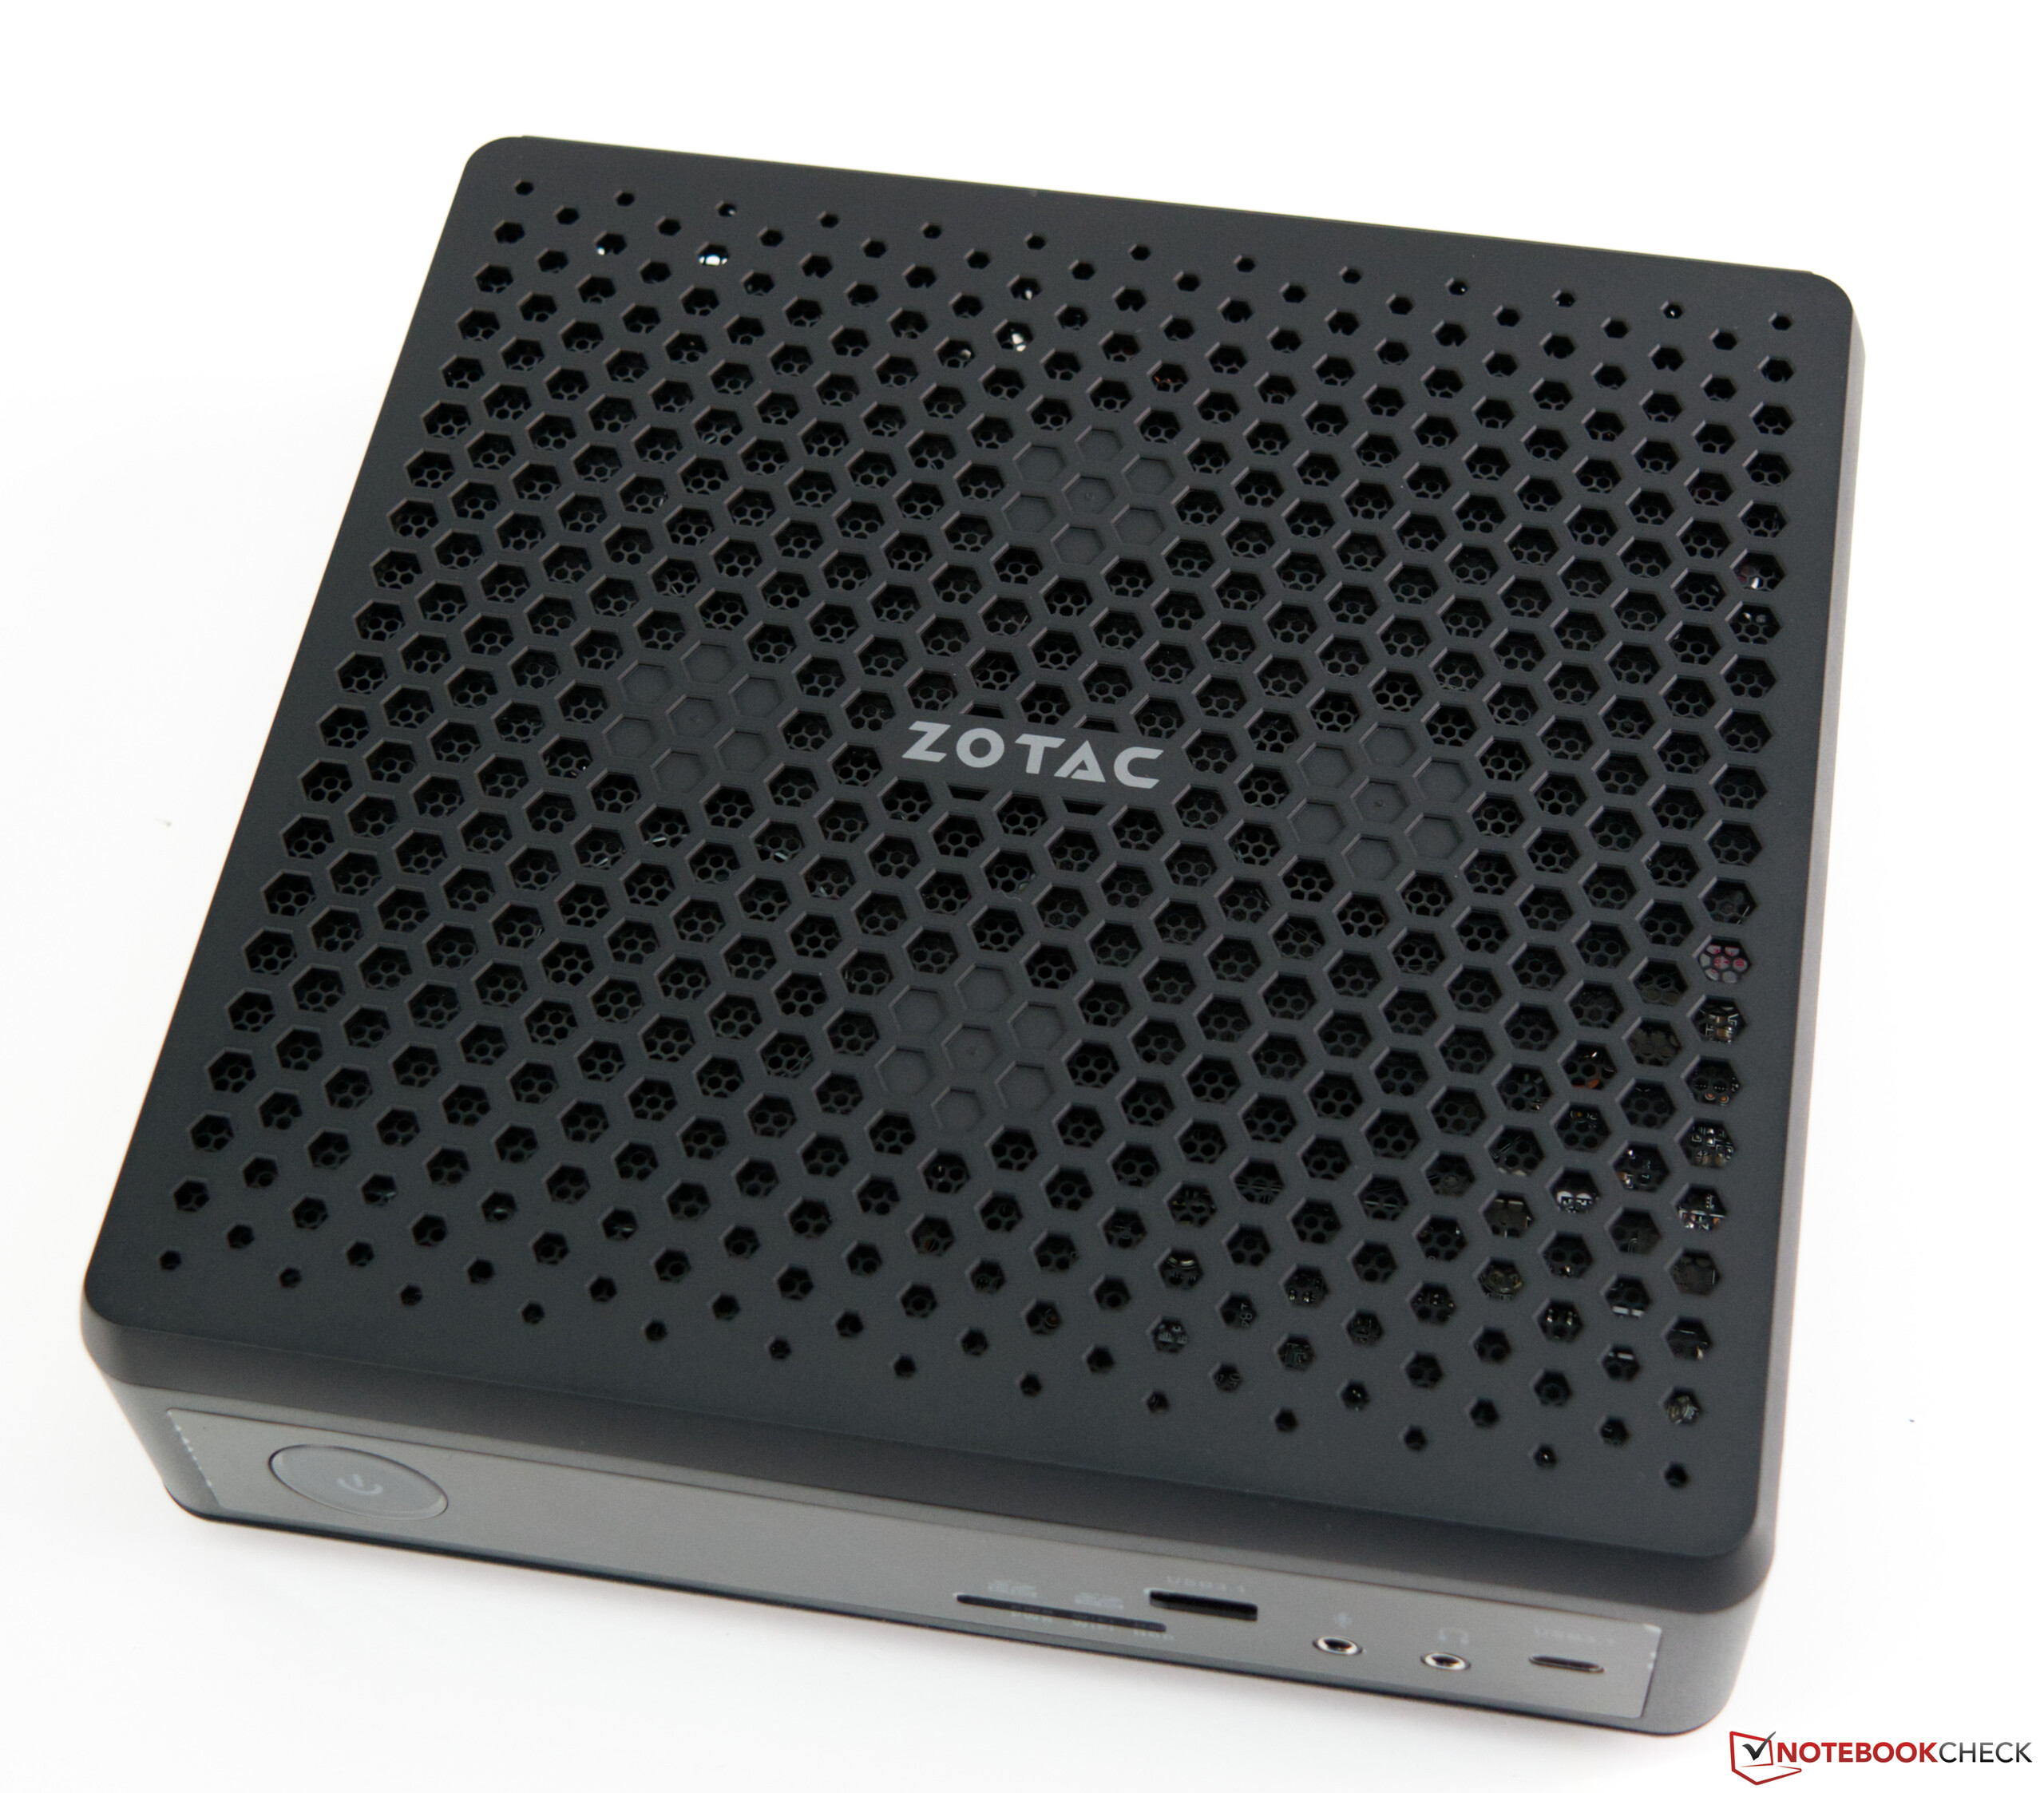
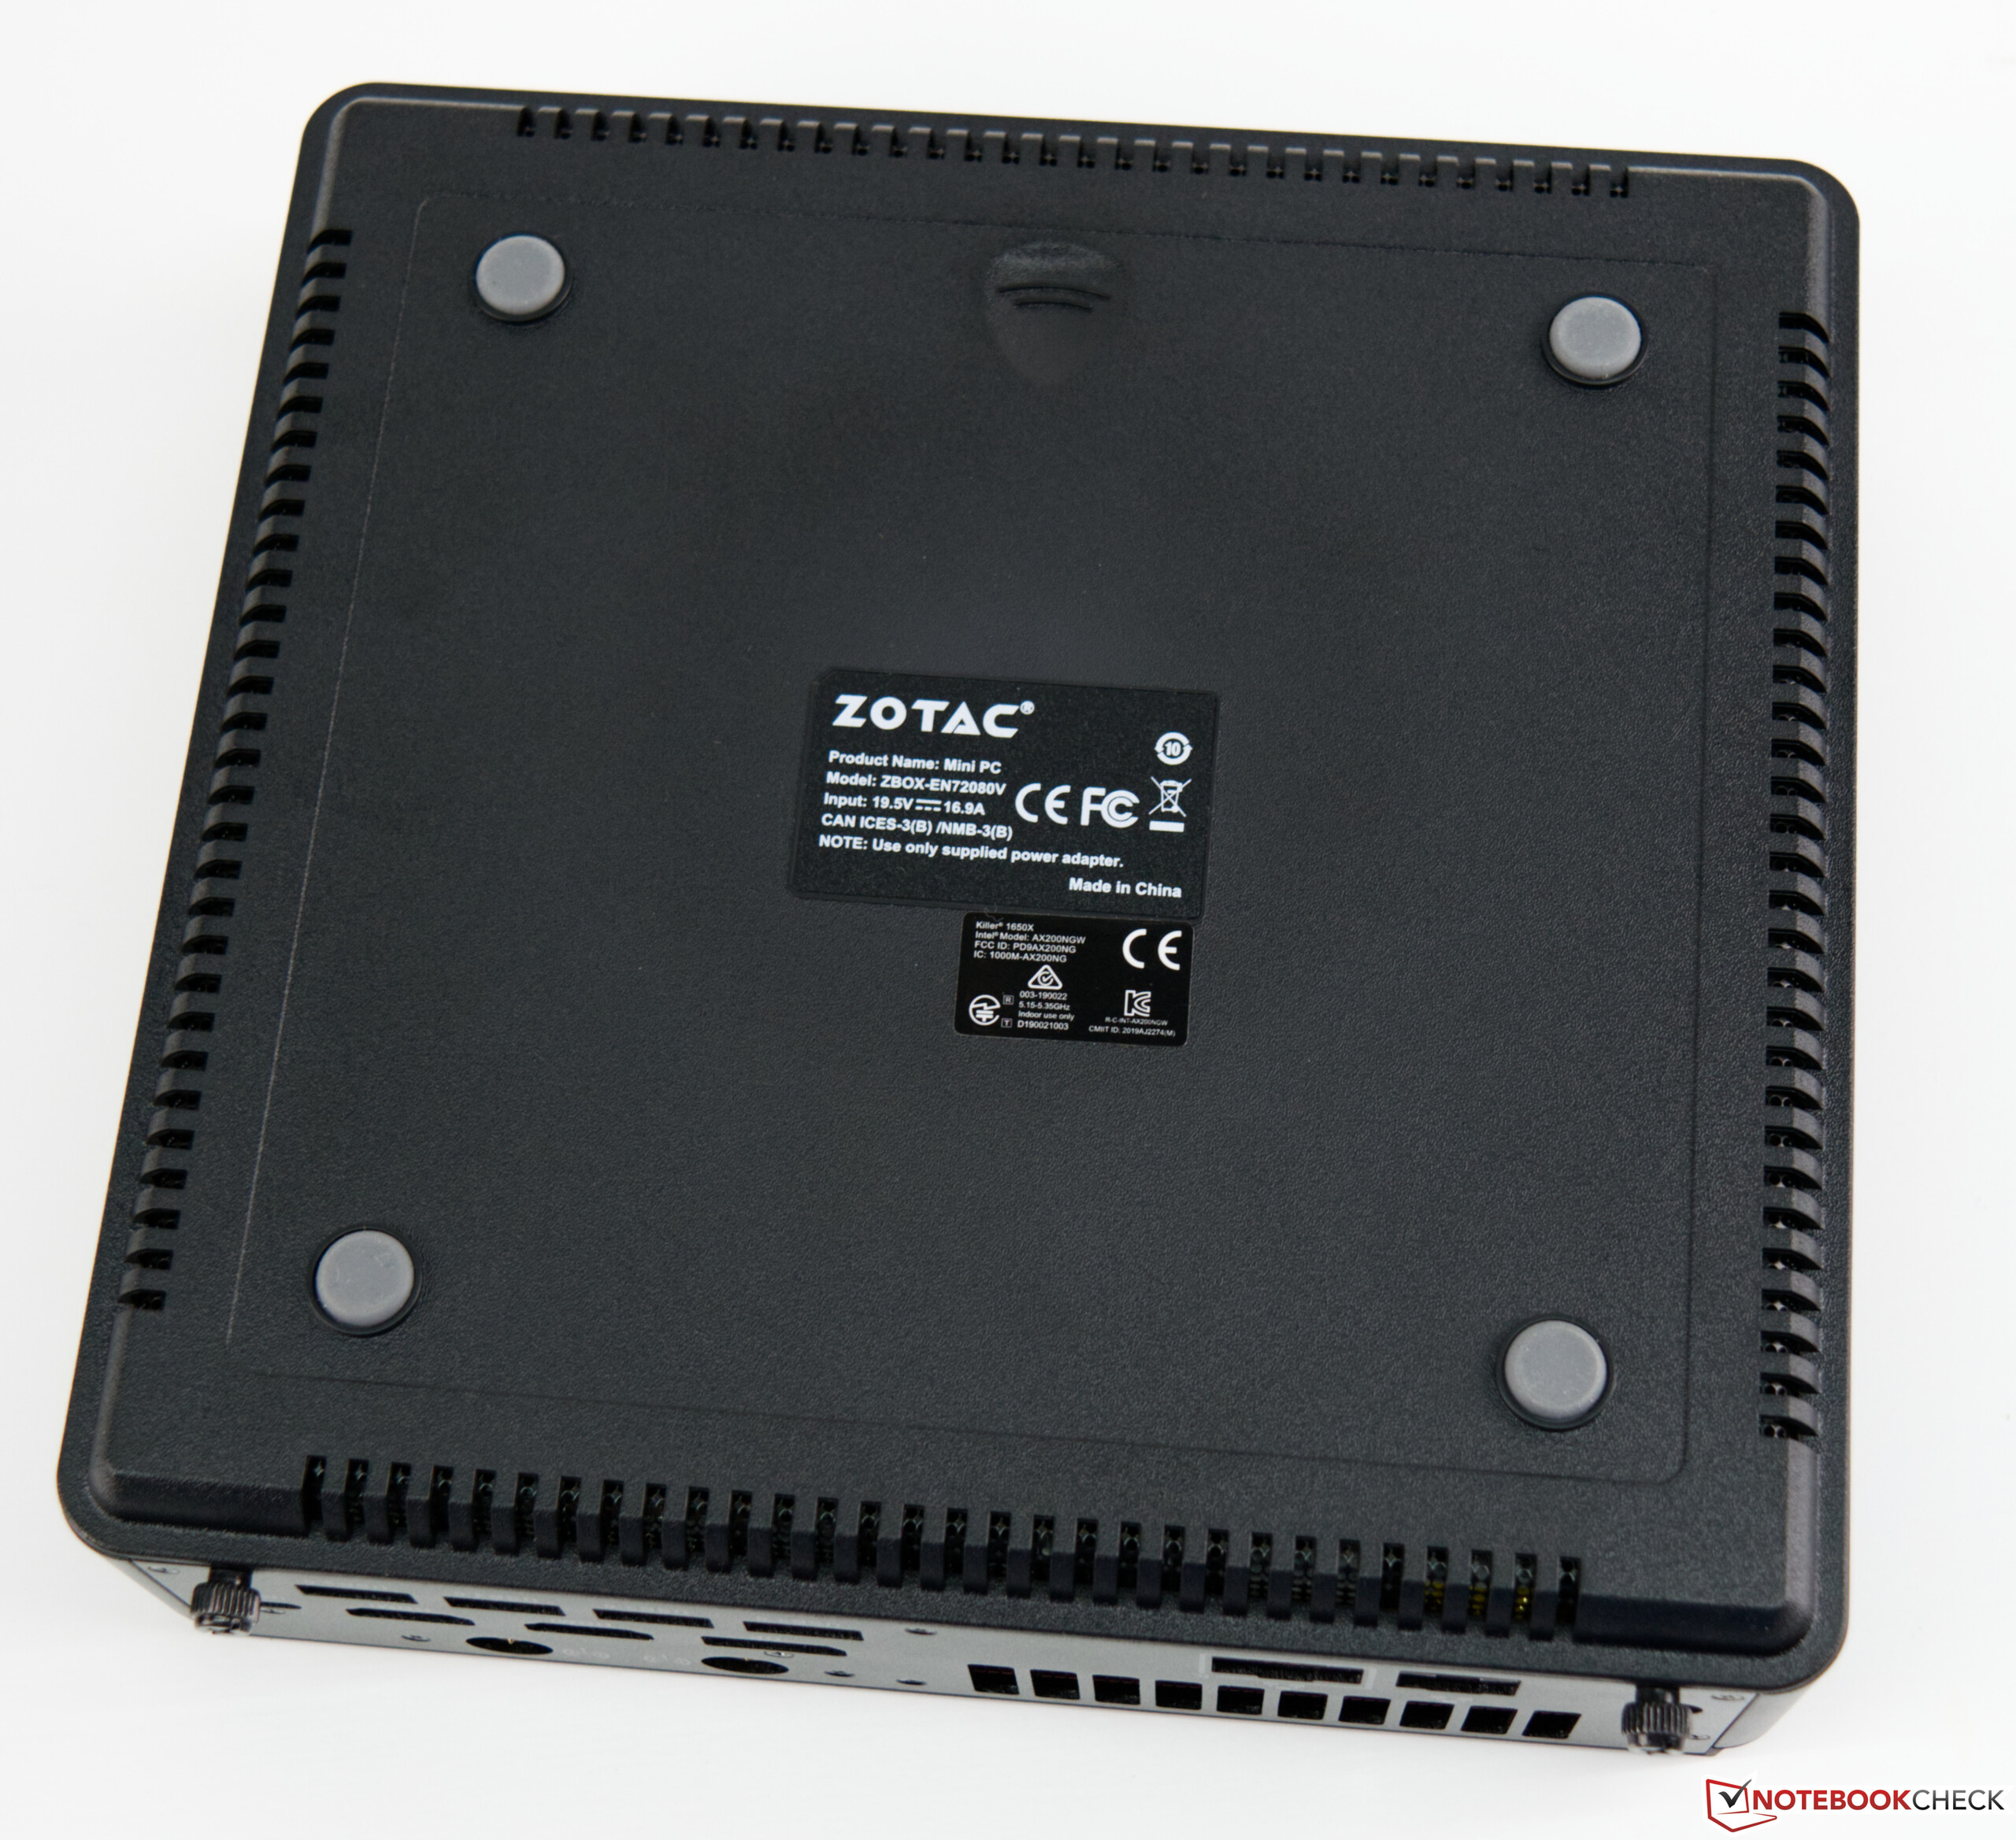
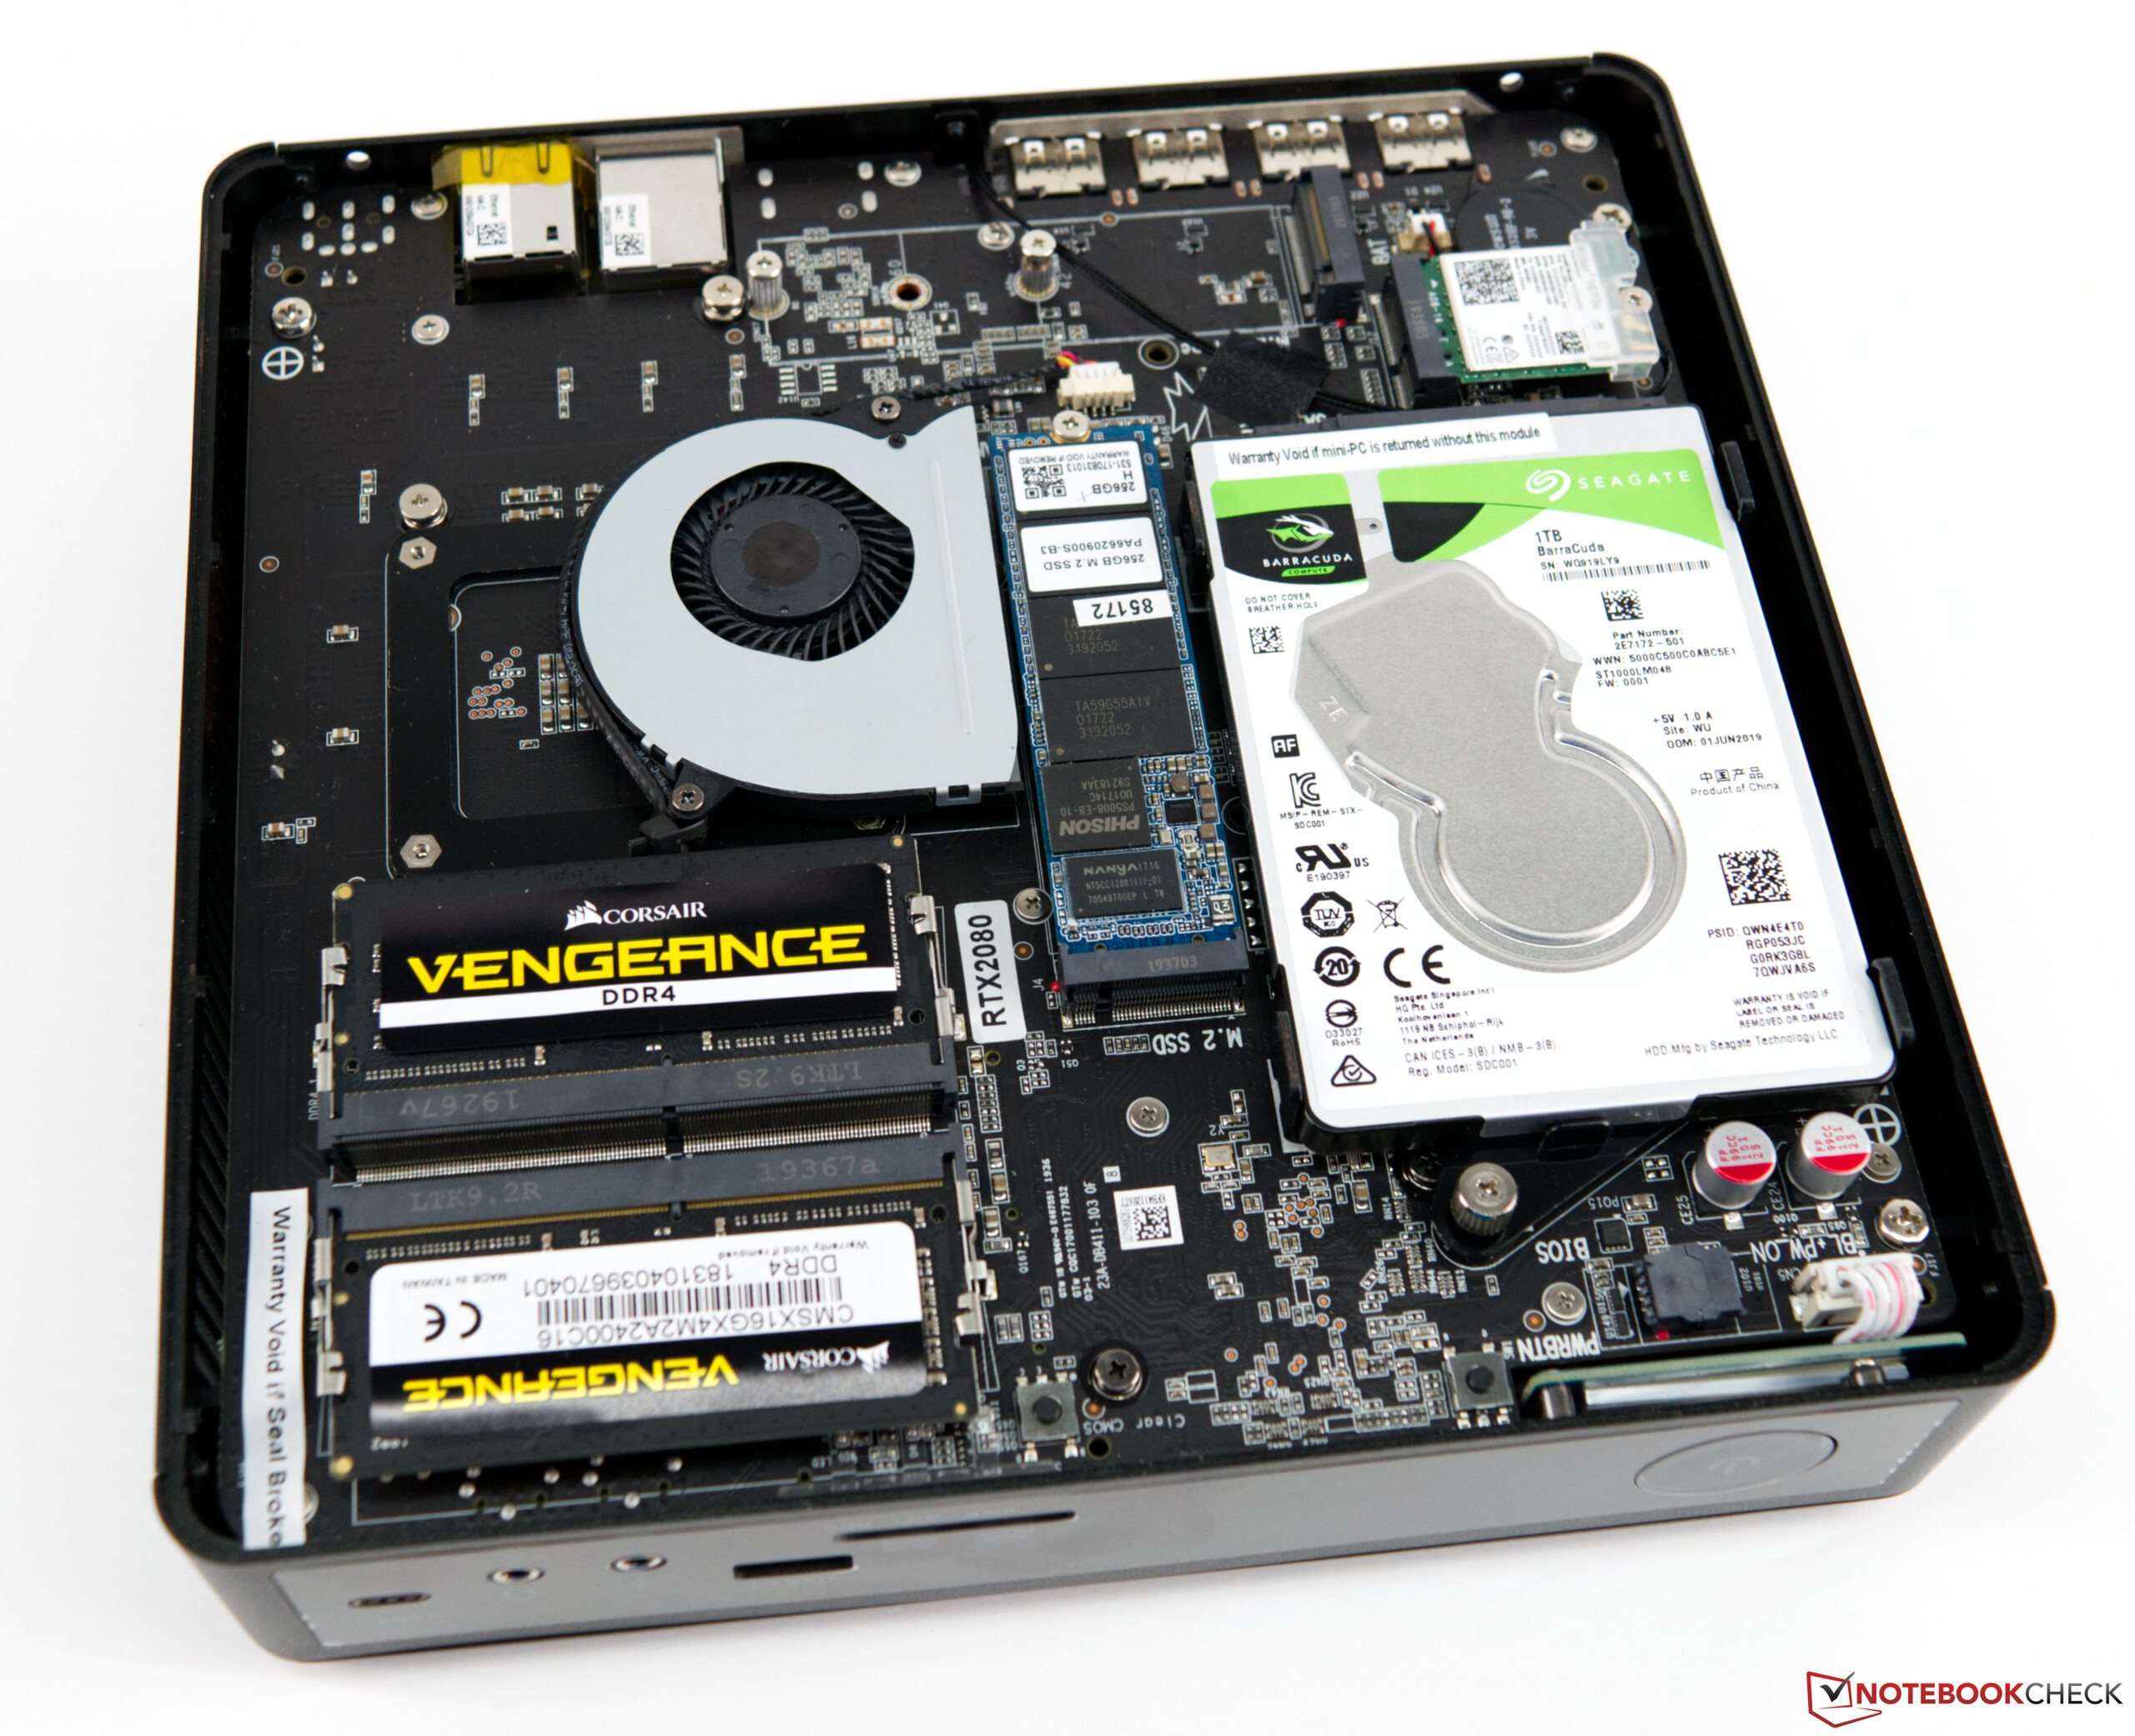
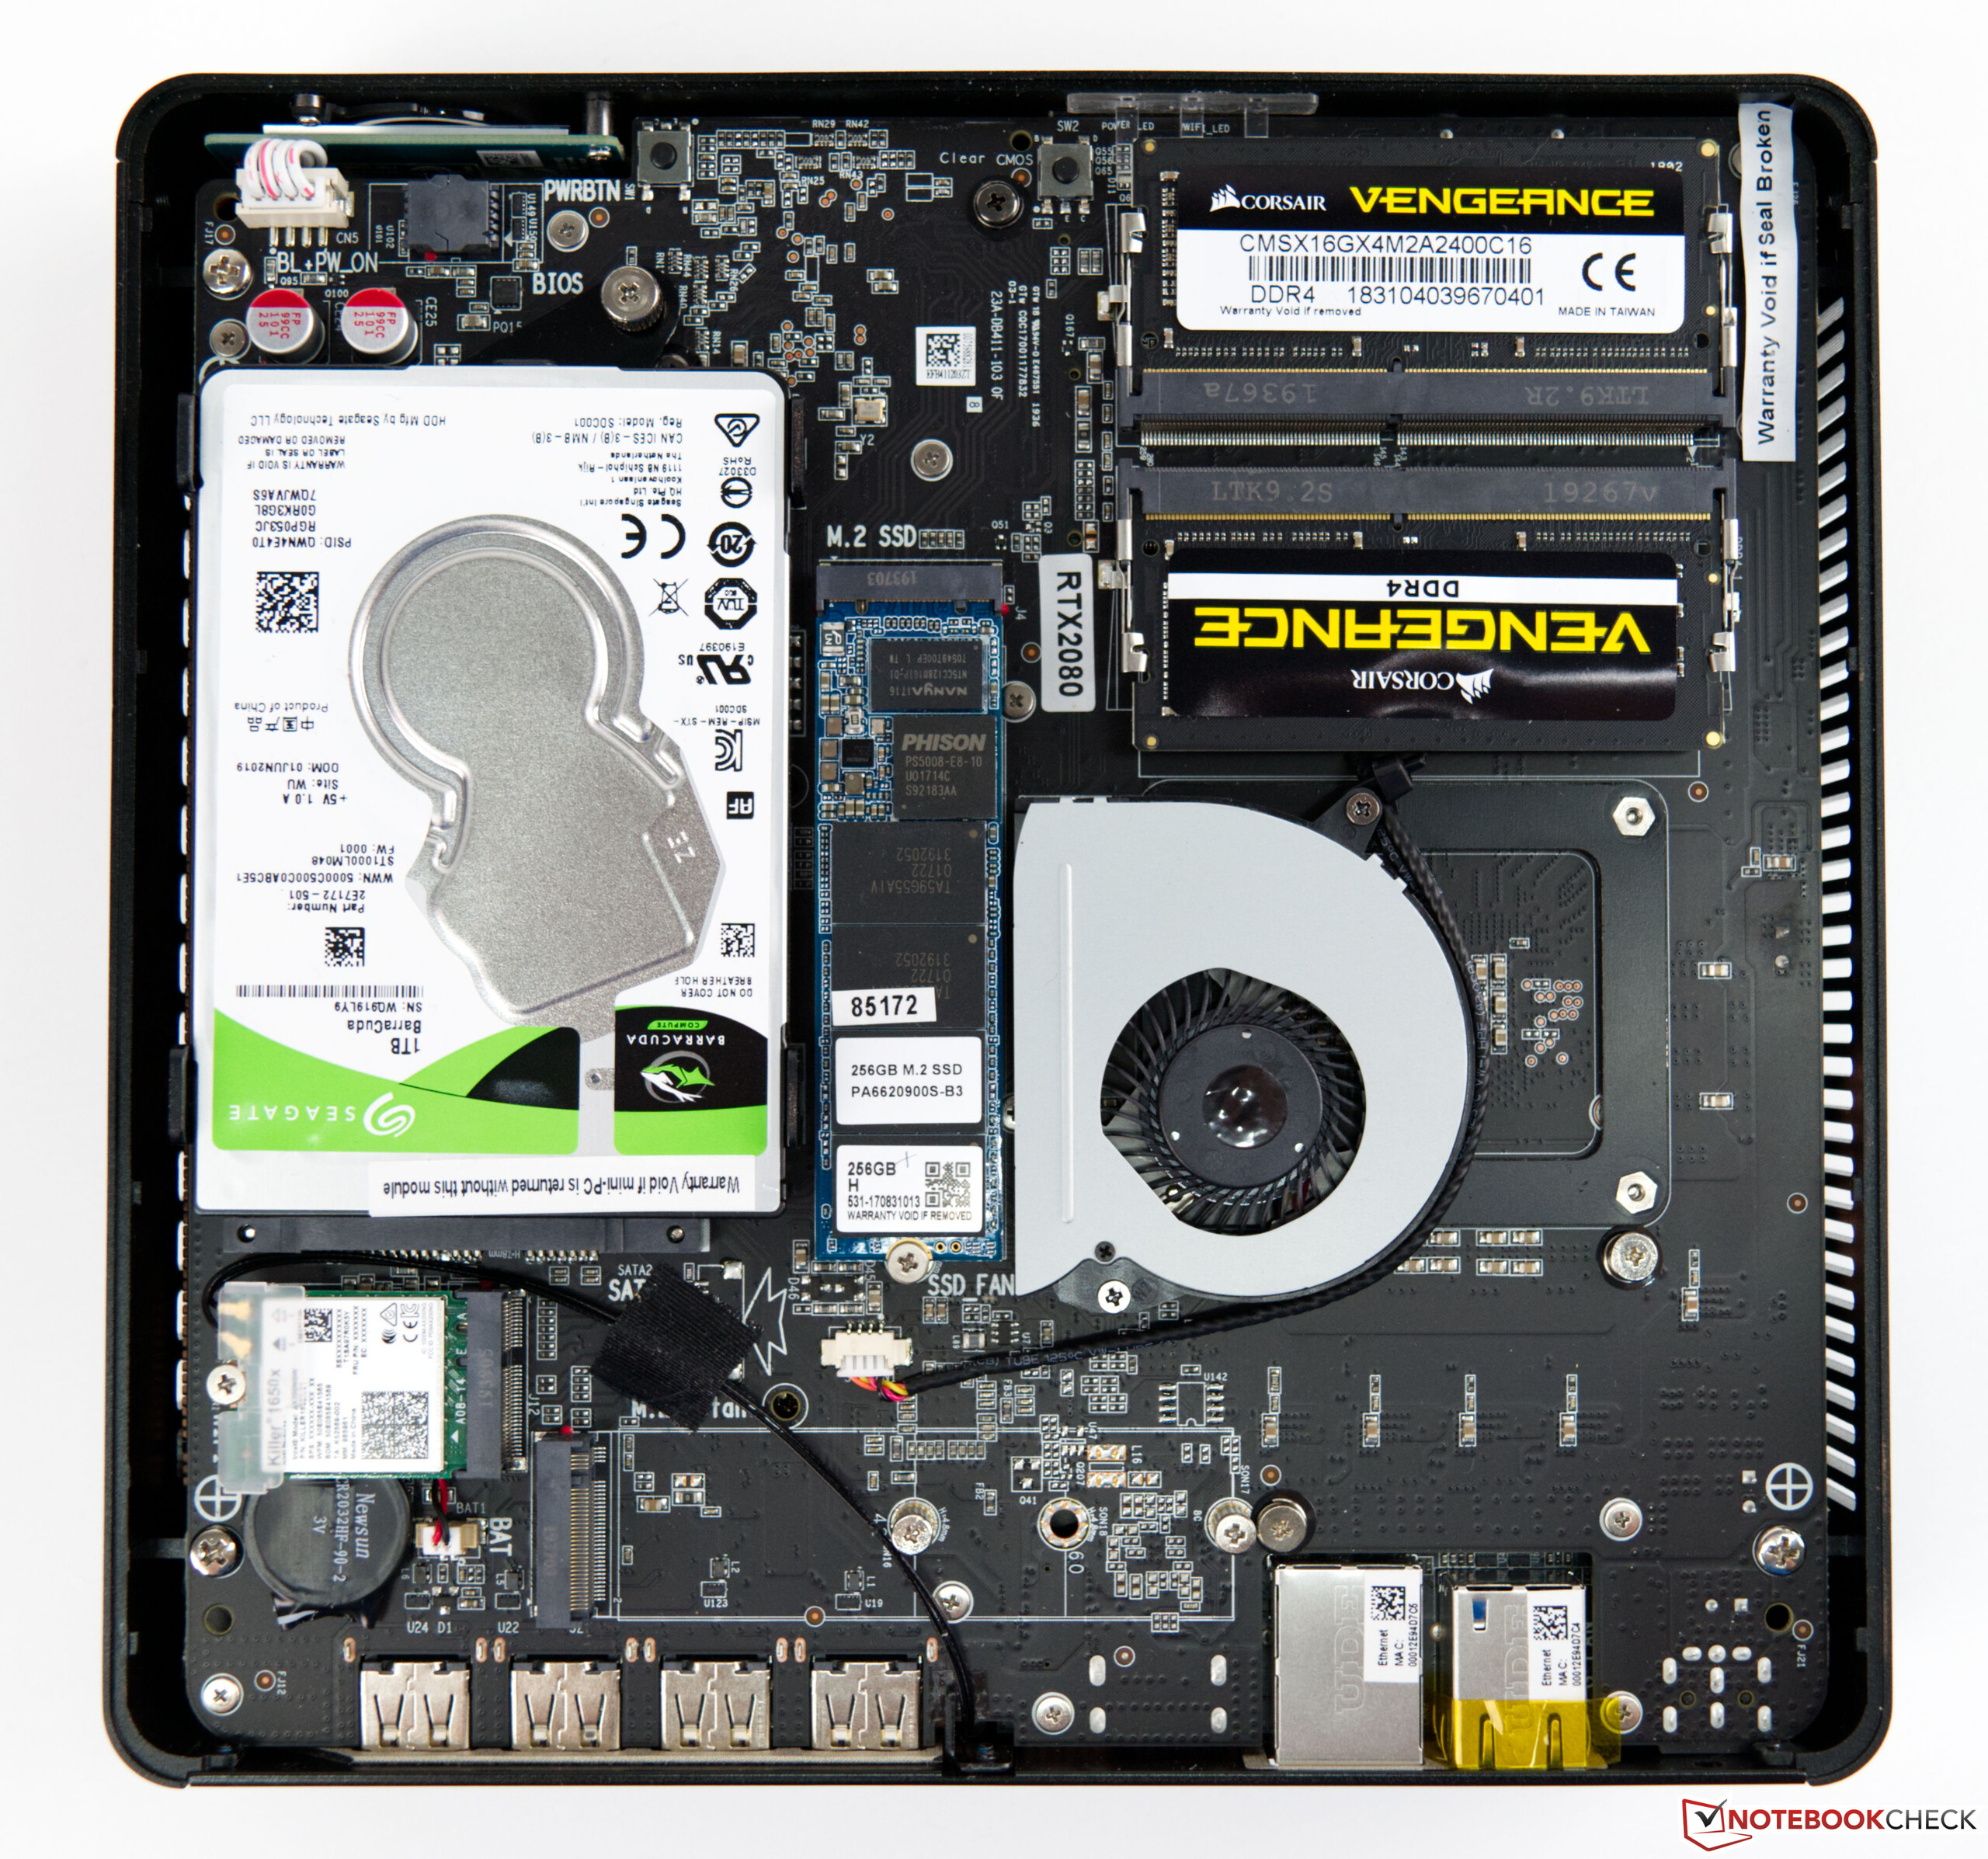
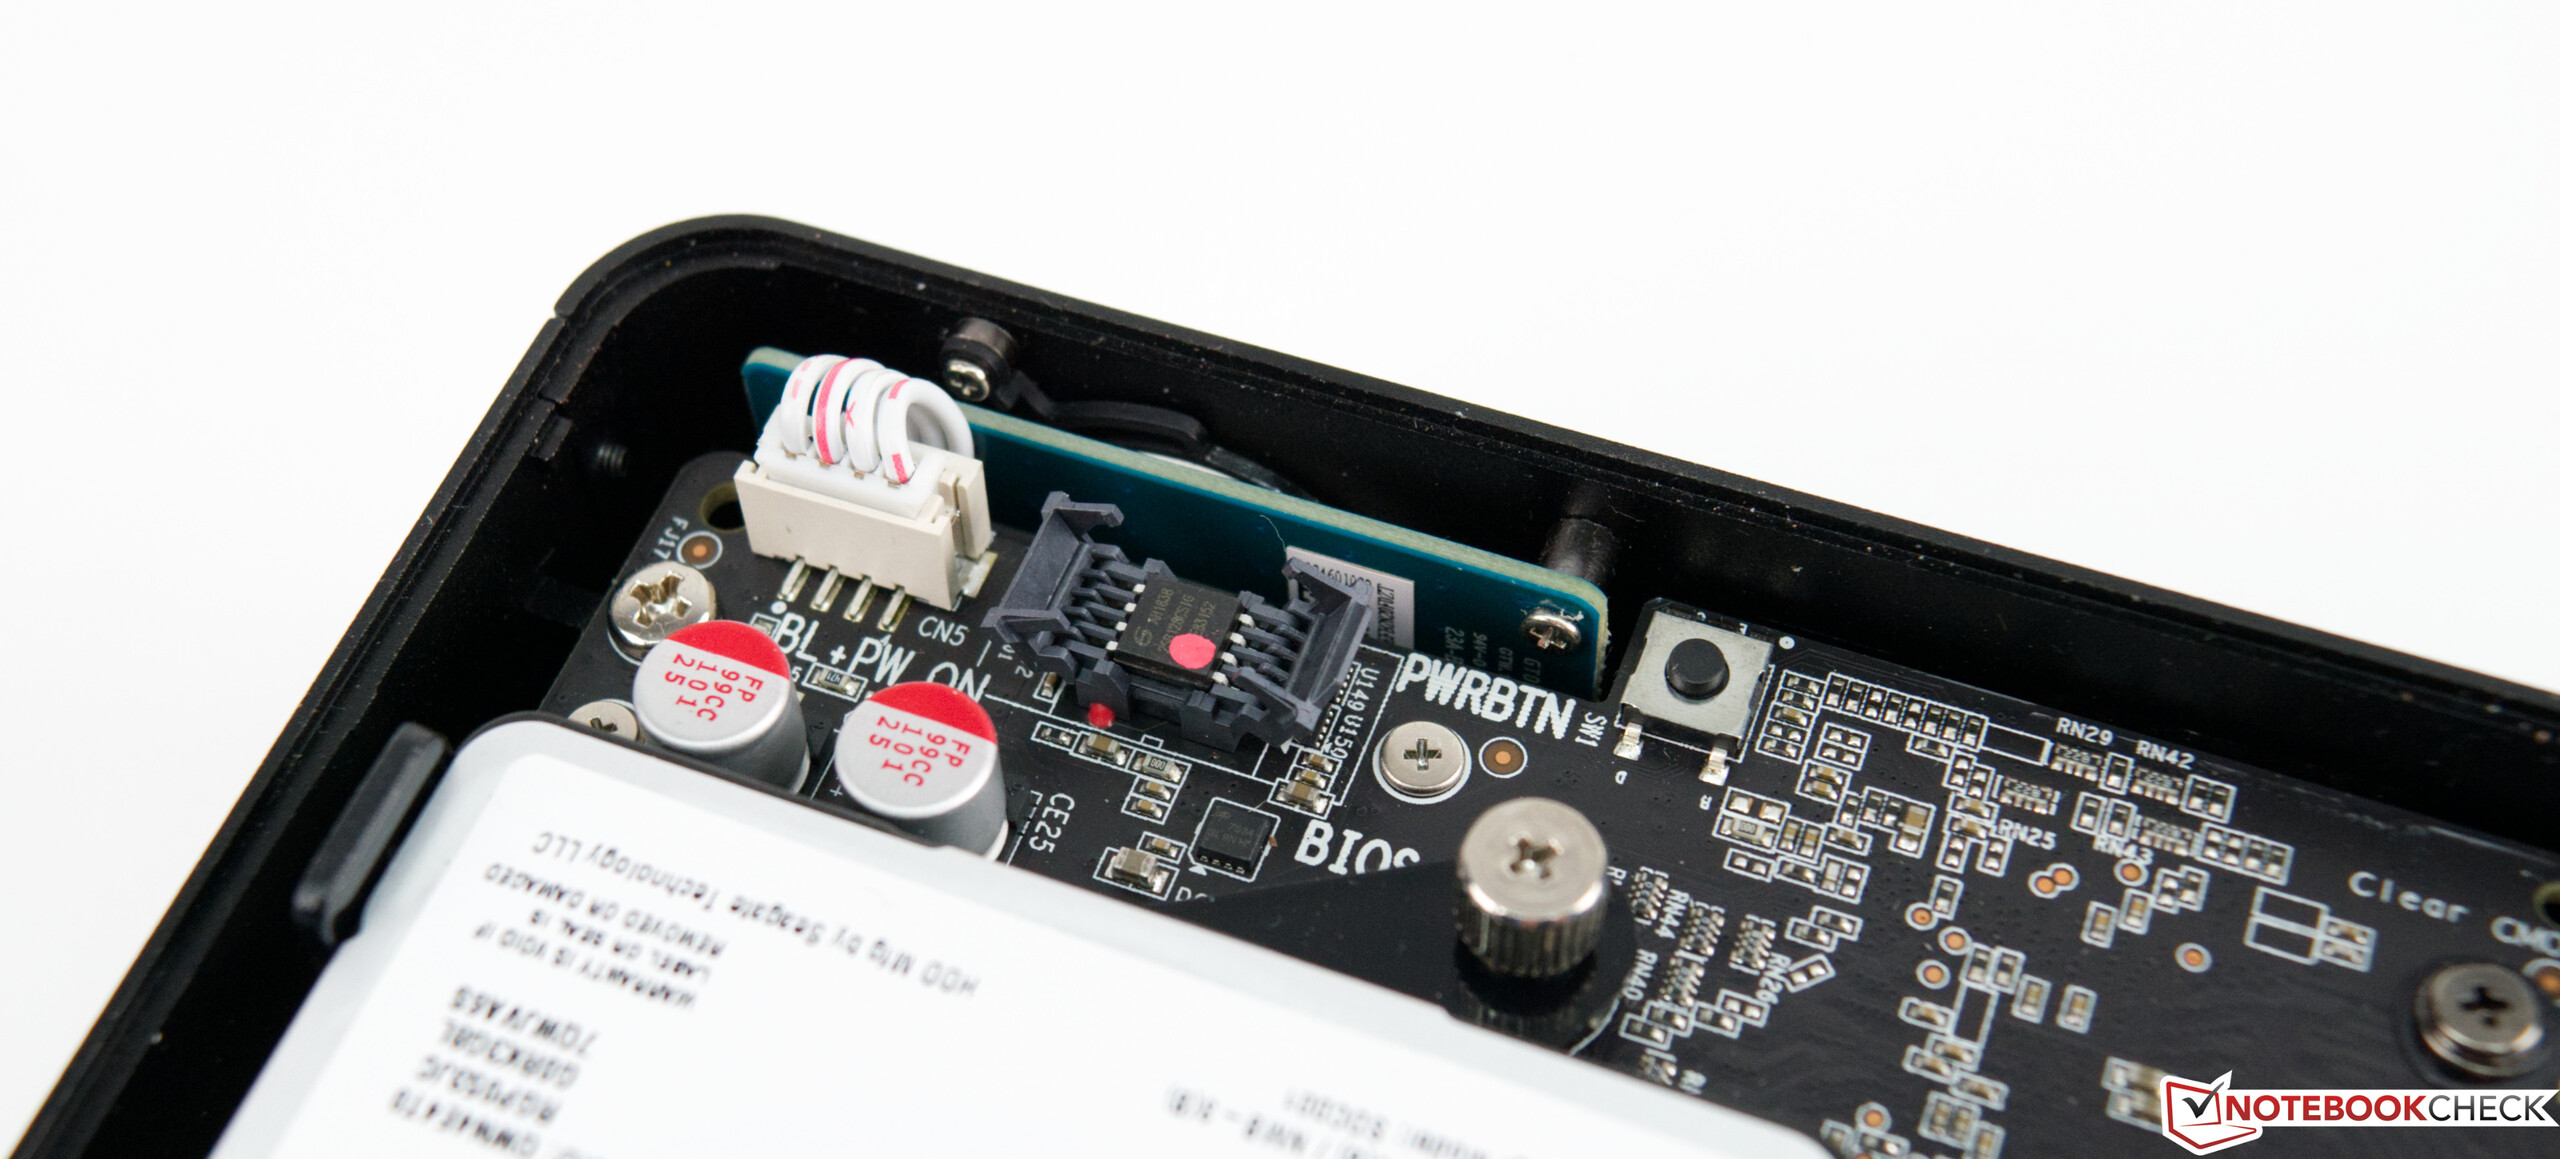
O Zotac ZBOX Magnus não é um PC qualquer pré-fabricado, mas como um sistema barebone, oferece ao usuário a possibilidade de completar o dispositivo de acordo com suas necessidades. Você pode escolher os dispositivos de armazenamento e o tipo de memória livremente. Infelizmente, os usuários são limitados no que diz respeito ao processador e à placa de vídeo, porque atualizar esses componentes posteriormente não é possível.
Testamos o ZBOX Magnus com o Intel Core i7-9750H em combinação com a Nvidia GeForce RTX 2080 Mobile. Em termos de desempenho puro, você pode rodar todos os jogos modernos sem problemas com o pequeno PC sem ter que sacrificar detalhes. No entanto, a resolução WQHD é necessária. O ZBOX também domina muitos títulos em UHD, embora muitas vezes você precise reduzir os detalhes aqui. Por outro lado, a GeForce RTX 2080 Mobile oferece quase o mesmo desempenho que a GeForce RTX 2070 de Desktop.
O Zotac ZBOX Magnus é um poderoso PC para jogos no formato mini. No entanto, antes de comprá-lo, você deve se familiarizar com as peculiaridades de um sistema barebone.
O sistema oferece uma grande vantagem em termos de volume. Dispositivos muito compactos costumam ser muito barulhentos e sofrem forte geração de calor. No geral, Zotac tem um controle muito bom do problema de calor, e o nível de ruído sob carga também é bom com pouco menos de 39 dB(A).
Aqueles que desejam investir 1.700 Euros (~$2.004) no sistema barebone agora sabem as vantagens e desvantagens que o ZBOX Magnus oferece. Em termos de preço, tanto Intel com Ghost Canyon NUC quanto Zotac com ZBOX Magnus não cedem facilmente. No entanto, deve-se considerar que o Ghost Canyon NUC não inclui uma placa de vídeo dedicada no preço de compra. Consequentemente, esse ponto claramente vai para a Zotac.
