Palit GeForce RTX 4090 GameRock OC Desktop GPU revisão: Alto desempenho com preço a condizer

O novo top model da Nvidia leva o nome GeForce RTX 4090 e tem uma impressionante VRAM de 24 GB, como seu predecessor. Conseqüentemente, ela está se estabelecendo cada vez mais como padrão no segmento de placas gráficas de alto consumo. A AMD revelou recentemente o Radeon RX 7900 XTX, que está seguindo o mesmo modelo e vem equipado com 24 GB de VRAM.
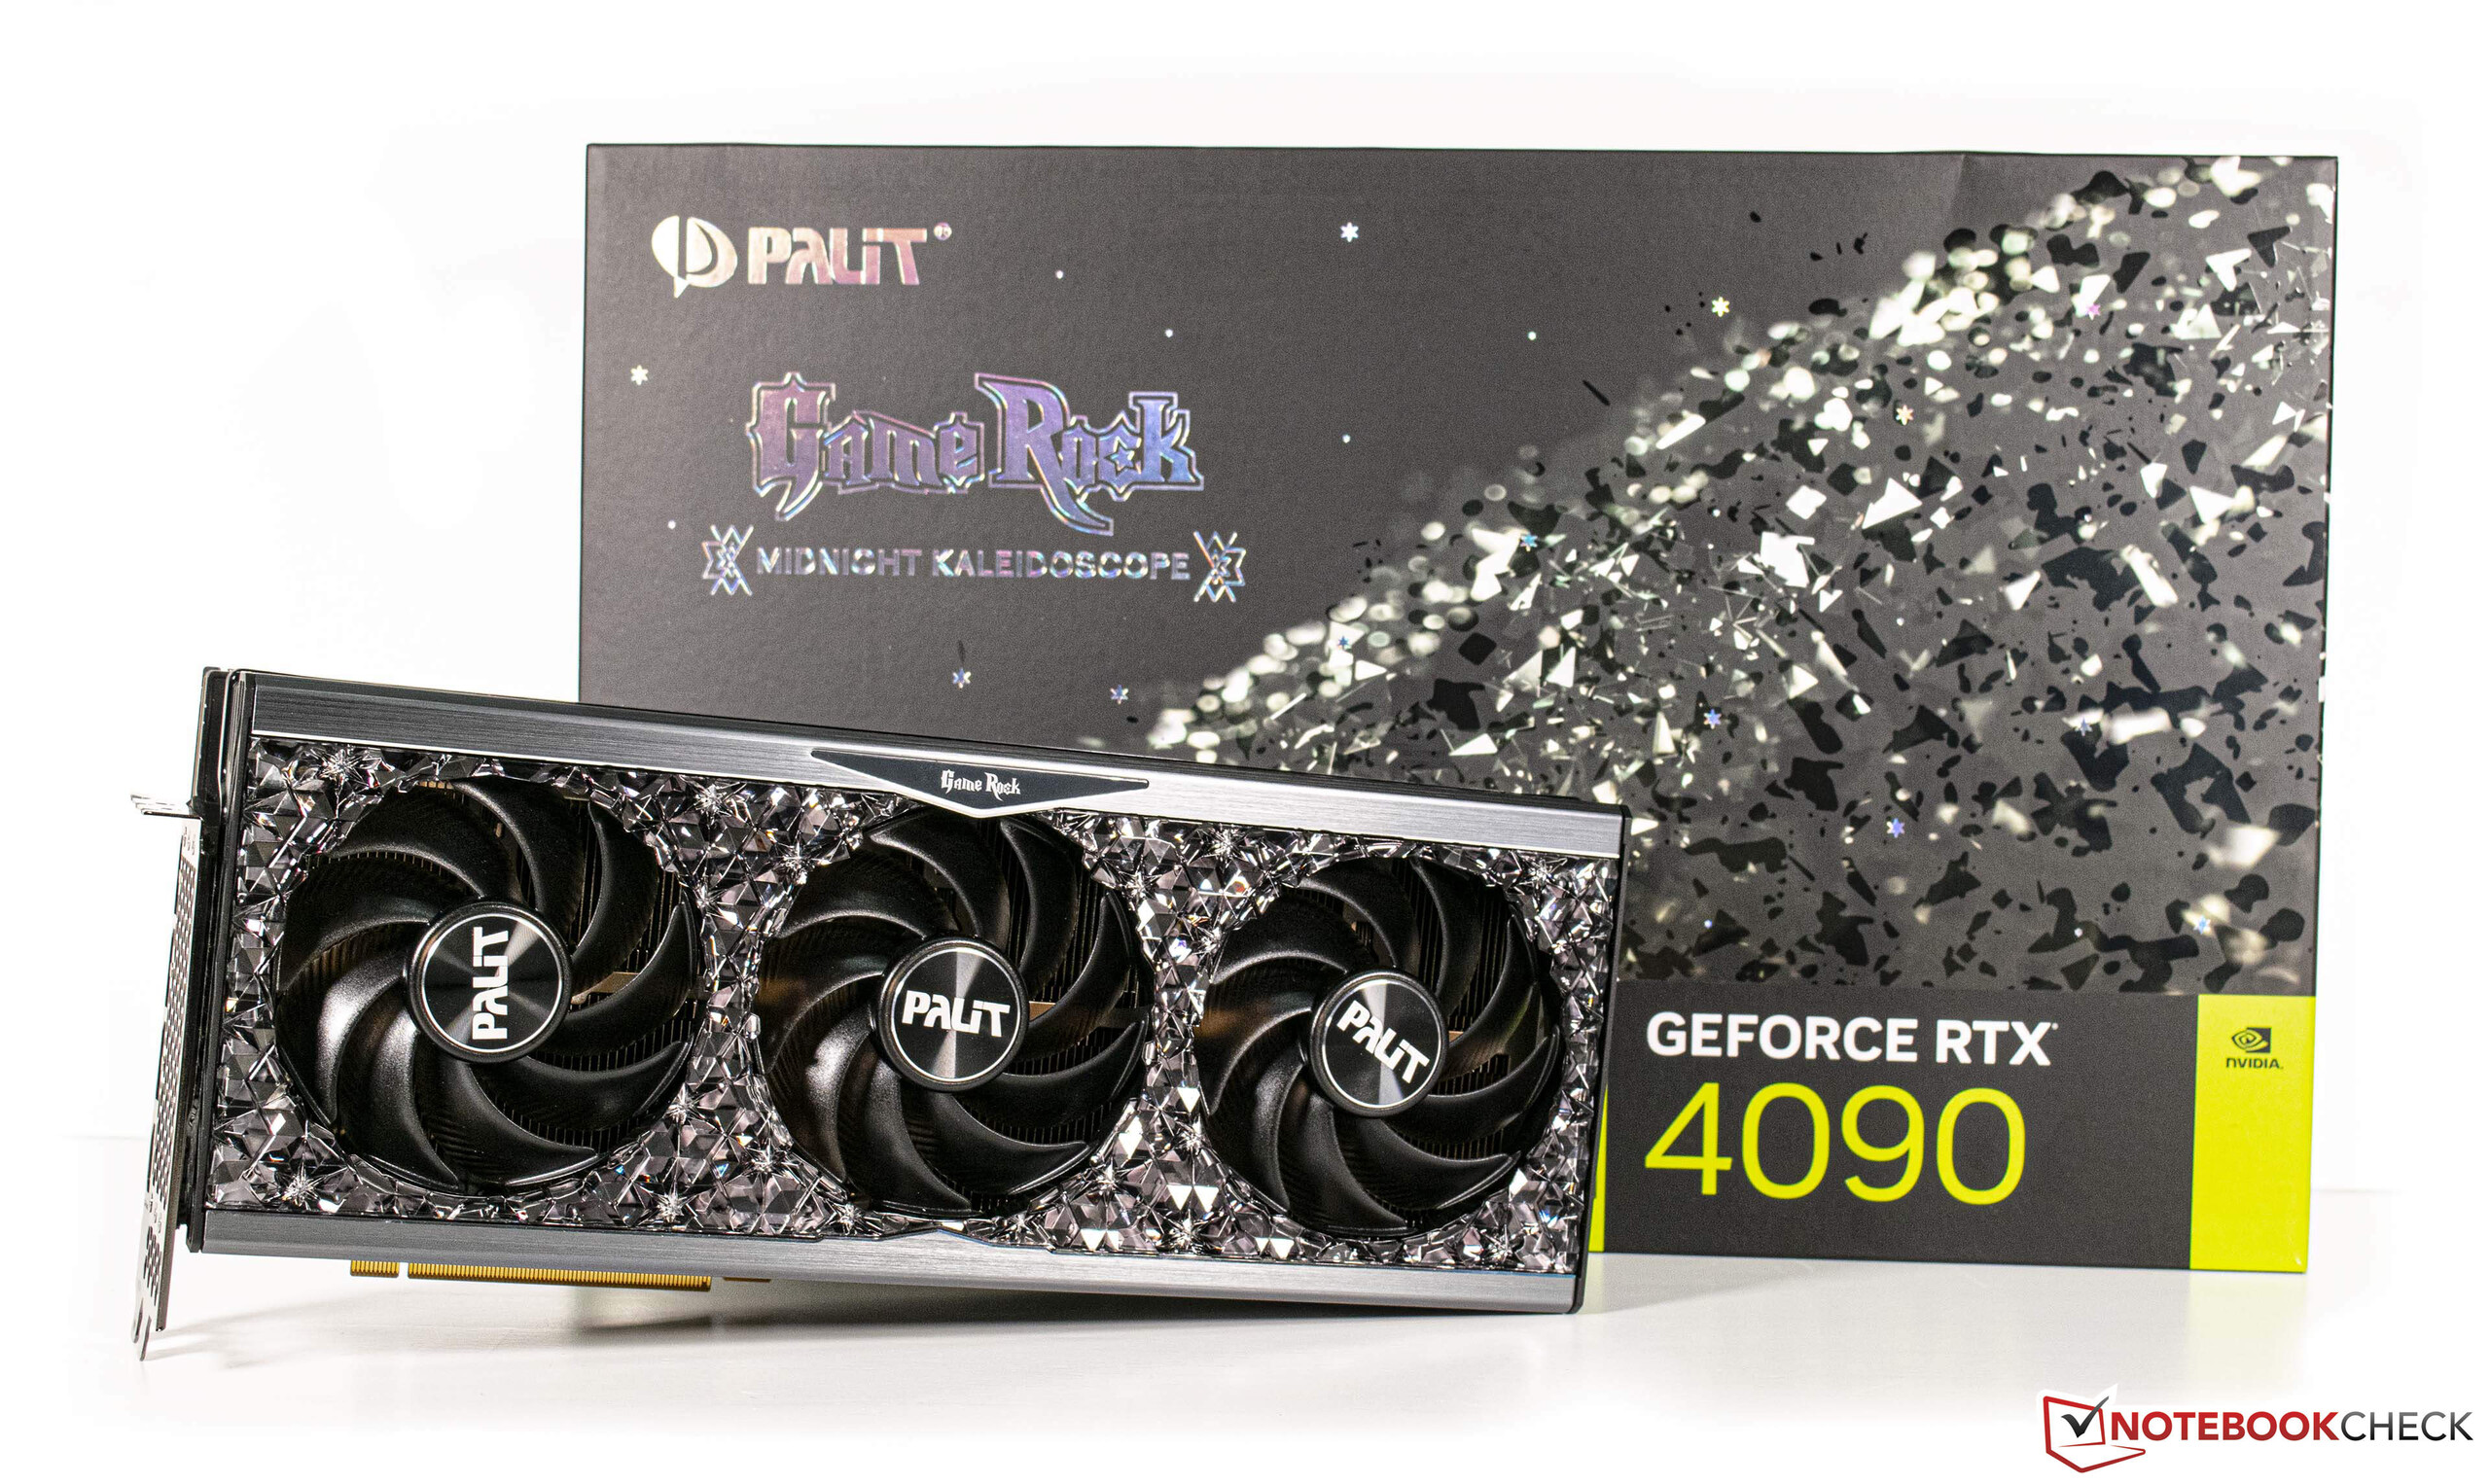
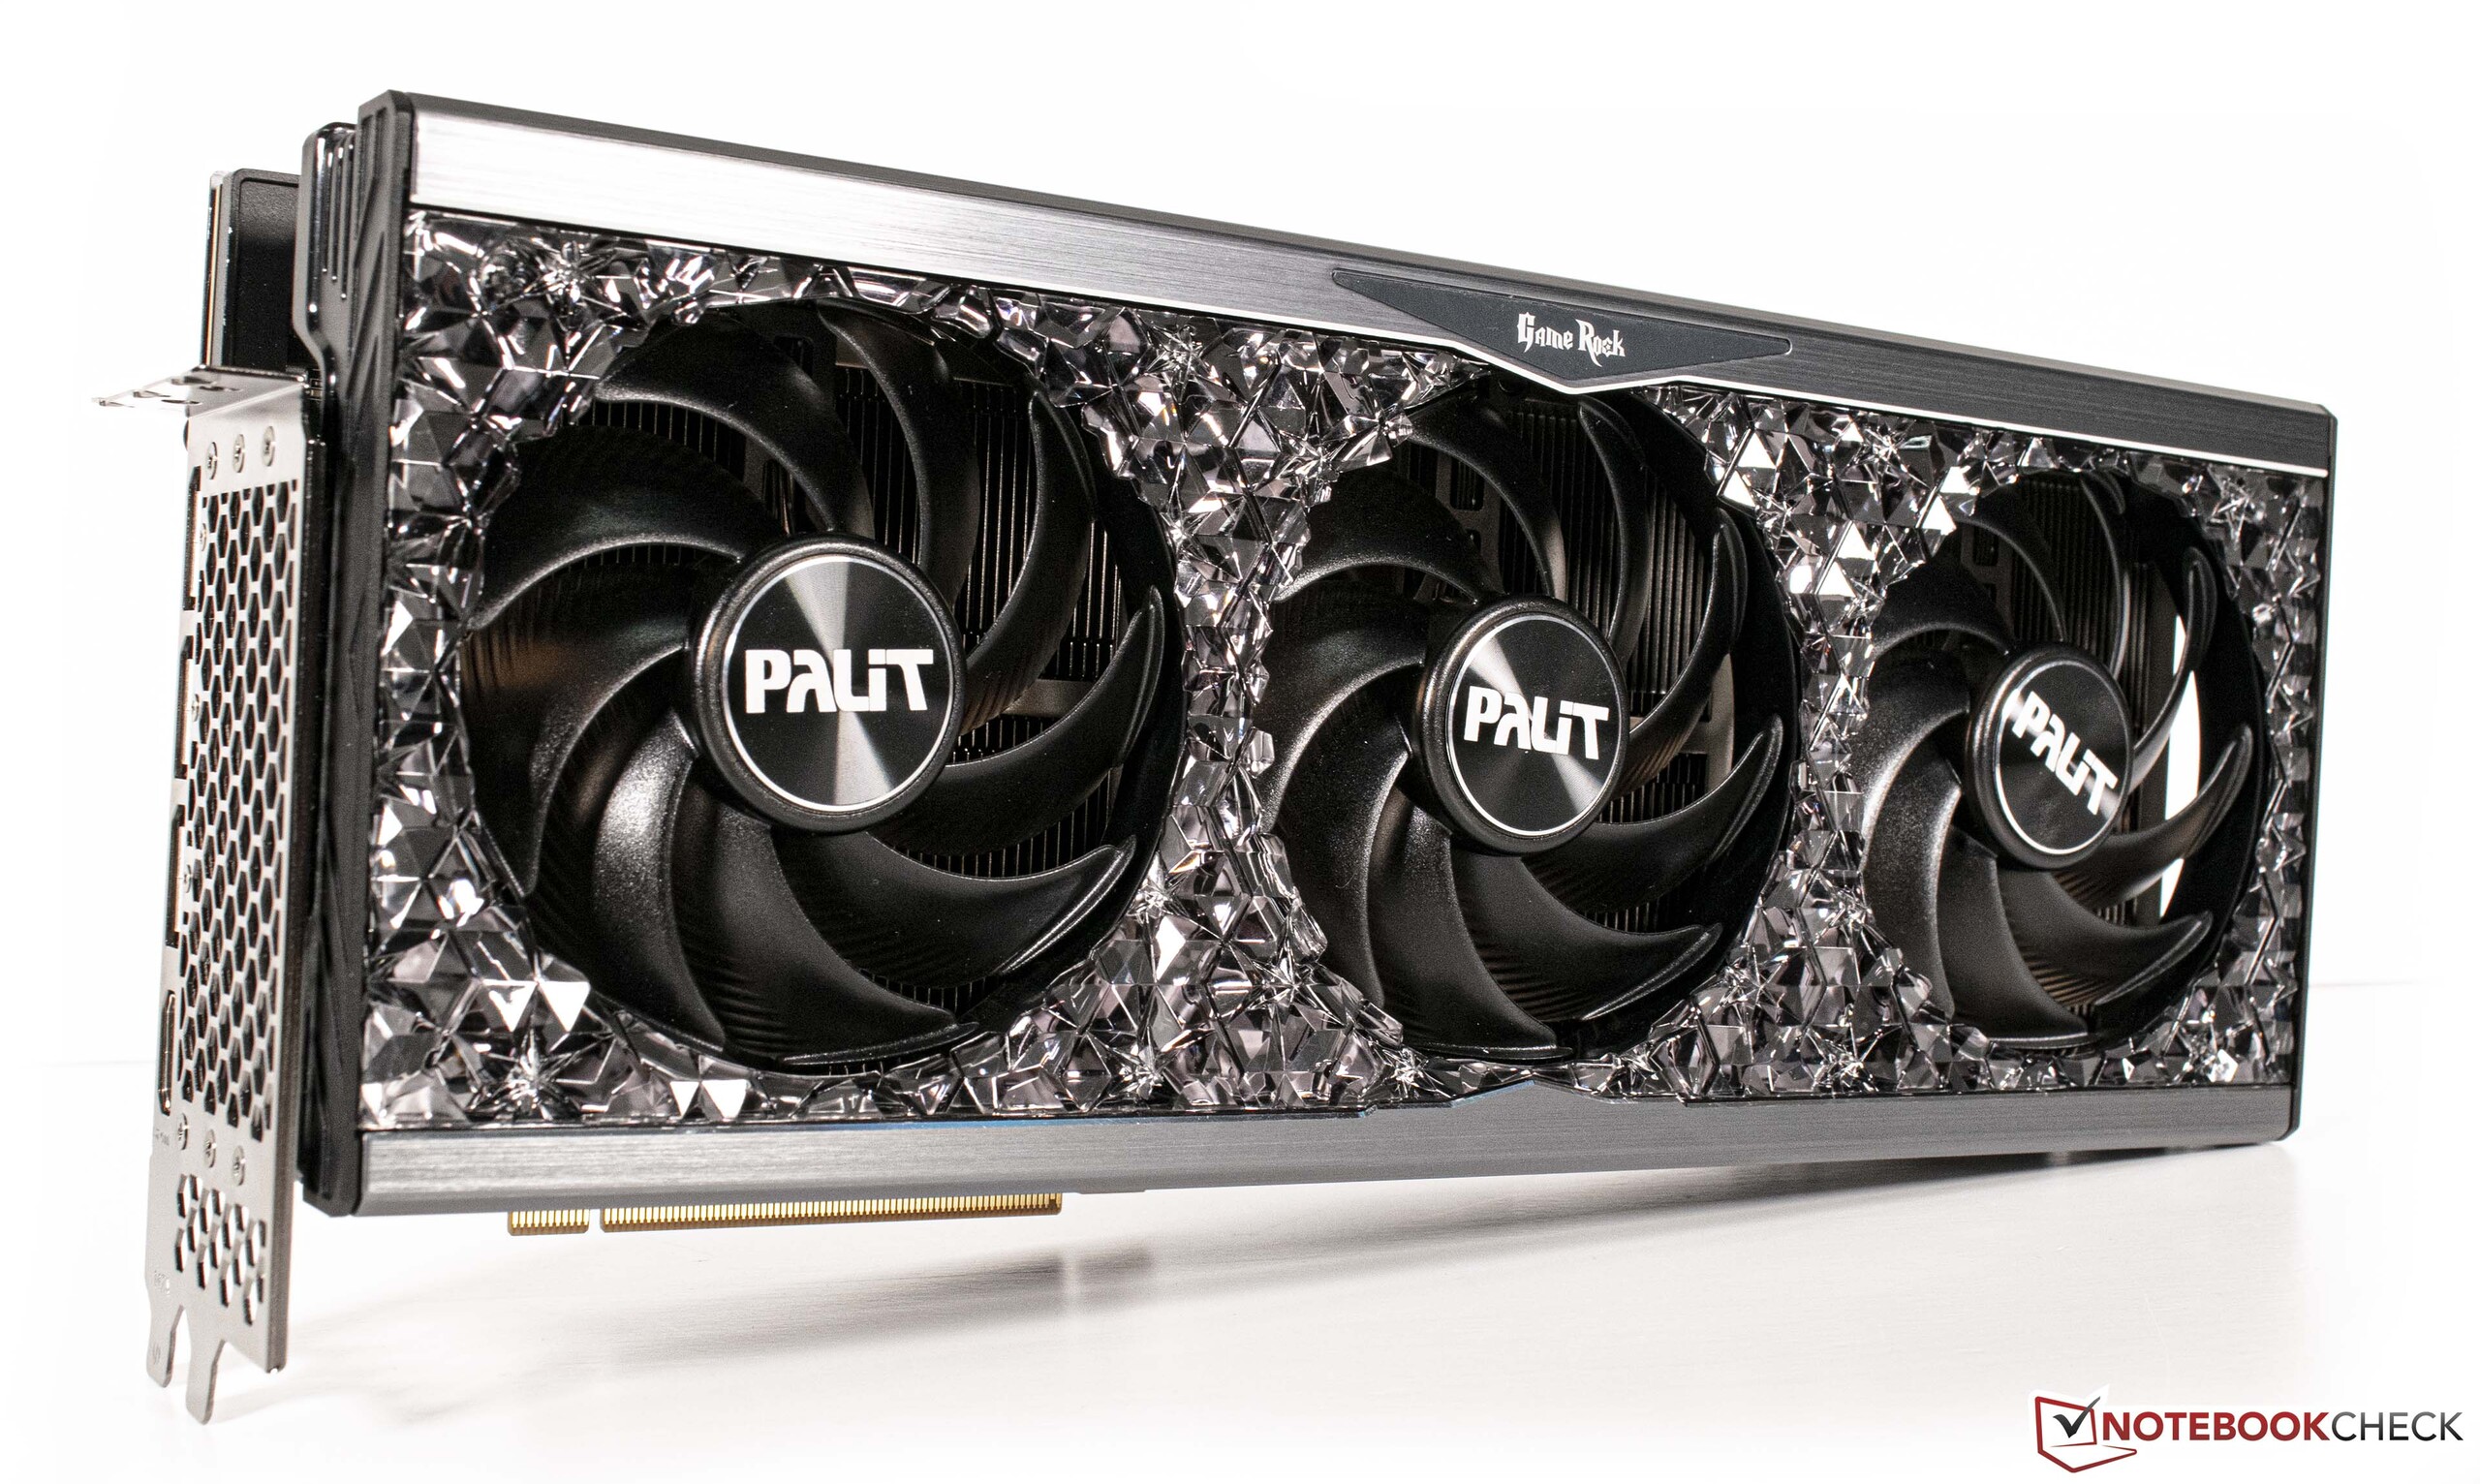
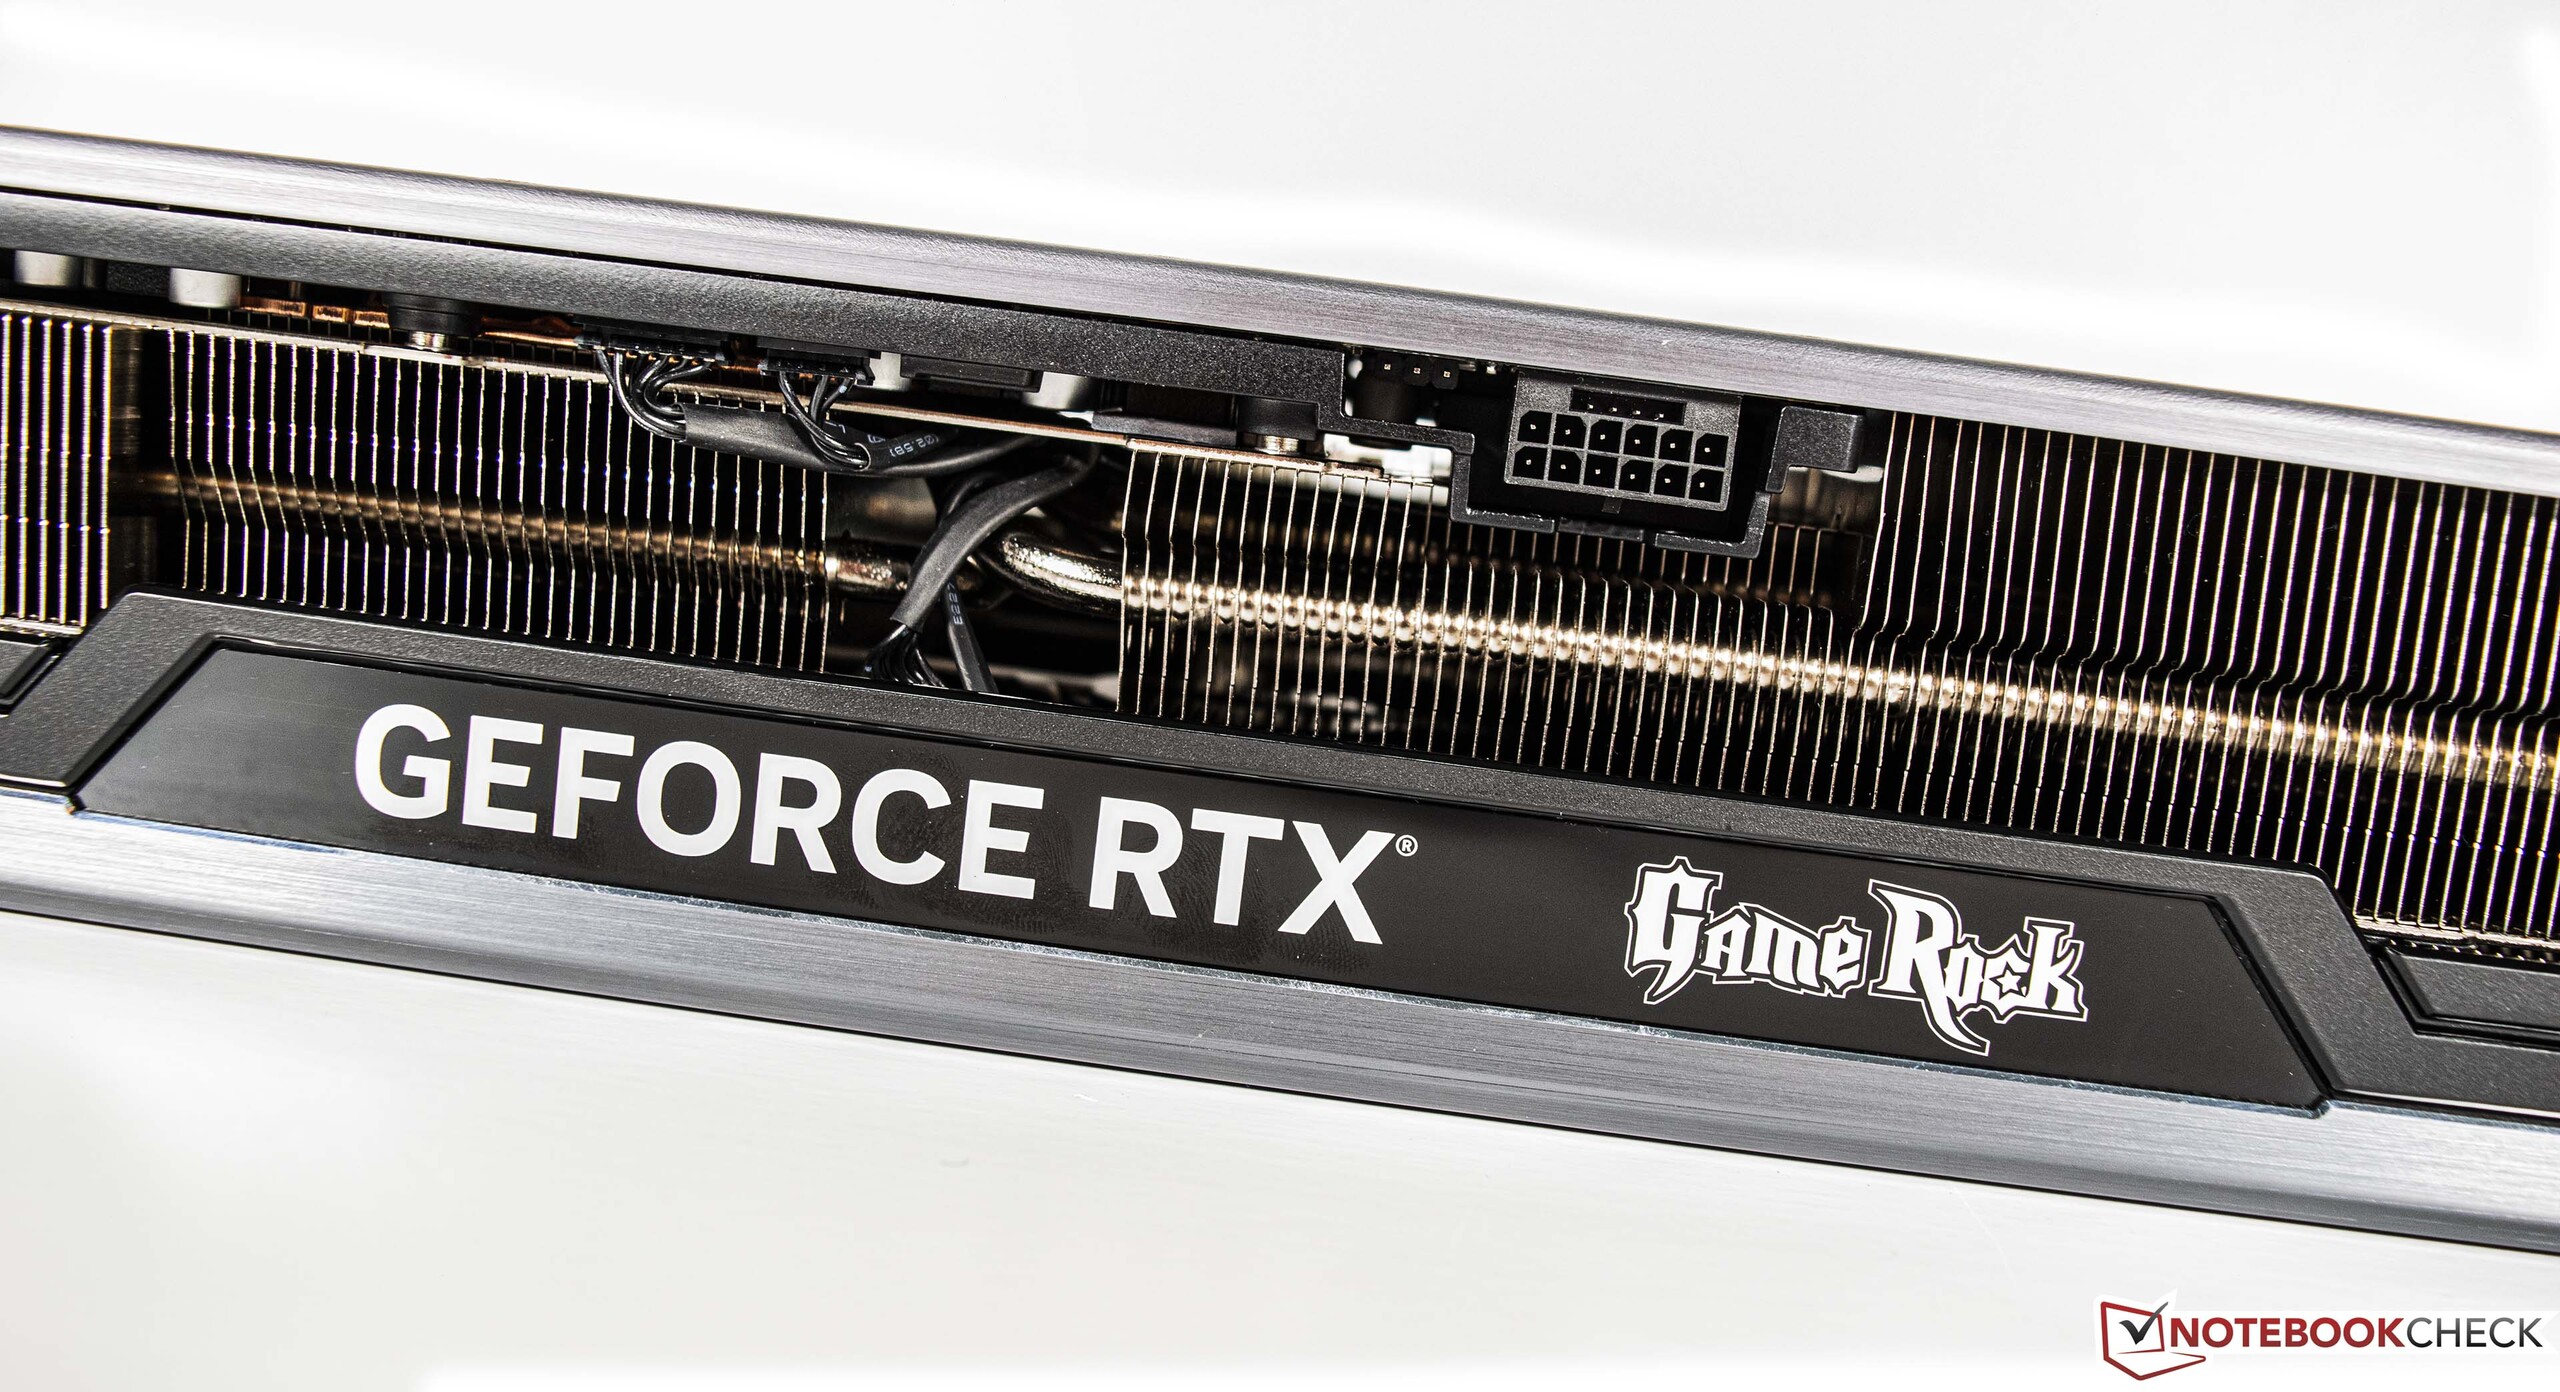
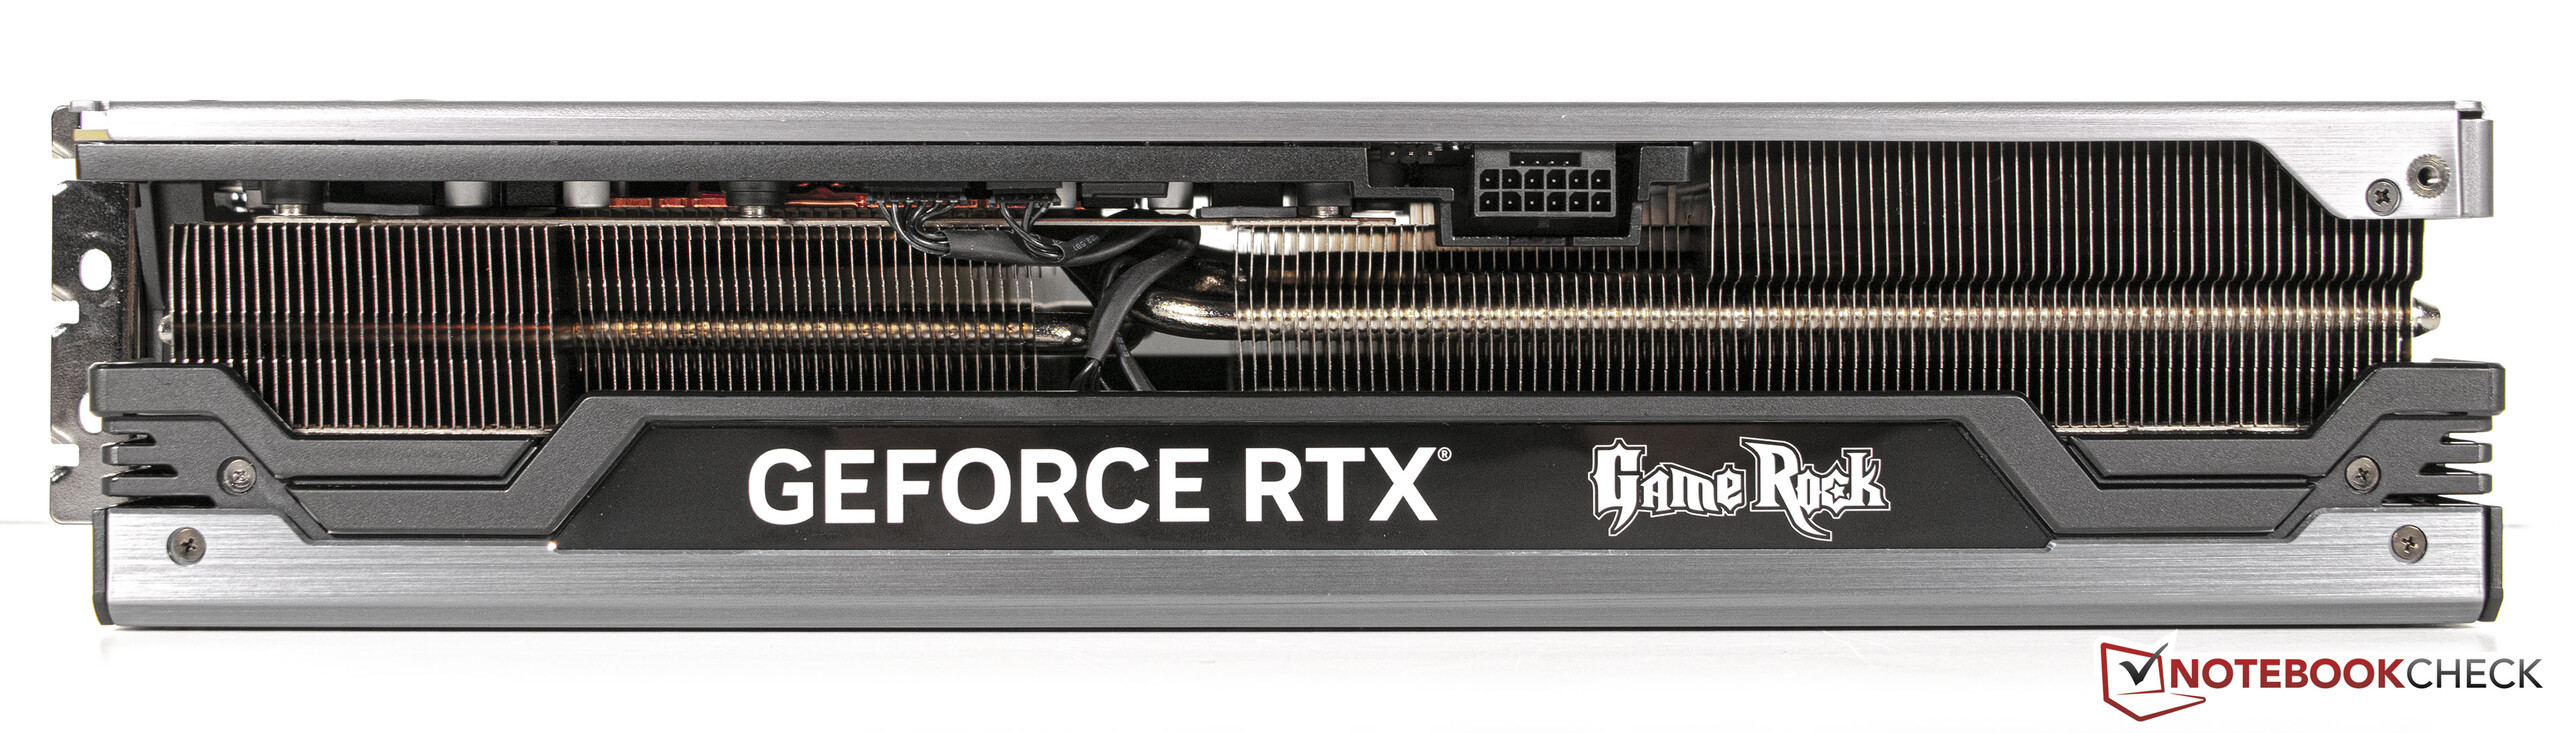
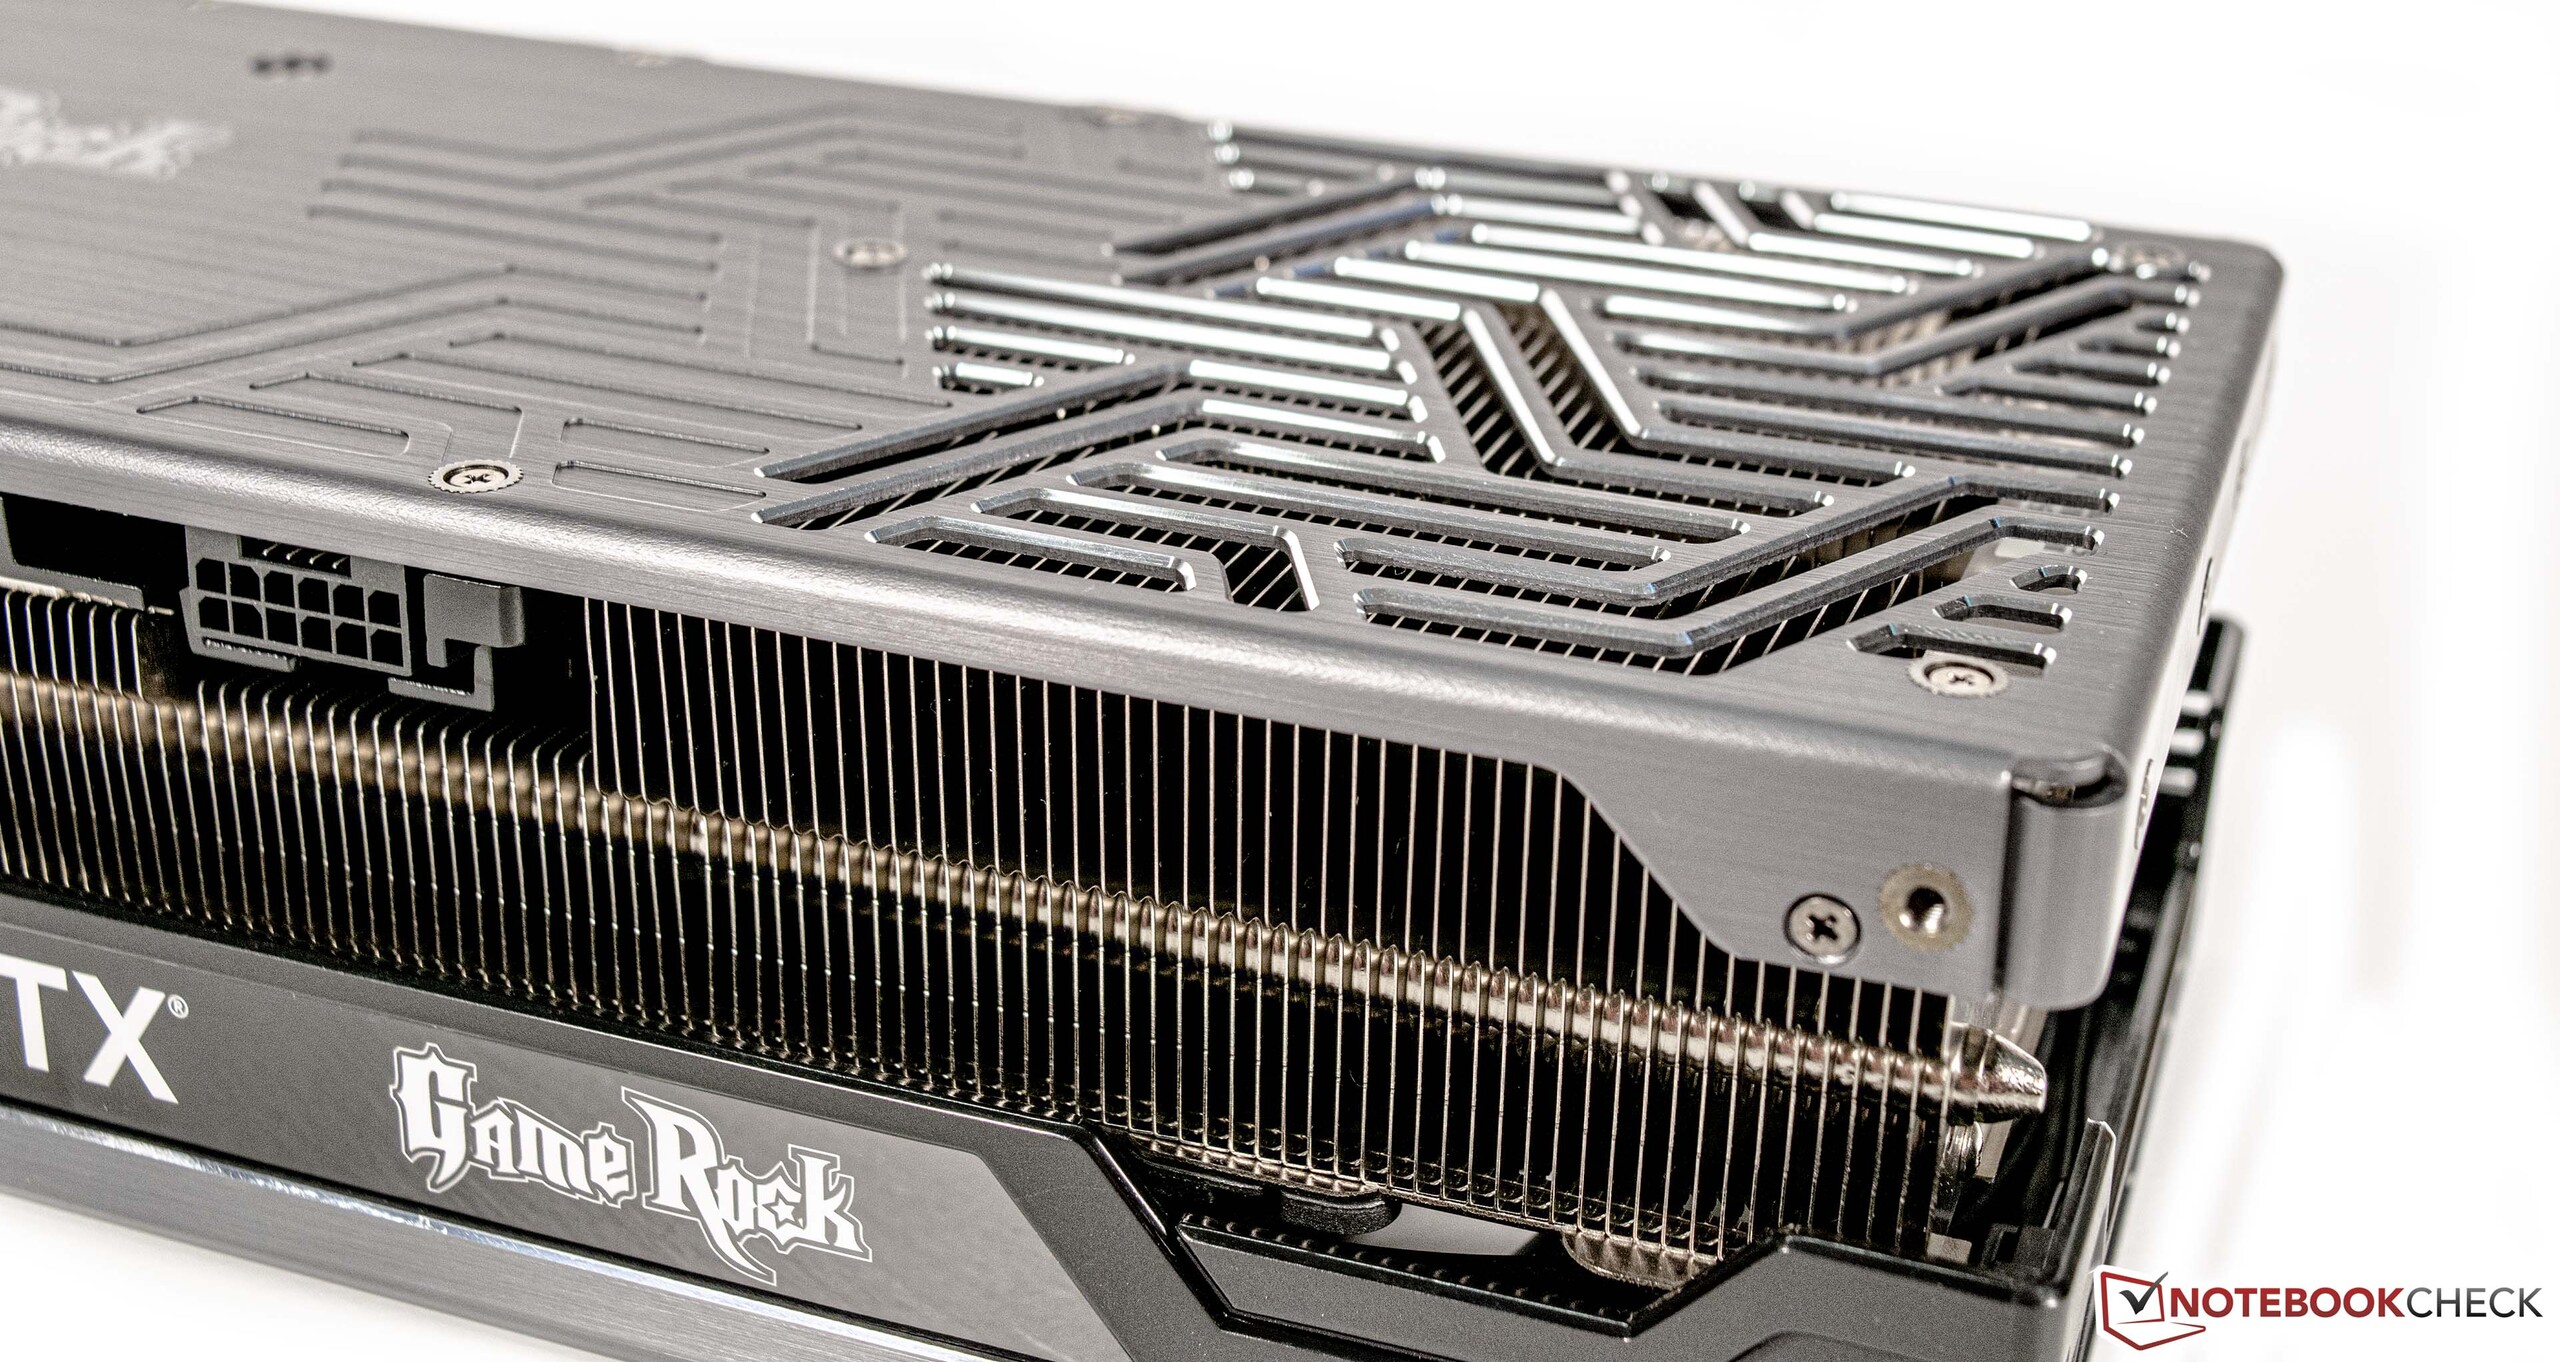
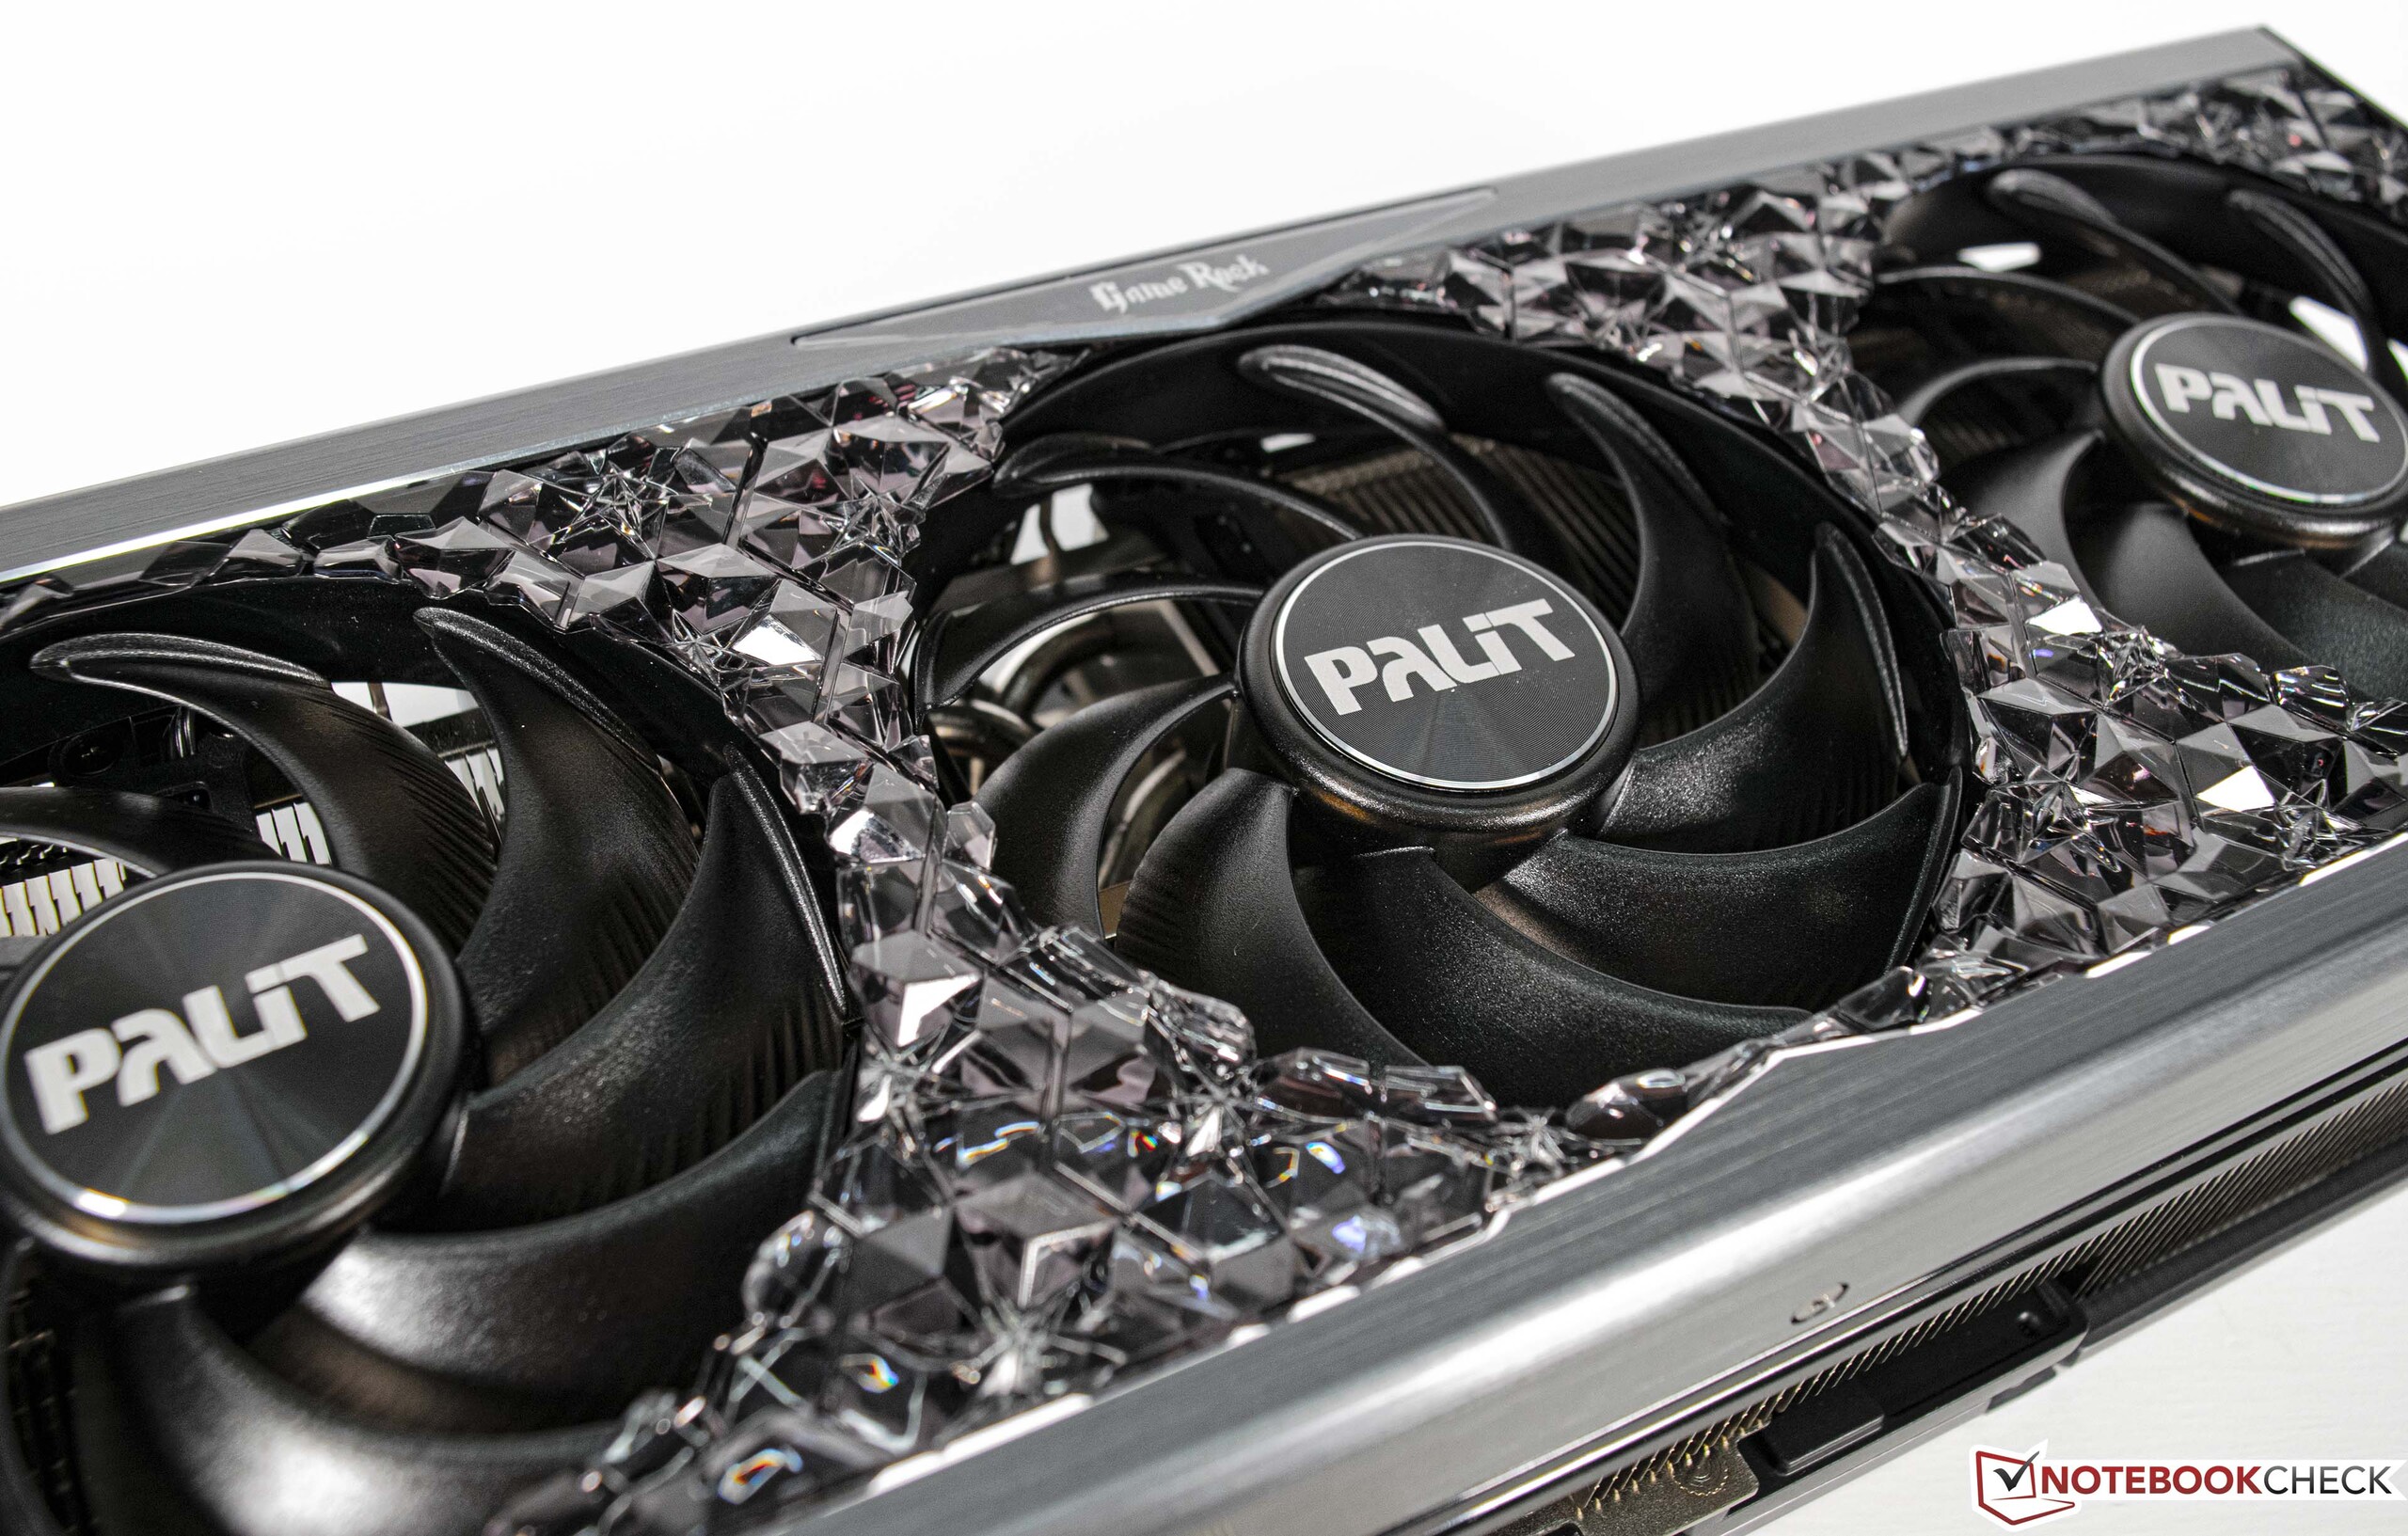
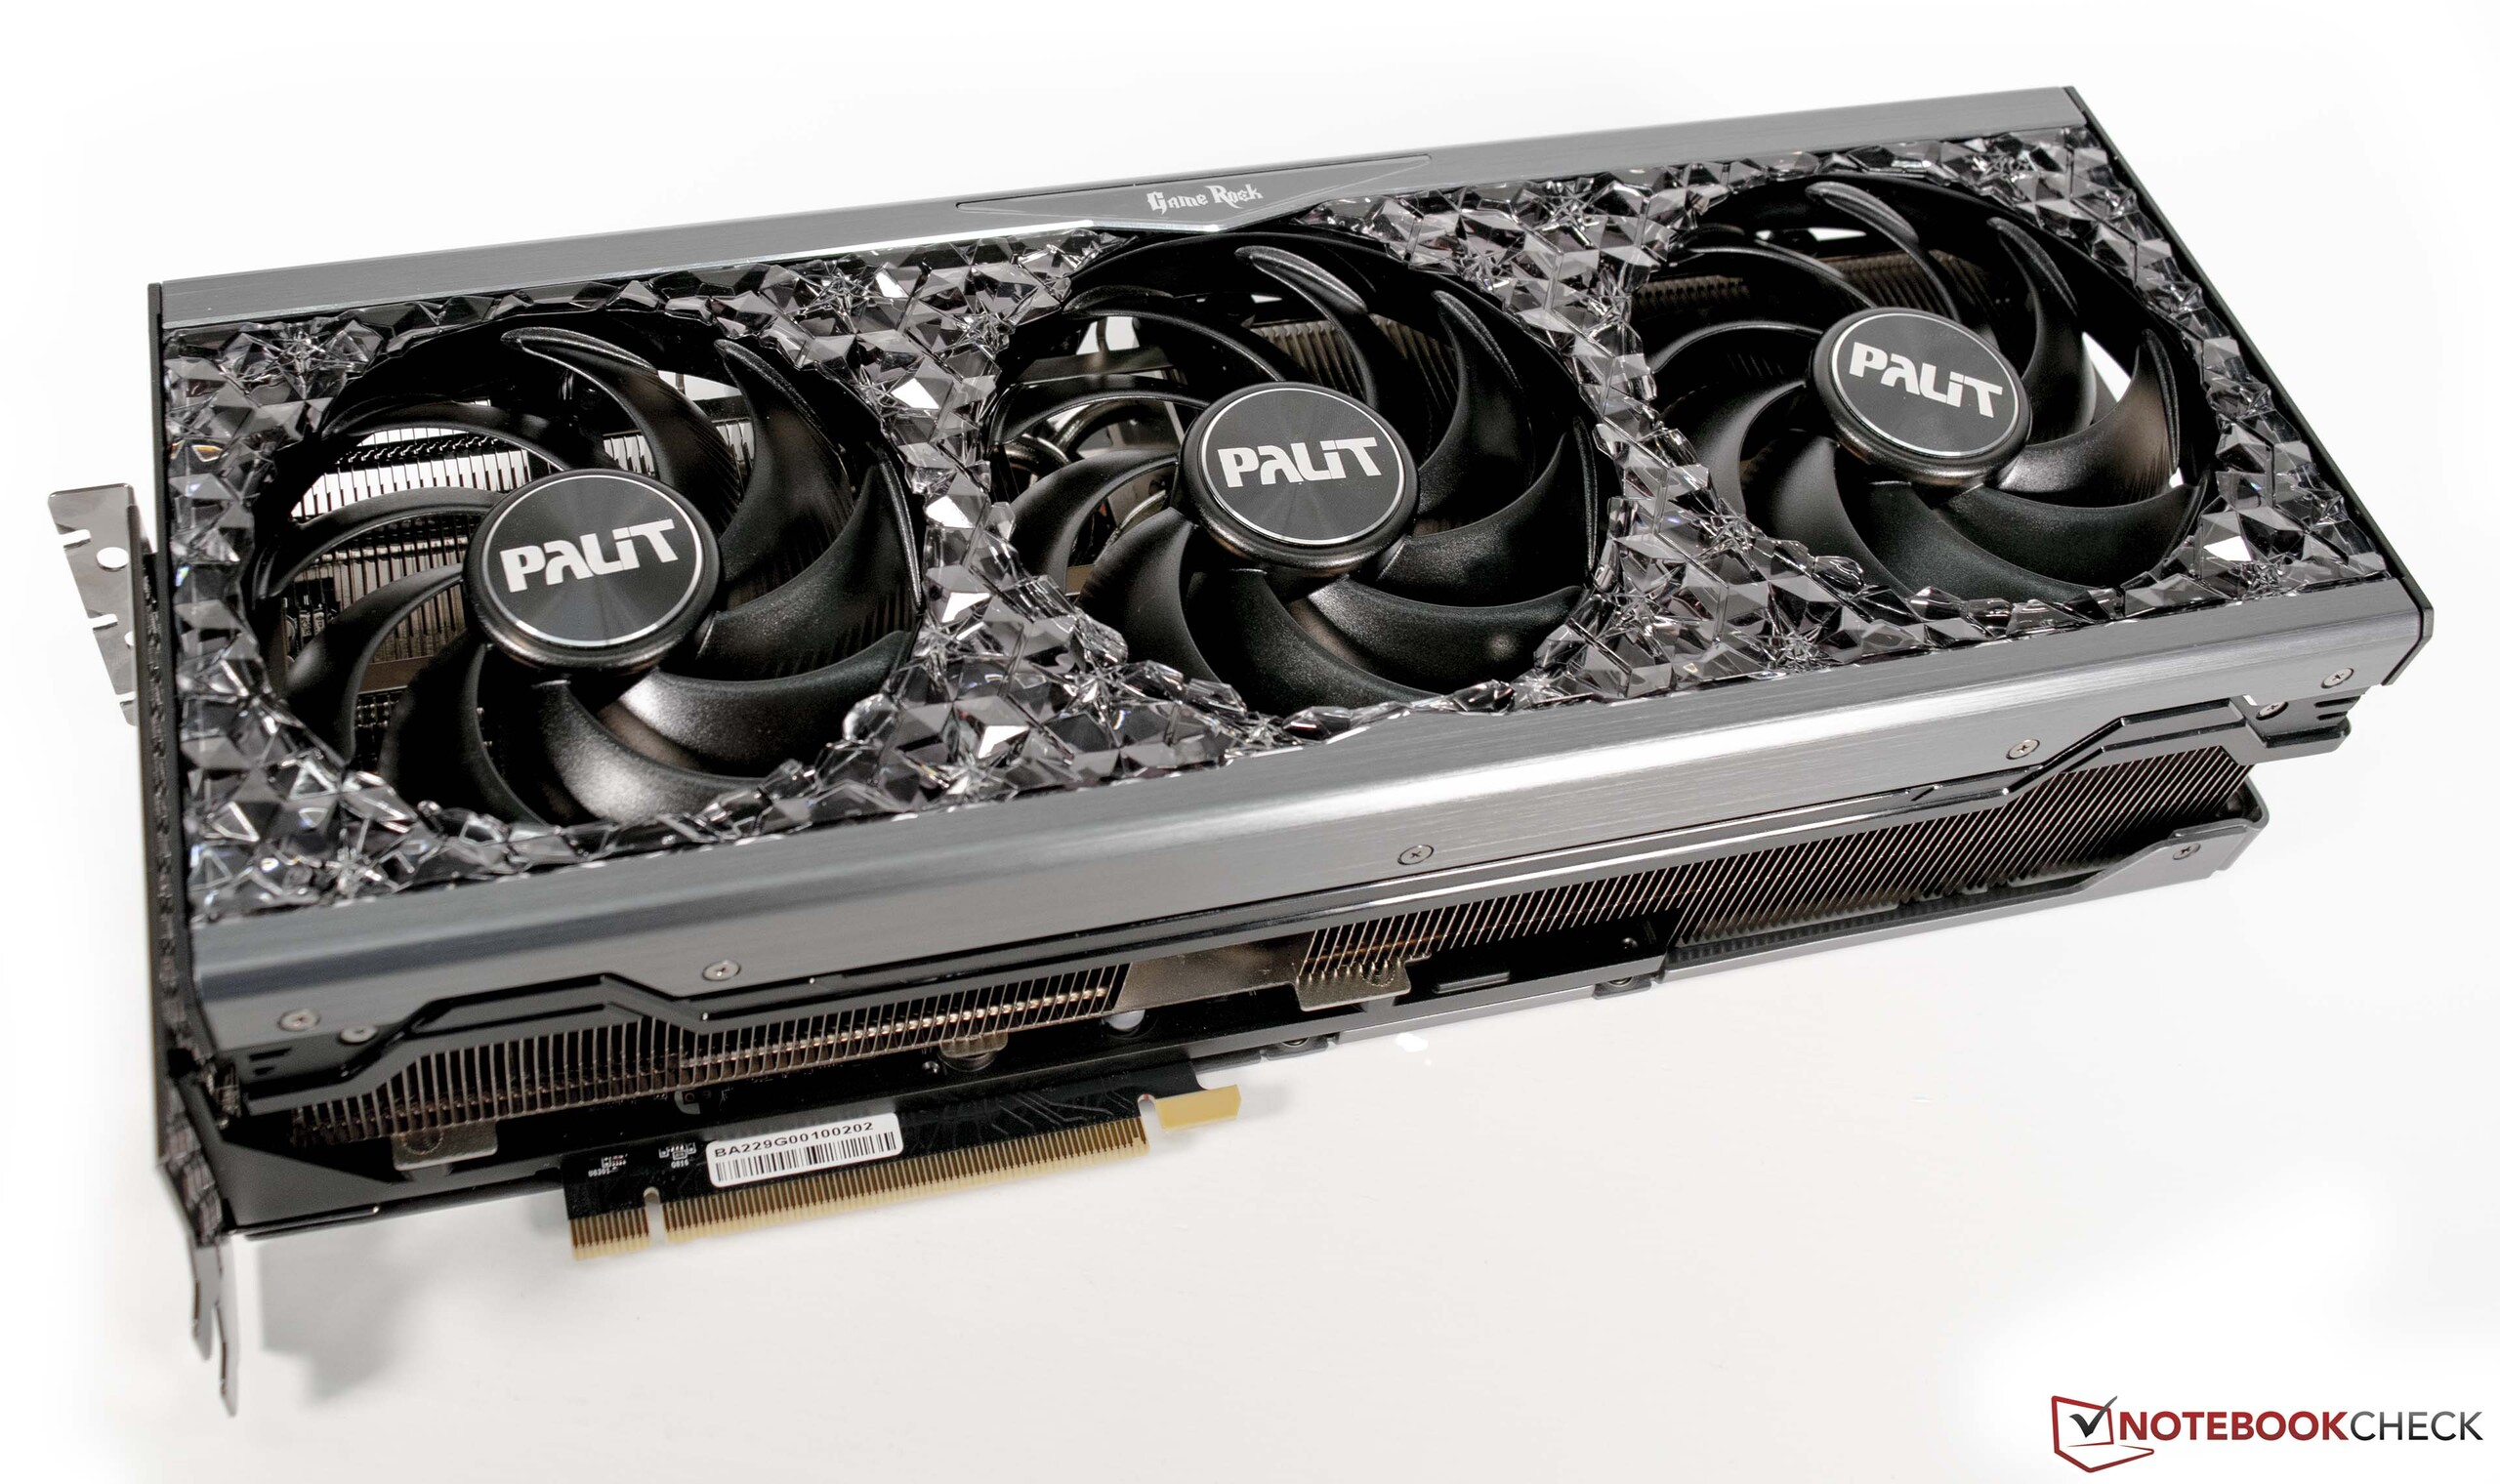
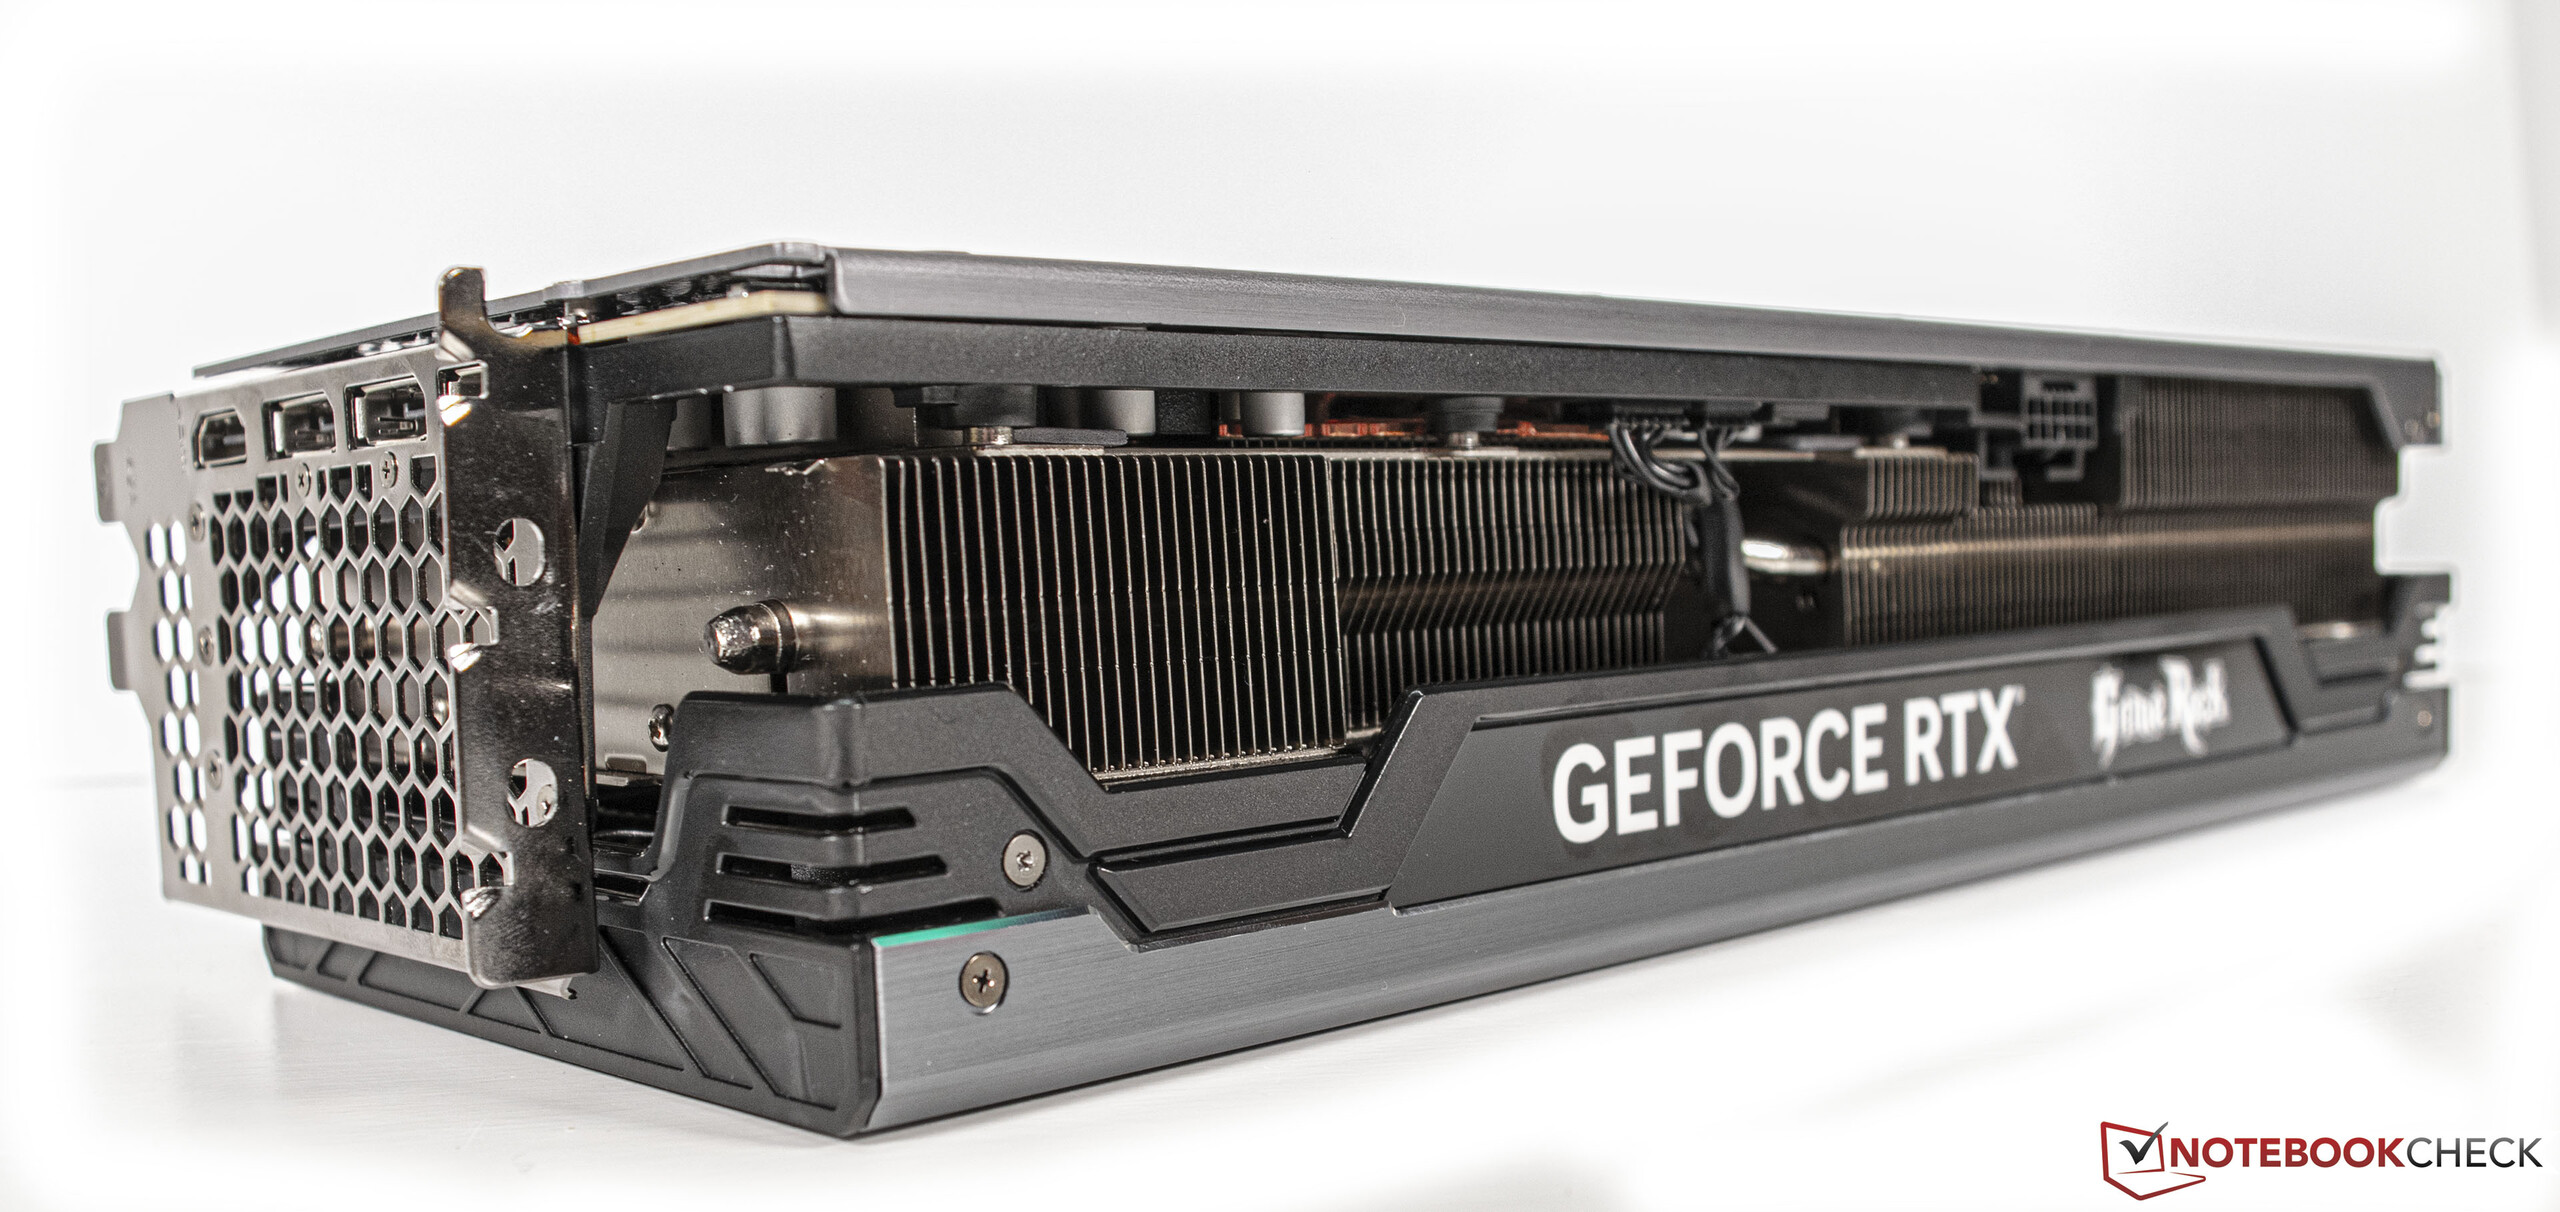
Para esta revisão, estamos usando o Palit GeForce RTX 4090 GameRock OC que, visualmente falando, difere muito da Edição dos Fundadores. O projeto de resfriamento do slot 3,5 requer espaço considerável dentro da caixa e está equipado com três ventiladores de 90 milímetros. O rumor de 600 watts de dissipação de energia das novas placas gráficas de alta qualidade é a razão para esta poderosa construção de refrigeração e pode ser encontrada em toda a série GeForce RTX 4090, independente do fabricante. Tem algo de positivo, pois nem o chip nem os problemas de temperatura VRAM estão em qualquer lugar para ser visto - isso já podemos revelar. No final das contas, o consumo de energia da placa gráfica é de 450 watts.
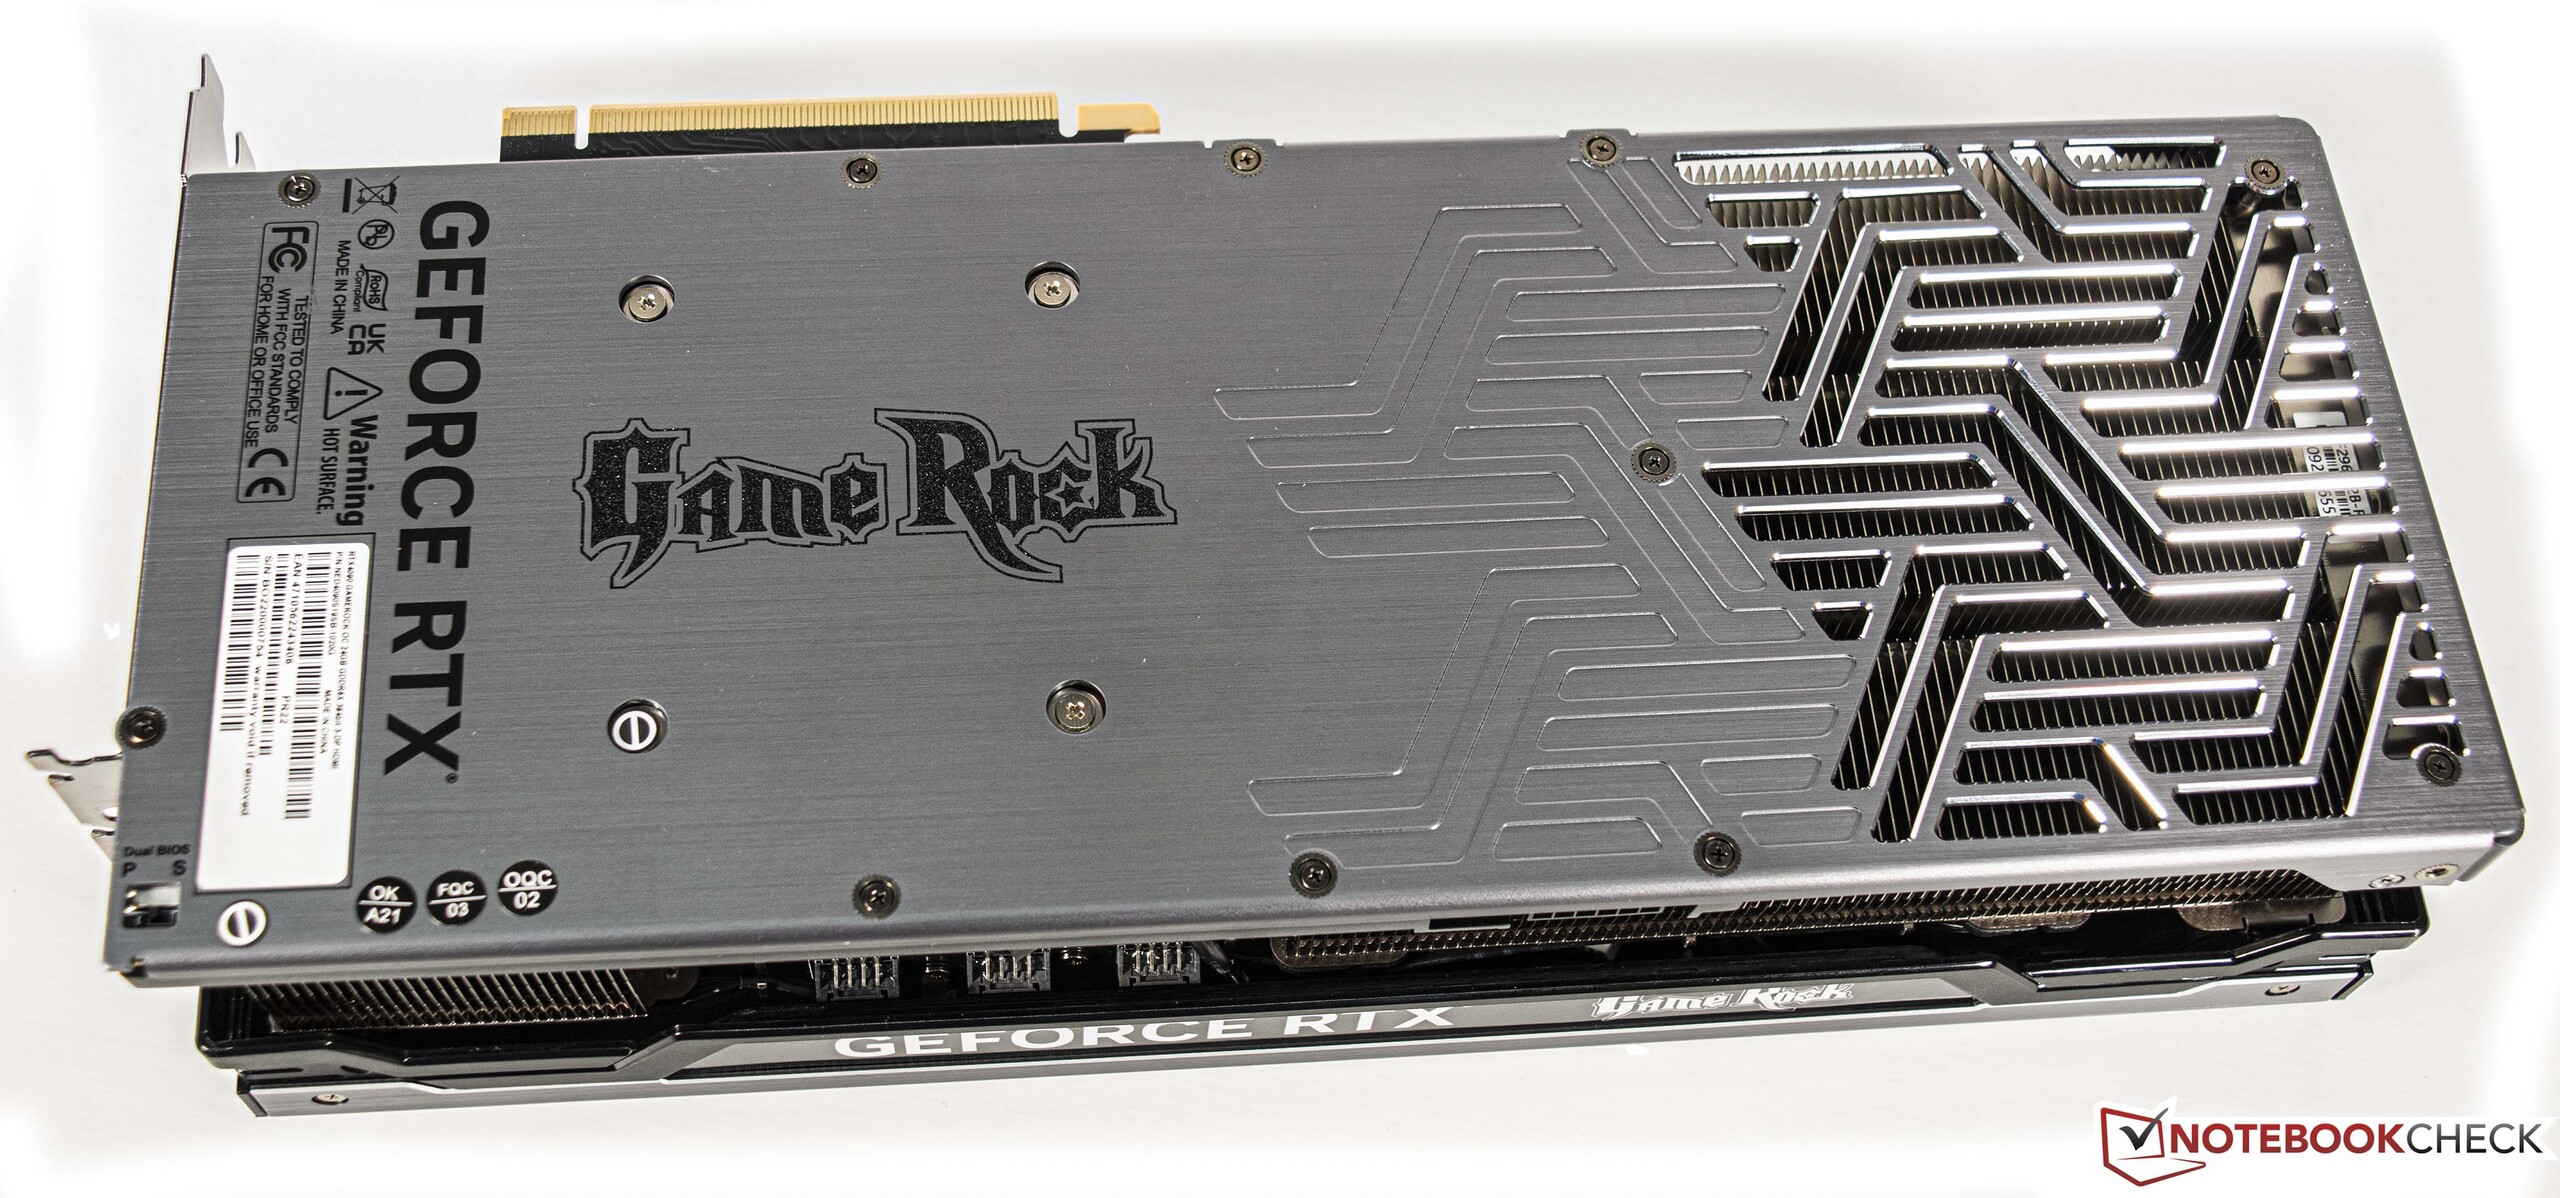
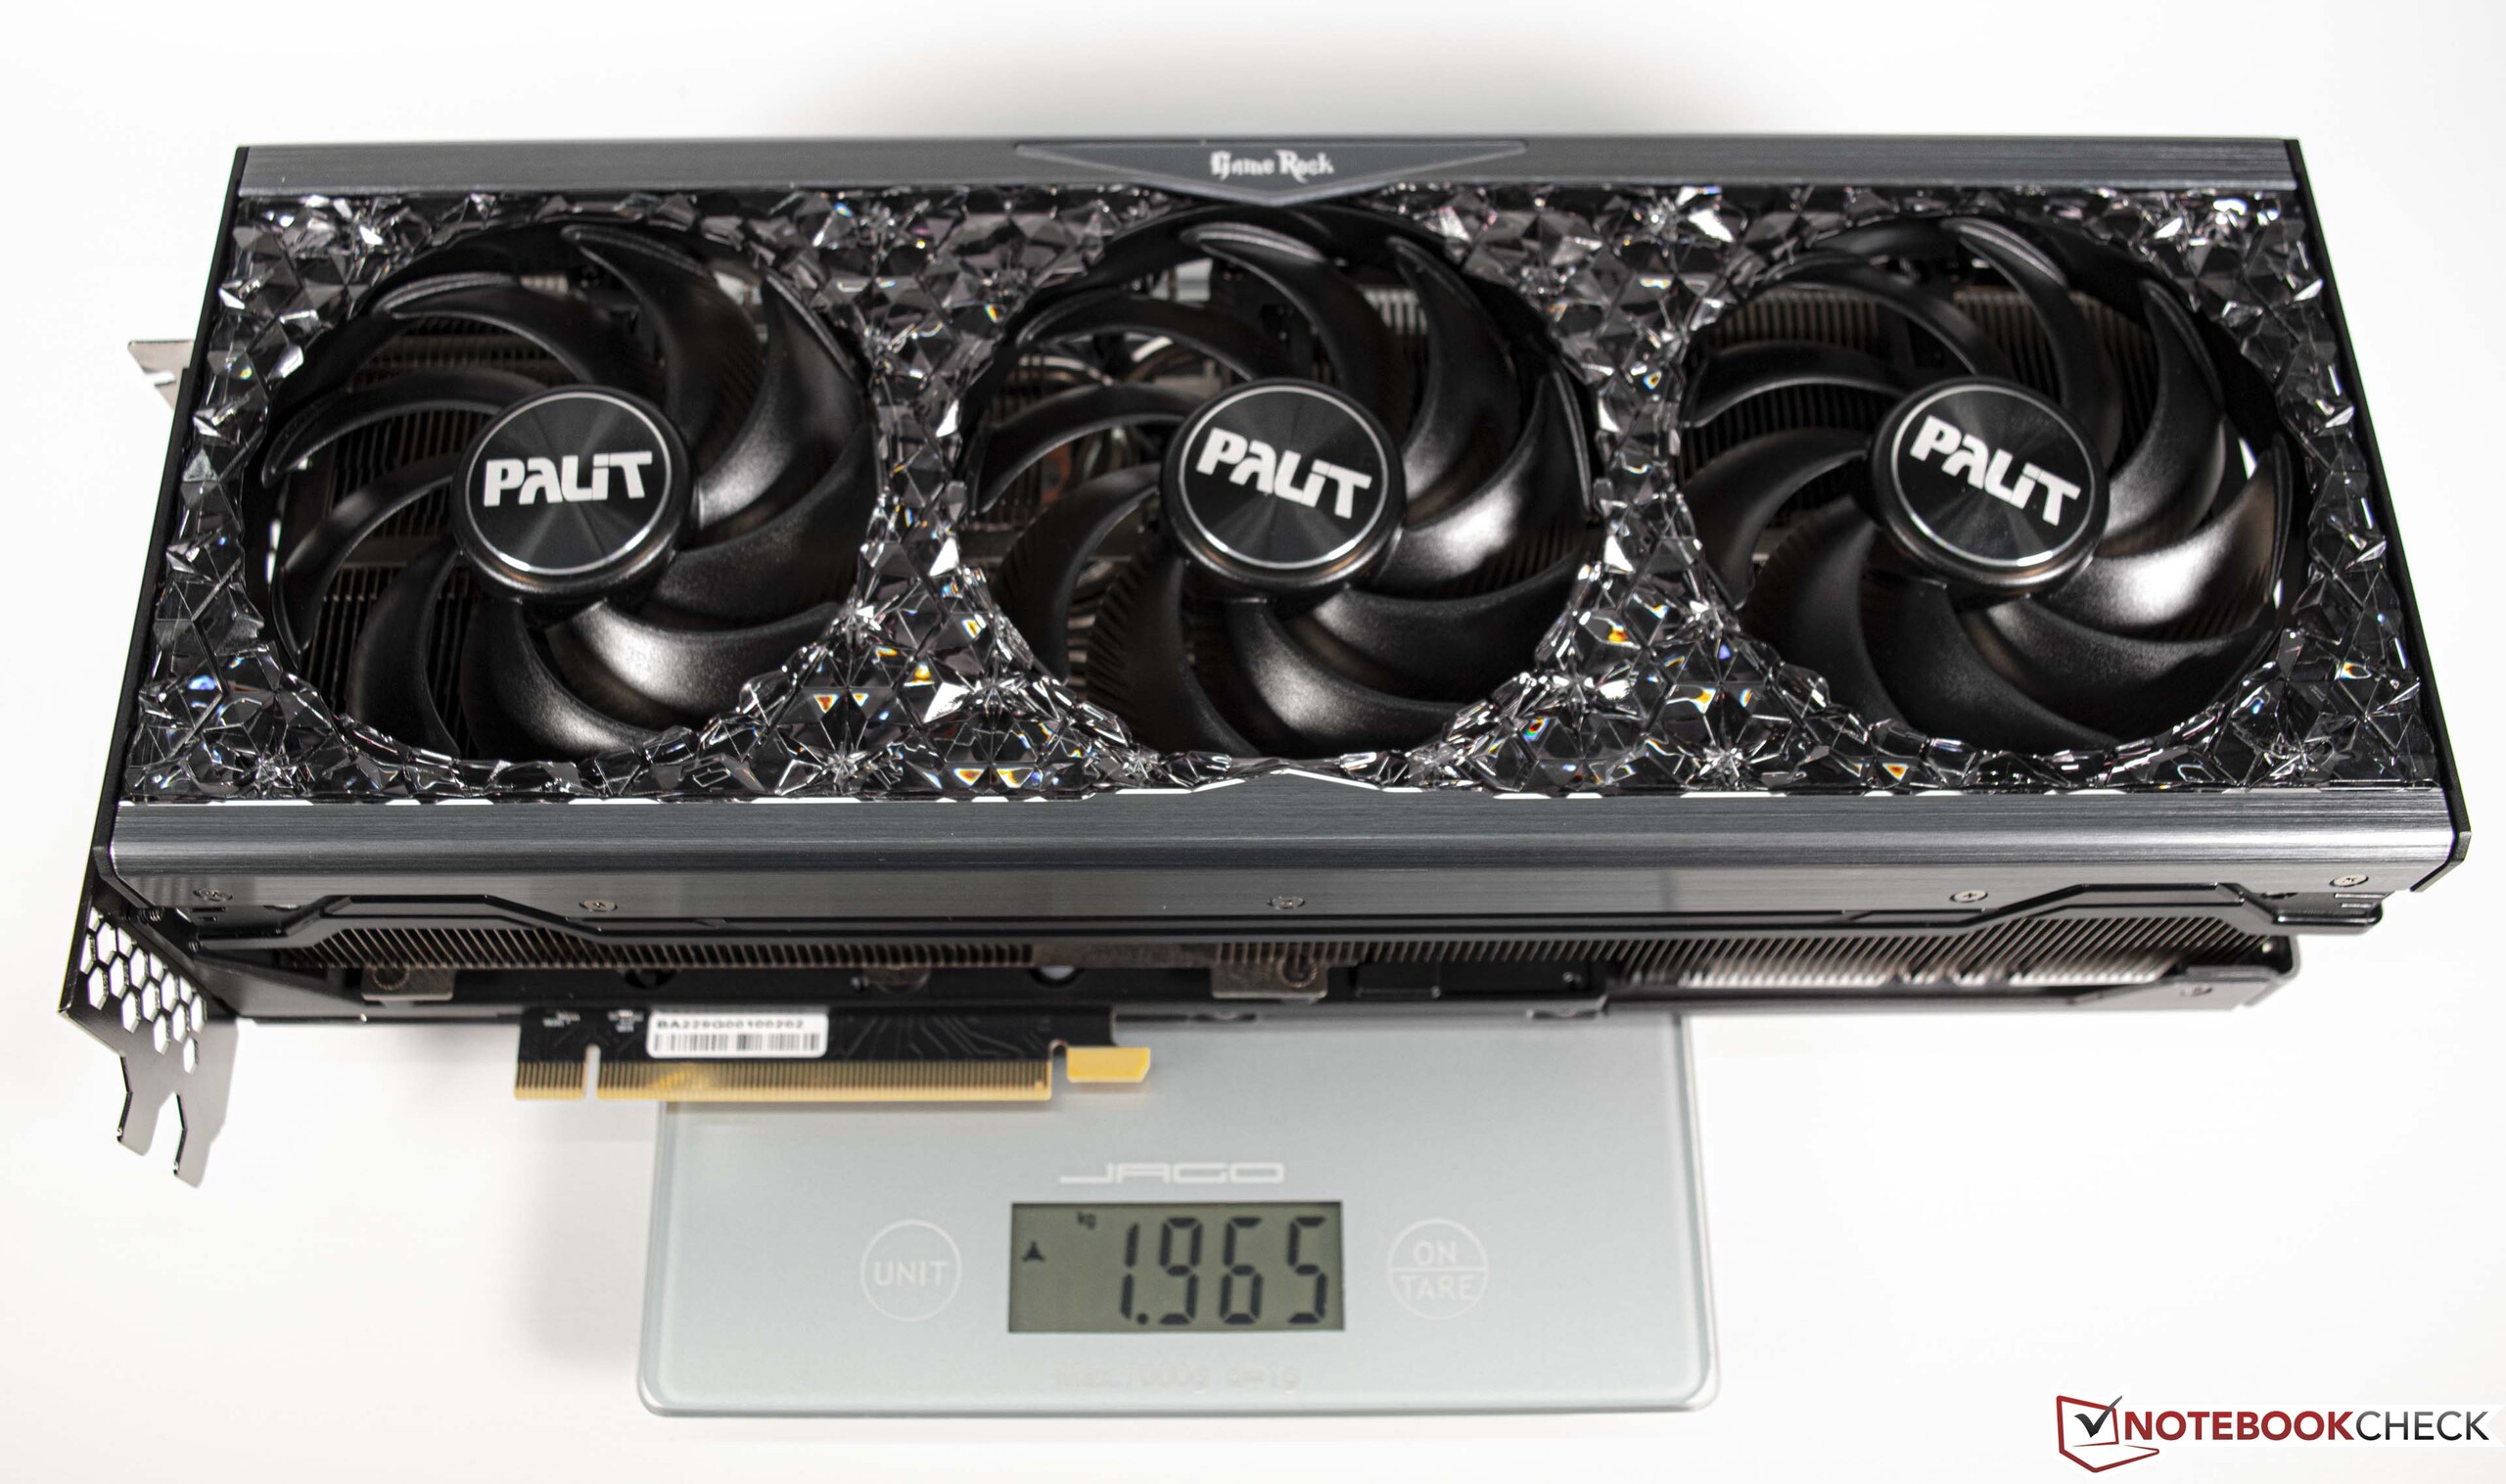
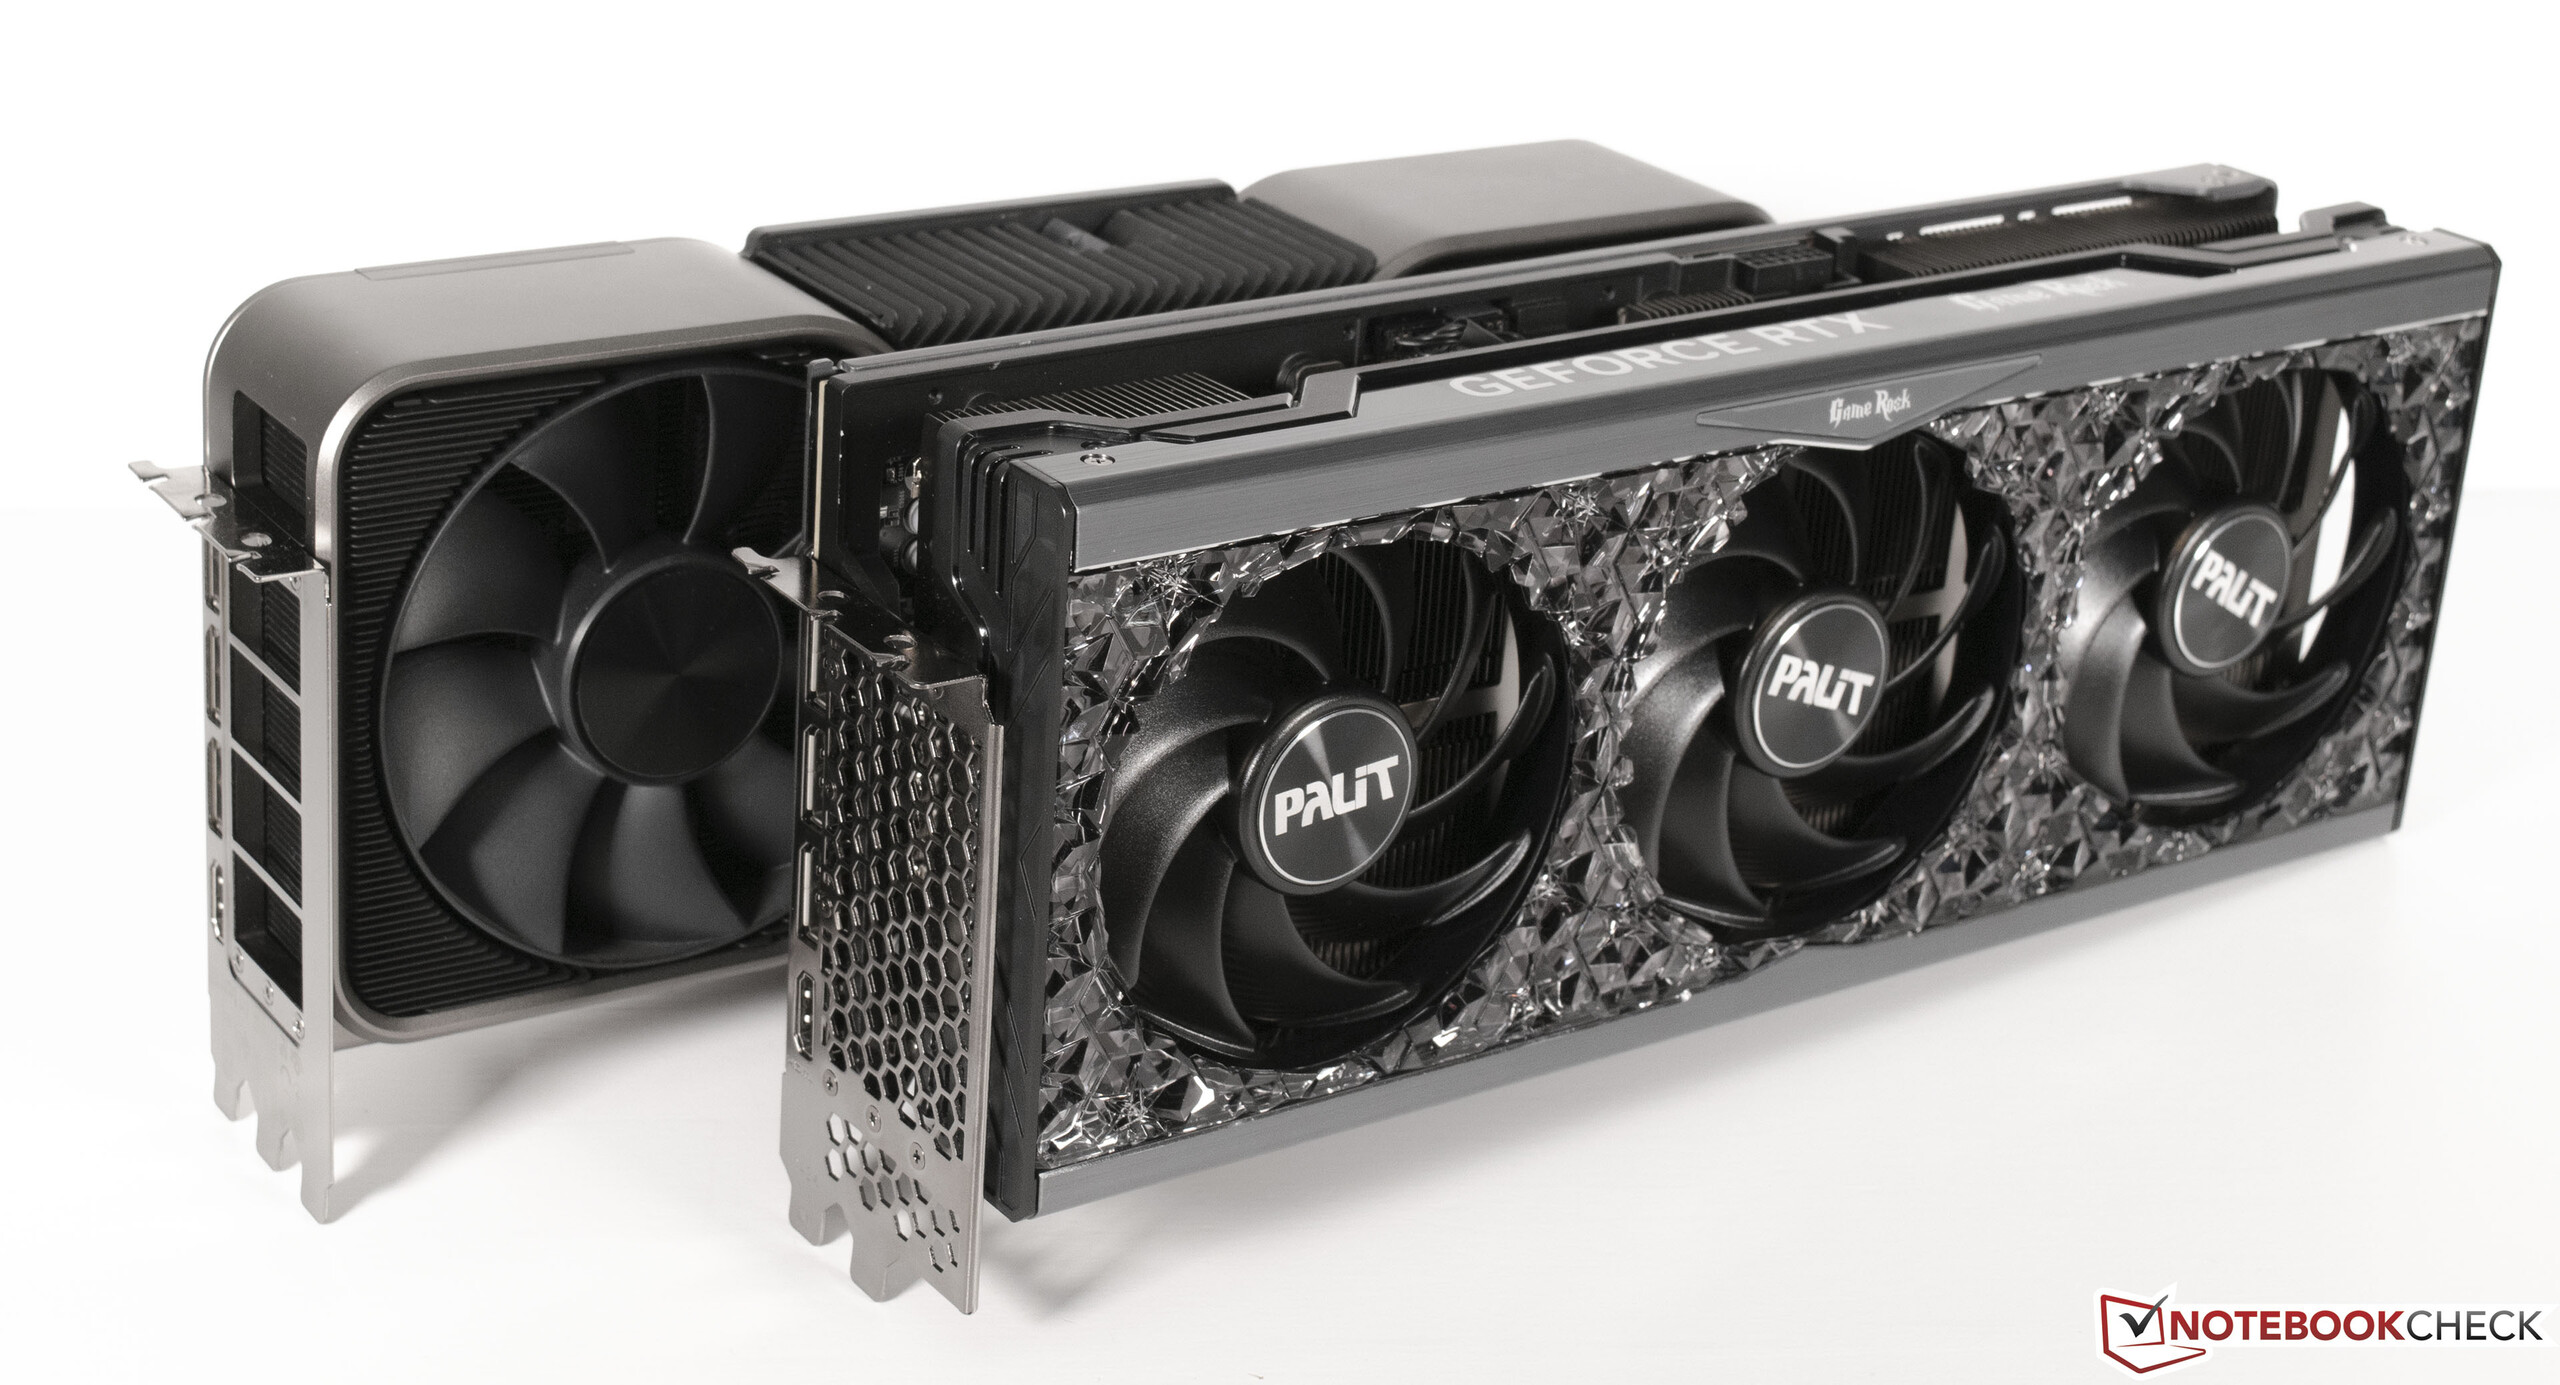
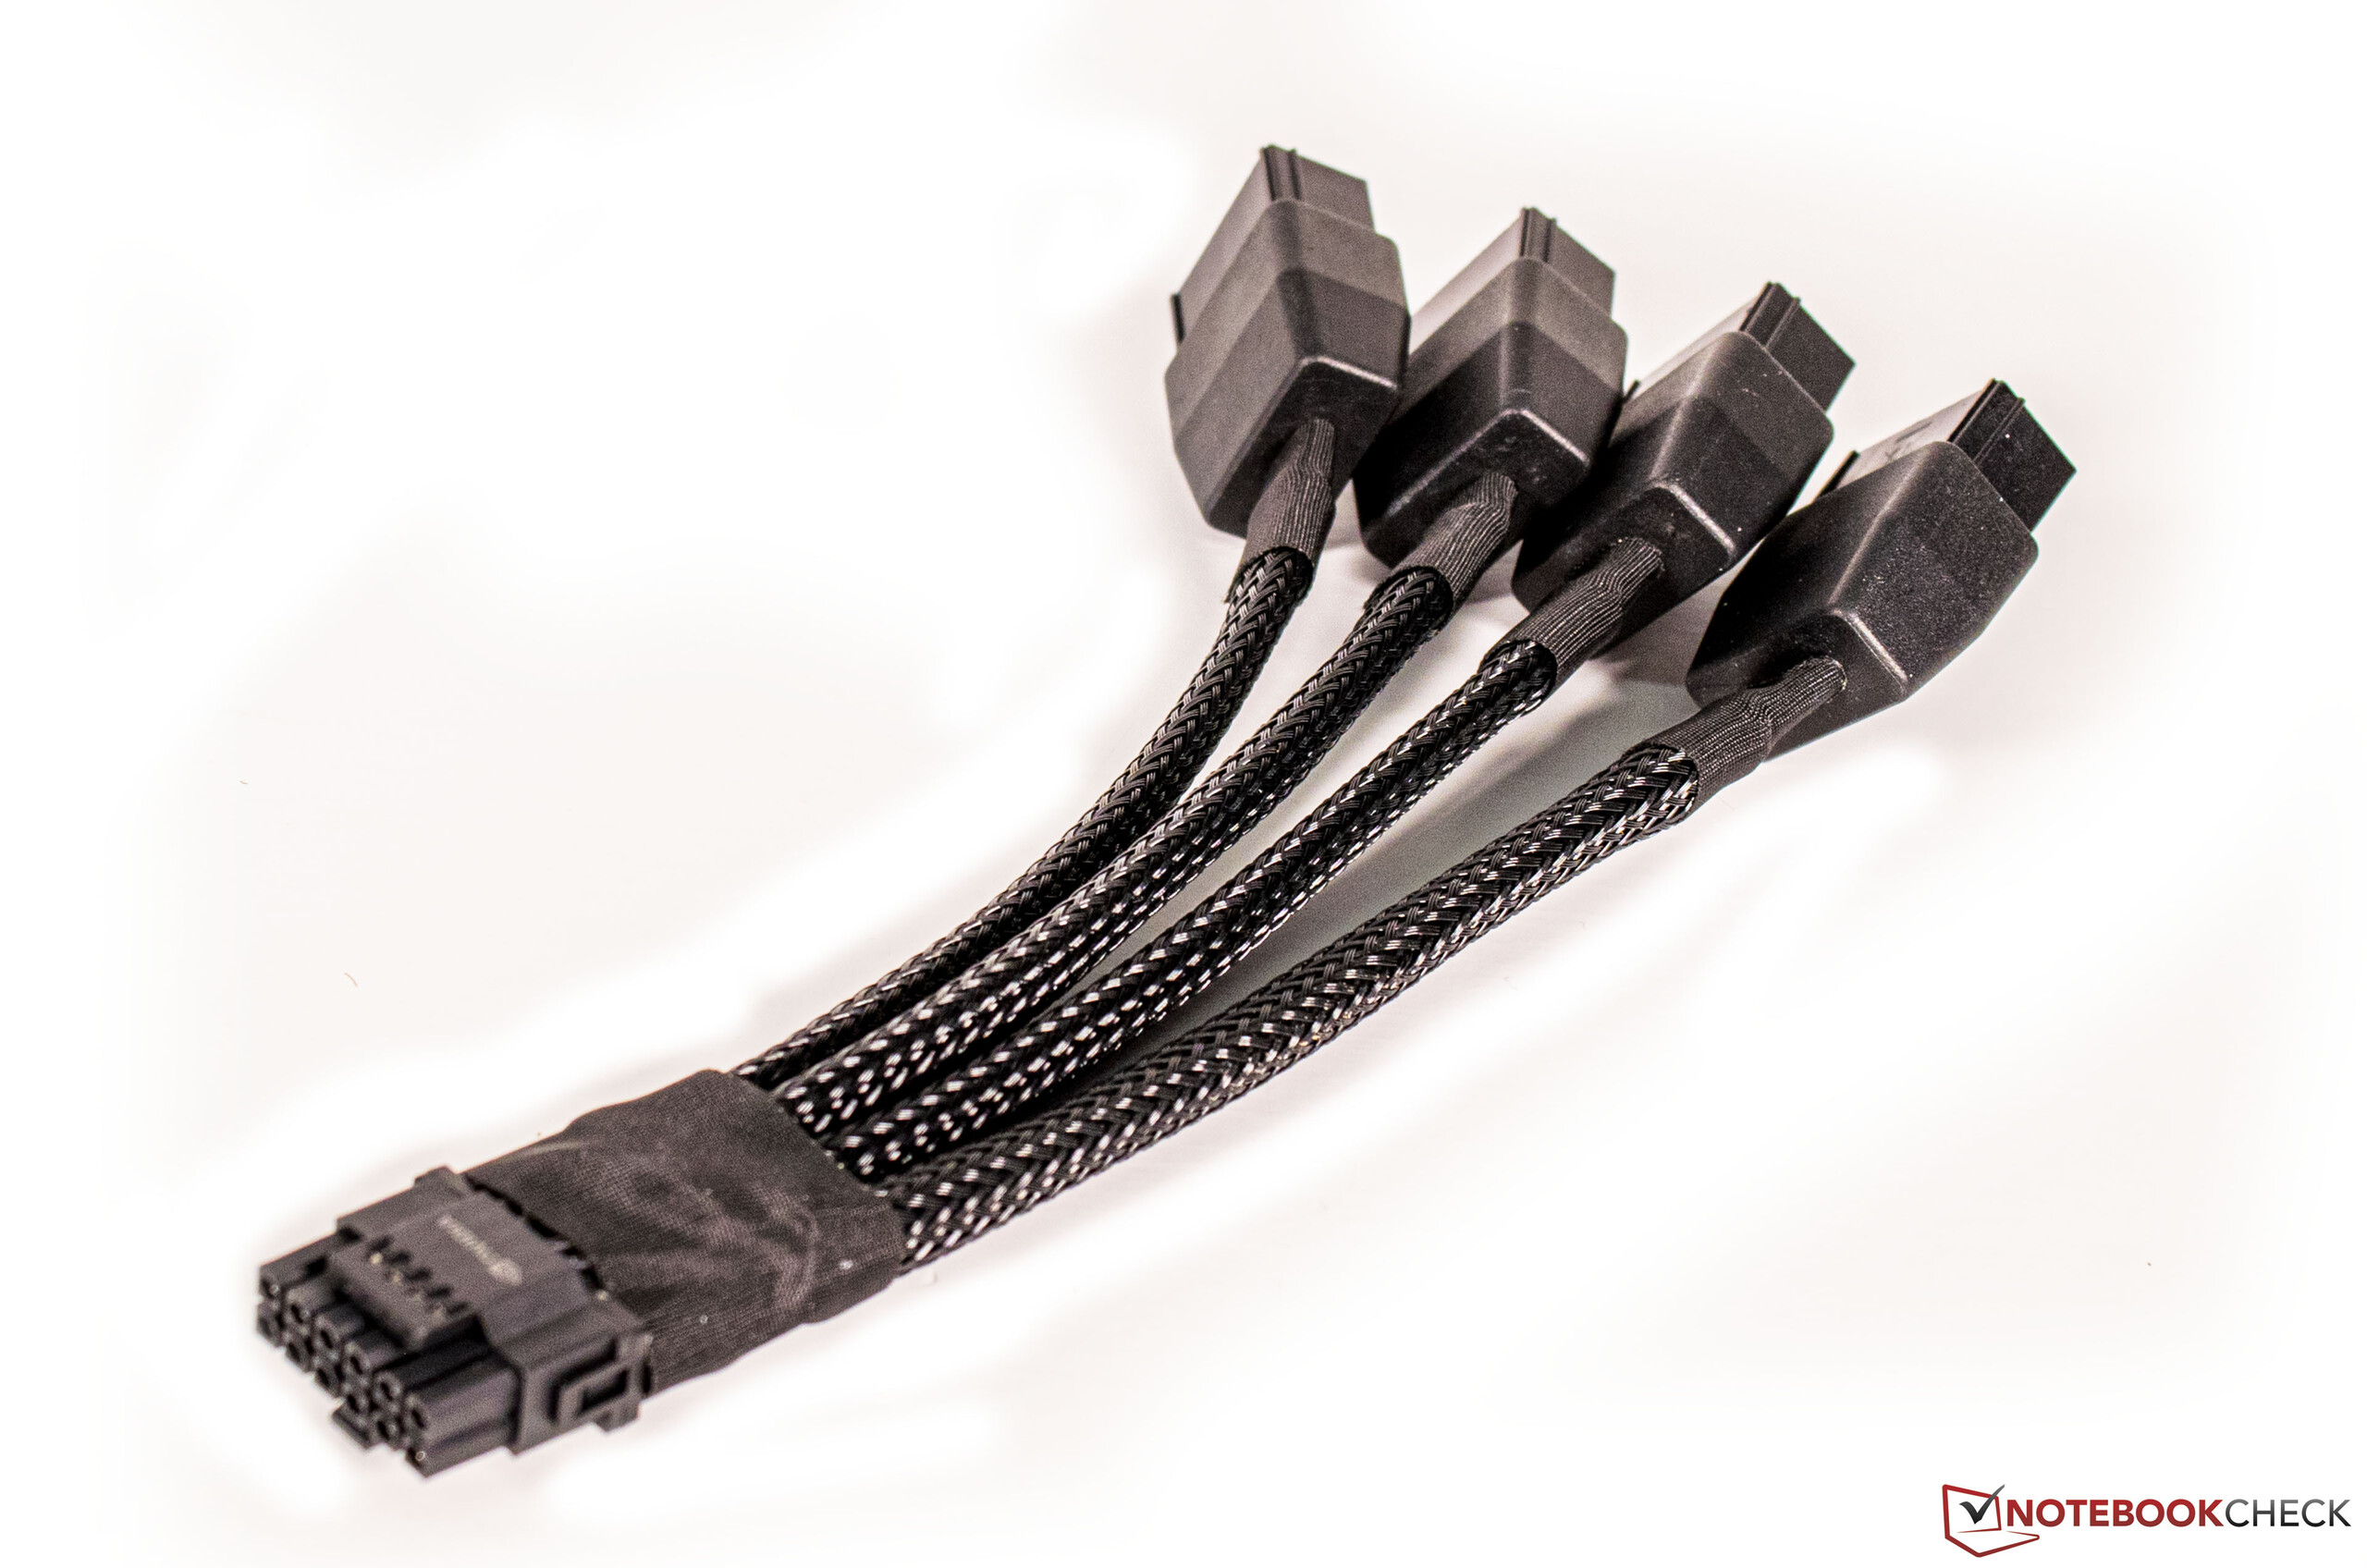
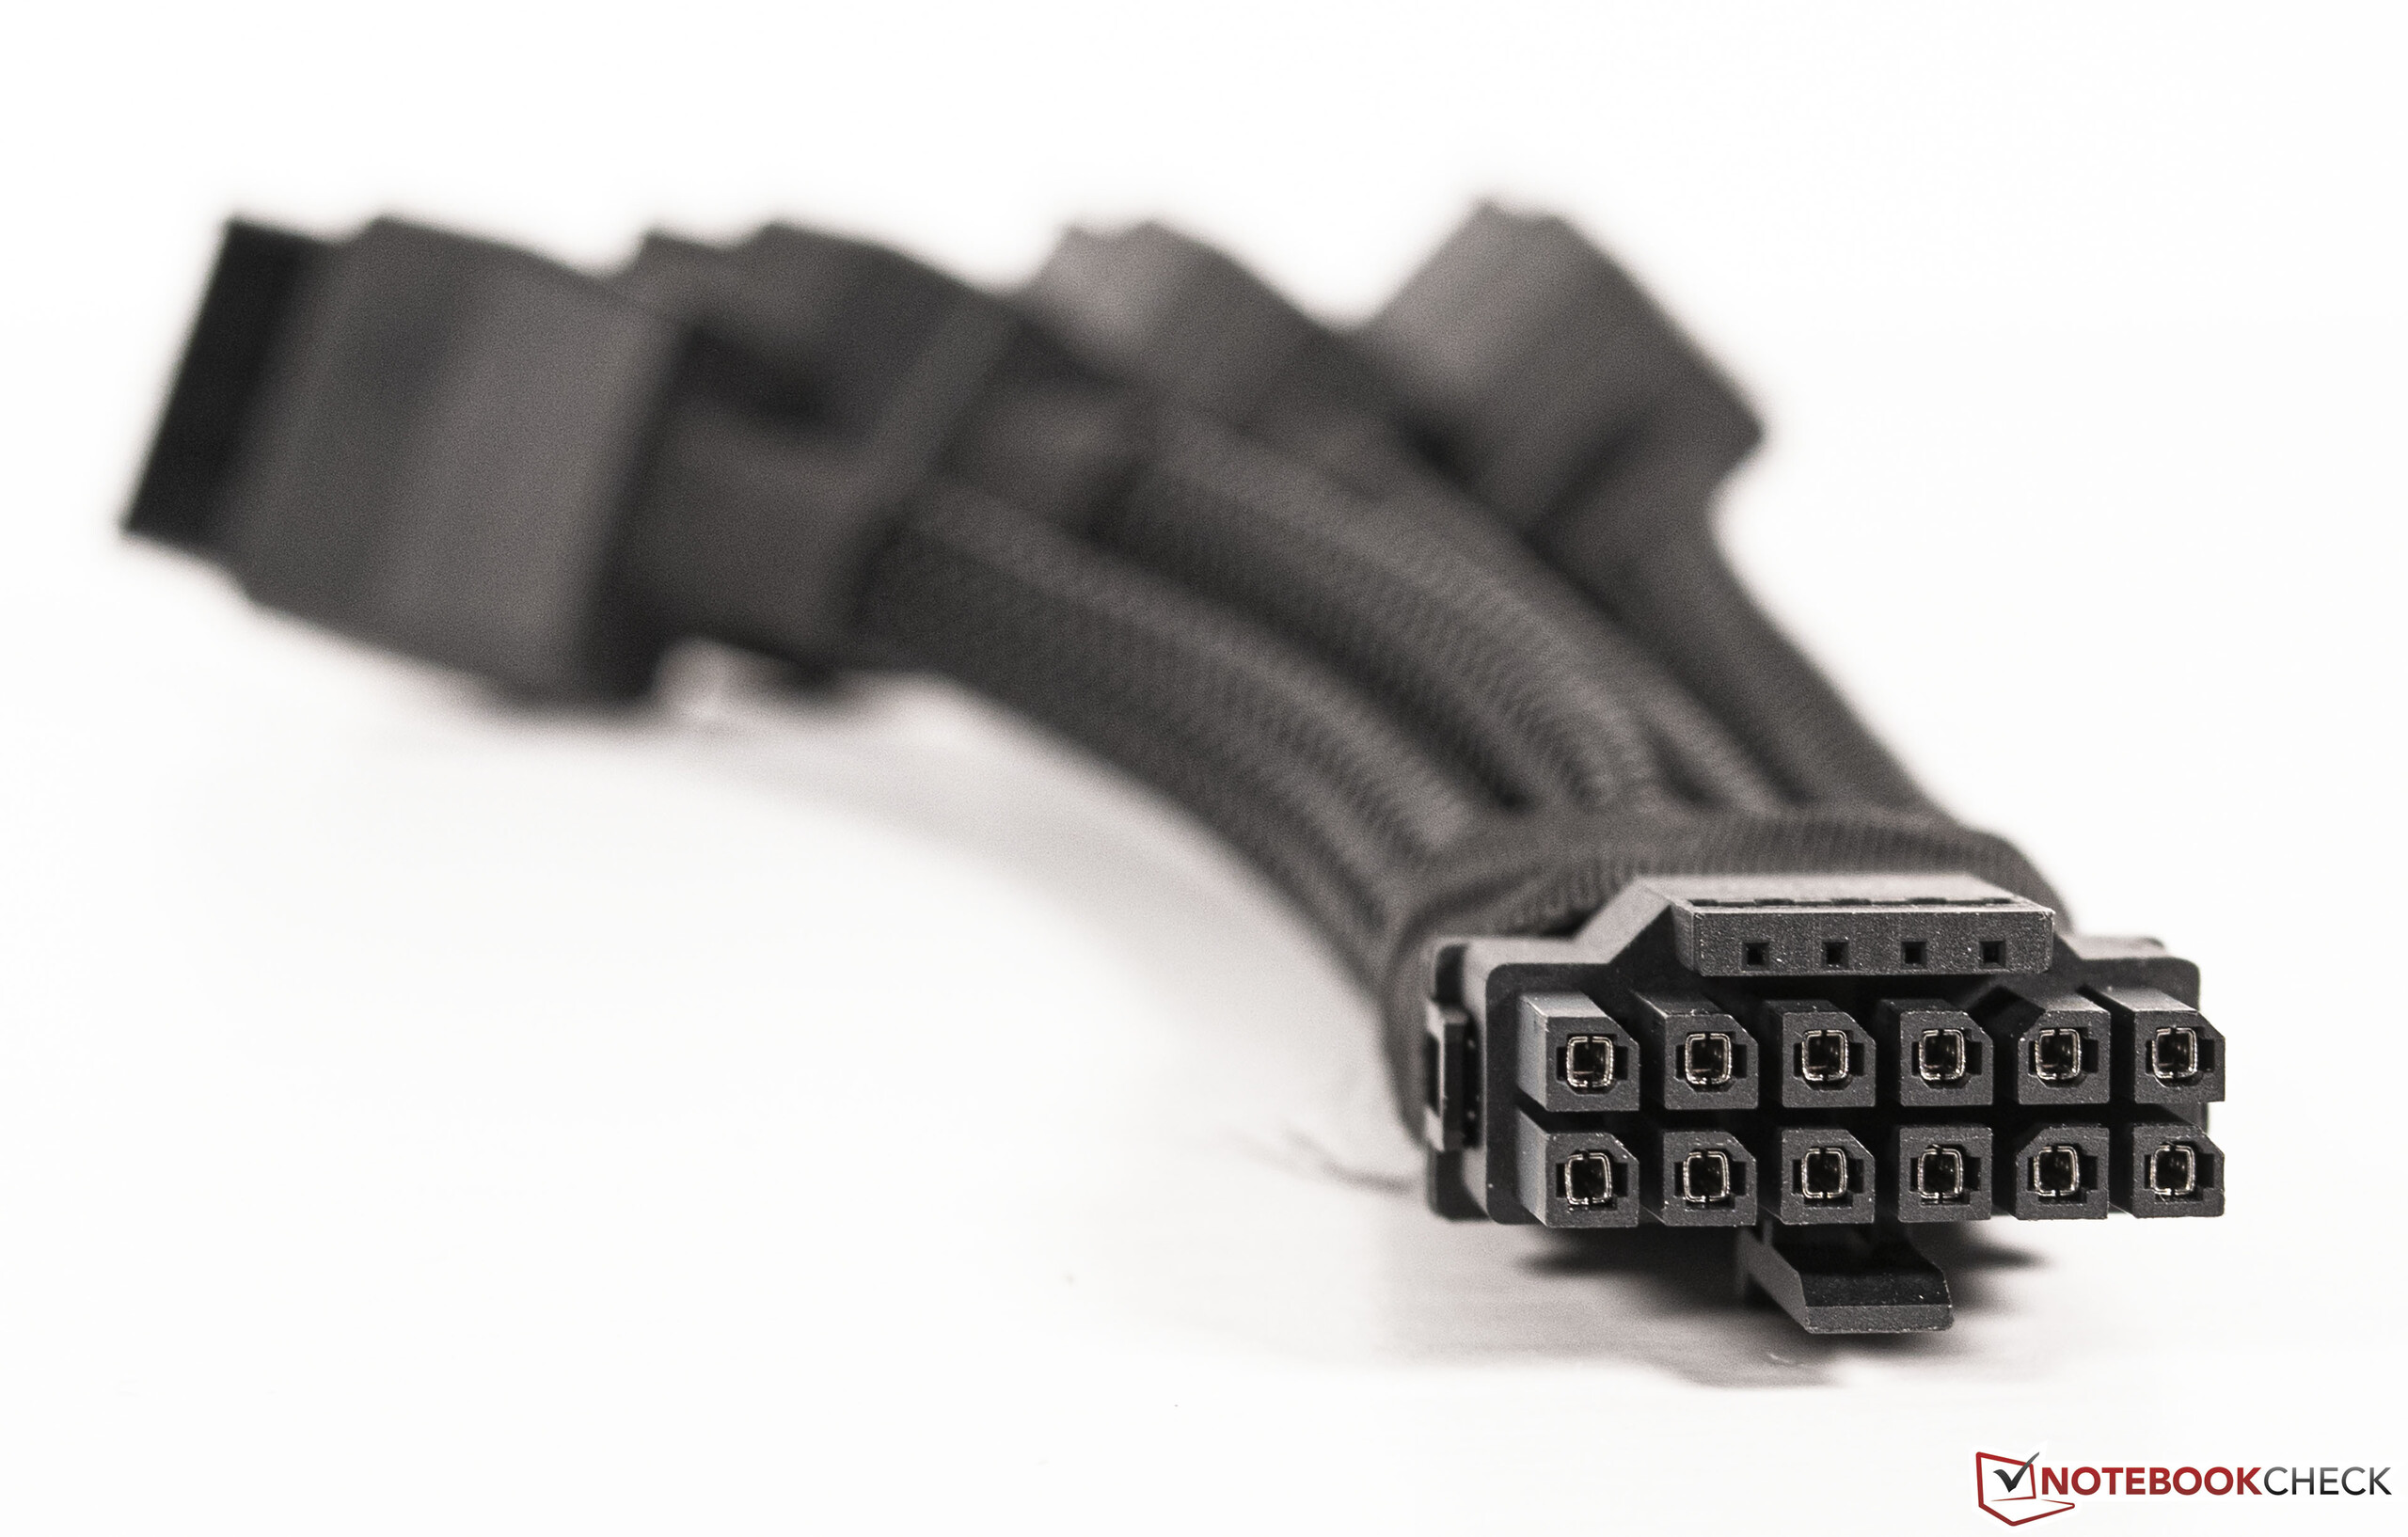
O Palit GeForce modelo RTX 4090 GameRock OC é um verdadeiro chamariz devido ao chamado Design Midnight Kaleidoscope, incluindo iluminação RGB sutil. Com pouco menos de 2 kg (4,4 libras), nossa amostra de revisão pertence aos pesos leves quando comparada com outras placas gráficas RTX 4090. No entanto, um porta-cartões gráficos está incluído na caixa, ajudando a suportar a instalação horizontal da placa. Além disso, há também o muito falado adaptador de rede que funde quatro conectores de energia de 8 pinos no novo conector de 12VHPWR da placa gráfica. Neste ponto, não queremos entrar na construção técnica e na precisão. Entretanto, o adaptador deve ser manuseado com cuidado a fim de evitar possíveis falhas de funcionamento. Recomendamos o uso de um cabo conector apropriado do fabricante da fonte de alimentação. Todos os nossos testes foram realizados com o adaptador correspondente, até agora sem encontrar nenhum problema.
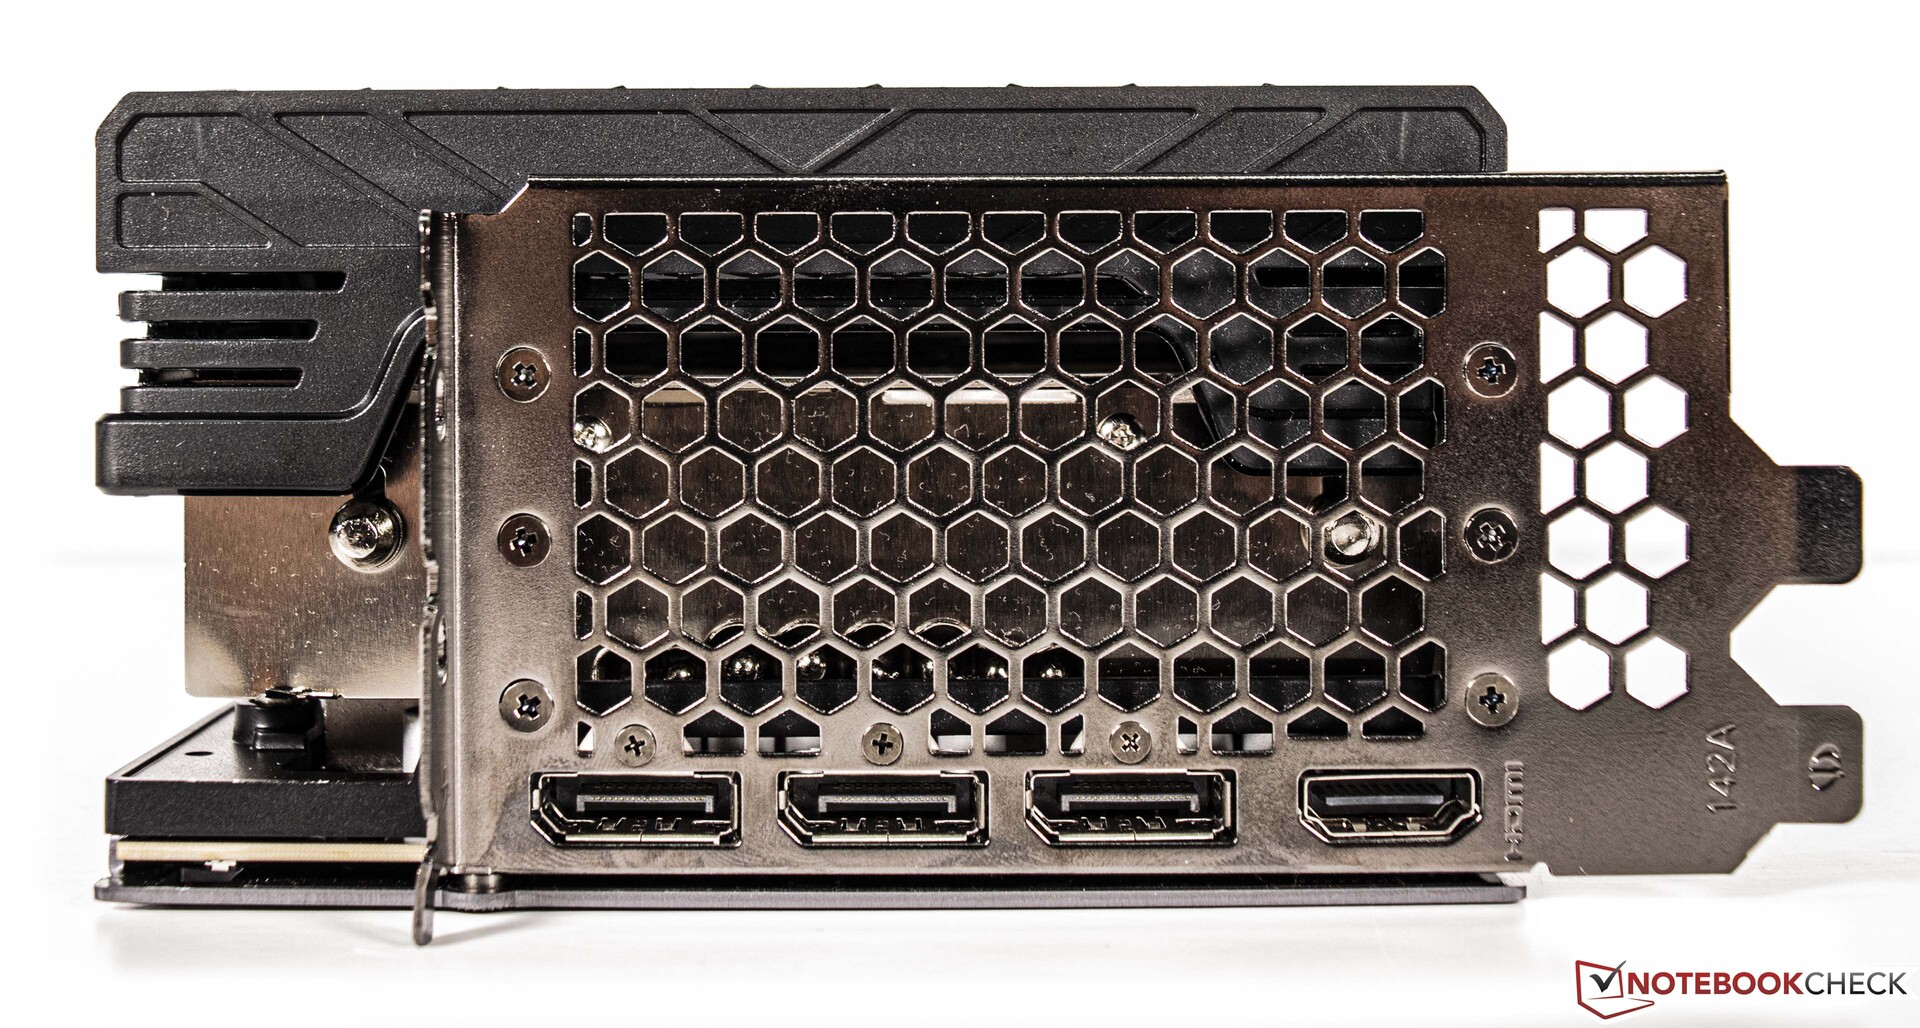
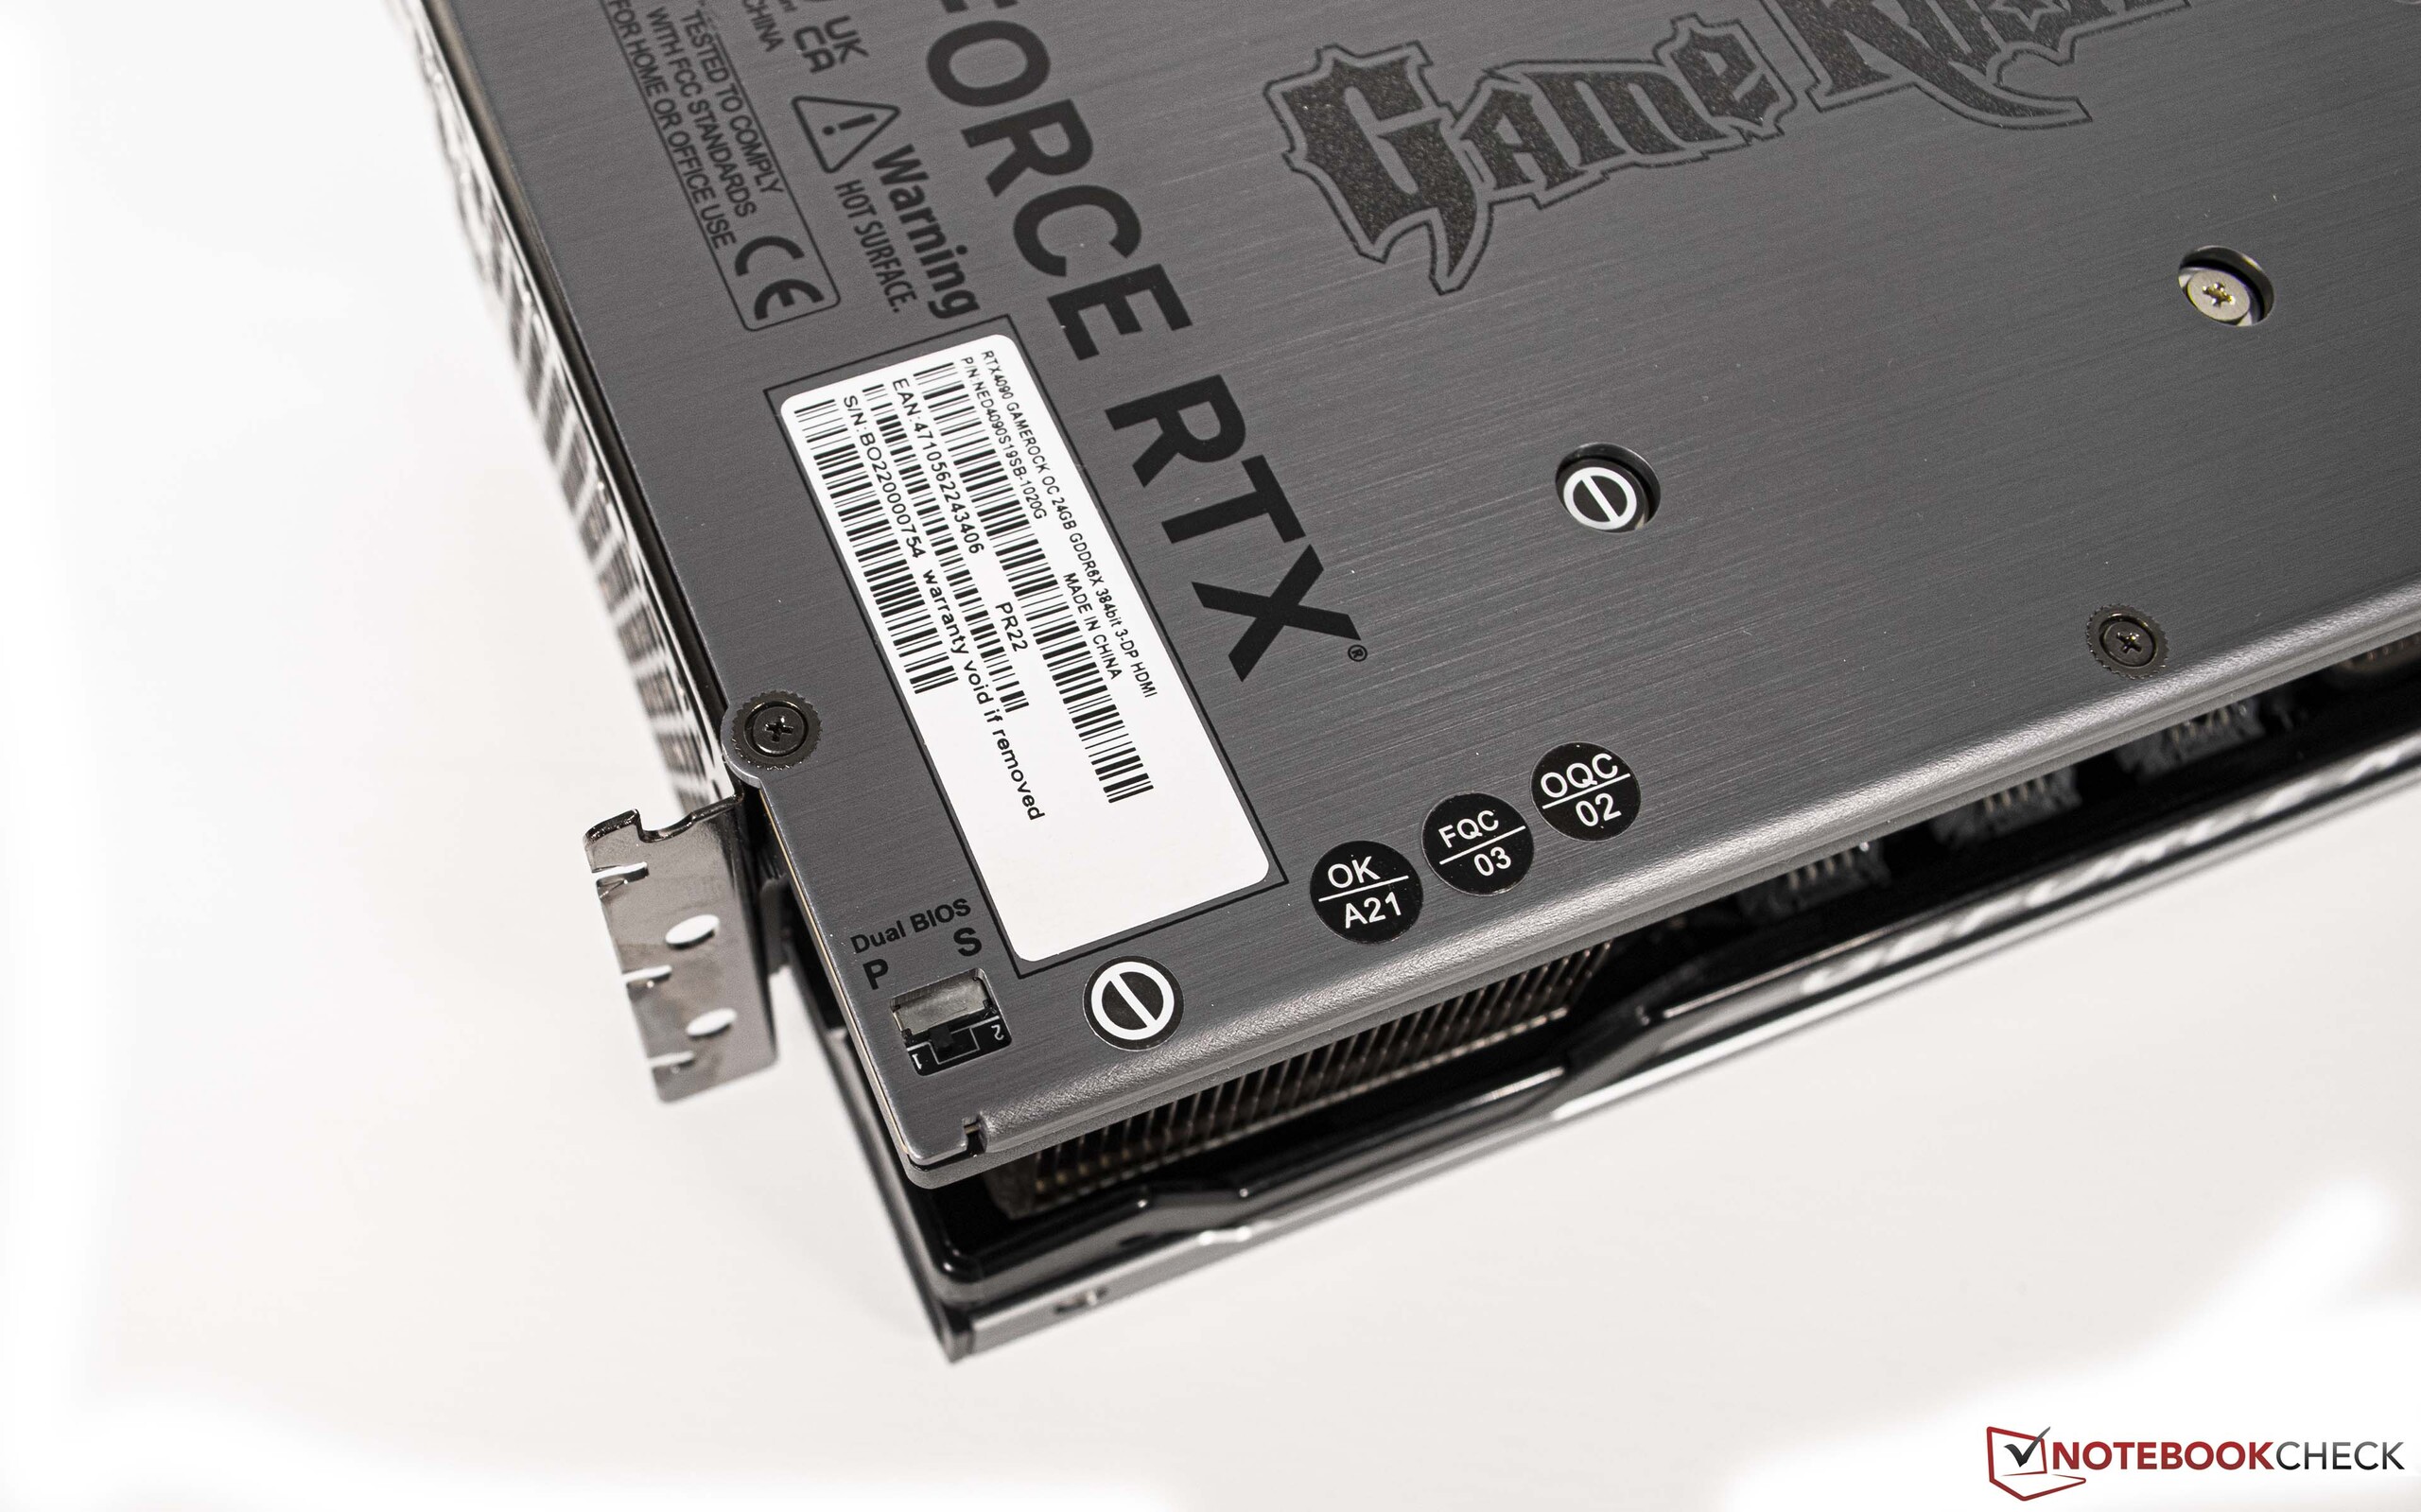
Externamente, o Palit GeForce RTX 4090 GameRock OC vem com 1x HDMI 2.1a e 3x DisplayPort 1.4a.
Flagship GeForce placas gráficas: Especificações
| RTX 4090 (FE) | RTX 4080 | RTX 3090 Ti | RTX 3090 (FE) | RTX 3080 Ti (FE) | RTX 3080 (FE) | Titan RTX | |
| GPU | AD102 | AD103 | GA102 | GA102 | GA102 | GA102 | TU102 |
| Processo FinFET | 4 nm | 4 nm | 8 nm | 8 nm | 8 nm | 8 nm | 12 nm |
| CUDA Cores | 16,384 | 9,728 | 10,752 | 10,496 | 10,240 | 8,704 | 4,608 |
| Unidades de Textura | 512 | 304 | 336 | 328 | 320 | 272 | 288 |
| Tensor Cores | 512 Gen 4 | 304 Gen 4 | 336 Gen 3 | 328 Gen 3 | 320 Gen 3 | 272 Gen 3 | 576 Gen 2 |
| RT Cores | 128 | 76 | 84 | 82 | 80 | 68 | 72 |
| GPU Velocidade do relógio base | 2.235 MHz | 2.205 | 1.560 MHz | 1.395 MHz | 1.365 MHz | 1.440 MHz | 1.350 MHz |
| GPU Aumentar a velocidade do relógio | 2.520 MHz | 2.505 | 1.860 MHz | 1.695 MHz | 1.665 MHz | 1.710 MHz | 1.770 MHz |
| Barramento de memória | 384 bits | 256 bits | 384 bits | 384 bits | 384 bits | 320 bits | 384 bits |
| Largura de banda de memória | 1.008 GB/s | 735,7 GB/s | 1.008 GB/s | 936 GB/s | 912,4 GB/s | 760 GB/s | 672 GB/s |
| VRAM | 24 GB GDDR6X | 16 GB GDDR6X | 24 GB GDDR6X | 24 GB GDDR6X | 12 GB GDDR6X | 10 GB GDDR6X | 24 GB GDDR6X |
| Consumo de energia | 450 W | 320 W | 450 W | 350 W | 350 W | 320 W | 280 W |
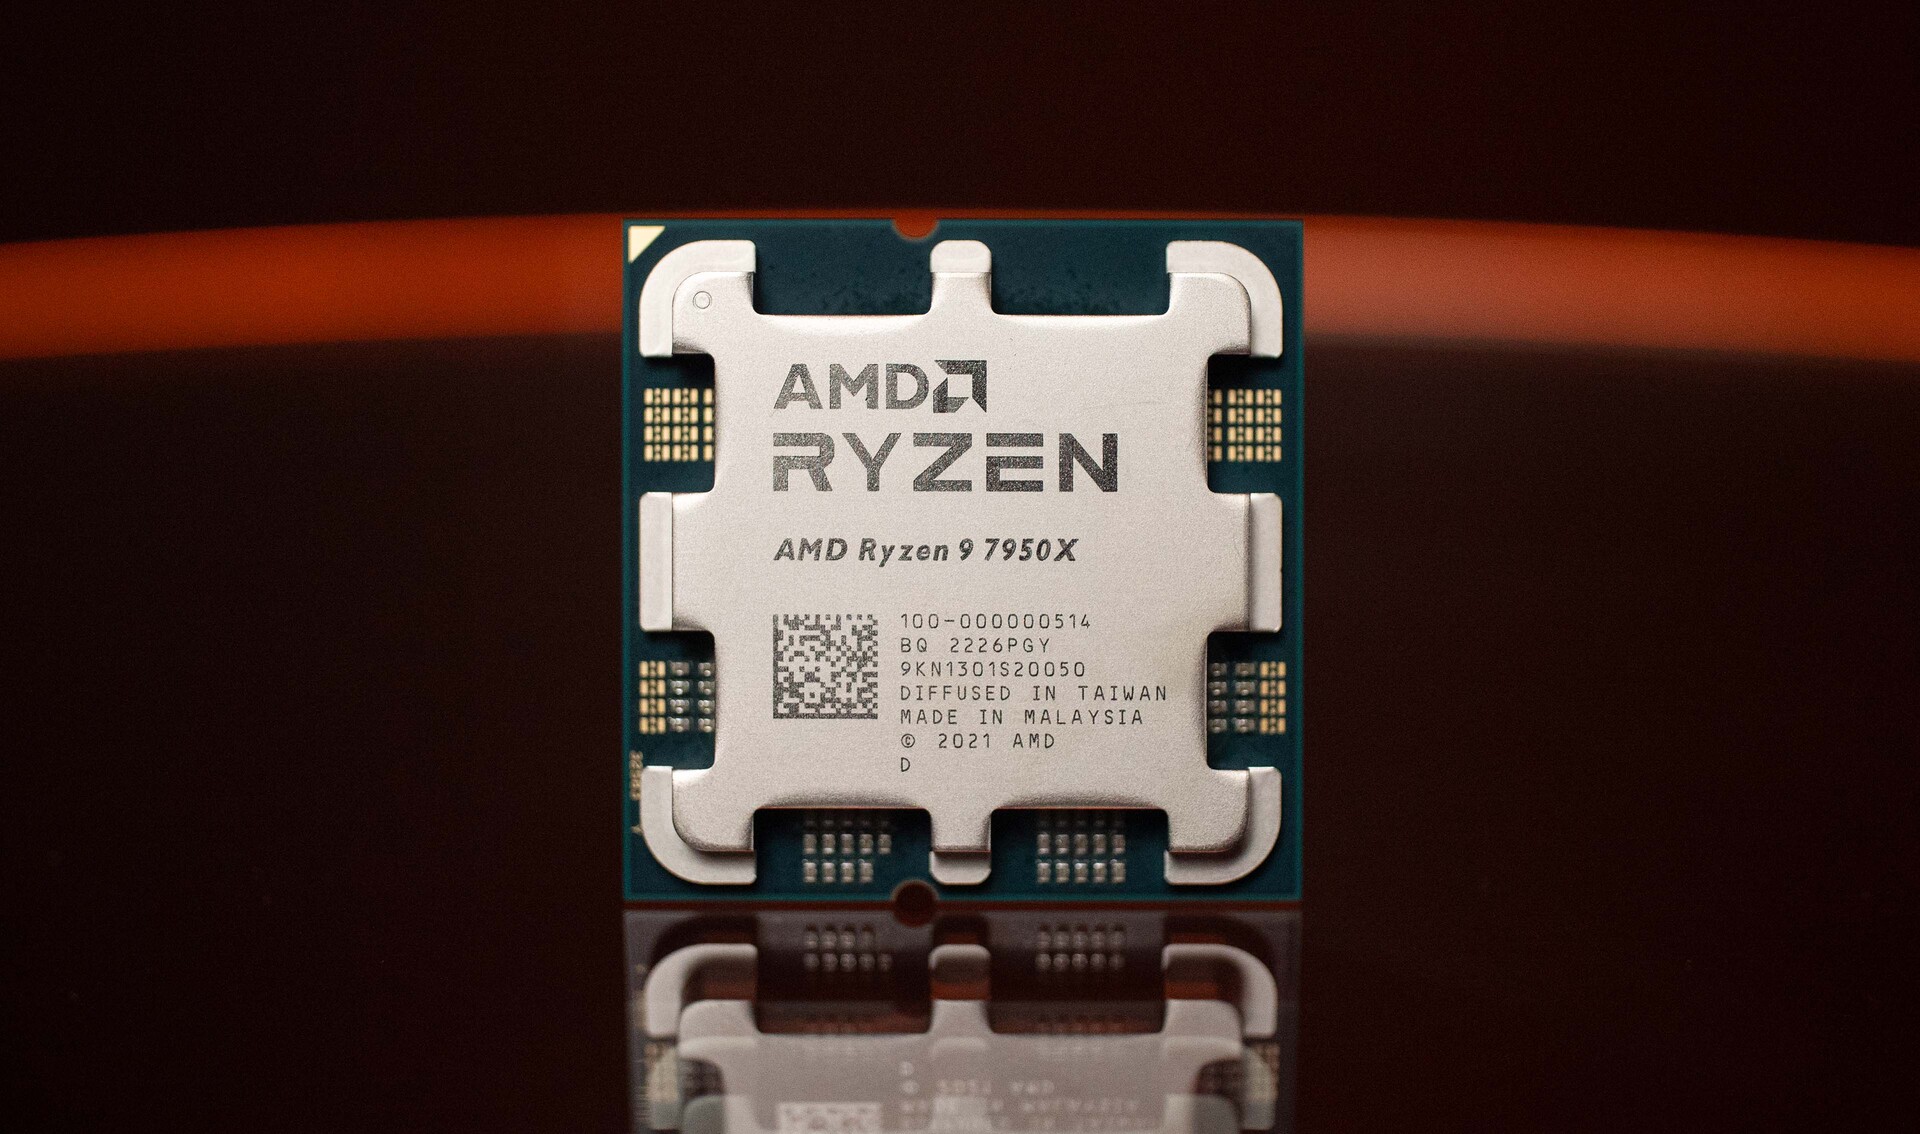
Nossa unidade de revisão com AMD Ryzen 9 7950X como base
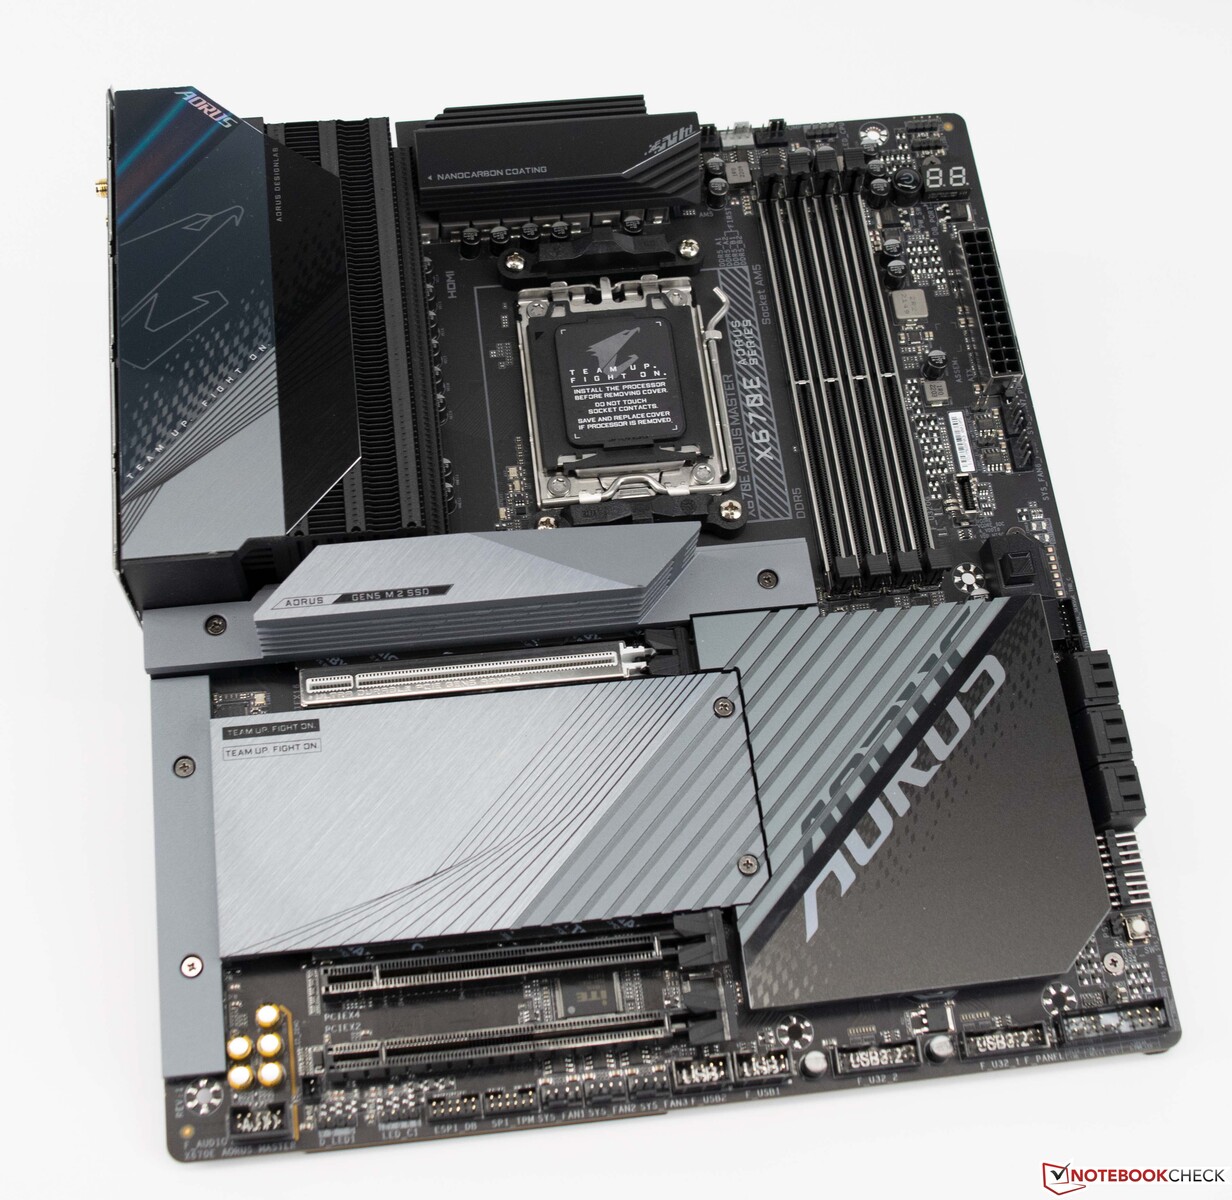
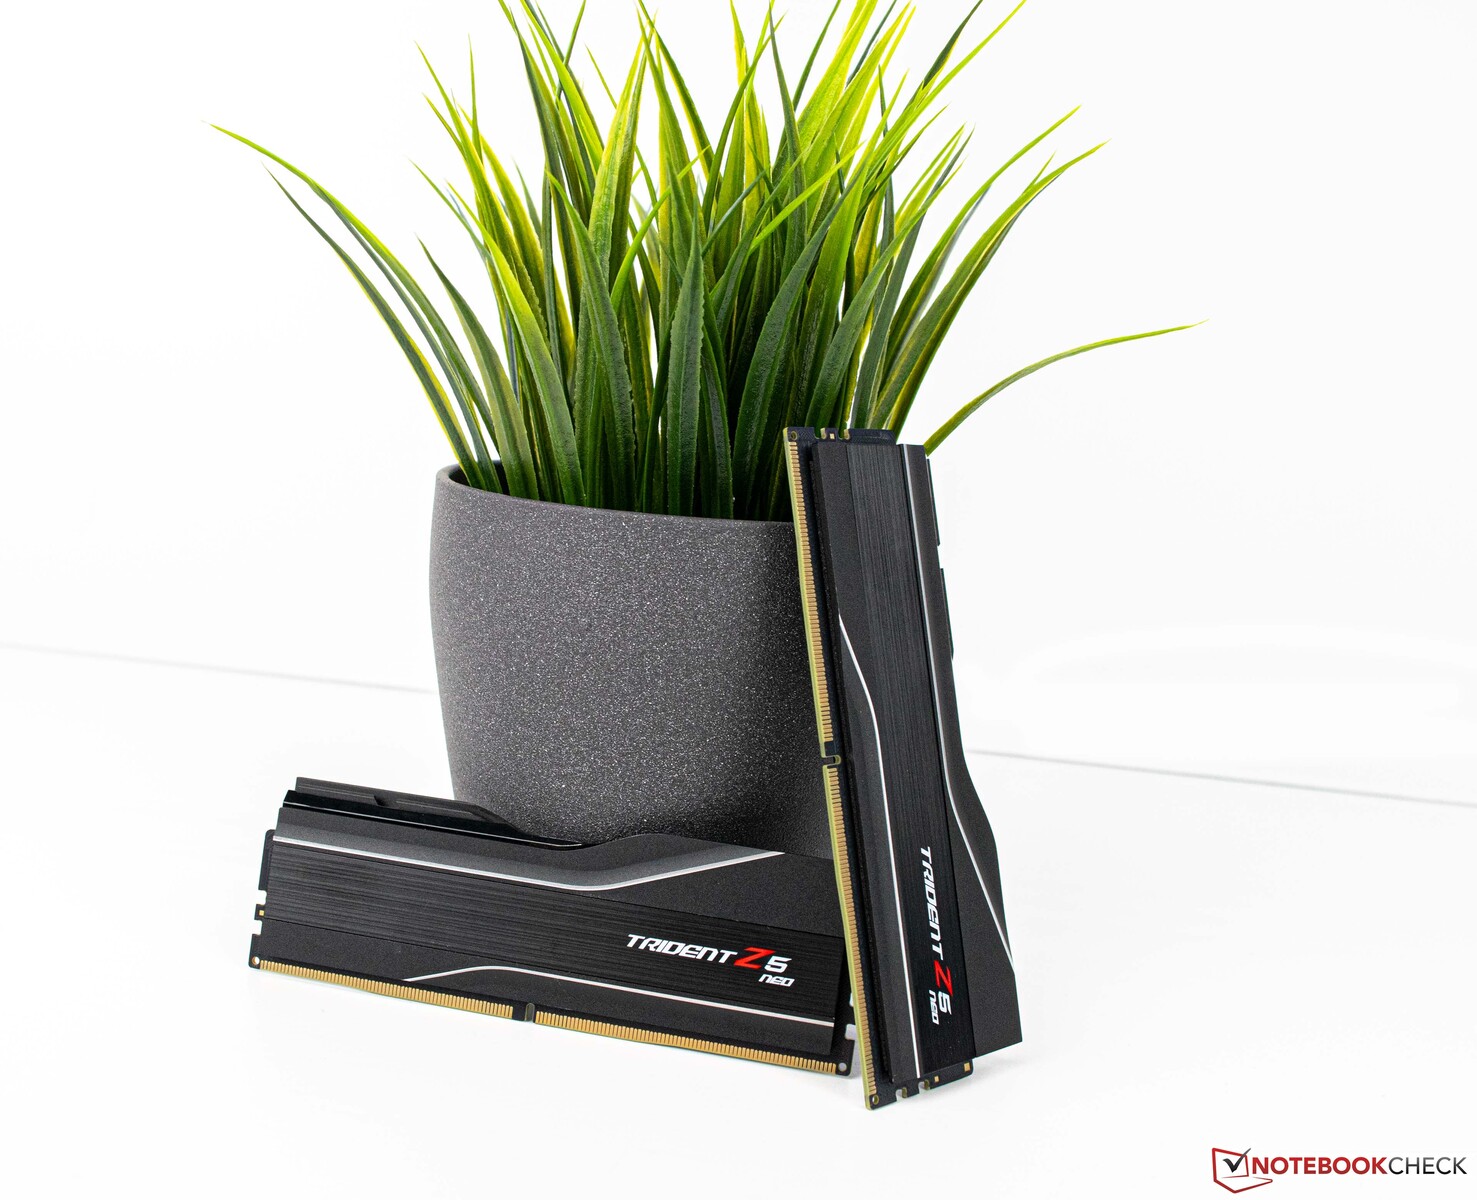
Como nosso sistema de teste, usamos uma plataforma AMD atual baseada na placa-mãe Gigabyte X670E Aorus Master. A CPU (AMD Ryzen 9 7950X) oferece bom desempenho de CPU e para refrigeração utilizamos uma solução AiO da Alphacool (Alphacool Eisbear Aurora 360 mm). A RAM de 32 GB vem da G.Skill e utiliza um perfil EXPO adequado. O monitor que usamos foi o Gigabyte M32U.
Detalhes de nosso sistema
Para as seguintes referências e testes, utilizamos este sistema
- Lian-Li O11 Dinâmica
- AMD Ryzen 9 7950X
- Gigabyte X670E Aorus Master, BIOS: F8a
- Alphacool Eisbear 360 AiO
- Fonte de alimentação Corsair RM 1000x
- G.Skill Trident Z5 Neo DDR5-6000 2x 16 GB, EXPO (DDR5-6000 CL30-38-38-96)
- Corsair MP600 2 TB
- Crucial MX500 2 TB
- Microsoft Windows 11 Professional 64-Bit (Versão 22H2)
Benchmarks Sintéticos
Os testes sintéticos já demonstram claramente o que o Nvidia GeForce RTX 4090 é capaz de fazer. O desempenho dos modelos top atuais é quase completamente pulverizado e na classificação geral de referência sintética o Palit GeForce RTX 4090 GameRock OC supera oNvidia GeForce RTX 3090 Tiem 52%. O modelo superior anterior da AMD (AMD Radeon RX 6950 XT) se encontra mais atrás na embalagem e ocupa o quarto lugar atrás da edição Nvidia GeForce RTX 3090 Founders Edition.
| Performance rating - Percent | |
| NVIDIA GeForce RTX 4090 | |
| NVIDIA Titan RTX | |
| AMD Radeon RX 6950 XT | |
| NVIDIA GeForce RTX 3090 | |
| NVIDIA GeForce RTX 3090 Ti -8! | |
| AMD Radeon RX 6900 XT | |
| NVIDIA GeForce RTX 3080 12 GB | |
| 3DMark | |
| 2560x1440 Time Spy Graphics | |
| NVIDIA GeForce RTX 4090 | |
| AMD Radeon RX 6950 XT | |
| NVIDIA GeForce RTX 3090 Ti | |
| NVIDIA GeForce RTX 3090 | |
| AMD Radeon RX 6900 XT | |
| NVIDIA GeForce RTX 3080 12 GB | |
| NVIDIA Titan RTX | |
| Fire Strike Extreme Graphics | |
| NVIDIA GeForce RTX 4090 | |
| AMD Radeon RX 6950 XT | |
| NVIDIA GeForce RTX 3090 Ti | |
| AMD Radeon RX 6900 XT | |
| NVIDIA GeForce RTX 3090 | |
| NVIDIA GeForce RTX 3080 12 GB | |
| NVIDIA Titan RTX | |
| 3840x2160 Fire Strike Ultra Graphics | |
| NVIDIA GeForce RTX 4090 | |
| AMD Radeon RX 6950 XT | |
| NVIDIA GeForce RTX 3090 Ti | |
| AMD Radeon RX 6900 XT | |
| NVIDIA GeForce RTX 3090 | |
| NVIDIA GeForce RTX 3080 12 GB | |
| NVIDIA Titan RTX | |
| 1920x1080 Fire Strike Graphics | |
| NVIDIA GeForce RTX 4090 | |
| AMD Radeon RX 6950 XT | |
| NVIDIA GeForce RTX 3090 Ti | |
| AMD Radeon RX 6900 XT | |
| NVIDIA GeForce RTX 3090 | |
| NVIDIA GeForce RTX 3080 12 GB | |
| NVIDIA Titan RTX | |
| Unigine Superposition | |
| 7680x4320 8k Optimized | |
| NVIDIA GeForce RTX 4090 | |
| NVIDIA GeForce RTX 3090 Ti | |
| NVIDIA GeForce RTX 3090 | |
| AMD Radeon RX 6950 XT | |
| NVIDIA GeForce RTX 3080 12 GB | |
| AMD Radeon RX 6900 XT | |
| NVIDIA Titan RTX | |
| 3840x2160 4k Optimized | |
| NVIDIA GeForce RTX 4090 | |
| NVIDIA GeForce RTX 3090 Ti | |
| AMD Radeon RX 6950 XT | |
| NVIDIA GeForce RTX 3090 | |
| NVIDIA GeForce RTX 3080 12 GB | |
| AMD Radeon RX 6900 XT | |
| NVIDIA Titan RTX | |
| 1920x1080 1080p Extreme | |
| NVIDIA GeForce RTX 4090 | |
| NVIDIA GeForce RTX 3090 Ti | |
| AMD Radeon RX 6950 XT | |
| NVIDIA GeForce RTX 3090 | |
| NVIDIA GeForce RTX 3080 12 GB | |
| AMD Radeon RX 6900 XT | |
| NVIDIA Titan RTX | |
| 1920x1080 1080p High | |
| NVIDIA GeForce RTX 4090 | |
| NVIDIA GeForce RTX 3090 Ti | |
| AMD Radeon RX 6950 XT | |
| NVIDIA GeForce RTX 3090 | |
| AMD Radeon RX 6900 XT | |
| NVIDIA GeForce RTX 3080 12 GB | |
| NVIDIA Titan RTX | |
| 1280x720 720p Low | |
| NVIDIA GeForce RTX 4090 | |
| NVIDIA Titan RTX | |
| NVIDIA GeForce RTX 3090 | |
| NVIDIA GeForce RTX 3090 Ti | |
| NVIDIA GeForce RTX 3080 12 GB | |
| AMD Radeon RX 6900 XT | |
| AMD Radeon RX 6950 XT | |
| Unigine Heaven 4.0 | |
| Extreme Preset DX11 | |
| NVIDIA GeForce RTX 4090 | |
| NVIDIA GeForce RTX 3090 | |
| NVIDIA GeForce RTX 3090 Ti | |
| AMD Radeon RX 6950 XT | |
| NVIDIA GeForce RTX 3080 12 GB | |
| AMD Radeon RX 6900 XT | |
| NVIDIA Titan RTX | |
| Extreme Preset OpenGL | |
| NVIDIA GeForce RTX 4090 | |
| NVIDIA GeForce RTX 3090 Ti | |
| NVIDIA GeForce RTX 3090 | |
| NVIDIA GeForce RTX 3080 12 GB | |
| AMD Radeon RX 6950 XT | |
| NVIDIA Titan RTX | |
| AMD Radeon RX 6900 XT | |
| Unigine Valley 1.0 | |
| 1920x1080 Extreme HD DirectX AA:x8 | |
| NVIDIA GeForce RTX 4090 | |
| NVIDIA GeForce RTX 3090 | |
| AMD Radeon RX 6950 XT | |
| NVIDIA GeForce RTX 3080 12 GB | |
| NVIDIA GeForce RTX 3090 Ti | |
| AMD Radeon RX 6900 XT | |
| NVIDIA Titan RTX | |
| 1920x1080 Extreme HD Preset OpenGL AA:x8 | |
| NVIDIA GeForce RTX 4090 | |
| NVIDIA GeForce RTX 3090 Ti | |
| NVIDIA GeForce RTX 3090 | |
| NVIDIA GeForce RTX 3080 12 GB | |
| AMD Radeon RX 6950 XT | |
| AMD Radeon RX 6900 XT | |
| NVIDIA Titan RTX | |
| 3DMark 11 | |
| 1280x720 Performance GPU | |
| NVIDIA GeForce RTX 4090 | |
| AMD Radeon RX 6950 XT | |
| NVIDIA GeForce RTX 3090 Ti | |
| NVIDIA GeForce RTX 3090 | |
| AMD Radeon RX 6900 XT | |
| NVIDIA GeForce RTX 3080 12 GB | |
| NVIDIA Titan RTX | |
| 1280x720 Performance | |
| NVIDIA GeForce RTX 4090 | |
| NVIDIA GeForce RTX 3090 Ti | |
| NVIDIA GeForce RTX 3090 | |
| NVIDIA Titan RTX | |
| AMD Radeon RX 6950 XT | |
| AMD Radeon RX 6900 XT | |
| NVIDIA GeForce RTX 3080 12 GB | |
| ComputeMark v2.1 | |
| 1024x600 Normal, QJuliaRayTrace | |
| NVIDIA GeForce RTX 4090 | |
| NVIDIA GeForce RTX 3090 | |
| NVIDIA GeForce RTX 3080 12 GB | |
| AMD Radeon RX 6950 XT | |
| AMD Radeon RX 6900 XT | |
| NVIDIA Titan RTX | |
| 1024x600 Normal, Mandel Scalar | |
| NVIDIA GeForce RTX 4090 | |
| AMD Radeon RX 6950 XT | |
| NVIDIA GeForce RTX 3090 | |
| AMD Radeon RX 6900 XT | |
| NVIDIA GeForce RTX 3080 12 GB | |
| NVIDIA Titan RTX | |
| 1024x600 Normal, Mandel Vector | |
| NVIDIA GeForce RTX 4090 | |
| NVIDIA GeForce RTX 3090 | |
| AMD Radeon RX 6950 XT | |
| AMD Radeon RX 6900 XT | |
| NVIDIA GeForce RTX 3080 12 GB | |
| NVIDIA Titan RTX | |
| 1024x600 Normal, Fluid 2DTexArr | |
| NVIDIA GeForce RTX 4090 | |
| NVIDIA GeForce RTX 3090 | |
| AMD Radeon RX 6950 XT | |
| NVIDIA GeForce RTX 3080 12 GB | |
| AMD Radeon RX 6900 XT | |
| NVIDIA Titan RTX | |
| 1024x600 Normal, Fluid 3DTex | |
| NVIDIA GeForce RTX 4090 | |
| AMD Radeon RX 6950 XT | |
| NVIDIA GeForce RTX 3090 | |
| AMD Radeon RX 6900 XT | |
| NVIDIA GeForce RTX 3080 12 GB | |
| NVIDIA Titan RTX | |
| 1024x600 Normal, Score | |
| NVIDIA GeForce RTX 4090 | |
| NVIDIA GeForce RTX 3090 | |
| AMD Radeon RX 6950 XT | |
| NVIDIA GeForce RTX 3080 12 GB | |
| AMD Radeon RX 6900 XT | |
| NVIDIA Titan RTX | |
| LuxMark v2.0 64Bit | |
| Sala GPUs-only | |
| AMD Radeon RX 6950 XT | |
| AMD Radeon RX 6900 XT | |
| NVIDIA GeForce RTX 4090 | |
| NVIDIA GeForce RTX 3090 | |
| NVIDIA GeForce RTX 3080 12 GB | |
| NVIDIA Titan RTX | |
| Room GPUs-only | |
| NVIDIA GeForce RTX 4090 | |
| NVIDIA GeForce RTX 3090 | |
| NVIDIA GeForce RTX 3080 12 GB | |
| AMD Radeon RX 6950 XT | |
| AMD Radeon RX 6900 XT | |
| NVIDIA Titan RTX | |
Palit GeForce RTX 4090 GameRock OC with Ryzen 9 vs. Core i9
| Performance rating - Percent | |
| NVIDIA GeForce RTX 4090, AMD Ryzen 9 7950X | |
| NVIDIA GeForce RTX 4090, Intel Core i9-13900K | |
| 3DMark | |
| 2560x1440 Time Spy Graphics | |
| NVIDIA GeForce RTX 4090, Intel Core i9-13900K | |
| NVIDIA GeForce RTX 4090, AMD Ryzen 9 7950X | |
| Fire Strike Extreme Graphics | |
| NVIDIA GeForce RTX 4090, AMD Ryzen 9 7950X | |
| NVIDIA GeForce RTX 4090, Intel Core i9-13900K | |
| 3840x2160 Fire Strike Ultra Graphics | |
| NVIDIA GeForce RTX 4090, Intel Core i9-13900K | |
| NVIDIA GeForce RTX 4090, AMD Ryzen 9 7950X | |
| 1920x1080 Fire Strike Graphics | |
| NVIDIA GeForce RTX 4090, AMD Ryzen 9 7950X | |
| NVIDIA GeForce RTX 4090, Intel Core i9-13900K | |
| Unigine Superposition | |
| 7680x4320 8k Optimized | |
| NVIDIA GeForce RTX 4090, AMD Ryzen 9 7950X | |
| NVIDIA GeForce RTX 4090, Intel Core i9-13900K | |
| 3840x2160 4k Optimized | |
| NVIDIA GeForce RTX 4090, Intel Core i9-13900K | |
| NVIDIA GeForce RTX 4090, AMD Ryzen 9 7950X | |
| 1920x1080 1080p Extreme | |
| NVIDIA GeForce RTX 4090, Intel Core i9-13900K | |
| NVIDIA GeForce RTX 4090, AMD Ryzen 9 7950X | |
| 1920x1080 1080p High | |
| NVIDIA GeForce RTX 4090, Intel Core i9-13900K | |
| NVIDIA GeForce RTX 4090, AMD Ryzen 9 7950X | |
| 1280x720 720p Low | |
| NVIDIA GeForce RTX 4090, Intel Core i9-13900K | |
| NVIDIA GeForce RTX 4090, AMD Ryzen 9 7950X | |
| Unigine Heaven 4.0 | |
| Extreme Preset DX11 | |
| NVIDIA GeForce RTX 4090, AMD Ryzen 9 7950X | |
| NVIDIA GeForce RTX 4090, Intel Core i9-13900K | |
| Extreme Preset OpenGL | |
| NVIDIA GeForce RTX 4090, Intel Core i9-13900K | |
| NVIDIA GeForce RTX 4090, AMD Ryzen 9 7950X | |
| Unigine Valley 1.0 | |
| 1920x1080 Extreme HD DirectX AA:x8 | |
| NVIDIA GeForce RTX 4090, Intel Core i9-13900K | |
| NVIDIA GeForce RTX 4090, AMD Ryzen 9 7950X | |
| 1920x1080 Extreme HD Preset OpenGL AA:x8 | |
| NVIDIA GeForce RTX 4090, Intel Core i9-13900K | |
| NVIDIA GeForce RTX 4090, AMD Ryzen 9 7950X | |
| 3DMark 11 | |
| 1280x720 Performance GPU | |
| NVIDIA GeForce RTX 4090, AMD Ryzen 9 7950X | |
| NVIDIA GeForce RTX 4090, Intel Core i9-13900K | |
| 1280x720 Performance | |
| NVIDIA GeForce RTX 4090, AMD Ryzen 9 7950X | |
| NVIDIA GeForce RTX 4090, Intel Core i9-13900K | |
Compute Benchmarks and professional applications
| ComputeMark v2.1 | |
| 1024x600 Normal, QJuliaRayTrace | |
| NVIDIA GeForce RTX 4090 | |
| NVIDIA GeForce RTX 3090 | |
| NVIDIA GeForce RTX 3080 12 GB | |
| AMD Radeon RX 6950 XT | |
| AMD Radeon RX 6900 XT | |
| NVIDIA Titan RTX | |
| 1024x600 Normal, Mandel Scalar | |
| NVIDIA GeForce RTX 4090 | |
| AMD Radeon RX 6950 XT | |
| NVIDIA GeForce RTX 3090 | |
| AMD Radeon RX 6900 XT | |
| NVIDIA GeForce RTX 3080 12 GB | |
| NVIDIA Titan RTX | |
| 1024x600 Normal, Mandel Vector | |
| NVIDIA GeForce RTX 4090 | |
| NVIDIA GeForce RTX 3090 | |
| AMD Radeon RX 6950 XT | |
| AMD Radeon RX 6900 XT | |
| NVIDIA GeForce RTX 3080 12 GB | |
| NVIDIA Titan RTX | |
| 1024x600 Normal, Fluid 2DTexArr | |
| NVIDIA GeForce RTX 4090 | |
| NVIDIA GeForce RTX 3090 | |
| AMD Radeon RX 6950 XT | |
| NVIDIA GeForce RTX 3080 12 GB | |
| AMD Radeon RX 6900 XT | |
| NVIDIA Titan RTX | |
| 1024x600 Normal, Fluid 3DTex | |
| NVIDIA GeForce RTX 4090 | |
| AMD Radeon RX 6950 XT | |
| NVIDIA GeForce RTX 3090 | |
| AMD Radeon RX 6900 XT | |
| NVIDIA GeForce RTX 3080 12 GB | |
| NVIDIA Titan RTX | |
| 1024x600 Normal, Score | |
| NVIDIA GeForce RTX 4090 | |
| NVIDIA GeForce RTX 3090 | |
| AMD Radeon RX 6950 XT | |
| NVIDIA GeForce RTX 3080 12 GB | |
| AMD Radeon RX 6900 XT | |
| NVIDIA Titan RTX | |
| LuxMark v2.0 64Bit | |
| Sala GPUs-only | |
| AMD Radeon RX 6950 XT | |
| AMD Radeon RX 6900 XT | |
| NVIDIA GeForce RTX 4090 | |
| NVIDIA GeForce RTX 3090 | |
| NVIDIA GeForce RTX 3080 12 GB | |
| NVIDIA Titan RTX | |
| Room GPUs-only | |
| NVIDIA GeForce RTX 4090 | |
| NVIDIA GeForce RTX 3090 | |
| NVIDIA GeForce RTX 3080 12 GB | |
| AMD Radeon RX 6950 XT | |
| AMD Radeon RX 6900 XT | |
| NVIDIA Titan RTX | |
| Blender - v3.3 Classroom CUDA | |
| NVIDIA Titan RTX | |
| Geekbench 5.5 | |
| OpenCL Score | |
| NVIDIA GeForce RTX 4090 | |
| NVIDIA GeForce RTX 3090 Ti | |
| NVIDIA GeForce RTX 3090 | |
| NVIDIA GeForce RTX 3080 12 GB | |
| AMD Radeon RX 6950 XT | |
| AMD Radeon RX 6900 XT | |
| NVIDIA Titan RTX | |
| Vulkan Score 5.5 | |
| NVIDIA GeForce RTX 3090 Ti | |
| NVIDIA GeForce RTX 4090 | |
| NVIDIA Titan RTX | |
| NVIDIA GeForce RTX 3090 | |
| AMD Radeon RX 6900 XT | |
| AMD Radeon RX 6950 XT | |
| NVIDIA GeForce RTX 3080 12 GB | |
| V-Ray 5 Benchmark | |
| GPU CUDA | |
| NVIDIA GeForce RTX 4090 | |
| NVIDIA GeForce RTX 3090 | |
| NVIDIA GeForce RTX 3080 12 GB | |
| AMD Radeon RX 6950 XT | |
| GPU RTX | |
| NVIDIA GeForce RTX 4090 | |
| NVIDIA GeForce RTX 3090 | |
* ... menor é melhor
Benchmarks de jogo
O Palit GeForce RTX 4090 GameRock OC tem um desempenho muito bom não apenas em benchmarks sintéticos, mas também em testes de jogos. Ganhos de até 50 a 60 por cento são canja para este monstro de uma placa gráfica. Embora a AMD fique muito atrás aqui, o novo AMD Radeon RX 7900 XTX já está nos blocos iniciais.
Para uma comparação justa, também testamos o Palit GeForce RTX 4090 GameRock OC com o Intel Core i9-13900K. Aqui é possível extrair um pouco mais de desempenho da placa gráfica. Mais uma vez, isto confirma que o Core i9-13900K da Intel oferece atualmente a solução de CPU para jogos mais rápida. O desempenho quando emparelhado com umaAMD Ryzen 9 7950Xnão é nada para se espirrar. Entretanto, se o objetivo é espremer cada último quadro por segundo da placa gráfica, atualmente não há como contornar uma plataforma Intel. Um display de 4K deve ser usado devido ao enorme poder do Palit GeForce RTX 4090 GameRock OC. Mesmo com esta alta resolução, às vezes atingimos os limites da CPU, o que torna a GPU um pouco mais lenta. Atualmente, existem apenas alguns jogos, por exemplo Cyberpunk 2077, F1 2022 ou The Quarry que realmente fazem o GeForce RTX 4090 quebrar o suor em 4K. Com recursos como o DLSS, isto pode ser neutralizado para que taxas de quadros de três dígitos também possam ser alcançadas aqui. Determinamos todos os resultados de referência usando o DLSS da Nvidia.
O novo DLSS 3.0 que é baseado no DLSS 2.0 e é expandido com o conjunto de recursos Frame Generation (FG), ajuda drasticamente a aumentar as taxas de quadros. O jogo mais famoso a ser beneficiado por este é o Cyberpunk 2077. Na resolução nativa de 4K e o Ray Tracing Ultra Preset até mesmo o GeForce RTX 4090 paira em torno de uma média de apenas 43 quadros por segundo. Ao ativar o DLSS mais de 100 quadros por segundo são possíveis, o que quase triplica o desempenho. O DLSS 3.0 depende do Núcleo Tensor de quarta geração que atualmente é usado apenas na série RTX 4000. Uma lista de jogos que já suportam DLSS 3.0 ou que serão suportados com este recurso no futuro pode ser encontrada aqui:
| GTA V - 3840x2160 High/On (Advanced Graphics Off) AA:FX AF:8x | |
| NVIDIA GeForce RTX 4090, AMD Ryzen 9 7950X | |
| NVIDIA GeForce RTX 3090 Ti, AMD Ryzen 7 5800X3D | |
| NVIDIA GeForce RTX 3090, AMD Ryzen 9 7950X | |
| AMD Radeon RX 6950 XT, AMD Ryzen 9 5900X | |
| NVIDIA GeForce RTX 3080 12 GB, AMD Ryzen 9 5900X | |
| NVIDIA Titan RTX, AMD Ryzen 9 7950X | |
| The Witcher 3 - 3840x2160 High Graphics & Postprocessing (Nvidia HairWorks Off) | |
| NVIDIA GeForce RTX 4090, AMD Ryzen 9 7950X | |
| NVIDIA GeForce RTX 3090 Ti, AMD Ryzen 7 5800X3D | |
| NVIDIA GeForce RTX 3090, AMD Ryzen 9 7950X | |
| AMD Radeon RX 6950 XT, AMD Ryzen 9 5900X | |
| NVIDIA GeForce RTX 3080 12 GB, AMD Ryzen 9 5900X | |
| AMD Radeon RX 6900 XT, AMD Ryzen 9 5950X | |
| NVIDIA Titan RTX, AMD Ryzen 9 7950X | |
| Final Fantasy XV Benchmark - 3840x2160 High Quality | |
| NVIDIA GeForce RTX 4090, AMD Ryzen 9 7950X | |
| NVIDIA GeForce RTX 3090 Ti, AMD Ryzen 7 5800X3D | |
| NVIDIA GeForce RTX 3090, AMD Ryzen 9 7950X | |
| AMD Radeon RX 6950 XT, AMD Ryzen 9 5900X | |
| NVIDIA GeForce RTX 3080 12 GB, AMD Ryzen 9 5900X | |
| NVIDIA Titan RTX, AMD Ryzen 9 7950X | |
| Strange Brigade - 3840x2160 ultra AA:ultra AF:16 | |
| NVIDIA GeForce RTX 4090, AMD Ryzen 9 7950X | |
| AMD Radeon RX 6950 XT, AMD Ryzen 9 5900X | |
| NVIDIA GeForce RTX 3090, AMD Ryzen 9 7950X | |
| NVIDIA GeForce RTX 3080 12 GB, AMD Ryzen 9 5900X | |
| NVIDIA Titan RTX, AMD Ryzen 9 7950X | |
| Far Cry 5 - 3840x2160 Ultra Preset AA:T | |
| NVIDIA GeForce RTX 4090, AMD Ryzen 9 7950X | |
| AMD Radeon RX 6950 XT, AMD Ryzen 9 5900X | |
| NVIDIA GeForce RTX 3090, AMD Ryzen 9 7950X | |
| NVIDIA GeForce RTX 3080 12 GB, AMD Ryzen 9 5900X | |
| NVIDIA Titan RTX, AMD Ryzen 9 7950X | |
| Far Cry New Dawn - 3840x2160 Ultra Preset | |
| NVIDIA GeForce RTX 4090, AMD Ryzen 9 7950X | |
| AMD Radeon RX 6950 XT, AMD Ryzen 9 5900X | |
| NVIDIA GeForce RTX 3090, AMD Ryzen 9 7950X | |
| AMD Radeon RX 6900 XT, AMD Ryzen 9 5950X | |
| NVIDIA GeForce RTX 3080 12 GB, AMD Ryzen 9 5900X | |
| NVIDIA Titan RTX, AMD Ryzen 9 7950X | |
| Far Cry 6 - 3840x2160 Ultra Graphics Quality + HD Textures AA:T | |
| NVIDIA GeForce RTX 4090, AMD Ryzen 9 7950X | |
| NVIDIA GeForce RTX 3090 Ti, AMD Ryzen 7 5800X3D | |
| AMD Radeon RX 6950 XT, AMD Ryzen 9 5900X | |
| NVIDIA GeForce RTX 3090, AMD Ryzen 9 7950X | |
| NVIDIA Titan RTX, AMD Ryzen 9 7950X | |
| NVIDIA GeForce RTX 3080 12 GB, AMD Ryzen 9 5900X | |
| Metro Exodus - 3840x2160 Ultra Quality AF:16x | |
| NVIDIA GeForce RTX 4090, AMD Ryzen 9 7950X | |
| NVIDIA GeForce RTX 3090 Ti, AMD Ryzen 7 5800X3D | |
| NVIDIA GeForce RTX 3090, AMD Ryzen 9 7950X | |
| AMD Radeon RX 6950 XT, AMD Ryzen 9 5900X | |
| AMD Radeon RX 6900 XT, AMD Ryzen 9 5950X | |
| NVIDIA GeForce RTX 3080 12 GB, AMD Ryzen 9 5900X | |
| NVIDIA Titan RTX, AMD Ryzen 9 7950X | |
| F1 2020 - 3840x2160 Ultra High Preset AA:T AF:16x | |
| NVIDIA GeForce RTX 4090, AMD Ryzen 9 7950X | |
| AMD Radeon RX 6950 XT, AMD Ryzen 9 5900X | |
| NVIDIA GeForce RTX 3090, AMD Ryzen 9 7950X | |
| AMD Radeon RX 6900 XT, AMD Ryzen 9 5950X | |
| AMD Radeon RX 6900 XT, AMD Ryzen 9 5950X | |
| NVIDIA GeForce RTX 3080 12 GB, AMD Ryzen 9 5900X | |
| NVIDIA Titan RTX, AMD Ryzen 9 7950X | |
| F1 2021 - 3840x2160 Ultra High Preset + Raytracing AA:T AF:16x | |
| NVIDIA GeForce RTX 4090, AMD Ryzen 9 7950X | |
| NVIDIA GeForce RTX 3090 Ti, AMD Ryzen 7 5800X3D | |
| NVIDIA GeForce RTX 3090, AMD Ryzen 9 7950X | |
| AMD Radeon RX 6950 XT, AMD Ryzen 9 5900X | |
| NVIDIA GeForce RTX 3080 12 GB, AMD Ryzen 9 5900X | |
| NVIDIA Titan RTX, AMD Ryzen 9 7950X | |
| F1 22 - 3840x2160 Ultra High Preset AA:T AF:16x | |
| NVIDIA GeForce RTX 4090, AMD Ryzen 9 7950X | |
| NVIDIA GeForce RTX 3090, AMD Ryzen 9 7950X | |
| AMD Radeon RX 6950 XT, AMD Ryzen 9 5900X | |
| NVIDIA Titan RTX, AMD Ryzen 9 7950X | |
| Borderlands 3 - 3840x2160 Badass Overall Quality (DX11) | |
| NVIDIA GeForce RTX 4090, AMD Ryzen 9 7950X | |
| NVIDIA GeForce RTX 3090 Ti, AMD Ryzen 7 5800X3D | |
| NVIDIA GeForce RTX 3090, AMD Ryzen 9 7950X | |
| NVIDIA GeForce RTX 3080 12 GB, AMD Ryzen 9 5900X | |
| AMD Radeon RX 6950 XT, AMD Ryzen 9 5900X | |
| AMD Radeon RX 6900 XT, AMD Ryzen 9 5950X | |
| AMD Radeon RX 6900 XT, AMD Ryzen 9 5950X | |
| NVIDIA Titan RTX, AMD Ryzen 9 7950X | |
| Cyberpunk 2077 1.6 - 3840x2160 Ultra Preset | |
| NVIDIA GeForce RTX 4090, AMD Ryzen 9 7950X | |
| NVIDIA GeForce RTX 3090 Ti, AMD Ryzen 7 5800X3D | |
| AMD Radeon RX 6950 XT, AMD Ryzen 9 5900X | |
Palit GeForce RTX 4090 GameRock OC with Ryzen 9 vs. Core i9
| Performance rating - Percent | |
| Palit GeForce RTX 4090 GameRock OC -1! | |
| Palit GeForce RTX 4090 GameRock OC | |
| GTA V - 3840x2160 Highest AA:4xMSAA + FX AF:16x | |
| Palit GeForce RTX 4090 GameRock OC | |
| Palit GeForce RTX 4090 GameRock OC | |
| The Witcher 3 - 3840x2160 Ultra Graphics & Postprocessing (HBAO+) | |
| Palit GeForce RTX 4090 GameRock OC | |
| Palit GeForce RTX 4090 GameRock OC | |
| Dota 2 Reborn - 3840x2160 ultra (3/3) best looking | |
| Palit GeForce RTX 4090 GameRock OC | |
| Palit GeForce RTX 4090 GameRock OC | |
| Final Fantasy XV Benchmark - 3840x2160 High Quality | |
| Palit GeForce RTX 4090 GameRock OC | |
| Palit GeForce RTX 4090 GameRock OC | |
| X-Plane 11.11 - 3840x2160 high (fps_test=3) | |
| Palit GeForce RTX 4090 GameRock OC | |
| Palit GeForce RTX 4090 GameRock OC | |
| Shadow of the Tomb Raider - 3840x2160 Highest Preset AA:T | |
| Palit GeForce RTX 4090 GameRock OC | |
| Palit GeForce RTX 4090 GameRock OC | |
| Far Cry 5 - 3840x2160 Ultra Preset AA:T | |
| Palit GeForce RTX 4090 GameRock OC | |
| Palit GeForce RTX 4090 GameRock OC | |
| Far Cry New Dawn - 3840x2160 Ultra Preset | |
| Palit GeForce RTX 4090 GameRock OC | |
| Palit GeForce RTX 4090 GameRock OC | |
| Far Cry 6 - 3840x2160 Ultra Graphics Quality + HD Textures AA:T | |
| Palit GeForce RTX 4090 GameRock OC | |
| Palit GeForce RTX 4090 GameRock OC | |
| GRID Legends - 3840x2160 Ultra Preset | |
| Palit GeForce RTX 4090 GameRock OC | |
| Palit GeForce RTX 4090 GameRock OC | |
| Metro Exodus - 3840x2160 Ultra Quality AF:16x | |
| Palit GeForce RTX 4090 GameRock OC | |
| Palit GeForce RTX 4090 GameRock OC | |
| Forza Horizon 5 - 3840x2160 Extreme Preset | |
| Palit GeForce RTX 4090 GameRock OC | |
| F1 2020 - 3840x2160 Ultra High Preset AA:T AF:16x | |
| Palit GeForce RTX 4090 GameRock OC | |
| Palit GeForce RTX 4090 GameRock OC | |
| F1 2021 - 3840x2160 Ultra High Preset + Raytracing AA:T AF:16x | |
| Palit GeForce RTX 4090 GameRock OC | |
| Palit GeForce RTX 4090 GameRock OC | |
| F1 22 - 3840x2160 Ultra High Preset AA:T AF:16x | |
| Palit GeForce RTX 4090 GameRock OC | |
| Palit GeForce RTX 4090 GameRock OC | |
| Borderlands 3 - 3840x2160 Badass Overall Quality (DX11) | |
| Palit GeForce RTX 4090 GameRock OC | |
| Palit GeForce RTX 4090 GameRock OC | |
| Tiny Tina's Wonderlands - 3840x2160 Badass Preset (DX12) | |
| Palit GeForce RTX 4090 GameRock OC | |
| Palit GeForce RTX 4090 GameRock OC | |
| God of War - 3840x2160 Ultra Preset | |
| Palit GeForce RTX 4090 GameRock OC | |
| Palit GeForce RTX 4090 GameRock OC | |
| The Quarry - 3840x2160 Ultra Preset | |
| Palit GeForce RTX 4090 GameRock OC | |
| Palit GeForce RTX 4090 GameRock OC | |
| Cyberpunk 2077 1.6 | |
| 3840x2160 Ray Tracing Ultra Preset (DLSS off) | |
| Palit GeForce RTX 4090 GameRock OC | |
| Palit GeForce RTX 4090 GameRock OC | |
| 3840x2160 Ultra Preset | |
| Palit GeForce RTX 4090 GameRock OC | |
| Palit GeForce RTX 4090 GameRock OC | |
| baixo | média | alto | ultra | QHD | 4K DLSS | 4K | |
|---|---|---|---|---|---|---|---|
| GTA V (2015) | 188.2 | 187.9 | 187.4 | 162 | 164.8 | 187.5 | |
| The Witcher 3 (2015) | 826 | 747 | 642 | 320 | 284 | ||
| Dota 2 Reborn (2015) | 310.6 | 276 | 262.9 | 239.2 | 234.4 | ||
| Rise of the Tomb Raider (2016) | 494 | 403 | 379 | 378 | 239 | ||
| Final Fantasy XV Benchmark (2018) | 236 | 233 | 233 | 225 | 161.1 | ||
| X-Plane 11.11 (2018) | 223 | 196.3 | 151.6 | 124.5 | |||
| Far Cry 5 (2018) | 238 | 209 | 200 | 188 | 185 | 175 | |
| Strange Brigade (2018) | 698 | 575 | 570 | 565 | 512 | 281 | |
| Shadow of the Tomb Raider (2018) | 332 | 325 | 323 | 304 | 279 | 186 | |
| Far Cry New Dawn (2019) | 200 | 177 | 171 | 154 | 152 | 145 | |
| Metro Exodus (2019) | 300 | 265 | 234 | 201 | 185.8 | 139.7 | |
| Anno 1800 (2019) | 211 | 199.3 | 143.1 | 73.6 | 72.8 | 66.9 | |
| Control (2019) | 240 | 240 | 240 | 219 | 113.3 | ||
| Borderlands 3 (2019) | 242 | 216 | 200 | 186.8 | 186 | 135 | |
| F1 2020 (2020) | 563 | 475 | 471 | 412 | 407 | 286 | |
| Crysis Remastered (2020) | 491 | 446 | 327 | 284 | 231 | 147.3 | |
| Mafia Definitive Edition (2020) | 292 | 266 | 237 | 226 | 162.7 | ||
| Watch Dogs Legion (2020) | 184.6 | 178.7 | 160.3 | 149.7 | 146.5 | 116.7 | |
| Dirt 5 (2020) | 385.7 | 356.1 | 333.8 | 325.7 | 287.4 | 190.4 | |
| F1 2021 (2021) | 677 | 642 | 529 | 271 | 263 | 199.1 | |
| New World (2021) | 215 | 188 | 183.5 | 175.3 | 174.8 | 149.3 | |
| Far Cry 6 (2021) | 209 | 189.4 | 169.5 | 173.9 | 168.4 | 136.9 | |
| Riders Republic (2021) | 318 | 309 | 292 | 279 | 229 | 149 | |
| Forza Horizon 5 (2021) | 411 | 302 | 283 | 208 | 197 | 162 | |
| God of War (2022) | 278 | 276 | 269 | 212 | 179.5 | 130.1 | |
| GRID Legends (2022) | 330 | 297 | 262 | 252 | 244 | 201 | |
| Cyberpunk 2077 1.6 (2022) | 229 | 225 | 215 | 207 | 149.6 | 78 | |
| Ghostwire Tokyo (2022) | 284 | 281 | 280 | 277 | 277 | 163.4 | |
| Tiny Tina's Wonderlands (2022) | 428 | 354 | 311 | 289 | 229 | 130.3 | |
| Vampire Bloodhunt (2022) | 460 | 398 | 394 | 382 | 374 | 254 | |
| F1 22 (2022) | 443 | 414 | 414 | 194.5 | 157.5 | 82.5 | |
| The Quarry (2022) | 427 | 337 | 290 | 256 | 193.8 | 75.4 | |
| FIFA 23 (2022) | 276 | 273 | 270 | 267 | 248 | 245 | |
| A Plague Tale Requiem (2022) | 179.6 | 173.6 | 167.9 | 154.3 | 125.8 | 73.7 | |
| Uncharted Legacy of Thieves Collection (2022) | 146.3 | 145.5 | 144.5 | 143.7 | 143.6 | 100.7 | |
| Call of Duty Modern Warfare 2 2022 (2022) | 304 | 287 | 245 | 240 | 191 | 183 | 128 |
| Spider-Man Miles Morales (2022) | 208 | 198.9 | 174.5 | 175.4 | 174.4 | 130.8 | |
| The Callisto Protocol (2022) | 229 | 222 | 202 | 201 | 183 | 127 | |
| Need for Speed Unbound (2022) | 178.2 | 171.1 | 154.3 | 153.7 | 152.8 | 146.3 | |
| High On Life (2023) | 388 | 357 | 307 | 293 | 224 | 106.6 | |
| The Witcher 3 v4 (2023) | 289 | 255 | 229 | 212 | 212 | 164.2 | |
| Dead Space Remake (2023) | 266 | 265 | 246 | 248 | 199.7 | 106.5 | |
| Hogwarts Legacy (2023) | 162.1 | 142.9 | 129.6 | 121.5 | 120.3 | 86 | |
| Returnal (2023) | 214 | 212 | 208 | 201 | 174 | 109 | |
| Atomic Heart (2023) | 316 | 251 | 234 | 223 | 181.6 | 110.9 | |
| Company of Heroes 3 (2023) | 383.1 | 364 | 344.8 | 330.8 | 302.8 | 205.7 | |
| Sons of the Forest (2023) | 133.3 | 126.3 | 122.3 | 120.7 | 118 | 114.2 | |
| Resident Evil 4 Remake (2023) | 287 | 303 | 294 | 213 | 188.9 | 121.8 | |
| The Last of Us (2023) | 169.6 | 163.2 | 163 | 162.8 | 136.9 | 118.1 | 77.4 |
| Dead Island 2 (2023) | 326 | 312 | 280 | 250 | 261 | 165.1 | |
| Star Wars Jedi Survivor (2023) | 170.6 | 166.3 | 160 | 155.4 | 150.3 | 80.4 | |
| Diablo 4 (2023) | 398 | 399 | 399 | 398 | 392 | 239 | 220 |
| F1 23 (2023) | 476 | 509 | 472 | 210 | 154 | 134 | 79.6 |
| Ratchet & Clank Rift Apart (2023) | 231 | 217 | 184.7 | 153.5 | 147.1 | 108.8 | |
| Atlas Fallen (2023) | 194.9 | 192.5 | 187 | 185.4 | 184.2 | 168.4 | |
| Immortals of Aveum (2023) | 155.6 | 138.2 | 124.4 | 97.3 | 126.1 | 62.6 | |
| Armored Core 6 (2023) | 119.7 | 119.6 | 119.8 | 119.5 | 119.5 | 119.3 | |
| Starfield (2023) | 138.9 | 139.2 | 130 | 124.5 | 78.1 | ||
| Lies of P (2023) | 330 | 327 | 303 | 286 | 264 | 237 | 166.7 |
| Baldur's Gate 3 (2023) | 323 | 299 | 274 | 265 | 203 | 189.4 | 112.6 |
| Counter-Strike 2 (2023) | 351 | 340 | 339 | 340 | 312 | 202 | |
| EA Sports FC 24 (2023) | 382 | 323 | 266 | 264 | 263 | 254 | |
| Assassin's Creed Mirage (2023) | 247 | 240 | 230 | 170 | 162 | 144 | 126 |
| Total War Pharaoh (2023) | 565.7 | 348.2 | 231.3 | 187.1 | 186.2 | 158.2 | |
| Lords of the Fallen (2023) | 181.7 | 174.2 | 155 | 116 | 88.6 | 88.6 | 53.2 |
| Alan Wake 2 (2023) | 152.4 | 149.3 | 144.4 | 126.7 | 58.7 | 72.2 | |
| EA Sports WRC (2023) | 255 | 170.6 | 157.8 | 152.6 | 147.4 | 139.6 | 121 |
| Call of Duty Modern Warfare 3 2023 (2023) | 330 | 306 | 265 | 254 | 199 | 129 | |
| Avatar Frontiers of Pandora (2023) | 251 | 234 | 209 | 170 | 124 | 113 | 69 |
| The Finals (2023) | 332 | 309 | 295 | 300 | 256 | 209 | 139.2 |
| Ready or Not (2023) | 336 | 356 | 336 | 323 | 263 | 243 | 132.4 |
Palit GeForce RTX 4090 GameRock Emissões OC
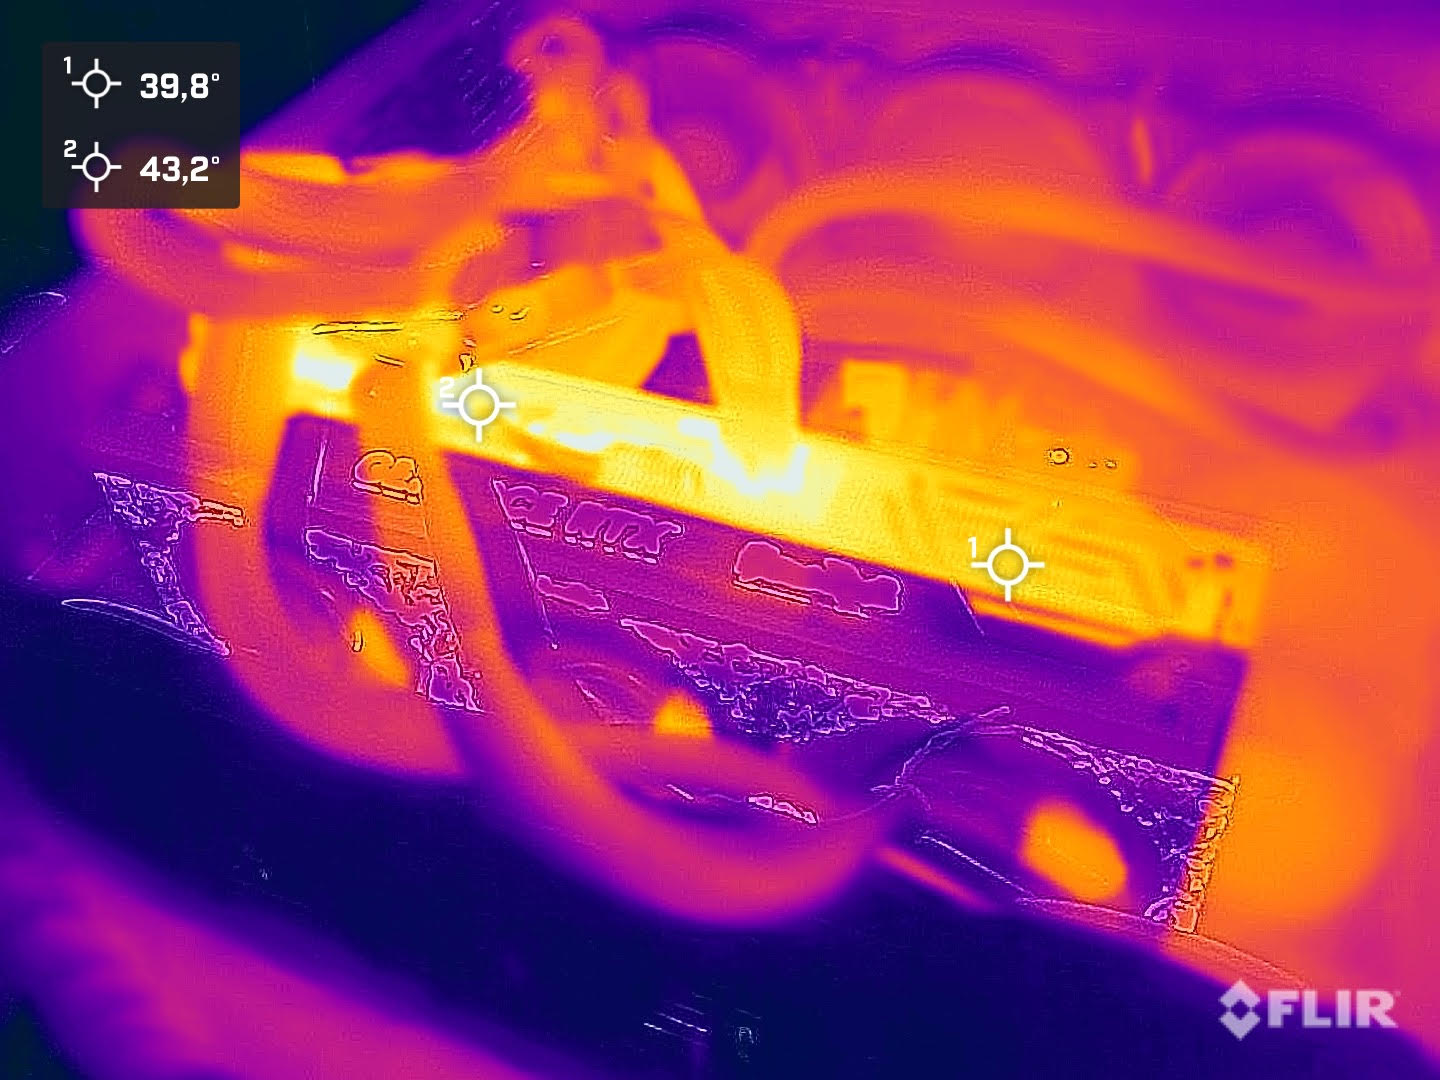
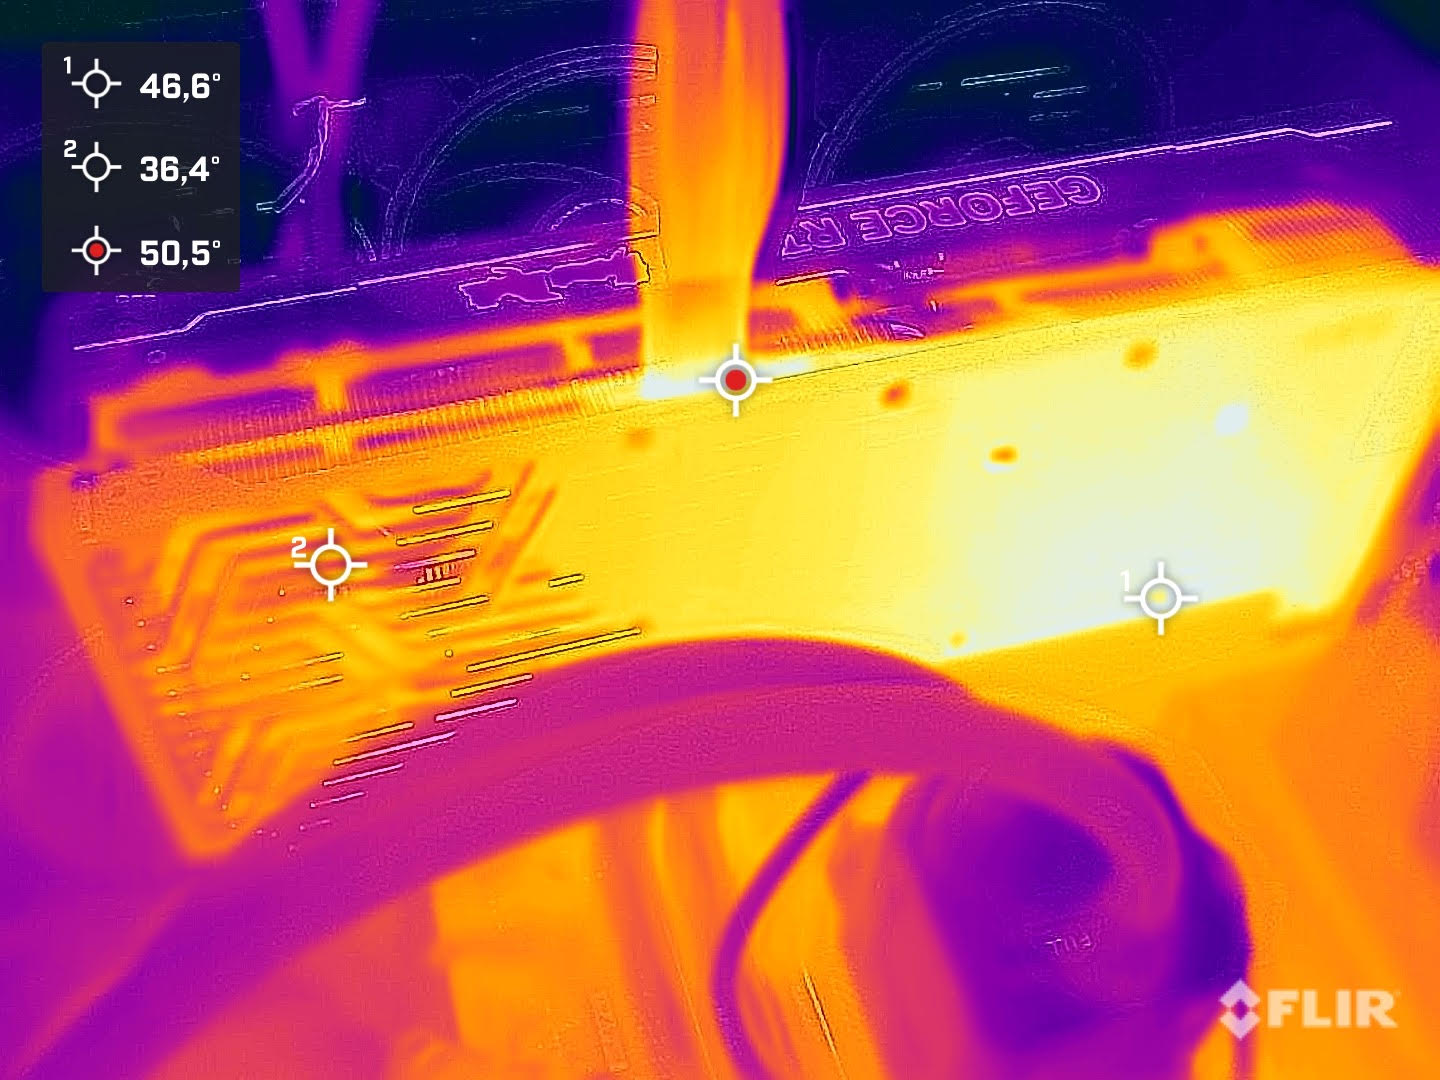
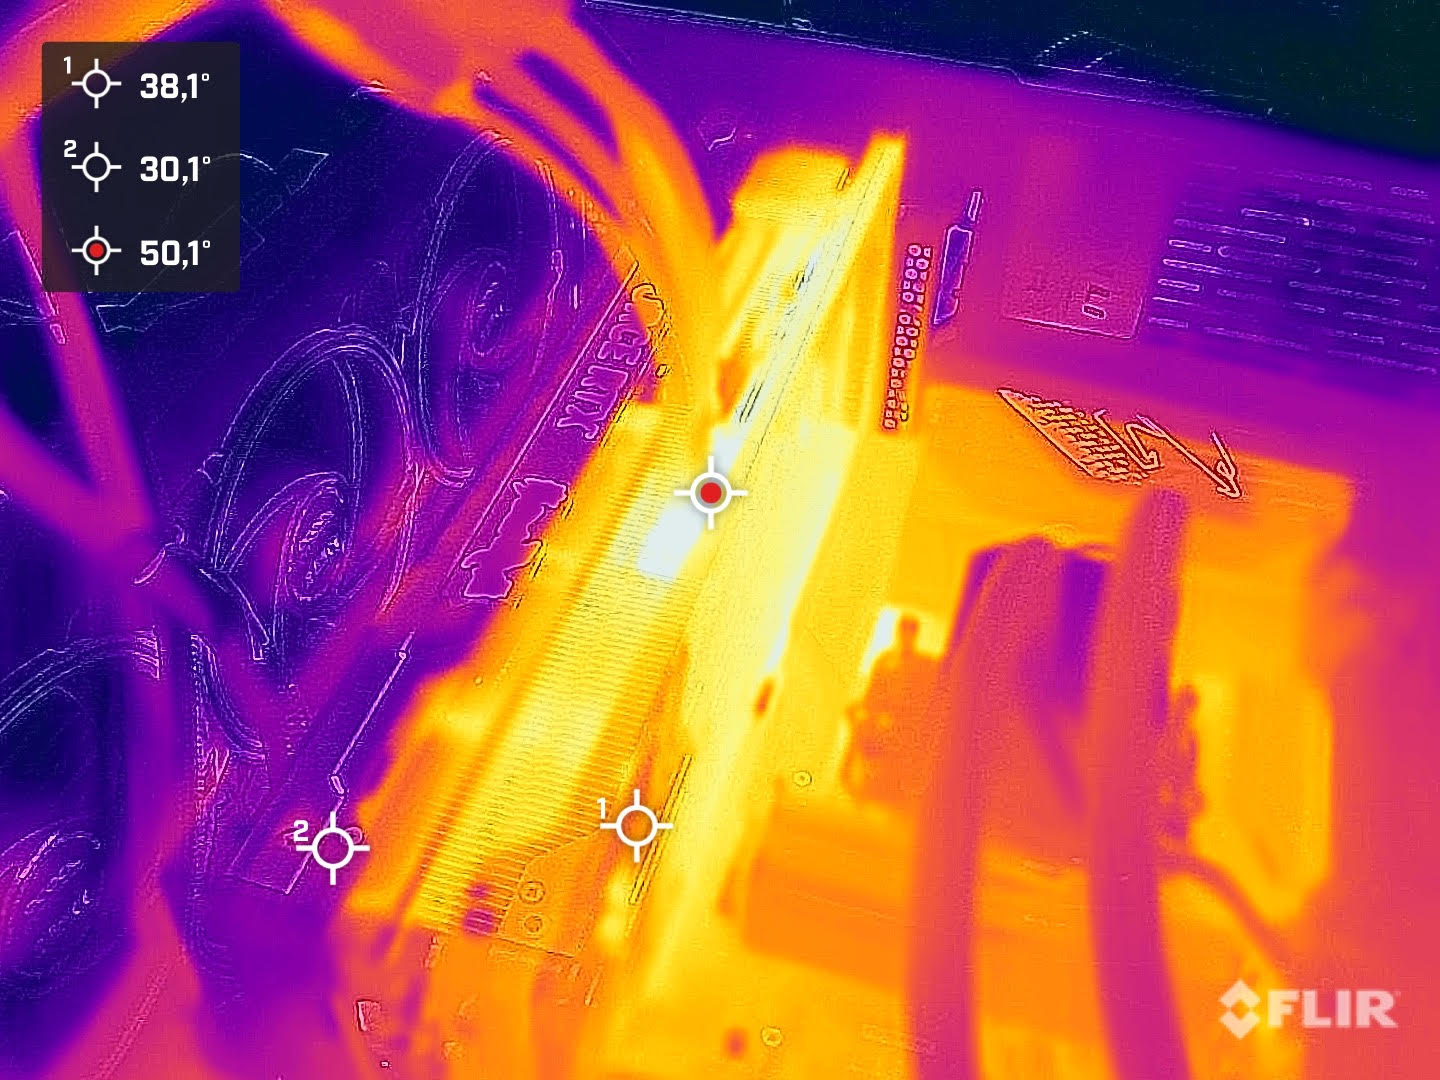
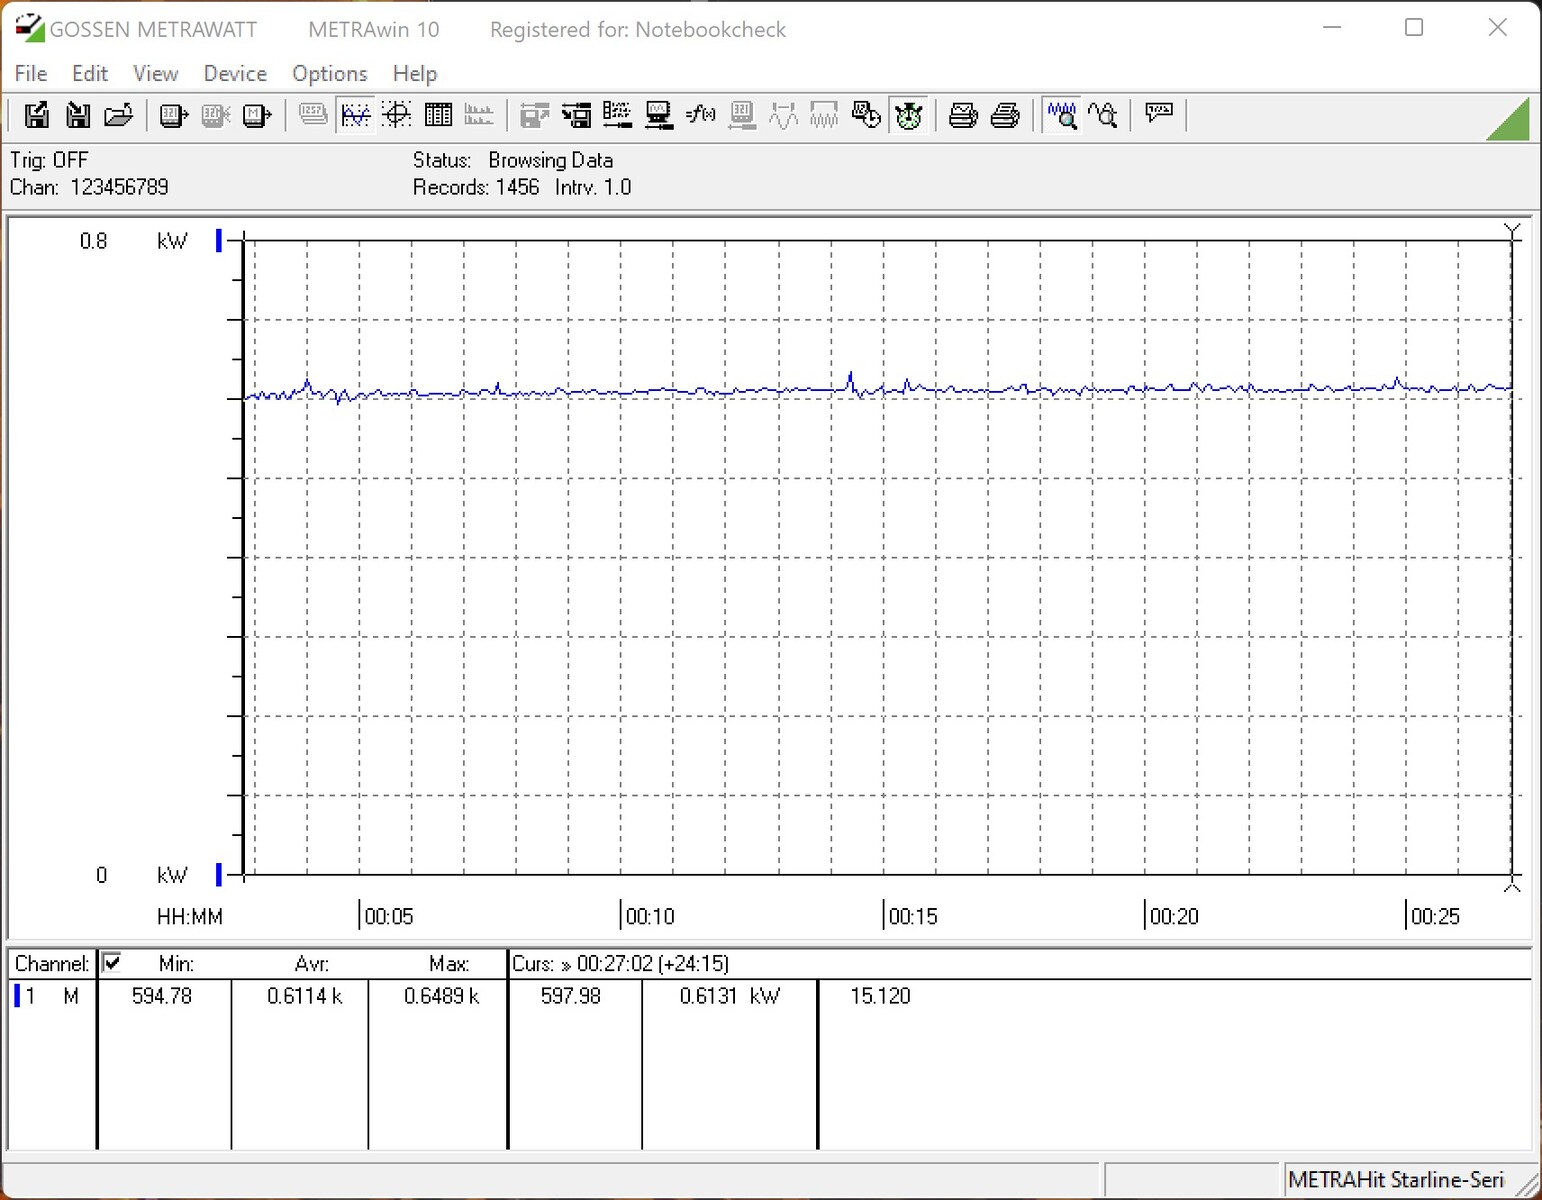
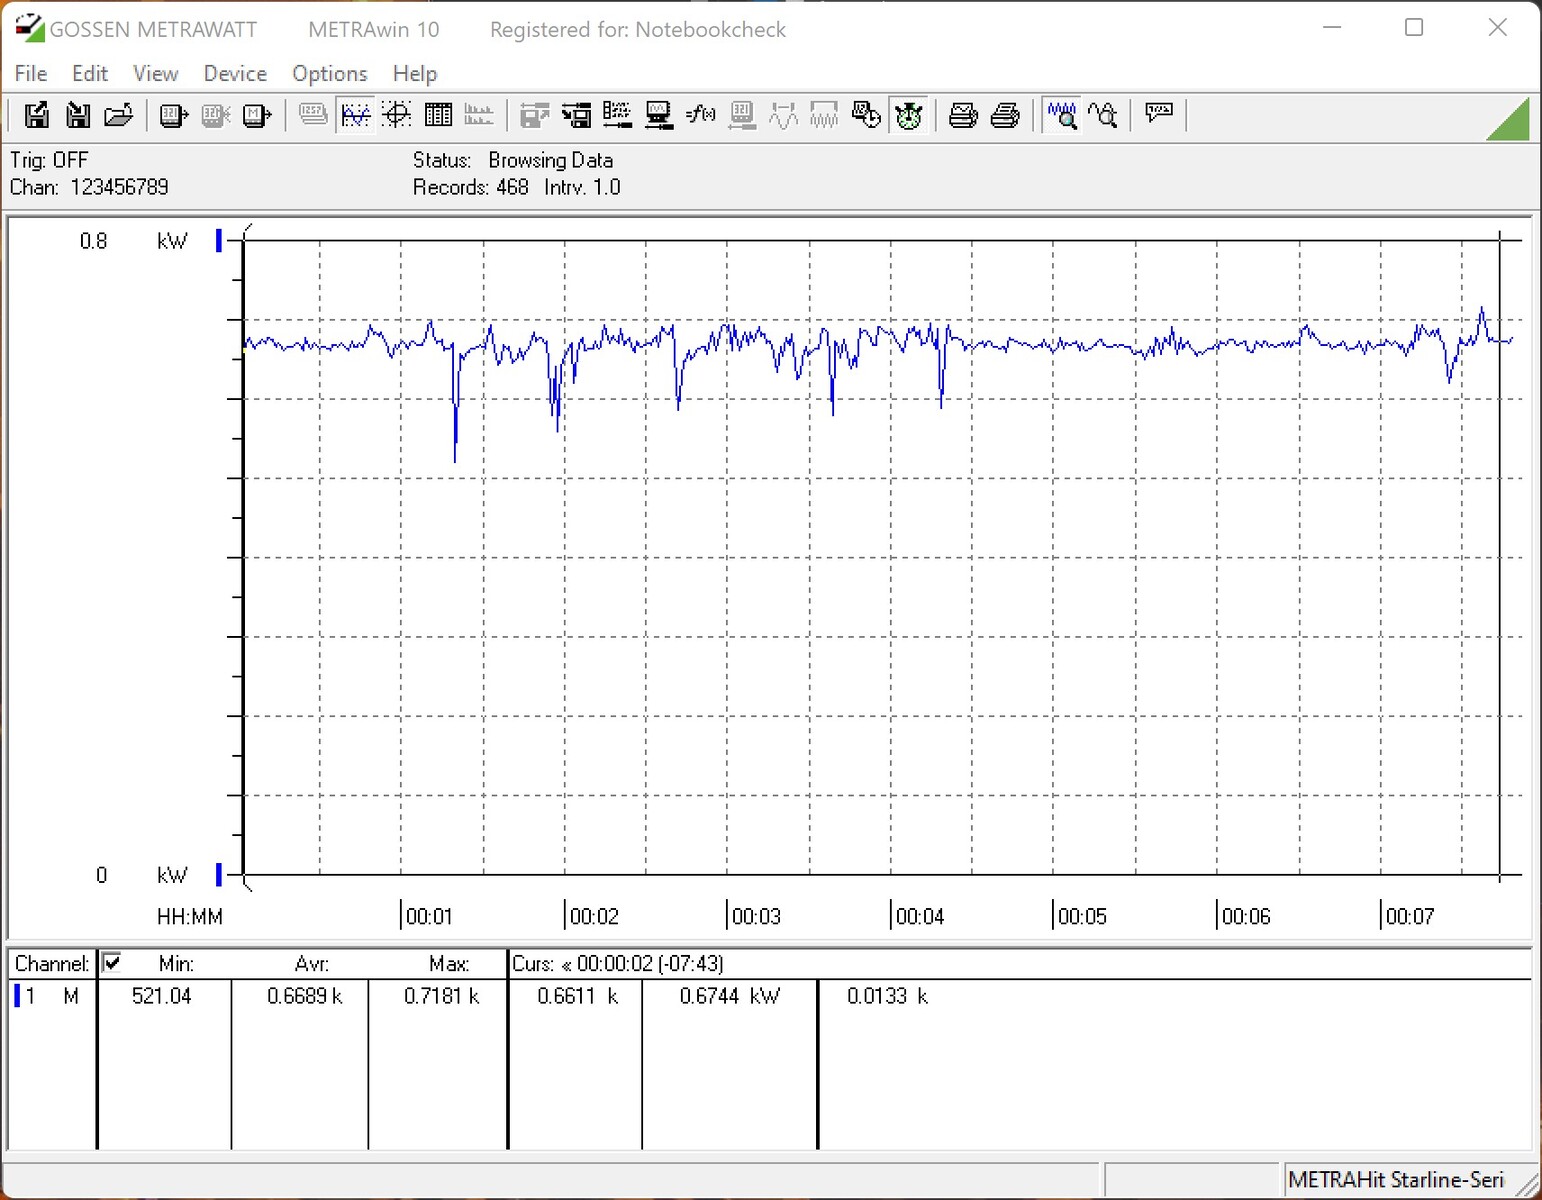
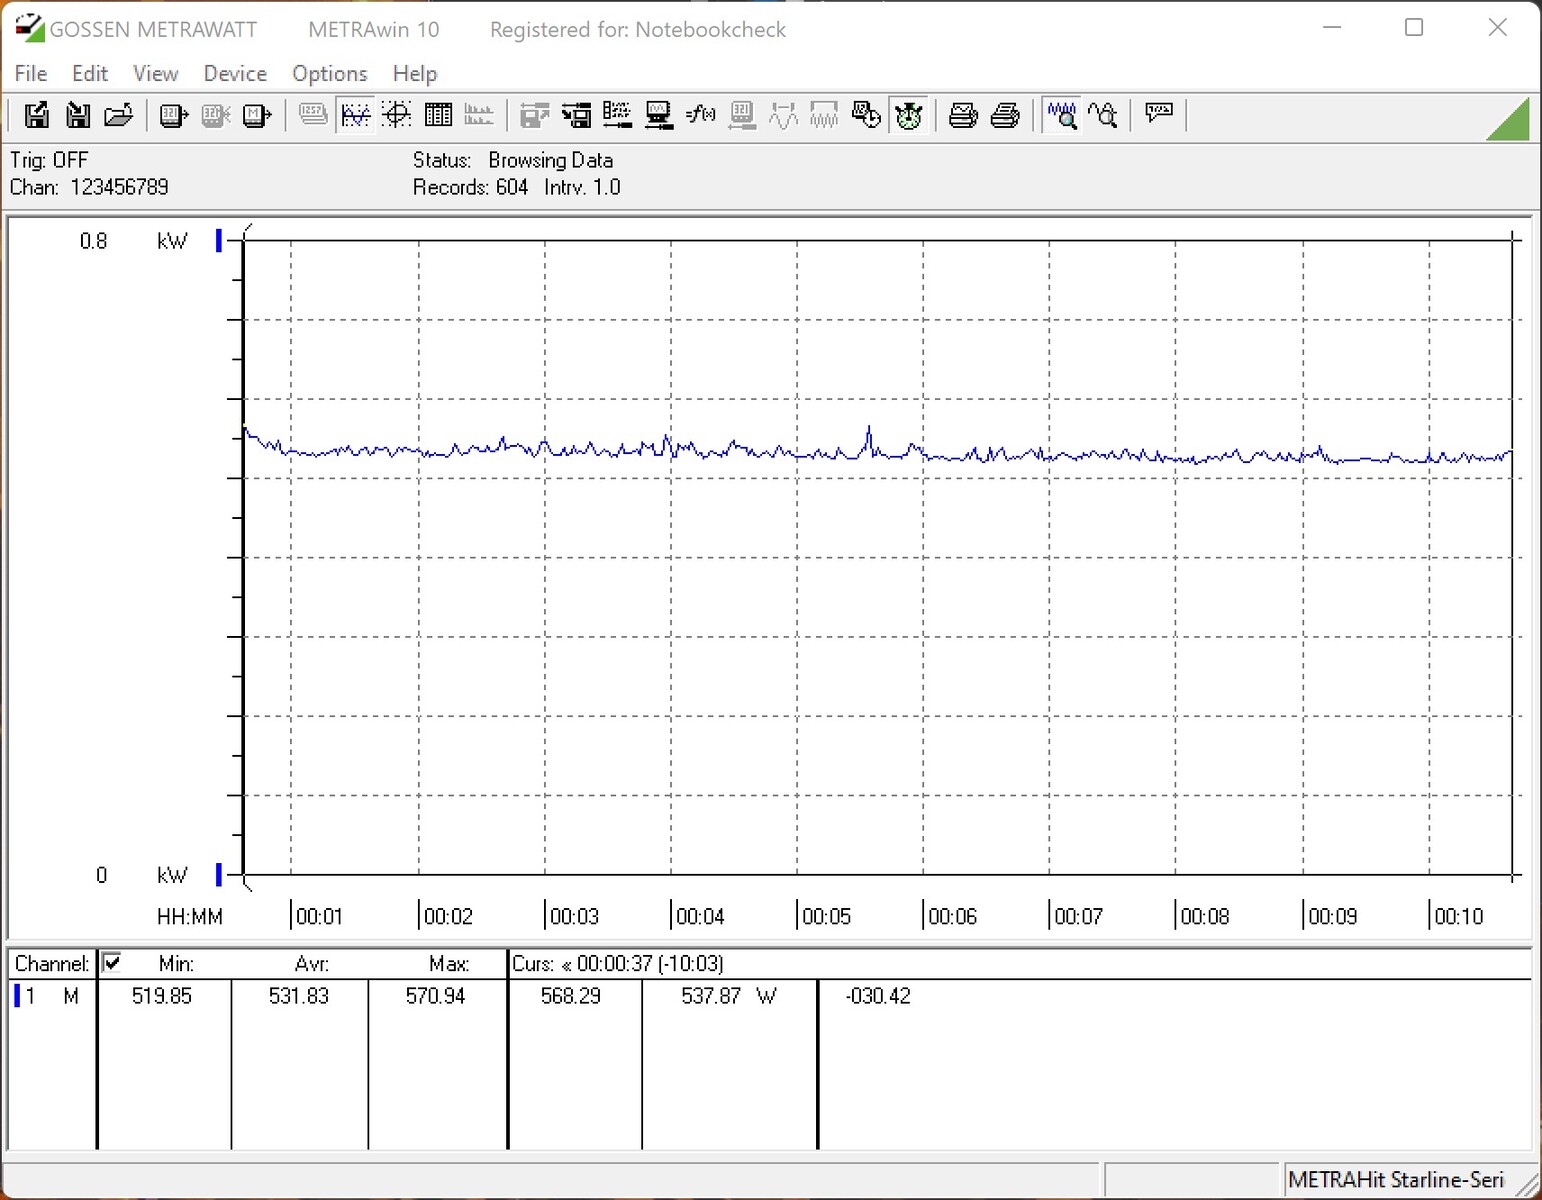
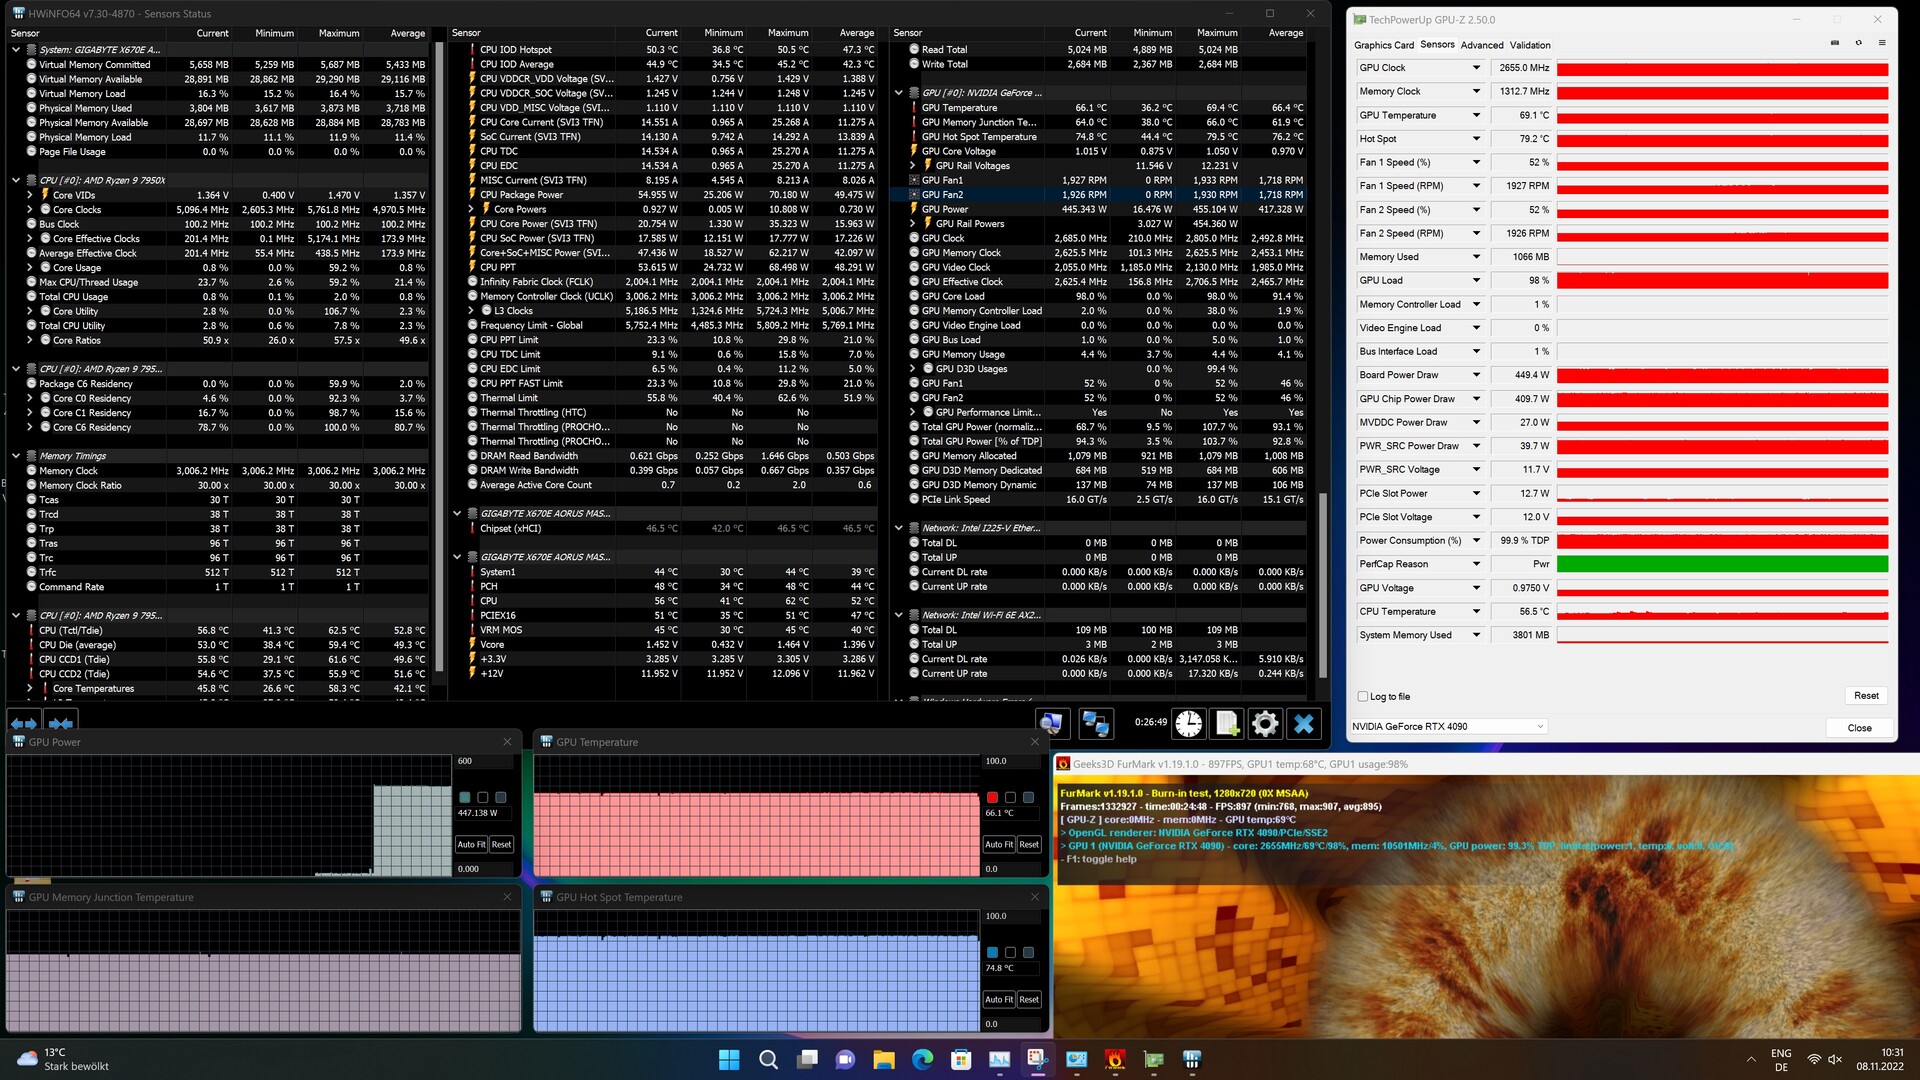
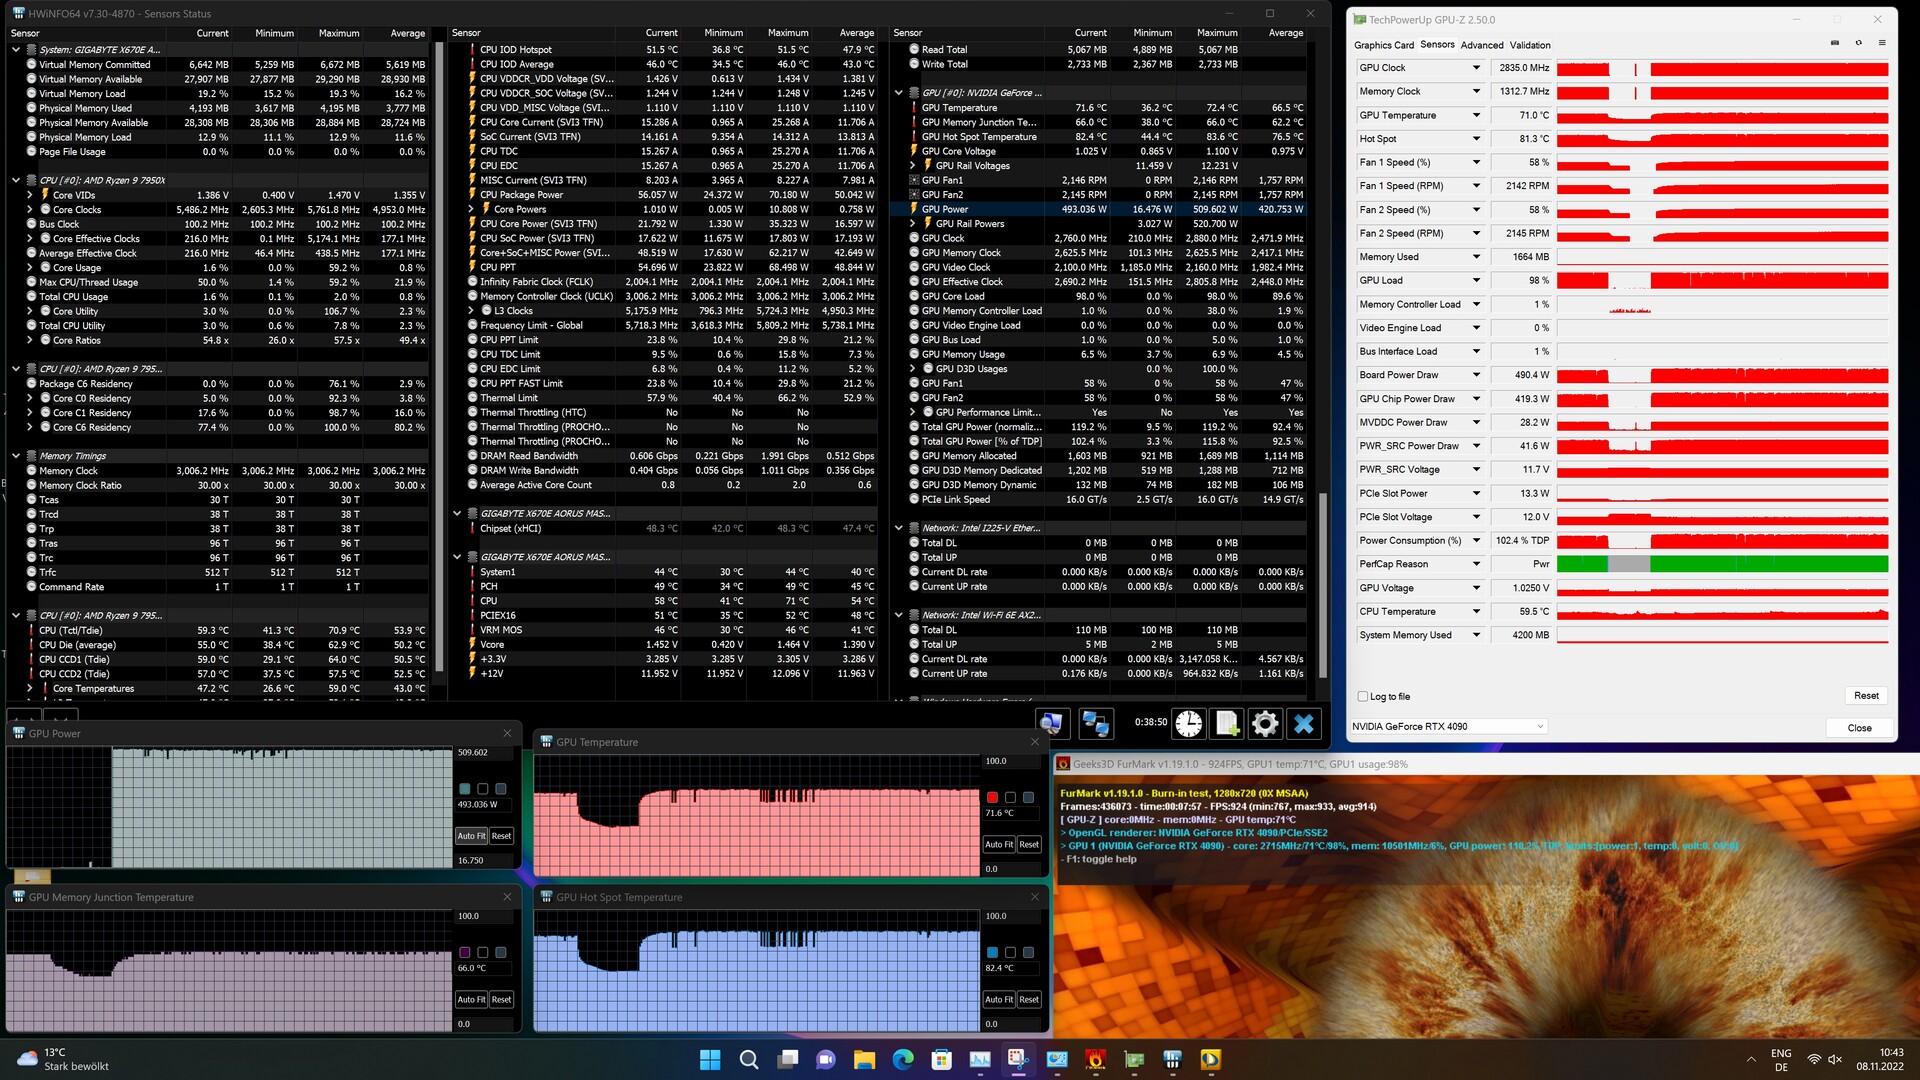
A 450 watts a Nvidia GeForce RTX 4090 está no mesmo nível que a Nvidia GeForce RTX 3090 Ti. No entanto, o consumo de energia aumenta em exatamente 100 watts em comparação com a Nvidia GeForce RTX 3090uma tendência que se solidificou nos últimos anos e só podemos esperar que o limite atual tenha sido atingido. Quem procura o melhor desempenho deve prestar pouca atenção ao tema do consumo de energia. Os 450 watts consumidos pelo Palit GeForce RTX 4090 GameRock OC durante o teste de estresse são dissipados com sucesso. A quase 70 °C, o chip GPU permanece relativamente frio, bem como a VRAM, onde não conseguimos detectar nenhum problema de temperatura a um máximo de 66 °C. O alvo de potência e a voltagem da CPU podem ser ligeiramente aumentados, de modo que a placa gráfica atinge um máximo de 509 watts sob carga. A temperatura do chip também aumenta um pouco como resultado. O ventilador incorporado faz um bom trabalho e resfria a placa de vídeo em operação padrão a aproximadamente 2000 rpm. A placa gráfica só pode ser ouvida de dentro da caixa.
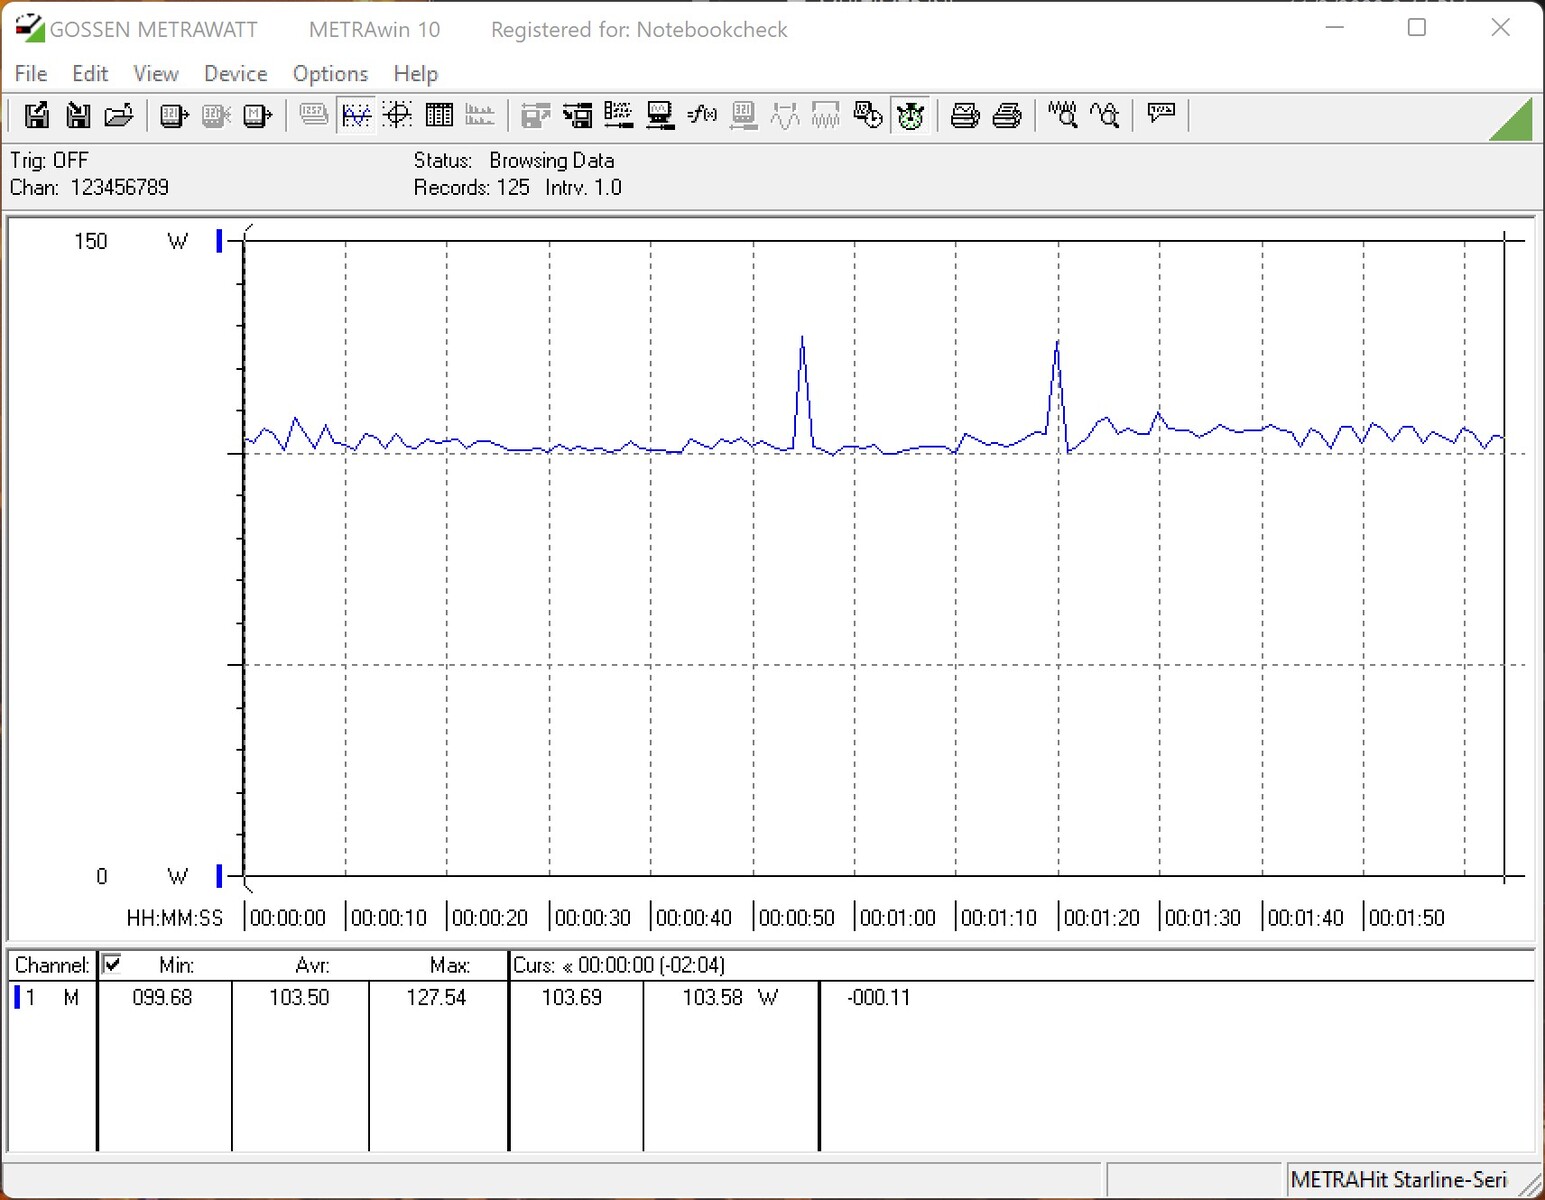
Quando se trata de jogos, o Palit GeForce RTX 4090 GameRock OC não tem motivos para se esconder. Aqui oAMD Radeon RX 6950 XTassim como a Nvidia GeForce RTX 3090 Ti requerem mais energia. Entretanto, neste teste estamos próximos aos limites da CPU, o que significa que a GPU não pode atingir o máximo desempenho. Ao comparar o consumo de energia sob o teste de estresse FurMark, a maré gira contra o Palit GeForce RTX 4090 GameRock OC. Com uma média de 611 watts, o consumo de energia das novas placas gráficas de ponta é visivelmente alto. Portanto, deve ser usado um poderoso suplemento de potência para operar a placa gráfica. Os próprios Palit recomendam o uso de uma fonte de alimentação de 1000 watts, como a que utilizamos durante os testes. Em todos os testes e benchmarks não houve problemas com a fonte de alimentação.
| Power Consumption / The Witcher 3 ultra (external Monitor) | |
| AMD Radeon RX 6950 XT, AMD Ryzen 9 5900X | |
| NVIDIA GeForce RTX 3090 Ti, AMD Ryzen 7 5800X3D (Idle: 102 W) | |
| NVIDIA GeForce RTX 3090, AMD Ryzen 9 7950X | |
| NVIDIA GeForce RTX 4090, AMD Ryzen 9 7950X | |
| NVIDIA GeForce RTX 3080 12 GB, AMD Ryzen 9 5900X | |
| AMD Radeon RX 6900 XT, AMD Ryzen 9 5950X (Idle: 99.15 W) | |
| Power Consumption / FurMark 1.19 GPU Stress Test (external Monitor) | |
| NVIDIA GeForce RTX 4090, AMD Ryzen 9 7950X | |
| AMD Radeon RX 6950 XT, AMD Ryzen 9 5900X | |
| NVIDIA GeForce RTX 3090, AMD Ryzen 9 7950X | |
| NVIDIA GeForce RTX 3080 12 GB, AMD Ryzen 9 5900X | |
| AMD Radeon RX 6900 XT, AMD Ryzen 9 5950X (Idle: 99.15 W) | |
* ... menor é melhor
Pro
Contra
Veredicto - Potência bruta sem problemas de temperatura

O mais novo carro-chefe da Nvidia, o GeForce RTX 4090, coloca na sombra tudo o que já foi antes - e depois alguns. O salto de desempenho em comparação com o Nvidia GeForce RTX 3090 é enorme. Em alguns casos, isto quase significa duplicar as taxas de quadros. No entanto, de modo geral, o aumento de desempenho é de 50 a 70 por cento, o que ainda é impressionante. Da mesma forma, a AMD também está em desadaptação com seu mais recente Radeon RX 6950 XT. Apresentado há apenas alguns dias, o AMD Radeon RX 7900 XTX está dando o melhor de si para fazer frente a isto.
O desempenho do GeForce RTX 4090 GameRock OC usado em nossa revisão é consistentemente excelente. Com características bem conhecidas como DLSS e raytracing, a Nvidia conseguiu mais uma vez aumentar consideravelmente o desempenho com inovações oferecidas atualmente apenas pela série RTX 4000 e, ao fazê-lo, atrair potenciais compradores. Resta saber se a AMD pode seguir o exemplo a este respeito. Entretanto, as características prometem muito, já que cada vez mais jogos estão usando a tecnologia para melhorar as taxas de quadros sem perda na qualidade da imagem. Mas mesmo sem DLSS, o GeForce RTX 4090 oferece enorme potência para quase todos os jogos atuais a 2160p nas configurações mais altas.
Para qualquer pessoa que considere uma compra, vale a pena lembrar que uma CPU muito rápida é necessária. Além disso, não adianta desperdiçar a potência da placa gráfica por apenas 1080p ou 1440p em jogos. A placa gráfica ficará rapidamente entediada.
O Palit GeForce RTX 4090 GameRock OC chama a atenção para si mesmo com o design do Caleidoscópio Midnight. Graças à Ada Lovelace, o design combina com o desempenho e é possível jogar sem restrições 4K.
As opiniões podem ser divididas quando se trata de consumo de energia e o conector de 12VHPWR implementado. Por um lado, os 450 watts ainda estão dentro dos limites, se mantivermos oNvidia GeForce RTX 3090 Ti em mente. Este esporte é o mesmo TBP e não pode atingir o desempenho do Nvidia GeForce RTX 4090 por um longo caminho. Como resultado, Nvidia é mais uma vez capaz de aumentar drasticamente a eficiência com a nova arquitetura Ada Lovelace. O novo conector de energia tem estado sob fogo ultimamente. Até agora, não conseguimos detectar nenhum problema relacionado a esse conector. Entretanto, continuaremos a monitorar isto e a mantê-lo atualizado, caso este destino também nos suceda. O Palit GeForce RTX 4090 GameRock OC é também um sucesso em parte devido a sua superfície semelhante a um diamante. A embalagem é bem arredondada por uma iluminação RGB sutil. Da mesma forma, o refrigerador Palit embutido faz tudo certo, pois a placa gráfica permanece agradavelmente silenciosa sob carga, apesar do alto consumo de energia.
Preço e disponibilidade
As placas gráficas continuam sendo difíceis de se obter. Quando os modelos se tornam disponíveis para compra, muitas vezes vêm com uma pesada sobretaxa sobre o RRP da Nvidia de 1949 euros. Atualmente, nossa amostra de revisão está listada em Amazônia por $2679. Entretanto, o prazo de entrega é de 4 a 6 semanas. O modelo não-OC do Palit GeForce RTX 4090 GameRock pode ser obtido atualmente em Amazon por $2369.
Price comparison

