Notebookcheck Logo

Revisão AMD Radeon RX 6900 XT: Desempenho quase-RTX 3090 por US$500 a menos, mas apenas marginalmente melhor que o RX 6800 XT

Radeon voltou a entrar no bate-papo. O Radeon RX 6900 XT sinaliza a reentrada da AMD no espaço da GPU da nave principal desde a saída do R9 Fury X em 2015. O RX 6900 XT oferece excelente desempenho raster que o coloca firmemente ao alcance da NVIDIA GeForce RTX 3090 apesar de algumas inadequações no traçado de raios e falta de super amostragem baseada em IA. Levamos o AMD Radeon RX 6900 XT para um test drive e vemos como a equipe Red progrediu bem com o RDNA 2 até agora.

A AMD teve (e ainda tem) um grande ataque contra a Intel no espaço da CPU com a Ryzen, mas a unidade Radeon ficou significativamente atrás da concorrência até agora. A última vez que vimos uma placa gráfica emblemática da AMD ser mencionada no mesmo fôlego que a da NVIDIA foi a baseada em Fiji Radeon R9 Fúria X que competiam com o NVIDIA Maxwell GeForce 980 Ti em 2015

Por muito tempo, o navio almirante da NVIDIA, Turing, permaneceu incontestado. AMD's Vega 56, Vega 64e o Radeon VII pouco fez para dar noites sem dormir à NVIDIA. Foi somente em julho de 2019 que a AMD teve um sucesso moderado com o Navi 10 Radeon RX 5700 XTmas isso era, na melhor das hipóteses, comparável ao GeForce RTX 2070 Super

Tudo isso agora é história. Em outubro passado, a AMD revelou oficialmente os cartões da série Radeon RX 6000, composta pelo RX 6800, RX 6800 XTo RX 6900 XT e, mais recentemente, o RX 6700 XTcom a promessa de assumir as ofertas Ampere de alta qualidade da NVIDIA, tais como a RTX 3070, RTX 3080e RTX 3090 para jogos de 1440p e 4K

O RX 6900 XT está sendo considerado como um concorrente RTX 3090, pelo menos em termos de puro desempenho raster (com ressalvas, é claro). As placas NVIDIA têm atualmente a vantagem quando se trata de características como traçado de raio e super amostragem baseada em IA. No entanto, o RX 6900 XT também tem alguns truques na manga

Nesta revisão, colocamos a placa Navi 21 XTX do cão superior através de seus passos e vemos se ela tem a coragem de assumir o Golias Ampere da NVIDIA

Comparação do Radeon RX 6900 XT com outros GPUs AMD

Especificações RadeonRX 6900 XT RadeonRX 6800 XT RadeonRX 6800 RadeonRX 6700 XT RadeonRX 5700 XT RadeonRX 5700 RadeonVII
GPU Navi21 XTX Navi 21 XT Navi 21 XL Navi 22 Navi 10 XT Navi 10 XL Vega 20 XT
Processo de fabricação 7nm 7 nm 7 nm 7 nm 7 nm 7 nm 7 nm
ComputeUnits 80 72 60 40 40 36 60
ShadingUnits 5,120 4,608 3,840 2,560 2,560 2,304 3,840
Unidades de Mapeamento de Textura 320 288 240 160 160 144 240
RayAccelerators 80 72 60 40 -- -- --
Relógio de Base 1,825 MHz 1,825 MHz 1,700 MHz 2,321 MHz 1,605 MHz 1,465 MHz 1,400 MHz
Relógio de jogo 2,015 MHz 2,015 MHz 1,815 MHz 2,424 MHz 1,755 MHz 1,625 MHz 1,750 MHz
Relógio de impulso 2,250 MHz 2,250 MHz 2,105 MHz 2,581 MHz 1,905 MHz 1,725 MHz 1,802 MHz
Infinity Cache 128MB 128 MB 128 MB 128 MB 96 MB --------
Memory BusWidth 256-bit 256-bit 256-bit 192-bit 256-bit 256-bit 4096-bit
Largura de banda de memória 512GB/s 512 GB/s 512 GB/s 384 GB/s 448 GB/s 448 GB/s 1,024 GB/s
Tamanho da memória 16GB GDDR6 16 GB GDDR6 16 GB GDDR6 12 GB GDDR6 8 GB GDDR6 8 GB GDDR6 16 GB HBM2
TBP 300W 300 W 300 W 250 W 230 W 225 W 180 W

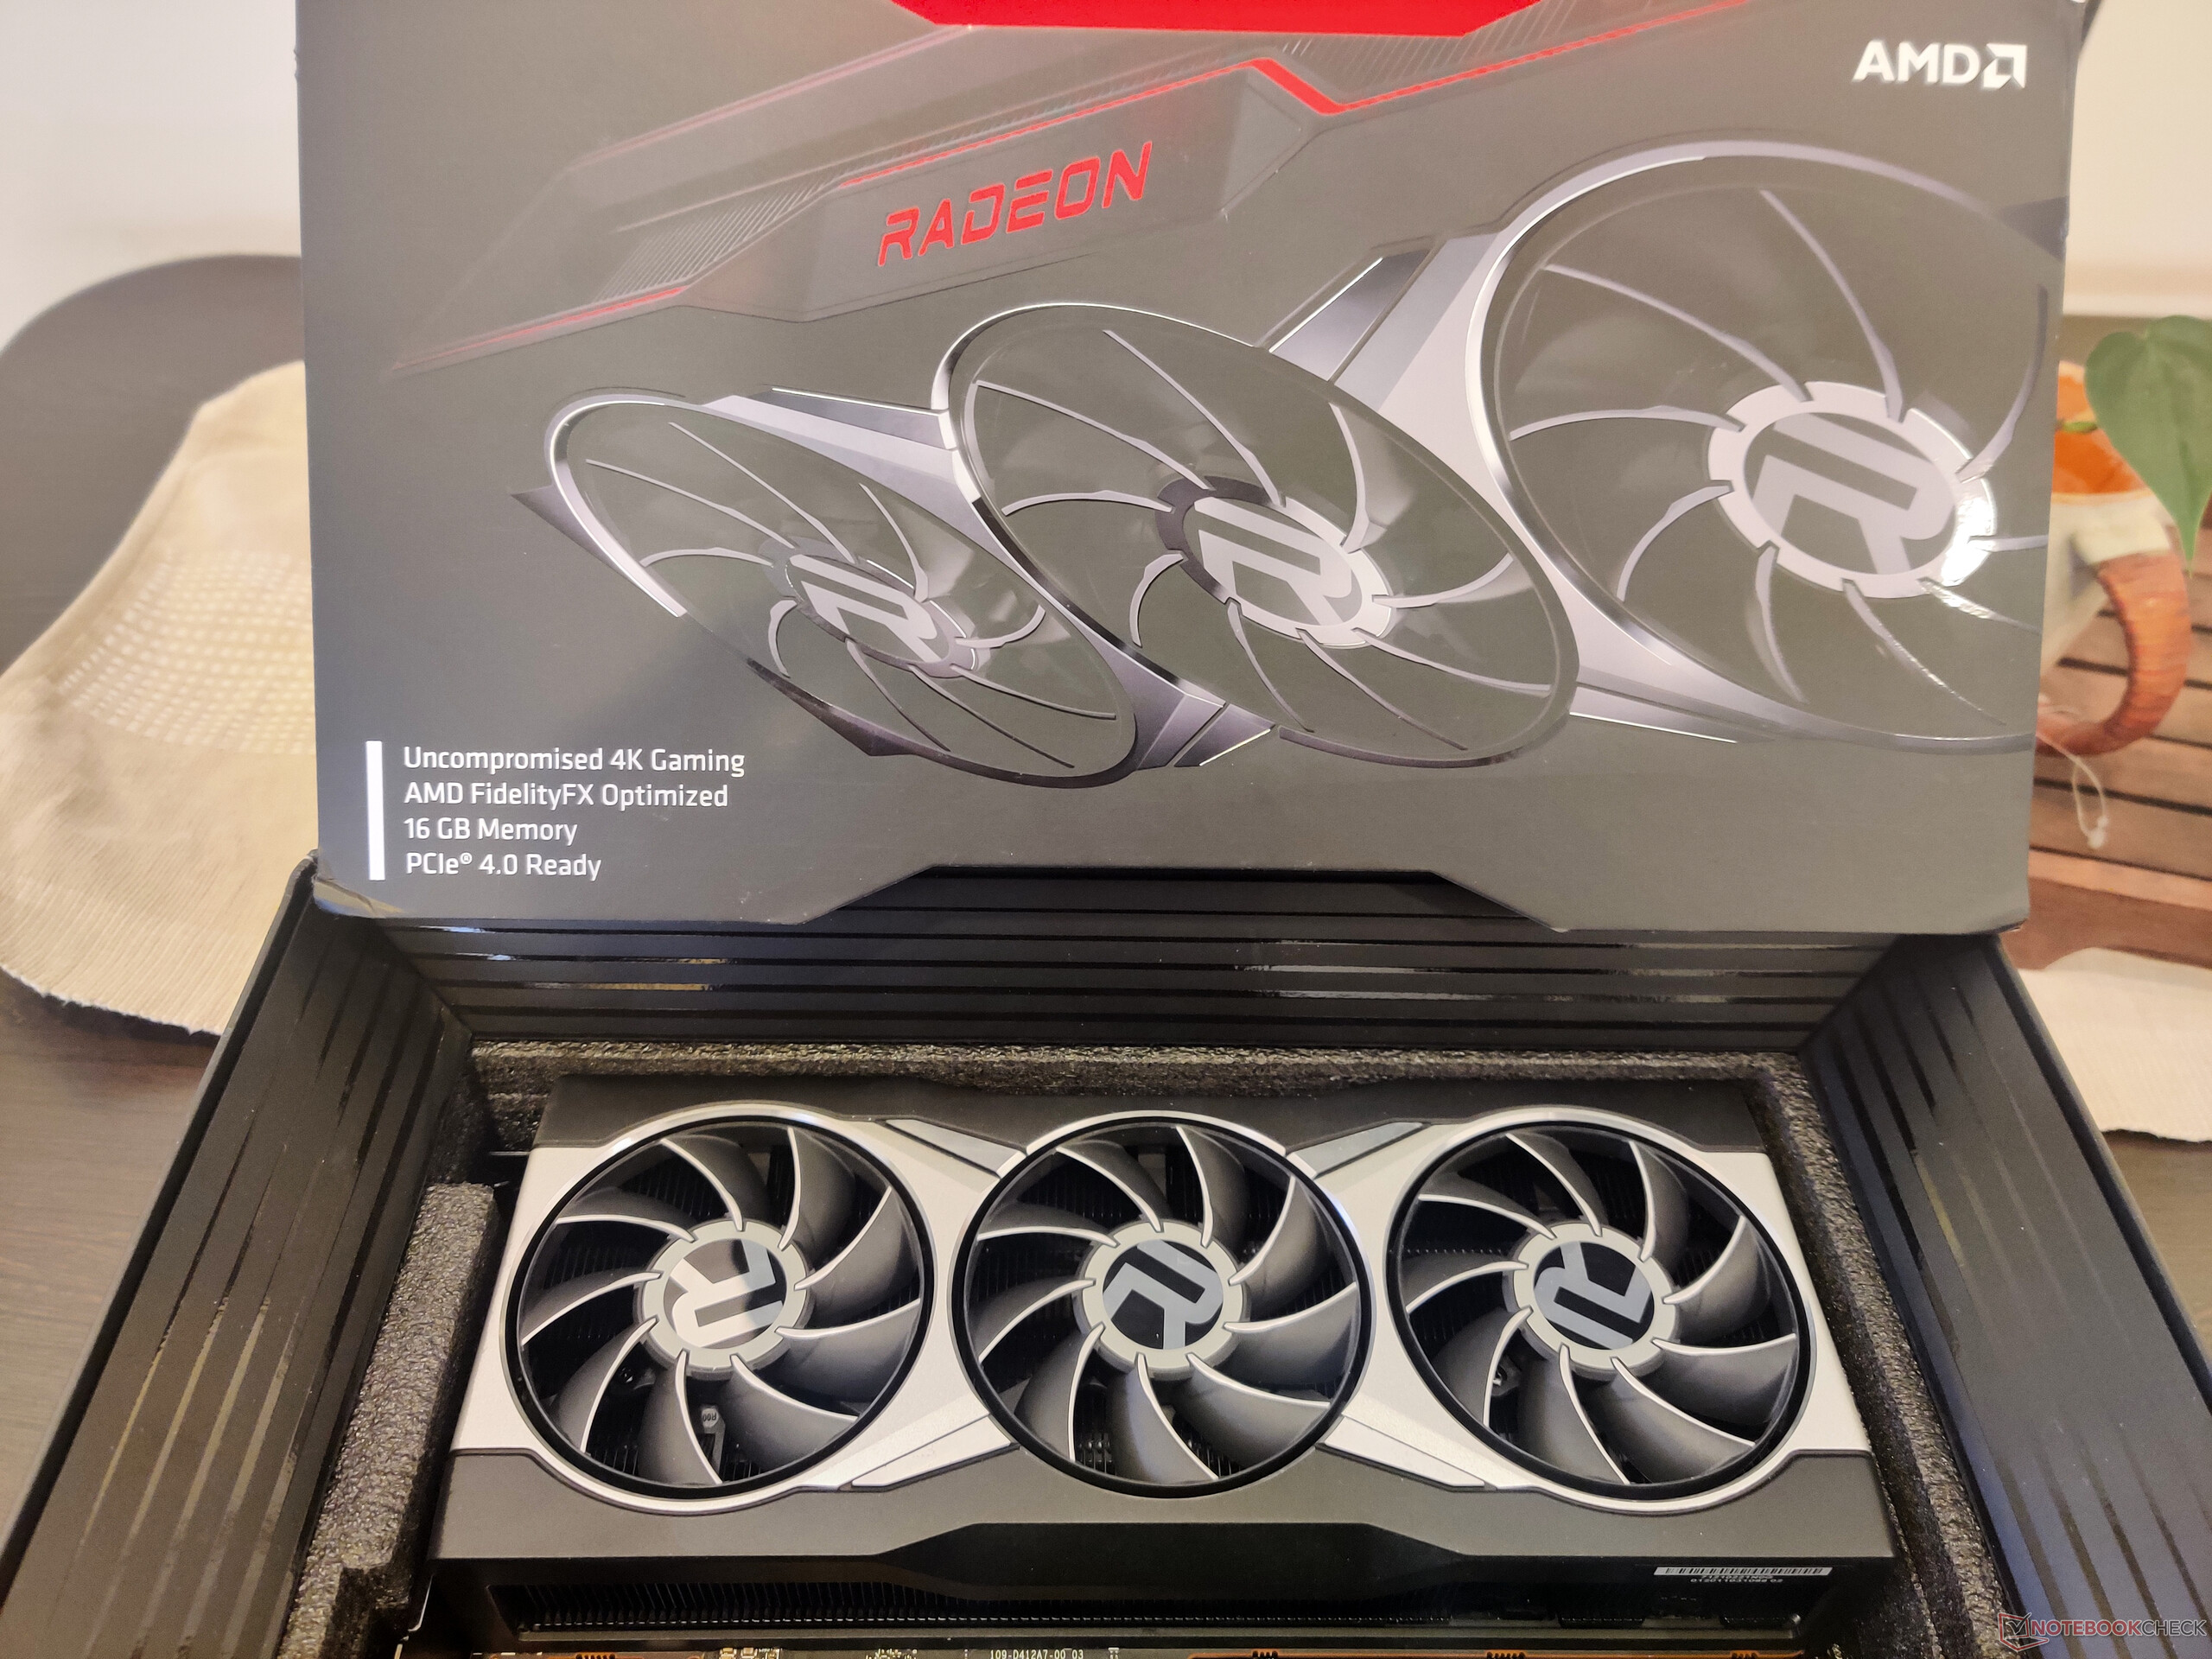
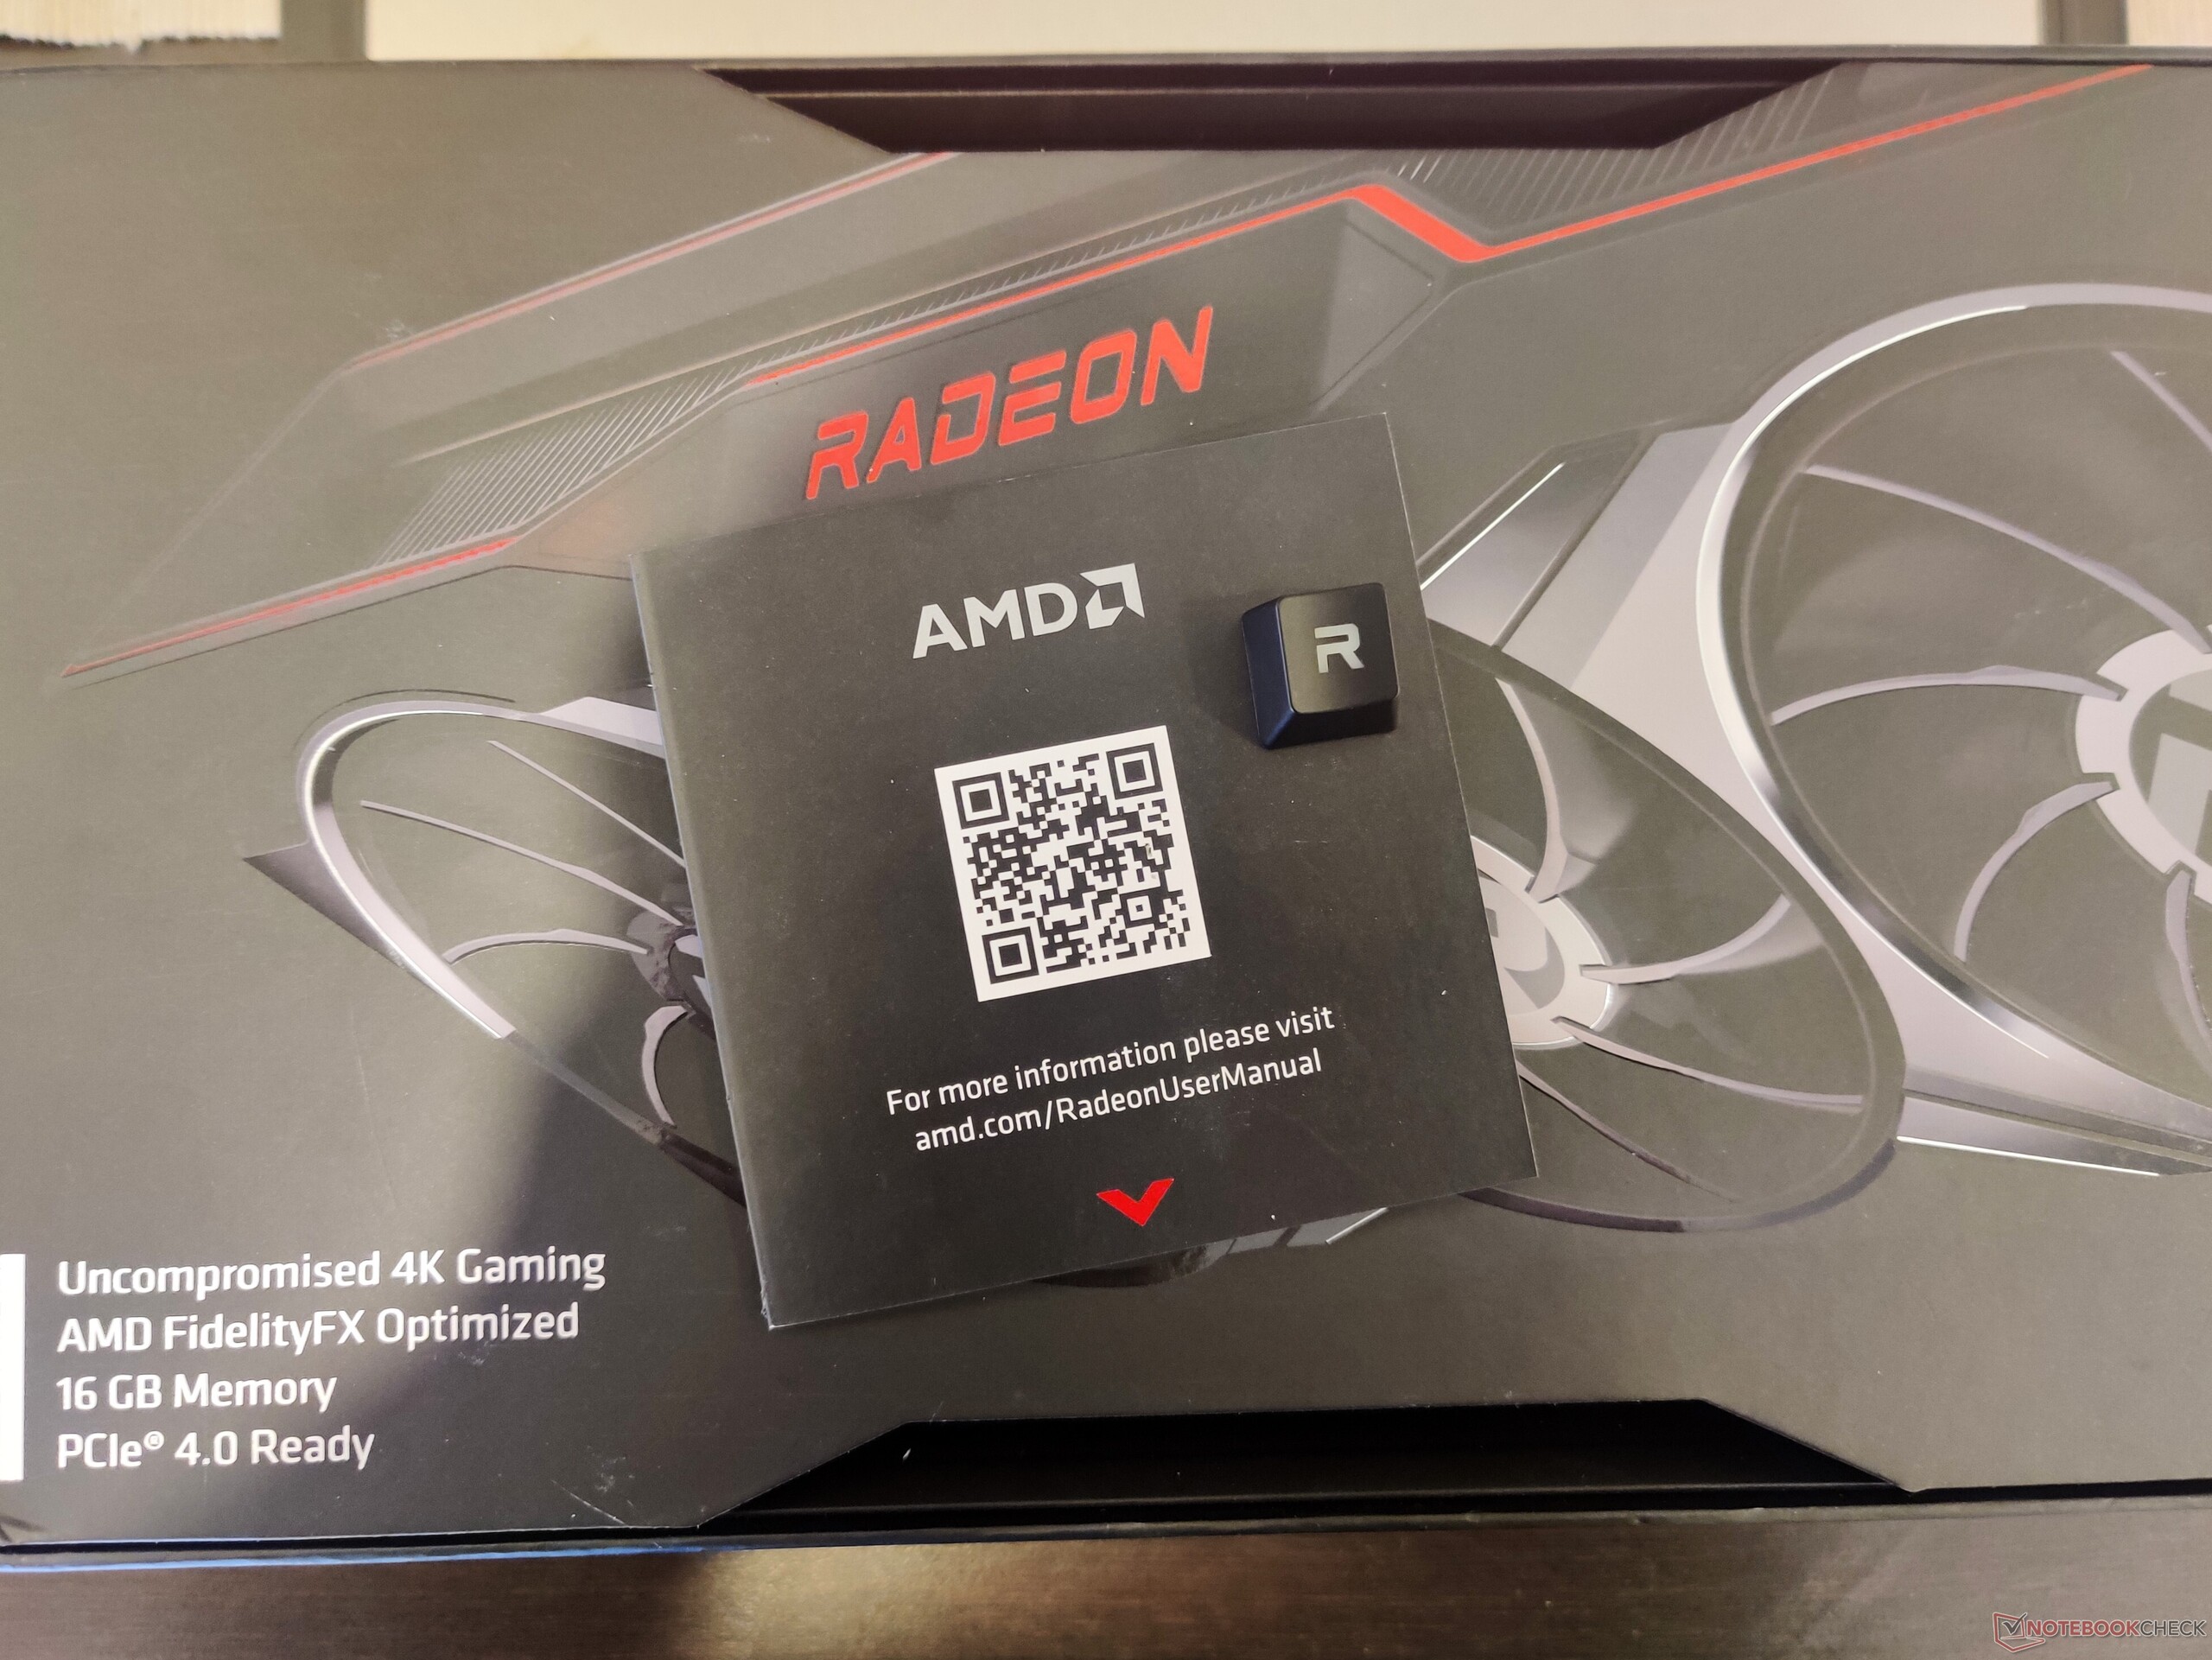
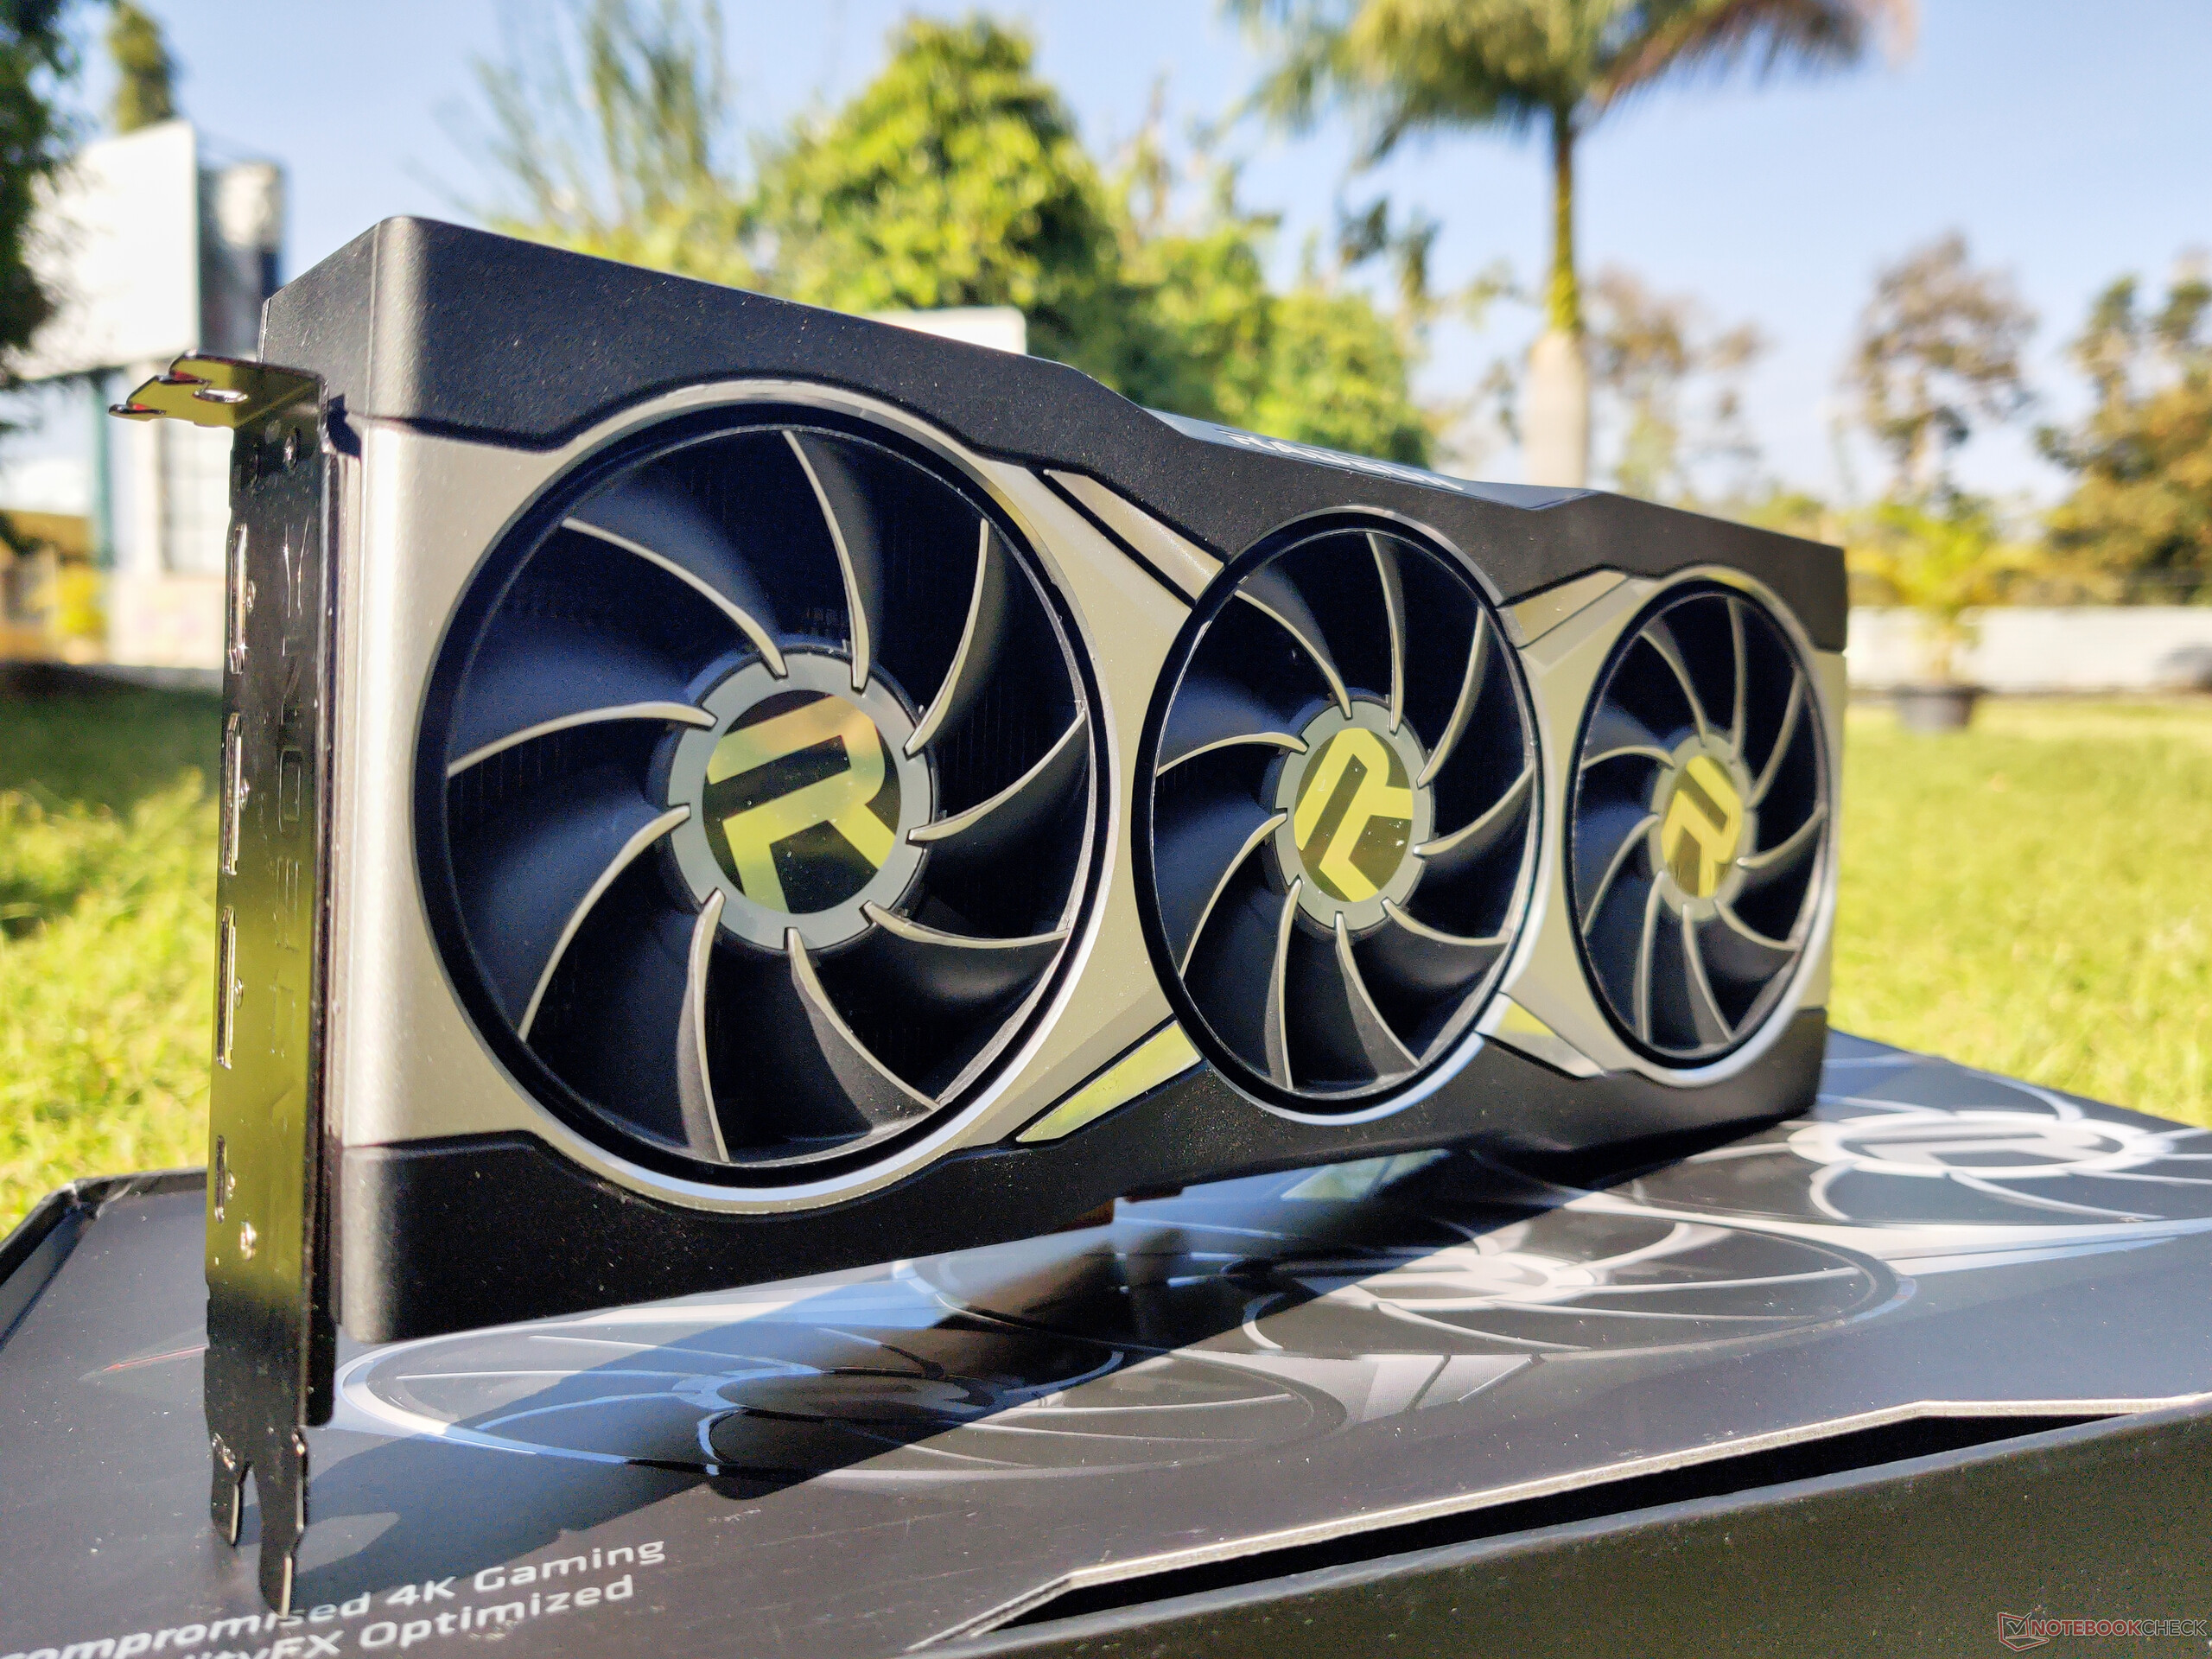
Uma visita ao AMD Radeon RX 6900 XT

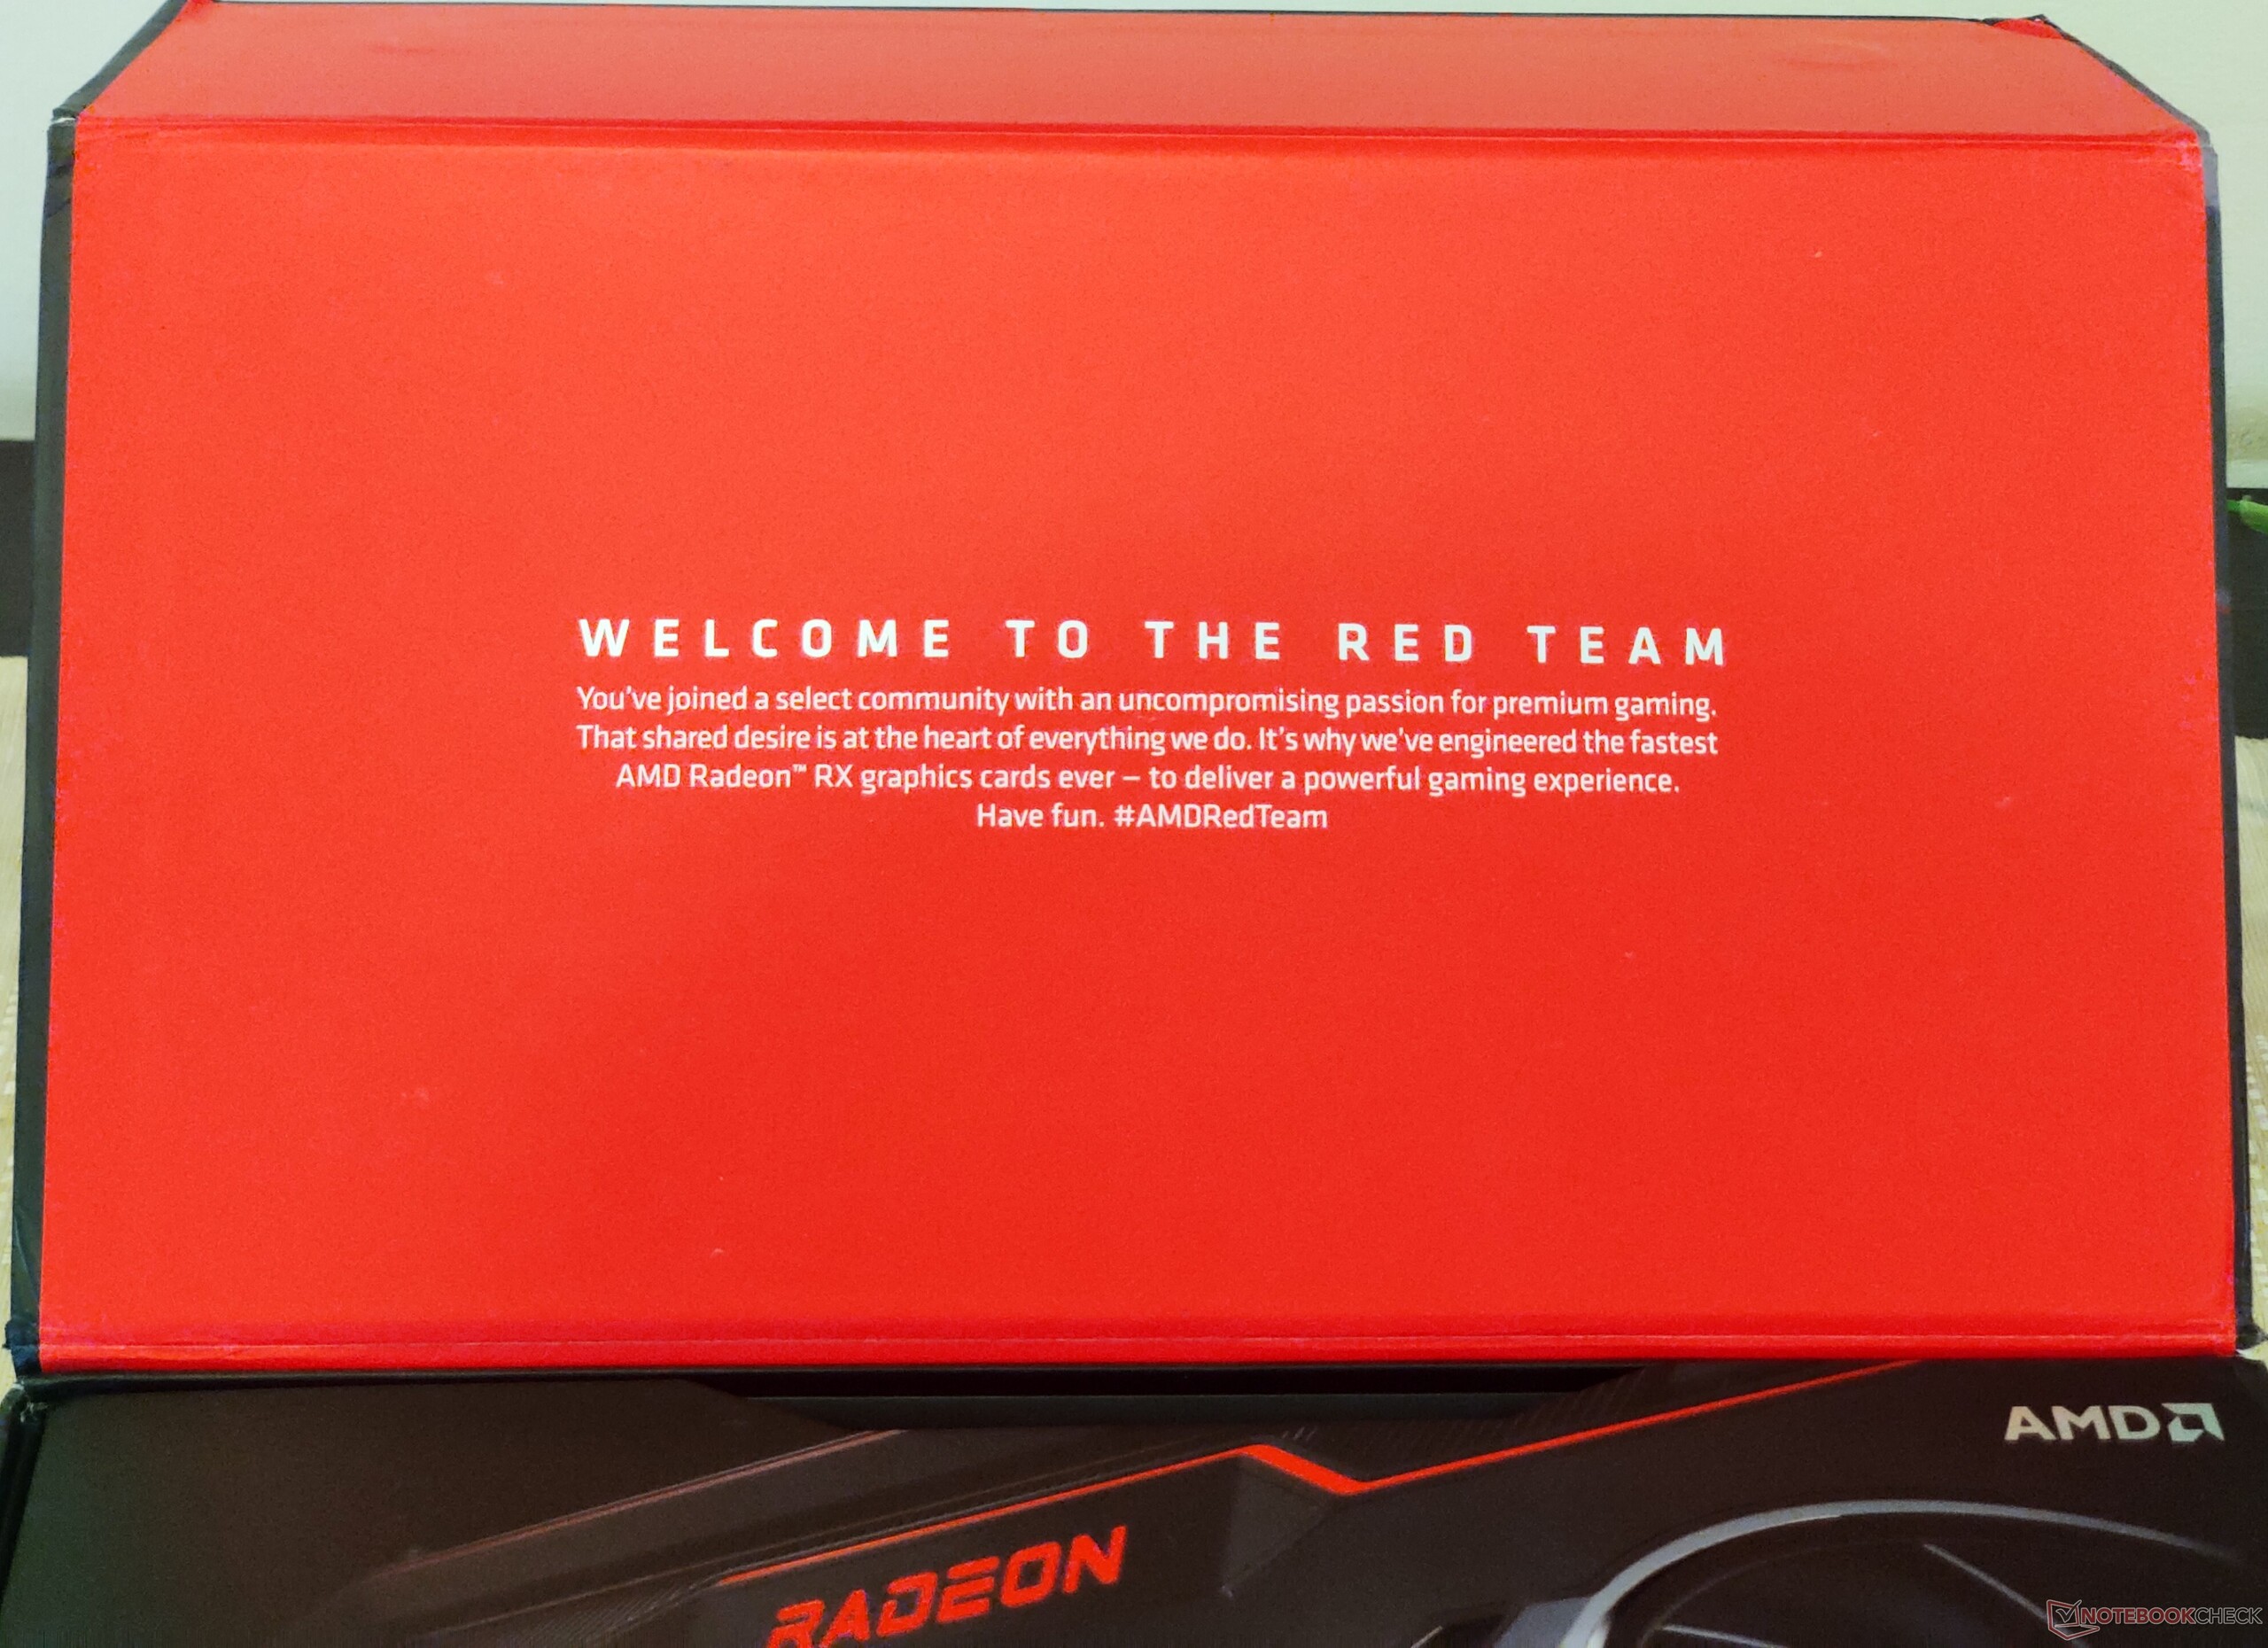
Ao abrir a caixa, fomos saudados por uma mensagem "Bem-vindo à equipe vermelha". A embalagem inclui uma cartolina Radeon na qual estão incluídos um guia de início rápido e uma tecla "R" do teclado. A tecla "R" é moldada na típica fonte Radeon e permite a passagem da luz RGB. Infelizmente, nossa embalagem não veio com um mouse pad da marca AMD incluído, que deveria, no entanto, estar lá na caixa do varejo.

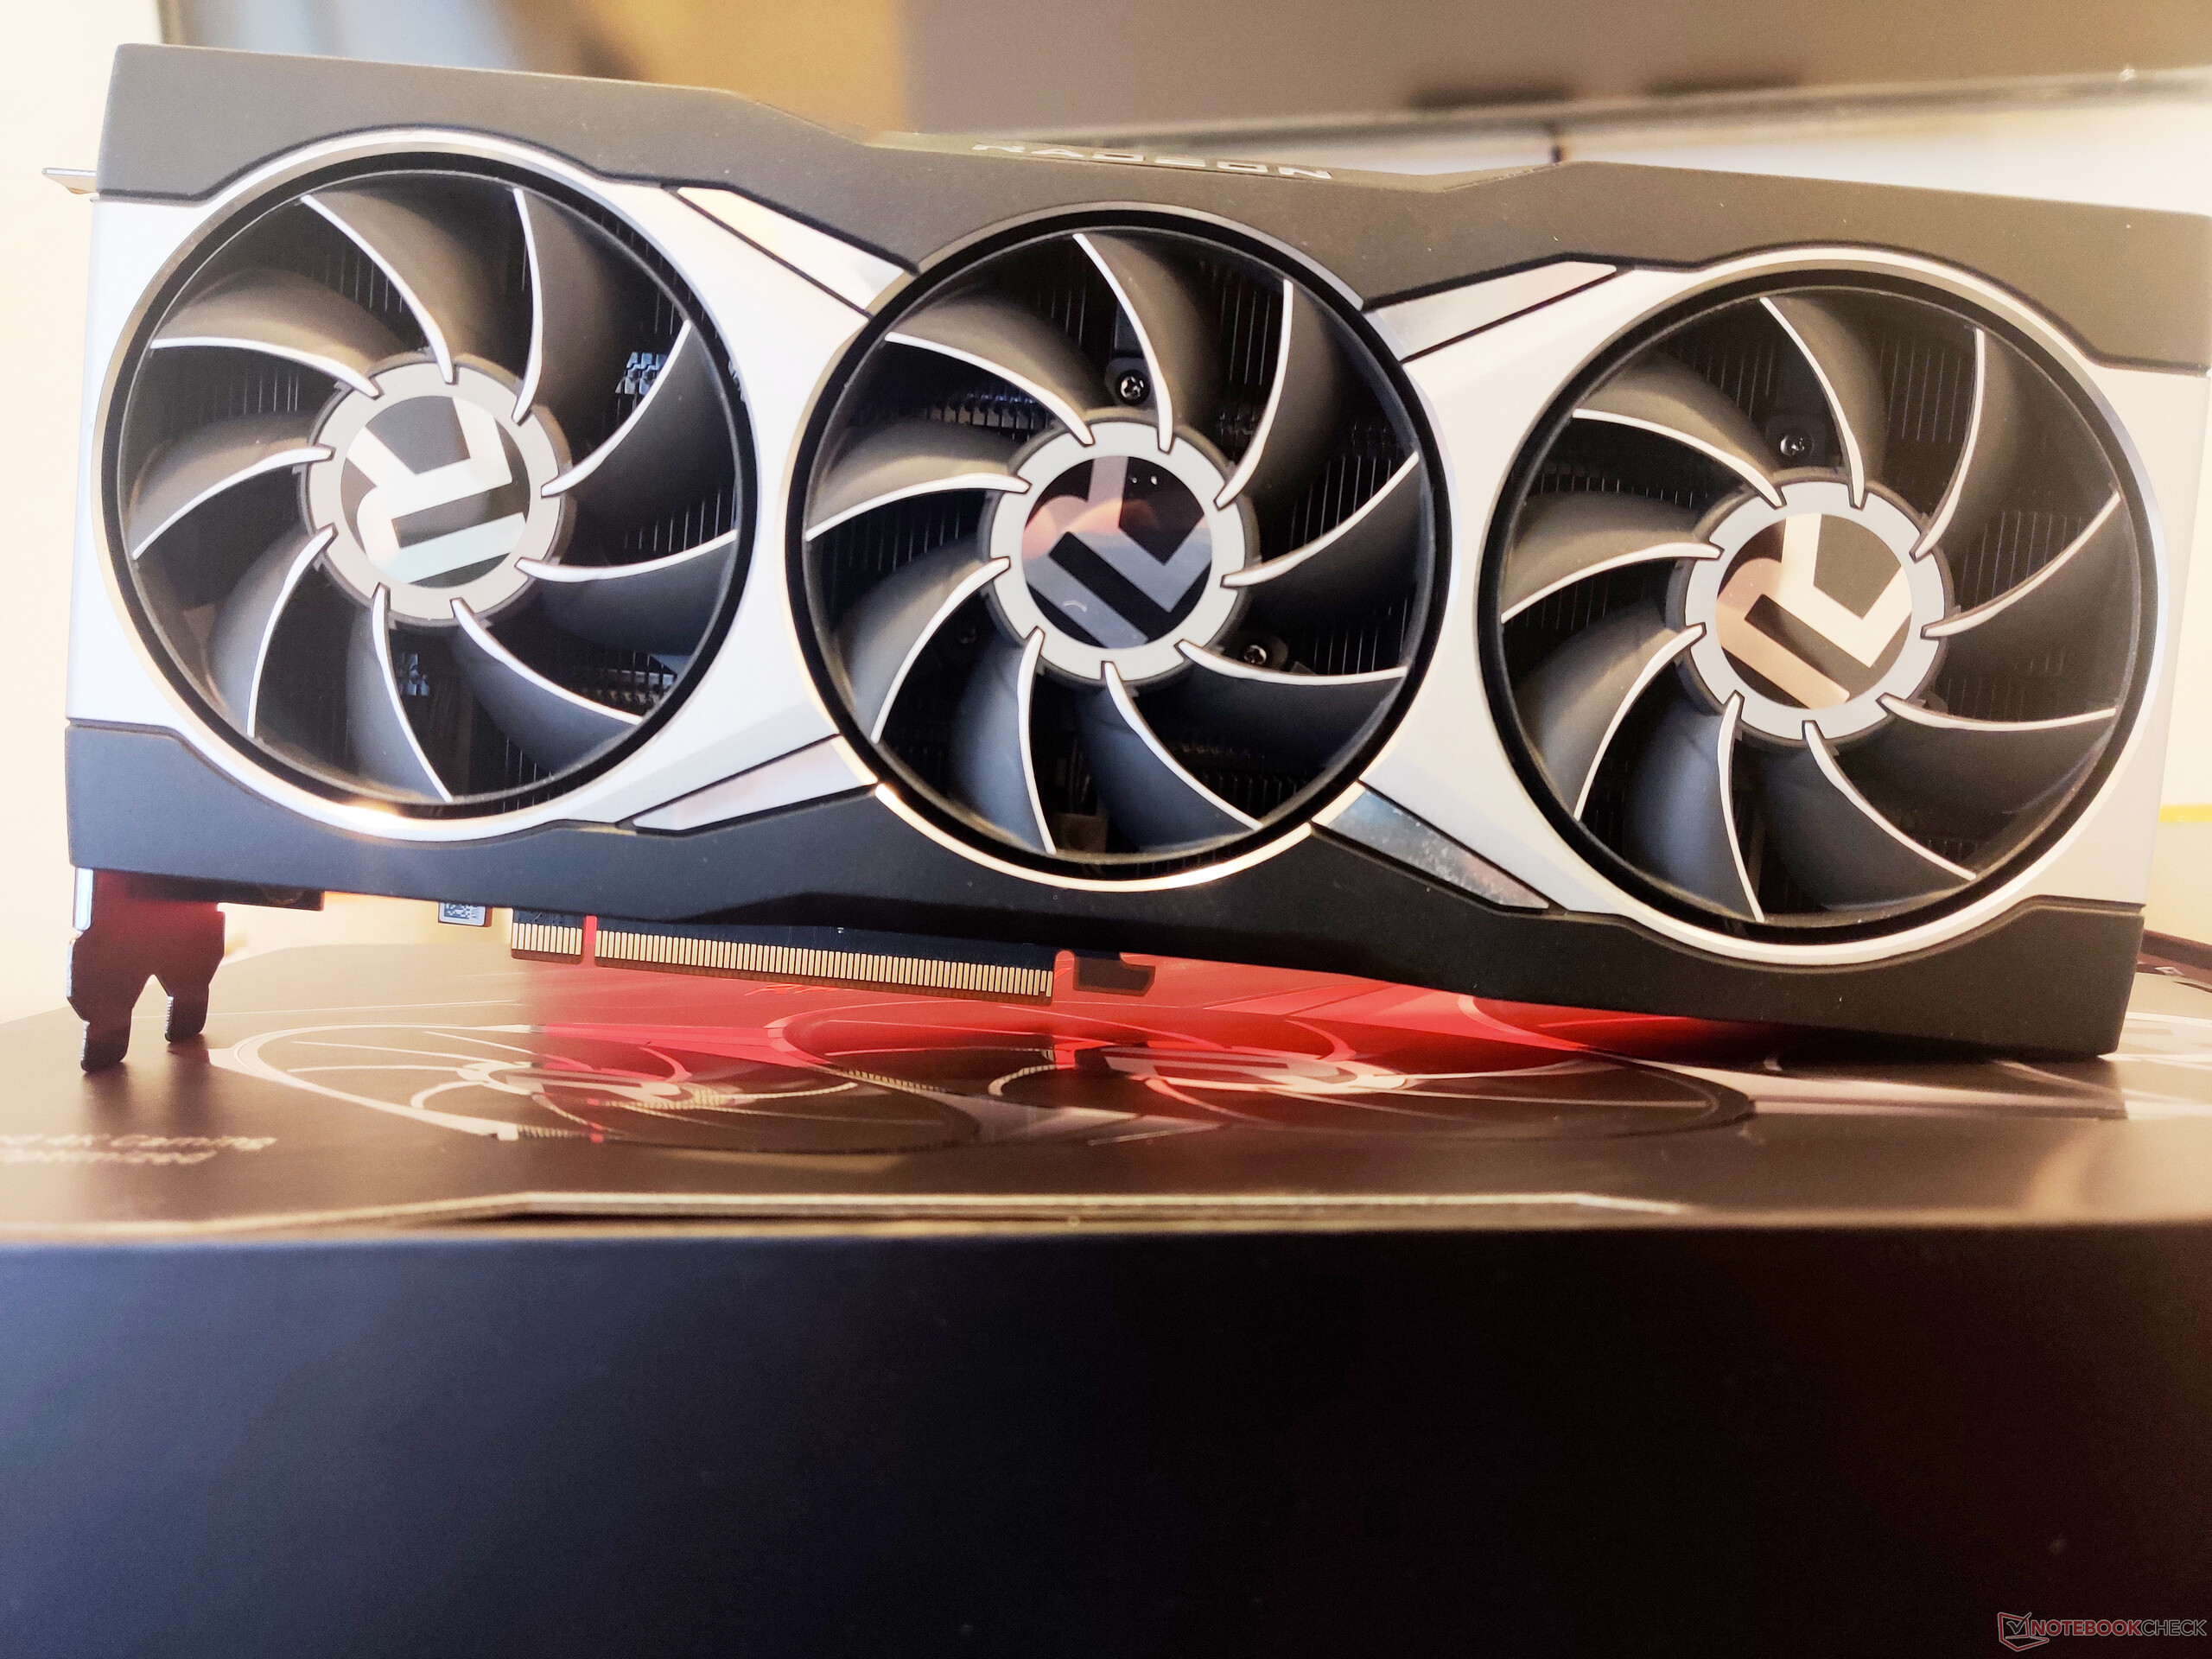
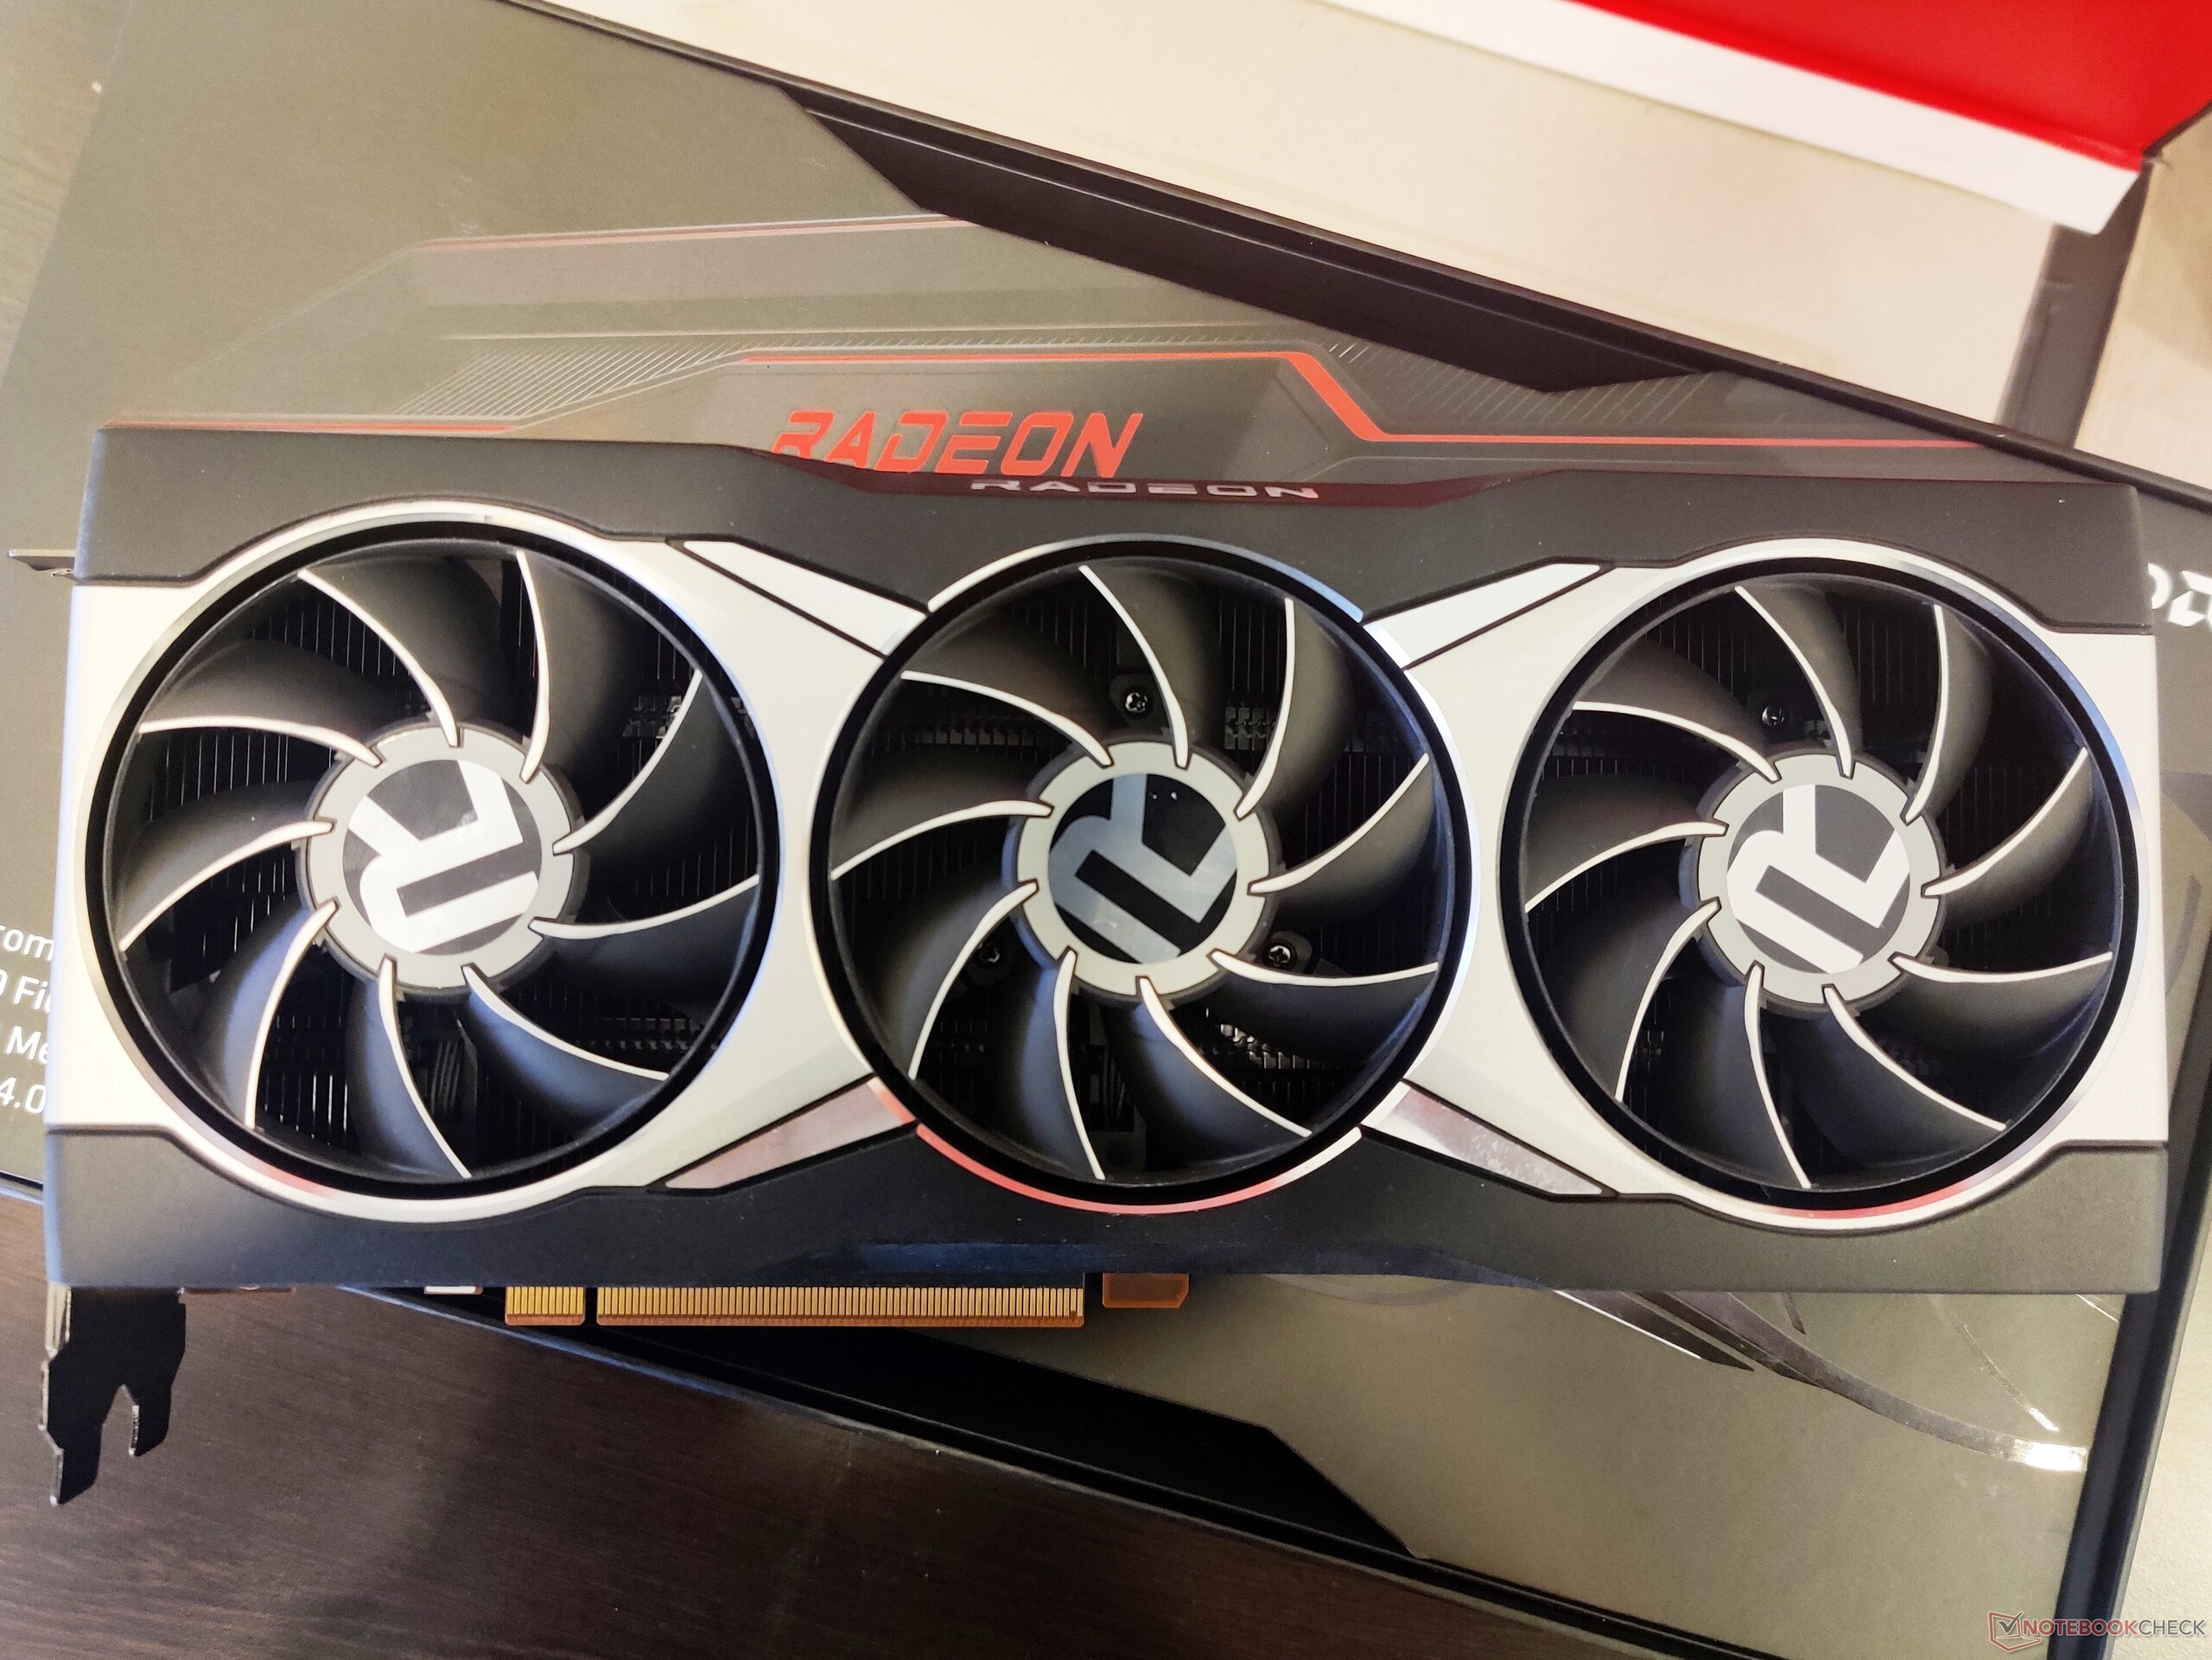
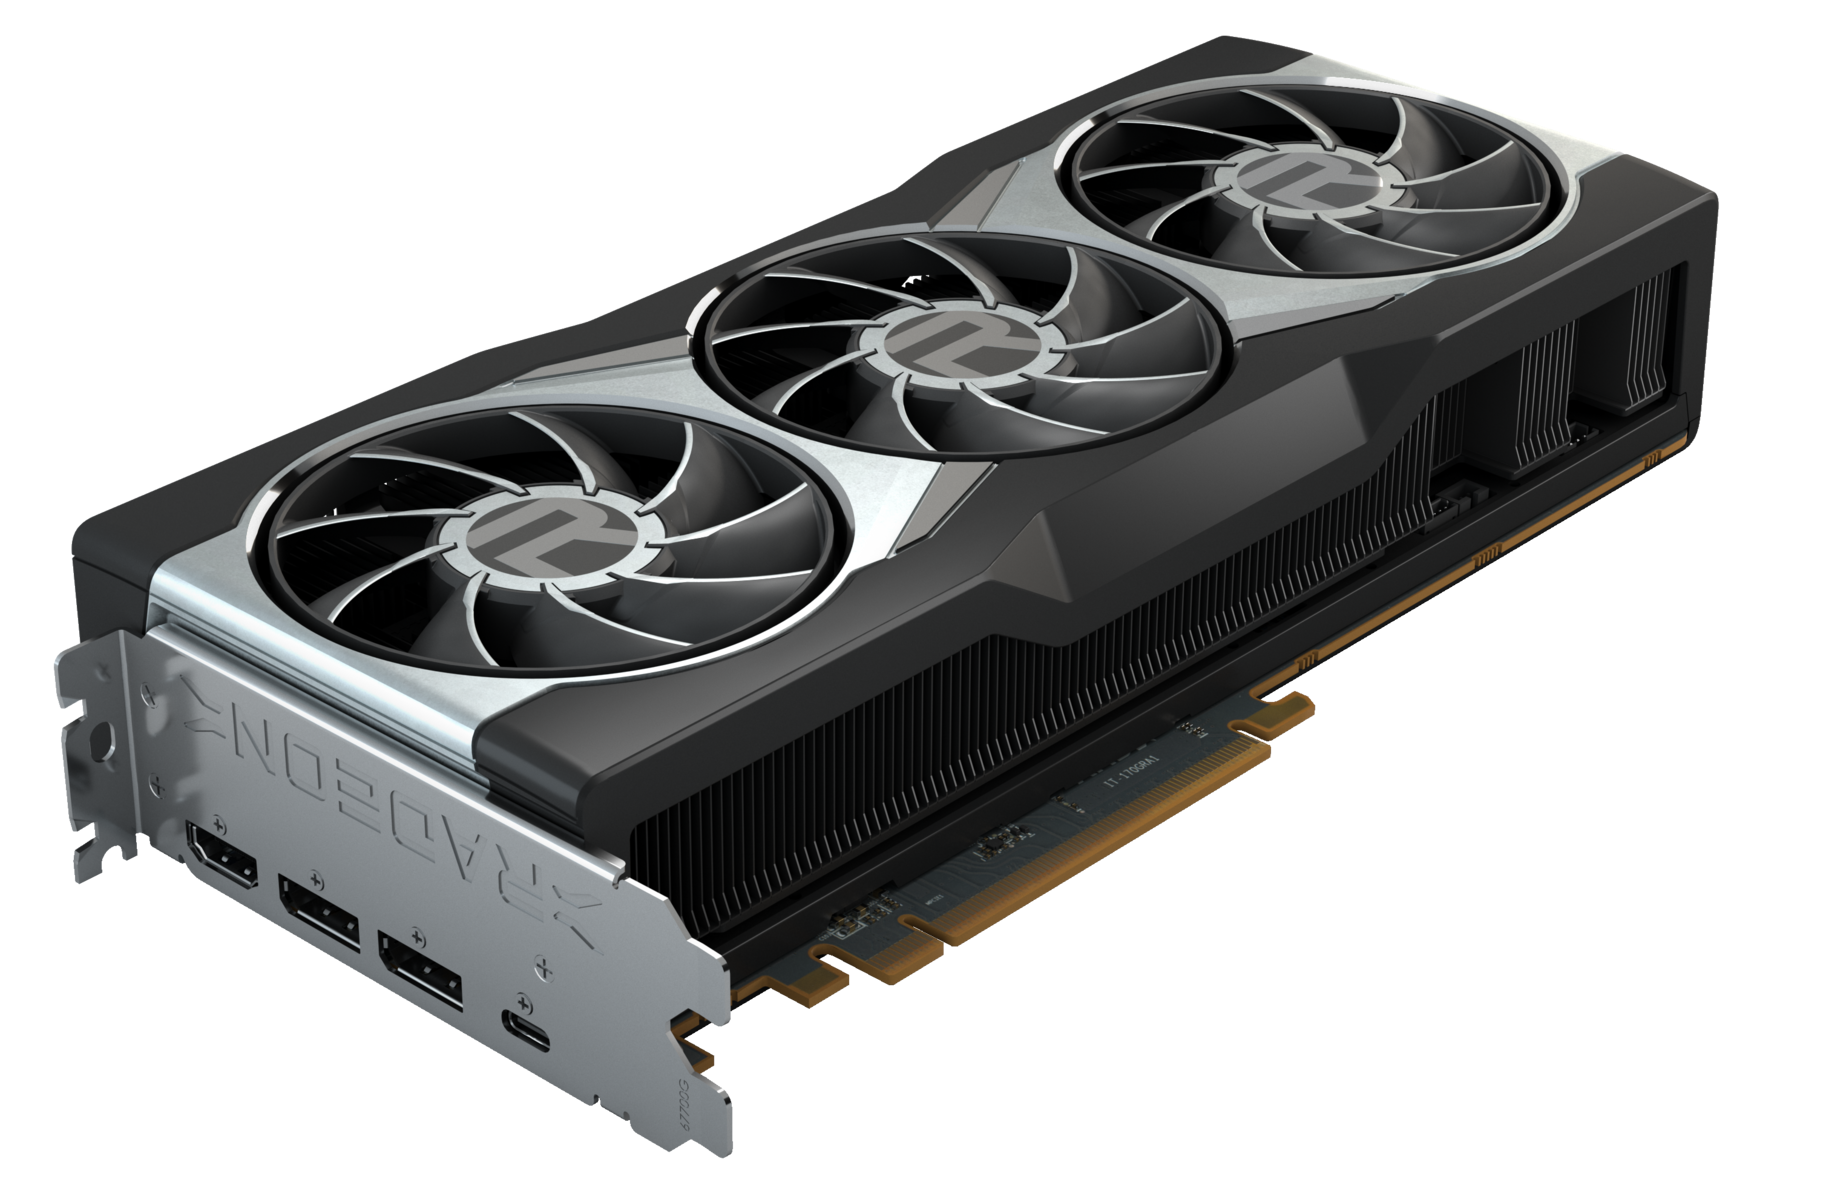
Vendo o cartão em si, vemos que a AMD abandonou o refrigerador no estilo ventilador encontrado no cartão de referência RX 5700 XT e optou por um refrigerador com ventilador triplo. Os ventiladores têm o distinto logotipo "R" neles e são construídos em uma moldura metálica prateada brilhante. No topo, encontramos uma guarnição vermelha que percorre o comprimento do cartão e também um logotipo RGB Radeon.

O logotipo da Radeon brilha em vermelho por padrão, mas você pode baixar uma ferramenta LED CoolerMaster RGB https://www.amd.com/en/support/graphics/amd-radeon-6000-series/amd-radeon-6900-series/amd-radeon-rx-6900-xt para ciclismo entre as cores. Nós arriscaríamos um palpite de que o CoolerMaster tem algo a ver com o sistema de resfriamento do projeto de referência seguindo o que já vimos antes com o refrigerador de estoque Wraith Prism da Ryzen.

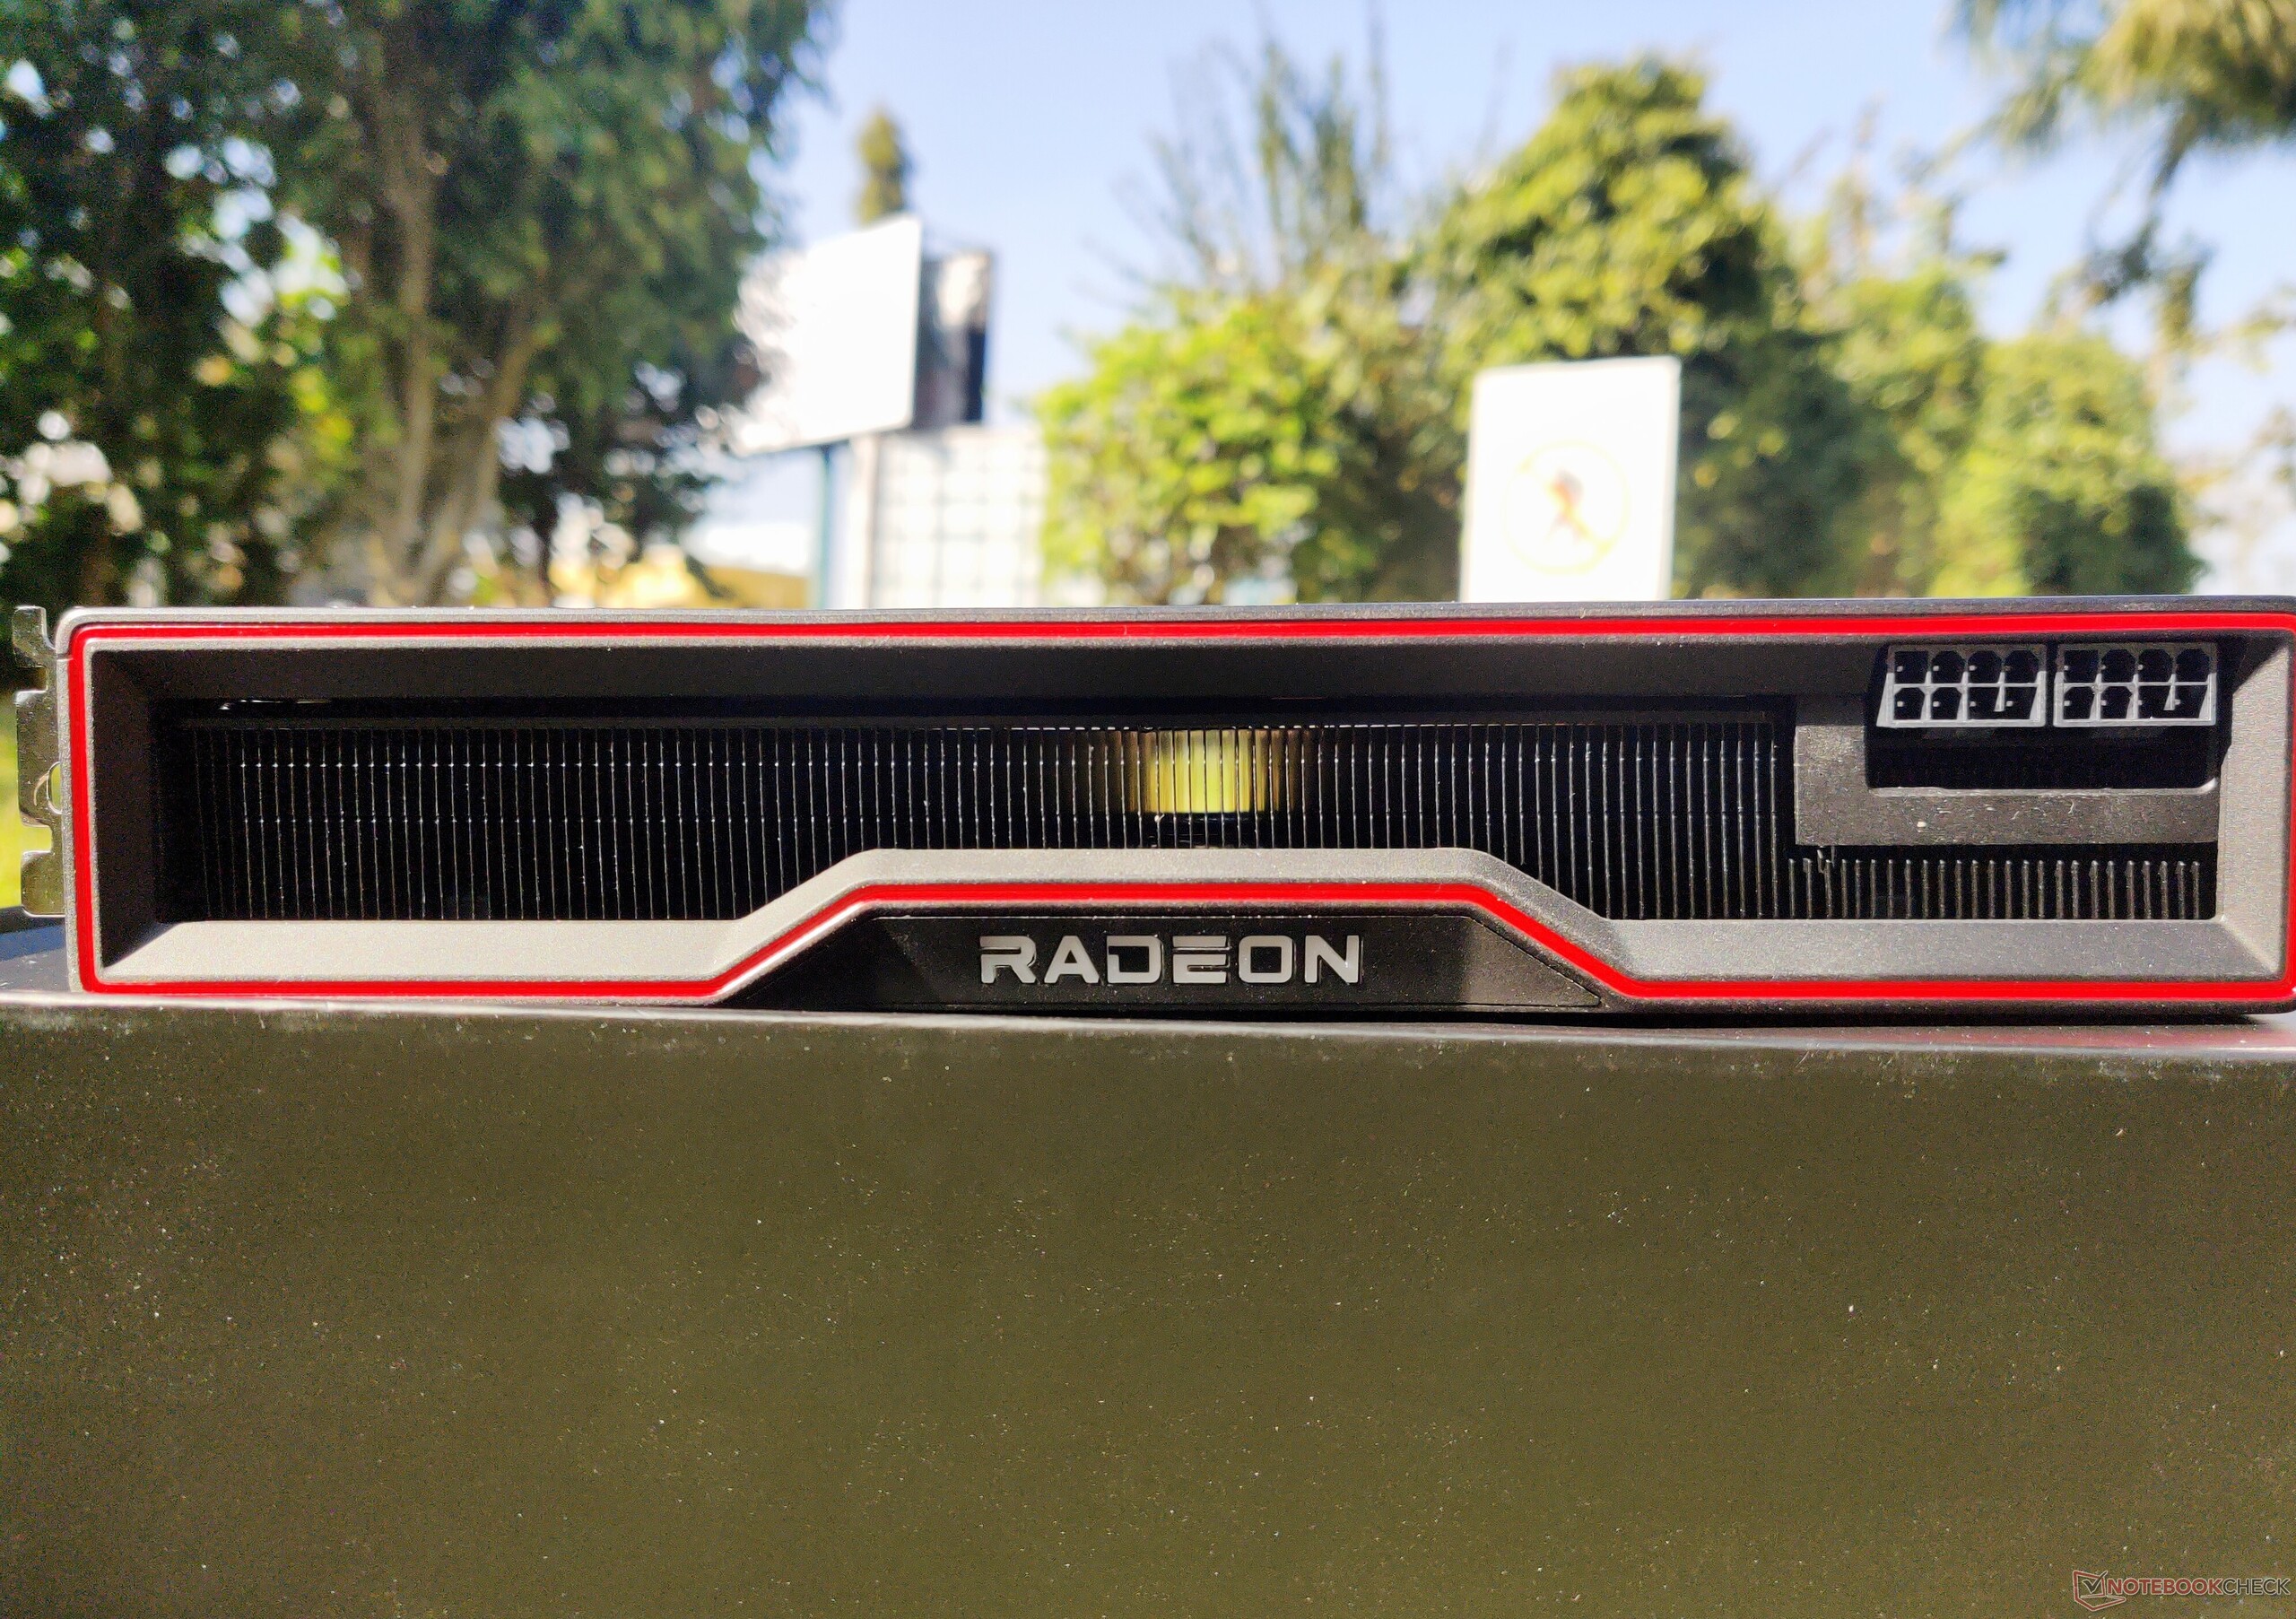
Na parte superior, vemos dois conectores de alimentação de 8 pinos que são colocados em direção à borda direita - não há coisas de antena alienígena de 12 pinos como a NVIDIA, que podem ser boas ou ruins, dependendo de sua preferência.

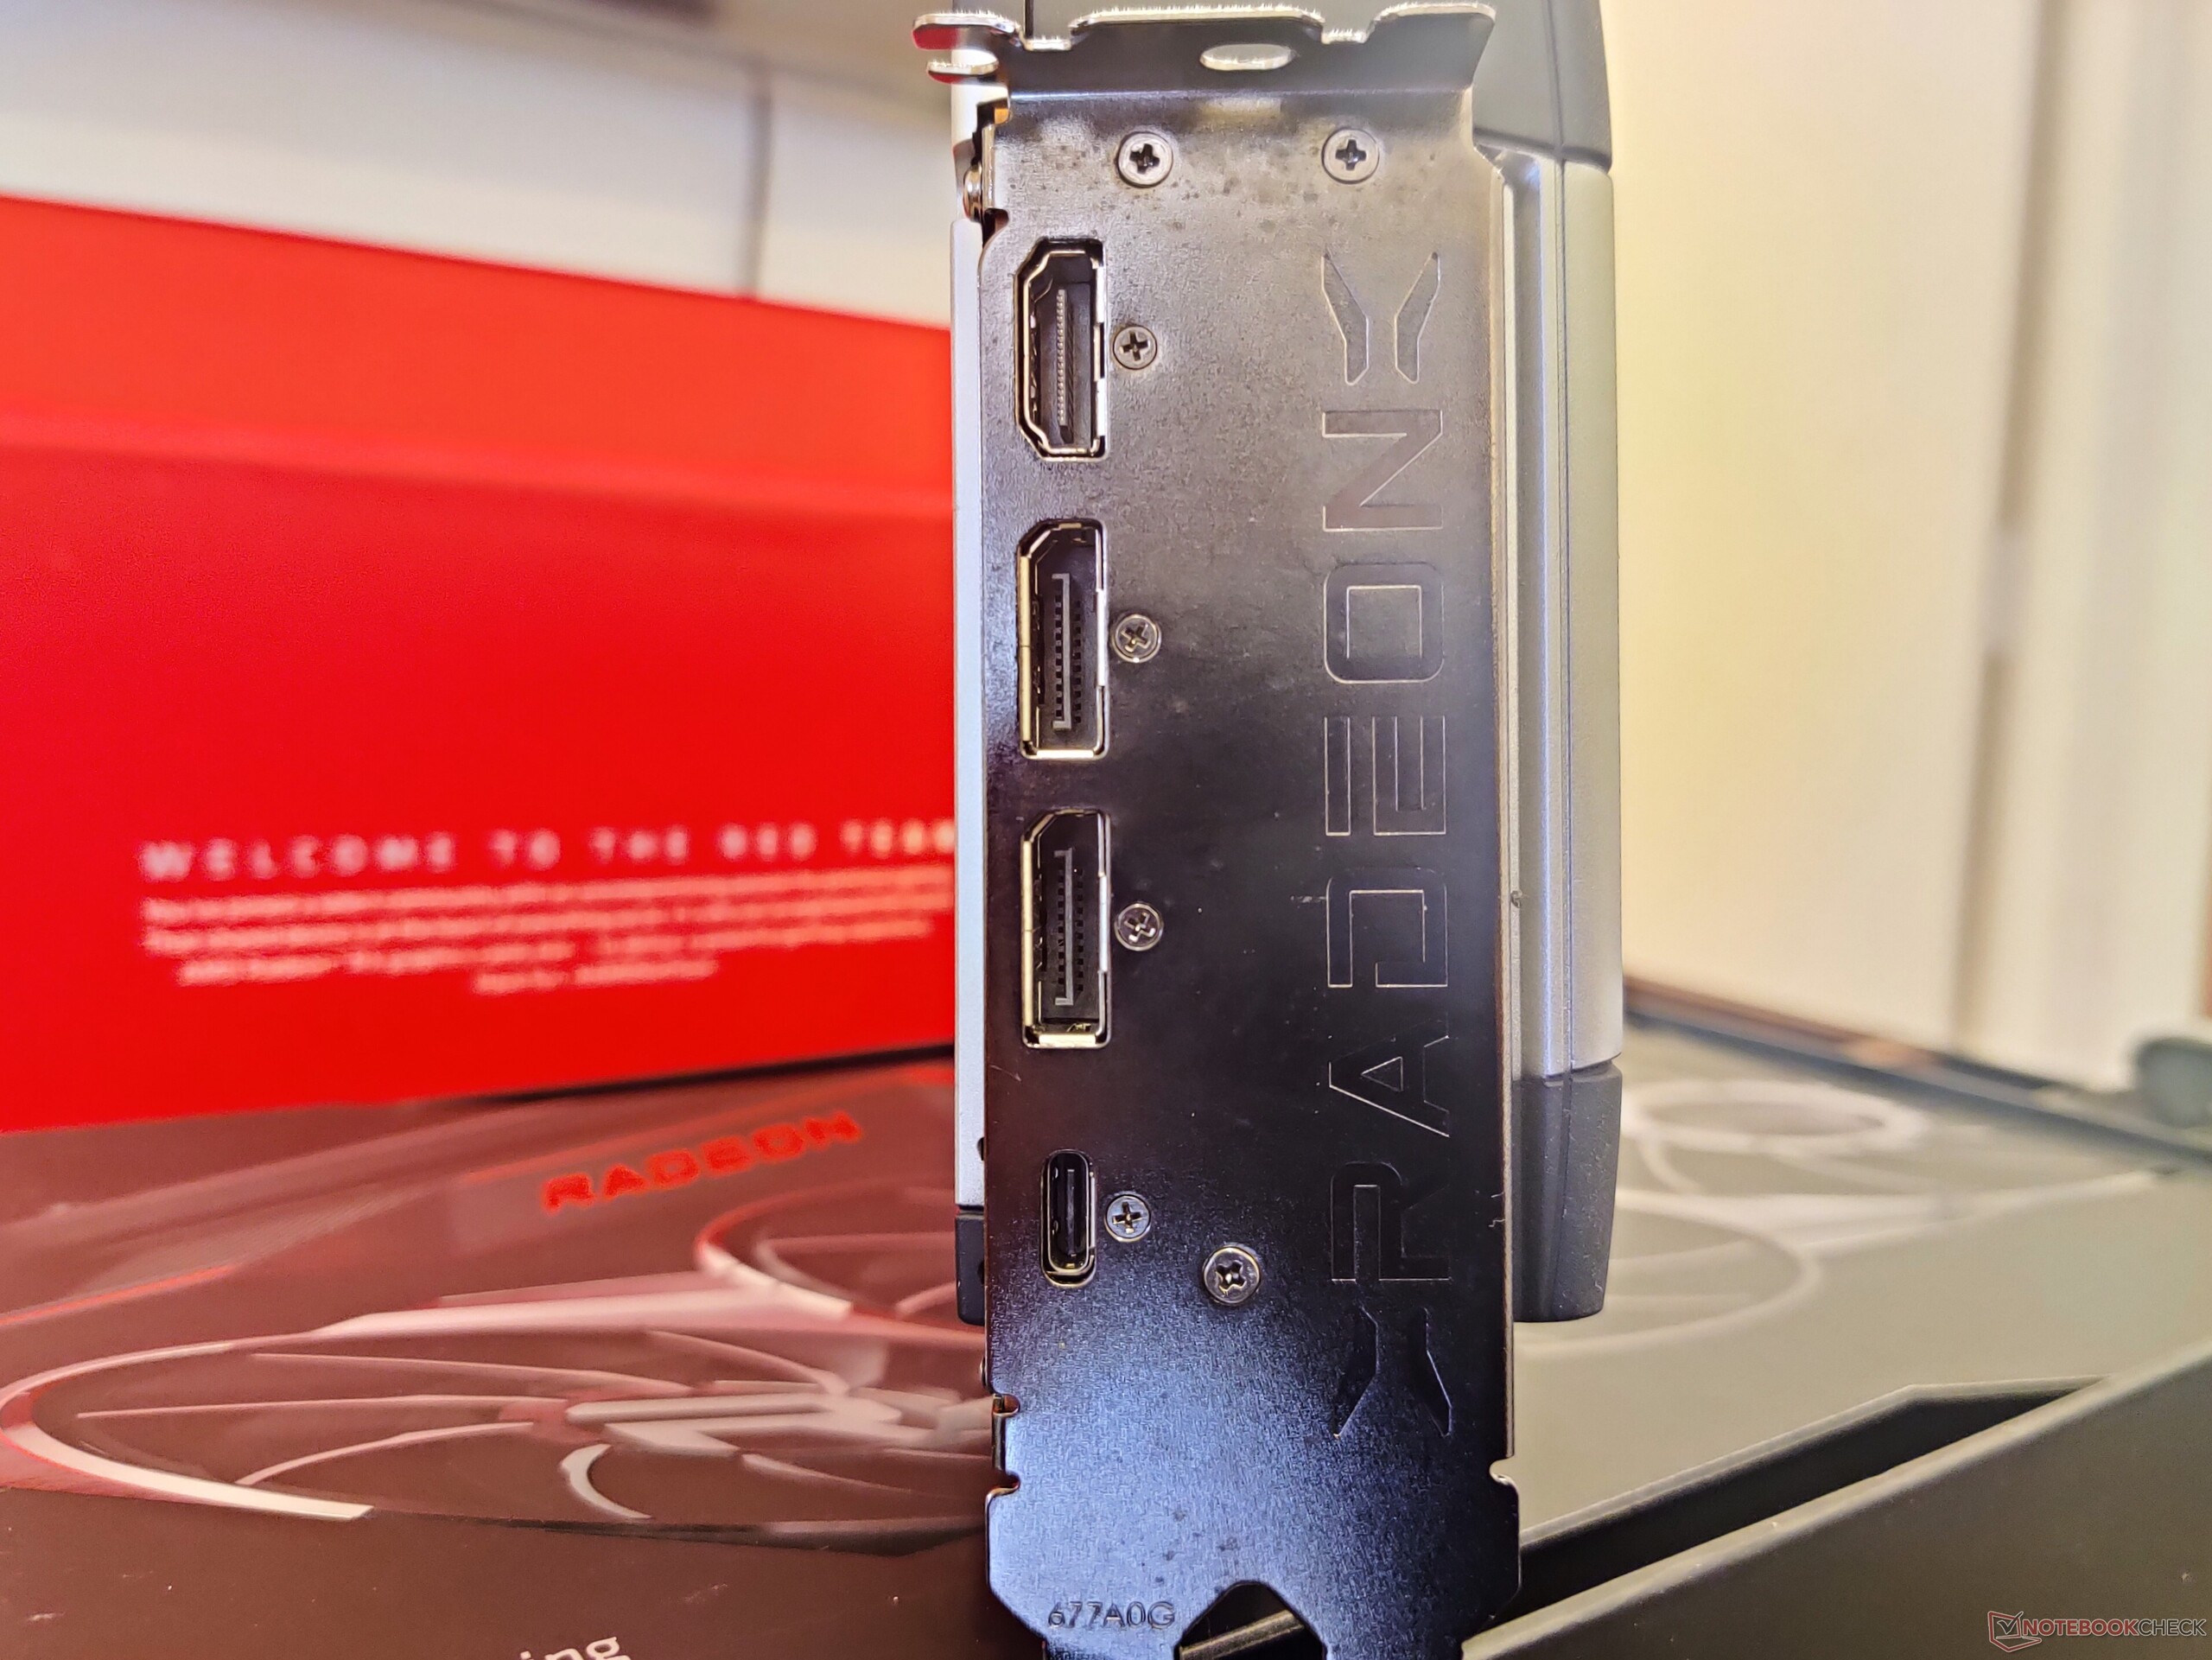
Na parte traseira, temos duas saídas DisplayPort 1.4, uma saída HDMI 2.1, e uma saída USB Type-C com DisplayPort. É bom ver a AMD oferecendo uma porta USB Type-C em um momento em que a NVIDIA a abandonou aparentemente para economizar alguma energia nas placas Ampere.

Não é exatamente uma novidade, mas já faz algum tempo desde que a AMD acenou adeus ao suporte CrossFire para que não haja nenhum porto de ponte CrossFire disponível. A NVIDIA, por outro lado, ainda oferece um conector NVLink no RTX 3090.

No geral, o RX 6900 XT tem um design de referência com 2,7 slots, que deve ter um apelo quase universal.

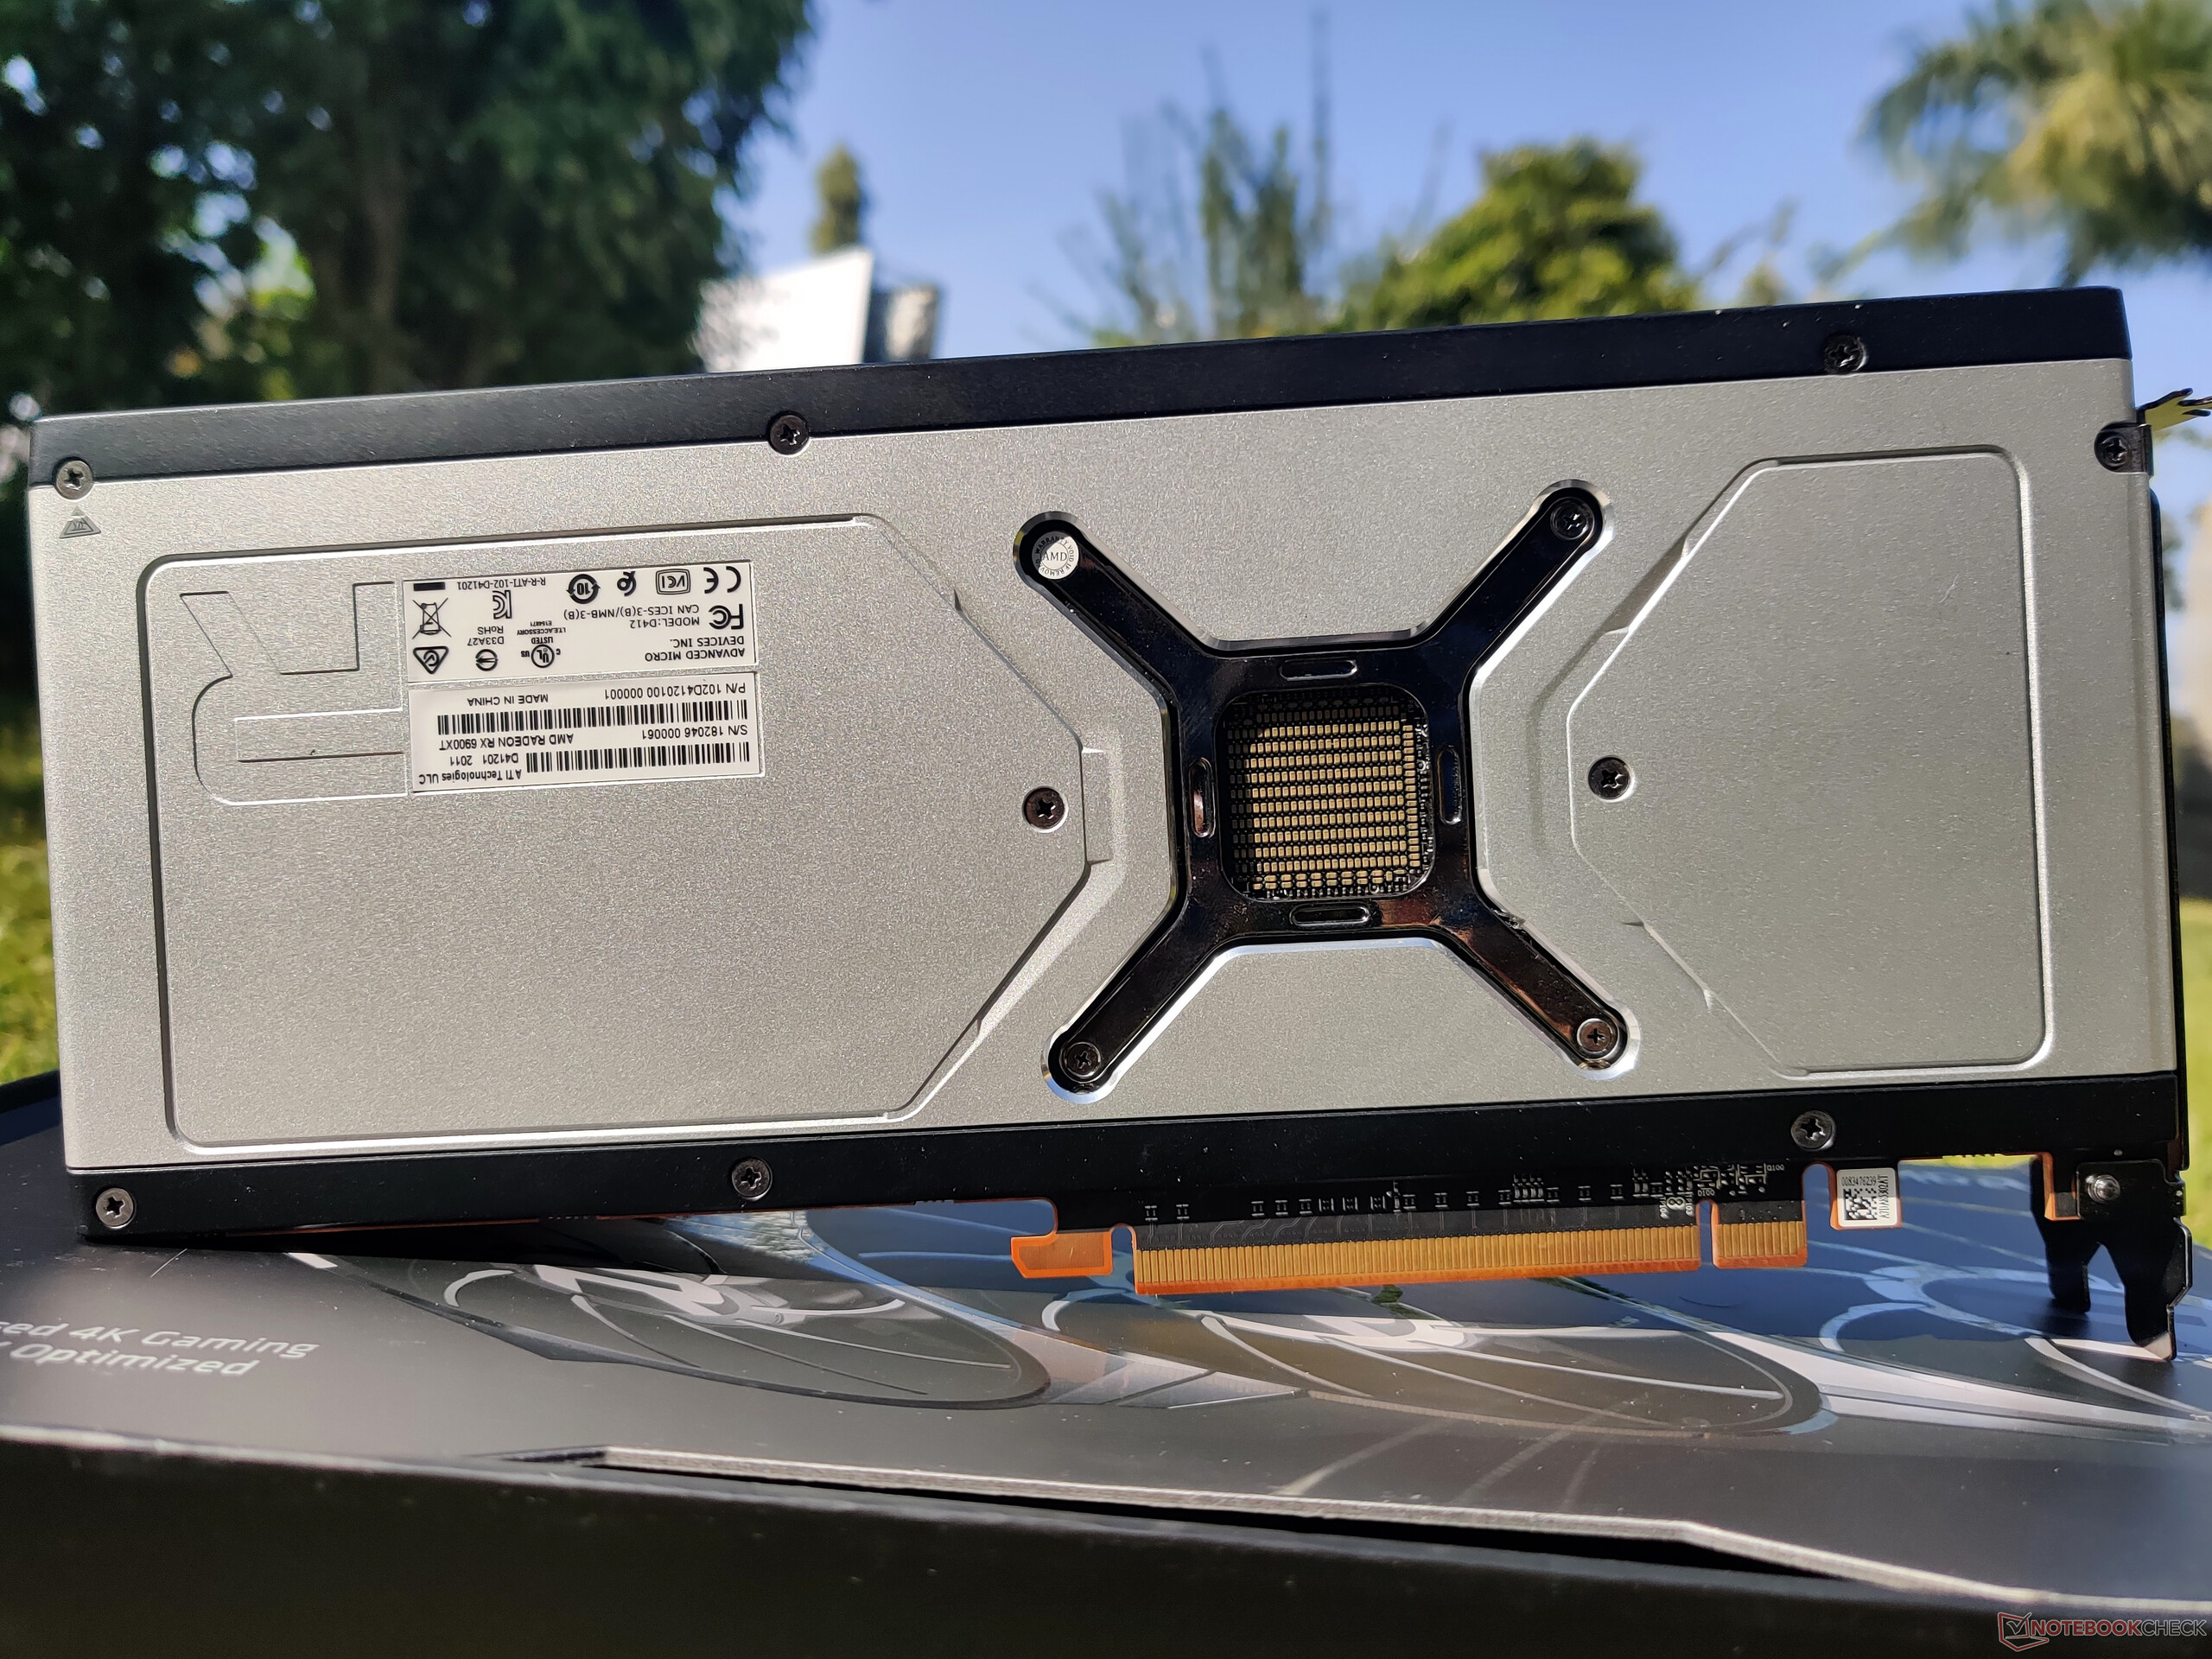
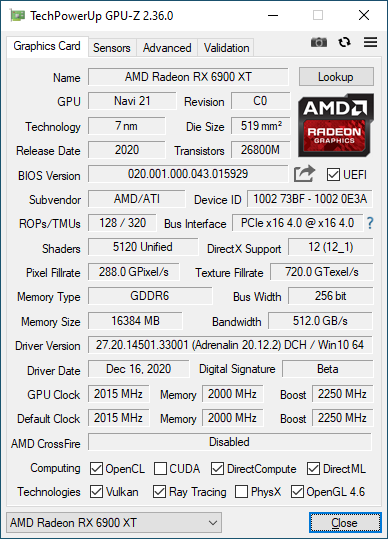
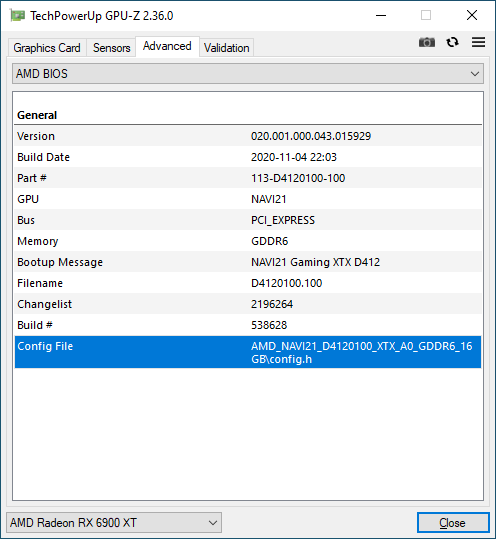
O Radeon RX 6900 XT é baseado na GPU RDNA 2 Navi 21 XTX - uma parte de 7 nm que oferece 80 unidades de computação (CUs), ou seja, 5.120 unidades de sombreamento. A placa tem um relógio de base de 1.825 MHz. Para a maioria das aplicações, a GPU funciona a 2.015 MHz, que a AMD anuncia como o Relógio de Jogo, enquanto aumenta até 2.250 MHz. Dependendo da carga de trabalho e da altura térmica disponível, também são possíveis aumentos ainda maiores.

Assim como o RX 6800 XT, o RX 6900 XT também oferece 16 GB GDDR6 VRAM em um barramento de 256 bits, produzindo uma largura de banda de memória de até 512 GB/s. A AMD equipou o Radeon RX 6900 XT com um Infinity Cache de 128 MB que cobre o mais lento (mas mais facilmente disponível) GDDR6 VRAM e o menor barramento de memória de 256 bits para atingir níveis de desempenho semelhantes aos da NVIDIA com um barramento maior, mais caro GDDR6X VRAM e maior largura de banda de memória

O Radeon RX 6900 XT é classificado para uma potência total de placa de 300 W. Durante os testes de estresse, observamos que o núcleo sozinho pode chegar a 255 W

A bancada de teste

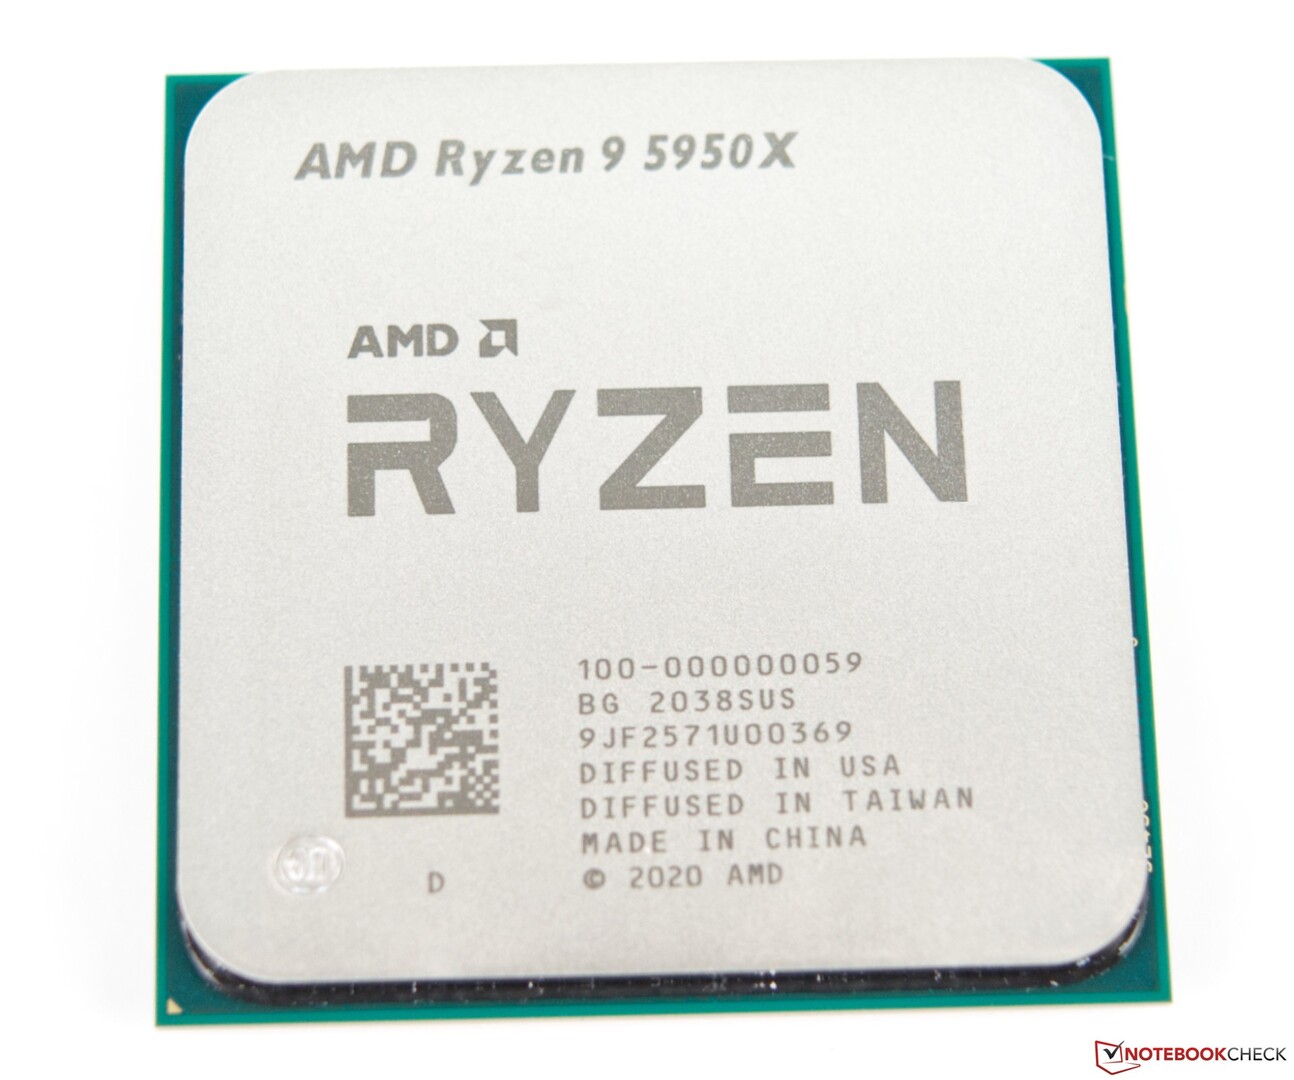
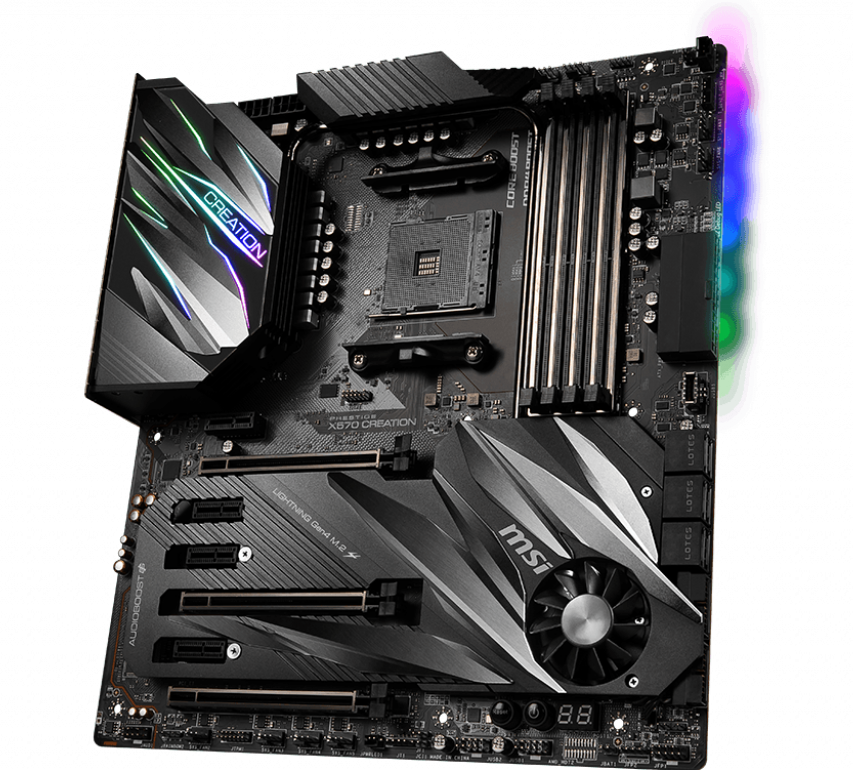
Utilizamos uma plataforma AMD X570 como banco de ensaio para avaliar o RX 6900 XT. Nossa configuração inclui um AMD Ryzen 9 5950X processador emparelhado com 32 GB (16 GB x) de G.SKILL Trident Z Neo DDR4-3200 RAM (timings 16-19-19-39) em uma placa-mãe de criação MSI Prestige X570

Um SSD Gigabyte Aorus NVMe Gen4 1 TB foi usado para executar o Windows 10 20H2 com os últimos patches cumulativos, enquanto os benchmarks e jogos foram instalados em dois SSDs MX500 SATA Crucial de 1 TB.

Mantendo o 16C/32T Ryzen 9 5950X frio era um refrigerador iCUE H115i Capellix AIO Corsair. A instalação foi alojada em uma caixa iCUE 4000X RGB Corsair com um Thermaltake Toughpower 850 W 80 Plus Gold como fonte de alimentação.

O RX 6900 XT foi emparelhado com uma TV inteligente OnePlus série U 55U1 rodando a 4K 60 Hz. A saída de cores foi ajustada para o formato Full RGB 4:4:4 pixel no software Radeon e a escala da área de trabalho do Windows foi ajustada para 100%.

Gostaríamos de agradecer à AMD por fornecer o RX 6900 XT e o Ryzen 9 5950X, à Corsair pelo refrigerador iCUE Elite Capellix AIO e pela caixa iCUE 4000X, e à OnePlus pela TV U série 55U1 4K

CPU AMD Ryzen 9 5950X
MSI Prestige X570 Criação da placa-mãe. (Fonte da imagem: MSI)
Gigabyte Aorus NVMe Gen4 SSD. (Fonte da imagem: Gigabyte)
G.SKILL Trident Z Neo DDR4-3600 RAM. (Fonte da imagem: G.SKILL)

Benchmarks Sintéticos

Na maioria dos testes 3DMark, o RX 6900 XT está no mesmo nível ou até melhor que o NVIDIA RTX 3090. As pistas máximas são vistas no 3DMark Fire Strike em até 1440p. No 4K Fire Strike Ultra, o chumbo é reduzido para cerca de 11% sobre a média do RTX 3090. Time Spy , no entanto, mostra que as bandeiras AMD e NVIDIA estão mais ou menos ao mesmo nível uma da outra

As capacidades da arquitetura RDNA2 quando se trata de traçado de raio não são pobres por si só, mas as deficiências se tornam bastante evidentes no teste Port Royal, no qual o RX 6900 XT fica visivelmente atrás do RTX 3080 em 15% e significativamente atrás do RTX 3090 em 24%. Dito isto, vemos que o RX 6900 XT tem um desempenho cerca de 9% melhor do que a média RTX 2080 Ti nesta referência.

Os benchmarks Unigine mostram melhores resultados nos testes DirectX em comparação com os OpenGL, especialmente nos benchmarks Valley e Heaven. Em Superposição, o RX 6900 XT leva uma surra no teste 8K Otimizado, que segue o RTX 3090 em 20%. Esta lacuna diminui significativamente em resoluções mais baixas, e vemos a GPU a seguir apenas em cerca de 8% no benchmark 4K Otimizado

3DMark
2560x1440 Time Spy Graphics
Average NVIDIA GeForce RTX 3090
  (18685 - 20433, n=16)
19254 Points +6%
Nvidia GeForce RTX 3090 Founders Edition
NVIDIA GeForce RTX 3090, R9 5900X
18685 Points +3%
AMD Radeon RX 6900 XT
AMD Radeon RX 6900 XT, R9 5950X
18210 Points
AMD Radeon RX 6800 XT
AMD Radeon RX 6800 XT, R9 5950X
17603 Points -3%
Average NVIDIA GeForce RTX 3080
  (17467 - 17604, n=2)
17536 Points -4%
ASUS GeForce RTX 3080 ROG STRIX OC GAMING
NVIDIA GeForce RTX 3080, R9 5900X
17467 Points -4%
AMD Ryzen 9 5900X
NVIDIA Titan RTX, R9 5900X
15283 Points -16%
Average NVIDIA Titan RTX
  (14216 - 15283, n=29)
14884 Points -18%
Average NVIDIA GeForce RTX 2080 Ti (Desktop)
  (13744 - 14645, n=4)
14283 Points -22%
KFA2 GeForce RTX 2080 Ti EX
NVIDIA GeForce RTX 2080 Ti (Desktop), R9 3900X
13744 Points -25%
MSI GeForce RTX 3070 Gaming X Trio
NVIDIA GeForce RTX 3070, R9 5900X
13579 Points -25%
Average NVIDIA GeForce RTX 3070
  (11043 - 13579, n=7)
12616 Points -31%
Nvidia GeForce RTX 2080 Super
NVIDIA GeForce RTX 2080 Super (Desktop), R7 2700X
11477 Points -37%
Average NVIDIA GeForce RTX 2080 Super (Desktop)
  (11313 - 11542, n=4)
11439 Points -37%
Nvidia GeForce RTX 2070 Super
NVIDIA GeForce RTX 2070 Super (Desktop), R7 2700X
10094 Points -45%
Average NVIDIA GeForce RTX 2070 Super (Desktop)
  (9564 - 10094, n=8)
9846 Points -46%
AMD Radeon RX 5700 XT
AMD Radeon RX 5700 XT (Desktop), R7 2700X
8673 Points -52%
Average AMD Radeon RX 5700 XT (Desktop)
  (6050 - 9371, n=7)
8574 Points -53%
AMD Radeon RX 5700
AMD Radeon RX 5700 (Desktop), R7 2700X
7675 Points -58%
1920x1080 Fire Strike Graphics
AMD Radeon RX 6900 XT
AMD Radeon RX 6900 XT, R9 5950X
50587 Points
AMD Radeon RX 6800 XT
AMD Radeon RX 6800 XT, R9 5950X
49735 Points -2%
Average NVIDIA GeForce RTX 3090
  (41298 - 49282, n=16)
46854 Points -7%
Nvidia GeForce RTX 3090 Founders Edition
NVIDIA GeForce RTX 3090, R9 5900X
41298 Points -18%
ASUS GeForce RTX 3080 ROG STRIX OC GAMING
NVIDIA GeForce RTX 3080, R9 5900X
40910 Points -19%
Average NVIDIA GeForce RTX 3080
  (37604 - 40910, n=2)
39257 Points -22%
Average NVIDIA Titan RTX
  (33377 - 40910, n=30)
36062 Points -29%
AMD Ryzen 9 5900X
NVIDIA Titan RTX, R9 5900X
34722 Points -31%
Average NVIDIA GeForce RTX 2080 Ti (Desktop)
  (32081 - 35851, n=4)
34141 Points -33%
KFA2 GeForce RTX 2080 Ti EX
NVIDIA GeForce RTX 2080 Ti (Desktop), R9 3900X
32081 Points -37%
MSI GeForce RTX 3070 Gaming X Trio
NVIDIA GeForce RTX 3070, R9 5900X
31096 Points -39%
Average NVIDIA GeForce RTX 3070
  (20357 - 33270, n=7)
28949 Points -43%
Average NVIDIA GeForce RTX 2080 Super (Desktop)
  (26824 - 28968, n=4)
27647 Points -45%
Nvidia GeForce RTX 2080 Super
NVIDIA GeForce RTX 2080 Super (Desktop), R7 2700X
27075 Points -46%
AMD Radeon RX 5700 XT
AMD Radeon RX 5700 XT (Desktop), R7 2700X
25383 Points -50%
Average AMD Radeon RX 5700 XT (Desktop)
  (19850 - 27164, n=7)
25322 Points -50%
Average NVIDIA GeForce RTX 2070 Super (Desktop)
  (22819 - 25799, n=8)
24645 Points -51%
Nvidia GeForce RTX 2070 Super
NVIDIA GeForce RTX 2070 Super (Desktop), R7 2700X
24151 Points -52%
AMD Radeon RX 5700
AMD Radeon RX 5700 (Desktop), R7 2700X
22457 Points -56%
3840x2160 Fire Strike Ultra Graphics
AMD Radeon RX 6900 XT
AMD Radeon RX 6900 XT, R9 5950X
13370 Points
AMD Radeon RX 6800 XT
AMD Radeon RX 6800 XT, R9 5950X
12626 Points -6%
Average NVIDIA GeForce RTX 3090
  (11613 - 12587, n=13)
12305 Points -8%
Nvidia GeForce RTX 3090 Founders Edition
NVIDIA GeForce RTX 3090, R9 5900X
11613 Points -13%
ASUS GeForce RTX 3080 ROG STRIX OC GAMING
NVIDIA GeForce RTX 3080, R9 5900X
10793 Points -19%
Average NVIDIA GeForce RTX 3080
  (10645 - 10793, n=2)
10719 Points -20%
Average NVIDIA Titan RTX
  (8461 - 10793, n=29)
8868 Points -34%
AMD Ryzen 9 5900X
NVIDIA Titan RTX, R9 5900X
8649 Points -35%
MSI GeForce RTX 3070 Gaming X Trio
NVIDIA GeForce RTX 3070, R9 5900X
8483 Points -37%
Average NVIDIA GeForce RTX 3070
  (8043 - 8483, n=5)
8250 Points -38%
Average NVIDIA GeForce RTX 2080 Ti (Desktop)
  (7925 - 8504, n=4)
8226 Points -38%
KFA2 GeForce RTX 2080 Ti EX
NVIDIA GeForce RTX 2080 Ti (Desktop), R9 3900X
7925 Points -41%
Average NVIDIA GeForce RTX 2080 Super (Desktop)
  (6500 - 6700, n=3)
6585 Points -51%
Nvidia GeForce RTX 2080 Super
NVIDIA GeForce RTX 2080 Super (Desktop), R7 2700X
6500 Points -51%
Average AMD Radeon RX 5700 XT (Desktop)
  (4989 - 6500, n=7)
6119 Points -54%
AMD Radeon RX 5700 XT
AMD Radeon RX 5700 XT (Desktop), R7 2700X
5955 Points -55%
Nvidia GeForce RTX 2070 Super
NVIDIA GeForce RTX 2070 Super (Desktop), R7 2700X
5786 Points -57%
Average NVIDIA GeForce RTX 2070 Super (Desktop)
  (2290 - 5882, n=7)
5313 Points -60%
AMD Radeon RX 5700
AMD Radeon RX 5700 (Desktop), R7 2700X
5292 Points -60%
Fire Strike Extreme Graphics
AMD Radeon RX 6900 XT
AMD Radeon RX 6900 XT, R9 5950X
26650 Points
AMD Radeon RX 6800 XT
AMD Radeon RX 6800 XT, R9 5950X
25015 Points -6%
Average NVIDIA GeForce RTX 3090
  (22075 - 24730, n=13)
23822 Points -11%
Nvidia GeForce RTX 3090 Founders Edition
NVIDIA GeForce RTX 3090, R9 5900X
22075 Points -17%
ASUS GeForce RTX 3080 ROG STRIX OC GAMING
NVIDIA GeForce RTX 3080, R9 5900X
20861 Points -22%
Average NVIDIA GeForce RTX 3080
  (20007 - 20861, n=2)
20434 Points -23%
Average NVIDIA Titan RTX
  (16484 - 20861, n=29)
17649 Points -34%
AMD Ryzen 9 5900X
NVIDIA Titan RTX, R9 5900X
17176 Points -36%
Average NVIDIA GeForce RTX 2080 Ti (Desktop)
  (15603 - 16856, n=3)
16416 Points -38%
MSI GeForce RTX 3070 Gaming X Trio
NVIDIA GeForce RTX 3070, R9 5900X
16196 Points -39%
Average NVIDIA GeForce RTX 3070
  (15503 - 16276, n=5)
15859 Points -40%
KFA2 GeForce RTX 2080 Ti EX
NVIDIA GeForce RTX 2080 Ti (Desktop), R9 3900X
15603 Points -41%
Average NVIDIA GeForce RTX 2080 Super (Desktop)
  (12968 - 13551, n=3)
13172 Points -51%
Nvidia GeForce RTX 2080 Super
NVIDIA GeForce RTX 2080 Super (Desktop), R7 2700X
12968 Points -51%
Average AMD Radeon RX 5700 XT (Desktop)
  (12178 - 12921, n=6)
12611 Points -53%
AMD Radeon RX 5700 XT
AMD Radeon RX 5700 XT (Desktop), R7 2700X
12209 Points -54%
Average NVIDIA GeForce RTX 2070 Super (Desktop)
  (11382 - 12044, n=7)
11850 Points -56%
Nvidia GeForce RTX 2070 Super
NVIDIA GeForce RTX 2070 Super (Desktop), R7 2700X
11634 Points -56%
AMD Radeon RX 5700
AMD Radeon RX 5700 (Desktop), R7 2700X
10876 Points -59%
2560x1440 Port Royal Graphics
Average NVIDIA GeForce RTX 3090
  (12255 - 13075, n=5)
12728 Points +33%
Nvidia GeForce RTX 3090 Founders Edition
NVIDIA GeForce RTX 3090, R9 5900X
12384 Points +29%
Average NVIDIA GeForce RTX 3080
  (11238 - 11433, n=2)
11336 Points +18%
ASUS GeForce RTX 3080 ROG STRIX OC GAMING
NVIDIA GeForce RTX 3080, R9 5900X
11238 Points +17%
AMD Radeon RX 6900 XT
AMD Radeon RX 6900 XT, R9 5950X
9585 Points
AMD Ryzen 9 5900X
NVIDIA Titan RTX, R9 5900X
9335 Points -3%
AMD Ryzen 9 5900X
NVIDIA Titan RTX, R9 5900X
9239 Points -4%
Average NVIDIA Titan RTX
  (8945 - 9528, n=24)
9303 Points -3%
Average NVIDIA GeForce RTX 2080 Ti (Desktop)
  (8537 - 9021, n=2)
8779 Points -8%
KFA2 GeForce RTX 2080 Ti EX
NVIDIA GeForce RTX 2080 Ti (Desktop), R9 3900X
8537 Points -11%
MSI GeForce RTX 3070 Gaming X Trio
NVIDIA GeForce RTX 3070, R9 5900X
8191 Points -15%
Average NVIDIA GeForce RTX 3070
  (7796 - 8191, n=5)
7941 Points -17%
Average NVIDIA GeForce RTX 2080 Super (Desktop)
  (6745 - 6947, n=3)
6873 Points -28%
Nvidia GeForce RTX 2080 Super
NVIDIA GeForce RTX 2080 Super (Desktop), R7 2700X
6745 Points -30%
Nvidia GeForce RTX 2070 Super
NVIDIA GeForce RTX 2070 Super (Desktop), R7 2700X
5840 Points -39%
Average NVIDIA GeForce RTX 2070 Super (Desktop)
  (5725 - 5988, n=5)
5838 Points -39%
Unigine Heaven 4.0
Extreme Preset DX11
Average NVIDIA GeForce RTX 3090
  (272 - 315, n=10)
299 fps +15%
Nvidia GeForce RTX 3090 Founders Edition
NVIDIA GeForce RTX 3090, R9 5900X
274 fps +6%
AMD Radeon RX 6900 XT
AMD Radeon RX 6900 XT, R9 5950X
259.5 (49.3min - 537.2max) fps
AMD Radeon RX 6800 XT
AMD Radeon RX 6800 XT, R9 5950X
247.9 fps -4%
Average NVIDIA GeForce RTX 3080
  (233 - 253, n=2)
243 fps -6%
AMD Ryzen 9 5900X
NVIDIA Titan RTX, R9 5900X
237.1 fps -9%
Average NVIDIA Titan RTX
  (207 - 248, n=12)
236 fps -9%
ASUS GeForce RTX 3080 ROG STRIX OC GAMING
NVIDIA GeForce RTX 3080, R9 5900X
232.6 fps -10%
Average NVIDIA GeForce RTX 2080 Ti (Desktop)
  (215 - 226, n=3)
222 fps -14%
KFA2 GeForce RTX 2080 Ti EX
NVIDIA GeForce RTX 2080 Ti (Desktop), R9 3900X
215.2 fps -17%
Average NVIDIA GeForce RTX 3070
  (196.4 - 214, n=5)
206 fps -21%
MSI GeForce RTX 3070 Gaming X Trio
NVIDIA GeForce RTX 3070, R9 5900X
202.5 fps -22%
Nvidia GeForce RTX 2080 Super
NVIDIA GeForce RTX 2080 Super (Desktop), R7 2700X
175.2 fps -32%
Average NVIDIA GeForce RTX 2080 Super (Desktop)
 
175.2 fps -32%
Average NVIDIA GeForce RTX 2070 Super (Desktop)
  (160.1 - 172.3, n=4)
167.1 fps -36%
Nvidia GeForce RTX 2070 Super
NVIDIA GeForce RTX 2070 Super (Desktop), R7 2700X
160.1 fps -38%
Average AMD Radeon RX 5700 XT (Desktop)
  (132.5 - 144.7, n=5)
136.8 fps -47%
AMD Radeon RX 5700 XT
AMD Radeon RX 5700 XT (Desktop), R7 2700X
132.5 fps -49%
AMD Radeon RX 5700
AMD Radeon RX 5700 (Desktop), R7 2700X
119.9 fps -54%
Extreme Preset OpenGL
Average NVIDIA GeForce RTX 3090
  (188.2 - 284, n=9)
268 fps +30%
Average NVIDIA GeForce RTX 3080
  (232 - 243, n=2)
238 fps +15%
ASUS GeForce RTX 3080 ROG STRIX OC GAMING
NVIDIA GeForce RTX 3080, R9 5900X
232.4 fps +13%
Average NVIDIA Titan RTX
  (203 - 299, n=12)
223 fps +8%
AMD Ryzen 9 5900X
NVIDIA Titan RTX, R9 5900X
215.1 fps +4%
AMD Radeon RX 6900 XT
AMD Radeon RX 6900 XT, R9 5950X
206.5 (8.2min - 453.7max) fps
Average NVIDIA GeForce RTX 2080 Ti (Desktop)
  (202 - 213, n=3)
206 fps 0%
KFA2 GeForce RTX 2080 Ti EX
NVIDIA GeForce RTX 2080 Ti (Desktop), R9 3900X
204.4 fps -1%
AMD Radeon RX 6800 XT
AMD Radeon RX 6800 XT, R9 5950X
204 fps -1%
MSI GeForce RTX 3070 Gaming X Trio
NVIDIA GeForce RTX 3070, R9 5900X
196.1 fps -5%
Average NVIDIA GeForce RTX 3070
  (187.5 - 196.1, n=4)
192.5 fps -7%
Nvidia GeForce RTX 3090 Founders Edition
NVIDIA GeForce RTX 3090, R9 5900X
188.2 fps -9%
Nvidia GeForce RTX 2080 Super
NVIDIA GeForce RTX 2080 Super (Desktop), R7 2700X
167.5 fps -19%
Average NVIDIA GeForce RTX 2080 Super (Desktop)
 
167.5 fps -19%
Average NVIDIA GeForce RTX 2070 Super (Desktop)
  (153.5 - 157.1, n=4)
155.4 fps -25%
Nvidia GeForce RTX 2070 Super
NVIDIA GeForce RTX 2070 Super (Desktop), R7 2700X
153.5 fps -26%
Average AMD Radeon RX 5700 XT (Desktop)
  (97.8 - 161.9, n=6)
124.7 fps -40%
AMD Radeon RX 5700 XT
AMD Radeon RX 5700 XT (Desktop), R7 2700X
110.2 fps -47%
AMD Radeon RX 5700
AMD Radeon RX 5700 (Desktop), R7 2700X
100.7 fps -51%
Unigine Valley 1.0
1920x1080 Extreme HD DirectX AA:x8
Average NVIDIA GeForce RTX 3090
  (184.2 - 245, n=10)
223 fps +11%
AMD Radeon RX 6900 XT
AMD Radeon RX 6900 XT, R9 5950X
200.8 (53.4min - 359.1max) fps
Nvidia GeForce RTX 3090 Founders Edition
NVIDIA GeForce RTX 3090, R9 5900X
192.4 fps -4%
AMD Radeon RX 6800 XT
AMD Radeon RX 6800 XT, R9 5950X
190.6 fps -5%
AMD Ryzen 9 5900X
NVIDIA Titan RTX, R9 5900X
180.1 fps -10%
Average NVIDIA GeForce RTX 3080
  (176.2 - 181.8, n=2)
179 fps -11%
ASUS GeForce RTX 3080 ROG STRIX OC GAMING
NVIDIA GeForce RTX 3080, R9 5900X
176.2 fps -12%
Average NVIDIA Titan RTX
  (135 - 191.4, n=12)
173.3 fps -14%
Average NVIDIA GeForce RTX 2080 Ti (Desktop)
  (159.4 - 164.1, n=3)
162.2 fps -19%
Average NVIDIA GeForce RTX 3070
  (155.1 - 168.5, n=5)
161.2 fps -20%
KFA2 GeForce RTX 2080 Ti EX
NVIDIA GeForce RTX 2080 Ti (Desktop), R9 3900X
159.4 fps -21%
MSI GeForce RTX 3070 Gaming X Trio
NVIDIA GeForce RTX 3070, R9 5900X
155.1 fps -23%
Average NVIDIA GeForce RTX 2070 Super (Desktop)
  (113.7 - 127.4, n=4)
122.5 fps -39%
Nvidia GeForce RTX 2080 Super
NVIDIA GeForce RTX 2080 Super (Desktop), R7 2700X
120.2 fps -40%
Average NVIDIA GeForce RTX 2080 Super (Desktop)
 
120.2 fps -40%
Nvidia GeForce RTX 2070 Super
NVIDIA GeForce RTX 2070 Super (Desktop), R7 2700X
113.7 fps -43%
Average AMD Radeon RX 5700 XT (Desktop)
  (106.3 - 116, n=4)
111.5 fps -44%
AMD Radeon RX 5700 XT
AMD Radeon RX 5700 XT (Desktop), R7 2700X
106.3 fps -47%
AMD Radeon RX 5700
AMD Radeon RX 5700 (Desktop), R7 2700X
99.3 fps -51%
1920x1080 Extreme HD Preset OpenGL AA:x8
Average NVIDIA GeForce RTX 3090
  (158.8 - 211, n=9)
201 fps +20%
Average NVIDIA GeForce RTX 3080
  (163.8 - 172, n=2)
167.9 fps 0%
AMD Radeon RX 6900 XT
AMD Radeon RX 6900 XT, R9 5950X
167.4 (56.7min - 375.7max) fps
ASUS GeForce RTX 3080 ROG STRIX OC GAMING
NVIDIA GeForce RTX 3080, R9 5900X
163.8 fps -2%
Nvidia GeForce RTX 3090 Founders Edition
NVIDIA GeForce RTX 3090, R9 5900X
158.8 fps -5%
AMD Ryzen 9 5900X
NVIDIA Titan RTX, R9 5900X
158.5 fps -5%
AMD Radeon RX 6800 XT
AMD Radeon RX 6800 XT, R9 5950X
158.2 fps -5%
Average NVIDIA Titan RTX
  (139.2 - 181.2, n=12)
158.1 fps -6%
Average NVIDIA GeForce RTX 2080 Ti (Desktop)
  (144.5 - 147.8, n=3)
145.8 fps -13%
KFA2 GeForce RTX 2080 Ti EX
NVIDIA GeForce RTX 2080 Ti (Desktop), R9 3900X
145.1 fps -13%
MSI GeForce RTX 3070 Gaming X Trio
NVIDIA GeForce RTX 3070, R9 5900X
142.9 fps -15%
Average NVIDIA GeForce RTX 3070
  (140.2 - 144.9, n=4)
142.7 fps -15%
Nvidia GeForce RTX 2080 Super
NVIDIA GeForce RTX 2080 Super (Desktop), R7 2700X
114.5 fps -32%
Average NVIDIA GeForce RTX 2080 Super (Desktop)
 
114.5 fps -32%
Average NVIDIA GeForce RTX 2070 Super (Desktop)
  (105.6 - 112, n=4)
109.5 fps -35%
Nvidia GeForce RTX 2070 Super
NVIDIA GeForce RTX 2070 Super (Desktop), R7 2700X
105.6 fps -37%
Average AMD Radeon RX 5700 XT (Desktop)
  (88.5 - 108.5, n=5)
92.8 fps -45%
AMD Radeon RX 5700 XT
AMD Radeon RX 5700 XT (Desktop), R7 2700X
89.1 fps -47%
AMD Radeon RX 5700
AMD Radeon RX 5700 (Desktop), R7 2700X
82.7 fps -51%
Unigine Superposition
1280x720 720p Low
Average NVIDIA GeForce RTX 3090
  (33329 - 54879, n=9)
45093 Points +22%
AMD Ryzen 9 5900X
NVIDIA Titan RTX, R9 5900X
40994 Points +11%
Average NVIDIA Titan RTX
  (25622 - 50876, n=9)
40891 Points +10%
Average NVIDIA GeForce RTX 2070 Super (Desktop)
  (26742 - 45424, n=3)
38495 Points +4%
Average AMD Radeon RX 5700 XT (Desktop)
  (28674 - 42884, n=3)
37187 Points 0%
AMD Radeon RX 6900 XT
AMD Radeon RX 6900 XT, R9 5950X
37023 Points
AMD Radeon RX 6800 XT
AMD Radeon RX 6800 XT, R9 5950X
36452 Points -2%
Nvidia GeForce RTX 3090 Founders Edition
NVIDIA GeForce RTX 3090, R9 5900X
34649 Points -6%
Average NVIDIA GeForce RTX 3070
  (27330 - 40007, n=5)
34576 Points -7%
MSI GeForce RTX 3070 Gaming X Trio
NVIDIA GeForce RTX 3070, R9 5900X
31666 Points -14%
Average NVIDIA GeForce RTX 3080
  (30851 - 32183, n=2)
31517 Points -15%
ASUS GeForce RTX 3080 ROG STRIX OC GAMING
NVIDIA GeForce RTX 3080, R9 5900X
30851 Points -17%
Average NVIDIA GeForce RTX 2080 Super (Desktop)
 
26907 Points -27%
1920x1080 1080p High
Average NVIDIA GeForce RTX 3090
  (23626 - 27207, n=10)
25978 Points +4%
AMD Radeon RX 6900 XT
AMD Radeon RX 6900 XT, R9 5950X
25029 Points
Nvidia GeForce RTX 3090 Founders Edition
NVIDIA GeForce RTX 3090, R9 5900X
23853 Points -5%
AMD Radeon RX 6800 XT
AMD Radeon RX 6800 XT, R9 5950X
22265 Points -11%
Average NVIDIA GeForce RTX 3080
  (21333 - 21912, n=2)
21623 Points -14%
ASUS GeForce RTX 3080 ROG STRIX OC GAMING
NVIDIA GeForce RTX 3080, R9 5900X
21333 Points -15%
AMD Ryzen 9 5900X
NVIDIA Titan RTX, R9 5900X
20315 Points -19%
Average NVIDIA Titan RTX
  (19460 - 20658, n=9)
20301 Points -19%
MSI GeForce RTX 3070 Gaming X Trio
NVIDIA GeForce RTX 3070, R9 5900X
17346 Points -31%
Average NVIDIA GeForce RTX 3070
  (17054 - 17491, n=5)
17312 Points -31%
Average NVIDIA GeForce RTX 2080 Super (Desktop)
 
15558 Points -38%
Average NVIDIA GeForce RTX 2070 Super (Desktop)
  (13655 - 13832, n=3)
13765 Points -45%
Average AMD Radeon RX 5700 XT (Desktop)
  (11874 - 11902, n=3)
11886 Points -53%
1920x1080 1080p Extreme
Average NVIDIA GeForce RTX 3090
  (11806 - 12694, n=10)
12227 Points +14%
Nvidia GeForce RTX 3090 Founders Edition
NVIDIA GeForce RTX 3090, R9 5900X
11806 Points +11%
Average NVIDIA GeForce RTX 3080
  (10572 - 10822, n=2)
10697 Points 0%
AMD Radeon RX 6900 XT
AMD Radeon RX 6900 XT, R9 5950X
10683 Points
ASUS GeForce RTX 3080 ROG STRIX OC GAMING
NVIDIA GeForce RTX 3080, R9 5900X
10572 Points -1%
AMD Radeon RX 6800 XT
AMD Radeon RX 6800 XT, R9 5950X
10046 Points -6%
AMD Ryzen 9 5900X
NVIDIA Titan RTX, R9 5900X
9056 Points -15%
Average NVIDIA Titan RTX
  (8916 - 9285, n=9)
9051 Points -15%
MSI GeForce RTX 3070 Gaming X Trio
NVIDIA GeForce RTX 3070, R9 5900X
8507 Points -20%
Average NVIDIA GeForce RTX 3070
  (8276 - 8507, n=5)
8354 Points -22%
Average NVIDIA GeForce RTX 2080 Super (Desktop)
 
7080 Points -34%
Average NVIDIA GeForce RTX 2070 Super (Desktop)
  (6161 - 6178, n=3)
6169 Points -42%
Average AMD Radeon RX 5700 XT (Desktop)
  (4901 - 4967, n=3)
4927 Points -54%
3840x2160 4k Optimized
Average NVIDIA GeForce RTX 3090
  (15794 - 16868, n=10)
16352 Points +9%
Nvidia GeForce RTX 3090 Founders Edition
NVIDIA GeForce RTX 3090, R9 5900X
15794 Points +6%
AMD Radeon RX 6900 XT
AMD Radeon RX 6900 XT, R9 5950X
14955 Points
Average NVIDIA GeForce RTX 3080
  (13984 - 14243, n=2)
14114 Points -6%
ASUS GeForce RTX 3080 ROG STRIX OC GAMING
NVIDIA GeForce RTX 3080, R9 5900X
13984 Points -6%
AMD Radeon RX 6800 XT
AMD Radeon RX 6800 XT, R9 5950X
13471 Points -10%
Average NVIDIA Titan RTX
  (11937 - 12644, n=9)
12203 Points -18%
AMD Ryzen 9 5900X
NVIDIA Titan RTX, R9 5900X
12186 Points -19%
MSI GeForce RTX 3070 Gaming X Trio
NVIDIA GeForce RTX 3070, R9 5900X
10755 Points -28%
Average NVIDIA GeForce RTX 3070
  (10544 - 10755, n=5)
10667 Points -29%
Average NVIDIA GeForce RTX 2080 Super (Desktop)
 
9338 Points -38%
Average NVIDIA GeForce RTX 2070 Super (Desktop)
  (8096 - 8111, n=3)
8101 Points -46%
Average AMD Radeon RX 5700 XT (Desktop)
  (6885 - 7034, n=3)
6973 Points -53%
7680x4320 8k Optimized
Average NVIDIA GeForce RTX 3090
  (6969 - 7521, n=10)
7160 Points +24%
Nvidia GeForce RTX 3090 Founders Edition
NVIDIA GeForce RTX 3090, R9 5900X
7002 Points +21%
Average NVIDIA GeForce RTX 3080
  (6243 - 6346, n=2)
6295 Points +9%
ASUS GeForce RTX 3080 ROG STRIX OC GAMING
NVIDIA GeForce RTX 3080, R9 5900X
6243 Points +8%
AMD Radeon RX 6900 XT
AMD Radeon RX 6900 XT, R9 5950X
5764 Points
AMD Ryzen 9 5900X
NVIDIA Titan RTX, R9 5900X
5402 Points -6%
Average NVIDIA Titan RTX
  (5255 - 5571, n=9)
5393 Points -6%
AMD Radeon RX 6800 XT
AMD Radeon RX 6800 XT, R9 5950X
5256 Points -9%
MSI GeForce RTX 3070 Gaming X Trio
NVIDIA GeForce RTX 3070, R9 5900X
4695 Points -19%
Average NVIDIA GeForce RTX 3070
  (4587 - 4695, n=5)
4624 Points -20%
Average NVIDIA GeForce RTX 2080 Super (Desktop)
 
3989 Points -31%
Average NVIDIA GeForce RTX 2070 Super (Desktop)
  (3419 - 3435, n=3)
3429 Points -41%
Average AMD Radeon RX 5700 XT (Desktop)
  (2867 - 2887, n=3)
2877 Points -50%
3DMark 11 Performance
42418 pontos
3DMark Fire Strike Score
39057 pontos
3DMark Fire Strike Extreme Score
25197 pontos
3DMark Time Spy Score
17549 pontos
Ajuda

Cálculos de referência

O RX 6900 XT coloca um espetáculo decente contra o RTX 3090 em comparação com os benchmarks computacionais. Na ComputeMark, vemos o topo da oferta da AMD ficar entre 3% e 26% atrás do RTX 3090, dependendo do teste. Curiosamente, a LuxMark parece mostrar todo o poder do RDNA 2 em termos de computação, com o RX 6900 XT mostrando uma liderança de 114% sobre o RTX 3090 no teste somente da Sala GPU, embora a placa tenha um acerto de cerca de 12% no benchmark somente da Sala GPU.

O desempenho no Geekbench 5.3, utilizando OpenCL e Vulkan, não parece ser impressionante, mesmo com o RTX 3080 oferecendo um desempenho marginalmente melhor que o RX 6900 XT em OpenCL. Embora a sorte se inverta na parte Vulkan do teste quando comparado com o RTX 3080, a Edição dos Fundadores do RTX 3090 ainda consegue uma confortável vantagem de 67% sobre o RX 6900 XT

ComputeMark v2.1
1024x600 Normal, QJuliaRayTrace
Average NVIDIA GeForce RTX 3090
  (16403 - 18223, n=9)
17439 Points +42%
Nvidia GeForce RTX 3090 Founders Edition
NVIDIA GeForce RTX 3090, R9 5900X
16543 Points +35%
Average NVIDIA GeForce RTX 3080
  (14718 - 15508, n=2)
15113 Points +23%
ASUS GeForce RTX 3080 ROG STRIX OC GAMING
NVIDIA GeForce RTX 3080, R9 5900X
14718 Points +20%
AMD Radeon RX 6900 XT
AMD Radeon RX 6900 XT, R9 5950X
12255 Points
MSI GeForce RTX 3070 Gaming X Trio
NVIDIA GeForce RTX 3070, R9 5900X
11816 Points -4%
Average NVIDIA GeForce RTX 3070
  (11510 - 11816, n=3)
11665 Points -5%
AMD Radeon RX 6800 XT
AMD Radeon RX 6800 XT, R9 5950X
11304 Points -8%
Average NVIDIA Titan RTX
  (9418 - 10129, n=3)
9748 Points -20%
Average NVIDIA GeForce RTX 2080 Ti (Desktop)
  (9104 - 9690, n=3)
9492 Points -23%
KFA2 GeForce RTX 2080 Ti EX
NVIDIA GeForce RTX 2080 Ti (Desktop), R9 3900X
9104 Points -26%
Nvidia GeForce RTX 2080 Super
NVIDIA GeForce RTX 2080 Super (Desktop), R7 2700X
7258 Points -41%
Average NVIDIA GeForce RTX 2080 Super (Desktop)
 
7258 Points -41%
Average NVIDIA GeForce RTX 2070 Super (Desktop)
  (6155 - 6158, n=2)
6157 Points -50%
Nvidia GeForce RTX 2070 Super
NVIDIA GeForce RTX 2070 Super (Desktop), R7 2700X
6155 Points -50%
AMD Radeon RX 5700 XT
AMD Radeon RX 5700 XT (Desktop), R7 2700X
5761 Points -53%
Average AMD Radeon RX 5700 XT (Desktop)
  (5677 - 5761, n=2)
5719 Points -53%
AMD Radeon RX 5700
AMD Radeon RX 5700 (Desktop), R7 2700X
4703 Points -62%
1024x600 Normal, Mandel Scalar
Average NVIDIA GeForce RTX 3090
  (10650 - 11564, n=9)
11171 Points +3%
AMD Radeon RX 6900 XT
AMD Radeon RX 6900 XT, R9 5950X
10834 Points
Nvidia GeForce RTX 3090 Founders Edition
NVIDIA GeForce RTX 3090, R9 5900X
10650 Points -2%
AMD Radeon RX 6800 XT
AMD Radeon RX 6800 XT, R9 5950X
10018 Points -8%
Average NVIDIA GeForce RTX 3080
  (9554 - 9938, n=2)
9746 Points -10%
ASUS GeForce RTX 3080 ROG STRIX OC GAMING
NVIDIA GeForce RTX 3080, R9 5900X
9554 Points -12%
MSI GeForce RTX 3070 Gaming X Trio
NVIDIA GeForce RTX 3070, R9 5900X
7314 Points -32%
Average NVIDIA GeForce RTX 3070
  (7042 - 7314, n=3)
7169 Points -34%
Average NVIDIA Titan RTX
  (5977 - 6406, n=3)
6184 Points -43%
Average NVIDIA GeForce RTX 2080 Ti (Desktop)
  (5679 - 6226, n=3)
6010 Points -45%
KFA2 GeForce RTX 2080 Ti EX
NVIDIA GeForce RTX 2080 Ti (Desktop), R9 3900X
5679 Points -48%
AMD Radeon RX 5700 XT
AMD Radeon RX 5700 XT (Desktop), R7 2700X
4869 Points -55%
Average AMD Radeon RX 5700 XT (Desktop)
  (4846 - 4869, n=2)
4858 Points -55%
Nvidia GeForce RTX 2080 Super
NVIDIA GeForce RTX 2080 Super (Desktop), R7 2700X
4525 Points -58%
Average NVIDIA GeForce RTX 2080 Super (Desktop)
 
4525 Points -58%
AMD Radeon RX 5700
AMD Radeon RX 5700 (Desktop), R7 2700X
4043 Points -63%
Nvidia GeForce RTX 2070 Super
NVIDIA GeForce RTX 2070 Super (Desktop), R7 2700X
3782 Points -65%
Average NVIDIA GeForce RTX 2070 Super (Desktop)
  (3748 - 3782, n=2)
3765 Points -65%
1024x600 Normal, Mandel Vector
Average NVIDIA GeForce RTX 3090
  (8038 - 10097, n=9)
9437 Points +9%
Nvidia GeForce RTX 3090 Founders Edition
NVIDIA GeForce RTX 3090, R9 5900X
9236 Points +6%
AMD Radeon RX 6900 XT
AMD Radeon RX 6900 XT, R9 5950X
8690 Points
AMD Radeon RX 6800 XT
AMD Radeon RX 6800 XT, R9 5950X
8399 Points -3%
Average NVIDIA GeForce RTX 3080
  (7148 - 7540, n=2)
7344 Points -15%
ASUS GeForce RTX 3080 ROG STRIX OC GAMING
NVIDIA GeForce RTX 3080, R9 5900X
7148 Points -18%
Average NVIDIA GeForce RTX 3070
  (5364 - 6266, n=3)
5707 Points -34%
MSI GeForce RTX 3070 Gaming X Trio
NVIDIA GeForce RTX 3070, R9 5900X
5490 Points -37%
Average NVIDIA Titan RTX
  (4944 - 5440, n=3)
5158 Points -41%
Average NVIDIA GeForce RTX 2080 Ti (Desktop)
  (4695 - 5092, n=3)
4941 Points -43%
KFA2 GeForce RTX 2080 Ti EX
NVIDIA GeForce RTX 2080 Ti (Desktop), R9 3900X
4695 Points -46%
Average AMD Radeon RX 5700 XT (Desktop)
  (4246 - 4371, n=2)
4309 Points -50%
AMD Radeon RX 5700 XT
AMD Radeon RX 5700 XT (Desktop), R7 2700X
4246 Points -51%
Nvidia GeForce RTX 2080 Super
NVIDIA GeForce RTX 2080 Super (Desktop), R7 2700X
3835 Points -56%
Average NVIDIA GeForce RTX 2080 Super (Desktop)
 
3835 Points -56%
AMD Radeon RX 5700
AMD Radeon RX 5700 (Desktop), R7 2700X
3532 Points -59%
Nvidia GeForce RTX 2070 Super
NVIDIA GeForce RTX 2070 Super (Desktop), R7 2700X
3358 Points -61%
Average NVIDIA GeForce RTX 2070 Super (Desktop)
  (3348 - 3358, n=2)
3353 Points -61%
1024x600 Normal, Fluid 2DTexArr
Average NVIDIA GeForce RTX 3090
  (4344 - 4608, n=9)
4497 Points +15%
Nvidia GeForce RTX 3090 Founders Edition
NVIDIA GeForce RTX 3090, R9 5900X
4344 Points +11%
Average NVIDIA GeForce RTX 3080
  (4087 - 4159, n=2)
4123 Points +5%
ASUS GeForce RTX 3080 ROG STRIX OC GAMING
NVIDIA GeForce RTX 3080, R9 5900X
4087 Points +4%
AMD Radeon RX 6800 XT
AMD Radeon RX 6800 XT, R9 5950X
3947 Points +1%
AMD Radeon RX 6900 XT
AMD Radeon RX 6900 XT, R9 5950X
3924 Points
Average NVIDIA Titan RTX
  (3691 - 3828, n=3)
3757 Points -4%
Average NVIDIA GeForce RTX 2080 Ti (Desktop)
  (3444 - 3539, n=3)
3499 Points -11%
KFA2 GeForce RTX 2080 Ti EX
NVIDIA GeForce RTX 2080 Ti (Desktop), R9 3900X
3444 Points -12%
MSI GeForce RTX 3070 Gaming X Trio
NVIDIA GeForce RTX 3070, R9 5900X
2704 Points -31%
Average NVIDIA GeForce RTX 3070
  (2666 - 2706, n=3)
2692 Points -31%
Nvidia GeForce RTX 2080 Super
NVIDIA GeForce RTX 2080 Super (Desktop), R7 2700X
2655 Points -32%
Average NVIDIA GeForce RTX 2080 Super (Desktop)
 
2655 Points -32%
Average NVIDIA GeForce RTX 2070 Super (Desktop)
  (2331 - 2354, n=2)
2343 Points -40%
Nvidia GeForce RTX 2070 Super
NVIDIA GeForce RTX 2070 Super (Desktop), R7 2700X
2331 Points -41%
Average AMD Radeon RX 5700 XT (Desktop)
  (1960 - 2005, n=2)
1983 Points -49%
AMD Radeon RX 5700 XT
AMD Radeon RX 5700 XT (Desktop), R7 2700X
1960 Points -50%
AMD Radeon RX 5700
AMD Radeon RX 5700 (Desktop), R7 2700X
1810 Points -54%
1024x600 Normal, Fluid 3DTex
Average NVIDIA GeForce RTX 3090
  (5246 - 5520, n=9)
5444 Points +6%
Nvidia GeForce RTX 3090 Founders Edition
NVIDIA GeForce RTX 3090, R9 5900X
5246 Points +2%
AMD Radeon RX 6800 XT
AMD Radeon RX 6800 XT, R9 5950X
5154 Points 0%
AMD Radeon RX 6900 XT
AMD Radeon RX 6900 XT, R9 5950X
5154 Points
Average NVIDIA GeForce RTX 3080
  (4417 - 4450, n=2)
4434 Points -14%
ASUS GeForce RTX 3080 ROG STRIX OC GAMING
NVIDIA GeForce RTX 3080, R9 5900X
4417 Points -14%
Average NVIDIA Titan RTX
  (3877 - 4027, n=3)
3955 Points -23%
Average NVIDIA GeForce RTX 2080 Ti (Desktop)
  (3589 - 3653, n=3)
3625 Points -30%
KFA2 GeForce RTX 2080 Ti EX
NVIDIA GeForce RTX 2080 Ti (Desktop), R9 3900X
3589 Points -30%
MSI GeForce RTX 3070 Gaming X Trio
NVIDIA GeForce RTX 3070, R9 5900X
2776 Points -46%
Average NVIDIA GeForce RTX 3070
  (2749 - 2791, n=3)
2772 Points -46%
Nvidia GeForce RTX 2080 Super
NVIDIA GeForce RTX 2080 Super (Desktop), R7 2700X
2736 Points -47%
Average NVIDIA GeForce RTX 2080 Super (Desktop)
 
2736 Points -47%
Average NVIDIA GeForce RTX 2070 Super (Desktop)
  (2456 - 2486, n=2)
2471 Points -52%
Nvidia GeForce RTX 2070 Super
NVIDIA GeForce RTX 2070 Super (Desktop), R7 2700X
2456 Points -52%
Average AMD Radeon RX 5700 XT (Desktop)
  (2349 - 2376, n=2)
2363 Points -54%
AMD Radeon RX 5700 XT
AMD Radeon RX 5700 XT (Desktop), R7 2700X
2349 Points -54%
AMD Radeon RX 5700
AMD Radeon RX 5700 (Desktop), R7 2700X
2294 Points -55%
1024x600 Normal, Score
Average NVIDIA GeForce RTX 3090
  (44948 - 49118, n=8)
47736 Points +17%
Nvidia GeForce RTX 3090 Founders Edition
NVIDIA GeForce RTX 3090, R9 5900X
46018 Points +13%
AMD Radeon RX 6900 XT
AMD Radeon RX 6900 XT, R9 5950X
40857 Points
Average NVIDIA GeForce RTX 3080
  (39924 - 41594, n=2)
40759 Points 0%
ASUS GeForce RTX 3080 ROG STRIX OC GAMING
NVIDIA GeForce RTX 3080, R9 5900X
39924 Points -2%
AMD Radeon RX 6800 XT
AMD Radeon RX 6800 XT, R9 5950X
38823 Points -5%
MSI GeForce RTX 3070 Gaming X Trio
NVIDIA GeForce RTX 3070, R9 5900X
30100 Points -26%
Average NVIDIA GeForce RTX 3070
  (29330 - 30581, n=3)
30004 Points -27%
Average NVIDIA Titan RTX
  (27907 - 29830, n=3)
28802 Points -30%
Average NVIDIA GeForce RTX 2080 Ti (Desktop)
  (26510 - 28145, n=3)
27567 Points -33%
KFA2 GeForce RTX 2080 Ti EX
NVIDIA GeForce RTX 2080 Ti (Desktop), R9 3900X
26510 Points -35%
Nvidia GeForce RTX 2080 Super
NVIDIA GeForce RTX 2080 Super (Desktop), R7 2700X
21009 Points -49%
Average NVIDIA GeForce RTX 2080 Super (Desktop)
 
21009 Points -49%
Average AMD Radeon RX 5700 XT (Desktop)
  (19184 - 19274, n=2)
19229 Points -53%
AMD Radeon RX 5700 XT
AMD Radeon RX 5700 XT (Desktop), R7 2700X
19184 Points -53%
Average NVIDIA GeForce RTX 2070 Super (Desktop)
  (18083 - 18095, n=2)
18089 Points -56%
Nvidia GeForce RTX 2070 Super
NVIDIA GeForce RTX 2070 Super (Desktop), R7 2700X
18083 Points -56%
AMD Radeon RX 5700
AMD Radeon RX 5700 (Desktop), R7 2700X
16383 Points -60%
LuxMark v2.0 64Bit
Room GPUs-only
Average NVIDIA GeForce RTX 3090
  (5727 - 5974, n=8)
5881 Samples/s +16%
Nvidia GeForce RTX 3090 Founders Edition
NVIDIA GeForce RTX 3090, R9 5900X
5808 Samples/s +14%
Average NVIDIA GeForce RTX 3080
  (5112 - 5198, n=2)
5155 Samples/s +1%
ASUS GeForce RTX 3080 ROG STRIX OC GAMING
NVIDIA GeForce RTX 3080, R9 5900X
5112 Samples/s +1%
AMD Radeon RX 6900 XT
AMD Radeon RX 6900 XT, R9 5950X
5084 Samples/s
AMD Radeon RX 6800 XT
AMD Radeon RX 6800 XT, R9 5950X
5057 Samples/s -1%
Average NVIDIA Titan RTX
  (4643 - 4703, n=2)
4673 Samples/s -8%
Average NVIDIA GeForce RTX 2080 Ti (Desktop)
  (4425 - 4494, n=3)
4449 Samples/s -12%
KFA2 GeForce RTX 2080 Ti EX
NVIDIA GeForce RTX 2080 Ti (Desktop), R9 3900X
4429 Samples/s -13%
MSI GeForce RTX 3070 Gaming X Trio
NVIDIA GeForce RTX 3070, R9 5900X
4293 Samples/s -16%
Average NVIDIA GeForce RTX 3070
  (2187 - 4293, n=3)
3588 Samples/s -29%
Nvidia GeForce RTX 2080 Super
NVIDIA GeForce RTX 2080 Super (Desktop), R7 2700X
3430 Samples/s -33%
Average NVIDIA GeForce RTX 2080 Super (Desktop)
 
3430 Samples/s -33%
Nvidia GeForce RTX 2070 Super
NVIDIA GeForce RTX 2070 Super (Desktop), R7 2700X
3404 Samples/s -33%
Average NVIDIA GeForce RTX 2070 Super (Desktop)
 
3404 Samples/s -33%
AMD Radeon RX 5700 XT
AMD Radeon RX 5700 XT (Desktop), R7 2700X
2104 Samples/s -59%
Average AMD Radeon RX 5700 XT (Desktop)
  (1915 - 2104, n=2)
2010 Samples/s -60%
AMD Radeon RX 5700
AMD Radeon RX 5700 (Desktop), R7 2700X
1856 Samples/s -63%
Sala GPUs-only
AMD Radeon RX 6900 XT
AMD Radeon RX 6900 XT, R9 5950X
31400 Samples/s
AMD Radeon RX 6800 XT
AMD Radeon RX 6800 XT, R9 5950X
28023 Samples/s -11%
Average NVIDIA GeForce RTX 3090
  (14590 - 15088, n=8)
14908 Samples/s -53%
Nvidia GeForce RTX 3090 Founders Edition
NVIDIA GeForce RTX 3090, R9 5900X
14670 Samples/s -53%
Average NVIDIA GeForce RTX 3080
  (12797 - 12980, n=2)
12889 Samples/s -59%
ASUS GeForce RTX 3080 ROG STRIX OC GAMING
NVIDIA GeForce RTX 3080, R9 5900X
12797 Samples/s -59%
Average NVIDIA Titan RTX
  (10799 - 10996, n=2)
10898 Samples/s -65%
Average NVIDIA GeForce RTX 2080 Ti (Desktop)
  (9999 - 10291, n=3)
10156 Samples/s -68%
MSI GeForce RTX 3070 Gaming X Trio
NVIDIA GeForce RTX 3070, R9 5900X
10115 Samples/s -68%
Average NVIDIA GeForce RTX 3070
  (10096 - 10115, n=3)
10107 Samples/s -68%
KFA2 GeForce RTX 2080 Ti EX
NVIDIA GeForce RTX 2080 Ti (Desktop), R9 3900X
9999 Samples/s -68%
Nvidia GeForce RTX 2080 Super
NVIDIA GeForce RTX 2080 Super (Desktop), R7 2700X
7878 Samples/s -75%
Average NVIDIA GeForce RTX 2080 Super (Desktop)
 
7878 Samples/s -75%
Nvidia GeForce RTX 2070 Super
NVIDIA GeForce RTX 2070 Super (Desktop), R7 2700X
7594 Samples/s -76%
Average NVIDIA GeForce RTX 2070 Super (Desktop)
 
7594 Samples/s -76%
AMD Radeon RX 5700 XT
AMD Radeon RX 5700 XT (Desktop), R7 2700X
6188 Samples/s -80%
Average AMD Radeon RX 5700 XT (Desktop)
  (4650 - 6188, n=2)
5419 Samples/s -83%
AMD Radeon RX 5700
AMD Radeon RX 5700 (Desktop), R7 2700X
5312 Samples/s -83%
Geekbench 5.5
OpenCL Score
Average NVIDIA GeForce RTX 3090
  (199930 - 224611, n=19)
214008 Points +24%
Nvidia GeForce RTX 3090 Founders Edition
NVIDIA GeForce RTX 3090, R9 5900X
199930 Points +16%
ASUS GeForce RTX 3080 ROG STRIX OC GAMING
NVIDIA GeForce RTX 3080, R9 5900X
192091 Points +11%
Average NVIDIA GeForce RTX 3080
  (164477 - 192091, n=2)
178284 Points +3%
AMD Radeon RX 6900 XT
AMD Radeon RX 6900 XT, R9 5950X
172661 Points
AMD Radeon RX 6800 XT
AMD Radeon RX 6800 XT, R9 5950X
159072 Points -8%
AMD Ryzen 9 5900X
NVIDIA Titan RTX, R9 5900X
149070 Points -14%
Average NVIDIA Titan RTX
  (132850 - 153940, n=20)
140450 Points -19%
Average NVIDIA GeForce RTX 3070
  (134961 - 138625, n=4)
136574 Points -21%
MSI GeForce RTX 3070 Gaming X Trio
NVIDIA GeForce RTX 3070, R9 5900X
136521 Points -21%
Average NVIDIA GeForce RTX 2080 Super (Desktop)
  (118695 - 127035, n=3)
122884 Points -29%
Average NVIDIA GeForce RTX 2070 Super (Desktop)
  (102914 - 132850, n=2)
117882 Points -32%
Average AMD Radeon RX 5700 XT (Desktop)
  (56327 - 84682, n=2)
70505 Points -59%
Vulkan Score
Nvidia GeForce RTX 3090 Founders Edition
NVIDIA GeForce RTX 3090, R9 5900X
147831 Points +67%
Average NVIDIA GeForce RTX 3090
  (62516 - 168974, n=19)
128422 Points +45%
Average NVIDIA Titan RTX
  (70085 - 138172, n=20)
92754 Points +5%
AMD Radeon RX 6900 XT
AMD Radeon RX 6900 XT, R9 5950X
88587 Points
AMD Radeon RX 6800 XT
AMD Radeon RX 6800 XT, R9 5950X
81098 Points -8%
Average NVIDIA GeForce RTX 3080
  (76596 - 83486, n=2)
80041 Points -10%
Average NVIDIA GeForce RTX 2080 Super (Desktop)
  (62324 - 91321, n=3)
78667 Points -11%
Average NVIDIA GeForce RTX 2070 Super (Desktop)
  (76596 - 80530, n=2)
78563 Points -11%
AMD Ryzen 9 5900X
NVIDIA Titan RTX, R9 5900X
76596 Points -14%
ASUS GeForce RTX 3080 ROG STRIX OC GAMING
NVIDIA GeForce RTX 3080, R9 5900X
76596 Points -14%
Average NVIDIA GeForce RTX 3070
  (27460 - 107958, n=4)
71908 Points -19%
MSI GeForce RTX 3070 Gaming X Trio
NVIDIA GeForce RTX 3070, R9 5900X
62516 Points -29%
Average AMD Radeon RX 5700 XT (Desktop)
  (14776 - 57117, n=2)
35947 Points -59%

Aplicações profissionais

Navi 2x parece mostrar bons ganhos de desempenho em aplicações profissionais sobre as peças Navi 1x, e até mesmo o melhor da Ampere ofertas ao consumidor da NVIDIA. Embora a Titan RTX e Quadro RTX 5000 são melhores escolhas em geral quando se trata de CAD/CAM, energia, automóveis e aplicações médicas, os resultados individuais dos componentes nos testes SPECviewperf mostram que o RX 6900 XT não é um descuido, pelo menos quando se trata de autoria 3D específica e fluxos de trabalho CAD

AMD Radeon RX 6900 XT
AMD Radeon RX 6900 XT, R9 5950X
AMD Radeon RX 6800 XT
AMD Radeon RX 6800 XT, R9 5950X
AMD Radeon RX 5700 XT
AMD Radeon RX 5700 XT (Desktop), R7 2700X
Nvidia GeForce RTX 3090 Founders Edition
NVIDIA GeForce RTX 3090, R9 5900X
ASUS GeForce RTX 3080 ROG STRIX OC GAMING
NVIDIA GeForce RTX 3080, R9 5900X
AMD Ryzen 9 5900X
NVIDIA Titan RTX, R9 5900X
Acer ConceptD 9 Pro
NVIDIA Quadro RTX 5000 (Laptop), i9-9980HK
SPECviewperf 12
-15%
-45%
-31%
-35%
55%
49%
1900x1060 Solidworks (sw-03)
167
150
-10%
89.6
-46%
71.4
-57%
71.1
-57%
174.9
5%
230.1
38%
1900x1060 Siemens NX (snx-02)
47.7
45.07
-6%
35.27
-26%
14.8
-69%
13.27
-72%
273.2
473%
258.1
441%
1900x1060 Showcase (showcase-01)
241
223
-7%
137.8
-43%
239
-1%
199.9
-17%
191.1
-21%
126.4
-48%
1900x1060 Medical (medical-01)
88.4
77.3
-13%
46.9
-47%
47.2
-47%
50.8
-43%
90.7
3%
109.3
24%
1900x1060 Maya (maya-04)
151
118
-22%
86.5
-43%
190
26%
184.6
22%
188.3
25%
179
19%
1900x1060 Energy (energy-01)
30.8
28.39
-8%
12.72
-59%
20.6
-33%
18.47
-40%
28.31
-8%
26
-16%
1900x1060 Creo (creo-01)
127
119
-6%
66.9
-47%
74.8
-41%
74.2
-42%
173
36%
172.1
36%
1900x1060 Catia (catia-04)
292
238
-18%
158.8
-46%
127
-57%
126.1
-57%
262.7
-10%
220
-25%
1900x1060 3ds Max (3dsmax-05)
318
167
-47%
173.8
-45%
320
1%
275.6
-13%
292.6
-8%
235.8
-26%
SPECviewperf 13
-8%
-45%
-57%
-38%
44%
35%
Solidworks (sw-04)
214
193
-10%
114.4
-47%
82.9
-61%
92.4
-57%
196.4
-8%
203.8
-5%
Siemens NX (snx-03)
85.8
81.4
-5%
61.3
-29%
15.6
-82%
23.22
-73%
493.4
475%
465.3
442%
Showcase (showcase-02)
241
232
-4%
137.6
-43%
114
-53%
190.5
-21%
127.1
-47%
Medical (medical-02)
148
130
-12%
82.8
-44%
49.3
-67%
91.8
-38%
90.8
-39%
133.4
-10%
Maya (maya-05)
395
348
-12%
220.3
-44%
253
-36%
360.2
-9%
458
16%
340.8
-14%
Energy (energy-02)
60.6
58.4
-4%
26.82
-56%
26.6
-56%
36.08
-40%
52
-14%
57.3
-5%
Creo (creo-02)
292
276
-5%
157
-46%
176
-40%
281.2
-4%
346.5
19%
319.8
10%
Catia (catia-05)
468
412
-12%
242.8
-48%
111
-76%
190.4
-59%
374.8
-20%
338.9
-28%
3ds Max (3dsmax-06)
317
284
-10%
175.6
-45%
180
-43%
238.2
-25%
291.3
-8%
232.2
-27%
SPECviewperf 2020
5%
-37%
64%
3840x2160 Solidworks (solidworks-05)
112
108
-4%
93.1
-17%
153
37%
3840x2160 Siemens NX (snx-04)
85
81.7
-4%
13.2
-84%
347
308%
3840x2160 Medical (medical-03)
30.4
27.84
-8%
9.95
-67%
16.42
-46%
3840x2160 Maya (maya-06)
266
224
-16%
181
-32%
257
-3%
3840x2160 Energy (energy-03)
32.6
60.8
87%
22.3
-32%
58.2
79%
3840x2160 Creo (creo-03)
65.4
65
-1%
68.1
4%
113
73%
3840x2160 CATIA (catia-06)
44.6
42.4
-5%
32.3
-28%
78.2
75%
3840x2160 3ds Max (3dsmax-07)
121
114
-6%
70.2
-42%
108
-11%
Total Average (Program / Settings)
-6% / -6%
-45% / -45%
-42% / -42%
-37% / -37%
54% / 54%
42% / 42%

Benchmarks de jogo

Na grande maioria dos jogos testados, o RX 6900 XT funciona em linhas esperadas a 4K Ultra. O RX 6900 XT parece ter uma vantagem sobre as placas NVIDIA em títulos otimizados para hardware AMD, como Assassin's Creed Odyssey e Assassin's Creed Valhalla. A placa principal da AMD liderou as cartas em Battlefield V, Hitman 3, F1 2020e Forza Horizon 4 também

Dito isto, o RTX 3090 mostrou entre 9% a 20% de vantagem na maioria dos títulos que testamos, chegando às vezes a 30% a 4K Ultra em Edição Definitiva da Máfia. A presença de oito unidades de computação (CUs) adicionais no RX 6900 XT não parece conferir uma vantagem significativa sobre o RX 6800 XT em jogos

O rastreamento de raios, apesar de disponível, é muito semelhante em comparação com a geração atual de cartões Ampere. No entanto, a AMD ainda precisa ser elogiada por alcançar um desempenho de traçado de raio que, na maioria das vezes, está no mesmo nível ou, às vezes, um pouco melhor do que o RTX 2080 Ti.

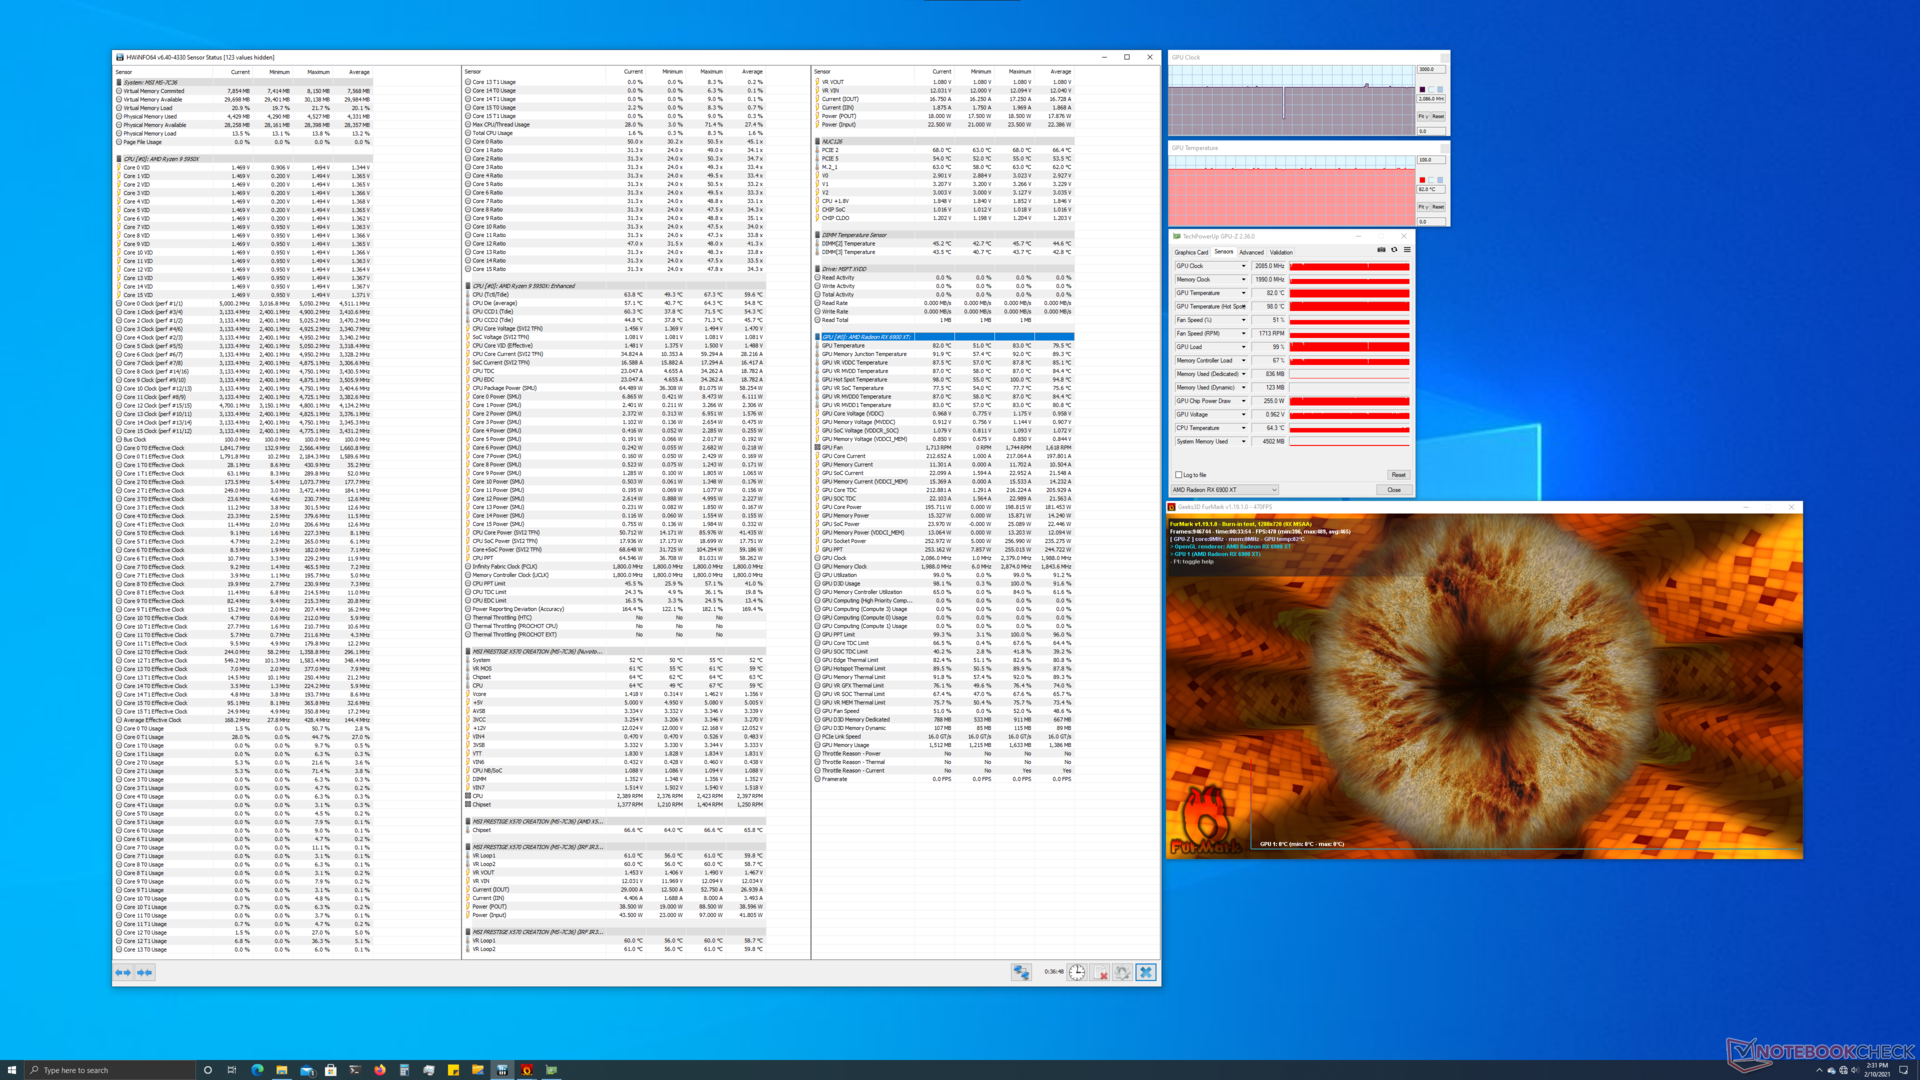
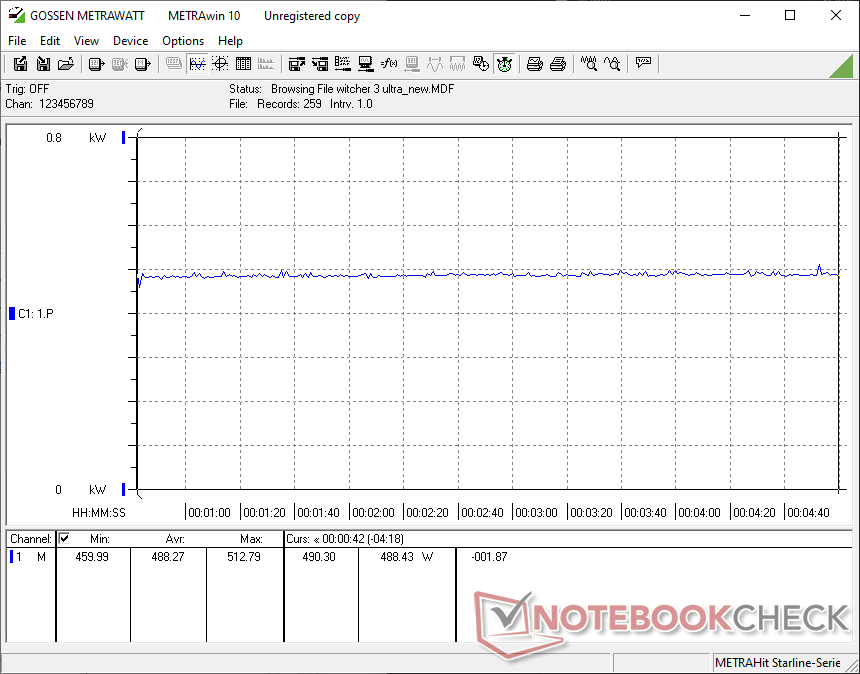
Em O Witcher 3 teste de estresse a 1080p Ultra, o RX 6900 XT oferece um desempenho bastante bom sustentado, próximo a 172 fps na maior parte do tempo. No entanto, vemos o estrangulamento ocasional, o que faz com que os fps caiam significativamente. Isto provavelmente pode ser atribuído a um mergulho nos relógios quando o cartão se aproxima do ponto quente ou temperatura de junção de 110 °C

0102030405060708090100110120130140150160170Tooltip
AMD Radeon RX 6900 XT Radeon RX 6900 XT, R9 5950X: Ø171.1 (125-176)
The Witcher 3
3840x2160 High Graphics & Postprocessing (Nvidia HairWorks Off)
Average NVIDIA GeForce RTX 3090
  (128 - 160.2, n=12)
151.5 fps +24%
Nvidia GeForce RTX 3090 Founders Edition
NVIDIA GeForce RTX 3090, R9 5900X
148 fps +21%
AMD Radeon RX 6900 XT
AMD Radeon RX 6900 XT, R9 5950X
122 (105min, 105P1 - 134max) fps
ASUS GeForce RTX 3080 ROG STRIX OC GAMING
NVIDIA GeForce RTX 3080, R9 5900X
115 (107min - 124max) fps -6%
Average NVIDIA GeForce RTX 3080
  (114 - 115, n=2)
114.5 fps -6%
AMD Radeon RX 6800 XT
AMD Radeon RX 6800 XT, R9 5950X
110 (97min - 117max) fps -10%
AMD Ryzen 9 5900X
NVIDIA Titan RTX, R9 5900X
104 (97min - 112max) fps -15%
Average NVIDIA Titan RTX
  (94 - 107.1, n=28)
102.4 fps -16%
Average NVIDIA GeForce RTX 2080 Ti (Desktop)
  (96 - 101, n=3)
98.3 fps -19%
KFA2 GeForce RTX 2080 Ti EX
NVIDIA GeForce RTX 2080 Ti (Desktop), R9 3900X
96 (87min - 109max) fps -21%
Average NVIDIA GeForce RTX 3070
  (84 - 93.9, n=5)
89.3 fps -27%
MSI GeForce RTX 3070 Gaming X Trio
NVIDIA GeForce RTX 3070, R9 5900X
88.2 (82min - 97max) fps -28%
Nvidia GeForce RTX 2080 Super
NVIDIA GeForce RTX 2080 Super (Desktop), R7 2700X
79 (71min - 87max) fps -35%
Average NVIDIA GeForce RTX 2080 Super (Desktop)
 
79 fps -35%
Nvidia GeForce RTX 2070 Super
NVIDIA GeForce RTX 2070 Super (Desktop), R7 2700X
68 (61min - 74max) fps -44%
Average NVIDIA GeForce RTX 2070 Super (Desktop)
  (65.5 - 71, n=5)
68 fps -44%
AMD Radeon RX 5700 XT
AMD Radeon RX 5700 XT (Desktop), R7 2700X
52.1 (47min - 57max) fps -57%
Average AMD Radeon RX 5700 XT (Desktop)
  (44 - 55.9, n=5)
52.1 fps -57%
AMD Radeon RX 5700
AMD Radeon RX 5700 (Desktop), R7 2700X
46.8 (42min - 51max) fps -62%
3840x2160 Ultra Graphics & Postprocessing (HBAO+)
Average NVIDIA GeForce RTX 3090
  (85.4 - 98.5, n=8)
93.4 fps +22%
Nvidia GeForce RTX 3090 Founders Edition
NVIDIA GeForce RTX 3090, R9 5900X
91.8 fps +20%
Average NVIDIA GeForce RTX 3080
  (78 - 85.7, n=2)
81.9 fps +7%
ASUS GeForce RTX 3080 ROG STRIX OC GAMING
NVIDIA GeForce RTX 3080, R9 5900X
78 (72min - 83max) fps +2%
AMD Radeon RX 6900 XT
AMD Radeon RX 6900 XT, R9 5950X
76.6 (70min, 70P1 - 84max) fps
Average NVIDIA Titan RTX
 
71.8 fps -6%
Average NVIDIA GeForce RTX 2080 Ti (Desktop)
  (65 - 67, n=3)
65.7 fps -14%
KFA2 GeForce RTX 2080 Ti EX
NVIDIA GeForce RTX 2080 Ti (Desktop), R9 3900X
65 (59min - 71max) fps -15%
Average NVIDIA GeForce RTX 3070
  (59 - 60.3, n=2)
59.7 fps -22%
Nvidia GeForce RTX 2080 Super
NVIDIA GeForce RTX 2080 Super (Desktop), R7 2700X
55.2 (49min - 61max) fps -28%
Average NVIDIA GeForce RTX 2080 Super (Desktop)
  (55.2 - 55.2, n=2)
55.2 fps -28%
Average NVIDIA GeForce RTX 2070 Super (Desktop)
  (46.3 - 49.3, n=4)
47.4 fps -38%
Nvidia GeForce RTX 2070 Super
NVIDIA GeForce RTX 2070 Super (Desktop), R7 2700X
46.3 (41min - 50max) fps -40%
AMD Radeon RX 5700 XT
AMD Radeon RX 5700 XT (Desktop), R7 2700X
39.7 (35min - 43max) fps -48%
Average AMD Radeon RX 5700 XT (Desktop)
  (38.9 - 40.4, n=3)
39.7 fps -48%
AMD Radeon RX 5700
AMD Radeon RX 5700 (Desktop), R7 2700X
35.6 (32min - 40max) fps -54%
1920x1080 Ultra Graphics & Postprocessing (HBAO+)
Average NVIDIA GeForce RTX 3090
  (160 - 192.6, n=16)
179.9 fps +10%
Nvidia GeForce RTX 3090 Founders Edition
NVIDIA GeForce RTX 3090, R9 5900X
171.5 fps +5%
AMD Radeon RX 6900 XT
AMD Radeon RX 6900 XT, R9 5950X
163.6 (139min - 179max) fps
AMD Radeon RX 6800 XT
AMD Radeon RX 6800 XT, R9 5950X
160 (138min - 179max) fps -2%
ASUS GeForce RTX 3080 ROG STRIX OC GAMING
NVIDIA GeForce RTX 3080, R9 5900X
152 (138min - 171max) fps -7%
Average NVIDIA GeForce RTX 3080
  (145 - 152, n=2)
148.5 fps -9%
AMD Ryzen 9 5900X
NVIDIA Titan RTX, R9 5900X
141 (127min - 154max) fps -14%
Average NVIDIA Titan RTX
  (124 - 150, n=28)
137.7 fps -16%
KFA2 GeForce RTX 2080 Ti EX
NVIDIA GeForce RTX 2080 Ti (Desktop), R9 3900X
135 (118min - 158max) fps -17%
Average NVIDIA GeForce RTX 2080 Ti (Desktop)
  (131 - 136, n=3)
134 fps -18%
MSI GeForce RTX 3070 Gaming X Trio
NVIDIA GeForce RTX 3070, R9 5900X
122 (110min - 138max) fps -25%
Nvidia GeForce RTX 2080 Super
NVIDIA GeForce RTX 2080 Super (Desktop), R7 2700X
109 (81min - 123max) fps -33%
Average NVIDIA GeForce RTX 2080 Super (Desktop)
 
109 fps -33%
Average NVIDIA GeForce RTX 3070
  (52.8 - 132.2, n=7)
106.1 fps -35%
Average NVIDIA GeForce RTX 2070 Super (Desktop)
  (95.6 - 109.6, n=6)
100.9 fps -38%
Nvidia GeForce RTX 2070 Super
NVIDIA GeForce RTX 2070 Super (Desktop), R7 2700X
97 (83min - 109max) fps -41%
AMD Radeon RX 5700 XT
AMD Radeon RX 5700 XT (Desktop), R7 2700X
92 (79min - 99max) fps -44%
Average AMD Radeon RX 5700 XT (Desktop)
  (71.6 - 102.4, n=6)
92 fps -44%
AMD Radeon RX 5700
AMD Radeon RX 5700 (Desktop), R7 2700X
80 (70min - 87max) fps -51%
Assassin´s Creed Odyssey
3840x2160 Ultra High Preset
AMD Radeon RX 6900 XT
AMD Radeon RX 6900 XT, R9 5950X
68 (14min - 149max) fps
Average NVIDIA GeForce RTX 3090
 
65 fps -4%
Average NVIDIA Titan RTX
 
52 fps -24%
Average NVIDIA GeForce RTX 2080 Ti (Desktop)
  (46 - 53, n=2)
49.5 fps -27%
Average NVIDIA GeForce RTX 3070
 
48 fps -29%
KFA2 GeForce RTX 2080 Ti EX
NVIDIA GeForce RTX 2080 Ti (Desktop), R9 3900X
46 fps -32%
Nvidia GeForce RTX 2080 Super
NVIDIA GeForce RTX 2080 Super (Desktop), R7 2700X
41 fps -40%
Average NVIDIA GeForce RTX 2080 Super (Desktop)
 
41 fps -40%
Nvidia GeForce RTX 2070 Super
NVIDIA GeForce RTX 2070 Super (Desktop), R7 2700X
39 fps -43%
Average NVIDIA GeForce RTX 2070 Super (Desktop)
  (38 - 39, n=2)
38.5 fps -43%
AMD Radeon RX 5700 XT
AMD Radeon RX 5700 XT (Desktop), R7 2700X
35 fps -49%
Average AMD Radeon RX 5700 XT (Desktop)
 
35 fps -49%
AMD Radeon RX 5700
AMD Radeon RX 5700 (Desktop), R7 2700X
31 fps -54%
2560x1440 Ultra High Preset
AMD Radeon RX 6900 XT
AMD Radeon RX 6900 XT, R9 5950X
99 (37min - 156max) fps
Average NVIDIA GeForce RTX 3090
 
82 fps -17%
Average NVIDIA GeForce RTX 2080 Ti (Desktop)
  (71 - 72, n=2)
71.5 fps -28%
KFA2 GeForce RTX 2080 Ti EX
NVIDIA GeForce RTX 2080 Ti (Desktop), R9 3900X
71 fps -28%
Average NVIDIA GeForce RTX 3070
 
68 fps -31%
Nvidia GeForce RTX 2080 Super
NVIDIA GeForce RTX 2080 Super (Desktop), R7 2700X
58 fps -41%
Average NVIDIA GeForce RTX 2080 Super (Desktop)
 
58 fps -41%
Average NVIDIA GeForce RTX 2070 Super (Desktop)
  (56 - 57, n=2)
56.5 fps -43%
Nvidia GeForce RTX 2070 Super
NVIDIA GeForce RTX 2070 Super (Desktop), R7 2700X
56 fps -43%
AMD Radeon RX 5700 XT
AMD Radeon RX 5700 XT (Desktop), R7 2700X
53 fps -46%
Average AMD Radeon RX 5700 XT (Desktop)
 
53 fps -46%
AMD Radeon RX 5700
AMD Radeon RX 5700 (Desktop), R7 2700X
51 fps -48%
1920x1080 Ultra High Preset
AMD Radeon RX 6900 XT
AMD Radeon RX 6900 XT, R9 5950X
98 (37min - 162max) fps
Average NVIDIA GeForce RTX 3090
 
92 fps -6%
Average NVIDIA GeForce RTX 2080 Ti (Desktop)
  (80 - 83, n=2)
81.5 fps -17%
Average NVIDIA GeForce RTX 3070
 
81 fps -17%
KFA2 GeForce RTX 2080 Ti EX
NVIDIA GeForce RTX 2080 Ti (Desktop), R9 3900X
80 fps -18%
Average NVIDIA Titan RTX
 
79 fps -19%
Nvidia GeForce RTX 2080 Super
NVIDIA GeForce RTX 2080 Super (Desktop), R7 2700X
68 fps -31%
Average NVIDIA GeForce RTX 2080 Super (Desktop)
 
68 fps -31%
Average NVIDIA GeForce RTX 2070 Super (Desktop)
  (64 - 66, n=2)
65 fps -34%
Nvidia GeForce RTX 2070 Super
NVIDIA GeForce RTX 2070 Super (Desktop), R7 2700X
64 fps -35%
AMD Radeon RX 5700 XT
AMD Radeon RX 5700 XT (Desktop), R7 2700X
62 fps -37%
Average AMD Radeon RX 5700 XT (Desktop)
 
62 fps -37%
AMD Radeon RX 5700
AMD Radeon RX 5700 (Desktop), R7 2700X
60 fps -39%
Battlefield V
1920x1080 Ultra Preset DXR
ASUS GeForce RTX 3080 ROG STRIX OC GAMING
NVIDIA GeForce RTX 3080, R9 5900X
128 (95min - 161max) fps +27%
Average NVIDIA GeForce RTX 3080
  (122.1 - 128, n=2)
125.1 fps +24%
Nvidia GeForce RTX 3090 Founders Edition
NVIDIA GeForce RTX 3090, R9 5900X
124.8 fps +24%
Average NVIDIA GeForce RTX 3090
  (106 - 128, n=3)
119.6 fps +18%
AMD Radeon RX 6900 XT
AMD Radeon RX 6900 XT, R9 5950X
101 (18.7min, 50.6P0.1, 65.1P1 - 290max) fps
Average NVIDIA GeForce RTX 3070
  (87.7 - 104.5, n=2)
96.1 fps -5%
Average NVIDIA GeForce RTX 2080 Ti (Desktop)
  (94 - 96, n=2)
95 fps -6%
AMD Radeon RX 6800 XT
AMD Radeon RX 6800 XT, R9 5950X
94.5 fps -6%
KFA2 GeForce RTX 2080 Ti EX
NVIDIA GeForce RTX 2080 Ti (Desktop), R9 3900X
94 (74min - 129max) fps -7%
MSI GeForce RTX 3070 Gaming X Trio
NVIDIA GeForce RTX 3070, R9 5900X
87.7 fps -13%
Nvidia GeForce RTX 2070 Super
NVIDIA GeForce RTX 2070 Super (Desktop), R7 2700X
80 (57min - 103max) fps -21%
Nvidia GeForce RTX 2080 Super
NVIDIA GeForce RTX 2080 Super (Desktop), R7 2700X
80 (47min - 111max) fps -21%
Average NVIDIA GeForce RTX 2080 Super (Desktop)
 
80 fps -21%
Average NVIDIA GeForce RTX 2070 Super (Desktop)
  (70.8 - 80, n=3)
75.6 fps -25%
3840x2160 Ultra Preset
AMD Radeon RX 6900 XT
AMD Radeon RX 6900 XT, R9 5950X
134 (28.5min, 44.9P0.1, 89P1 - 463max) fps
Average NVIDIA GeForce RTX 3090
  (94 - 130, n=4)
112.5 fps -16%
AMD Radeon RX 6800 XT
AMD Radeon RX 6800 XT, R9 5950X
102.5 fps -24%
Average NVIDIA Titan RTX
 
97.3 fps -27%
Nvidia GeForce RTX 3090 Founders Edition
NVIDIA GeForce RTX 3090, R9 5900X
95.8 fps -29%
ASUS GeForce RTX 3080 ROG STRIX OC GAMING
NVIDIA GeForce RTX 3080, R9 5900X
94.2 (78min - 135max) fps -30%
Average NVIDIA GeForce RTX 3080
  (87.2 - 94.2, n=2)
90.7 fps -32%
Average NVIDIA GeForce RTX 2080 Ti (Desktop)
  (73 - 99, n=2)
86 fps -36%
KFA2 GeForce RTX 2080 Ti EX
NVIDIA GeForce RTX 2080 Ti (Desktop), R9 3900X
73 (61min - 110max) fps -46%
Average NVIDIA GeForce RTX 3070
  (69 - 70.9, n=2)
70 fps -48%
MSI GeForce RTX 3070 Gaming X Trio
NVIDIA GeForce RTX 3070, R9 5900X
69 fps -49%
Average NVIDIA GeForce RTX 2080 Super (Desktop)
  (55.7 - 80, n=2)
67.9 fps -49%
AMD Radeon RX 5700 XT
AMD Radeon RX 5700 XT (Desktop), R7 2700X
59.5 (49min - 92max) fps -56%
Average AMD Radeon RX 5700 XT (Desktop)
 
59.5 fps -56%
Nvidia GeForce RTX 2080 Super
NVIDIA GeForce RTX 2080 Super (Desktop), R7 2700X
55.7 (33min - 81max) fps -58%
AMD Radeon RX 5700
AMD Radeon RX 5700 (Desktop), R7 2700X
53.5 (44min - 83max) fps -60%
Average NVIDIA GeForce RTX 2070 Super (Desktop)
  (50.9 - 54.4, n=3)
52.7 fps -61%
Nvidia GeForce RTX 2070 Super
NVIDIA GeForce RTX 2070 Super (Desktop), R7 2700X
50.9 (41min - 73max) fps -62%
2560x1440 Ultra Preset
AMD Radeon RX 6900 XT
AMD Radeon RX 6900 XT, R9 5950X
196 (24.2min, 63.2P0.1, 120P1 - 512max) fps
AMD Radeon RX 6800 XT
AMD Radeon RX 6800 XT, R9 5950X
153.7 fps -22%
Average NVIDIA GeForce RTX 3090
  (124 - 178, n=3)
143.8 fps -27%
Average NVIDIA GeForce RTX 2080 Ti (Desktop)
  (108 - 159, n=2)
133.5 fps -32%
ASUS GeForce RTX 3080 ROG STRIX OC GAMING
NVIDIA GeForce RTX 3080, R9 5900X
132 (109min - 179max) fps -33%
Nvidia GeForce RTX 3090 Founders Edition
NVIDIA GeForce RTX 3090, R9 5900X
129.5 fps -34%
Average NVIDIA GeForce RTX 3080
  (116.1 - 132, n=2)
124.1 fps -37%
KFA2 GeForce RTX 2080 Ti EX
NVIDIA GeForce RTX 2080 Ti (Desktop), R9 3900X
108 (87min - 153max) fps -45%
Average NVIDIA GeForce RTX 2080 Super (Desktop)
  (85 - 131, n=2)
108 fps -45%
Average NVIDIA GeForce RTX 3070
  (98.8 - 106.8, n=2)
102.8 fps -48%
MSI GeForce RTX 3070 Gaming X Trio
NVIDIA GeForce RTX 3070, R9 5900X
98.8 fps -50%
AMD Radeon RX 5700 XT
AMD Radeon RX 5700 XT (Desktop), R7 2700X
89 (70min - 130max) fps -55%
Average AMD Radeon RX 5700 XT (Desktop)
 
89 fps -55%
Nvidia GeForce RTX 2080 Super
NVIDIA GeForce RTX 2080 Super (Desktop), R7 2700X
85 (43min - 122max) fps -57%
Average NVIDIA GeForce RTX 2070 Super (Desktop)
  (78 - 94, n=3)
85 fps -57%
AMD Radeon RX 5700
AMD Radeon RX 5700 (Desktop), R7 2700X
81 (64min - 122max) fps -59%
Nvidia GeForce RTX 2070 Super
NVIDIA GeForce RTX 2070 Super (Desktop), R7 2700X
78 (65min - 110max) fps -60%
1920x1080 Ultra Preset
AMD Radeon RX 6900 XT
AMD Radeon RX 6900 XT, R9 5950X
197 (46.7min, 68.3P0.1, 114P1 - 501max) fps
AMD Radeon RX 6800 XT
AMD Radeon RX 6800 XT, R9 5950X
175.4 fps -11%
Average NVIDIA Titan RTX
 
160.4 fps -19%
Average NVIDIA GeForce RTX 2080 Ti (Desktop)
  (127 - 190, n=2)
158.5 fps -20%
Average NVIDIA GeForce RTX 3090
  (141 - 187, n=3)
157.9 fps -20%
ASUS GeForce RTX 3080 ROG STRIX OC GAMING
NVIDIA GeForce RTX 3080, R9 5900X
152 (126min - 199max) fps -23%
Nvidia GeForce RTX 3090 Founders Edition
NVIDIA GeForce RTX 3090, R9 5900X
145.8 fps -26%
Average NVIDIA GeForce RTX 3080
  (137.9 - 152, n=2)
145 fps -26%
Average NVIDIA GeForce RTX 2080 Super (Desktop)
  (101 - 160, n=2)
130.5 fps -34%
KFA2 GeForce RTX 2080 Ti EX
NVIDIA GeForce RTX 2080 Ti (Desktop), R9 3900X
127 (102min - 175max) fps -36%
Average NVIDIA GeForce RTX 3070
  (113.6 - 125.2, n=2)
119.4 fps -39%
MSI GeForce RTX 3070 Gaming X Trio
NVIDIA GeForce RTX 3070, R9 5900X
113.6 fps -42%
AMD Radeon RX 5700 XT
AMD Radeon RX 5700 XT (Desktop), R7 2700X
105 (81min - 150max) fps -47%
Average AMD Radeon RX 5700 XT (Desktop)
 
105 fps -47%
Average NVIDIA GeForce RTX 2070 Super (Desktop)
  (93.2 - 123, n=3)
103.7 fps -47%
Nvidia GeForce RTX 2080 Super
NVIDIA GeForce RTX 2080 Super (Desktop), R7 2700X
101 (63min - 139max) fps -49%
AMD Radeon RX 5700
AMD Radeon RX 5700 (Desktop), R7 2700X
97 (76min - 140max) fps -51%
Nvidia GeForce RTX 2070 Super
NVIDIA GeForce RTX 2070 Super (Desktop), R7 2700X
95 (77min - 133max) fps -52%
The Division 2
3840x2160 Ultra Preset
Average NVIDIA GeForce RTX 3090
  (71.9 - 77.5, n=3)
73.8 fps +11%
Nvidia GeForce RTX 3090 Founders Edition
NVIDIA GeForce RTX 3090, R9 5900X
72 fps +8%
AMD Radeon RX 6900 XT
AMD Radeon RX 6900 XT, R9 5950X
66.6 (40.2min, 54.6P1) fps
ASUS GeForce RTX 3080 ROG STRIX OC GAMING
NVIDIA GeForce RTX 3080, R9 5900X
65 fps -2%
Average NVIDIA GeForce RTX 3080
 
65 fps -2%
AMD Radeon RX 6800 XT
AMD Radeon RX 6800 XT, R9 5950X
63.2 (34.5min, 54.1P1) fps -5%
Average NVIDIA Titan RTX
 
62 fps -7%
Average NVIDIA GeForce RTX 2080 Ti (Desktop)
  (53 - 57, n=3)
55.3 fps -17%
KFA2 GeForce RTX 2080 Ti EX
NVIDIA GeForce RTX 2080 Ti (Desktop), R9 3900X
53 fps -20%
MSI GeForce RTX 3070 Gaming X Trio
NVIDIA GeForce RTX 3070, R9 5900X
49 fps -26%
Average NVIDIA GeForce RTX 3070
 
49 fps -26%
Nvidia GeForce RTX 2080 Super
NVIDIA GeForce RTX 2080 Super (Desktop), R7 2700X
45 fps -32%
Average NVIDIA GeForce RTX 2080 Super (Desktop)
  (43 - 45, n=2)
44 fps -34%
Nvidia GeForce RTX 2070 Super
NVIDIA GeForce RTX 2070 Super (Desktop), R7 2700X
39 fps -41%
Average NVIDIA GeForce RTX 2070 Super (Desktop)
  (37 - 39, n=2)
38 fps -43%
AMD Radeon RX 5700 XT
AMD Radeon RX 5700 XT (Desktop), R7 2700X
34.1 (16.9min, 21.4P1) fps -49%
Average AMD Radeon RX 5700 XT (Desktop)
  (26 - 34.1, n=2)
30.1 fps -55%
AMD Radeon RX 5700
AMD Radeon RX 5700 (Desktop), R7 2700X
30 (2.5min, 24.3P1) fps -55%
2560x1440 Ultra Preset
Average NVIDIA GeForce RTX 3090
  (120 - 128, n=3)
123 fps +4%
Nvidia GeForce RTX 3090 Founders Edition
NVIDIA GeForce RTX 3090, R9 5900X
121 fps +3%
AMD Radeon RX 6900 XT
AMD Radeon RX 6900 XT, R9 5950X
118 (51.3min, 70.9P1) fps
AMD Radeon RX 6800 XT
AMD Radeon RX 6800 XT, R9 5950X
114 (52.4min, 73P1) fps -3%
ASUS GeForce RTX 3080 ROG STRIX OC GAMING
NVIDIA GeForce RTX 3080, R9 5900X
107 fps -9%
Average NVIDIA GeForce RTX 3080
 
107 fps -9%
Average NVIDIA Titan RTX
 
102 fps -14%
Average NVIDIA GeForce RTX 2080 Ti (Desktop)
  (92 - 100, n=3)
96.3 fps -18%
KFA2 GeForce RTX 2080 Ti EX
NVIDIA GeForce RTX 2080 Ti (Desktop), R9 3900X
92 fps -22%
MSI GeForce RTX 3070 Gaming X Trio
NVIDIA GeForce RTX 3070, R9 5900X
82 fps -31%
Average NVIDIA GeForce RTX 3070
 
82 fps -31%
Nvidia GeForce RTX 2080 Super
NVIDIA GeForce RTX 2080 Super (Desktop), R7 2700X
79 fps -33%
Average NVIDIA GeForce RTX 2080 Super (Desktop)
 
79 fps -33%
Nvidia GeForce RTX 2070 Super
NVIDIA GeForce RTX 2070 Super (Desktop), R7 2700X
69 fps -42%
Average NVIDIA GeForce RTX 2070 Super (Desktop)
  (67 - 69, n=2)
68 fps -42%
AMD Radeon RX 5700 XT
AMD Radeon RX 5700 XT (Desktop), R7 2700X
64 (33.2min, 45.2P1) fps -46%
AMD Radeon RX 5700
AMD Radeon RX 5700 (Desktop), R7 2700X
56.9 (22.8min, 39.8P1) fps -52%
Average AMD Radeon RX 5700 XT (Desktop)
  (49 - 64, n=2)
56.5 fps -52%
1920x1080 Ultra Preset
Nvidia GeForce RTX 3090 Founders Edition
NVIDIA GeForce RTX 3090, R9 5900X
152 fps +10%
Average NVIDIA GeForce RTX 3090
  (140 - 160, n=3)
150.7 fps +9%
ASUS GeForce RTX 3080 ROG STRIX OC GAMING
NVIDIA GeForce RTX 3080, R9 5900X
140 fps +1%
Average NVIDIA GeForce RTX 3080
 
140 fps +1%
AMD Radeon RX 6800 XT
AMD Radeon RX 6800 XT, R9 5950X
138 (45.5min, 74.1P1) fps 0%
AMD Radeon RX 6900 XT
AMD Radeon RX 6900 XT, R9 5950X
138 (54.9min, 75.2P1) fps
Average NVIDIA GeForce RTX 2080 Ti (Desktop)
  (123 - 133, n=3)
127 fps -8%
KFA2 GeForce RTX 2080 Ti EX
NVIDIA GeForce RTX 2080 Ti (Desktop), R9 3900X
123 fps -11%
Average NVIDIA Titan RTX
 
113 fps -18%
MSI GeForce RTX 3070 Gaming X Trio
NVIDIA GeForce RTX 3070, R9 5900X
112 fps -19%
Average NVIDIA GeForce RTX 3070
 
112 fps -19%
Nvidia GeForce RTX 2080 Super
NVIDIA GeForce RTX 2080 Super (Desktop), R7 2700X
106 fps -23%
Average NVIDIA GeForce RTX 2080 Super (Desktop)
 
106 fps -23%
Average NVIDIA GeForce RTX 2070 Super (Desktop)
  (90 - 96, n=2)
93 fps -33%
Nvidia GeForce RTX 2070 Super
NVIDIA GeForce RTX 2070 Super (Desktop), R7 2700X
90 fps -35%
AMD Radeon RX 5700 XT
AMD Radeon RX 5700 XT (Desktop), R7 2700X
88 (30.2min, 50P1) fps -36%
Average AMD Radeon RX 5700 XT (Desktop)
  (69 - 88, n=2)
78.5 fps -43%
AMD Radeon RX 5700
AMD Radeon RX 5700 (Desktop), R7 2700X
78 (14.6min, 42.2P1) fps -43%
Red Dead Redemption 2
3840x2160 Maximum Settings
Average NVIDIA GeForce RTX 3090
  (61.9 - 67, n=3)
64.1 fps +17%
Nvidia GeForce RTX 3090 Founders Edition
NVIDIA GeForce RTX 3090, R9 5900X
63.5 (29min - 85max) fps +16%
Average NVIDIA GeForce RTX 3080
  (56 - 56.4, n=2)
56.2 fps +3%
ASUS GeForce RTX 3080 ROG STRIX OC GAMING
NVIDIA GeForce RTX 3080, R9 5900X
56 fps +3%
AMD Radeon RX 6900 XT
AMD Radeon RX 6900 XT, R9 5950X
54.6 (36.2min, 47.6P1 - 67max) fps
AMD Radeon RX 6800 XT
AMD Radeon RX 6800 XT, R9 5950X
52.9 (41min, 45.5P1 - 65.3max) fps -3%
MSI GeForce RTX 3070 Gaming X Trio
NVIDIA GeForce RTX 3070, R9 5900X
44 (32min - 55max) fps -19%
Average NVIDIA GeForce RTX 3070
  (42.1 - 44, n=3)
42.9 fps -21%
Average NVIDIA GeForce RTX 2080 Ti (Desktop)
 
42.3 fps -23%
Average NVIDIA Titan RTX
 
41 fps -25%
Average NVIDIA GeForce RTX 2080 Super (Desktop)
 
33 fps -40%
Average NVIDIA GeForce RTX 2070 Super (Desktop)
  (28 - 28.7, n=2)
28.4 fps -48%
Average AMD Radeon RX 5700 XT (Desktop)
 
27 fps -51%
2560x1440 Maximum Settings
Average NVIDIA GeForce RTX 3090
  (91.9 - 96, n=3)
93.4 fps +14%
Nvidia GeForce RTX 3090 Founders Edition
NVIDIA GeForce RTX 3090, R9 5900X
92.3 (33min - 132max) fps +12%
Average NVIDIA GeForce RTX 3080
  (81 - 86.4, n=2)
83.7 fps +2%
AMD Radeon RX 6800 XT
AMD Radeon RX 6800 XT, R9 5950X
82.7 (59min, 66.7P1 - 103max) fps +1%
AMD Radeon RX 6900 XT
AMD Radeon RX 6900 XT, R9 5950X
82.1 (34min, 66.7P1 - 104max) fps
ASUS GeForce RTX 3080 ROG STRIX OC GAMING
NVIDIA GeForce RTX 3080, R9 5900X
81 fps -1%
MSI GeForce RTX 3070 Gaming X Trio
NVIDIA GeForce RTX 3070, R9 5900X
65 (33min - 100max) fps -21%
Average NVIDIA GeForce RTX 3070
  (63.2 - 65, n=3)
63.9 fps -22%
Average NVIDIA GeForce RTX 2080 Ti (Desktop)
 
63 fps -23%
Average NVIDIA Titan RTX
 
63 fps -23%
Average NVIDIA GeForce RTX 2080 Super (Desktop)
 
50.6 fps -38%
Average NVIDIA GeForce RTX 2070 Super (Desktop)
  (43.3 - 44, n=2)
43.7 fps -47%
Average AMD Radeon RX 5700 XT (Desktop)
 
41.8 fps -49%
1920x1080 Maximum Settings
Average NVIDIA GeForce RTX 3090
  (109.9 - 115, n=3)
111.6 fps +14%
Nvidia GeForce RTX 3090 Founders Edition
NVIDIA GeForce RTX 3090, R9 5900X
109.9 (37min - 148max) fps +12%
AMD Radeon RX 6800 XT
AMD Radeon RX 6800 XT, R9 5950X
102 (68.7min, 76.9P1 - 129max) fps +4%
Average NVIDIA GeForce RTX 3080
  (96 - 103, n=2)
99.5 fps +2%
AMD Radeon RX 6900 XT
AMD Radeon RX 6900 XT, R9 5950X
98 (34.2min, 76.9P1 - 125max) fps
ASUS GeForce RTX 3080 ROG STRIX OC GAMING
NVIDIA GeForce RTX 3080, R9 5900X
96 fps -2%
MSI GeForce RTX 3070 Gaming X Trio
NVIDIA GeForce RTX 3070, R9 5900X
78 (38min - 126max) fps -20%
Average NVIDIA GeForce RTX 3070
  (76.2 - 78, n=3)
77.4 fps -21%
Average NVIDIA GeForce RTX 2080 Ti (Desktop)
 
76 fps -22%
Average NVIDIA Titan RTX
 
76 fps -22%
Average NVIDIA GeForce RTX 2080 Super (Desktop)
 
61 fps -38%
Average NVIDIA GeForce RTX 2070 Super (Desktop)
  (53 - 54.6, n=2)
53.8 fps -45%
Average AMD Radeon RX 5700 XT (Desktop)
 
51.5 fps -47%
Mafia Definitive Edition
3840x2160 High Preset
Average NVIDIA GeForce RTX 3090
  (84.5 - 89.1, n=2)
86.8 fps +30%
Nvidia GeForce RTX 3090 Founders Edition
NVIDIA GeForce RTX 3090, R9 5900X
84.5 fps +26%
ASUS GeForce RTX 3080 ROG STRIX OC GAMING
NVIDIA GeForce RTX 3080, R9 5900X
78.2 (17.9min, 31P0.1, 59.3P1 - 292max) fps +17%
Average NVIDIA GeForce RTX 3080
  (78.1 - 78.2, n=2)
78.2 fps +17%
AMD Radeon RX 6900 XT
AMD Radeon RX 6900 XT, R9 5950X
67 (32.3min, 41.7P0.1, 44.7P1 - 211max) fps
Average NVIDIA Titan RTX
 
63.4 fps -5%
AMD Radeon RX 6800 XT
AMD Radeon RX 6800 XT, R9 5950X
62.6 (28min, 37.6P0.1, 49.2P1 - 87.3max) fps -7%
Average NVIDIA GeForce RTX 2080 Ti (Desktop)
 
62.4 fps -7%
MSI GeForce RTX 3070 Gaming X Trio
NVIDIA GeForce RTX 3070, R9 5900X
56.6 (34.7min, 37.9P0.1, 44.2P1 - 177max) fps -16%
Average NVIDIA GeForce RTX 3070
  (55.2 - 56.6, n=2)
55.9 fps -17%
Average NVIDIA GeForce RTX 2080 Super (Desktop)
 
48.5 fps -28%
Average NVIDIA GeForce RTX 2070 Super (Desktop)
 
41.8 fps -38%
Average AMD Radeon RX 5700 XT (Desktop)
 
36.4 fps -46%
2560x1440 High Preset
Average NVIDIA GeForce RTX 3090
  (142.3 - 149, n=2)
145.7 fps +21%
Nvidia GeForce RTX 3090 Founders Edition
NVIDIA GeForce RTX 3090, R9 5900X
142.3 fps +19%
ASUS GeForce RTX 3080 ROG STRIX OC GAMING
NVIDIA GeForce RTX 3080, R9 5900X
137 (26.5min, 66.2P0.1, 95.7P1 - 265max) fps +14%
Average NVIDIA GeForce RTX 3080
  (127 - 137, n=2)
132 fps +10%
AMD Radeon RX 6900 XT
AMD Radeon RX 6900 XT, R9 5950X
120 (17.6min, 61.2P0.1, 83.1P1 - 238max) fps
AMD Radeon RX 6800 XT
AMD Radeon RX 6800 XT, R9 5950X
112 (23.5min, 64P0.1, 80.8P1 - 169max) fps -7%
Average NVIDIA Titan RTX
 
109 fps -9%
Average NVIDIA GeForce RTX 2080 Ti (Desktop)
 
105 fps -12%
MSI GeForce RTX 3070 Gaming X Trio
NVIDIA GeForce RTX 3070, R9 5900X
98.7 (45.2min, 55.9P0.1, 69.4P1 - 191max) fps -18%
Average NVIDIA GeForce RTX 3070
  (98.1 - 98.7, n=2)
98.4 fps -18%
Average NVIDIA GeForce RTX 2080 Super (Desktop)
 
88.8 fps -26%
Average NVIDIA GeForce RTX 2070 Super (Desktop)
 
78.1 fps -35%
Average AMD Radeon RX 5700 XT (Desktop)
 
67.7 fps -44%
1920x1080 High Preset
ASUS GeForce RTX 3080 ROG STRIX OC GAMING
NVIDIA GeForce RTX 3080, R9 5900X
169 (32.7min, 75.7P0.1, 112P1 - 361max) fps +22%
Nvidia GeForce RTX 3090 Founders Edition
NVIDIA GeForce RTX 3090, R9 5900X
158.8 fps +15%
Average NVIDIA GeForce RTX 3090
  (157 - 158.8, n=2)
157.9 fps +14%
Average NVIDIA GeForce RTX 3080
  (144 - 169, n=2)
156.5 fps +13%
AMD Radeon RX 6900 XT
AMD Radeon RX 6900 XT, R9 5950X
138 (32.8min, 68.1P0.1, 90.2P1 - 334max) fps
Average NVIDIA GeForce RTX 3070
  (124 - 132, n=2)
128 fps -7%
MSI GeForce RTX 3070 Gaming X Trio
NVIDIA GeForce RTX 3070, R9 5900X
124 (57.4min, 62.8P0.1, 82P1 - 251max) fps -10%
Average NVIDIA Titan RTX
 
123.7 fps -10%
AMD Radeon RX 6800 XT
AMD Radeon RX 6800 XT, R9 5950X
121 (23.7min, 68P0.1, 83.3P1 - 223max) fps -12%
Average NVIDIA GeForce RTX 2080 Super (Desktop)
 
118.1 fps -14%
Average NVIDIA GeForce RTX 2080 Ti (Desktop)
 
117 fps -15%
Average NVIDIA GeForce RTX 2070 Super (Desktop)
 
111.6 fps -19%
Average AMD Radeon RX 5700 XT (Desktop)
 
92.3 fps -33%
Cyberpunk 2077 1.0
3840x2160 Ultra Preset
Average NVIDIA GeForce RTX 3090
  (41.5 - 45.3, n=2)
43.4 fps +25%
Nvidia GeForce RTX 3090 Founders Edition
NVIDIA GeForce RTX 3090, R9 5900X
41.5 fps +19%
Average NVIDIA GeForce RTX 3080
 
38.9 fps +12%
AMD Radeon RX 6900 XT
AMD Radeon RX 6900 XT, R9 5950X
34.8 (19.4min, 22.8P0.1, 29.7P1 - 177max) fps
Average NVIDIA GeForce RTX 2080 Ti (Desktop)
 
32.2 fps -7%
AMD Ryzen 9 5900X
NVIDIA Titan RTX, R9 5900X
30.9 fps -11%
Average NVIDIA Titan RTX
 
30.9 fps -11%
Average NVIDIA GeForce RTX 3070
  (26.6 - 27.9, n=2)
27.3 fps -22%
Average NVIDIA GeForce RTX 2080 Super (Desktop)
 
24.1 fps -31%
Average NVIDIA GeForce RTX 2070 Super (Desktop)
 
21.5 fps -38%
Average AMD Radeon RX 5700 XT (Desktop)
 
16.5 fps -53%
2560x1440 Ultra Preset
Average NVIDIA GeForce RTX 3090
  (78.1 - 85.3, n=2)
81.7 fps +13%
Nvidia GeForce RTX 3090 Founders Edition
NVIDIA GeForce RTX 3090, R9 5900X
78.1 fps +8%
Average NVIDIA GeForce RTX 3080
 
72.5 fps 0%
AMD Radeon RX 6900 XT
AMD Radeon RX 6900 XT, R9 5950X
72.3 (21min, 36.7P0.1, 58.6P1 - 231max) fps
Average NVIDIA GeForce RTX 2080 Ti (Desktop)
 
64 fps -11%
AMD Ryzen 9 5900X
NVIDIA Titan RTX, R9 5900X
58.4 fps -19%
Average NVIDIA Titan RTX
 
58.4 fps -19%
Average NVIDIA GeForce RTX 3070
  (53.7 - 54.8, n=2)
54.3 fps -25%
Average NVIDIA GeForce RTX 2080 Super (Desktop)
 
49.1 fps -32%
Average NVIDIA GeForce RTX 2070 Super (Desktop)
 
43.7 fps -40%
Average AMD Radeon RX 5700 XT (Desktop)
 
36.9 fps -49%
1920x1080 Ultra Preset
Nvidia GeForce RTX 3090 Founders Edition
NVIDIA GeForce RTX 3090, R9 5900X
109.7 fps +3%
Average NVIDIA GeForce RTX 3090
  (108 - 109.7, n=2)
108.9 fps +3%
AMD Radeon RX 6900 XT
AMD Radeon RX 6900 XT, R9 5950X
106 (23.2min, 48.3P0.1, 76.1P1 - 189max) fps
Average NVIDIA GeForce RTX 3080
 
103 fps -3%
Average NVIDIA GeForce RTX 2080 Ti (Desktop)
 
95.4 fps -10%
AMD Ryzen 9 5900X
NVIDIA Titan RTX, R9 5900X
82.3 fps -22%
Average NVIDIA Titan RTX
 
82.3 fps -22%
Average NVIDIA GeForce RTX 3070
  (80.6 - 81, n=2)
80.8 fps -24%
Average NVIDIA GeForce RTX 2080 Super (Desktop)
 
72.1 fps -32%
Average NVIDIA GeForce RTX 2070 Super (Desktop)
 
65.4 fps -38%
Average AMD Radeon RX 5700 XT (Desktop)
 
58.9 fps -44%
Call of Duty Black Ops Cold War
1920x1080 Highest Settings + Ultra Ray Tracing
AMD Ryzen 9 5900X
NVIDIA Titan RTX, R9 5900X
119 fps +71%
Average NVIDIA Titan RTX
 
119 fps +71%
Nvidia GeForce RTX 3090 Founders Edition
NVIDIA GeForce RTX 3090, R9 5900X
89 fps +28%
Average NVIDIA GeForce RTX 3090
  (88.3 - 89, n=2)
88.7 fps +28%
Average NVIDIA GeForce RTX 3080
 
81.9 fps +18%
Average NVIDIA GeForce RTX 2080 Ti (Desktop)
 
77.2 fps +11%
AMD Radeon RX 6900 XT
AMD Radeon RX 6900 XT, R9 5950X
69.5 (40.4min, 48.2P0.1, 54.5P1 - 302max) fps
MSI GeForce RTX 3070 Gaming X Trio
NVIDIA GeForce RTX 3070, R9 5900X
68.5 (19.1min, 22.3P0.1, 30.4P1 - 229max) fps -1%
Average NVIDIA GeForce RTX 3070
  (49.8 - 70.1, n=3)
62.8 fps -10%
Average NVIDIA GeForce RTX 2080 Super (Desktop)
 
59 fps -15%
Average NVIDIA GeForce RTX 2070 Super (Desktop)
 
55.6 fps -20%
AMD Radeon RX 6800 XT
AMD Radeon RX 6800 XT, R9 5950X
21.8 (8.8min, 9.61P0.1, 16.2P1 - 49.5max) fps -69%
3840x2160 Highest Settings
Average NVIDIA GeForce RTX 3090
  (74.6 - 76.1, n=2)
75.4 fps +11%
Nvidia GeForce RTX 3090 Founders Edition
NVIDIA GeForce RTX 3090, R9 5900X
74.6 fps +10%
MSI GeForce RTX 3070 Gaming X Trio
NVIDIA GeForce RTX 3070, R9 5900X
74 (32.6min, 43.5P0.1, 50.6P1 - 270max) fps +9%
AMD Radeon RX 6900 XT
AMD Radeon RX 6900 XT, R9 5950X
68.1 (42.2min, 50.7P0.1, 56.8P1 - 172max) fps
Average NVIDIA GeForce RTX 3080
 
65.6 fps -4%
AMD Radeon RX 6800 XT
AMD Radeon RX 6800 XT, R9 5950X
64 (10.8min, 11.6P0.1, 50.8P1 - 159max) fps -6%
Average NVIDIA GeForce RTX 3070
  (43.8 - 74, n=3)
56 fps -18%
Average NVIDIA GeForce RTX 2080 Ti (Desktop)
 
54.4 fps -20%
AMD Ryzen 9 5900X
NVIDIA Titan RTX, R9 5900X
52.9 fps -22%
Average NVIDIA Titan RTX
 
52.9 fps -22%
Average NVIDIA GeForce RTX 2080 Super (Desktop)
  (38 - 44.5, n=2)
41.3 fps -39%
Average NVIDIA GeForce RTX 2070 Super (Desktop)
 
37.6 fps -45%
Average AMD Radeon RX 5700 XT (Desktop)
 
33.3 fps -51%
2560x1440 Highest Settings
Nvidia GeForce RTX 3090 Founders Edition
NVIDIA GeForce RTX 3090, R9 5900X
124.7 fps +8%
Average NVIDIA GeForce RTX 3090
  (122 - 124.7, n=2)
123.4 fps +7%
AMD Radeon RX 6900 XT
AMD Radeon RX 6900 XT, R9 5950X
115 (54.9min, 82.8P0.1, 92.3P1 - 314max) fps
MSI GeForce RTX 3070 Gaming X Trio
NVIDIA GeForce RTX 3070, R9 5900X
107 (43.6min, 54P0.1, 62.7P1 - 272max) fps -7%
Average NVIDIA GeForce RTX 3080
 
104 fps -10%
Average NVIDIA GeForce RTX 3070
  (83 - 107, n=3)
93.2 fps -19%
Average NVIDIA GeForce RTX 2080 Ti (Desktop)
 
89.2 fps -22%
AMD Ryzen 9 5900X
NVIDIA Titan RTX, R9 5900X
87.6 fps -24%
Average NVIDIA Titan RTX
 
87.6 fps -24%
AMD Radeon RX 6800 XT
AMD Radeon RX 6800 XT, R9 5950X
80.4 (16.5min, 31.8P0.1, 64.3P1 - 285max) fps -30%
Average NVIDIA GeForce RTX 2070 Super (Desktop)
 
67.7 fps -41%
Average NVIDIA GeForce RTX 2080 Super (Desktop)
  (51 - 77.6, n=2)
64.3 fps -44%
Average AMD Radeon RX 5700 XT (Desktop)
 
59.6 fps -48%
1920x1080 Highest Settings
Nvidia GeForce RTX 3090 Founders Edition
NVIDIA GeForce RTX 3090, R9 5900X
161.1 fps +5%
Average NVIDIA GeForce RTX 3090
  (161 - 161.1, n=2)
161.1 fps +5%
AMD Radeon RX 6900 XT
AMD Radeon RX 6900 XT, R9 5950X
153 (60.9min, 98.1P0.1, 117P1 - 437max) fps
AMD Ryzen 9 5900X
NVIDIA Titan RTX, R9 5900X
144 fps -6%
AMD Radeon RX 6800 XT
AMD Radeon RX 6800 XT, R9 5950X
144 (58.7min, 90.7P0.1, 105P1 - 365max) fps -6%
Average NVIDIA Titan RTX
 
144 fps -6%
Average NVIDIA GeForce RTX 3080
 
127 fps -17%
MSI GeForce RTX 3070 Gaming X Trio
NVIDIA GeForce RTX 3070, R9 5900X
122 (45min, 57.3P0.1, 67.9P1 - 301max) fps -20%
Average NVIDIA GeForce RTX 2080 Ti (Desktop)
 
118 fps -23%
Average NVIDIA GeForce RTX 3070
  (95.7 - 122, n=3)
112.6 fps -26%
Average NVIDIA GeForce RTX 2070 Super (Desktop)
 
92.7 fps -39%
Average NVIDIA GeForce RTX 2080 Super (Desktop)
  (59 - 106, n=2)
82.5 fps -46%
Average AMD Radeon RX 5700 XT (Desktop)
 
81.3 fps -47%
Metro Exodus
1920x1080 Ultra Quality DXR AF:16x
Average NVIDIA GeForce RTX 3090
  (68.6 - 122.2, n=12)
111.4 fps +23%
Average NVIDIA GeForce RTX 3080
  (91.5 - 102, n=2)
96.8 fps +7%
ASUS GeForce RTX 3080 ROG STRIX OC GAMING
NVIDIA GeForce RTX 3080, R9 5900X
91.5 (51.03min - 134.52max) fps +1%
AMD Radeon RX 6900 XT
AMD Radeon RX 6900 XT, R9 5950X
90.5 (55.53min - 126.79max) fps
AMD Ryzen 9 5900X
NVIDIA Titan RTX, R9 5900X
87.9 (49.32min - 136.76max) fps -3%
Average NVIDIA Titan RTX
  (69 - 95.5, n=23)
86.1 fps -5%
AMD Radeon RX 6800 XT
AMD Radeon RX 6800 XT, R9 5950X
85.5 (52.71min - 120.38max) fps -6%
Average NVIDIA GeForce RTX 2080 Ti (Desktop)
  (78.6 - 84.9, n=3)
81.8 fps -10%
Average NVIDIA GeForce RTX 3070
  (80.4 - 83, n=5)
81.6 fps -10%
MSI GeForce RTX 3070 Gaming X Trio
NVIDIA GeForce RTX 3070, R9 5900X
80.4 (43.5min - 124.3max) fps -11%
KFA2 GeForce RTX 2080 Ti EX
NVIDIA GeForce RTX 2080 Ti (Desktop), R9 3900X
78.6 (43min - 115max) fps -13%
Nvidia GeForce RTX 3090 Founders Edition
NVIDIA GeForce RTX 3090, R9 5900X
68.6 (37.68min - 117.88max) fps -24%
Nvidia GeForce RTX 2080 Super
NVIDIA GeForce RTX 2080 Super (Desktop), R7 2700X
65 (37.62min - 97.62max) fps -28%
Average NVIDIA GeForce RTX 2080 Super (Desktop)
 
65 fps -28%
Average NVIDIA GeForce RTX 2070 Super (Desktop)
  (56.3 - 62.1, n=4)
58.5 fps -35%
Nvidia GeForce RTX 2070 Super
NVIDIA GeForce RTX 2070 Super (Desktop), R7 2700X
57.5 (34min - 85max) fps -36%
3840x2160 Ultra Quality AF:16x
Average NVIDIA GeForce RTX 3090
  (70.6 - 77.3, n=12)
75 fps +12%
Nvidia GeForce RTX 3090 Founders Edition
NVIDIA GeForce RTX 3090, R9 5900X
70.6 (41.43min - 118.98max) fps +6%
AMD Radeon RX 6900 XT
AMD Radeon RX 6900 XT, R9 5950X
66.7 (42.71min - 92.25max) fps
Average NVIDIA GeForce RTX 3080
  (64.1 - 65.9, n=2)
65 fps -3%
ASUS GeForce RTX 3080 ROG STRIX OC GAMING
NVIDIA GeForce RTX 3080, R9 5900X
64.1 (36.54min - 108.57max) fps -4%
AMD Radeon RX 6800 XT
AMD Radeon RX 6800 XT, R9 5950X
56.3 (40.14min - 64.28max) fps -16%
AMD Ryzen 9 5900X
NVIDIA Titan RTX, R9 5900X
54.9 (34.88min - 89.73max) fps -18%
Average NVIDIA Titan RTX
  (51.3 - 57.9, n=27)
54.9 fps -18%
Average NVIDIA GeForce RTX 2080 Ti (Desktop)
  (47.5 - 51, n=3)
49.7 fps -25%
MSI GeForce RTX 3070 Gaming X Trio
NVIDIA GeForce RTX 3070, R9 5900X
49.1 (30.24min - 89.89max) fps -26%
Average NVIDIA GeForce RTX 3070
  (48.3 - 49.7, n=5)
48.9 fps -27%
KFA2 GeForce RTX 2080 Ti EX
NVIDIA GeForce RTX 2080 Ti (Desktop), R9 3900X
47.5 (31min - 69max) fps -29%
Average NVIDIA GeForce RTX 2080 Super (Desktop)
  (40 - 40.4, n=2)
40.2 fps -40%
Nvidia GeForce RTX 2080 Super
NVIDIA GeForce RTX 2080 Super (Desktop), R7 2700X
40 (25.84min - 59.35max) fps -40%
Average NVIDIA GeForce RTX 2070 Super (Desktop)
  (35 - 38.1, n=5)
36.8 fps -45%
Nvidia GeForce RTX 2070 Super
NVIDIA GeForce RTX 2070 Super (Desktop), R7 2700X
35 (23min - 51max) fps -48%
Average AMD Radeon RX 5700 XT (Desktop)
  (29.6 - 35.7, n=3)
33.6 fps -50%
AMD Radeon RX 5700 XT
AMD Radeon RX 5700 XT (Desktop), R7 2700X
29.6 (20.7min - 36.64max) fps -56%
AMD Radeon RX 5700
AMD Radeon RX 5700 (Desktop), R7 2700X
28.6 (19.67min - 36.24max) fps -57%
2560x1440 Ultra Quality AF:16x
Average NVIDIA GeForce RTX 3090
  (102 - 118.2, n=12)
113.2 fps +11%
Nvidia GeForce RTX 3090 Founders Edition
NVIDIA GeForce RTX 3090, R9 5900X
106 (54.88min - 173.25max) fps +4%
AMD Radeon RX 6900 XT
AMD Radeon RX 6900 XT, R9 5950X
102 (59.52min - 156.84max) fps
Average NVIDIA GeForce RTX 3080
  (92.2 - 97.4, n=2)
94.8 fps -7%
AMD Radeon RX 6800 XT
AMD Radeon RX 6800 XT, R9 5950X
94.6 (55.44min - 143.68max) fps -7%
ASUS GeForce RTX 3080 ROG STRIX OC GAMING
NVIDIA GeForce RTX 3080, R9 5900X
92.2 (46.62min - 155.93max) fps -10%
AMD Ryzen 9 5900X
NVIDIA Titan RTX, R9 5900X
84.9 (46.03min - 152.65max) fps -17%
Average NVIDIA Titan RTX
  (69 - 92.9, n=26)
84 fps -18%
Average NVIDIA GeForce RTX 3070
  (74.4 - 78.3, n=5)
75.8 fps -26%
Average NVIDIA GeForce RTX 2080 Ti (Desktop)
  (71.9 - 77.9, n=3)
75.3 fps -26%
MSI GeForce RTX 3070 Gaming X Trio
NVIDIA GeForce RTX 3070, R9 5900X
74.4 (38.95min - 129.85max) fps -27%
KFA2 GeForce RTX 2080 Ti EX
NVIDIA GeForce RTX 2080 Ti (Desktop), R9 3900X
71.9 (40min - 108max) fps -30%
Average NVIDIA GeForce RTX 2080 Super (Desktop)
  (61 - 65, n=2)
63 fps -38%
Nvidia GeForce RTX 2080 Super
NVIDIA GeForce RTX 2080 Super (Desktop), R7 2700X
61 (35.51min - 95.82max) fps -40%
Average NVIDIA GeForce RTX 2070 Super (Desktop)
  (54.3 - 61.9, n=5)
57.6 fps -44%
Average AMD Radeon RX 5700 XT (Desktop)
  (54.5 - 57.7, n=3)
56.4 fps -45%
AMD Radeon RX 5700 XT
AMD Radeon RX 5700 XT (Desktop), R7 2700X
54.5 (31.85min - 78.06max) fps -47%
Nvidia GeForce RTX 2070 Super
NVIDIA GeForce RTX 2070 Super (Desktop), R7 2700X
54.3 (32min - 83max) fps -47%
AMD Radeon RX 5700
AMD Radeon RX 5700 (Desktop), R7 2700X
48.4 (28.7min - 68.51max) fps -53%
1920x1080 Ultra Quality AF:16x
Average NVIDIA GeForce RTX 3090
  (108 - 145, n=12)
135.3 fps +10%
Nvidia GeForce RTX 3090 Founders Edition
NVIDIA GeForce RTX 3090, R9 5900X
124 (65.58min - 188.71max) fps +1%
AMD Radeon RX 6900 XT
AMD Radeon RX 6900 XT, R9 5950X
123 (67.67min - 199.52max) fps
AMD Radeon RX 6800 XT
AMD Radeon RX 6800 XT, R9 5950X
115 (64.52min - 181.92max) fps -7%
Average NVIDIA GeForce RTX 3080
  (111 - 116, n=2)
113.5 fps -8%
ASUS GeForce RTX 3080 ROG STRIX OC GAMING
NVIDIA GeForce RTX 3080, R9 5900X
111 (57.16min - 183.25max) fps -10%
AMD Ryzen 9 5900X
NVIDIA Titan RTX, R9 5900X
106 (52.66min - 176.55max) fps -14%
Average NVIDIA Titan RTX
  (73 - 116, n=27)
102.2 fps -17%
Average NVIDIA GeForce RTX 3070
  (91.3 - 97.7, n=5)
93.9 fps -24%
Average NVIDIA GeForce RTX 2080 Ti (Desktop)
  (89.7 - 98.6, n=3)
93.8 fps -24%
MSI GeForce RTX 3070 Gaming X Trio
NVIDIA GeForce RTX 3070, R9 5900X
91.3 (46.36min - 152.74max) fps -26%
KFA2 GeForce RTX 2080 Ti EX
NVIDIA GeForce RTX 2080 Ti (Desktop), R9 3900X
89.7 (46min - 140max) fps -27%
Average NVIDIA GeForce RTX 2080 Super (Desktop)
  (76 - 82, n=2)
79 fps -36%
Nvidia GeForce RTX 2080 Super
NVIDIA GeForce RTX 2080 Super (Desktop), R7 2700X
76 (38.54min - 122.4max) fps -38%
Average NVIDIA GeForce RTX 2070 Super (Desktop)
  (67.8 - 79.1, n=5)
72.3 fps -41%
Average AMD Radeon RX 5700 XT (Desktop)
  (61 - 73.8, n=3)
69.3 fps -44%
Nvidia GeForce RTX 2070 Super
NVIDIA GeForce RTX 2070 Super (Desktop), R7 2700X
67.8 (36min - 110max) fps -45%
AMD Radeon RX 5700 XT
AMD Radeon RX 5700 XT (Desktop), R7 2700X
61 (36.09min - 86.1max) fps -50%
AMD Radeon RX 5700
AMD Radeon RX 5700 (Desktop), R7 2700X
58.6 (32.67min - 85.8max) fps -52%

Memória de acesso inteligente AMD

Configurações BAR redimensionáveis na placa-mãe de criação MSI Prestige X570.

Memória de acesso inteligente (SAM) é o termo chique da AMD para registro de endereço base redimensionável (BAR), uma especificação PCIe que permite à CPU acessar a VRAM completa da GPU o tempo todo (originalmente limitada a 256 MB de memória GPU para compatibilidade com SO de 32 bits). Embora todas as GPUs RDNA 2 suportem SAM out-of-the-box, elas precisam ser emparelhadas com uma CPU Ryzen série 5000 e uma placa-mãe com um chipset B550 ou X570 (as CPUs Ryzen 3000 nestas placas-mãe são agora suportadas em https://hexus.net/tech/news/cpu/147498-amd-brings-smart-access-memory-ryzen-3000-series-cpus/ também). Você também pode ter que procurar por atualizações de BIOS (AGESA 1.1.0.0 ou mais recente) de seu fornecedor de placas-mãe que habilitem este recurso.

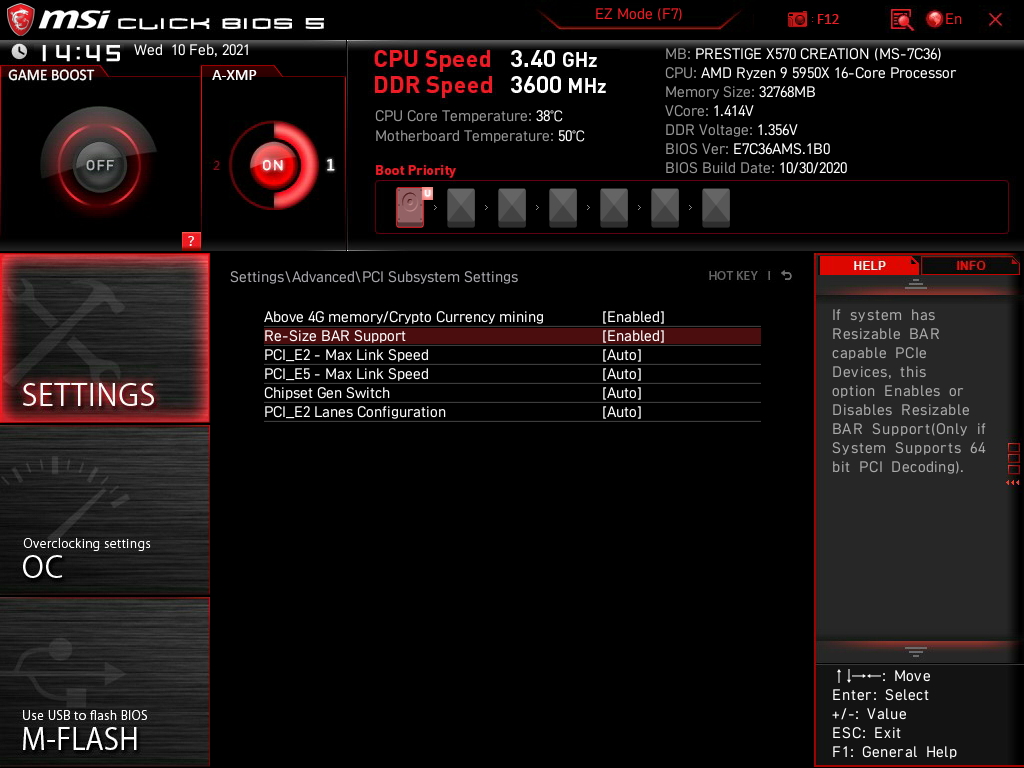
Para habilitar o SAM, você precisa navegar para o BIOS e habilitar tanto "Above 4G Memory/Crypto Currency Mining" quanto "Re-Size BAR Support" em PCIe Subsystem Settings. Infelizmente, não há maneira de verificar o status do SAM através do driver.

Enquanto a AMD parecia bastante entusiasmada com o SAM durante sua palestra principal de lançamento do Big Navi, os ganhos de desempenho no mundo real, se houver, são vistos apenas em uma mão cheia de jogos no momento. Em nossos testes, encontramos o SAM para oferecer aumentos marginais de fps em Borderlands 3 e Shadow of the Tomb Raider em configurações QHD Ultra e 4K Ultra

Entretanto, habilitando o SAM mostrou +18% a 1080p Ultra, +13% a 1440p Ultra, e +8% de ganhos a 4K Ultra em Assassin's Creed Valhalla. O SAM não parecia ser de nenhum benefício a 1080p Ultra no Forza Horizon 4, mas vemos +11% e +13% de benefícios a 1440p Ultra e 4K Ultra, respectivamente. F1 2020 mostrou apenas pequenos ganhos a 1080p Ultra. Jogos como o Control, Hitman 3e Cães de guarda Legion não mostrou nenhuma melhoria ou regressão de desempenho com o SAM ligado

Com todas as novas GPUs e placas-mãe agora suportando BAR redimensionáveis, esperamos que mais jogos aproveitem este recurso nos próximos dias.

Borderlands 3
3840x2160 Badass Overall Quality (DX11)
Average NVIDIA GeForce RTX 3090
  (68 - 75.3, n=12)
72.8 fps +22%
Nvidia GeForce RTX 3090 Founders Edition
NVIDIA GeForce RTX 3090, R9 5900X
68 fps +14%
Average NVIDIA GeForce RTX 3080
  (61.5 - 61.9, n=2)
61.7 fps +3%
ASUS GeForce RTX 3080 ROG STRIX OC GAMING
NVIDIA GeForce RTX 3080, R9 5900X
61.5 fps +3%
AMD Radeon RX 6900 XT
AMD Radeon RX 6900 XT, R9 5950X (SAM ENABLED)
59.8 fps
AMD Radeon RX 6900 XT
AMD Radeon RX 6900 XT, R9 5950X
57.1 fps -5%
AMD Radeon RX 6800 XT
AMD Radeon RX 6800 XT, R9 5950X
53.6 fps -10%
Average NVIDIA Titan RTX
  (46 - 52.8, n=29)
47.3 fps -21%
AMD Ryzen 9 5900X
NVIDIA Titan RTX, R9 5900X
46.7 fps -22%
Average NVIDIA GeForce RTX 2080 Ti (Desktop)
  (43.6 - 47, n=2)
45.3 fps -24%
Average NVIDIA GeForce RTX 3070
  (42.7 - 46.3, n=5)
44.3 fps -26%
MSI GeForce RTX 3070 Gaming X Trio
NVIDIA GeForce RTX 3070, R9 5900X
44.2 fps -26%
KFA2 GeForce RTX 2080 Ti EX
NVIDIA GeForce RTX 2080 Ti (Desktop), R9 3900X
43.6 fps -27%
Average NVIDIA GeForce RTX 2080 Super (Desktop)
 
35.9 fps -40%
Average NVIDIA GeForce RTX 2070 Super (Desktop)
  (29.5 - 32.7, n=5)
31.3 fps -48%
Average AMD Radeon RX 5700 XT (Desktop)
  (28.1 - 30.5, n=3)
29.6 fps -51%
2560x1440 Badass Overall Quality (DX11)
Average NVIDIA GeForce RTX 3090
  (105 - 131.6, n=12)
123.2 fps +15%
AMD Radeon RX 6900 XT
AMD Radeon RX 6900 XT, R9 5950X (SAM ENABLED)
107 fps
AMD Radeon RX 6900 XT
AMD Radeon RX 6900 XT, R9 5950X
105 fps -2%
Nvidia GeForce RTX 3090 Founders Edition
NVIDIA GeForce RTX 3090, R9 5900X
105 fps -2%
ASUS GeForce RTX 3080 ROG STRIX OC GAMING
NVIDIA GeForce RTX 3080, R9 5900X
103 fps -4%
Average NVIDIA GeForce RTX 3080
  (95.7 - 103, n=2)
99.4 fps -7%
AMD Radeon RX 6800 XT
AMD Radeon RX 6800 XT, R9 5950X
93.6 fps -13%
AMD Ryzen 9 5900X
NVIDIA Titan RTX, R9 5900X
84.7 fps -21%
Average NVIDIA Titan RTX
  (74 - 93.1, n=29)
84.7 fps -21%
Average NVIDIA GeForce RTX 2080 Ti (Desktop)
  (78 - 83, n=2)
80.5 fps -25%
KFA2 GeForce RTX 2080 Ti EX
NVIDIA GeForce RTX 2080 Ti (Desktop), R9 3900X
78 fps -27%
Average NVIDIA GeForce RTX 3070
  (75.1 - 82.9, n=5)
77.7 fps -27%
MSI GeForce RTX 3070 Gaming X Trio
NVIDIA GeForce RTX 3070, R9 5900X
75.9 fps -29%
Average NVIDIA GeForce RTX 2080 Super (Desktop)
 
65.5 fps -39%
Average NVIDIA GeForce RTX 2070 Super (Desktop)
  (53.7 - 60.3, n=5)
57.3 fps -46%
Average AMD Radeon RX 5700 XT (Desktop)
  (51.1 - 56.1, n=3)
54.3 fps -49%
1920x1080 Badass Overall Quality (DX11)
Average NVIDIA GeForce RTX 3090
  (117 - 165, n=12)
149.1 fps +14%
AMD Radeon RX 6900 XT
AMD Radeon RX 6900 XT, R9 5950X (SAM ENABLED)
131 fps
AMD Radeon RX 6900 XT
AMD Radeon RX 6900 XT, R9 5950X
130 fps -1%
ASUS GeForce RTX 3080 ROG STRIX OC GAMING
NVIDIA GeForce RTX 3080, R9 5900X
128 fps -2%
Average NVIDIA GeForce RTX 3080
  (117 - 128, n=2)
122.5 fps -6%
AMD Radeon RX 6800 XT
AMD Radeon RX 6800 XT, R9 5950X
120 fps -8%
Nvidia GeForce RTX 3090 Founders Edition
NVIDIA GeForce RTX 3090, R9 5900X
119 fps -9%
AMD Ryzen 9 5900X
NVIDIA Titan RTX, R9 5900X
118 fps -10%
Average NVIDIA Titan RTX
  (77.2 - 128.7, n=29)
112 fps -15%
Average NVIDIA GeForce RTX 2080 Ti (Desktop)
  (101.3 - 109, n=2)
105.2 fps -20%
KFA2 GeForce RTX 2080 Ti EX
NVIDIA GeForce RTX 2080 Ti (Desktop), R9 3900X
101.3 fps -23%
Average NVIDIA GeForce RTX 3070
  (95.3 - 108.9, n=5)
100.6 fps -23%
MSI GeForce RTX 3070 Gaming X Trio
NVIDIA GeForce RTX 3070, R9 5900X
95.8 fps -27%
Average NVIDIA GeForce RTX 2080 Super (Desktop)
 
91 fps -31%
Average NVIDIA GeForce RTX 2070 Super (Desktop)
  (74.3 - 86, n=5)
80.9 fps -38%
Average AMD Radeon RX 5700 XT (Desktop)
  (71.7 - 79.1, n=3)
76.6 fps -42%
Control
1920x1080 High Quality Preset & High Ray Tracing Preset (DX12)
Average NVIDIA GeForce RTX 3090
  (91.4 - 120.4, n=4)
108.2 fps +42%
Nvidia GeForce RTX 3090 Founders Edition
NVIDIA GeForce RTX 3090, R9 5900X
106.9 fps +40%
ASUS GeForce RTX 3080 ROG STRIX OC GAMING
NVIDIA GeForce RTX 3080, R9 5900X
103 (94min - 116max) fps +35%
Average NVIDIA GeForce RTX 3080
  (98.1 - 103, n=2)
100.6 fps +32%
Average NVIDIA Titan RTX
  (63 - 120, n=3)
88.1 fps +16%
AMD Radeon RX 6900 XT
AMD Radeon RX 6900 XT, R9 5950X (SAM ENABLED)
76.2 (38.7min, 43.3P0.1, 62.8P1 - 142max) fps
AMD Radeon RX 6900 XT
AMD Radeon RX 6900 XT, R9 5950X
73.1 (31.6min, 40.9P0.1, 62.6P1 - 149max) fps -4%
Average NVIDIA GeForce RTX 2080 Ti (Desktop)
  (72 - 76, n=2)
74 fps -3%
KFA2 GeForce RTX 2080 Ti EX
NVIDIA GeForce RTX 2080 Ti (Desktop), R9 3900X
72 (67min - 80max) fps -6%
Average NVIDIA GeForce RTX 3070
  (57.9 - 75.1, n=3)
68.5 fps -10%
AMD Radeon RX 6800 XT
AMD Radeon RX 6800 XT, R9 5950X
66.9 (60min - 75max) fps -12%
MSI GeForce RTX 3070 Gaming X Trio
NVIDIA GeForce RTX 3070, R9 5900X
57.9 (29min - 79max) fps -24%
Average NVIDIA GeForce RTX 2080 Super (Desktop)
 
53.2 fps -30%
Average NVIDIA GeForce RTX 2070 Super (Desktop)
  (51.1 - 54.2, n=4)
52.7 fps -31%
3840x2160 High Quality Preset (DX11)
Average NVIDIA GeForce RTX 3090
  (61.3 - 66, n=4)
63 fps +15%
Nvidia GeForce RTX 3090 Founders Edition
NVIDIA GeForce RTX 3090, R9 5900X
61.3 fps +12%
Average NVIDIA GeForce RTX 3080
  (56.2 - 56.7, n=2)
56.5 fps +3%
ASUS GeForce RTX 3080 ROG STRIX OC GAMING
NVIDIA GeForce RTX 3080, R9 5900X
56.2 (49min - 64max) fps +3%
AMD Radeon RX 6900 XT
AMD Radeon RX 6900 XT, R9 5950X
54.7 (39.8min, 41.7P0.1, 44.9P1 - 65.8max) fps
AMD Radeon RX 6900 XT
AMD Radeon RX 6900 XT, R9 5950X (SAM ENABLED)
53.9 (36.6min, 41.7P0.1, 43.5P1 - 64.9max) fps -1%
AMD Radeon RX 6800 XT
AMD Radeon RX 6800 XT, R9 5950X
51.6 (46min - 58max) fps -6%
Average NVIDIA Titan RTX
  (45.2 - 47.3, n=3)
46.5 fps -15%
Average NVIDIA GeForce RTX 2080 Ti (Desktop)
  (42.6 - 45.8, n=2)
44.2 fps -19%
KFA2 GeForce RTX 2080 Ti EX
NVIDIA GeForce RTX 2080 Ti (Desktop), R9 3900X
42.6 (37min - 49max) fps -22%
MSI GeForce RTX 3070 Gaming X Trio
NVIDIA GeForce RTX 3070, R9 5900X
42.3 (37min - 49max) fps -23%
Average NVIDIA GeForce RTX 3070
  (40.6 - 42.3, n=3)
41.3 fps -24%
Average AMD Radeon RX 5700 XT (Desktop)
  (26.3 - 55.2, n=2)
40.8 fps -25%
Average NVIDIA GeForce RTX 2080 Super (Desktop)
 
30.4 fps -44%
Average NVIDIA GeForce RTX 2070 Super (Desktop)
  (29.2 - 30.7, n=4)
30.1 fps -45%
2560x1440 High Quality Preset (DX11)
Average NVIDIA GeForce RTX 3090
  (115.8 - 123.7, n=4)
120.1 fps +6%
Nvidia GeForce RTX 3090 Founders Edition
NVIDIA GeForce RTX 3090, R9 5900X
115.8 fps +2%
AMD Radeon RX 6900 XT
AMD Radeon RX 6900 XT, R9 5950X
113 (71.5min, 73.2P0.1, 79.6P1 - 164max) fps
AMD Radeon RX 6900 XT
AMD Radeon RX 6900 XT, R9 5950X (SAM ENABLED)
113 (68min, 71.3P0.1, 81.1P1 - 193max) fps 0%
AMD Radeon RX 6800 XT
AMD Radeon RX 6800 XT, R9 5950X
108 (93min - 123max) fps -4%
ASUS GeForce RTX 3080 ROG STRIX OC GAMING
NVIDIA GeForce RTX 3080, R9 5900X
106 (92min - 123max) fps -6%
Average NVIDIA GeForce RTX 3080
  (105 - 106, n=2)
105.5 fps -7%
Average NVIDIA Titan RTX
  (89 - 93.6, n=3)
91.5 fps -19%
Average NVIDIA GeForce RTX 2080 Ti (Desktop)
  (84 - 89, n=2)
86.5 fps -23%
KFA2 GeForce RTX 2080 Ti EX
NVIDIA GeForce RTX 2080 Ti (Desktop), R9 3900X
84 (75min - 95max) fps -26%
MSI GeForce RTX 3070 Gaming X Trio
NVIDIA GeForce RTX 3070, R9 5900X
82.5 (72min - 96max) fps -27%
Average NVIDIA GeForce RTX 3070
  (79.8 - 82.5, n=3)
81.2 fps -28%
Average AMD Radeon RX 5700 XT (Desktop)
  (53.4 - 91, n=2)
72.2 fps -36%
Average NVIDIA GeForce RTX 2080 Super (Desktop)
 
62 fps -45%
Average NVIDIA GeForce RTX 2070 Super (Desktop)
  (56.9 - 62.6, n=4)
60.6 fps -46%
1920x1080 High Quality Preset (DX11)
Average NVIDIA GeForce RTX 3090
  (172.2 - 189.2, n=4)
178.1 fps +2%
AMD Radeon RX 6900 XT
AMD Radeon RX 6900 XT, R9 5950X
175 (56.8min, 96P0.1, 112P1 - 314max) fps
AMD Radeon RX 6900 XT
AMD Radeon RX 6900 XT, R9 5950X (SAM ENABLED)
174 (54min, 99P0.1, 112P1 - 335max) fps -1%
Nvidia GeForce RTX 3090 Founders Edition
NVIDIA GeForce RTX 3090, R9 5900X
172.2 fps -2%
AMD Radeon RX 6800 XT
AMD Radeon RX 6800 XT, R9 5950X
168 (145min - 194max) fps -4%
ASUS GeForce RTX 3080 ROG STRIX OC GAMING
NVIDIA GeForce RTX 3080, R9 5900X
155 (133min - 178max) fps -11%
Average NVIDIA GeForce RTX 3080
  (151 - 155, n=2)
153 fps -13%
Average NVIDIA Titan RTX
  (135 - 141.9, n=3)
137.3 fps -22%
Average NVIDIA GeForce RTX 2080 Ti (Desktop)
  (126 - 132, n=2)
129 fps -26%
KFA2 GeForce RTX 2080 Ti EX
NVIDIA GeForce RTX 2080 Ti (Desktop), R9 3900X
126 (111min - 143max) fps -28%
MSI GeForce RTX 3070 Gaming X Trio
NVIDIA GeForce RTX 3070, R9 5900X
122 (103min - 138max) fps -30%
Average NVIDIA GeForce RTX 3070
  (117 - 124.9, n=3)
121.3 fps -31%
Average AMD Radeon RX 5700 XT (Desktop)
  (83 - 121.9, n=2)
102.5 fps -41%
Average NVIDIA GeForce RTX 2080 Super (Desktop)
 
95 fps -46%
Average NVIDIA GeForce RTX 2070 Super (Desktop)
  (88 - 97.3, n=4)
93.3 fps -47%
Assassin´s Creed Valhalla
3840x2160 Ultra High Preset
AMD Radeon RX 6900 XT
AMD Radeon RX 6900 XT, R9 5950X (SAM ENABLED)
68 (33min - 230max) fps
AMD Radeon RX 6900 XT
AMD Radeon RX 6900 XT, R9 5950X
63 (32min - 219max) fps -7%
AMD Radeon RX 6800 XT
AMD Radeon RX 6800 XT, R9 5950X
65 (33min - 179max) fps -4%
Nvidia GeForce RTX 3090 Founders Edition
NVIDIA GeForce RTX 3090, R9 5900X
57 (36min - 113max) fps -16%
Average NVIDIA GeForce RTX 3090
  (55 - 57, n=2)
56 fps -18%
Average NVIDIA GeForce RTX 3080
 
52 fps -24%
MSI GeForce RTX 3070 Gaming X Trio
NVIDIA GeForce RTX 3070, R9 5900X
47 (31min - 92max) fps -31%
Average NVIDIA GeForce RTX 2080 Ti (Desktop)
 
46 fps -32%
Average NVIDIA GeForce RTX 3070
  (42 - 47, n=3)
44 fps -35%
AMD Ryzen 9 5900X
NVIDIA Titan RTX, R9 5900X
43 fps -37%
Average NVIDIA Titan RTX
 
43 fps -37%
Average NVIDIA GeForce RTX 2080 Super (Desktop)
 
36 fps -47%
Average AMD Radeon RX 5700 XT (Desktop)
 
33 fps -51%
Average NVIDIA GeForce RTX 2070 Super (Desktop)
 
32 fps -53%
2560x1440 Ultra High Preset
AMD Radeon RX 6900 XT
AMD Radeon RX 6900 XT, R9 5950X (SAM ENABLED)
115 (41min - 242max) fps
AMD Radeon RX 6900 XT
AMD Radeon RX 6900 XT, R9 5950X
102 (40min - 239max) fps -11%
AMD Radeon RX 6800 XT
AMD Radeon RX 6800 XT, R9 5950X
98 (25min - 211max) fps -15%
Nvidia GeForce RTX 3090 Founders Edition
NVIDIA GeForce RTX 3090, R9 5900X
79 (44min - 135max) fps -31%
Average NVIDIA GeForce RTX 3090
  (76 - 79, n=2)
77.5 fps -33%
Average NVIDIA GeForce RTX 3080
 
76 fps -34%
MSI GeForce RTX 3070 Gaming X Trio
NVIDIA GeForce RTX 3070, R9 5900X
67 (39min - 124max) fps -42%
Average NVIDIA GeForce RTX 2080 Ti (Desktop)
 
67 fps -42%
AMD Ryzen 9 5900X
NVIDIA Titan RTX, R9 5900X
66 fps -43%
Average NVIDIA Titan RTX
 
66 fps -43%
Average NVIDIA GeForce RTX 3070
  (65 - 67, n=3)
65.7 fps -43%
Average AMD Radeon RX 5700 XT (Desktop)
 
59 fps -49%
Average NVIDIA GeForce RTX 2080 Super (Desktop)
 
57 fps -50%
Average NVIDIA GeForce RTX 2070 Super (Desktop)
 
53 fps -54%
1920x1080 Ultra High Preset
AMD Radeon RX 6900 XT
AMD Radeon RX 6900 XT, R9 5950X (SAM ENABLED)
148 (44min - 248max) fps
AMD Radeon RX 6900 XT
AMD Radeon RX 6900 XT, R9 5950X
125 (43min - 252max) fps -16%
AMD Radeon RX 6800 XT
AMD Radeon RX 6800 XT, R9 5950X
118 (29min - 255max) fps -20%
Nvidia GeForce RTX 3090 Founders Edition
NVIDIA GeForce RTX 3090, R9 5900X
91 (48min - 158max) fps -39%
Average NVIDIA GeForce RTX 3090
  (88 - 91, n=2)
89.5 fps -40%
Average NVIDIA GeForce RTX 3080
 
88 fps -41%
AMD Ryzen 9 5900X
NVIDIA Titan RTX, R9 5900X
80 fps -46%
Average NVIDIA GeForce RTX 2080 Ti (Desktop)
 
80 fps -46%
Average NVIDIA Titan RTX
 
80 fps -46%
Average NVIDIA GeForce RTX 3070
  (77 - 80, n=3)
78.3 fps -47%
MSI GeForce RTX 3070 Gaming X Trio
NVIDIA GeForce RTX 3070, R9 5900X
78 (15min - 139max) fps -47%
Average AMD Radeon RX 5700 XT (Desktop)
 
78 fps -47%
Average NVIDIA GeForce RTX 2080 Super (Desktop)
 
70 fps -53%
Average NVIDIA GeForce RTX 2070 Super (Desktop)
 
66 fps -55%
Shadow of the Tomb Raider
3840x2160 Highest Preset AA:T
Average NVIDIA GeForce RTX 3090
  (89.3 - 99.7, n=12)
96.4 fps +12%
Nvidia GeForce RTX 3090 Founders Edition
NVIDIA GeForce RTX 3090, R9 5900X
94 fps +9%
AMD Radeon RX 6900 XT
AMD Radeon RX 6900 XT, R9 5950X (SAM ENABLED)
86 fps
AMD Radeon RX 6900 XT
AMD Radeon RX 6900 XT, R9 5950X
84 fps -2%
Average NVIDIA GeForce RTX 3080
  (83.9 - 87.9, n=2)
85.9 fps 0%
ASUS GeForce RTX 3080 ROG STRIX OC GAMING
NVIDIA GeForce RTX 3080, R9 5900X
83.9 fps -2%
AMD Radeon RX 6800 XT
AMD Radeon RX 6800 XT, R9 5950X
79.6 fps -7%
Average NVIDIA Titan RTX
  (59 - 71.1, n=24)
66.9 fps -22%
AMD Ryzen 9 5900X
NVIDIA Titan RTX, R9 5900X
66.3 fps -23%
Average NVIDIA GeForce RTX 3070
  (61 - 63.5, n=4)
62.3 fps -28%
MSI GeForce RTX 3070 Gaming X Trio
NVIDIA GeForce RTX 3070, R9 5900X
61 fps -29%
Average NVIDIA GeForce RTX 2080 Ti (Desktop)
  (60 - 61, n=2)
60.5 fps -30%
KFA2 GeForce RTX 2080 Ti EX
NVIDIA GeForce RTX 2080 Ti (Desktop), R9 3900X
60 fps -30%
Nvidia GeForce RTX 2080 Super
NVIDIA GeForce RTX 2080 Super (Desktop), R7 2700X
49 fps -43%
Average NVIDIA GeForce RTX 2080 Super (Desktop)
  (49 - 49, n=2)
49 fps -43%
Average NVIDIA GeForce RTX 2070 Super (Desktop)
  (43 - 47.9, n=5)
45.5 fps -47%
Nvidia GeForce RTX 2070 Super
NVIDIA GeForce RTX 2070 Super (Desktop), R7 2700X
43 fps -50%
AMD Radeon RX 5700 XT
AMD Radeon RX 5700 XT (Desktop), R7 2700X
38 fps -56%
Average AMD Radeon RX 5700 XT (Desktop)
  (32 - 40.9, n=4)
37.9 fps -56%
AMD Radeon RX 5700
AMD Radeon RX 5700 (Desktop), R7 2700X
34 fps -60%
2560x1440 Highest Preset AA:T
Average NVIDIA GeForce RTX 3090
  (137 - 172.3, n=12)
165.6 fps +2%
AMD Radeon RX 6900 XT
AMD Radeon RX 6900 XT, R9 5950X (SAM ENABLED)
163 fps
AMD Radeon RX 6900 XT
AMD Radeon RX 6900 XT, R9 5950X
155 fps -5%
Nvidia GeForce RTX 3090 Founders Edition
NVIDIA GeForce RTX 3090, R9 5900X
159 fps -2%
Average NVIDIA GeForce RTX 3080
  (147 - 152, n=2)
149.5 fps -8%
AMD Radeon RX 6800 XT
AMD Radeon RX 6800 XT, R9 5950X
148 fps -9%
ASUS GeForce RTX 3080 ROG STRIX OC GAMING
NVIDIA GeForce RTX 3080, R9 5900X
147 fps -10%
AMD Ryzen 9 5900X
NVIDIA Titan RTX, R9 5900X
120 fps -26%
Average NVIDIA Titan RTX
  (98 - 128, n=23)
117.8 fps -28%
Average NVIDIA GeForce RTX 3070
  (108 - 116, n=4)
113.2 fps -31%
Average NVIDIA GeForce RTX 2080 Ti (Desktop)
  (108 - 112, n=2)
110 fps -33%
KFA2 GeForce RTX 2080 Ti EX
NVIDIA GeForce RTX 2080 Ti (Desktop), R9 3900X
108 fps -34%
MSI GeForce RTX 3070 Gaming X Trio
NVIDIA GeForce RTX 3070, R9 5900X
108 fps -34%
Average NVIDIA GeForce RTX 2080 Super (Desktop)
  (91 - 92, n=2)
91.5 fps -44%
Nvidia GeForce RTX 2080 Super
NVIDIA GeForce RTX 2080 Super (Desktop), R7 2700X
91 fps -44%
Average NVIDIA GeForce RTX 2070 Super (Desktop)
  (81 - 89.6, n=5)
85.4 fps -48%
Nvidia GeForce RTX 2070 Super
NVIDIA GeForce RTX 2070 Super (Desktop), R7 2700X
81 fps -50%
AMD Radeon RX 5700 XT
AMD Radeon RX 5700 XT (Desktop), R7 2700X
76 fps -53%
Average AMD Radeon RX 5700 XT (Desktop)
  (61 - 79.2, n=4)
73.8 fps -55%
AMD Radeon RX 5700
AMD Radeon RX 5700 (Desktop), R7 2700X
68 fps -58%
1920x1080 Highest Preset AA:T
Average NVIDIA GeForce RTX 3090
  (145 - 240, n=14)
204 fps +1%
AMD Radeon RX 6900 XT
AMD Radeon RX 6900 XT, R9 5950X
202 fps
AMD Radeon RX 6900 XT
AMD Radeon RX 6900 XT, R9 5950X (SAM ENABLED)
199 fps -1%
AMD Radeon RX 6800 XT
AMD Radeon RX 6800 XT, R9 5950X
194 fps -4%
Nvidia GeForce RTX 3090 Founders Edition
NVIDIA GeForce RTX 3090, R9 5900X
187 fps -7%
ASUS GeForce RTX 3080 ROG STRIX OC GAMING
NVIDIA GeForce RTX 3080, R9 5900X
185 fps -8%
Average NVIDIA GeForce RTX 3080
  (177 - 185, n=2)
181 fps -10%
AMD Ryzen 9 5900X
NVIDIA Titan RTX, R9 5900X
166 fps -18%
Average NVIDIA GeForce RTX 3070
  (138 - 160, n=4)
151.3 fps -25%
Average NVIDIA Titan RTX
  (106 - 178.8, n=24)
149.5 fps -26%
MSI GeForce RTX 3070 Gaming X Trio
NVIDIA GeForce RTX 3070, R9 5900X
138 fps -32%
Average NVIDIA GeForce RTX 2080 Ti (Desktop)
  (130 - 142, n=2)
136 fps -33%
KFA2 GeForce RTX 2080 Ti EX
NVIDIA GeForce RTX 2080 Ti (Desktop), R9 3900X
130 fps -36%
Average NVIDIA GeForce RTX 2070 Super (Desktop)
  (104 - 131.1, n=5)
119.7 fps -41%
Average NVIDIA GeForce RTX 2080 Super (Desktop)
  (110 - 118, n=2)
114 fps -44%
Average AMD Radeon RX 5700 XT (Desktop)
  (89 - 119, n=6)
110.8 fps -45%
Nvidia GeForce RTX 2080 Super
NVIDIA GeForce RTX 2080 Super (Desktop), R7 2700X
110 fps -46%
AMD Radeon RX 5700 XT
AMD Radeon RX 5700 XT (Desktop), R7 2700X
110 fps -46%
Nvidia GeForce RTX 2070 Super
NVIDIA GeForce RTX 2070 Super (Desktop), R7 2700X
104 fps -49%
AMD Radeon RX 5700
AMD Radeon RX 5700 (Desktop), R7 2700X
90 fps -55%
Forza Horizon 4
3840x2160 Ultra Preset AA:2xMS
AMD Radeon RX 6900 XT
AMD Radeon RX 6900 XT, R9 5950X (SAM ENABLED)
172 fps
AMD Radeon RX 6900 XT
AMD Radeon RX 6900 XT, R9 5950X
152 fps -12%
Average NVIDIA GeForce RTX 3090
 
147 fps -15%
Average NVIDIA Titan RTX
  (90 - 121, n=17)
112.9 fps -34%
KFA2 GeForce RTX 2080 Ti EX
NVIDIA GeForce RTX 2080 Ti (Desktop), R9 3900X
107 fps -38%
Average NVIDIA GeForce RTX 2080 Ti (Desktop)
  (98 - 111, n=3)
105.3 fps -39%
Average NVIDIA GeForce RTX 2070 Super (Desktop)
  (76 - 85, n=3)
81.7 fps -52%
Nvidia GeForce RTX 2080 Super
NVIDIA GeForce RTX 2080 Super (Desktop), R7 2700X
81 fps -53%
Average NVIDIA GeForce RTX 2080 Super (Desktop)
 
81 fps -53%
AMD Radeon RX 5700 XT
AMD Radeon RX 5700 XT (Desktop), R7 2700X
79 fps -54%
Average AMD Radeon RX 5700 XT (Desktop)
 
79 fps -54%
Nvidia GeForce RTX 2070 Super
NVIDIA GeForce RTX 2070 Super (Desktop), R7 2700X
76 fps -56%
AMD Radeon RX 5700
AMD Radeon RX 5700 (Desktop), R7 2700X
70 fps -59%
2560x1440 Ultra Preset AA:2xMS
AMD Radeon RX 6900 XT
AMD Radeon RX 6900 XT, R9 5950X (SAM ENABLED)
243 fps
AMD Radeon RX 6900 XT
AMD Radeon RX 6900 XT, R9 5950X
218 fps -10%
Average NVIDIA GeForce RTX 3090
 
164 fps -33%
Average NVIDIA Titan RTX
  (127 - 171, n=16)
154.8 fps -36%
KFA2 GeForce RTX 2080 Ti EX
NVIDIA GeForce RTX 2080 Ti (Desktop), R9 3900X
147 fps -40%
Average NVIDIA GeForce RTX 2080 Ti (Desktop)
  (131 - 150, n=3)
142.7 fps -41%
Average NVIDIA GeForce RTX 2070 Super (Desktop)
  (108 - 125, n=3)
119.3 fps -51%
AMD Radeon RX 5700 XT
AMD Radeon RX 5700 XT (Desktop), R7 2700X
119 fps -51%
Average AMD Radeon RX 5700 XT (Desktop)
 
119 fps -51%
Nvidia GeForce RTX 2080 Super
NVIDIA GeForce RTX 2080 Super (Desktop), R7 2700X
117 fps -52%
Average NVIDIA GeForce RTX 2080 Super (Desktop)
 
117 fps -52%
Nvidia GeForce RTX 2070 Super
NVIDIA GeForce RTX 2070 Super (Desktop), R7 2700X
108 fps -56%
AMD Radeon RX 5700
AMD Radeon RX 5700 (Desktop), R7 2700X
103 fps -58%
1920x1080 Ultra Preset AA:2xMS
AMD Radeon RX 6900 XT
AMD Radeon RX 6900 XT, R9 5950X
248 fps
AMD Radeon RX 6900 XT
AMD Radeon RX 6900 XT, R9 5950X (SAM ENABLED)
247 fps 0%
Average NVIDIA Titan RTX
  (129 - 196, n=17)
169.8 fps -32%
KFA2 GeForce RTX 2080 Ti EX
NVIDIA GeForce RTX 2080 Ti (Desktop), R9 3900X
168 fps -32%
Average NVIDIA GeForce RTX 3090
 
166 fps -33%
Average NVIDIA GeForce RTX 2080 Ti (Desktop)
  (153 - 169, n=3)
163.3 fps -34%
Average AMD Radeon RX 5700 XT (Desktop)
  (138 - 149, n=3)
145 fps -42%
Average NVIDIA GeForce RTX 2070 Super (Desktop)
  (129 - 153, n=3)
145 fps -42%
AMD Radeon RX 5700 XT
AMD Radeon RX 5700 XT (Desktop), R7 2700X
138 fps -44%
Nvidia GeForce RTX 2080 Super
NVIDIA GeForce RTX 2080 Super (Desktop), R7 2700X
133 fps -46%
Average NVIDIA GeForce RTX 2080 Super (Desktop)
 
133 fps -46%
Nvidia GeForce RTX 2070 Super
NVIDIA GeForce RTX 2070 Super (Desktop), R7 2700X
129 fps -48%
AMD Radeon RX 5700
AMD Radeon RX 5700 (Desktop), R7 2700X
118 fps -52%
Hitman 3
3840x2160 Maximum Settings AF:16x
AMD Radeon RX 6900 XT
AMD Radeon RX 6900 XT, R9 5950X
128.4 fps
AMD Radeon RX 6900 XT
AMD Radeon RX 6900 XT, R9 5950X (SAM ENABLED)
127.8 fps 0%
Average NVIDIA GeForce RTX 3090
  (115 - 122, n=2)
118.5 fps -8%
Nvidia GeForce RTX 3090 Founders Edition
NVIDIA GeForce RTX 3090, R9 5900X
115 fps -10%
Average NVIDIA GeForce RTX 3080
 
109 fps -15%
Average NVIDIA GeForce RTX 2080 Ti (Desktop)
 
85.2 fps -34%
AMD Ryzen 9 5900X
NVIDIA Titan RTX, R9 5900X
82 fps -36%
Average NVIDIA Titan RTX
 
82 fps -36%
Average NVIDIA GeForce RTX 3070
 
77.5 fps -40%
Average NVIDIA GeForce RTX 2080 Super (Desktop)
 
64 fps -50%
Average NVIDIA GeForce RTX 2070 Super (Desktop)
 
55 fps -57%
Average AMD Radeon RX 5700 XT (Desktop)
 
53 fps -59%
2560x1440 Maximum Settings AF:16x
AMD Radeon RX 6900 XT
AMD Radeon RX 6900 XT, R9 5950X
213.1 fps
AMD Radeon RX 6900 XT
AMD Radeon RX 6900 XT, R9 5950X (SAM ENABLED)
213.1 fps 0%
Nvidia GeForce RTX 3090 Founders Edition
NVIDIA GeForce RTX 3090, R9 5900X
190 fps -11%
Average NVIDIA GeForce RTX 3090
  (166 - 190, n=2)
178 fps -16%
Average NVIDIA GeForce RTX 3080
 
164 fps -23%
Average NVIDIA GeForce RTX 2080 Ti (Desktop)
 
147 fps -31%
AMD Ryzen 9 5900X
NVIDIA Titan RTX, R9 5900X
145 fps -32%
Average NVIDIA Titan RTX
 
145 fps -32%
Average NVIDIA GeForce RTX 3070
 
140 fps -34%
Average NVIDIA GeForce RTX 2080 Super (Desktop)
 
115 fps -46%
Average NVIDIA GeForce RTX 2070 Super (Desktop)
 
101 fps -53%
Average AMD Radeon RX 5700 XT (Desktop)
 
95 fps -55%
1920x1080 Maximum Settings AF:16x
AMD Radeon RX 6900 XT
AMD Radeon RX 6900 XT, R9 5950X
276.2 fps
AMD Radeon RX 6900 XT
AMD Radeon RX 6900 XT, R9 5950X (SAM ENABLED)
269.4 fps -2%
Nvidia GeForce RTX 3090 Founders Edition
NVIDIA GeForce RTX 3090, R9 5900X
223 fps -19%
AMD Ryzen 9 5900X
NVIDIA Titan RTX, R9 5900X
202 fps -27%
Average NVIDIA Titan RTX
 
202 fps -27%
Average NVIDIA GeForce RTX 3090
  (167 - 223, n=2)
195 fps -29%
Average NVIDIA GeForce RTX 3080
 
166 fps -40%
Average NVIDIA GeForce RTX 2080 Super (Desktop)
 
166 fps -40%
Average NVIDIA GeForce RTX 3070
 
165 fps -40%
Average NVIDIA GeForce RTX 2080 Ti (Desktop)
 
162 fps -41%
Average NVIDIA GeForce RTX 2070 Super (Desktop)
 
148 fps -46%
Average AMD Radeon RX 5700 XT (Desktop)
 
141 fps -49%
Watch Dogs Legion
1920x1080 Ultra Preset + Ultra Ray Tracing (DX12)
Average NVIDIA GeForce RTX 3090
  (75.7 - 78.2, n=2)
77 fps +38%
Nvidia GeForce RTX 3090 Founders Edition
NVIDIA GeForce RTX 3090, R9 5900X
75.7 (33.41min, 58.92P1 - 126.05max) fps +36%
AMD Radeon RX 6800 XT
AMD Radeon RX 6800 XT, R9 5950X
71.4 (47.71min, 55.63P1 - 113.42max) fps +28%
Average NVIDIA GeForce RTX 3080
  (70.9 - 71.3, n=2)
71.1 fps +28%
ASUS GeForce RTX 3080 ROG STRIX OC GAMING
NVIDIA GeForce RTX 3080, R9 5900X
70.9 (37.64min, 58.05P1 - 113.63max) fps +28%
Average NVIDIA GeForce RTX 2080 Ti (Desktop)
 
55.8 fps 0%
AMD Radeon RX 6900 XT
AMD Radeon RX 6900 XT, R9 5950X
55.6 (35.81min, 41.86P1 - 76.28max) fps
AMD Radeon RX 6900 XT
AMD Radeon RX 6900 XT, R9 5950X (SAM ENABLED)
55.5 (36.48min, 43.27P1 - 76.42max) fps 0%
Average NVIDIA Titan RTX
 
55.4 fps 0%
Average NVIDIA GeForce RTX 3070
  (51.7 - 61, n=4)
55.1 fps -1%
MSI GeForce RTX 3070 Gaming X Trio
NVIDIA GeForce RTX 3070, R9 5900X
54.3 (18.74min, 40.53P1 - 81.06max) fps -2%
Average NVIDIA GeForce RTX 2080 Super (Desktop)
 
45.4 fps -18%
Average NVIDIA GeForce RTX 2070 Super (Desktop)
 
39.2 fps -29%
3840x2160 Ultra Preset (DX12)
Average NVIDIA GeForce RTX 3090
  (57.6 - 60.3, n=2)
59 fps +10%
Nvidia GeForce RTX 3090 Founders Edition
NVIDIA GeForce RTX 3090, R9 5900X
57.6 (24.58min, 45.93P1 - 114.36max) fps +7%
ASUS GeForce RTX 3080 ROG STRIX OC GAMING
NVIDIA GeForce RTX 3080, R9 5900X
54.1 (24.72min, 44.97P1 - 114.7max) fps +1%
Average NVIDIA GeForce RTX 3080
  (53.5 - 54.1, n=2)
53.8 fps 0%
AMD Radeon RX 6900 XT
AMD Radeon RX 6900 XT, R9 5950X (SAM ENABLED)
53.6 (34.78min, 44.93P1 - 72.47max) fps
AMD Radeon RX 6900 XT
AMD Radeon RX 6900 XT, R9 5950X
53.5 (33.75min, 44.2P1 - 82.3max) fps 0%
AMD Radeon RX 6800 XT
AMD Radeon RX 6800 XT, R9 5950X
49.3 (32.85min, 41.54P1 - 76.12max) fps -8%
Average NVIDIA GeForce RTX 2080 Ti (Desktop)
 
44 fps -18%
Average NVIDIA Titan RTX
 
43.4 fps -19%
Average NVIDIA GeForce RTX 3070
  (37 - 39.2, n=4)
38 fps -29%
MSI GeForce RTX 3070 Gaming X Trio
NVIDIA GeForce RTX 3070, R9 5900X
37 (17.44min, 25.32P1 - 81.3max) fps -31%
Average NVIDIA GeForce RTX 2080 Super (Desktop)
 
34.4 fps -36%
Average NVIDIA GeForce RTX 2070 Super (Desktop)
 
29.2 fps -46%
Average AMD Radeon RX 5700 XT (Desktop)
 
12.7 fps -76%
2560x1440 Ultra Preset (DX12)
AMD Radeon RX 6900 XT
AMD Radeon RX 6900 XT, R9 5950X (SAM ENABLED)
91.4 (38.16min, 73.25P1 - 135.95max) fps
AMD Radeon RX 6900 XT
AMD Radeon RX 6900 XT, R9 5950X
91.1 (31.59min, 72.21P1 - 151.03max) fps 0%
Average NVIDIA GeForce RTX 3090
  (88.3 - 89.7, n=2)
89 fps -3%
Nvidia GeForce RTX 3090 Founders Edition
NVIDIA GeForce RTX 3090, R9 5900X
88.3 (48.36min, 68.18P1 - 160.5max) fps -3%
AMD Radeon RX 6800 XT
AMD Radeon RX 6800 XT, R9 5950X
84.5 (58.88min, 69.45P1 - 137.16max) fps -8%
ASUS GeForce RTX 3080 ROG STRIX OC GAMING
NVIDIA GeForce RTX 3080, R9 5900X
81.6 (44.31min, 65.35P1 - 139.28max) fps -11%
Average NVIDIA GeForce RTX 3080
  (81.1 - 81.6, n=2)
81.4 fps -11%
Average NVIDIA GeForce RTX 2080 Ti (Desktop)
 
72.9 fps -20%
Average NVIDIA Titan RTX
 
69.9 fps -24%
Average NVIDIA GeForce RTX 3070
  (65.3 - 67, n=4)
66.1 fps -28%
MSI GeForce RTX 3070 Gaming X Trio
NVIDIA GeForce RTX 3070, R9 5900X
65.7 (25.01min, 51.86P1 - 96.9max) fps -28%
Average NVIDIA GeForce RTX 2080 Super (Desktop)
 
57.3 fps -37%
Average NVIDIA GeForce RTX 2070 Super (Desktop)
 
51.4 fps -44%
Average AMD Radeon RX 5700 XT (Desktop)
 
46.4 fps -49%
1920x1080 Ultra Preset (DX12)
AMD Radeon RX 6900 XT
AMD Radeon RX 6900 XT, R9 5950X (SAM ENABLED)
121 (67.26min, 95.56P1 - 184.97max) fps
AMD Radeon RX 6900 XT
AMD Radeon RX 6900 XT, R9 5950X
120 (81.32min, 93.02P1 - 209.32max) fps -1%
AMD Radeon RX 6800 XT
AMD Radeon RX 6800 XT, R9 5950X
112 (75.12min, 87.97P1 - 181.69max) fps -7%
Nvidia GeForce RTX 3090 Founders Edition
NVIDIA GeForce RTX 3090, R9 5900X
107 (24.35min, 77.46P1 - 174.03max) fps -12%
Average NVIDIA GeForce RTX 3090
  (103 - 107, n=2)
105 fps -13%
ASUS GeForce RTX 3080 ROG STRIX OC GAMING
NVIDIA GeForce RTX 3080, R9 5900X
103 (55.63min, 83.65P1 - 156.57max) fps -15%
Average NVIDIA GeForce RTX 3080
  (99.3 - 103, n=2)
101.2 fps -16%
Average NVIDIA GeForce RTX 2080 Ti (Desktop)
 
89.6 fps -26%
Average NVIDIA Titan RTX
 
85.5 fps -29%
Average NVIDIA GeForce RTX 3070
  (79 - 89, n=4)
84.7 fps -30%
MSI GeForce RTX 3070 Gaming X Trio
NVIDIA GeForce RTX 3070, R9 5900X
79 (42.91min, 56.59P1 - 121.27max) fps -35%
Average NVIDIA GeForce RTX 2080 Super (Desktop)
 
75.4 fps -38%
Average NVIDIA GeForce RTX 2070 Super (Desktop)
 
68.3 fps -44%
Average AMD Radeon RX 5700 XT (Desktop)
 
66.8 fps -45%
F1 2020
3840x2160 Ultra High Preset AA:T AF:16x
Average NVIDIA GeForce RTX 3090
  (133 - 149.6, n=10)
141.8 fps +4%
AMD Radeon RX 6900 XT
AMD Radeon RX 6900 XT, R9 5950X (SAM ENABLED)
137 (109min - 165max) fps
AMD Radeon RX 6900 XT
AMD Radeon RX 6900 XT, R9 5950X
136 (110min - 161max) fps -1%
Nvidia GeForce RTX 3090 Founders Edition
NVIDIA GeForce RTX 3090, R9 5900X
135 (116min - 157max) fps -1%
AMD Radeon RX 6800 XT
AMD Radeon RX 6800 XT, R9 5950X (704326)
128 (106min - 152max) fps -7%
ASUS GeForce RTX 3080 ROG STRIX OC GAMING
NVIDIA GeForce RTX 3080, R9 5900X (692646)
118 (102min - 137max) fps -14%
Average NVIDIA GeForce RTX 3080
  (114 - 118, n=2)
116 fps -15%
Average NVIDIA Titan RTX
  (97.4 - 103.4, n=6)
101.5 fps -26%
Average NVIDIA GeForce RTX 2080 Ti (Desktop)
 
100 fps -27%
Average NVIDIA GeForce RTX 3070
  (88.7 - 92.7, n=3)
90.2 fps -34%
MSI GeForce RTX 3070 Gaming X Trio
NVIDIA GeForce RTX 3070, R9 5900X (692646)
89.2 (73min - 104max) fps -35%
Average NVIDIA GeForce RTX 2080 Super (Desktop)
 
77.2 fps -44%
Average NVIDIA GeForce RTX 2070 Super (Desktop)
  (67.6 - 71.4, n=3)
69.2 fps -49%
Average AMD Radeon RX 5700 XT (Desktop)
  (47 - 65, n=4)
59.3 fps -57%
2560x1440 Ultra High Preset AA:T AF:16x
AMD Radeon RX 6900 XT
AMD Radeon RX 6900 XT, R9 5950X (SAM ENABLED)
228 (178min - 275max) fps
AMD Radeon RX 6900 XT
AMD Radeon RX 6900 XT, R9 5950X
220 (173min - 264max) fps -4%
Average NVIDIA GeForce RTX 3090
  (204 - 240, n=10)
226 fps -1%
AMD Radeon RX 6800 XT
AMD Radeon RX 6800 XT, R9 5950X (704326)
215 (166min - 264max) fps -6%
Nvidia GeForce RTX 3090 Founders Edition
NVIDIA GeForce RTX 3090, R9 5900X
207 (171min - 241max) fps -9%
Average NVIDIA Titan RTX
  (153 - 175.8, n=6)
167.4 fps -27%
Average NVIDIA GeForce RTX 2080 Ti (Desktop)
 
162 fps -29%
ASUS GeForce RTX 3080 ROG STRIX OC GAMING
NVIDIA GeForce RTX 3080, R9 5900X (692646)
155 (128min - 184max) fps -32%
Average NVIDIA GeForce RTX 3080
  (146 - 155, n=2)
150.5 fps -34%
Average NVIDIA GeForce RTX 3070
  (143 - 162.2, n=3)
150.4 fps -34%
MSI GeForce RTX 3070 Gaming X Trio
NVIDIA GeForce RTX 3070, R9 5900X (692646)
146 (121min - 168max) fps -36%
Average NVIDIA GeForce RTX 2080 Super (Desktop)
 
127 fps -44%
Average NVIDIA GeForce RTX 2070 Super (Desktop)
  (117.6 - 121.1, n=3)
118.9 fps -48%
Average AMD Radeon RX 5700 XT (Desktop)
  (80 - 109, n=4)
99.3 fps -56%
1920x1080 Ultra High Preset AA:T AF:16x
AMD Radeon RX 6900 XT
AMD Radeon RX 6900 XT, R9 5950X (SAM ENABLED)
291 (222min - 355max) fps
AMD Radeon RX 6900 XT
AMD Radeon RX 6900 XT, R9 5950X
275 (213min - 338max) fps -5%
AMD Radeon RX 6800 XT
AMD Radeon RX 6800 XT, R9 5950X (704326)
279 (211min - 345max) fps -4%
Average NVIDIA GeForce RTX 3090
  (227 - 311, n=10)
279 fps -4%
Nvidia GeForce RTX 3090 Founders Edition
NVIDIA GeForce RTX 3090, R9 5900X
250 (214min - 304max) fps -14%
Average NVIDIA Titan RTX
  (194 - 231, n=7)
216 fps -26%
Average NVIDIA GeForce RTX 2080 Ti (Desktop)
 
202 fps -31%
Average NVIDIA GeForce RTX 3070
  (179 - 215, n=3)
191.7 fps -34%
ASUS GeForce RTX 3080 ROG STRIX OC GAMING
NVIDIA GeForce RTX 3080, R9 5900X (692646)
185 (158min - 218max) fps -36%
Average NVIDIA GeForce RTX 3080
  (179 - 185, n=2)
182 fps -37%
MSI GeForce RTX 3070 Gaming X Trio
NVIDIA GeForce RTX 3070, R9 5900X (692646)
179 (153min - 213max) fps -38%
Average NVIDIA GeForce RTX 2080 Super (Desktop)
 
162 fps -44%
Average NVIDIA GeForce RTX 2070 Super (Desktop)
  (153 - 163, n=3)
157.4 fps -46%
Average AMD Radeon RX 5700 XT (Desktop)
  (108 - 149, n=4)
131.9 fps -55%
baixo média alto ultraQHD4K
The Witcher 3 (2015) 589 375 323 163.6 122
Shadow of the Tomb Raider (2018) 248 222 213 199 163 86
Forza Horizon 4 (2018) 350 283 279 247 243 172
Assassin´s Creed Odyssey (2018) 124 117 106 98 99 68
Battlefield V (2018) 196 195 196 197 196 134
Far Cry New Dawn (2019) 141 126 123 118 117 101
Metro Exodus (2019) 274 214 154 123 102 66.7
The Division 2 (2019) 217 190 157 138 118 66.6
Anno 1800 (2019) 223 162 139 87.1 70.7 52
Total War: Three Kingdoms (2019) 429.7 263 180.3 141.3 92.9 44.9
Control (2019) 240 234 174 113 53.9
Borderlands 3 (2019) 197 169 152 131 107 59.8
Red Dead Redemption 2 (2019) 208 196 150 98 82.1 54.6
Doom Eternal (2020) 624 480 416 411 328 185
Gears Tactics (2020) 495.8 338.1 249 175.1 136.4 74.1
F1 2020 (2020) 520 442 395 291 228 137
Horizon Zero Dawn (2020) 245 205 184 164 136 76
Mafia Definitive Edition (2020) 160 142 138 120 67
Watch Dogs Legion (2020) 191 190 170 121 91.4 53.6
Assassin´s Creed Valhalla (2020) 227 169 142 148 115 68
Call of Duty Black Ops Cold War (2020) 298 198 169 153 115 68.1
Immortals Fenyx Rising (2020) 139 126 127 122 121 83
Cyberpunk 2077 1.0 (2020) 160 152 127 106 72.3 34.8
Hitman 3 (2021) 352.8 283.2 279.9 269.4 213.1 127.8

Emissions

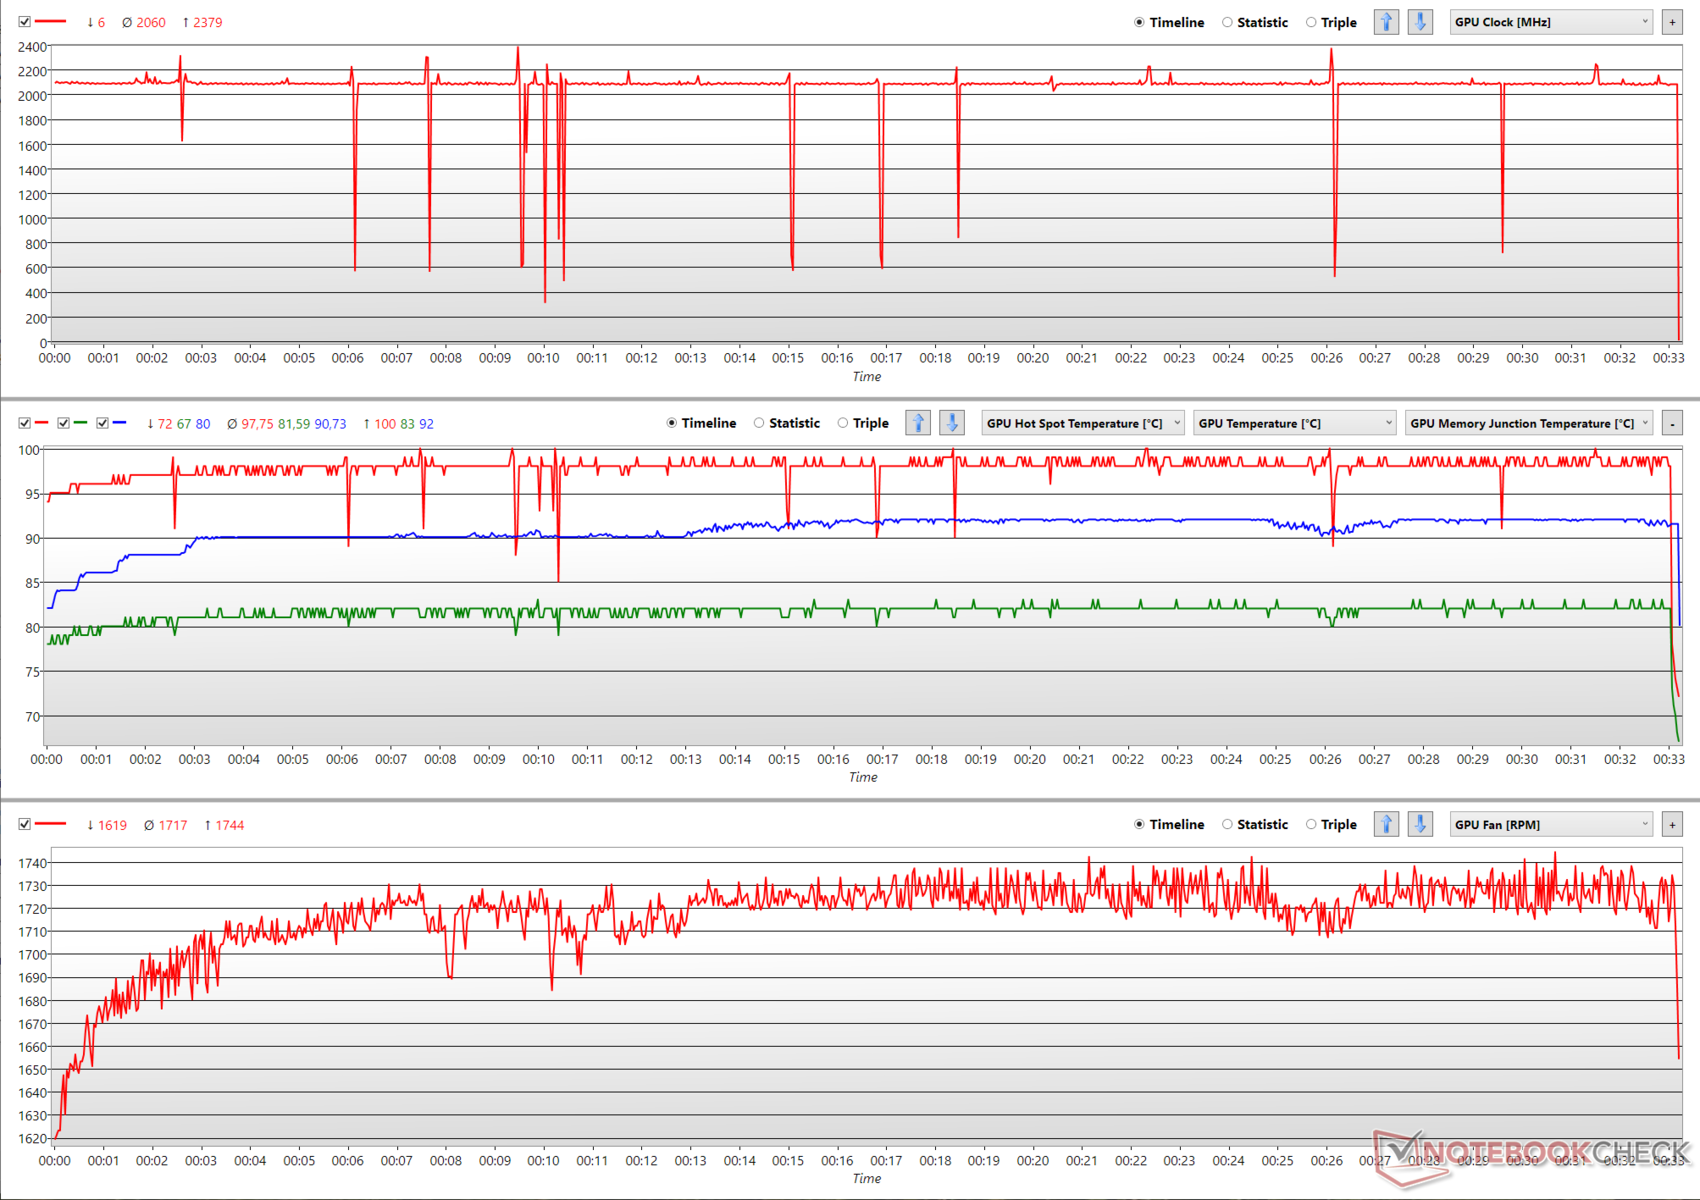
Com a série RX 6000, a AMD abandonou seu refrigerador tradicional estilo ventilador para um sistema de resfriamento com ventilador triplo mais capaz. Embora este novo resfriador definitivamente permita melhores relógios sustentados, encontramos a placa chegando mais perto da temperatura do ponto quente de 100 °C, muitas vezes sob tensão FurMark. O núcleo também funciona bastante quente a 82 °C

Na maioria das vezes, o RX 6900 XT pode oferecer um impulso bastante sustentado de 2.086 MHz e às vezes pode até atingir 2.379 MHz. Entretanto, vemos ocasionalmente um estrangulamento quando a temperatura do ponto quente atinge a marca de 100 °C, embora os relógios recuperem bastante rapidamente

Usamos a tensão FurMark para determinar os níveis de ruído e temperatura. FuMark e The Witcher 3 a 1080p Ultra preset foram usados para medir o consumo de energia

Tensão FurMark
Tensão FurMark
Relógios centrais, temperaturas (temperatura do ponto quente da GPU - vermelho, temperatura da GPU - verde, temperatura da junção GDDR6 - azul), e gráficos de velocidade do ventilador durante a tensão FurMark

Temperatura

Mapa de calor AMD Radeon RX 6900 XT.

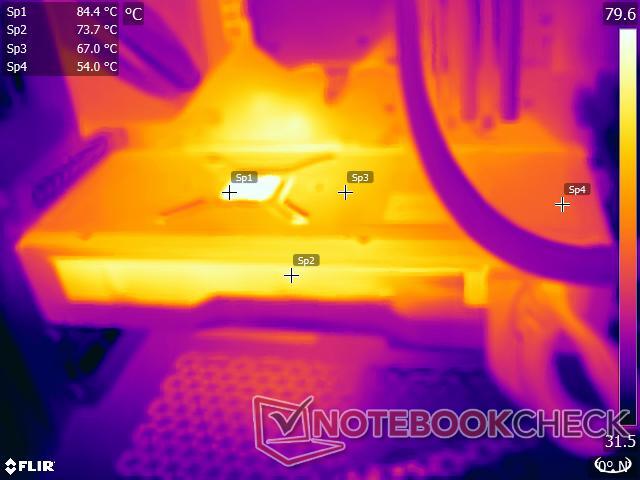
As temperaturas de superfície parecem estar também no lado mais alto. Registramos quase 85 °C perto da área da GPU e 67 °C perto da seção VRM da fonte de alimentação enquanto realizávamos o teste de tensão FurMark.

As aberturas de exaustão de ar na parte superior da placa podem chegar a quase 74 °C. Portanto, recomendamos utilizar um bom exaustor para evitar o acúmulo de calor dentro da caixa, especialmente se a caixa tiver um painel lateral de vidro temperado. Os usuários de energia podem achar que vale a pena subvoltar a carda e estabelecer um limite de potência mais baixo. Isto pode potencialmente reduzir a temperatura do ponto quente e evitar alguns dos pingos do relógio que vimos anteriormente.

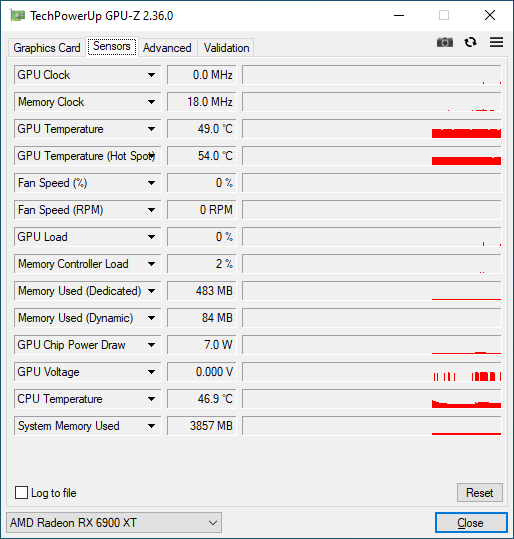
Registramos 49 °C e 54 °C como temperaturas de GPU e ponto quente, respectivamente, durante a inatividade. Ao contrário da placa de referência Radeon RX 5700 XT, o RX 6900 XT agora apresenta parada do ventilador de parada, o que significa que os ventiladores se desligam completamente quando não há carga

Consumo de energia

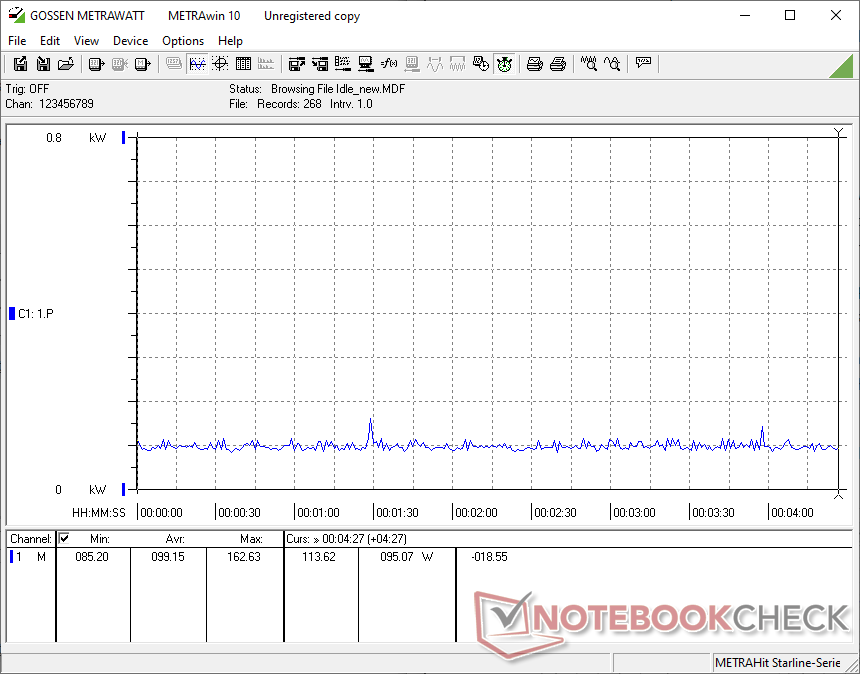
Nossa bancada de teste consome uma média de 99 W de potência em inatividade com toda a iluminação RGB desligada e um total de cinco ventiladores (três ventiladores de caixa Corsair SP 120 mm e dois ventiladores de radiador Corsair ML 120 mm) e a bomba Elite Capellix AIO funcionando em um perfil Balanceado.

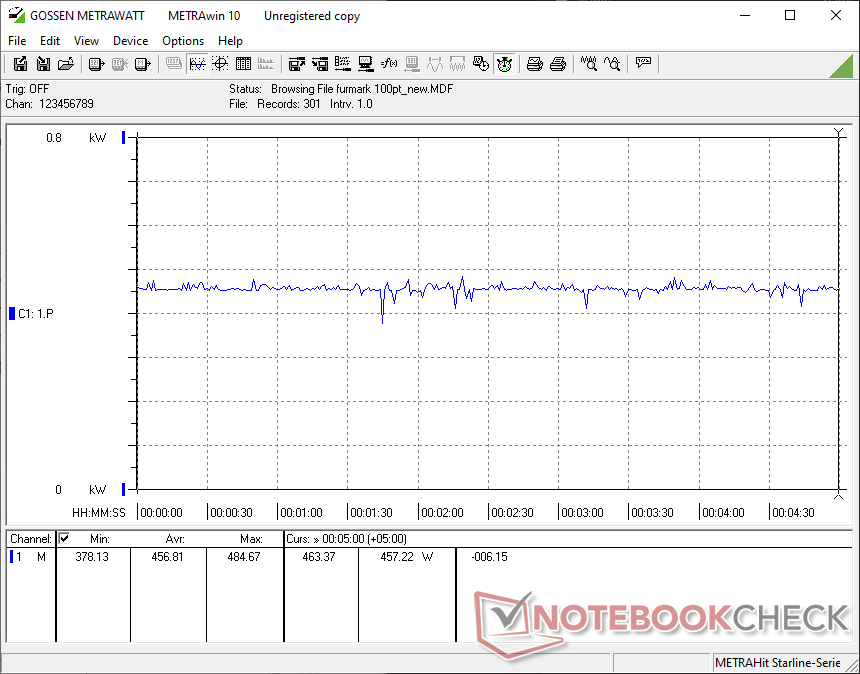
O nosso sistema baseado no RX 6900 XT consome uma média de 456,8 W e 488 W durante os testes FurMark e The Witcher 3 Ultra stress, respectivamente.. O consumo de energia durante a tensão FurMark mostra a queda ocasional consistente com as quedas de velocidade do relógio que descrevemos anteriormente

Enquanto as novas placas RDNA 2 definitivamente mostram um aumento no consumo de energia sobre o RX 5700 XT, é interessante notar que não há muita diferença entre o RX 6800 XT e o RX 6900 XT a este respeito. A Edição dos Fundadores do RTX 3090, por outro lado, consome 10% mais energia do que o RX 6900 XT no FurMark, sendo 5% mais econômico no The Witcher 3 Ultra

Consumo de energia do sistema - ocioso
Consumo de energia do sistema - FurMark stress
Consumo de energia do sistema - O Witcher 3 1080p Ultra pré-definido
Power Consumption
1280x720 FurMark 1.19 GPU Stress Test (external Monitor)
ASUS GeForce RTX 3080 ROG STRIX OC GAMING
NVIDIA GeForce RTX 3080, R9 5900X (Idle: 88.3 W)
505 (493min - 541max) Watt * -11%
Nvidia GeForce RTX 3090 Founders Edition
NVIDIA GeForce RTX 3090, R9 5900X (Idle: 91.1 W)
502 (425min - 525max) Watt * -10%
Average NVIDIA GeForce RTX 3080
  (Idle: 492 - 505, n=2 W)
499 Watt * -9%
Average NVIDIA GeForce RTX 3090
  (Idle: 281 - 551, n=8 W)
469 Watt * -3%
AMD Radeon RX 6900 XT
AMD Radeon RX 6900 XT, R9 5950X (Idle: 99.15 W)
456.8 (378.13min - 484.67max) Watt *
AMD Radeon RX 6800 XT
AMD Radeon RX 6800 XT, R9 5950X (Idle: 99.5 W)
447.9 (413min - 484max) Watt * +2%
Average NVIDIA Titan RTX
 
419 Watt * +8%
KFA2 GeForce RTX 2080 Ti EX
NVIDIA GeForce RTX 2080 Ti (Desktop), R9 3900X (Idle: 100.5 W)
400.8 (354min - 432max) Watt * +12%
Average NVIDIA GeForce RTX 2080 Ti (Desktop)
  (Idle: 330 - 439, n=3 W)
390 Watt * +15%
MSI GeForce RTX 3070 Gaming X Trio
NVIDIA GeForce RTX 3070, R9 5900X (Idle: 95.1 W)
376.9 (369min - 433max) Watt * +17%
Nvidia GeForce RTX 2080 Super
NVIDIA GeForce RTX 2080 Super (Desktop), R7 2700X (Idle: 78.87 W)
376.8 (331min - 409max) Watt * +18%
Average NVIDIA GeForce RTX 2080 Super (Desktop)
  (Idle: 328 - 414, n=4 W)
362 Watt * +21%
Average NVIDIA GeForce RTX 3070
  (Idle: 281 - 393, n=6 W)
348 Watt * +24%
Average AMD Radeon RX 5700 XT (Desktop)
  (Idle: 327 - 352, n=3 W)
339 Watt * +26%
Average NVIDIA GeForce RTX 2070 Super (Desktop)
  (Idle: 280 - 358, n=6 W)
329 Watt * +28%
AMD Radeon RX 5700 XT
AMD Radeon RX 5700 XT (Desktop), R7 2700X (239 fps, Idle: 69.8 W)
326.6 (313min - 351max) Watt * +29%
Nvidia GeForce RTX 2070 Super
NVIDIA GeForce RTX 2070 Super (Desktop), R7 2700X (283 fps, Idle: 80.5 W)
326 (315min - 348max) Watt * +29%
AMD Radeon RX 5700
AMD Radeon RX 5700 (Desktop), R7 2700X (207 fps, Idle: 64.5 W)
280.5 (271min - 312max) Watt * +39%
1920x1080 The Witcher 3 ultra (external Monitor)
Average NVIDIA GeForce RTX 3090
  (Idle: 464 - 597, n=17 W)
524 Watt * -7%
ASUS GeForce RTX 3080 ROG STRIX OC GAMING
NVIDIA GeForce RTX 3080, R9 5900X (Idle: 88.3 W)
505 (389min - 543max) Watt * -3%
AMD Radeon RX 6800 XT
AMD Radeon RX 6800 XT, R9 5950X (Idle: 99.5 W)
505 (389min - 543max) Watt * -3%
Average NVIDIA GeForce RTX 3080
  (Idle: 498 - 505, n=2 W)
502 Watt * -3%
AMD Radeon RX 6900 XT
AMD Radeon RX 6900 XT, R9 5950X (Idle: 99.15 W)
488.3 (459.99min - 512.79max) Watt *
Nvidia GeForce RTX 3090 Founders Edition
NVIDIA GeForce RTX 3090, R9 5900X (Idle: 91.1 W)
463.7 (450min - 487max) Watt * +5%
AMD Ryzen 9 5900X
NVIDIA Titan RTX, R9 5900X (Idle: 78.1 W)
439.6 (419min - 497max) Watt * +10%
KFA2 GeForce RTX 2080 Ti EX
NVIDIA GeForce RTX 2080 Ti (Desktop), R9 3900X (Idle: 100.5 W)
438.8 (431min - 463max) Watt * +10%
Average NVIDIA GeForce RTX 2080 Ti (Desktop)
  (Idle: 359 - 467, n=3 W)
422 Watt * +14%
Average NVIDIA Titan RTX
  (Idle: 371 - 463, n=27 W)
408 Watt * +16%
Average NVIDIA GeForce RTX 3070
  (Idle: 317 - 550, n=5 W)
401 Watt * +18%
MSI GeForce RTX 3070 Gaming X Trio
NVIDIA GeForce RTX 3070, R9 5900X (Idle: 95.1 W)
394.5 (381min - 430max) Watt * +19%
Nvidia GeForce RTX 2080 Super
NVIDIA GeForce RTX 2080 Super (Desktop), R7 2700X (Idle: 78.87 W)
382.8 (360min - 410max) Watt * +22%
Average NVIDIA GeForce RTX 2080 Super (Desktop)
  (Idle: 336 - 416, n=5 W)
363 Watt * +26%
Average AMD Radeon RX 5700 XT (Desktop)
  (Idle: 326 - 376, n=3 W)
350 Watt * +28%
AMD Radeon RX 5700 XT
AMD Radeon RX 5700 XT (Desktop), R7 2700X (Idle: 69.8 W)
348.7 (341min - 359max) Watt * +29%
Nvidia GeForce RTX 2070 Super
NVIDIA GeForce RTX 2070 Super (Desktop), R7 2700X (96.8 fps, Idle: 80.5 W)
344.7 (335min - 370max) Watt * +29%
Average NVIDIA GeForce RTX 2070 Super (Desktop)
  (Idle: 296 - 377, n=6 W)
342 Watt * +30%
AMD Radeon RX 5700
AMD Radeon RX 5700 (Desktop), R7 2700X (84.2 fps, Idle: 64.5 W)
295.9 (284min - 304max) Watt * +39%

* ... smaller is better

Níveis de ruídos

O novo sistema de resfriamento com ventilador triplo da AMD parece operar com níveis de ruído decentes. Com a disponibilidade de um modo completo de parada do ventilador, o nível de pressão sonora (SPL) é quase o mesmo que os níveis ambientais a 28,70 db(A) a uma distância de 20 cm da caixa fechada

Durante o teste de estresse FurMark, o SPL subiu para 44,13 db(A), o que é bastante tolerável quando a caixa é fechada. Os usuários podem ser capazes de otimizar ainda mais as temperaturas e curvas dos ventiladores usando o Radeon Software Adrenalin Edition ou através de ferramentas de terceiros, como o MSI Afterburner

Níveis de ruído - Ocioso com os ventiladores fora do estojo
Níveis de ruído - FurMark stress com os ventiladores desligados

Pro

+ Boa qualidade de construção
+ Placa traseira de alumínio
+ Refrigerador com ventilador triplo
+ Porta USB tipo C
+ Desempenho entre um RTX 3080 e RTX 3090 na maioria dos jogos sintéticos e 4K benchmarks
+ Bom espetáculo em aplicações profissionais em 3D
+ Consumo de energia ao par com um RX 6800 XT e inferior a RTX 3090
+ Parada completa do ventilador em modo inativo
+ Níveis de ruído toleráveis sob tensão
+ US$500 mais barato no MSRP em comparação com um RTX 3090

Contra

- O desempenho dos cálculos pode ser melhor
- Ray tracing significativamente atrás de RTX 3080 e RTX 3090
- Ainda não há suporte para super amostragem baseada em IA
- Memória de acesso inteligente de pouca conseqüência na maioria dos jogos
- Altas temperaturas de núcleo e superfície sob carga
- Estrangulamento esporádico sob carga
- Desempenho geral apenas marginalmente melhor do que o RX 6800 XT
- Estoques muito limitados

Veredicto

AMD Radeon RX 6900 XT. Unidade de revisão, cortesia da AMD Índia.

Os dias em que a AMD foi a menor no mercado de GPU acabaram oficialmente com o Radeon RX 6900 XT. O RX 6900 XT tem a coragem de assumir verdadeiramente as ofertas de navios de bandeira da NVIDIA, e vemos que isso se reflete na maioria dos testes. Com as últimas placas Navi 2x, a AMD parece ter adotado um design mais marcante completo com o logotipo RGB Radeon e um refrigerador com ventilador triplo para um melhor desempenho térmico em comparação com os refrigeradores em estilo soprador que temos visto até agora.

O RX 6900 XT aguenta muito bem sua sorte, mesmo vencendo o RTX 3090 em alguns pontos de referência sintéticos. Considerando o MSRP de US$999 do RX 6900 XT contra o MSRP de US$1.499 do RTX 3090, o leve déficit de desempenho é bem compensado pela diferença de preço de US$500. Além disso, vemos números excelentes em aplicações profissionais, tornando o RX 6900 XT uma boa escolha se sua carga de trabalho não for dependente da CUDA.

Os gamers que têm querido obter um cartão AMD emblemático que possa ser uma alternativa viável ao da NVIDIA, encontrarão o RX 6900 XT que vale a pena, especialmente se os jogos forem otimizados para o hardware AMD. Os drivers de adrenalina da Radeon Software percorreram um longo caminho em termos de oferecer um experiência estávele a inclusão de ambos, Ryzen e Radeon tuning, no última versão é definitivamente um passo na direção certa. A memória de acesso inteligente, embora boa de se ter, é atualmente de pouca importância na grande maioria dos jogos de hoje.

A AMD, no entanto, atualmente fica atrás da NVIDIA em duas tecnologias, que agora estão sendo rapidamente incorporadas pelos desenvolvedores de jogos - traçado de raio e super amostragem baseada em IA. O desempenho de traçado de raio do RX 6900 XT é definitivamente RTX 2080 Ti-classe, mas não é realmente competitivo com o que o RTX 3080 e RTX 3090 podem oferecer. Além disso, a AMD é ainda por vir com uma super solução de amostragem nas linhas da Super Amostragem de Aprendizagem Profunda da NVIDIA (DLSS).

Os oito CUs adicionais no RX 6900 XT não parecem oferecer um ganho de desempenho significativo sobre o RX 6800 XT de 72-CU. Portanto, se você estiver procurando principalmente um cartão somente para jogos, o RX 6800 XT a US$649 MSRP seria provavelmente um investimento melhor

O AMD Radeon RX 6900 XT é exatamente o que os fãs da equipe Red vêm clamando há muito tempo, a fim de manter a competição sob controle. Embora o RX 6900 XT não vença totalmente a NVIDIA GeForce RTX 3090, ele está a uma distância impressionante e, às vezes, pode derrotar o melhor cão da NVIDIA por uma margem justa, tornando-o uma boa escolha se as tecnologias da próxima geração, tais como traçado de raio e super amostragem baseada em IA não forem as principais preocupações"

O RX 6900 XT não ajuda exatamente a economizar em suas contas de eletricidade. Entretanto, ainda é comparativamente mais econômico no consumo de energia quando comparado com o RTX 3080 e o RTX 3090. Enquanto os níveis de ruído sob carga são toleráveis, as temperaturas parecem estar no lado mais alto levando a um estrangulamento esporádico em nossos testes de estresse

Com RDNA 2 se tornando o hardware gráfico básico em consoles de próxima geração, como o Xbox Series X/S e o PlayStation 5, há uma grande vantagem potencial de cross-platform que os desenvolvedores podem aproveitar. Espera-se que a AMD também melhore o que puder na frente de traçado de raio e ofereça uma alternativa DLSS viável nos próximos meses

Preço e disponibilidade

A AMD está atualmente com escassez de cartões de referência Radeon RX 6900 XT, mas tem prometido para continuar oferecendo o projeto de referência. Enquanto os estoques de cartões de referência são esperado para reabastecer em breve, os cartões de parceiros add-in board (AiB) de empresas como MSI, Sapphire, XFX e PowerColor podem ser utilizados on-line, dependendo da situação do estoque

No momento desta redação, o Sapphire RX 6900 XT está disponível em Amazon por US$2.388 enquanto o XFX Speedster MERC 319 Radeon RX 6900 XT está disponível por US$2.661,99 no site WalmartAmbos são marcas bastante significativas. Os cartões AiB na Best Buy e Newegg continuam fora de estoque no momento da publicação

Recomendamos manter um registro da disponibilidade dos cartões de referência AMD e esperar que os preços das versões AiB caiam nas próximas semanas antes de dar o mergulho

Pricecompare

Please share our article, every link counts!
> Análises e revisões de portáteis e celulares > Análises > Análises > Revisão AMD Radeon RX 6900 XT: Desempenho quase-RTX 3090 por US$500 a menos, mas apenas marginalmente melhor que o RX 6800 XT
Vaidyanathan Subramaniam, 2021-05- 4 (Update: 2021-05- 8)