100 W Core i7-8809G vs. 28 W Core i7-1165G7: Pode Tiger Lake superar o exótico chipset Intel-AMD?
A Intel e a AMD fizeram ondulações em sua indústria quando anunciaram um parceria em 2017 para co-desenvolver a plataforma Kaby Lake-G. Foi um chipset único que casou um CPU Kaby Lake-H quad-core com uma GPU Radeon RX Vega, tudo embalado sob um envelope de 100 W TDP. Não durou muito tempo no mercado, no entanto, devido em parte a seu apoio muito limitado dos principais fabricantes de PCs
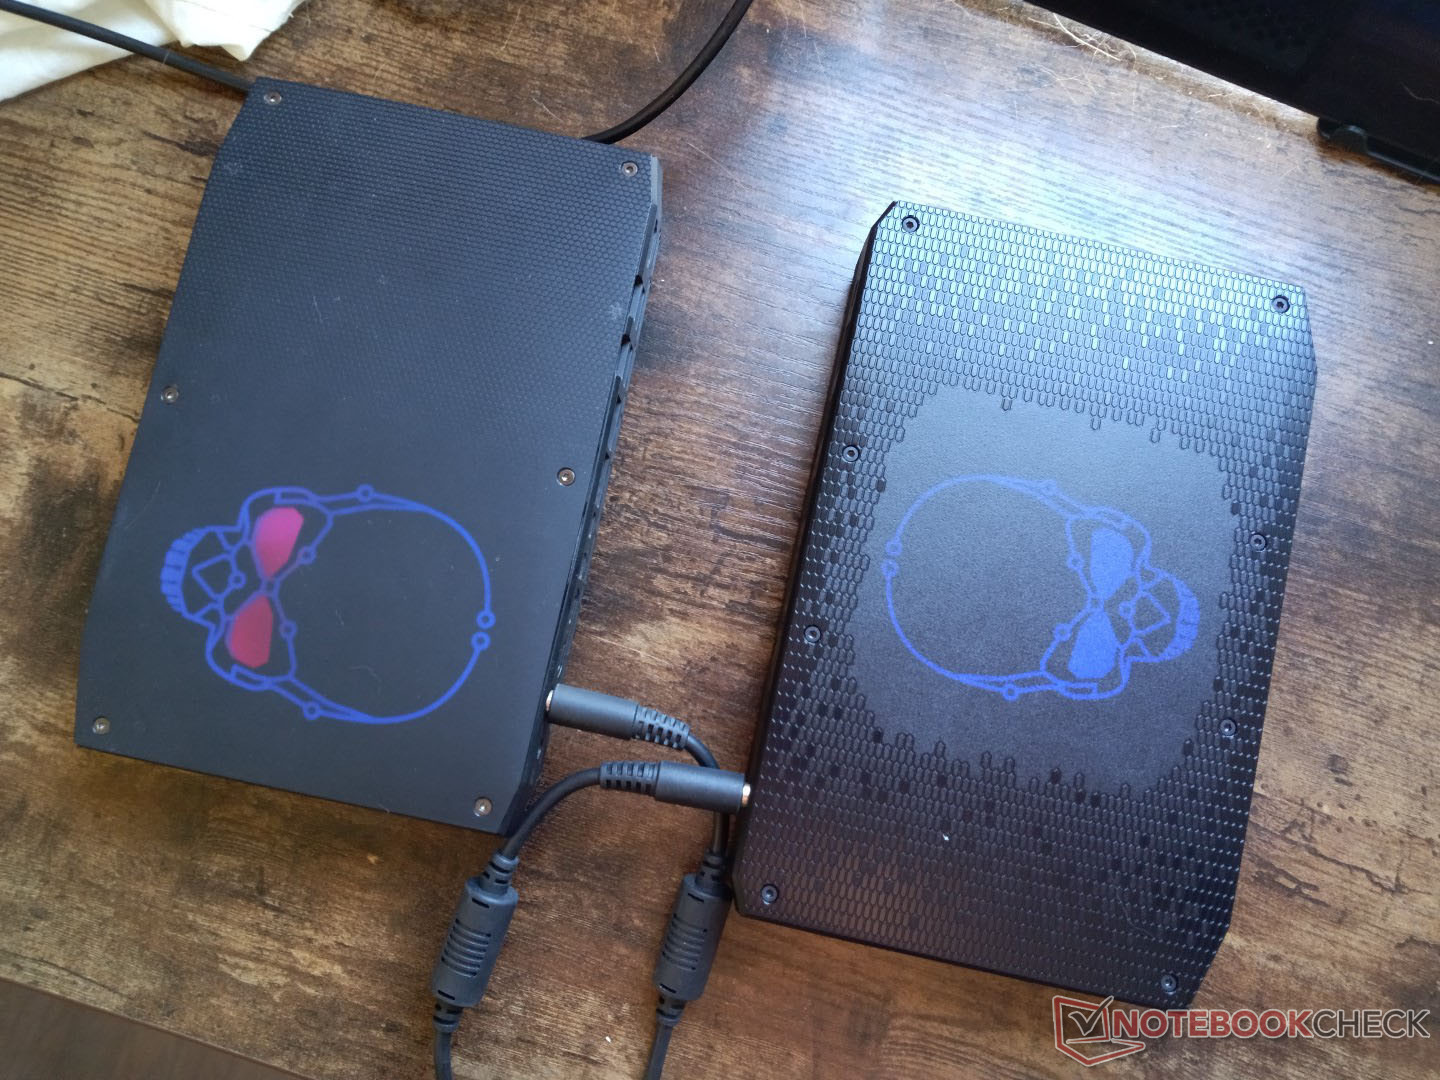
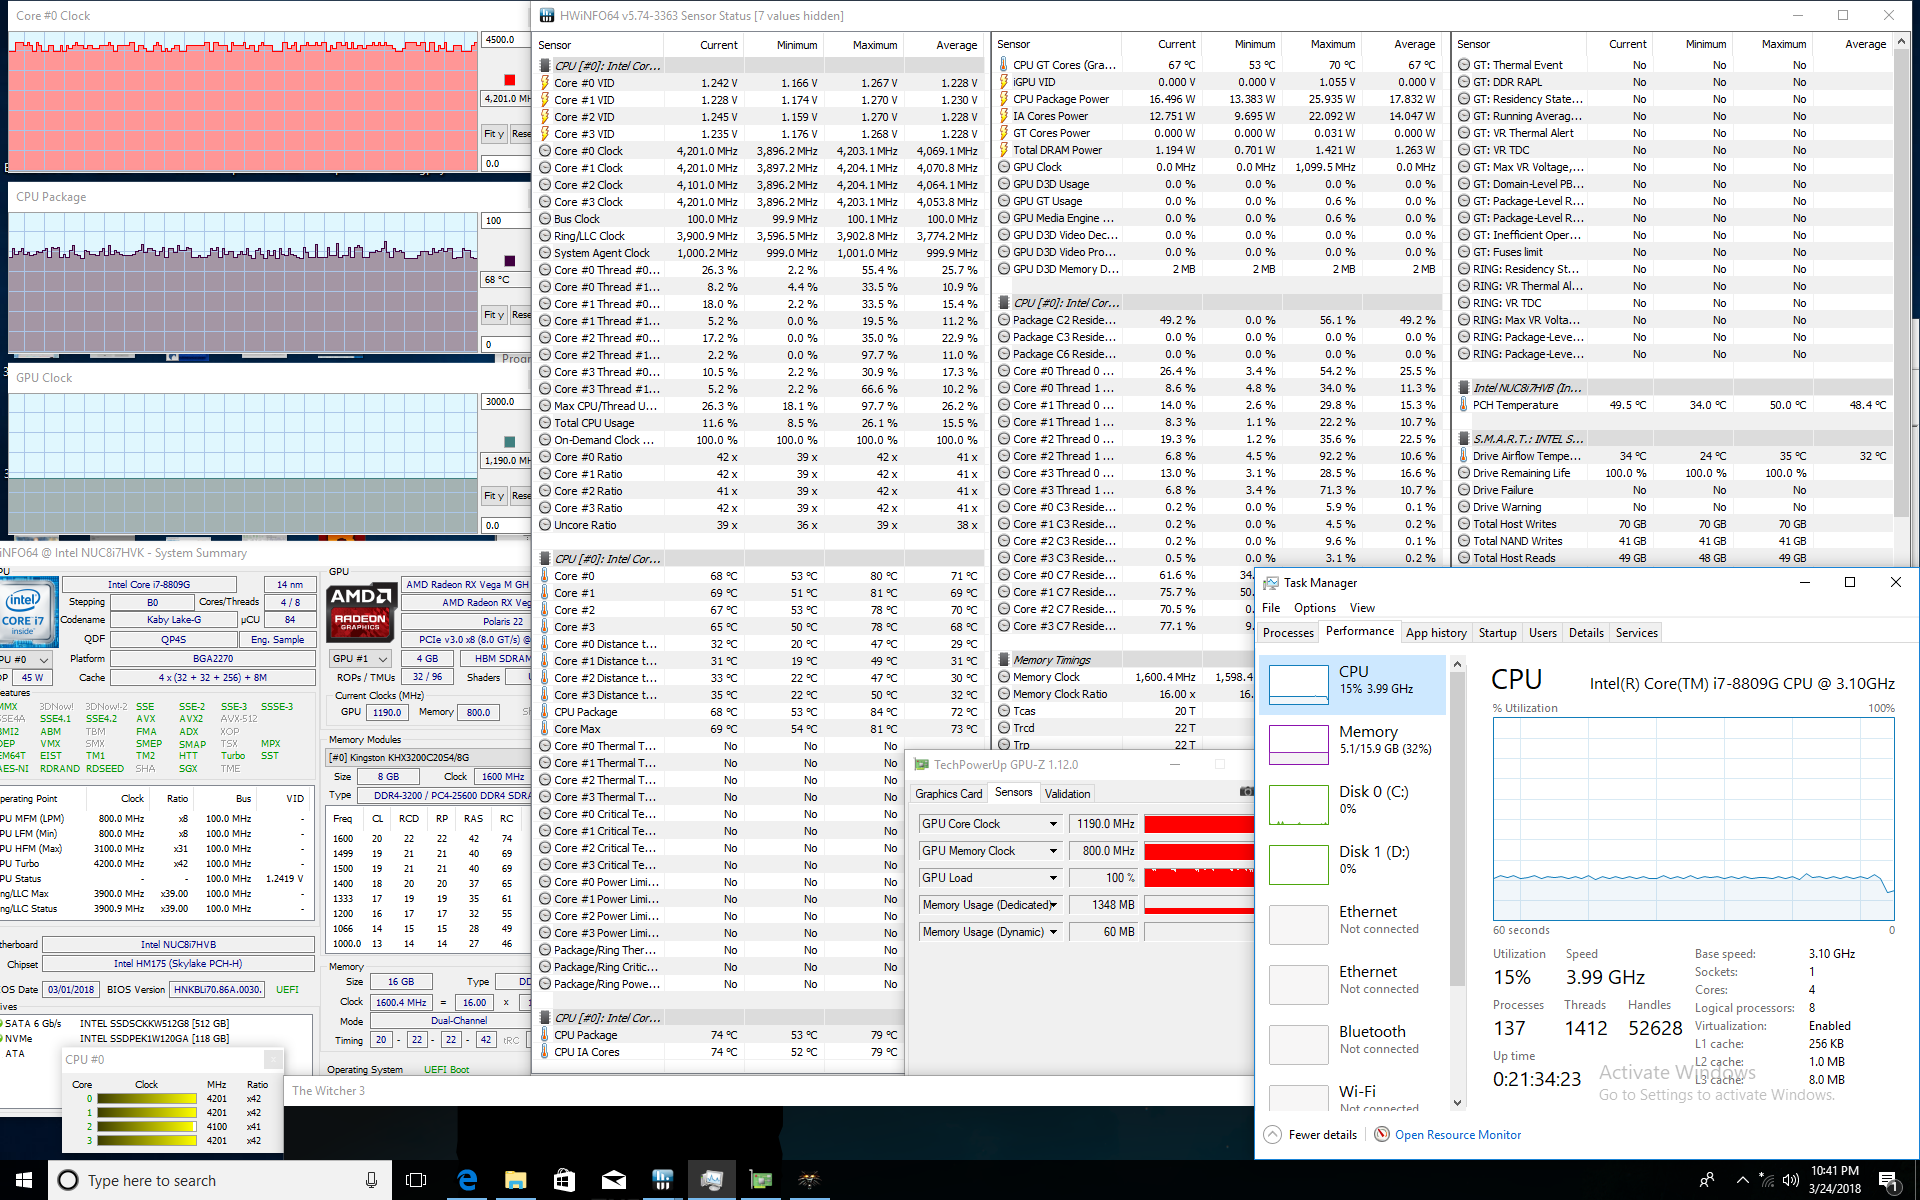
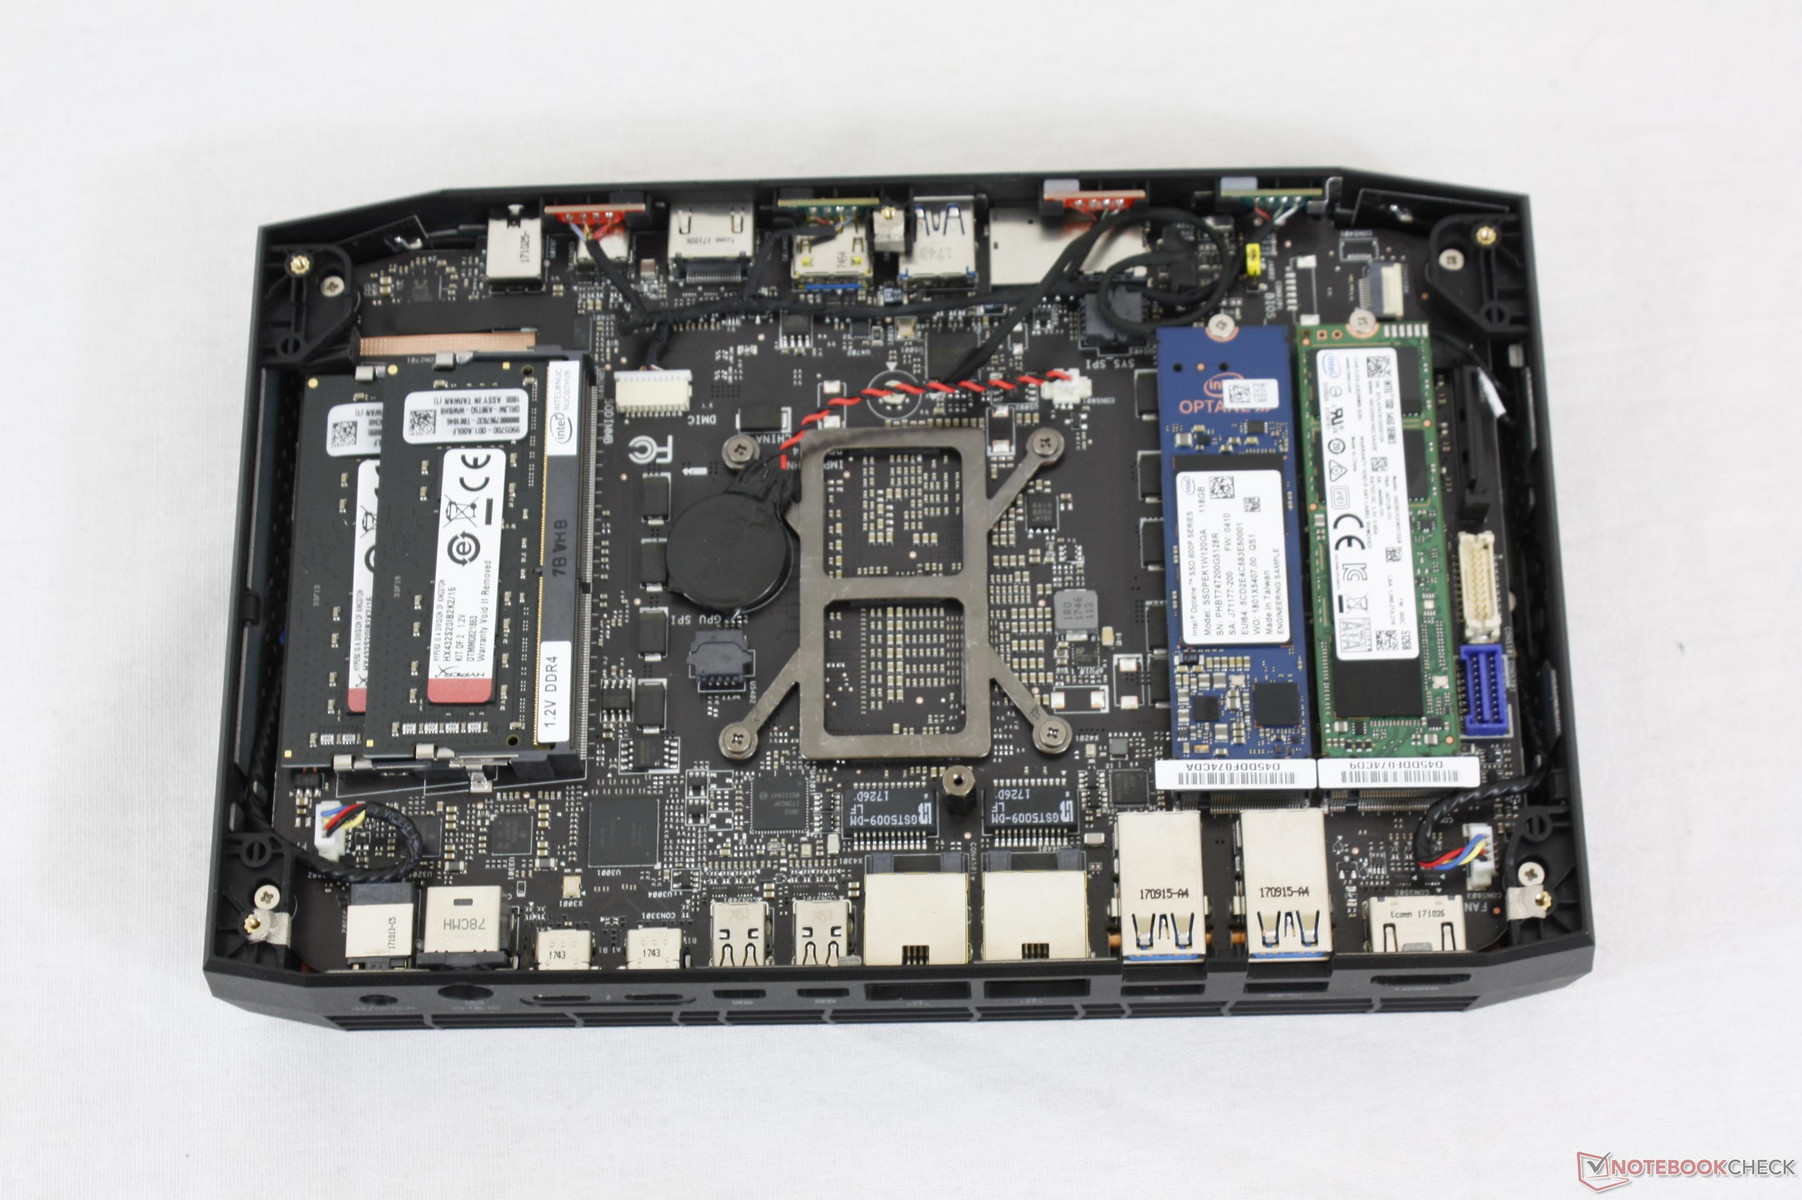
O 2018 Hades Canyon NUC continua sendo o primeiro e único campeão do Kaby Lake-G Núcleo i7-8809G processador. Embora seria tolice esperar que ele funcionasse tão rápido quanto as últimas soluções de 2021, ainda estamos interessados em ver a diferença de desempenho que existe entre o raro Core i7-8809G de 100 W e a plataforma atual de 28 W Tiger Lake-U
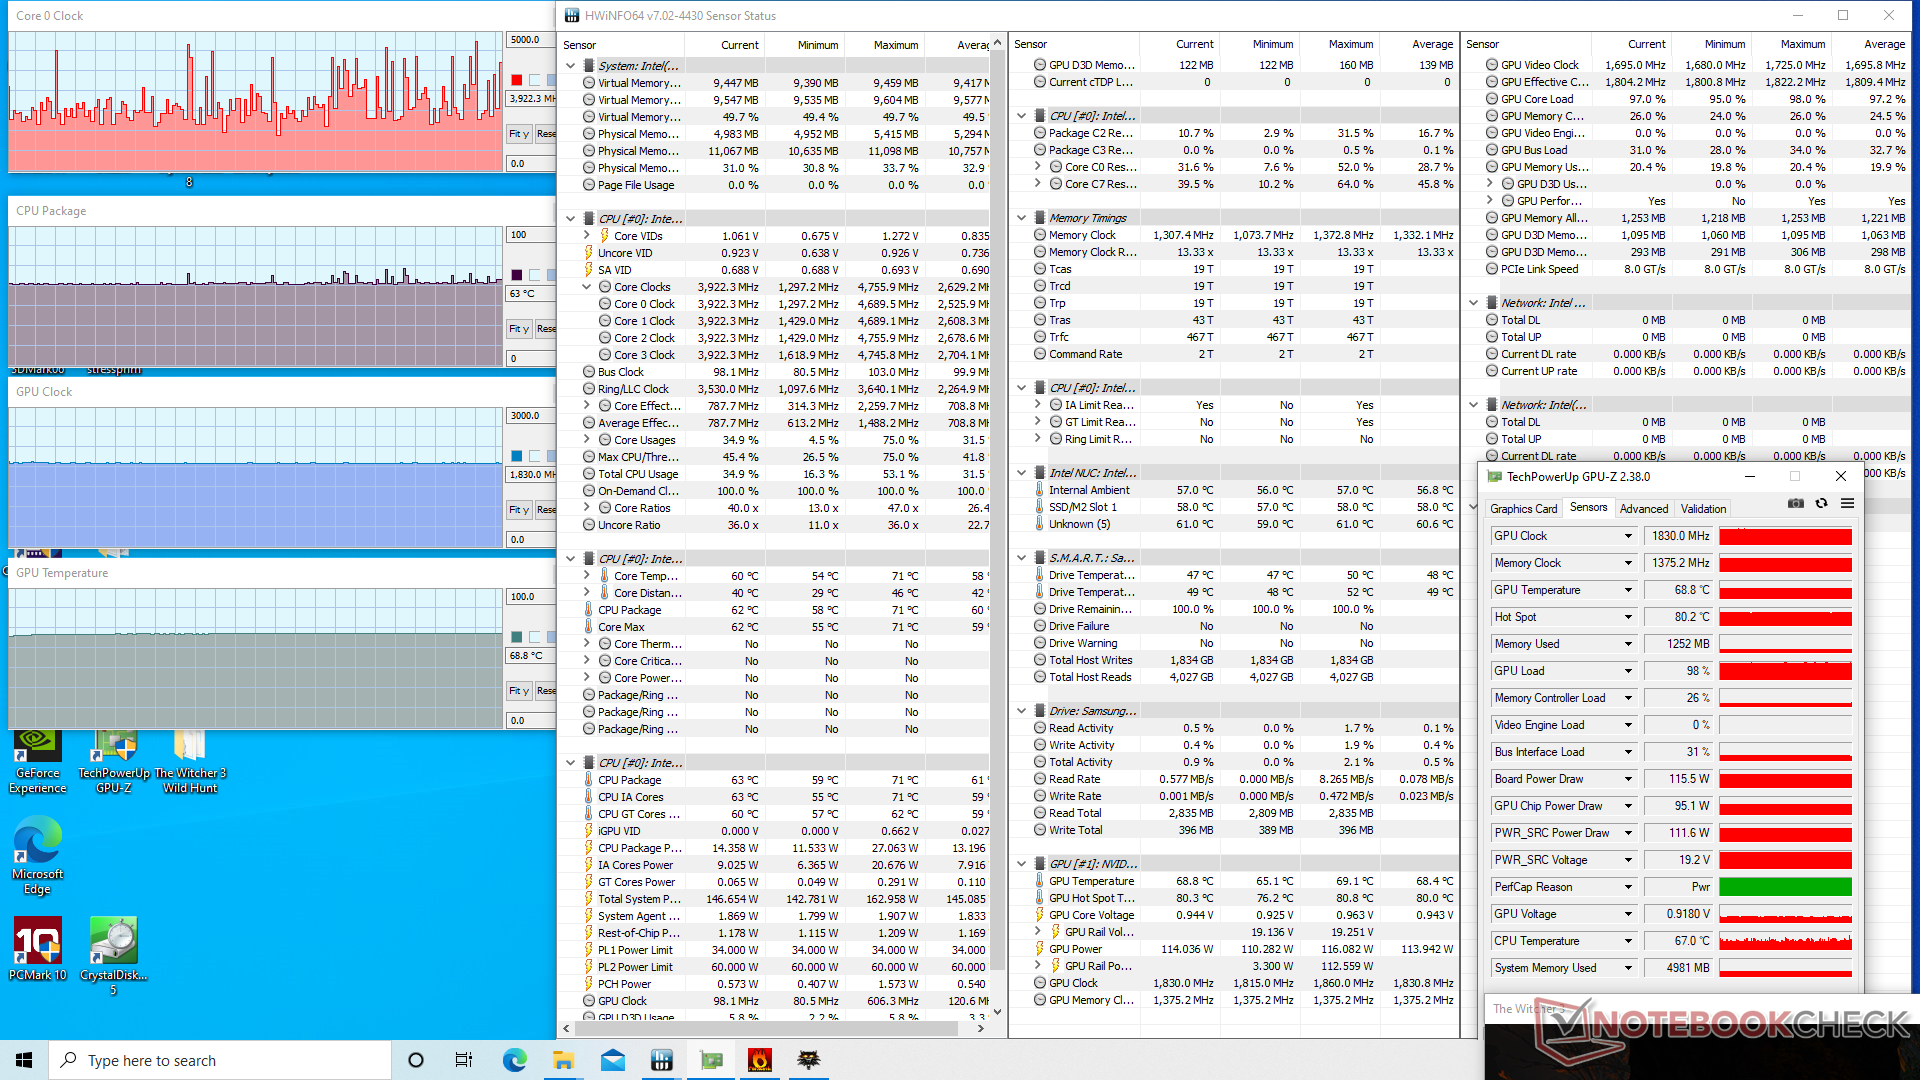
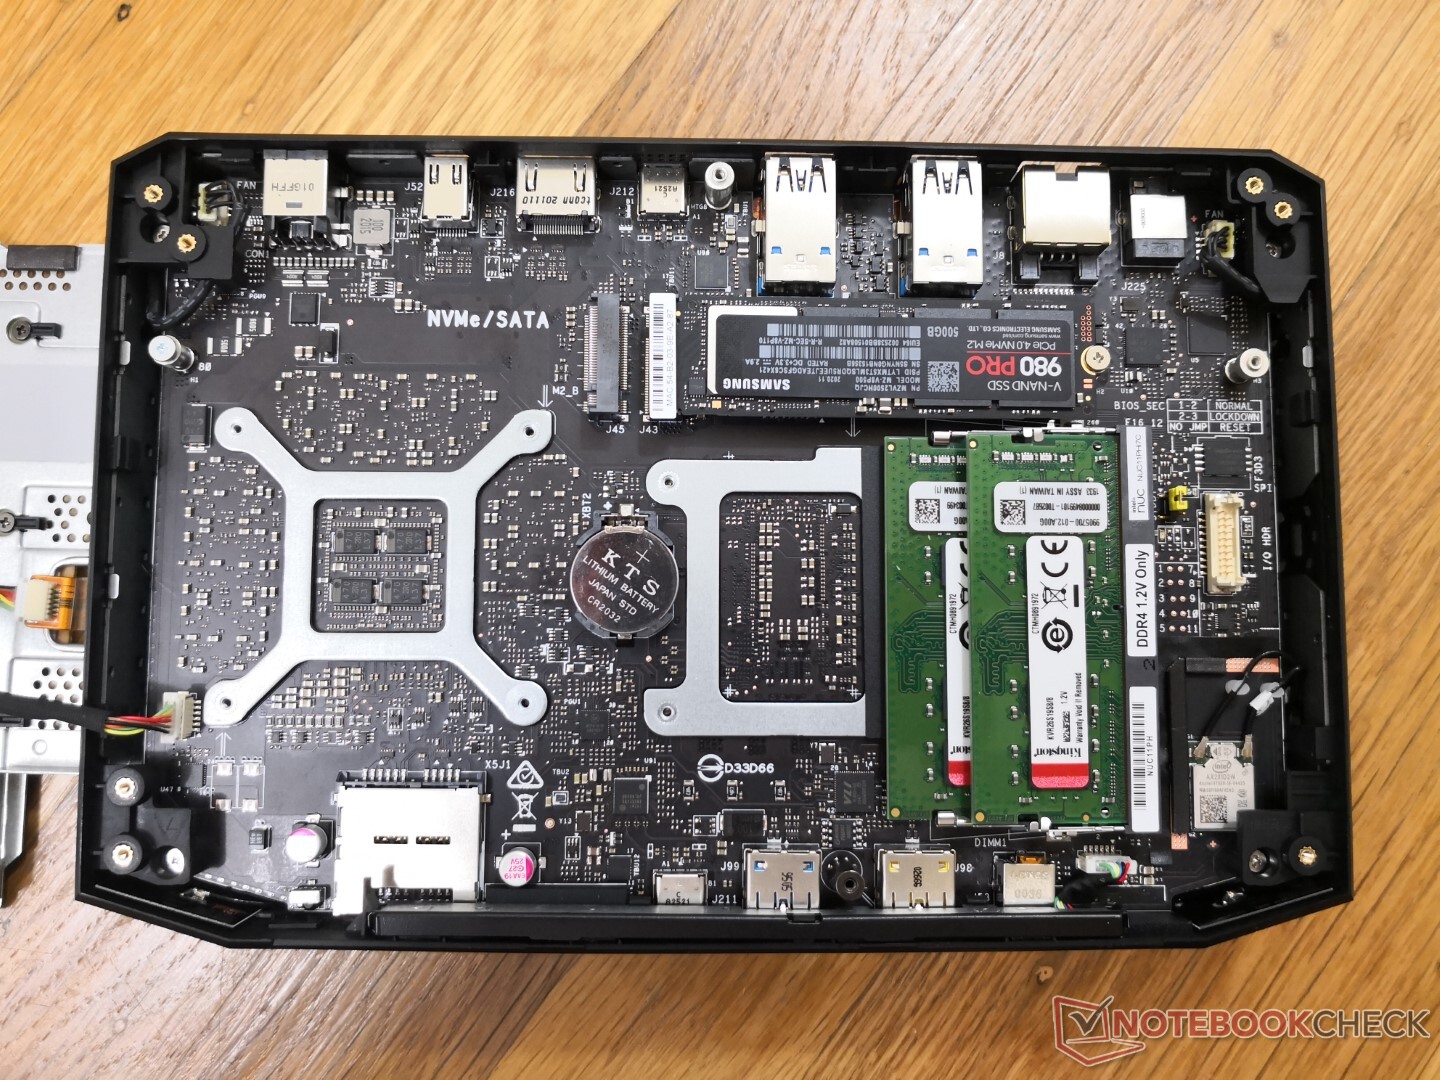
O NUC11 Phantom Canyon sucede diretamente ao NUC8 Hades Canyon para torná-lo o sistema perfeito para uma comparação frente a frente. Benchmarks multi-tarefa pesados como CineBench, Blender e HWBOT x265 mostram que o Core i7-8809G e Core i7-1165G7 estão muito próximos um do outro, apesar de suas enormes diferenças nos níveis de TDP. Entretanto, a CPU mais nova tem um desempenho superior ao da CPU Intel-AMD quando se trata de cargas com rosca única
Quando se olha para o Radeon RX Vega M GH e móvel GeForce RTX 2060Este último oferece taxas de quadros significativamente mais rápidas, especialmente ao executar títulos DX12 exigentes em resoluções mais altas, onde o desempenho se torna mais vinculado à GPU
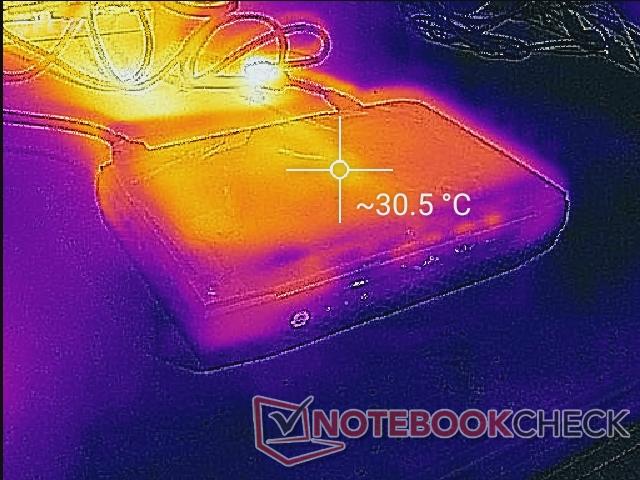
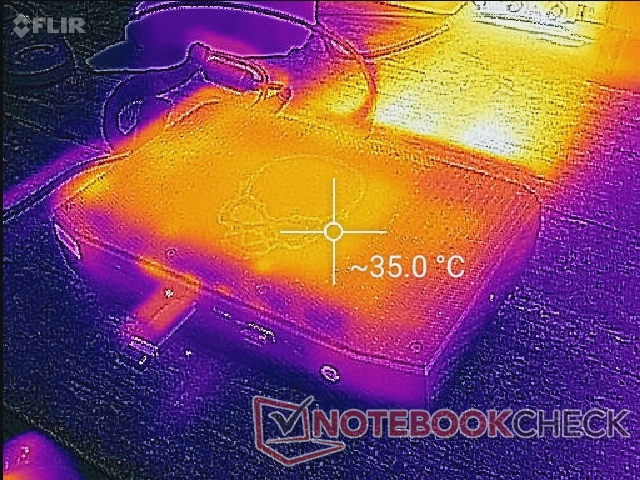
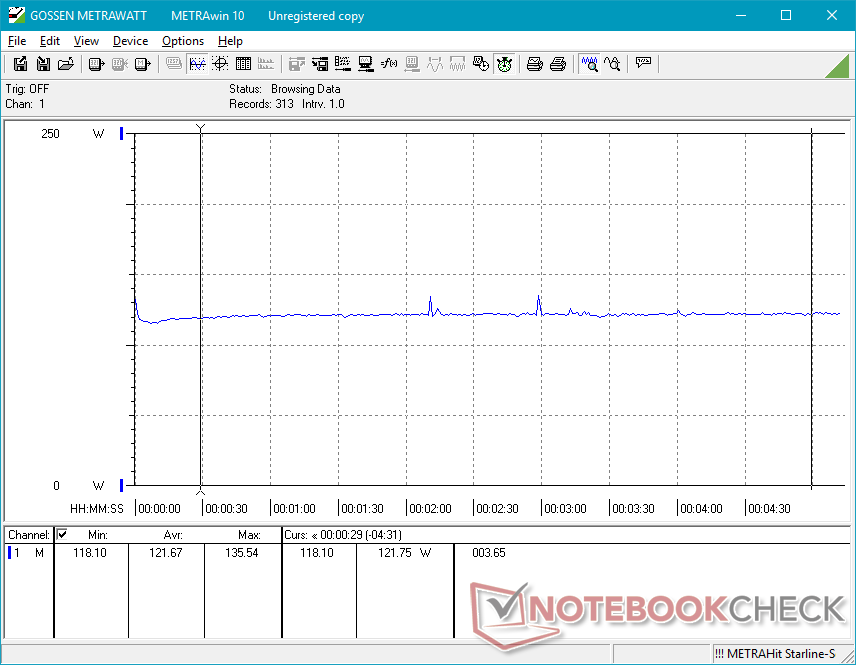
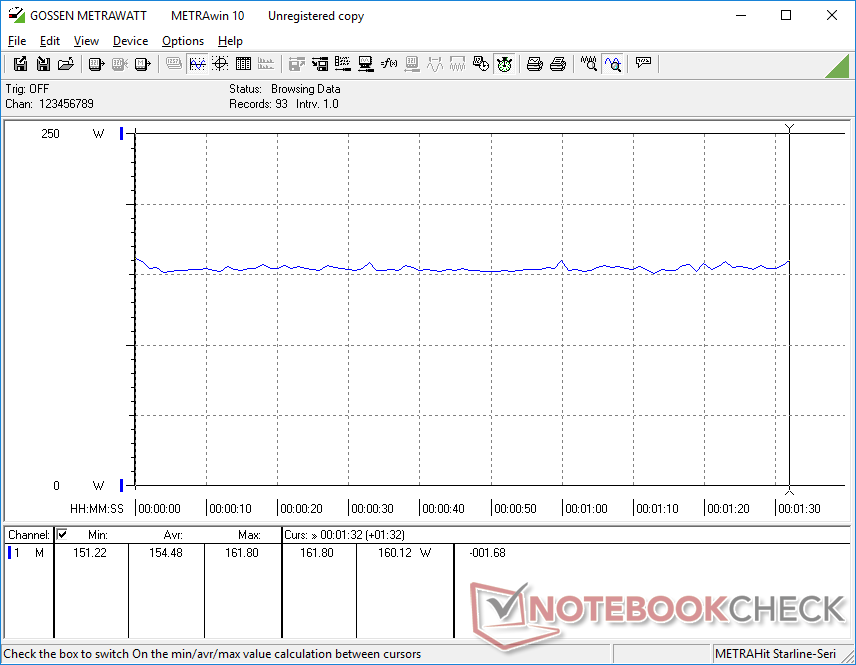
O consumo total de energia é maior no Phantom Canyon do que no Hades Canyon, o que significa que o aumento de desempenho não é gratuito. Entretanto, o aumento no consumo é muito menor do que o aumento percentual de desempenho para um desempenho maior de gen para gen por watt. Além disso, as temperaturas centrais e o ruído do ventilador permaneceriam relativamente consistentes entre os dois NUCs, apesar das grandes diferenças de desempenho. Os usuários estão obtendo mais desempenho sem que a máquina funcione mais alto ou mais quente.
O Kaby Lake-G foi divertido enquanto durou, mas o Phantom Canyon é a prova de que você não precisa de uma arquitetura exótica quando CPUs e GPUs "em estoque" podem realizar o mesmo e com melhor suporte de software.
Veja nossas revisões completas sobre o NUC8 Hades Canyon e NUC11 Phantom Canyon para saber mais sobre estes NUCs de jogos.
| Intel NUC8 Hades Canyon Especificações principais | Especificações do núcleo do Intel NUC11 Phantom Canyon |
|---|---|
| 8ª geração Intel Core i7-8809G CPU Kaby Lake-G 100 W TDP CPU e GPU combinados Discreta Radeon RX Vega M GH GPU 4 GB HBM2 VRAM 2018 lançamento | 11ª geração CPU Intel Core i7-1165G7 Tiger Lake-U 28 W TDP CPU + 80 W a 90 W TGP GPU Discreto GeForce GPU móvel RTX 2060 6 GB GDDR6 VRAM 2021 lançamento |
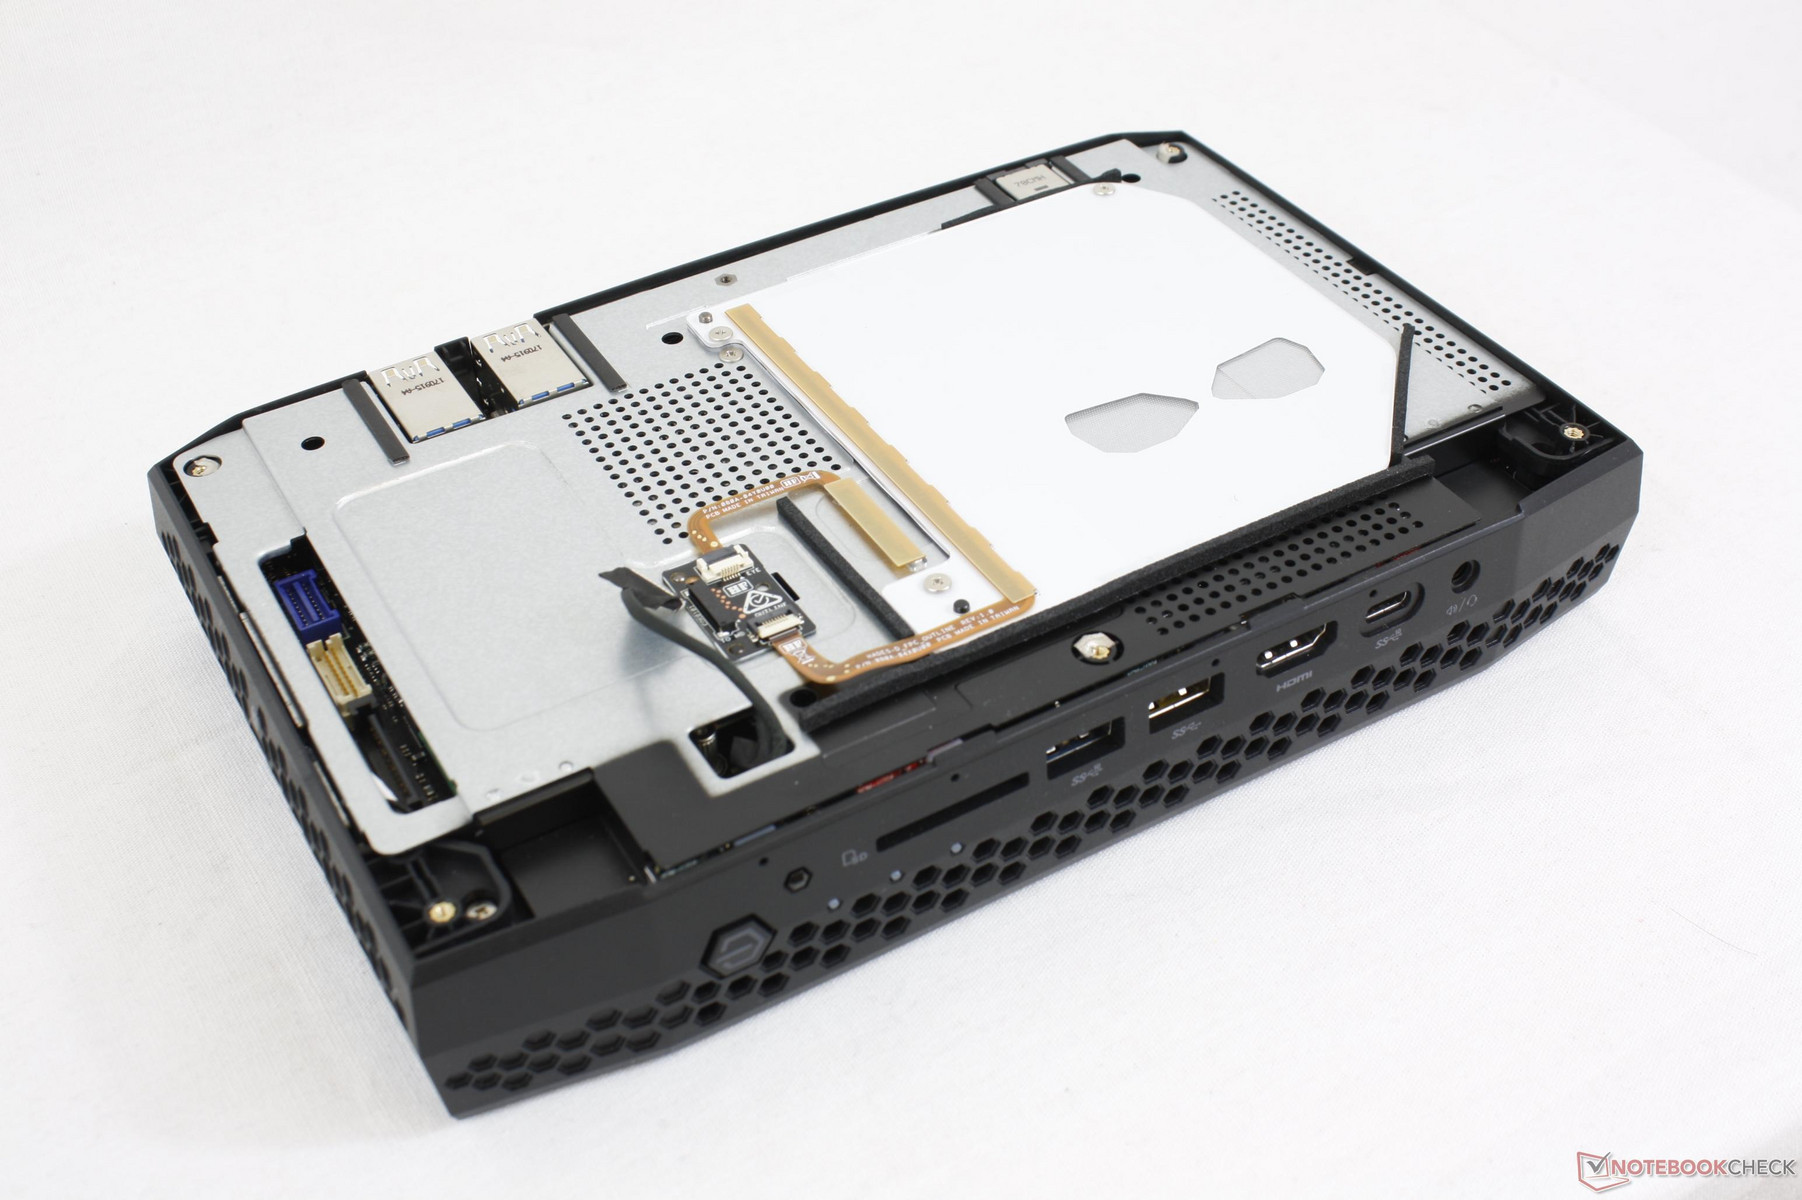
| Intel NUC8 Hades Canyon Portos | Portos NUC11 Phantom Canyon Intel |
|---|---|
| 2x mini-DisplayPort 1.3 2x 1 Gbps RJ-45 6x USB-A 3x USB-C (2x Thunderbolt 3) 2x HDMI 2.0a 1x Óptico 1x Áudio de 3.5 mm | 1x mini-DisplayPort 1.4 1x 2.5 Gbps RJ-45 6x USB-A 2x USB-C (2x Thunderbolt 4) 1x HDMI 2.0b 1x Óptico 1x Áudio de 3.5 mm |
Cinebench R15: CPU Multi 64Bit | CPU Single 64Bit
Blender: v2.79 BMW27 CPU
7-Zip 18.03: 7z b 4 -mmt1 | 7z b 4
Geekbench 5.5: Single-Core | Multi-Core
HWBOT x265 Benchmark v2.2: 4k Preset
LibreOffice : 20 Documents To PDF
R Benchmark 2.5: Overall mean
| Cinebench R20 / CPU (Multi Core) | |
| Intel Hades Canyon NUC8i7HVK | |
| Intel NUC11PHKi7C | |
| Cinebench R20 / CPU (Single Core) | |
| Intel NUC11PHKi7C | |
| Intel Hades Canyon NUC8i7HVK | |
| Cinebench R15 / CPU Multi 64Bit | |
| Intel NUC11PHKi7C | |
| Intel Hades Canyon NUC8i7HVK | |
| Cinebench R15 / CPU Single 64Bit | |
| Intel NUC11PHKi7C | |
| Intel Hades Canyon NUC8i7HVK | |
| Blender / v2.79 BMW27 CPU | |
| Intel NUC11PHKi7C | |
| Intel Hades Canyon NUC8i7HVK | |
| 7-Zip 18.03 / 7z b 4 -mmt1 | |
| Intel NUC11PHKi7C | |
| Intel Hades Canyon NUC8i7HVK | |
| 7-Zip 18.03 / 7z b 4 | |
| Intel NUC11PHKi7C | |
| Intel Hades Canyon NUC8i7HVK | |
| Geekbench 5.5 / Single-Core | |
| Intel NUC11PHKi7C | |
| Geekbench 5.5 / Multi-Core | |
| Intel NUC11PHKi7C | |
| HWBOT x265 Benchmark v2.2 / 4k Preset | |
| Intel NUC11PHKi7C | |
| Intel Hades Canyon NUC8i7HVK | |
| LibreOffice / 20 Documents To PDF | |
| Intel NUC11PHKi7C | |
| R Benchmark 2.5 / Overall mean | |
| Intel NUC11PHKi7C | |
* ... menor é melhor
| 3DMark | |
| 1920x1080 Fire Strike Graphics | |
| Intel NUC11PHKi7C | |
| Intel Hades Canyon NUC8i7HVK | |
| Média Intel Iris Xe Graphics G7 96EUs (2286 - 6624, n=222) | |
| 2560x1440 Time Spy Graphics | |
| Intel NUC11PHKi7C | |
| Intel Hades Canyon NUC8i7HVK | |
| Média Intel Iris Xe Graphics G7 96EUs (707 - 1890, n=218) | |
| 2560x1440 Time Spy Score | |
| Intel NUC11PHKi7C | |
| Intel Hades Canyon NUC8i7HVK | |
| Média Intel Iris Xe Graphics G7 96EUs (789 - 2159, n=215) | |
| 3840x2160 Fire Strike Ultra Graphics | |
| Intel NUC11PHKi7C | |
| Intel Hades Canyon NUC8i7HVK | |
| Média Intel Iris Xe Graphics G7 96EUs (599 - 1458, n=94) | |
| 3DMark 11 | |
| 1280x720 Performance GPU | |
| Intel NUC11PHKi7C | |
| Intel Hades Canyon NUC8i7HVK | |
| Média Intel Iris Xe Graphics G7 96EUs (2867 - 7676, n=209) | |
| 1280x720 Performance Combined | |
| Intel NUC11PHKi7C | |
| Intel Hades Canyon NUC8i7HVK | |
| Média Intel Iris Xe Graphics G7 96EUs (1926 - 7661, n=208) | |
| Final Fantasy XV Benchmark | |
| 1280x720 Lite Quality | |
| Intel NUC11PHKi7C | |
| Intel Hades Canyon NUC8i7HVK | |
| Média Intel Iris Xe Graphics G7 96EUs (14.9 - 56.5, n=189) | |
| 1920x1080 Standard Quality | |
| Intel NUC11PHKi7C | |
| Intel Hades Canyon NUC8i7HVK | |
| Média Intel Iris Xe Graphics G7 96EUs (10.5 - 31.2, n=185) | |
| 1920x1080 High Quality | |
| Intel NUC11PHKi7C | |
| Intel Hades Canyon NUC8i7HVK | |
| Média Intel Iris Xe Graphics G7 96EUs (8.15 - 27.8, n=178) | |
| GTA V | |
| 1024x768 Lowest Settings possible | |
| Intel NUC11PHKi7C | |
| Intel Hades Canyon NUC8i7HVK | |
| Média Intel Iris Xe Graphics G7 96EUs (52 - 166.4, n=168) | |
| 1920x1080 Lowest Settings possible | |
| Intel Hades Canyon NUC8i7HVK | |
| Intel NUC11PHKi7C | |
| Média Intel Iris Xe Graphics G7 96EUs (34.7 - 132.1, n=141) | |
| 1366x768 Normal/Off AF:4x | |
| Intel Hades Canyon NUC8i7HVK | |
| Intel NUC11PHKi7C | |
| Média Intel Iris Xe Graphics G7 96EUs (24.1 - 152.7, n=169) | |
| 1920x1080 Normal/Off AF:4x | |
| Intel Hades Canyon NUC8i7HVK | |
| Intel NUC11PHKi7C | |
| Média Intel Iris Xe Graphics G7 96EUs (20 - 119.3, n=142) | |
| 1920x1080 High/On (Advanced Graphics Off) AA:2xMSAA + FX AF:8x | |
| Intel NUC11PHKi7C | |
| Intel Hades Canyon NUC8i7HVK | |
| Média Intel Iris Xe Graphics G7 96EUs (9.39 - 51.6, n=162) | |
| 1920x1080 Highest AA:4xMSAA + FX AF:16x | |
| Intel NUC11PHKi7C | |
| Intel Hades Canyon NUC8i7HVK | |
| Média Intel Iris Xe Graphics G7 96EUs (4.13 - 22.9, n=156) | |
| Dota 2 Reborn | |
| 1280x720 min (0/3) fastest | |
| Intel NUC11PHKi7C | |
| Intel Hades Canyon NUC8i7HVK | |
| Média Intel Iris Xe Graphics G7 96EUs (36 - 148, n=221) | |
| 1366x768 med (1/3) | |
| Intel NUC11PHKi7C | |
| Intel Hades Canyon NUC8i7HVK | |
| Média Intel Iris Xe Graphics G7 96EUs (31.6 - 108.5, n=221) | |
| 1920x1080 high (2/3) | |
| Intel NUC11PHKi7C | |
| Intel Hades Canyon NUC8i7HVK | |
| Média Intel Iris Xe Graphics G7 96EUs (23.2 - 88.1, n=221) | |
| 1920x1080 ultra (3/3) best looking | |
| Intel NUC11PHKi7C | |
| Intel Hades Canyon NUC8i7HVK | |
| Média Intel Iris Xe Graphics G7 96EUs (20.6 - 78.5, n=221) | |
| The Witcher 3 | |
| 1024x768 Low Graphics & Postprocessing | |
| Intel NUC11PHKi7C | |
| Intel Hades Canyon NUC8i7HVK | |
| Média Intel Iris Xe Graphics G7 96EUs (28.9 - 117.2, n=188) | |
| 1366x768 Medium Graphics & Postprocessing | |
| Intel NUC11PHKi7C | |
| Intel Hades Canyon NUC8i7HVK | |
| Média Intel Iris Xe Graphics G7 96EUs (21.4 - 77.8, n=185) | |
| 1920x1080 High Graphics & Postprocessing (Nvidia HairWorks Off) | |
| Intel NUC11PHKi7C | |
| Intel Hades Canyon NUC8i7HVK | |
| Média Intel Iris Xe Graphics G7 96EUs (10.6 - 45.9, n=191) | |
| 1920x1080 Ultra Graphics & Postprocessing (HBAO+) | |
| Intel NUC11PHKi7C | |
| Intel Hades Canyon NUC8i7HVK | |
| Média Intel Iris Xe Graphics G7 96EUs (8.79 - 20.1, n=181) | |
| X-Plane 11.11 | |
| 1280x720 low (fps_test=1) | |
| Intel NUC11PHKi7C | |
| Intel Hades Canyon NUC8i7HVK | |
| Média Intel Iris Xe Graphics G7 96EUs (13.4 - 88.4, n=213) | |
| 1920x1080 med (fps_test=2) | |
| Intel NUC11PHKi7C | |
| Intel Hades Canyon NUC8i7HVK | |
| Média Intel Iris Xe Graphics G7 96EUs (11.6 - 69.5, n=214) | |
| 1920x1080 high (fps_test=3) | |
| Intel NUC11PHKi7C | |
| Intel Hades Canyon NUC8i7HVK | |
| Média Intel Iris Xe Graphics G7 96EUs (11.1 - 59.8, n=213) | |
| Strange Brigade | |
| 1280x720 lowest AF:1 | |
| Intel NUC11PHKi7C | |
| Intel Hades Canyon NUC8i7HVK | |
| Média Intel Iris Xe Graphics G7 96EUs (48.5 - 115.1, n=172) | |
| 1920x1080 medium AA:medium AF:4 | |
| Intel NUC11PHKi7C | |
| Intel Hades Canyon NUC8i7HVK | |
| Média Intel Iris Xe Graphics G7 96EUs (18.2 - 51.4, n=170) | |
| 1920x1080 high AA:high AF:8 | |
| Intel NUC11PHKi7C | |
| Intel Hades Canyon NUC8i7HVK | |
| Média Intel Iris Xe Graphics G7 96EUs (15.4 - 39.8, n=169) | |
| 1920x1080 ultra AA:ultra AF:16 | |
| Intel NUC11PHKi7C | |
| Intel Hades Canyon NUC8i7HVK | |
| Média Intel Iris Xe Graphics G7 96EUs (13.2 - 31.7, n=167) | |
| Networking | |
| iperf3 transmit AX12 | |
| Intel NUC11PHKi7C | |
| Intel Hades Canyon NUC8i7HVK | |
| iperf3 receive AX12 | |
| Intel NUC11PHKi7C | |
| Intel Hades Canyon NUC8i7HVK | |
| SD Card Reader | |
| average JPG Copy Test (av. of 3 runs) | |
| Intel NUC11PHKi7C (Toshiba Exceria Pro SDXC 64 GB UHS-II) | |
| Intel Hades Canyon NUC8i7HVK (Toshiba Exceria Pro SDXC 64 GB UHS-II) | |
| maximum AS SSD Seq Read Test (1GB) | |
| Intel NUC11PHKi7C (Toshiba Exceria Pro SDXC 64 GB UHS-II) | |
| Intel Hades Canyon NUC8i7HVK (Toshiba Exceria Pro SDXC 64 GB UHS-II) | |
| Intel NUC11PHKi7C GeForce RTX 2060 Mobile, i7-1165G7, Samsung SSD 980 Pro 500GB MZ-V8P500BW | Intel Hades Canyon NUC8i7HVK Vega M GH, i7-8809G, Intel Optane 120 GB SSDPEK1W120GA | |
|---|---|---|
| Noise | -10% | |
| desligado / ambiente * (dB) | 24.5 | 28.7 -17% |
| Idle Minimum * (dB) | 25.3 | 29 -15% |
| Idle Average * (dB) | 25.3 | 29 -15% |
| Idle Maximum * (dB) | 25.3 | 29 -15% |
| Load Average * (dB) | 36.4 | 36 1% |
| Witcher 3 ultra * (dB) | 39.7 | 42 -6% |
| Load Maximum * (dB) | 47.9 | 49.4 -3% |
* ... menor é melhor
| Intel NUC11PHKi7C i7-1165G7, GeForce RTX 2060 Mobile, Samsung SSD 980 Pro 500GB MZ-V8P500BW, , x, | Intel Hades Canyon NUC8i7HVK i7-8809G, Vega M GH, Intel Optane 120 GB SSDPEK1W120GA, , x, | |
|---|---|---|
| Power Consumption | -40% | |
| Idle Minimum * (Watt) | 5.8 | 15.5 -167% |
| Idle Average * (Watt) | 5.9 | 16.2 -175% |
| Idle Maximum * (Watt) | 20.7 | 16.5 20% |
| Load Average * (Watt) | 130.8 | 83.4 36% |
| Witcher 3 ultra * (Watt) | 154.4 | 121.7 21% |
| Load Maximum * (Watt) | 225.2 | 173.5 23% |
* ... menor é melhor

Price comparison

