Kaby Lake-G é história: Revisão Intel Phantom Canyon NUC11PHKi7C
 vs. 2018 Intel Hades Canyon (direita)")
(26 de abril de 2021 atualização: Estamos confirmando com a Intel se a NUC11PHK suporta ou não a G-Sync e se o crânio azul iluminado por LED pode ser mudado para cores diferentes. A página será atualizada assim que tivermos a informação)
Ao contrário dos mais lentos e menos caros NUC11TNK ou NUC11PAQo NUC11PHK Phantom Canyon vem de série com um discreto GeForce RTX 2060 GPU para um desempenho gráfico e potencial de jogos significativamente mais rápidos. Ele sucede diretamente o NUC8 Hades Canyon e não o NUC9 Extremo já que seu chassi se assemelha mais ao primeiro e não ao segundo.
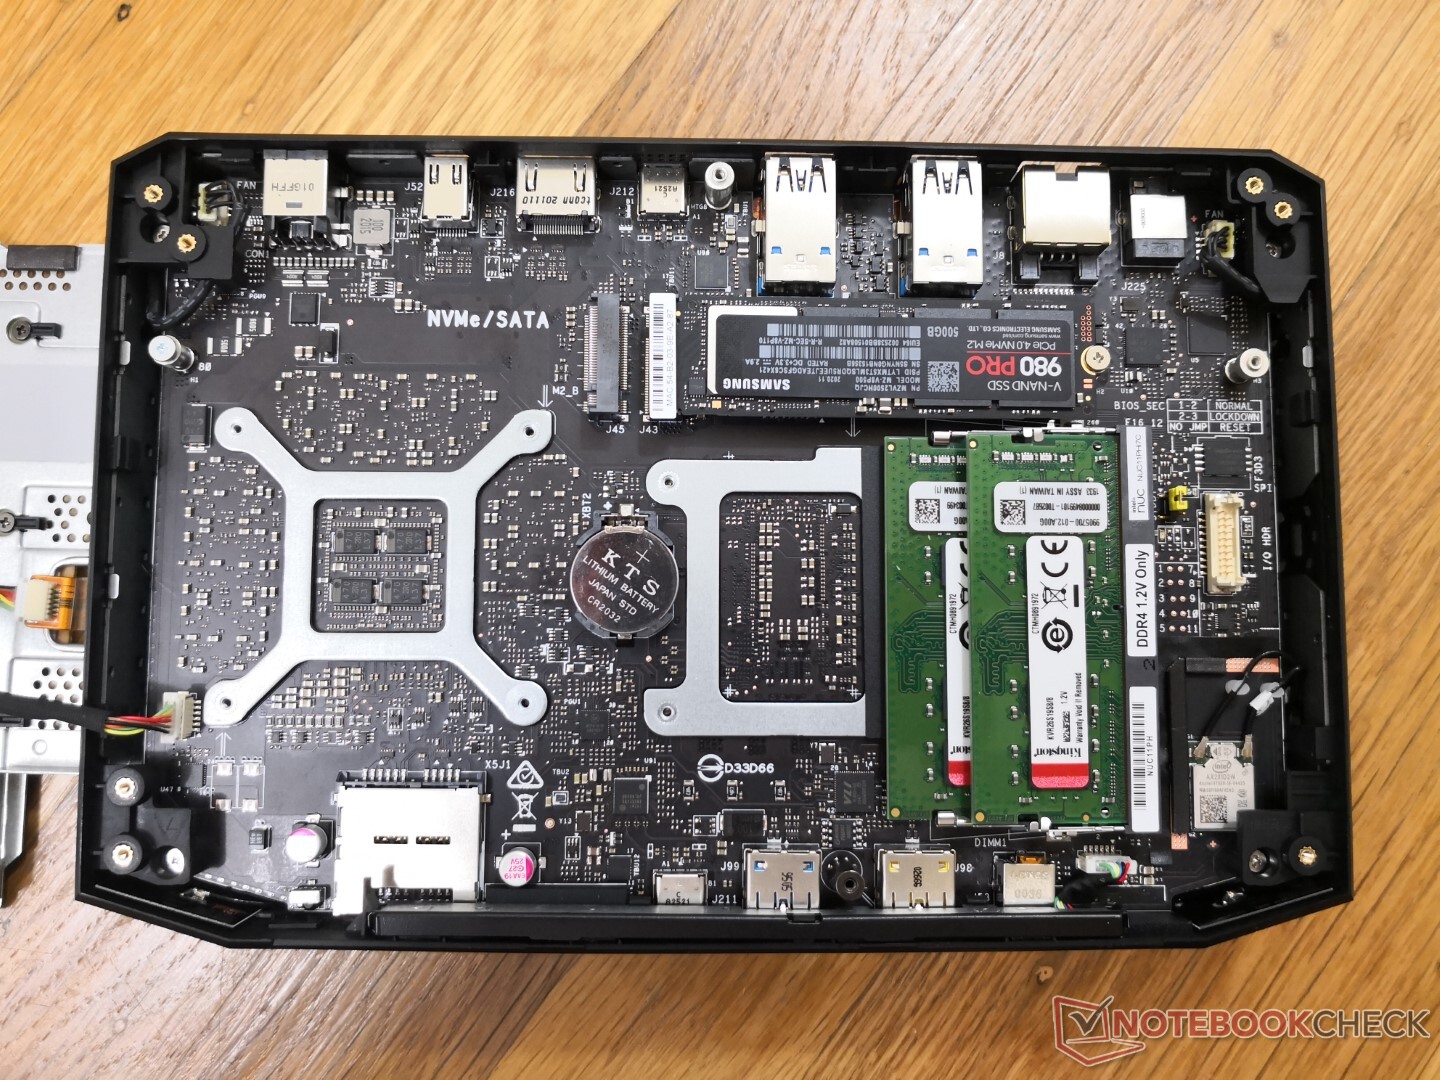
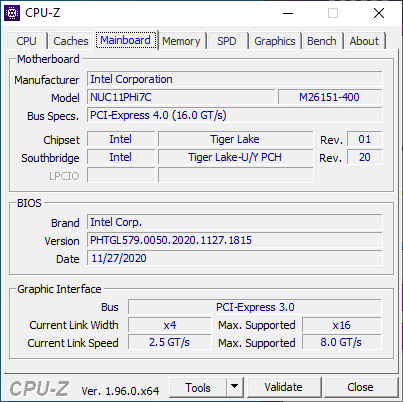
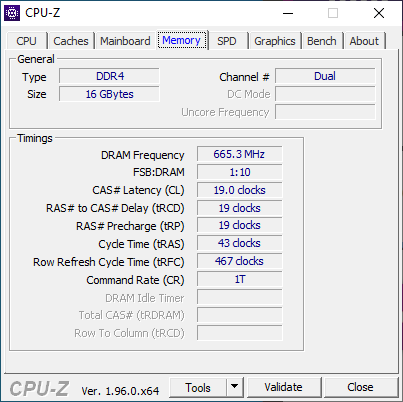
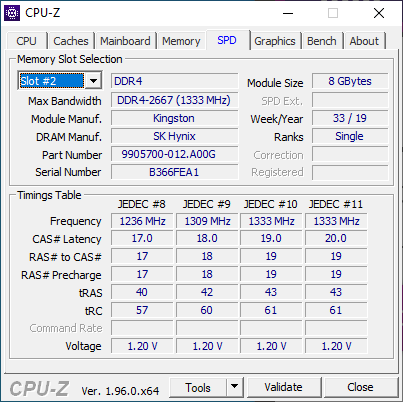
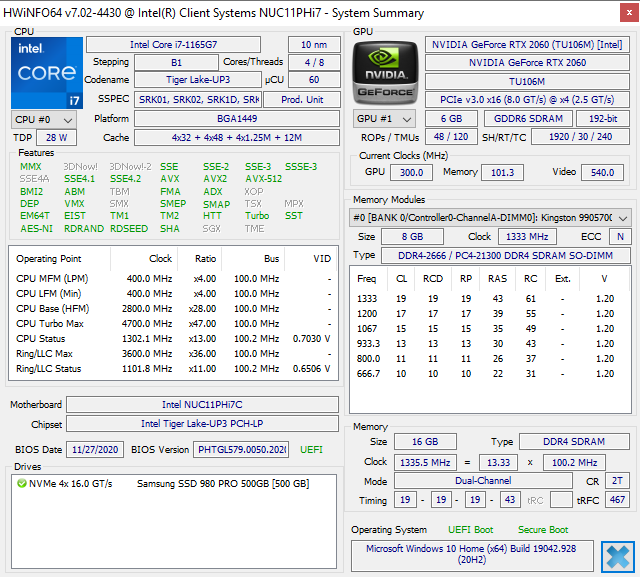
O Phantom Canyon é enviado como um kit de barebones e por isso optamos por instalar um Samsung 980 Pro NVMe SSD com 16 GB de RAM de canal duplo DDR4-2666 para nossos propósitos de revisão. O próprio NUC pode suportar uma RAM mais rápida de até 3200 MHz.
Mais análises da Intel NUC:
potential competitors in comparison
Avaliação | Data | Modelo | Peso | Altura | Size | Resolução | Preço |
|---|---|---|---|---|---|---|---|
v (old) | 04/2021 | Intel NUC11PHKi7C i7-1165G7, GeForce RTX 2060 Mobile | 1.4 kg | 42 mm | x | ||
v (old) | Intel Hades Canyon NUC8i7HVK i7-8809G, Vega M GH | 1.3 kg | 39 mm | x | |||
v (old) | 02/2021 | Intel NUC11PAQi7 i7-1165G7, Iris Xe G7 96EUs | 647 g | 56 mm | x | ||
v (old) | 03/2021 | GMK NucBox 2 i5-8259U, Iris Plus Graphics 655 | 430 g | 50 mm | x | ||
v (old) | 03/2018 | Zotac ZBOX Magnus EK71080 i7-7700HQ, GeForce GTX 1080 (Desktop) | 3.3 kg | 128 mm | 0.00" | x | |
v (old) | 02/2021 | Aorus Gaming Box GeForce RTX 2080 Ti i7-1165G7 | 3.8 kg | 140 mm | x | ||
v (old) | Beelink GTR35 II-G-16512D00W64PRO-1T R5 3550H, Vega 8 | 843 g | 39 mm | x |
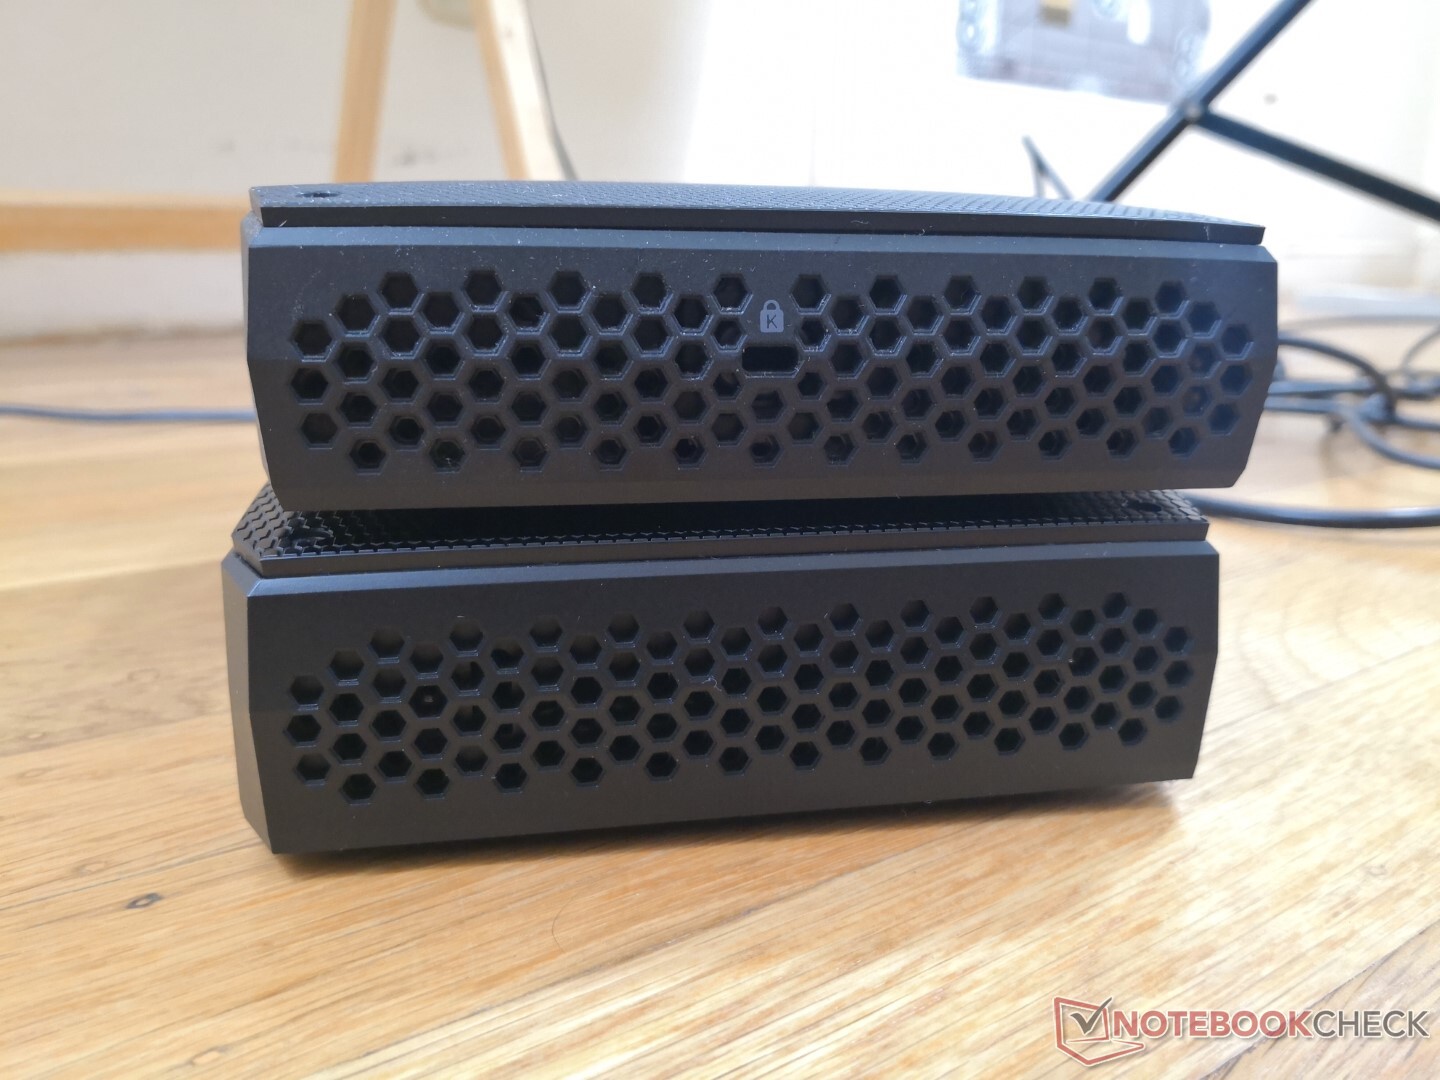
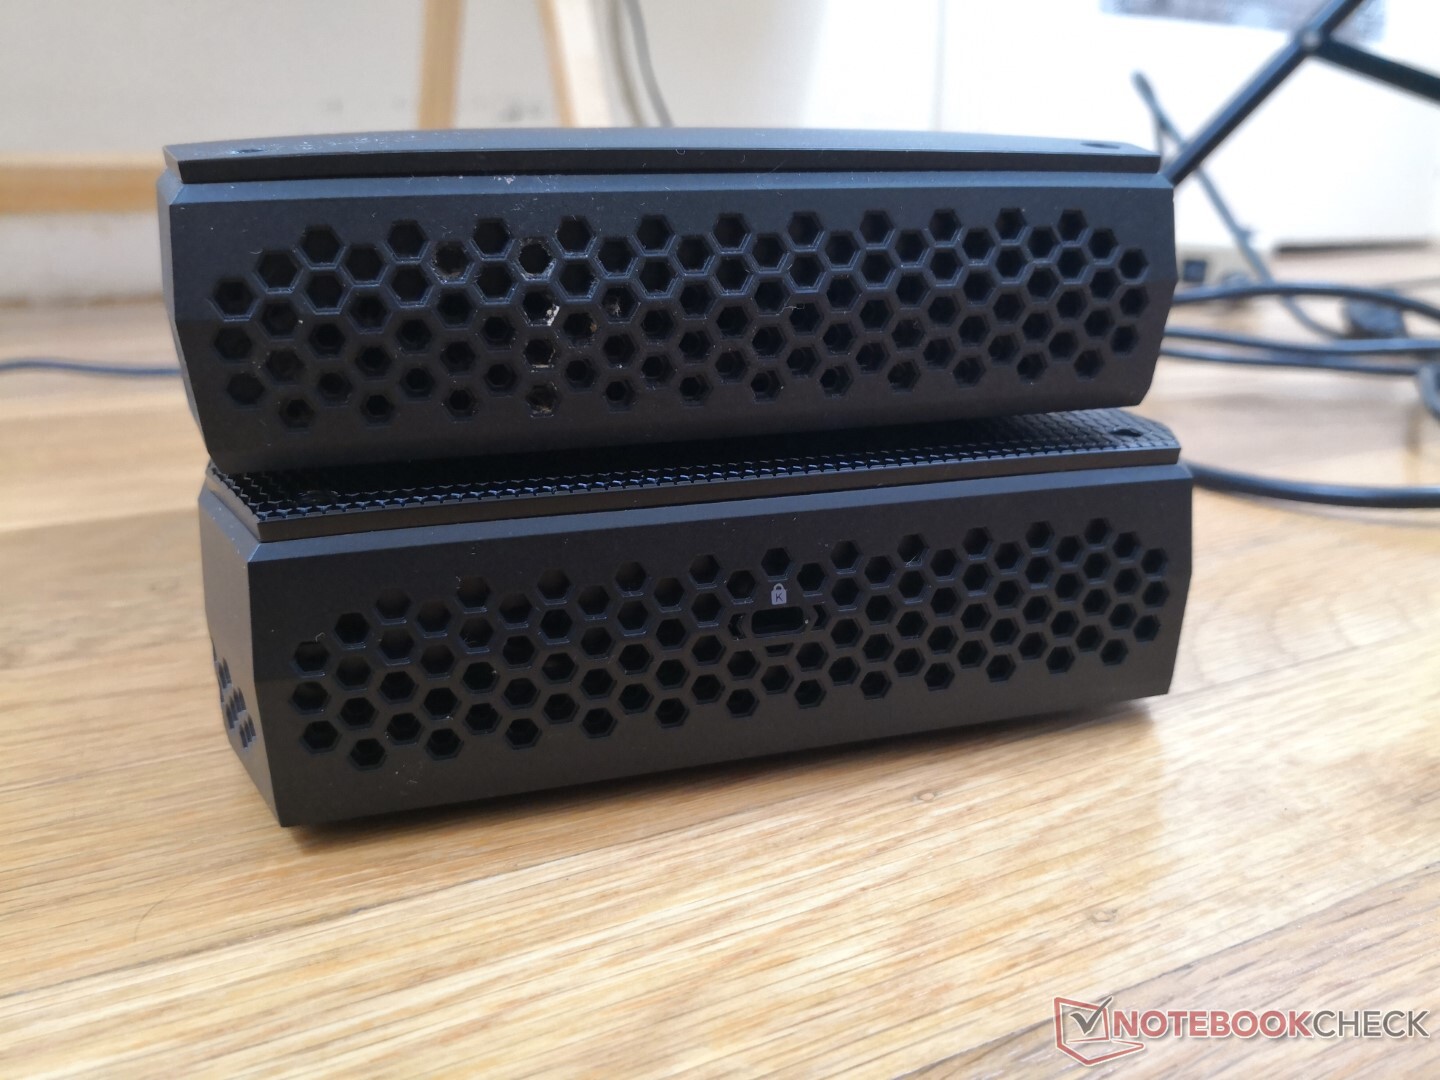
Caso
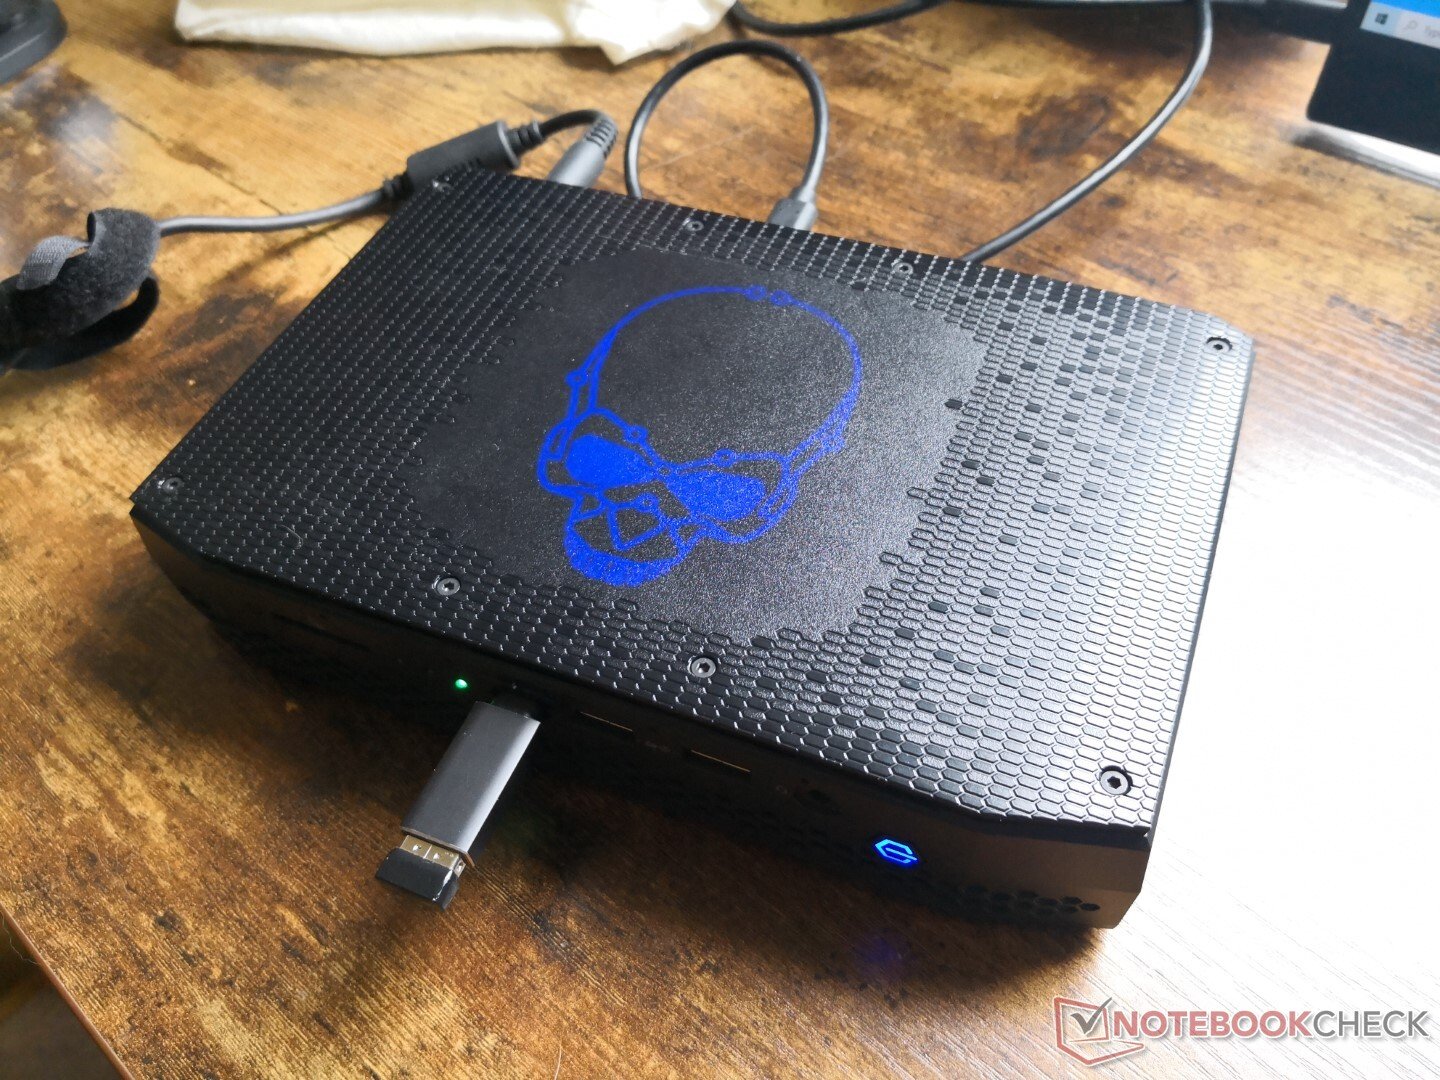
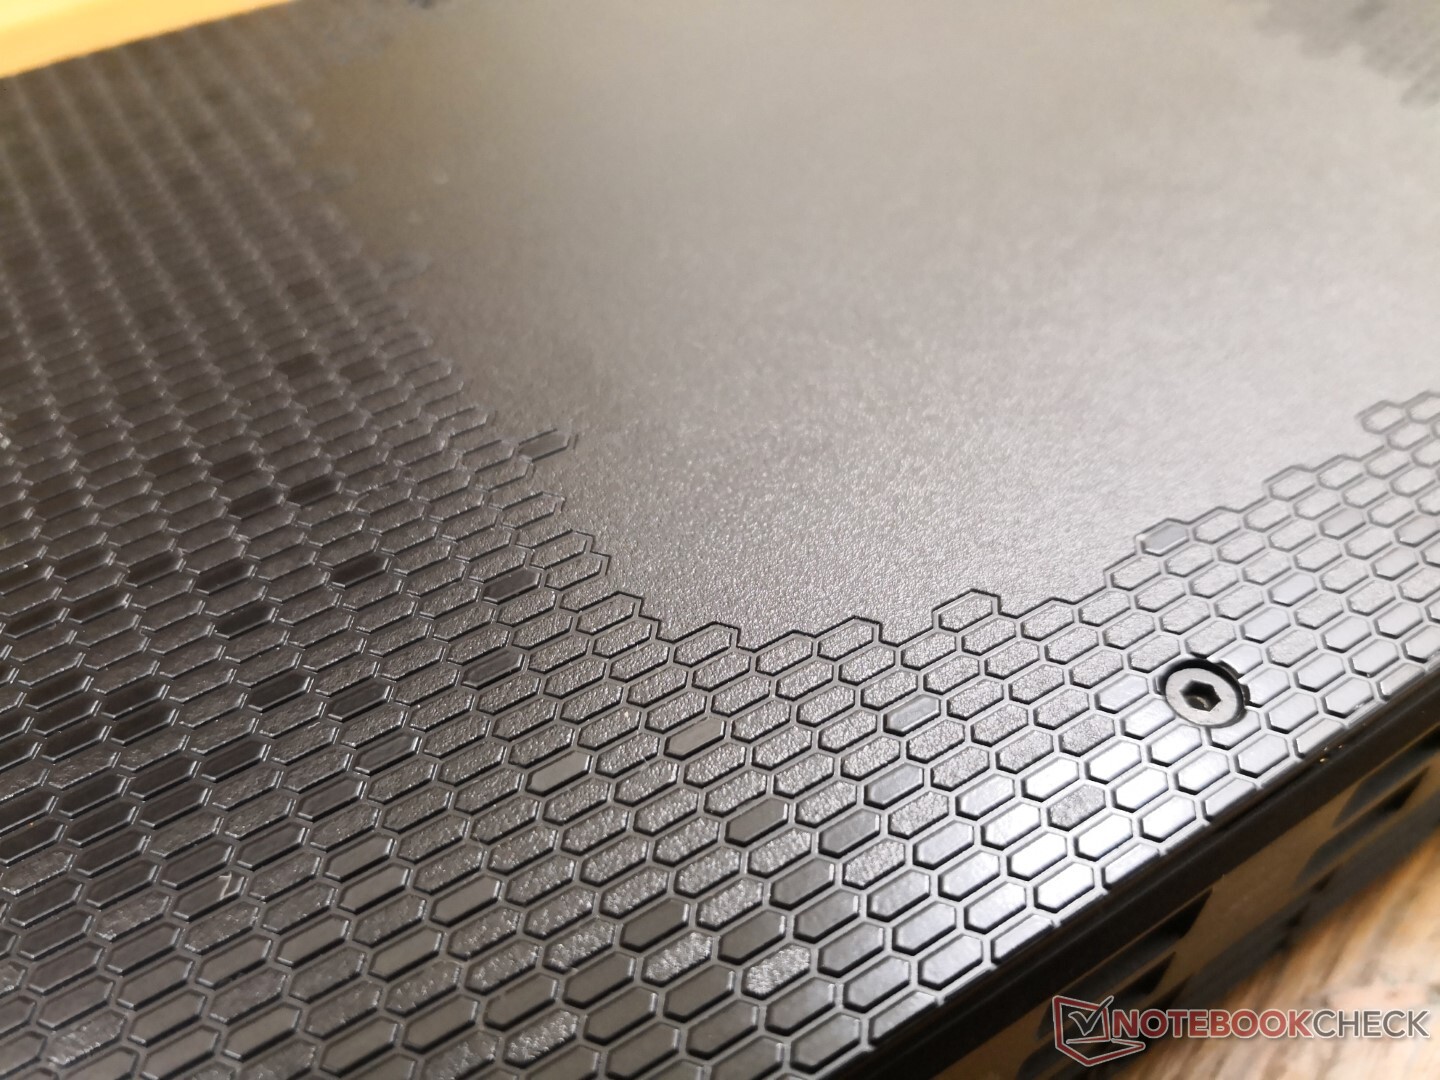
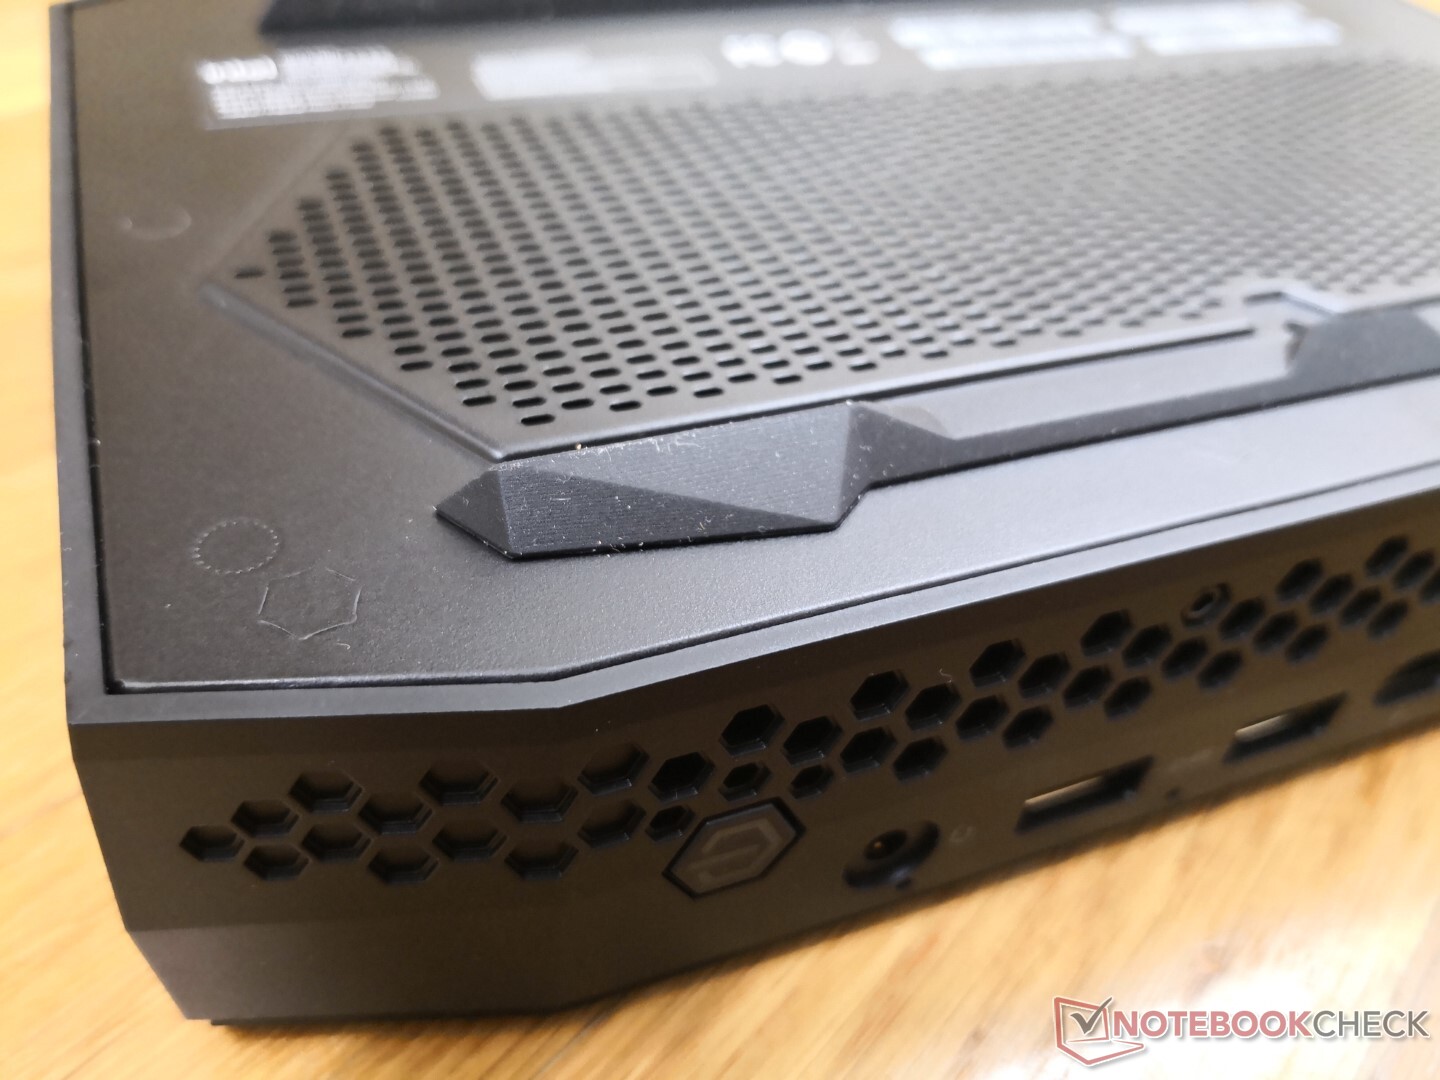
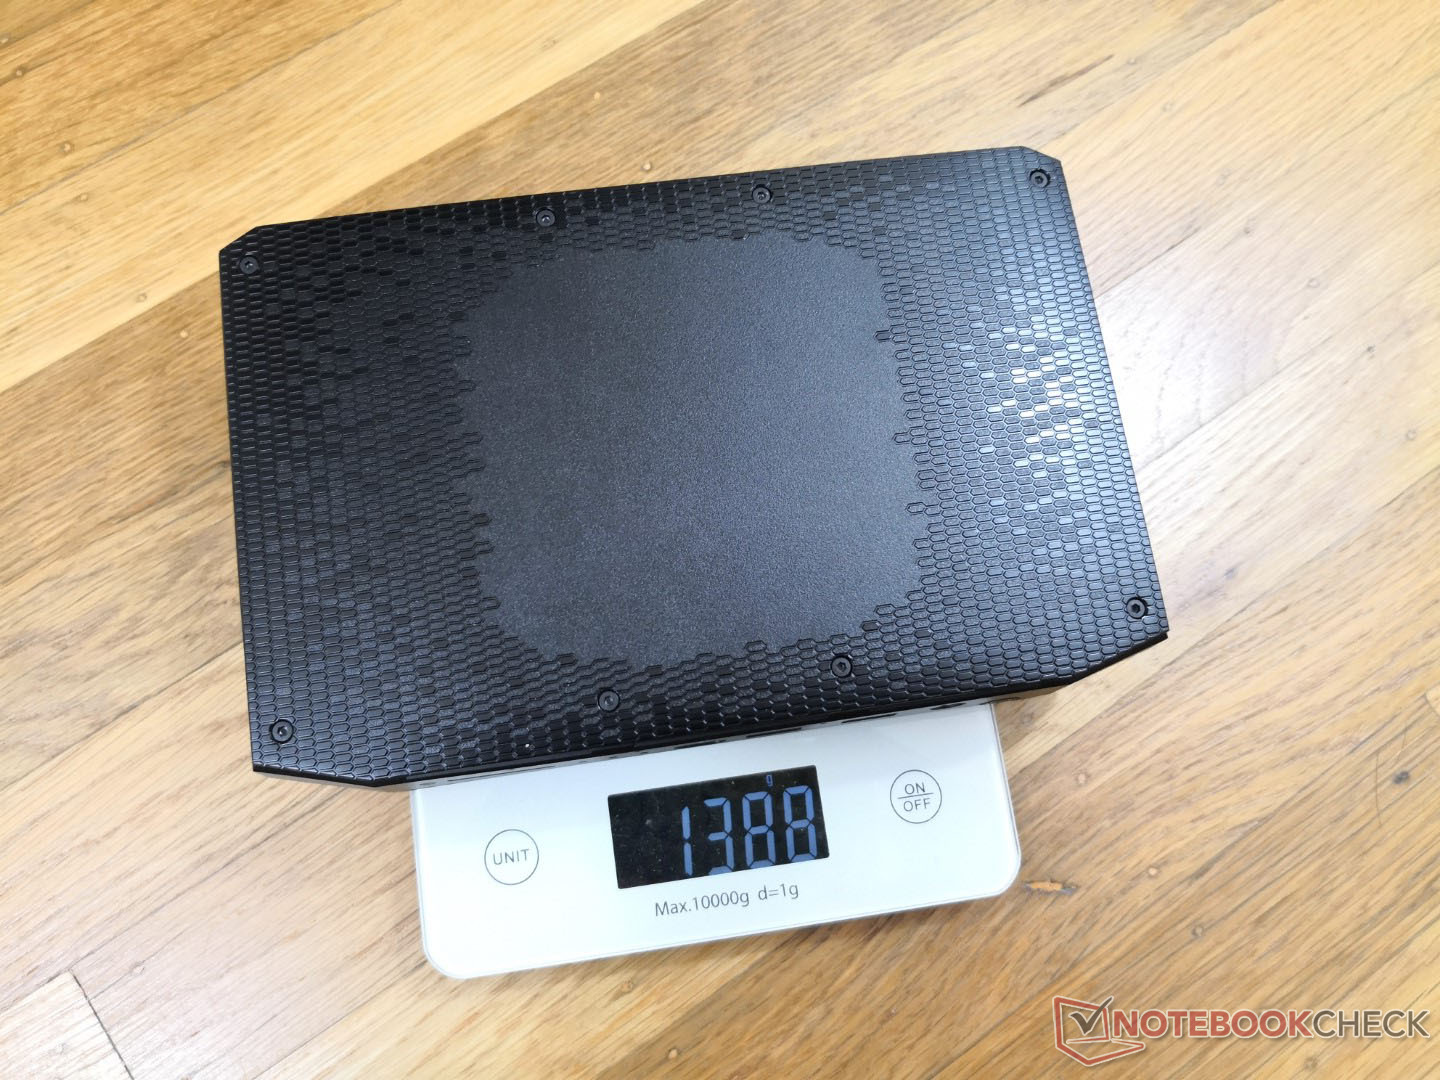
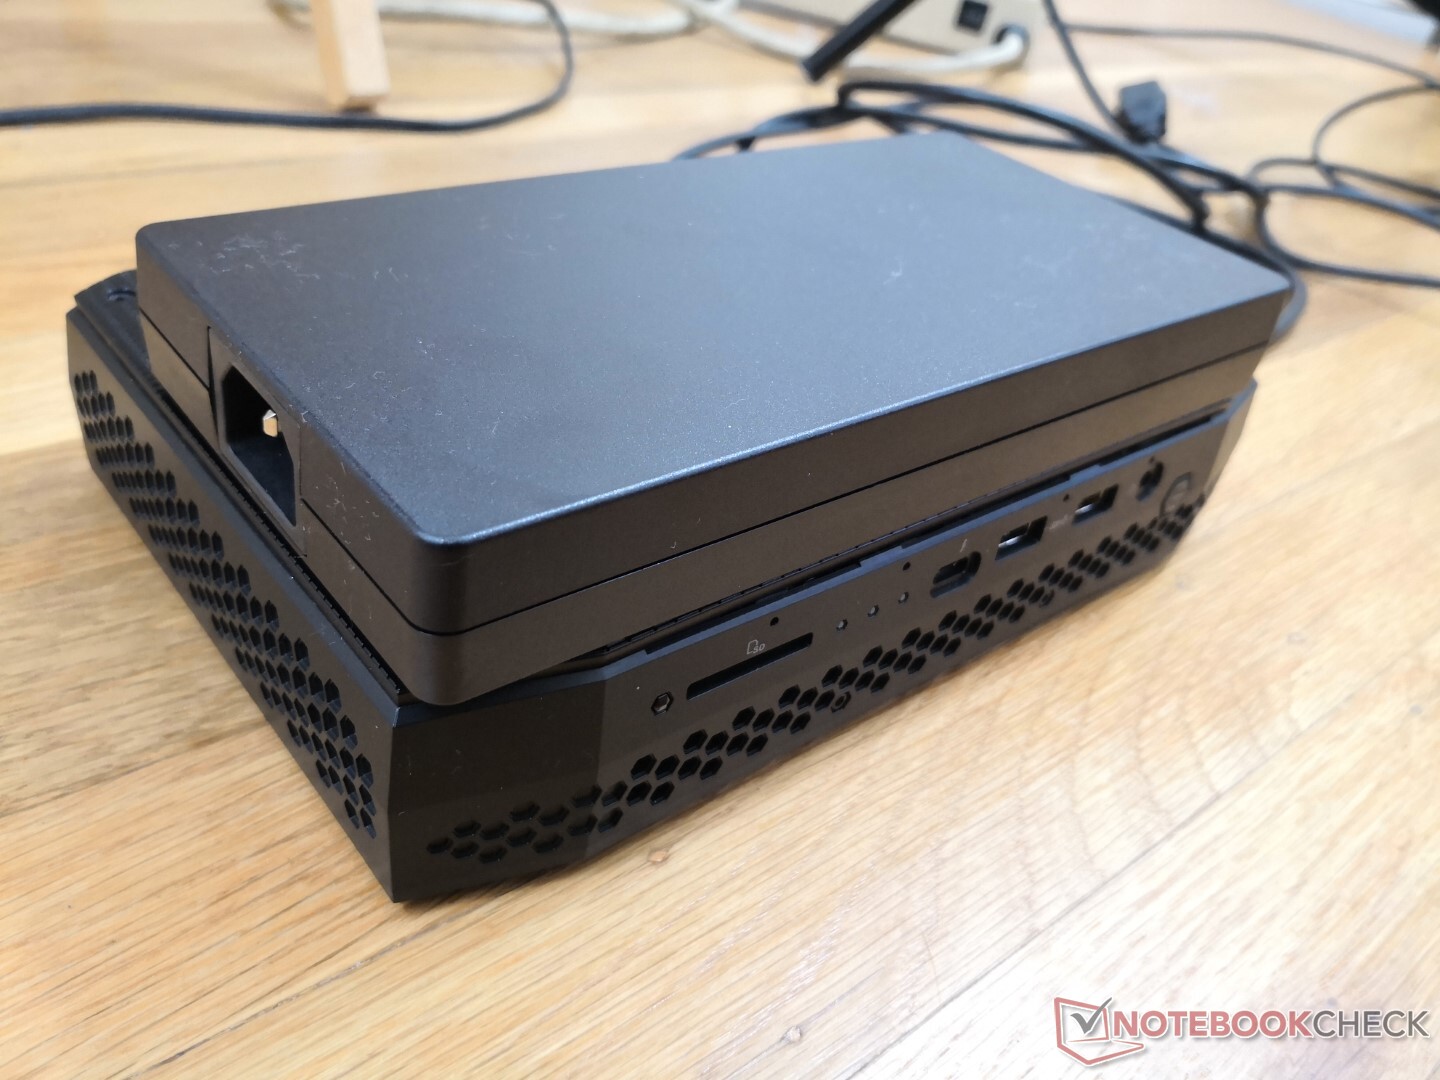
Os materiais e o tamanho do chassi são essencialmente os mesmos que no Hades Canyon NUC com apenas pequenas alterações cosméticas nas texturas e grelhas de ventilação. Entretanto, o Phantom Canyon é ligeiramente mais grosso (42 mm vs. 39 mm) e mais pesado (1,4 kg vs. 1,3 kg) do que seu predecessor imediato, a fim de melhor acomodar os processadores mais ávidos de energia e para a nova placa frontal removível iluminada por LEDs.
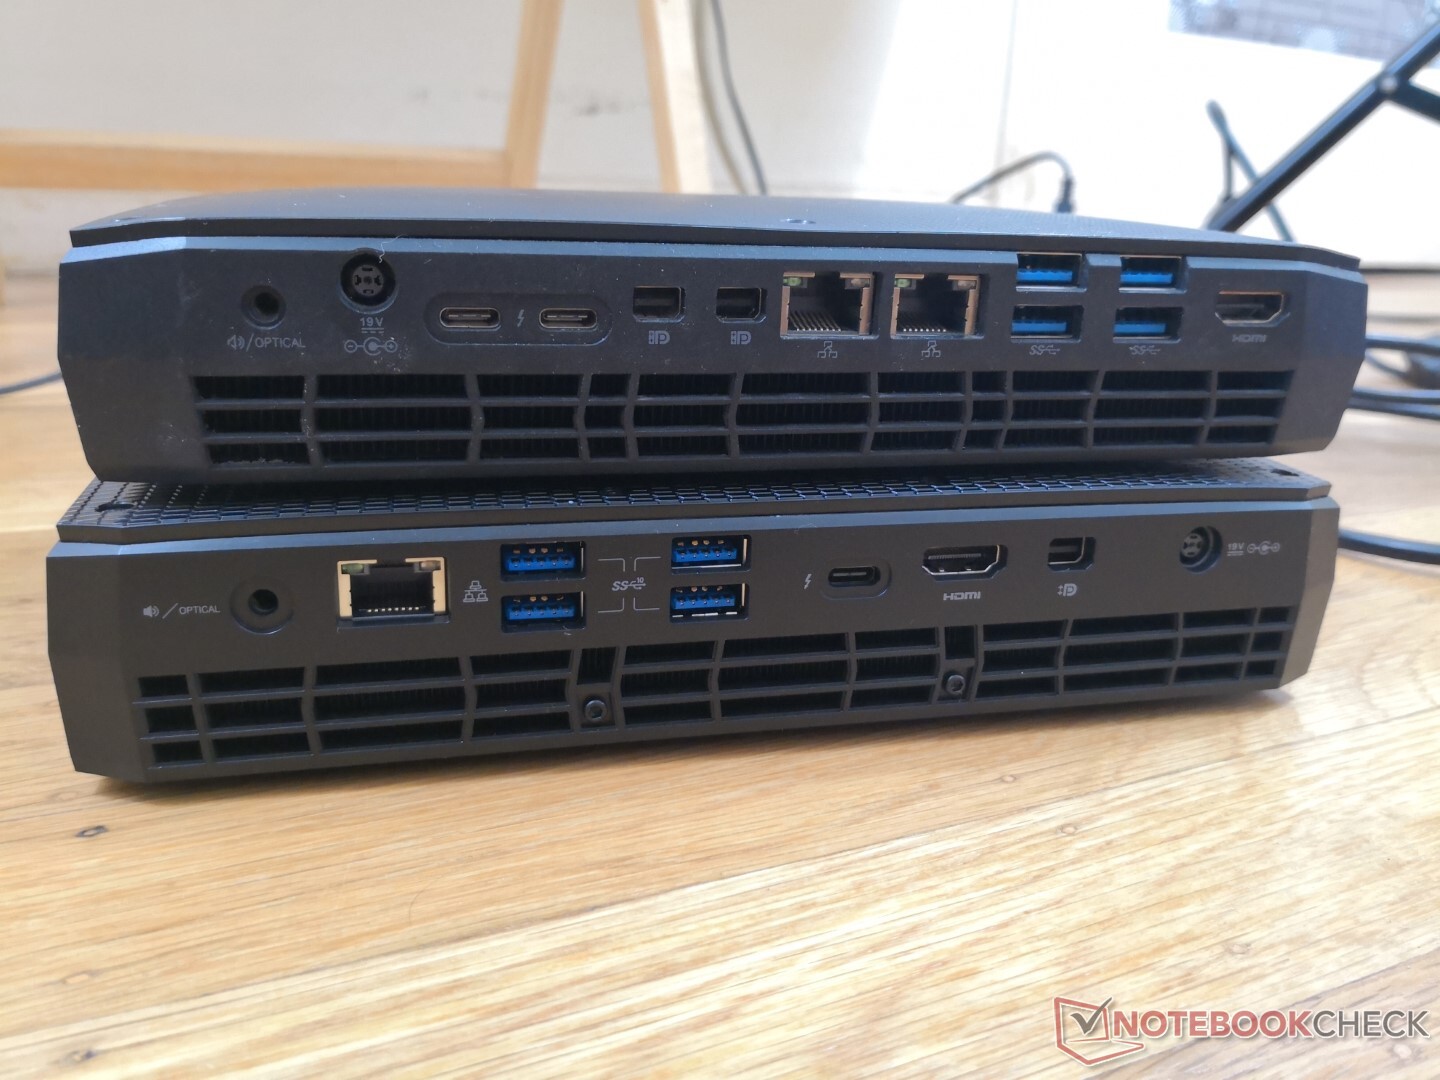
Conectividade
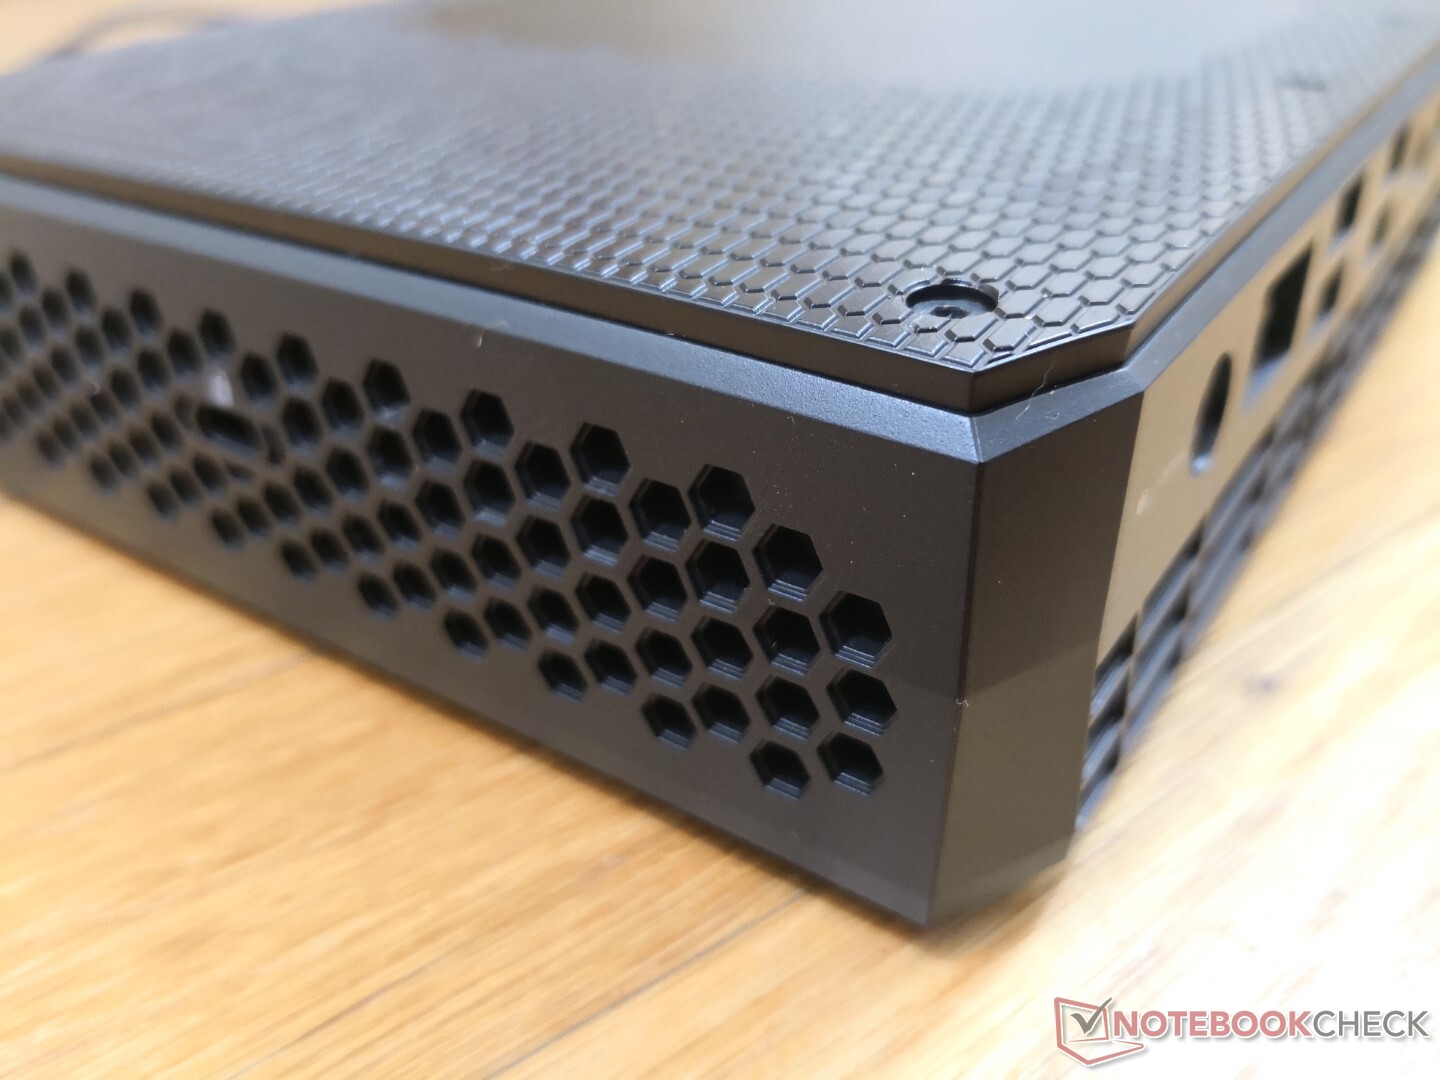
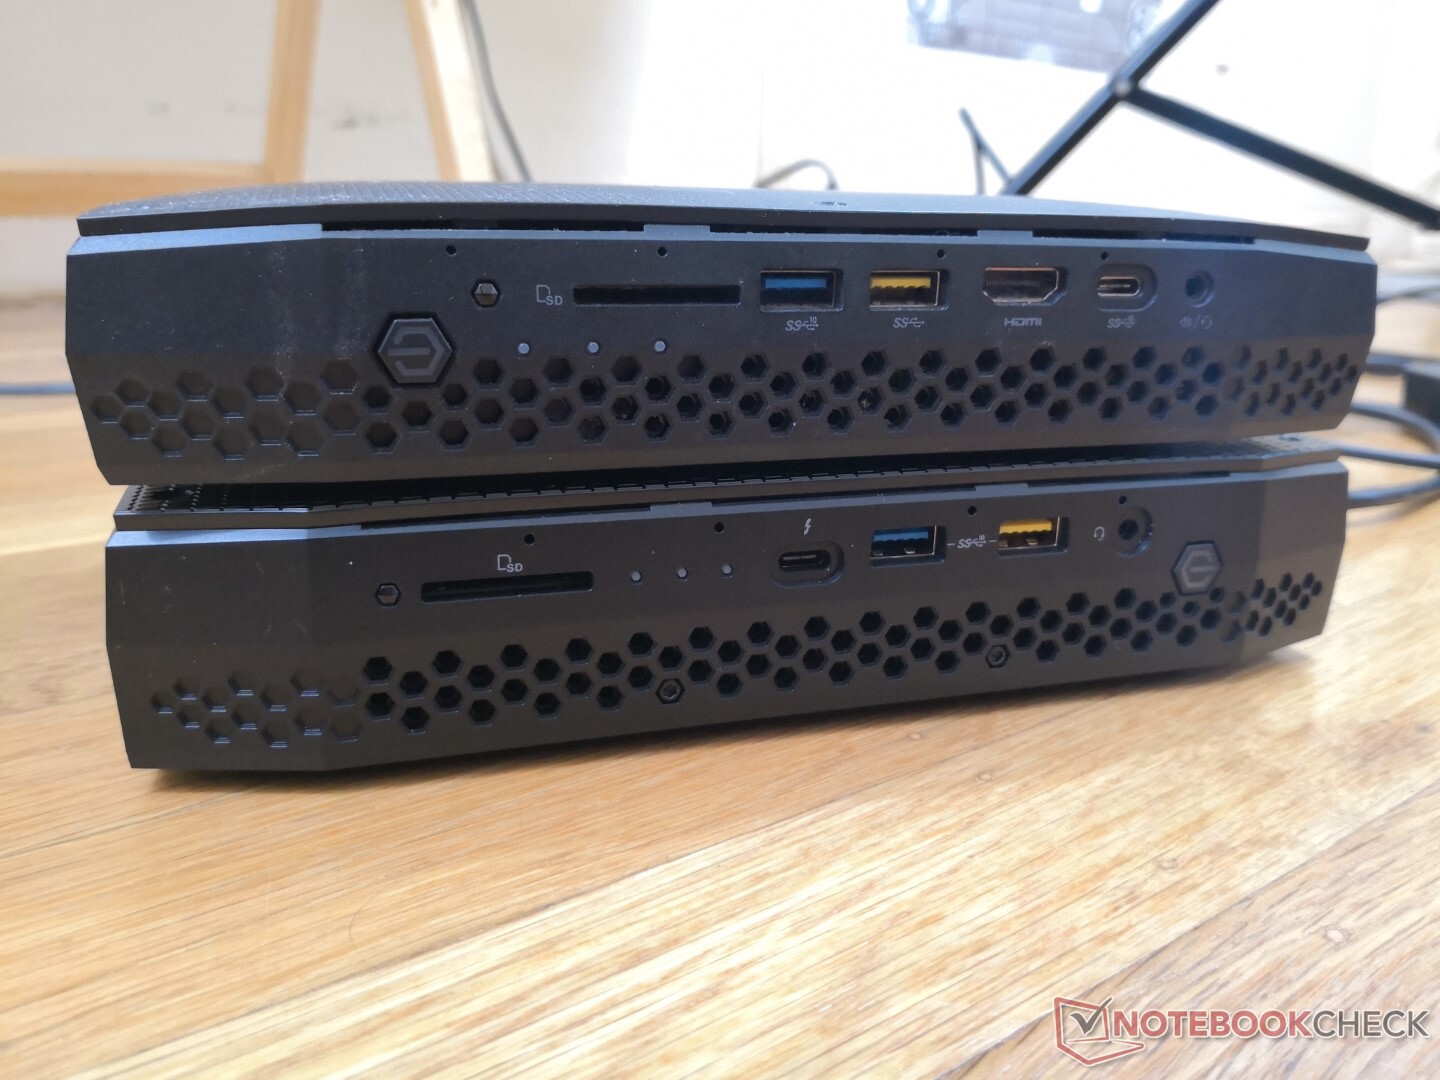
As opções de porto mudaram a partir de 2018 Hades Canyon. Agora há apenas uma porta RJ-45, uma porta HDMI, uma mini-DisplayPort e duas USB-C c/ Thunderbolt 4 em vez de duas RJ-45, duas HDMI, duas mini-DisplayPort, e três USB-C no modelo anterior. Todas as seis portas USB-A permanecem.
A NUC não pode ser alimentada por USB-C e, mesmo que pudesse, exigiria mais suco para funcionar do que o limite de 100 W de USB-C.
As imagens abaixo comparam a NUC8 Hades Canyon (superior) com a NUC11 Phantom Canyon (inferior).
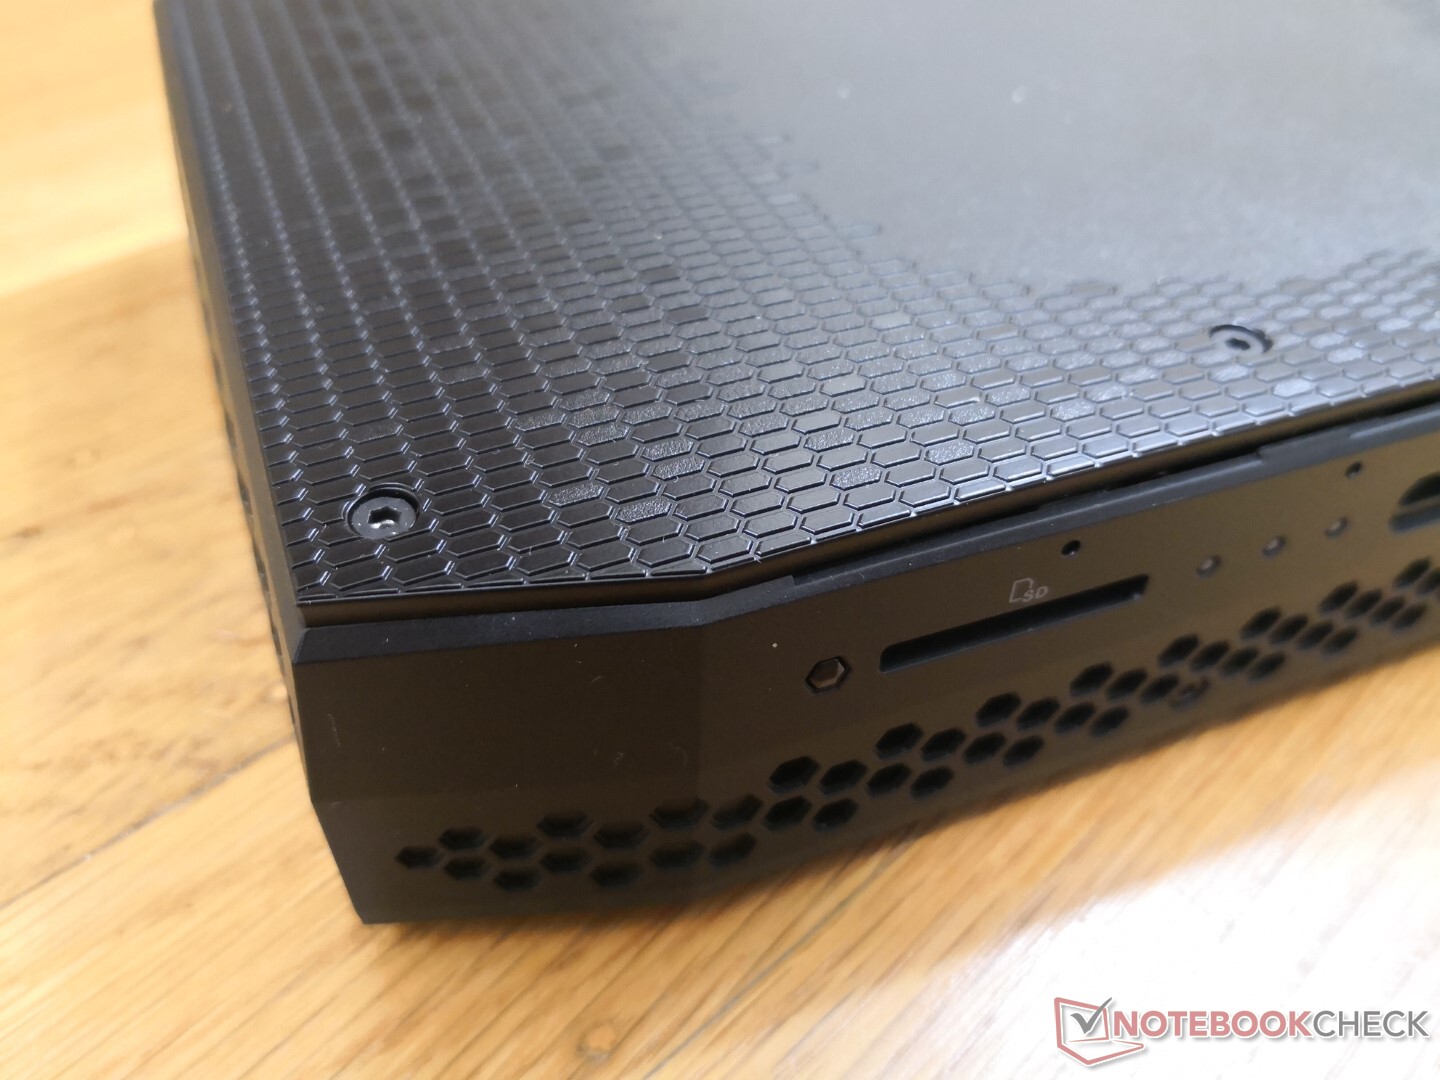
Leitor de cartões SD
O leitor SD integrado oferece taxas de transferência mais rápidas do que o leitor de cartões em Hades Canyon. Ele não é carregado por mola, ao contrário da maioria dos laptops.
| SD Card Reader | |
| average JPG Copy Test (av. of 3 runs) | |
| Intel NUC11PAQi7 (Toshiba Exceria Pro SDXC 64 GB UHS-II) | |
| Intel NUC11PHKi7C (Toshiba Exceria Pro SDXC 64 GB UHS-II) | |
| Intel Hades Canyon NUC8i7HVK (Toshiba Exceria Pro SDXC 64 GB UHS-II) | |
| Zotac ZBOX Magnus EK71080 (Toshiba Exceria Pro SDXC 64 GB UHS-II) | |
| GMK NucBox 2 (Toshiba Exceria Pro M501 UHS-II) | |
| maximum AS SSD Seq Read Test (1GB) | |
| Intel NUC11PHKi7C (Toshiba Exceria Pro SDXC 64 GB UHS-II) | |
| Intel NUC11PAQi7 (Toshiba Exceria Pro SDXC 64 GB UHS-II) | |
| Intel Hades Canyon NUC8i7HVK (Toshiba Exceria Pro SDXC 64 GB UHS-II) | |
| Zotac ZBOX Magnus EK71080 (Toshiba Exceria Pro SDXC 64 GB UHS-II) | |
| GMK NucBox 2 (Toshiba Exceria Pro M501 UHS-II) | |
Comunicação
| Networking | |
| iperf3 transmit AX12 | |
| Intel NUC11PHKi7C | |
| Intel NUC11PAQi7 | |
| GMK NucBox 2 | |
| Intel Hades Canyon NUC8i7HVK | |
| Zotac ZBOX Magnus EK71080 | |
| iperf3 receive AX12 | |
| Intel NUC11PHKi7C | |
| Intel NUC11PAQi7 | |
| GMK NucBox 2 | |
| Intel Hades Canyon NUC8i7HVK | |
| Zotac ZBOX Magnus EK71080 | |
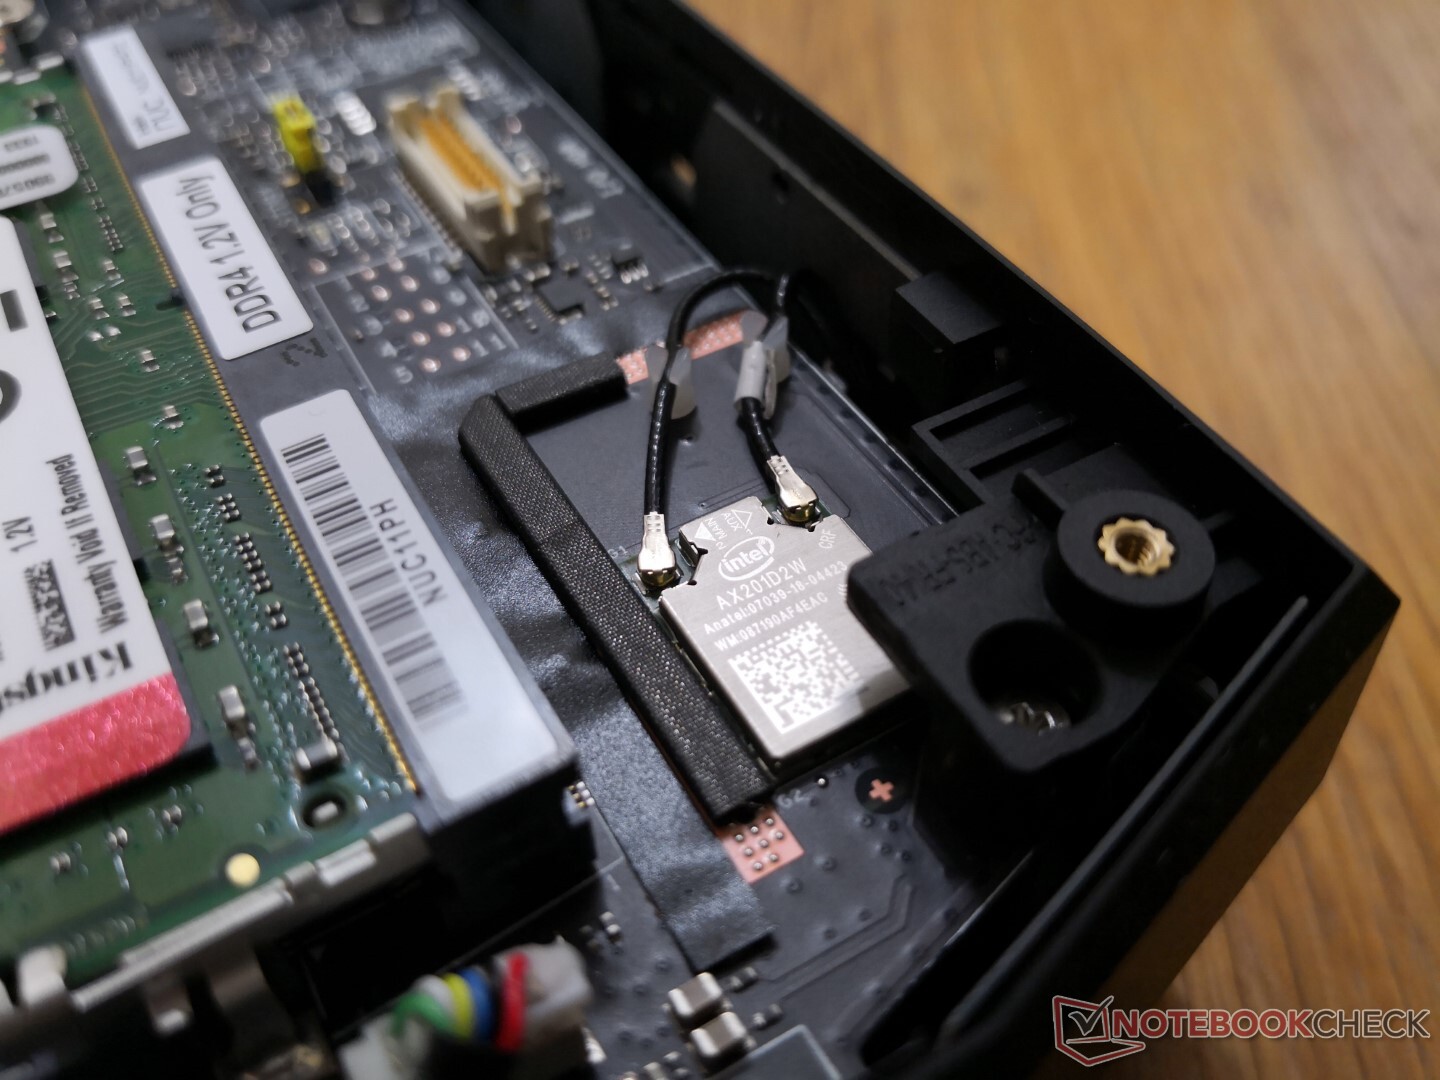
Manutenção
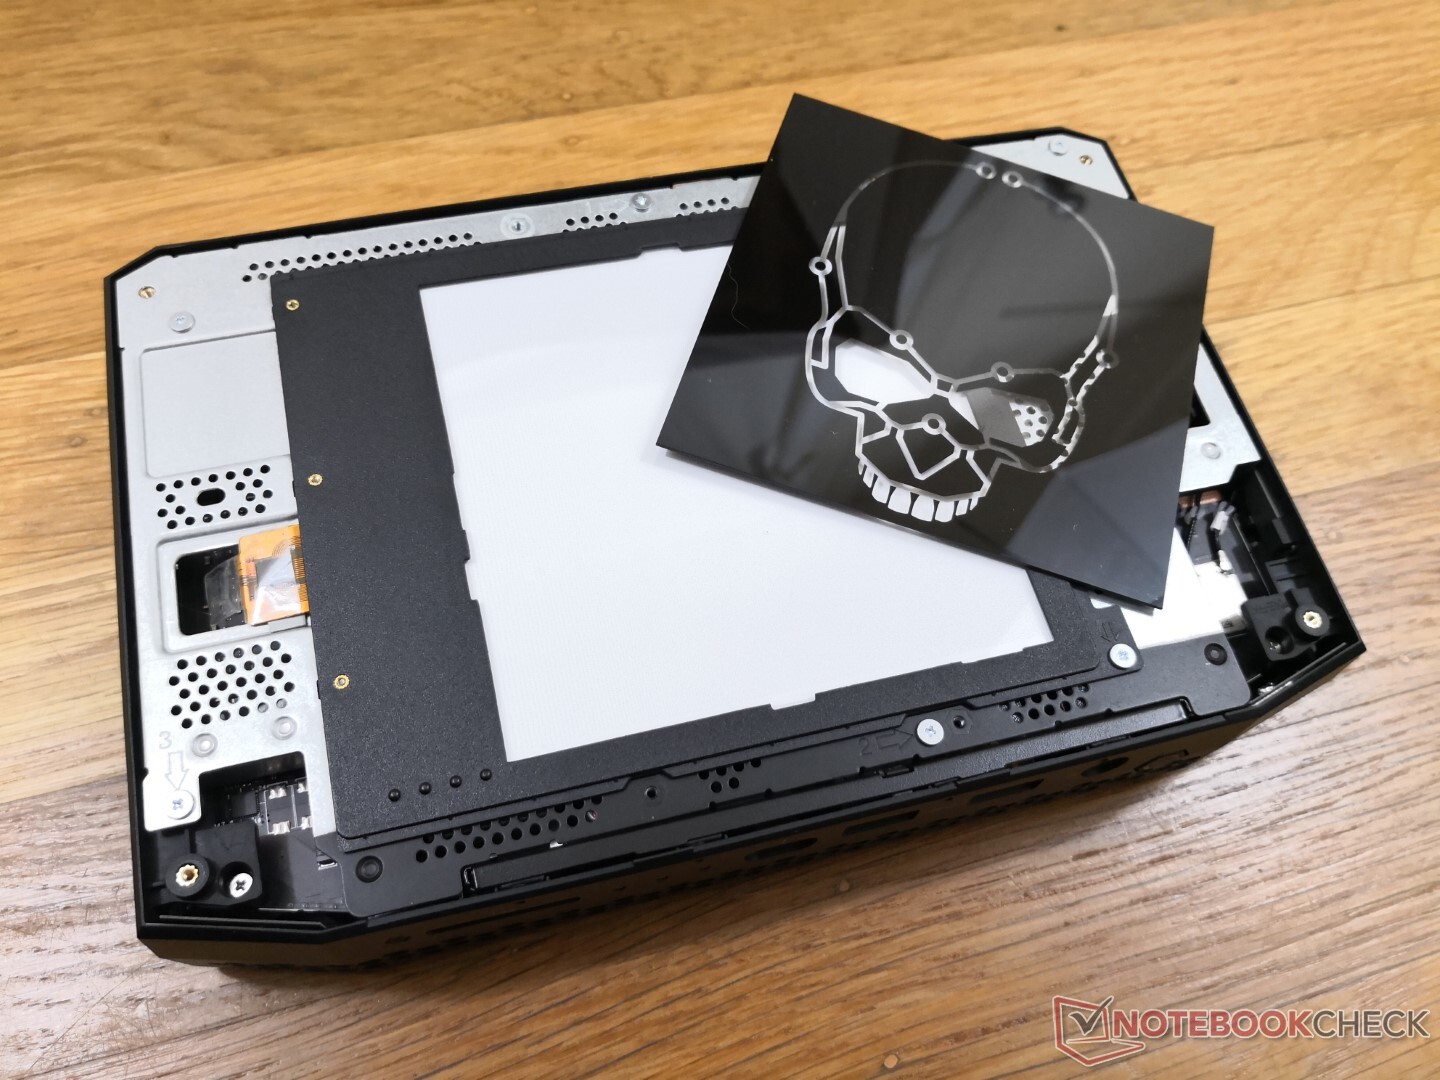
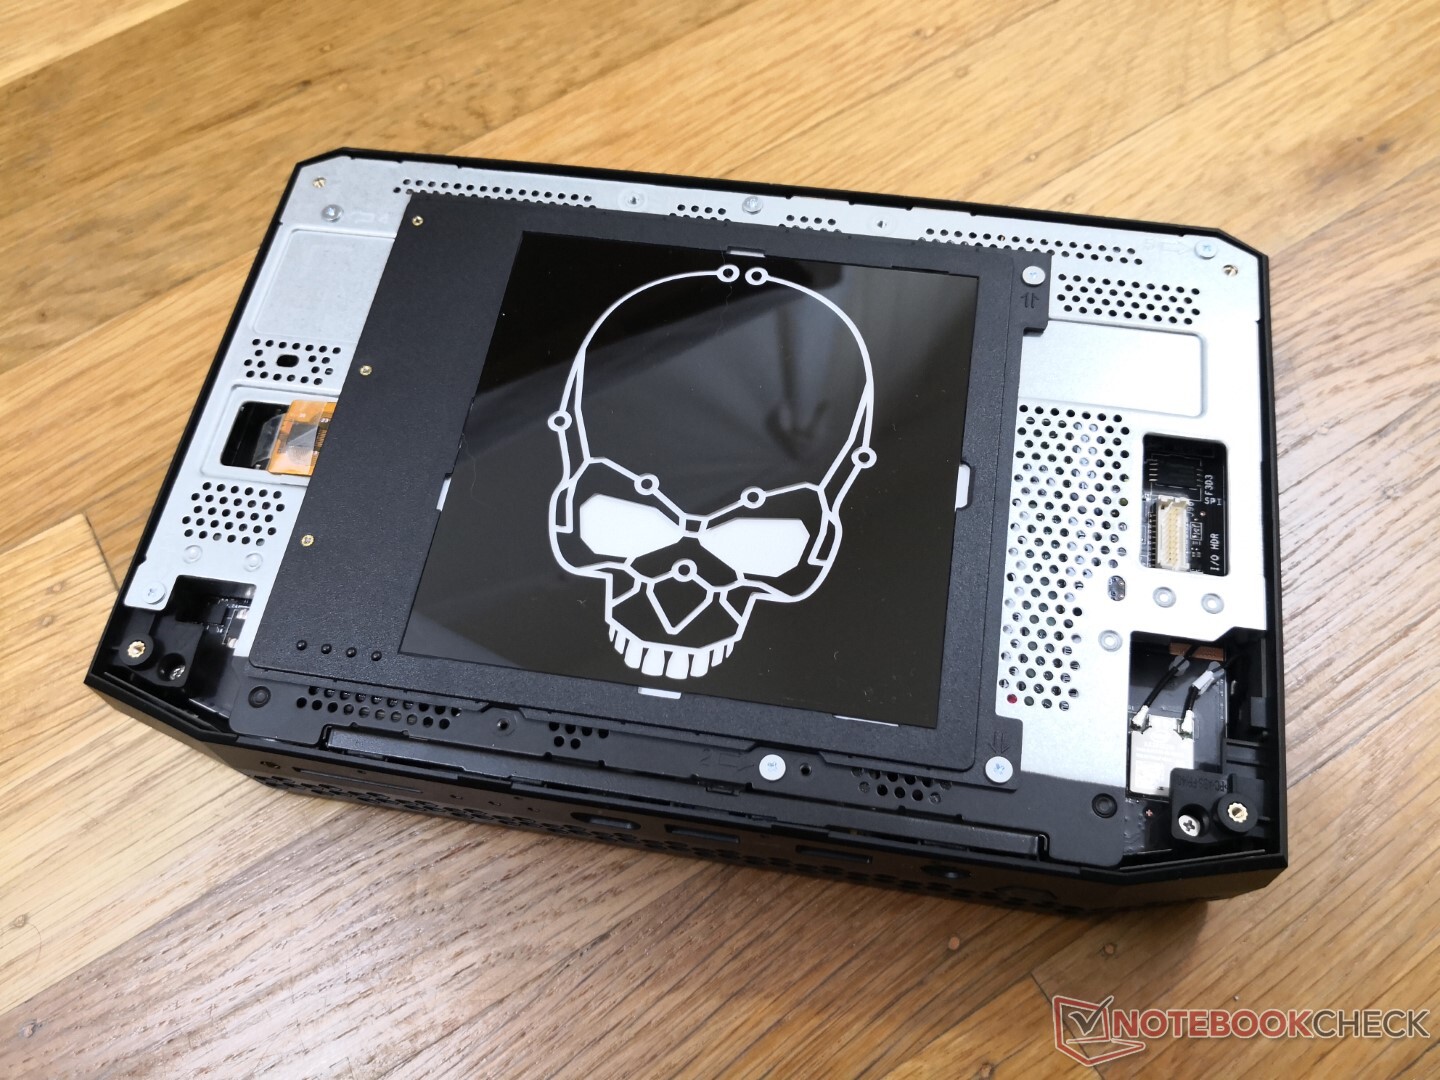
O painel superior é fixado por 8 parafusos hexagonais que protegem a placa frontal e a gaiola metálica personalizável. A remoção da gaiola de metal para acessar a RAM e os slots de armazenamento exigirá uma chave de fenda padrão Philips. O acesso à solução de resfriamento por baixo é infelizmente mais difícil e menos fácil de usar.
Acessórios e Garantia
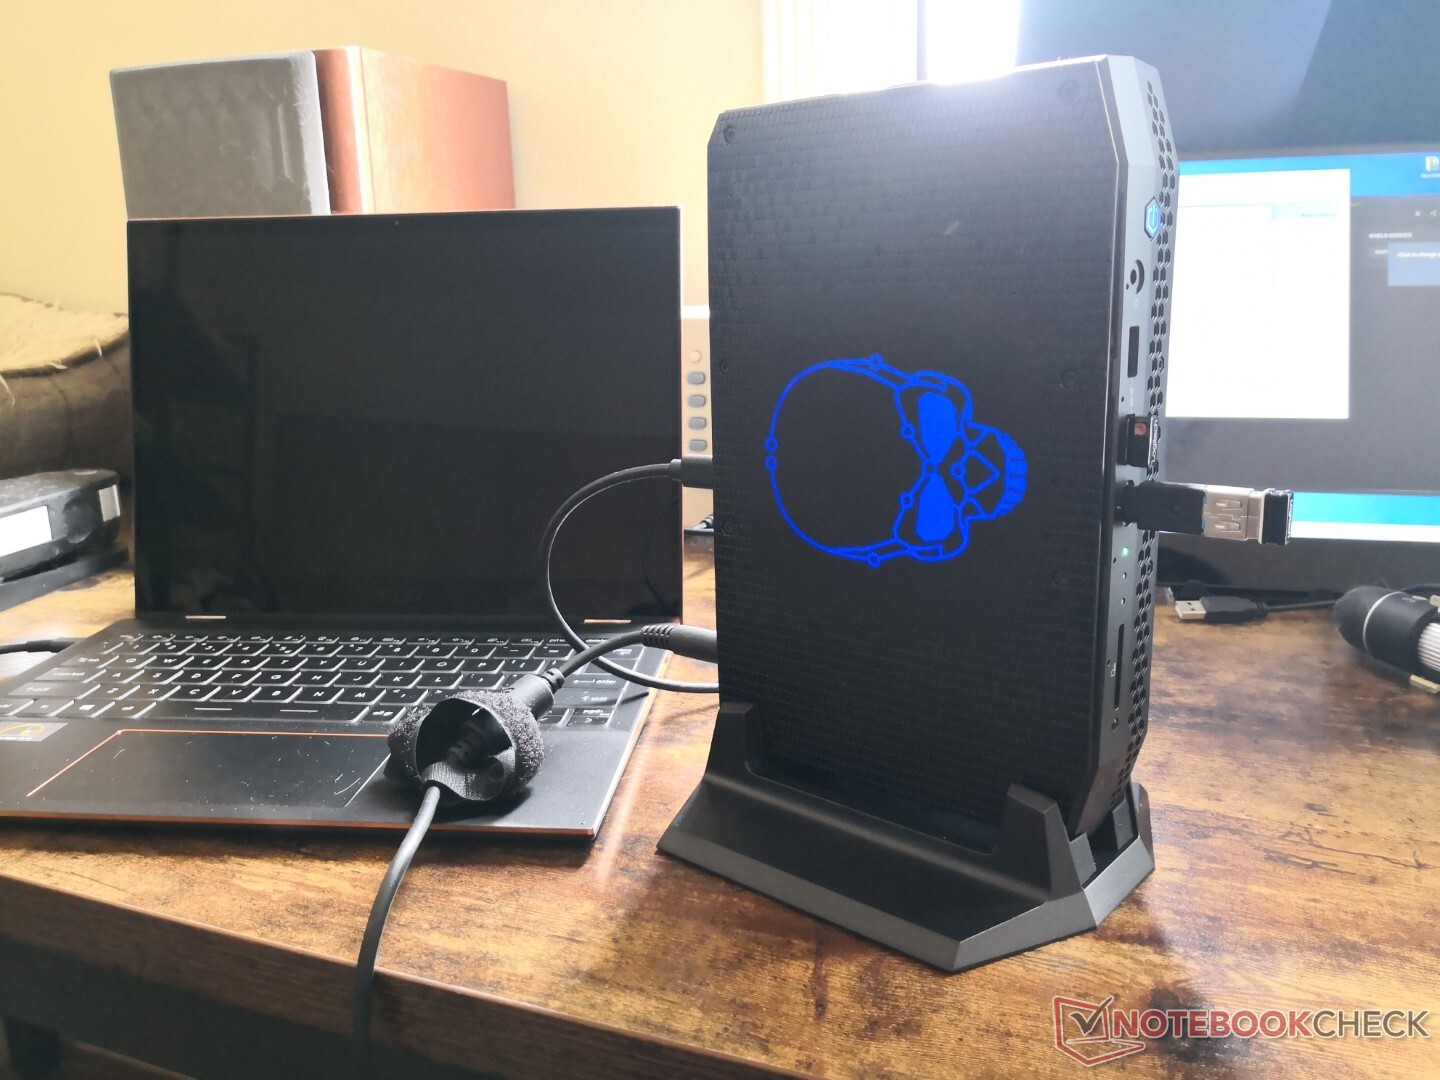
Os extras na caixa incluem um suporte VESA removível, parafusos extras, suporte vertical de plástico e cinco placas faciais de plástico transparente se os proprietários quiserem trocar o crânio iluminado por outro padrão. O suporte é felizmente firme, sem risco real de tombar. As almofadas mantêm o NUC no lugar com um pouco de folga ao longo do fundo para o fluxo de ar
Uma garantia limitada de três anos vem como padrão, ao contrário da maioria dos outros mini PCs.
Desempenho
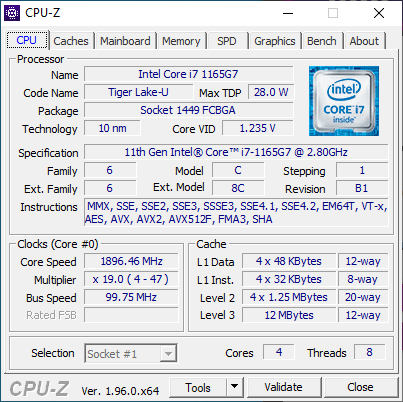
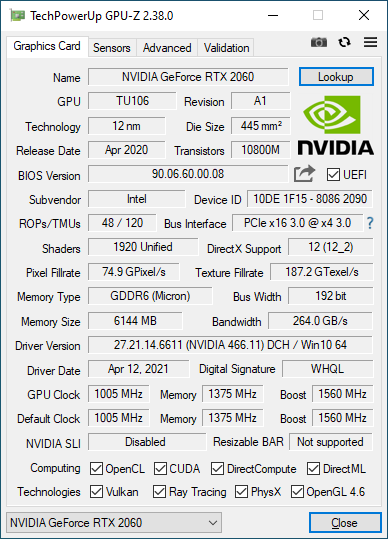
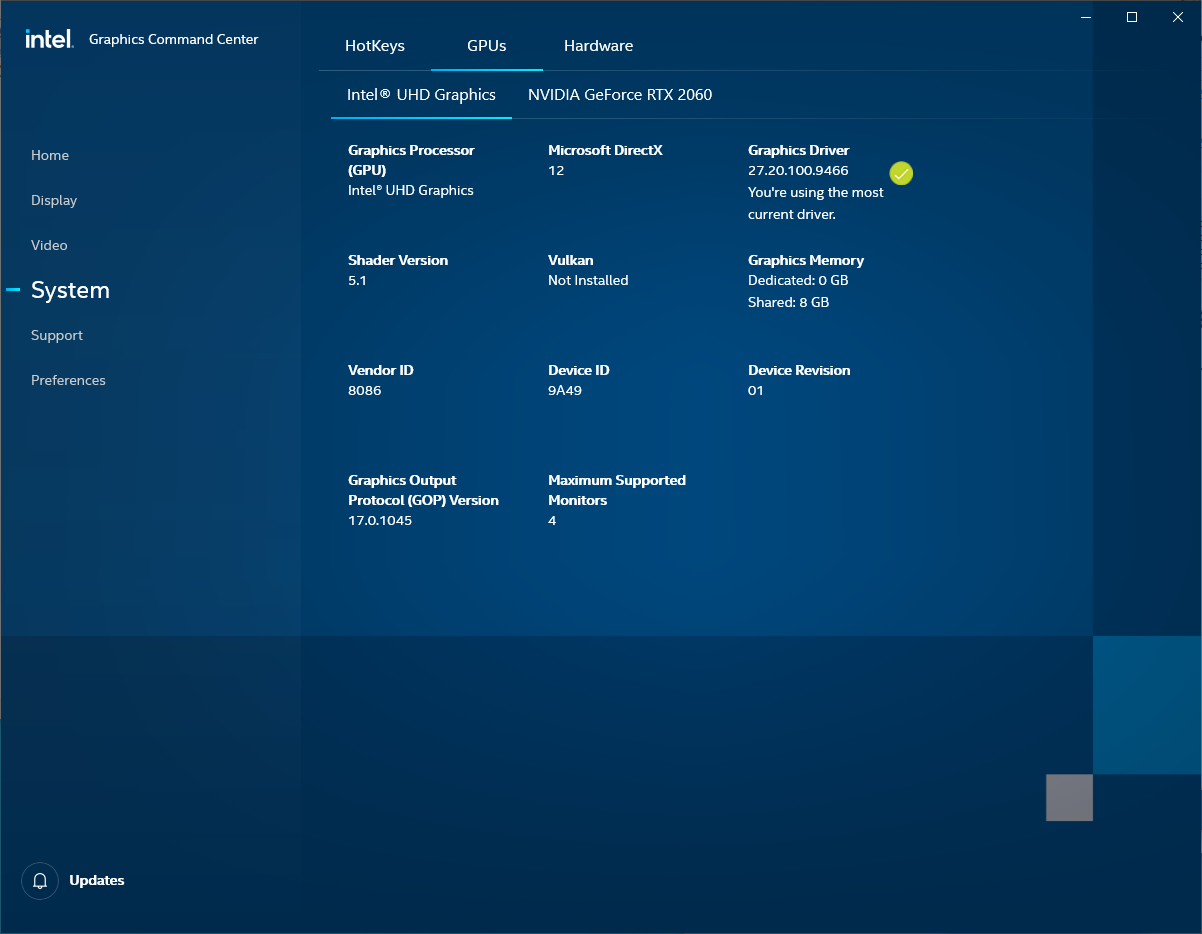
Todas as SKUs NUC11 Enthusiast a partir desta escrita vêm com a CPU Core i7-1165G7 da 11ª geração e GeForce RTX 2060 GPU. Tenha em mente que a GPU Nvidia aqui é a versão móvel Max-P e não o desktop one.
Optimus é compatível com comutação gráfica automática. Não há suporte para G-Sync.
Nossa unidade foi configurada para o modo "Performance" via BIOS antes de executar quaisquer benchmarks de performance abaixo para obter as mais altas pontuações possíveis.
Processador
O desempenho da CPU é excelente com resultados que estão dentro de 5% do NUC11PHKi7C. O Huawei MateBook X Pro equipado com o mesmo Core i7-1165G7 A CPU funcionaria cerca de 32% mais lenta do que nosso Phantom Canyon NUC.
Se ajustado para o modo Balanceado ao invés do modo Performance via BIOS, então o desempenho multi-tarefa cairia em cerca de 10 a 15 por cento de acordo com o CineBench.
Quando comparado com o mais antigo Núcleo i7-8809GO Core i7-1165G7 é capaz de superá-lo em ambos os benchmarks de rosca única e de rosca múltipla em cerca de 30% e 15%, respectivamente. Curiosamente, nossa pontuação CineBench R20 xT é inferior ao esperado, mesmo após duas tentativas.
Cinebench R15: CPU Multi 64Bit | CPU Single 64Bit
Blender: v2.79 BMW27 CPU
7-Zip 18.03: 7z b 4 -mmt1 | 7z b 4
Geekbench 5.5: Single-Core | Multi-Core
HWBOT x265 Benchmark v2.2: 4k Preset
LibreOffice : 20 Documents To PDF
R Benchmark 2.5: Overall mean
| Cinebench R20 / CPU (Multi Core) | |
| Lenovo Legion C7 15IMH05 82EH0030GE | |
| Asus ZenBook 13 UM325S | |
| Zotac ZBOX Magnus EN72070V | |
| Lenovo ThinkBook 15p Gen1 4K | |
| Intel Hades Canyon NUC8i7HVK | |
| Intel NUC11TNKi5 | |
| Média Intel Core i7-1165G7 (1060 - 2657, n=81) | |
| Intel NUC11PHKi7C | |
| Beelink GTR35 II-G-16512D00W64PRO-1T | |
| Asus VivoBook S13 S333JA-DS51 | |
| Asus Zenbook S UX393JA | |
| Beelink SEi10 | |
| Cinebench R20 / CPU (Single Core) | |
| Intel NUC11PHKi7C | |
| Asus ZenBook 13 UM325S | |
| Média Intel Core i7-1165G7 (442 - 589, n=81) | |
| Intel NUC11TNKi5 | |
| Zotac ZBOX Magnus EN72070V | |
| Lenovo Legion C7 15IMH05 82EH0030GE | |
| Lenovo ThinkBook 15p Gen1 4K | |
| Asus Zenbook S UX393JA | |
| Intel Hades Canyon NUC8i7HVK | |
| Beelink SEi10 | |
| Asus VivoBook S13 S333JA-DS51 | |
| Beelink GTR35 II-G-16512D00W64PRO-1T | |
| Cinebench R15 / CPU Multi 64Bit | |
| Lenovo Legion C7 15IMH05 82EH0030GE | |
| Asus ZenBook 13 UM325S | |
| Lenovo ThinkBook 15p Gen1 4K | |
| Zotac ZBOX Magnus EN72070V | |
| Intel NUC11PHKi7C | |
| Intel Hades Canyon NUC8i7HVK | |
| Média Intel Core i7-1165G7 (553 - 1027, n=86) | |
| Intel NUC11TNKi5 | |
| Beelink GTR35 II-G-16512D00W64PRO-1T | |
| Asus VivoBook S13 S333JA-DS51 | |
| Asus Zenbook S UX393JA | |
| Beelink SEi10 | |
| Cinebench R15 / CPU Single 64Bit | |
| Intel NUC11PHKi7C | |
| Asus ZenBook 13 UM325S | |
| Média Intel Core i7-1165G7 (115 - 230, n=78) | |
| Lenovo Legion C7 15IMH05 82EH0030GE | |
| Intel NUC11TNKi5 | |
| Lenovo ThinkBook 15p Gen1 4K | |
| Zotac ZBOX Magnus EN72070V | |
| Asus Zenbook S UX393JA | |
| Intel Hades Canyon NUC8i7HVK | |
| Beelink SEi10 | |
| Beelink GTR35 II-G-16512D00W64PRO-1T | |
| Asus VivoBook S13 S333JA-DS51 | |
| Blender / v2.79 BMW27 CPU | |
| Beelink SEi10 | |
| Asus Zenbook S UX393JA | |
| Asus VivoBook S13 S333JA-DS51 | |
| Beelink GTR35 II-G-16512D00W64PRO-1T | |
| Média Intel Core i7-1165G7 (468 - 1138, n=80) | |
| Intel NUC11TNKi5 | |
| Intel NUC11PHKi7C | |
| Intel Hades Canyon NUC8i7HVK | |
| Lenovo ThinkBook 15p Gen1 4K | |
| Zotac ZBOX Magnus EN72070V | |
| Asus ZenBook 13 UM325S | |
| Lenovo Legion C7 15IMH05 82EH0030GE | |
| 7-Zip 18.03 / 7z b 4 -mmt1 | |
| Lenovo Legion C7 15IMH05 82EH0030GE | |
| Asus ZenBook 13 UM325S | |
| Intel NUC11PHKi7C | |
| Média Intel Core i7-1165G7 (4478 - 5507, n=80) | |
| Lenovo ThinkBook 15p Gen1 4K | |
| Zotac ZBOX Magnus EN72070V | |
| Intel NUC11TNKi5 | |
| Asus Zenbook S UX393JA | |
| Intel Hades Canyon NUC8i7HVK | |
| Beelink SEi10 | |
| Asus VivoBook S13 S333JA-DS51 | |
| Beelink GTR35 II-G-16512D00W64PRO-1T | |
| 7-Zip 18.03 / 7z b 4 | |
| Lenovo Legion C7 15IMH05 82EH0030GE | |
| Asus ZenBook 13 UM325S | |
| Zotac ZBOX Magnus EN72070V | |
| Lenovo ThinkBook 15p Gen1 4K | |
| Intel NUC11PHKi7C | |
| Intel NUC11TNKi5 | |
| Média Intel Core i7-1165G7 (15347 - 27405, n=80) | |
| Intel Hades Canyon NUC8i7HVK | |
| Asus Zenbook S UX393JA | |
| Asus VivoBook S13 S333JA-DS51 | |
| Beelink GTR35 II-G-16512D00W64PRO-1T | |
| Beelink SEi10 | |
| Geekbench 5.5 / Single-Core | |
| Intel NUC11PHKi7C | |
| Média Intel Core i7-1165G7 (1302 - 1595, n=77) | |
| Asus ZenBook 13 UM325S | |
| Intel NUC11TNKi5 | |
| Asus Zenbook S UX393JA | |
| Lenovo Legion C7 15IMH05 82EH0030GE | |
| Lenovo ThinkBook 15p Gen1 4K | |
| Zotac ZBOX Magnus EN72070V | |
| Asus VivoBook S13 S333JA-DS51 | |
| Beelink SEi10 | |
| Beelink GTR35 II-G-16512D00W64PRO-1T | |
| Geekbench 5.5 / Multi-Core | |
| Lenovo Legion C7 15IMH05 82EH0030GE | |
| Asus ZenBook 13 UM325S | |
| Lenovo ThinkBook 15p Gen1 4K | |
| Zotac ZBOX Magnus EN72070V | |
| Intel NUC11PHKi7C | |
| Média Intel Core i7-1165G7 (3078 - 5926, n=77) | |
| Asus Zenbook S UX393JA | |
| Intel NUC11TNKi5 | |
| Asus VivoBook S13 S333JA-DS51 | |
| Beelink GTR35 II-G-16512D00W64PRO-1T | |
| Beelink SEi10 | |
| HWBOT x265 Benchmark v2.2 / 4k Preset | |
| Lenovo Legion C7 15IMH05 82EH0030GE | |
| Asus ZenBook 13 UM325S | |
| Zotac ZBOX Magnus EN72070V | |
| Lenovo ThinkBook 15p Gen1 4K | |
| Intel NUC11PHKi7C | |
| Intel Hades Canyon NUC8i7HVK | |
| Intel NUC11TNKi5 | |
| Média Intel Core i7-1165G7 (1.39 - 8.47, n=80) | |
| Asus VivoBook S13 S333JA-DS51 | |
| Asus Zenbook S UX393JA | |
| Beelink GTR35 II-G-16512D00W64PRO-1T | |
| Beelink SEi10 | |
| LibreOffice / 20 Documents To PDF | |
| Beelink GTR35 II-G-16512D00W64PRO-1T | |
| Asus VivoBook S13 S333JA-DS51 | |
| Zotac ZBOX Magnus EN72070V | |
| Lenovo ThinkBook 15p Gen1 4K | |
| Lenovo Legion C7 15IMH05 82EH0030GE | |
| Beelink SEi10 | |
| Asus ZenBook 13 UM325S | |
| Intel NUC11TNKi5 | |
| Média Intel Core i7-1165G7 (21.5 - 88.1, n=78) | |
| Asus Zenbook S UX393JA | |
| Intel NUC11PHKi7C | |
| R Benchmark 2.5 / Overall mean | |
| Asus VivoBook S13 S333JA-DS51 | |
| Beelink SEi10 | |
| Beelink GTR35 II-G-16512D00W64PRO-1T | |
| Asus Zenbook S UX393JA | |
| Intel NUC11TNKi5 | |
| Lenovo ThinkBook 15p Gen1 4K | |
| Zotac ZBOX Magnus EN72070V | |
| Média Intel Core i7-1165G7 (0.552 - 1.002, n=80) | |
| Lenovo Legion C7 15IMH05 82EH0030GE | |
| Intel NUC11PHKi7C | |
| Asus ZenBook 13 UM325S | |
* ... menor é melhor
Desempenho do sistema
| PCMark 10 | |
| Score | |
| Intel NUC11PHKi7C | |
| Aorus Gaming Box GeForce RTX 2080 Ti | |
| Intel Hades Canyon NUC8i7HVK | |
| Zotac ZBOX Magnus EK71080 | |
| Intel NUC11PAQi7 | |
| GMK NucBox 2 | |
| Essentials | |
| Intel NUC11PAQi7 | |
| Aorus Gaming Box GeForce RTX 2080 Ti | |
| Intel NUC11PHKi7C | |
| Intel Hades Canyon NUC8i7HVK | |
| GMK NucBox 2 | |
| Zotac ZBOX Magnus EK71080 | |
| Productivity | |
| Intel NUC11PHKi7C | |
| Aorus Gaming Box GeForce RTX 2080 Ti | |
| Intel Hades Canyon NUC8i7HVK | |
| Intel NUC11PAQi7 | |
| Zotac ZBOX Magnus EK71080 | |
| GMK NucBox 2 | |
| Digital Content Creation | |
| Intel NUC11PHKi7C | |
| Zotac ZBOX Magnus EK71080 | |
| Aorus Gaming Box GeForce RTX 2080 Ti | |
| Intel Hades Canyon NUC8i7HVK | |
| Intel NUC11PAQi7 | |
| GMK NucBox 2 | |
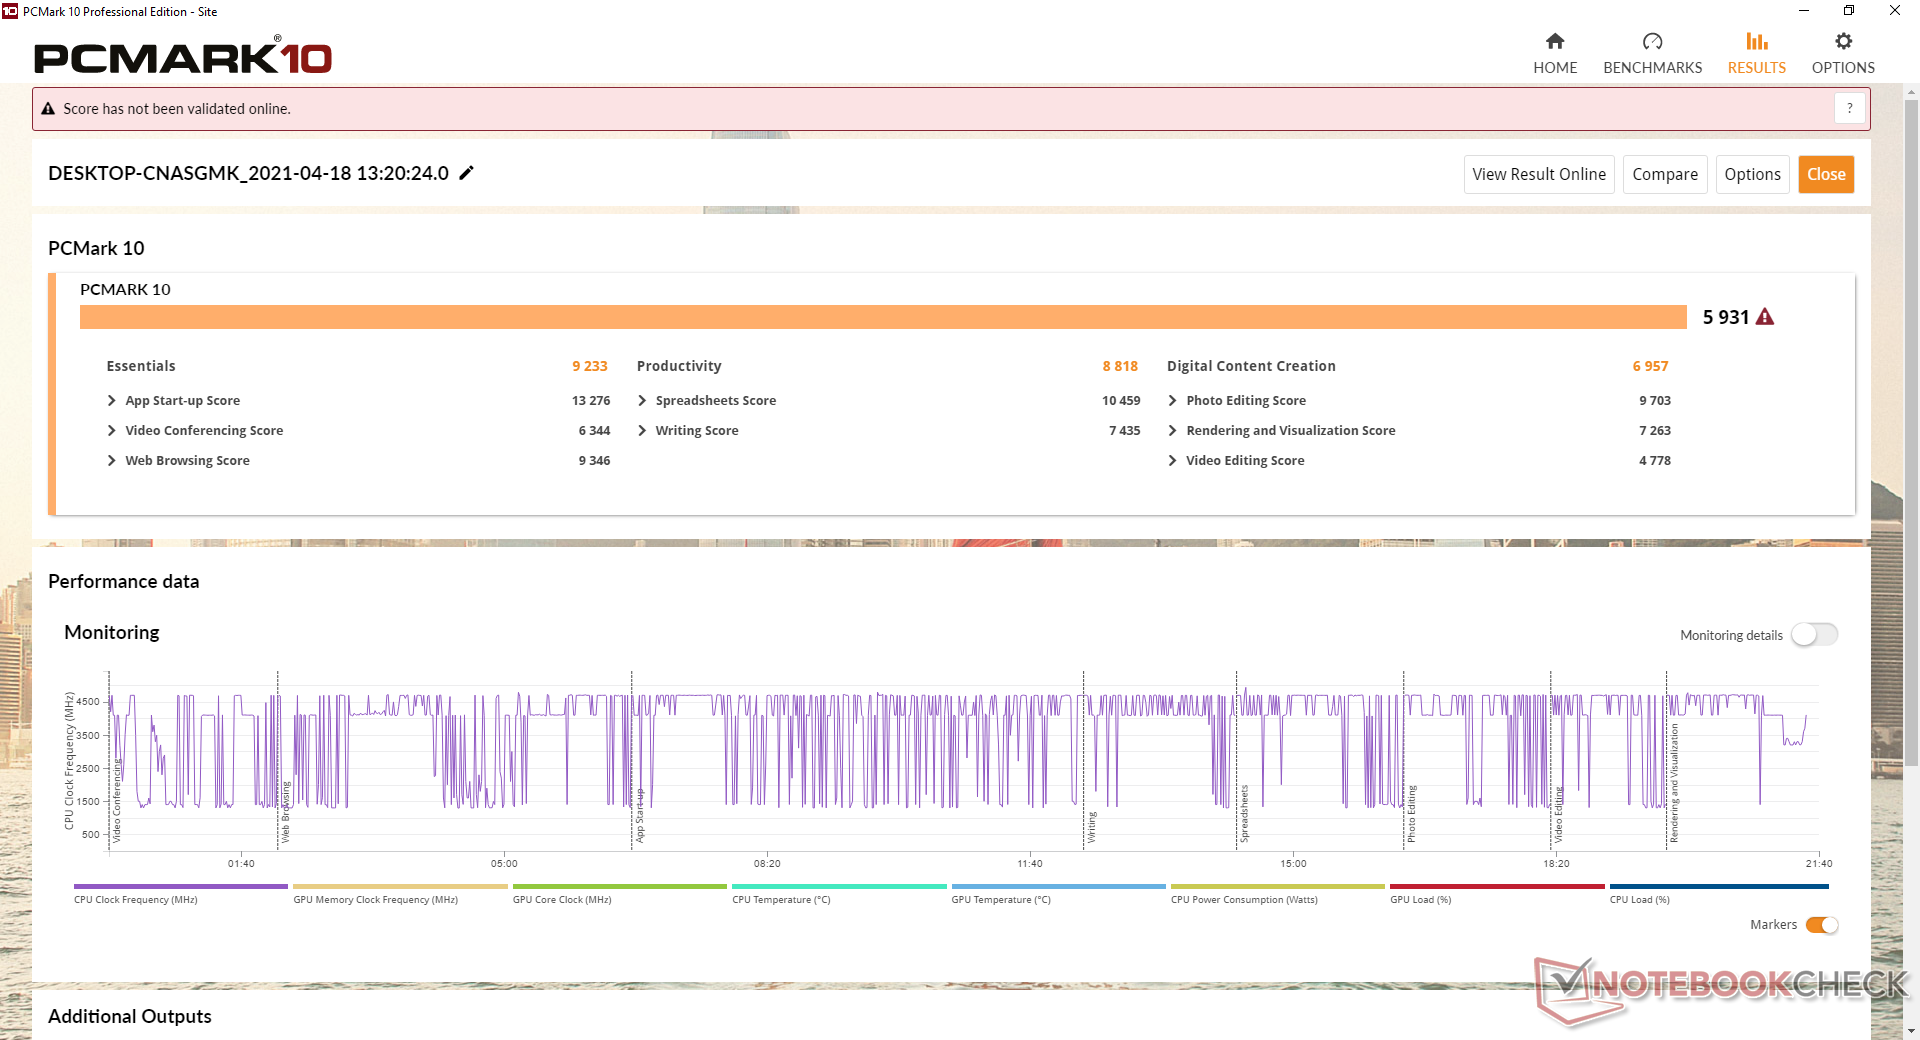
| PCMark 10 Score | 5931 pontos | |
Ajuda | ||
Latência do DPC
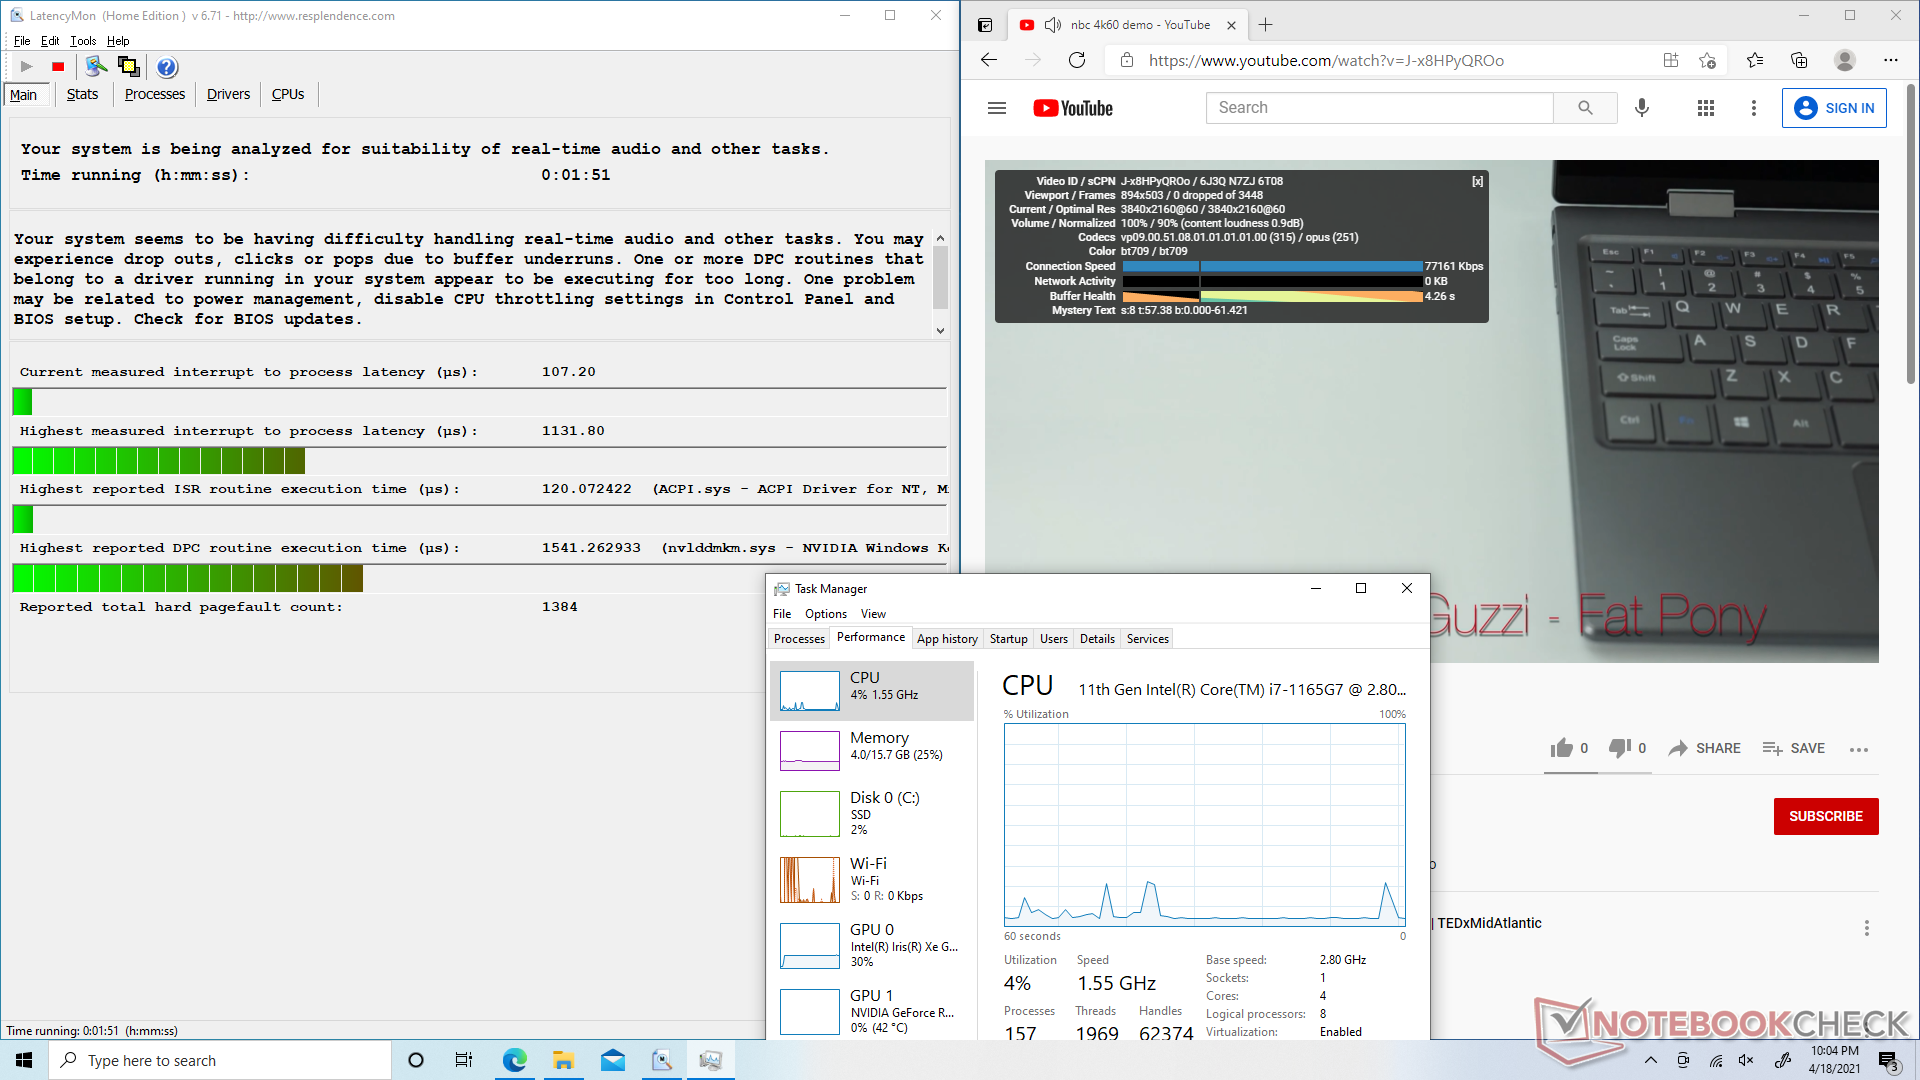
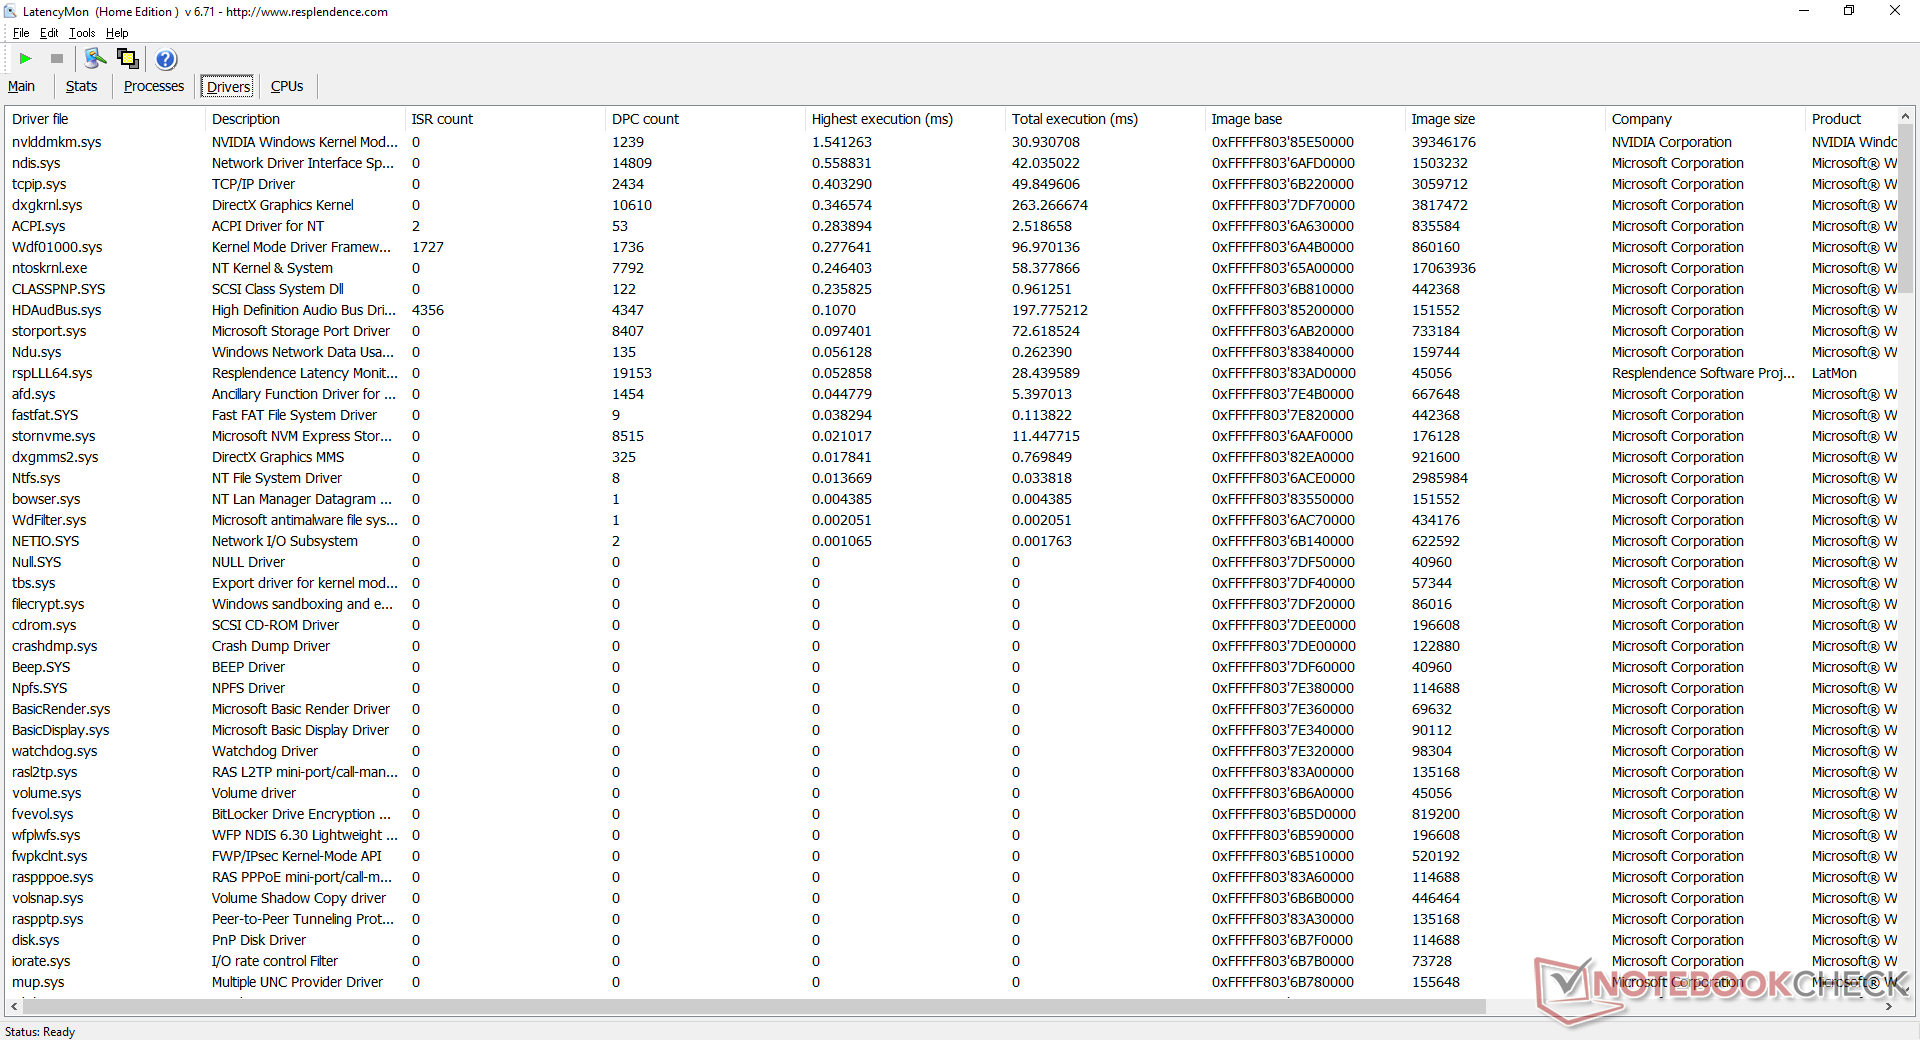
| DPC Latencies / LatencyMon - interrupt to process latency (max), Web, Youtube, Prime95 | |
| Intel NUC11PHKi7C | |
| GMK NucBox 2 | |
| Intel NUC11PAQi7 | |
* ... menor é melhor
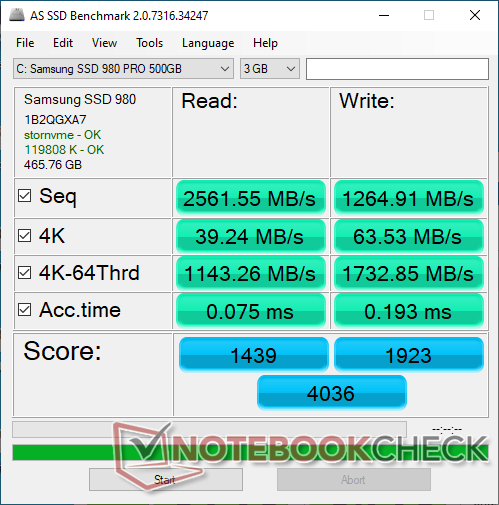
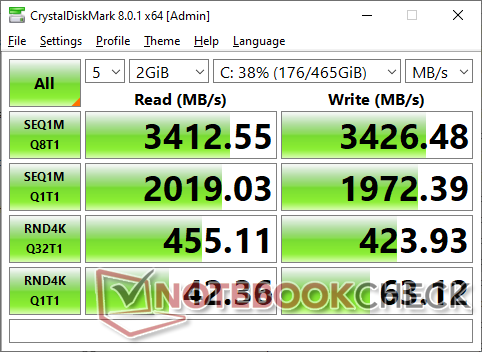
Dispositivos de armazenamento
Enquanto osNUC11PAQi7 suporta velocidades PCIe 4.0 x4 NVMe SSD, o NUC11PHKi7C não, pois seus dois slots M.2 estão limitados apenas às velocidades PCIe 3.0 x4 e SATA III, respectivamente. Isto é um tanto decepcionante quando se considera que o NUC11PHKi7C é supostamente um produto "entusiasta" voltado para usuários de alto desempenho. Instalamos o mesmo Samsung SSD 980 da NUC11PAQi7 em nossa NUC11PHKi7C e, com certeza, nossas taxas de transferência foram apenas cerca da metade das da NUC11PAQi7.
Vale notar que o sistema suporta SSDs M.2 22110 mais longos, enquanto a maioria dos outros sistemas são limitados a 2280.
| Intel NUC11PHKi7C Samsung SSD 980 Pro 500GB MZ-V8P500BW | Intel Hades Canyon NUC8i7HVK Intel Optane 120 GB SSDPEK1W120GA | Intel NUC11PAQi7 Samsung SSD 980 Pro 500GB MZ-V8P500BW | GMK NucBox 2 Netac S930E8/256GPN | Zotac ZBOX Magnus EK71080 Samsung PM961 MZVLW256HEHP | |
|---|---|---|---|---|---|
| AS SSD | 3% | 47% | -33% | -8% | |
| Seq Read (MB/s) | 2562 | 1379 -46% | 3257 27% | 2069 -19% | 2119 -17% |
| Seq Write (MB/s) | 1265 | 553 -56% | 3937 211% | 1203 -5% | 1205 -5% |
| 4K Read (MB/s) | 39.24 | 127.9 226% | 51.3 31% | 41.66 6% | 46.69 19% |
| 4K Write (MB/s) | 63.5 | 103.5 63% | 75.7 19% | 136.9 116% | 105.2 66% |
| 4K-64 Read (MB/s) | 1143 | 1258 10% | 2283 100% | 366.3 -68% | 1170 2% |
| 4K-64 Write (MB/s) | 1733 | 556 -68% | 2206 27% | 340.5 -80% | 443.8 -74% |
| Access Time Read * (ms) | 0.075 | 0.025 67% | 0.056 25% | 0.064 15% | 0.06 20% |
| Access Time Write * (ms) | 0.193 | 0.033 83% | 0.154 20% | 0.347 -80% | 0.04 79% |
| Score Read (Points) | 1439 | 1524 6% | 2660 85% | 615 -57% | 1429 -1% |
| Score Write (Points) | 1923 | 714 -63% | 2676 39% | 598 -69% | 669 -65% |
| Score Total (Points) | 4036 | 3023 -25% | 6725 67% | 1497 -63% | 2791 -31% |
| Copy ISO MB/s (MB/s) | 1675 | 1125 -33% | 2030 21% | 1186 -29% | 1649 -2% |
| Copy Program MB/s (MB/s) | 1030 | 342.4 -67% | 883 -14% | 428.6 -58% | 468 -55% |
| Copy Game MB/s (MB/s) | 1810 | 768 -58% | 1817 0% | 435.7 -76% | 1010 -44% |
| CrystalDiskMark 5.2 / 6 | 21% | 111% | 6% | -2% | |
| Write 4K (MB/s) | 67.3 | 133.7 99% | 244.6 263% | 178.4 165% | 132.7 97% |
| Read 4K (MB/s) | 38.32 | 178.6 366% | 80.4 110% | 61 59% | 44.48 16% |
| Write Seq (MB/s) | 1985 | 608 -69% | 4094 106% | 1040 -48% | 1193 -40% |
| Read Seq (MB/s) | 2049 | 1428 -30% | 4099 100% | 1919 -6% | 1371 -33% |
| Write 4K Q32T1 (MB/s) | 432.3 | 323.6 -25% | 715 65% | 417.7 -3% | 398.5 -8% |
| Read 4K Q32T1 (MB/s) | 452.4 | 282.3 -38% | 783 73% | 325.6 -28% | 483.5 7% |
| Write Seq Q32T1 (MB/s) | 3423 | 627 -82% | 5065 48% | 1144 -67% | 1202 -65% |
| Read Seq Q32T1 (MB/s) | 3123 | 1521 -51% | 6884 120% | 2379 -24% | 3388 8% |
| Média Total (Programa/Configurações) | 12% /
10% | 79% /
70% | -14% /
-19% | -5% /
-6% |
* ... menor é melhor

Disk Throttling: DiskSpd Read Loop, Queue Depth 8
Desempenho da GPU
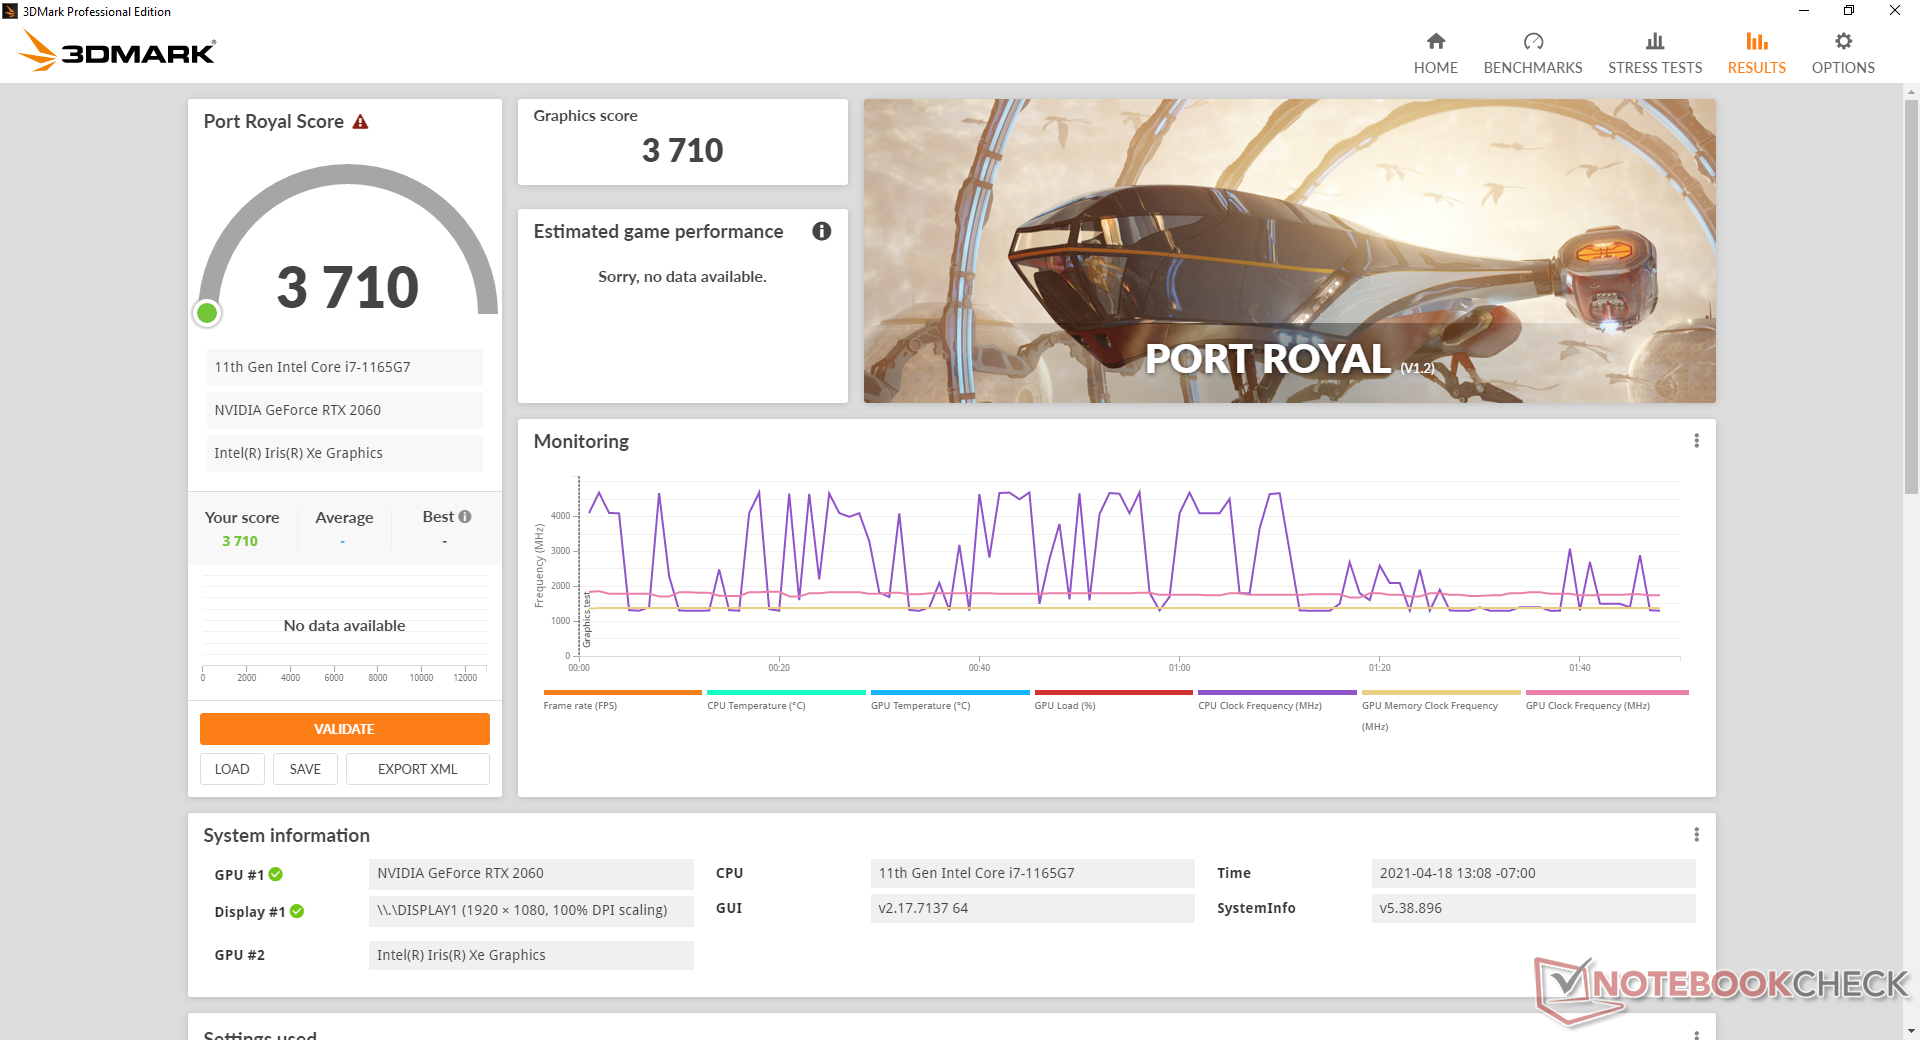
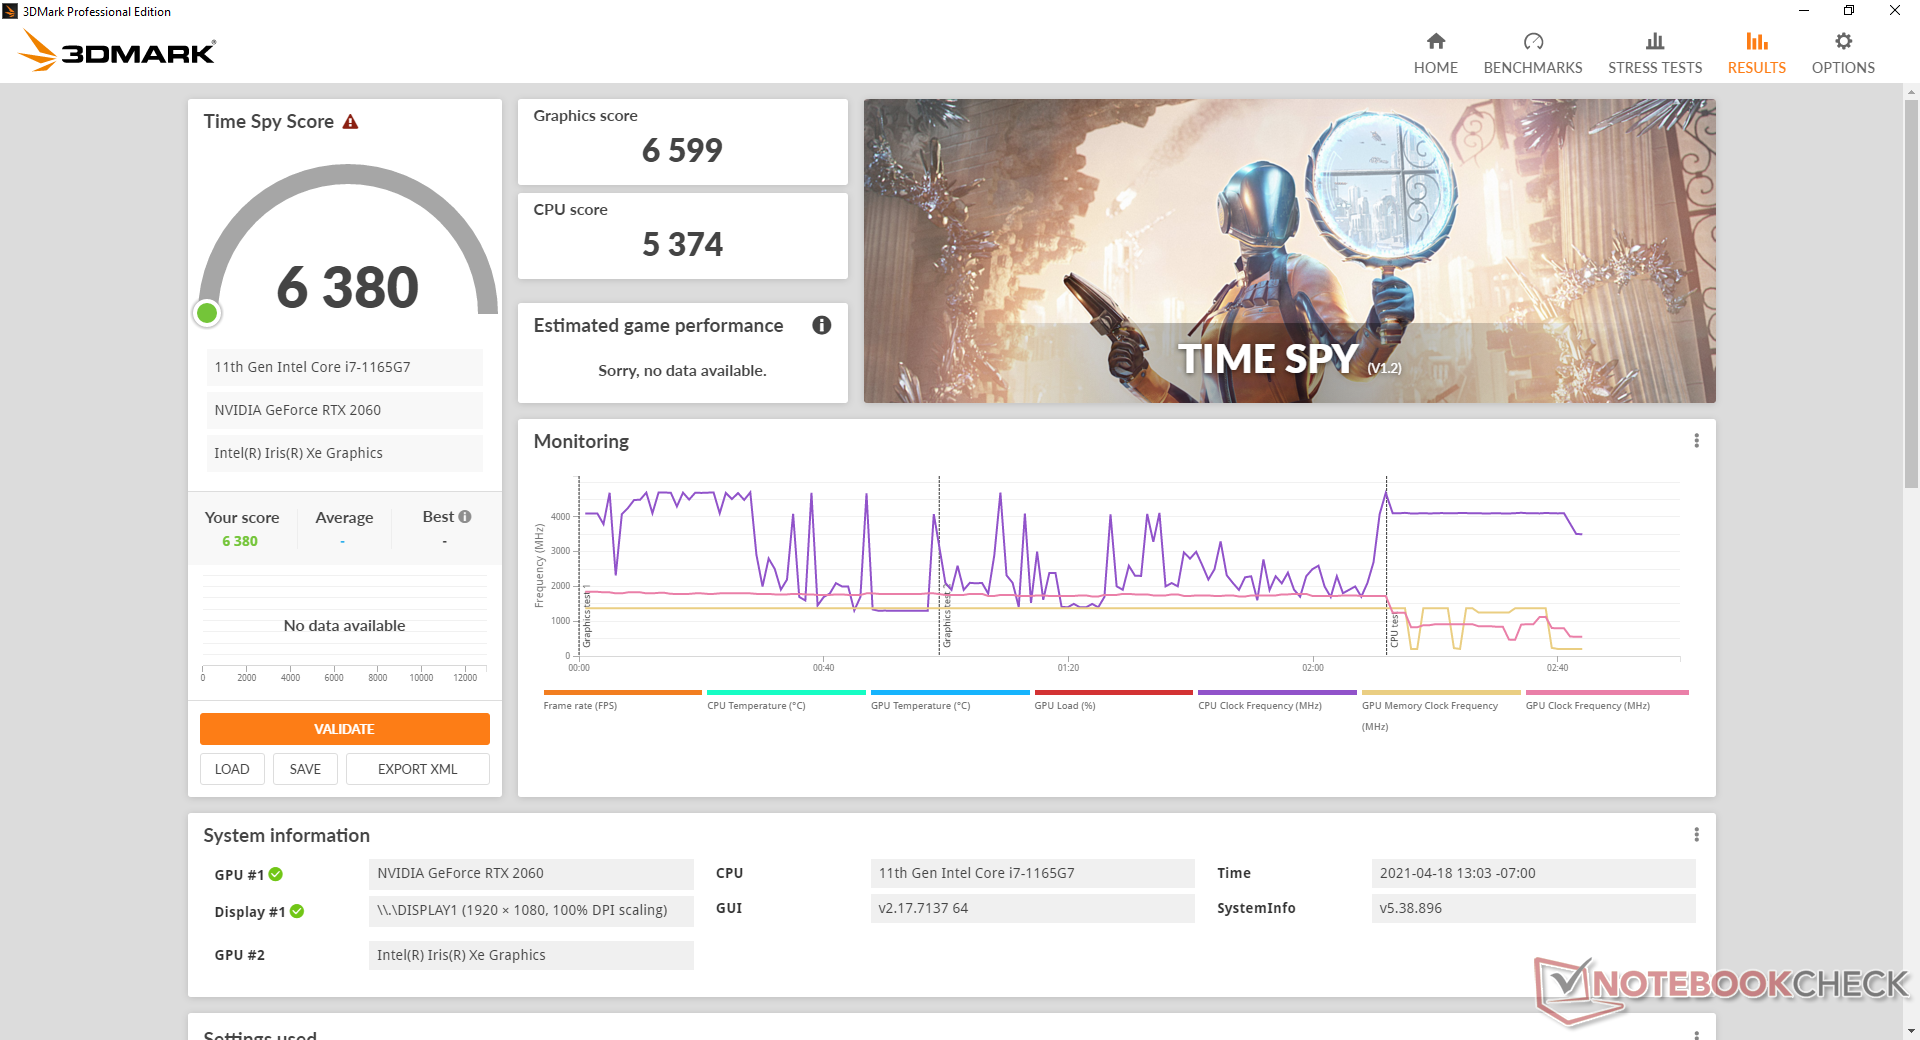
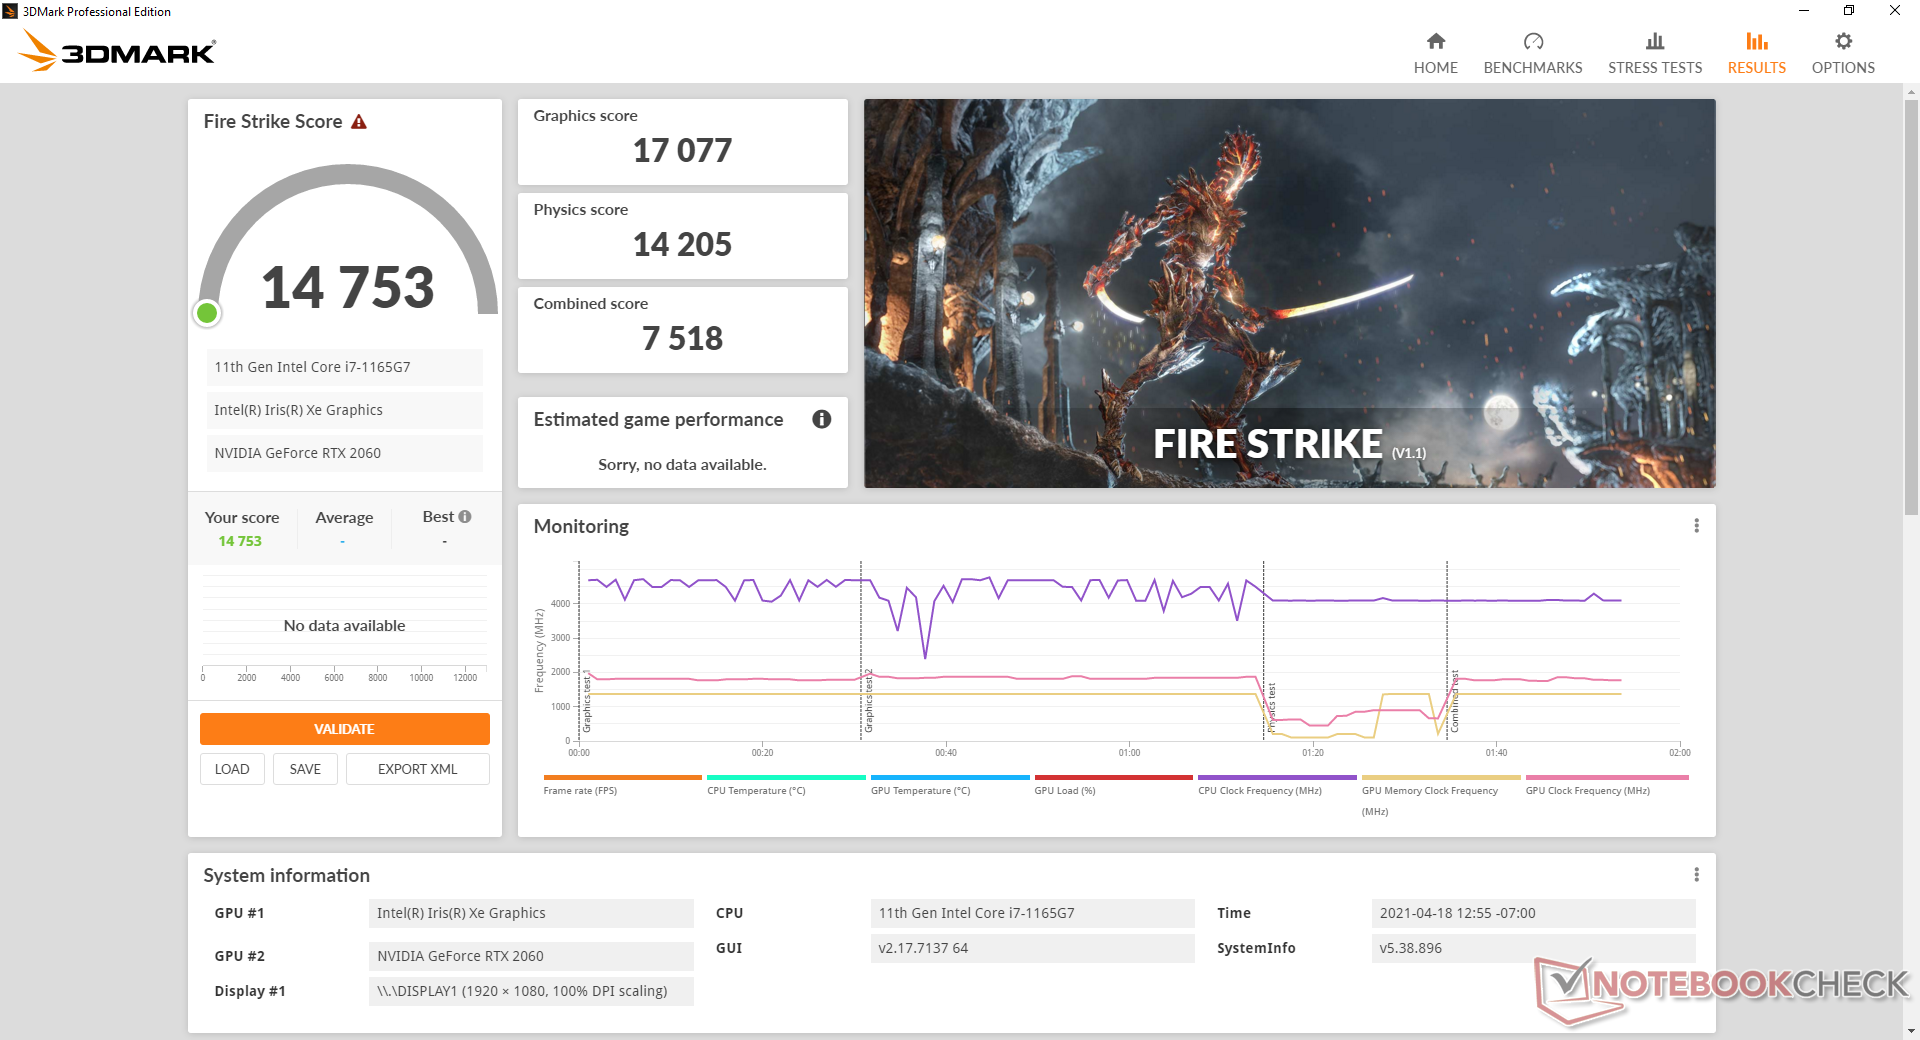
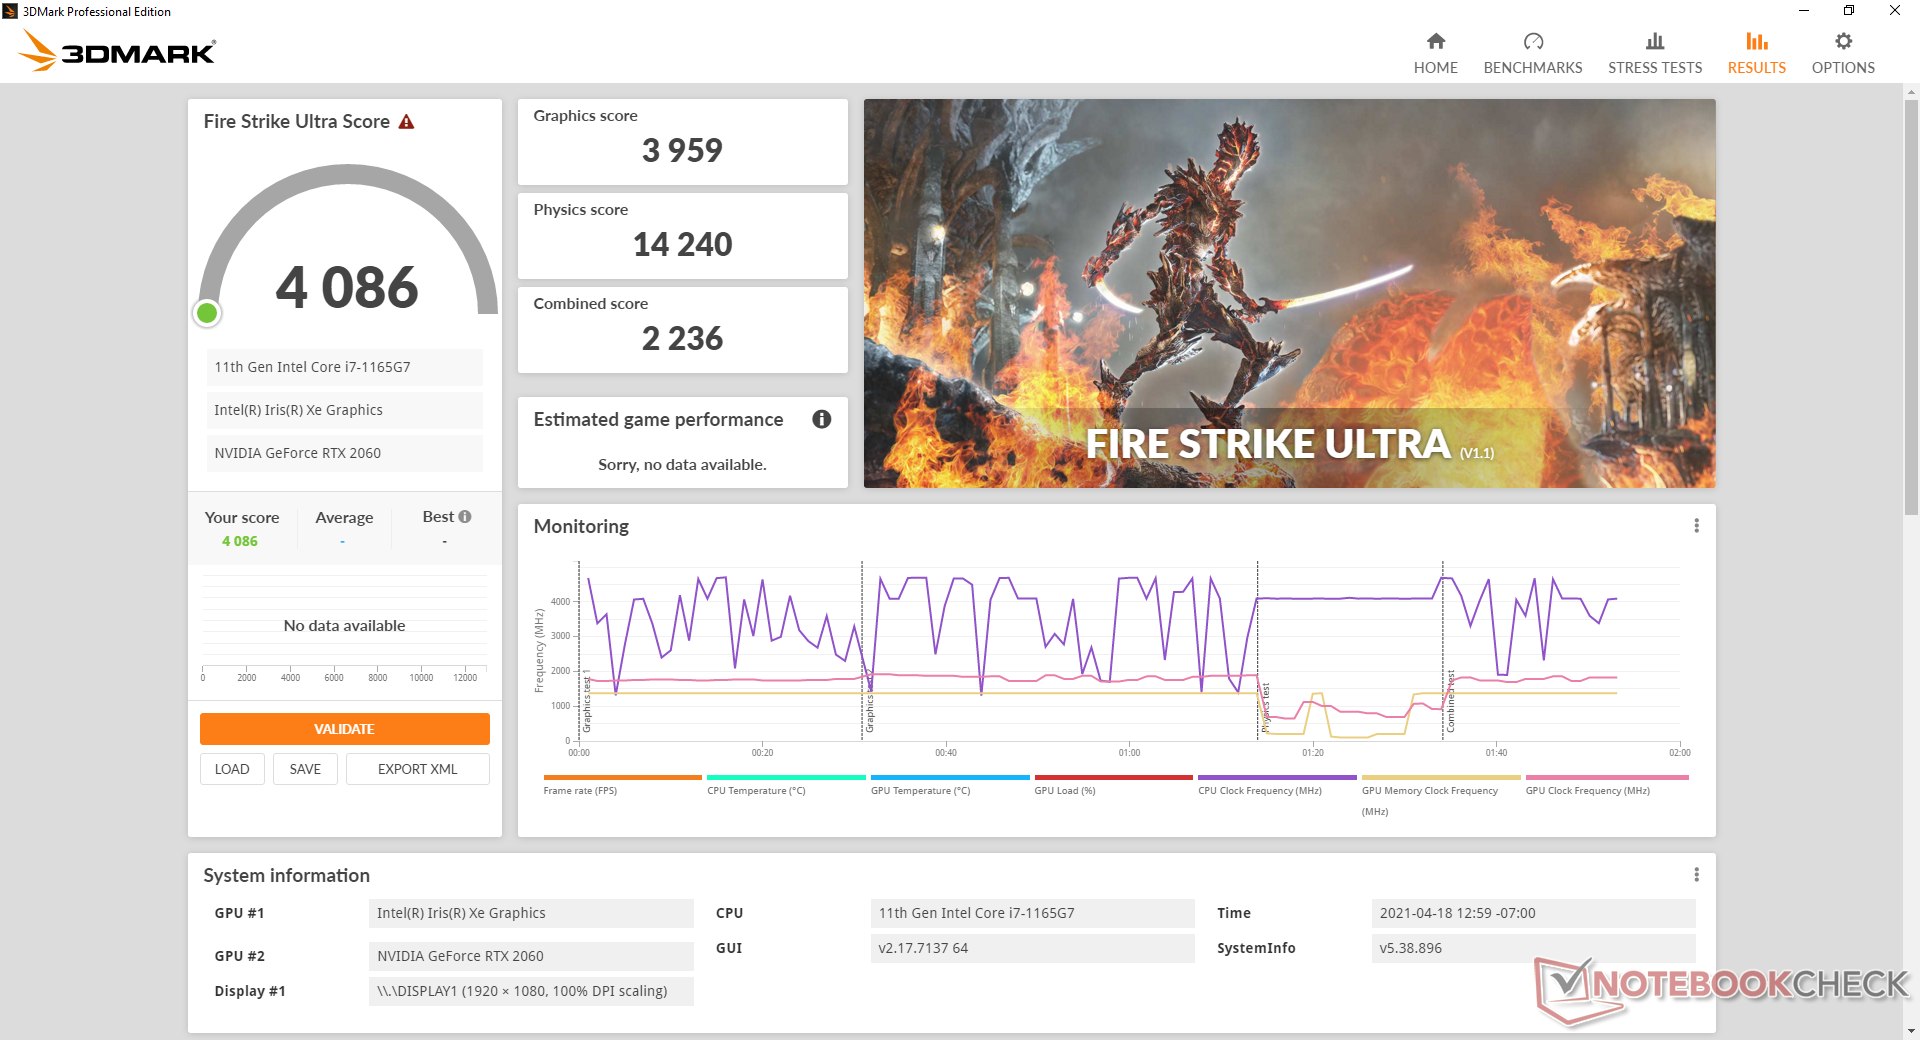
O desempenho gráfico é onde esperamos que seja relativo ao laptop médio equipado com o mesmo GeForce RTX 2060 GPU. Mais notadamente, o desempenho é quase 70% mais rápido do que a Radeon RX Vega M GH no antigo Hades Canyon de acordo com o 3DMark Fire Strike enquanto Time Spy mostra um aumento de desempenho ainda maior de pouco mais de 2x. Isto sugere que jogos rodando no DX12 verão os maiores benefícios de desempenho de gênero para gênero.
Um PC desktop com um "próprio" GeForce RTX 2060 ainda terá um desempenho superior ao móvel RTX 2060 em nosso NUC em cerca de 15% a 20%
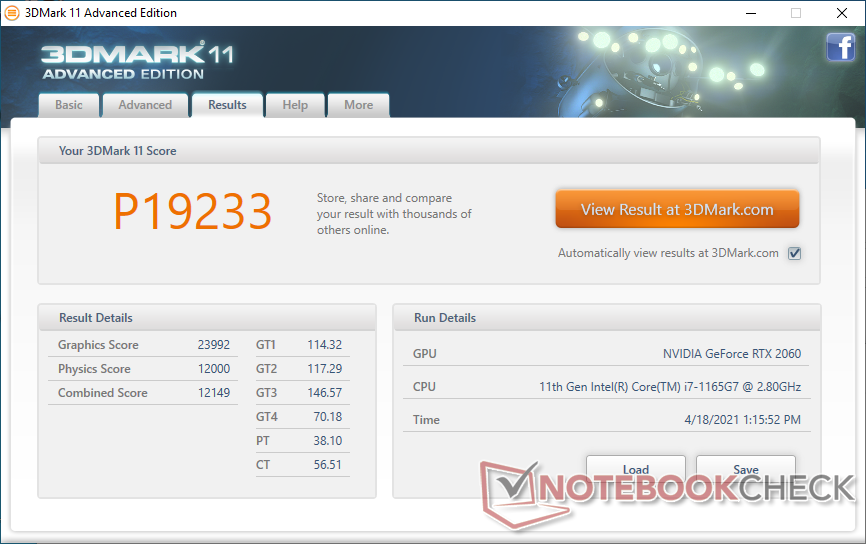

| 3DMark 11 | |
| 1280x720 Performance GPU | |
| Aorus Gaming Box GeForce RTX 2080 Ti | |
| Zotac ZBOX Magnus EN72070V | |
| MSI RTX 2060 Gaming Z 6G | |
| Intel NUC11PHKi7C | |
| MSI GF65 Thin 10UE | |
| Aorus 15P WB | |
| Asus ROG Zephyrus M15 GU502LU-BI7N4 | |
| Média NVIDIA GeForce RTX 2060 Mobile (19143 - 24662, n=40) | |
| Intel Hades Canyon NUC8i7HVK | |
| HP Envy 14-eb0010nr | |
| Huawei MateBook X Pro 2021 | |
| Intel NUC11TNKi5 | |
| Beelink SEi10 | |
| 1280x720 Performance Combined | |
| MSI RTX 2060 Gaming Z 6G | |
| Asus ROG Zephyrus M15 GU502LU-BI7N4 | |
| Aorus 15P WB | |
| MSI GF65 Thin 10UE | |
| Aorus Gaming Box GeForce RTX 2080 Ti | |
| Zotac ZBOX Magnus EN72070V | |
| Intel NUC11PHKi7C | |
| Média NVIDIA GeForce RTX 2060 Mobile (1107 - 14726, n=40) | |
| Intel Hades Canyon NUC8i7HVK | |
| HP Envy 14-eb0010nr | |
| Huawei MateBook X Pro 2021 | |
| Intel NUC11TNKi5 | |
| Beelink SEi10 | |
| 3DMark 11 Performance | 19233 pontos | |
| 3DMark Cloud Gate Standard Score | 30679 pontos | |
| 3DMark Fire Strike Score | 14753 pontos | |
| 3DMark Time Spy Score | 6380 pontos | |
Ajuda | ||
| baixo | média | alto | ultra | |
|---|---|---|---|---|
| GTA V (2015) | 168 | 158 | 119 | 69.6 |
| The Witcher 3 (2015) | 220.7 | 152.2 | 101.5 | 61.4 |
| Dota 2 Reborn (2015) | 139 | 123 | 116 | 112 |
| Final Fantasy XV Benchmark (2018) | 130 | 89.2 | 67.5 | |
| X-Plane 11.11 (2018) | 94.8 | 81.3 | 69.8 | |
| Strange Brigade (2018) | 287 | 148 | 124 | 109 |
Emissions
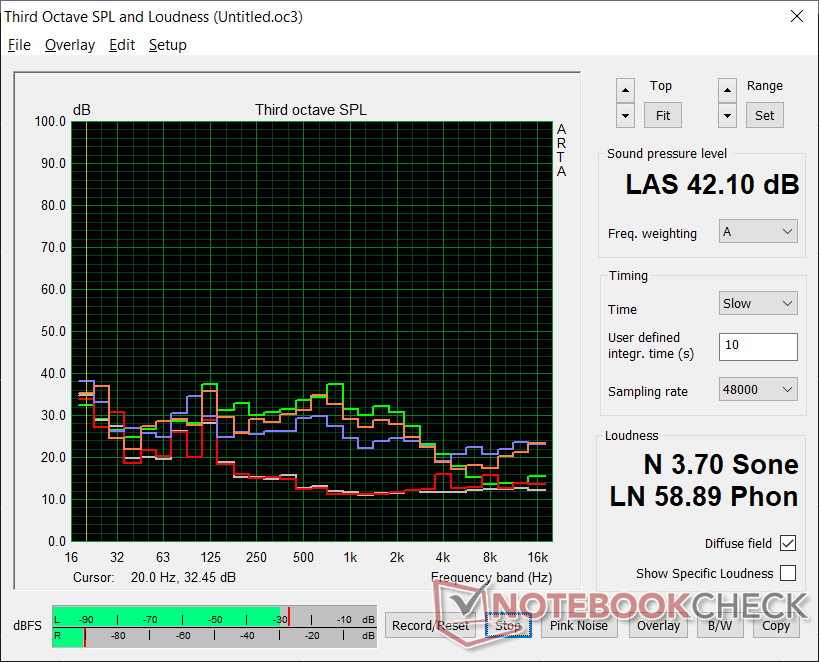
Ruído do sistema
Somos capazes de gravar um choro de bobina de 25,3 dB(A) quando ociosos na área de trabalho contra um fundo silencioso de 24,5 dB(A). O ruído dos ventiladores está próximo ao que gravamos no Hades Canyon NUC. Quando em funcionamento Witcher 3Por exemplo, o ruído do ventilador aumentaria lentamente até atingir um estável 39,7 dB(A). Quando se executam cargas mais extremas como Prime95 ou FurMark, o ruído dos ventiladores subiria temporariamente até 47,9 dB(A) antes de cair e se estabilizar em 42,1 dB(A).
| Intel NUC11PHKi7C GeForce RTX 2060 Mobile, i7-1165G7, Samsung SSD 980 Pro 500GB MZ-V8P500BW | Intel Hades Canyon NUC8i7HVK Vega M GH, i7-8809G, Intel Optane 120 GB SSDPEK1W120GA | Intel NUC11PAQi7 Iris Xe G7 96EUs, i7-1165G7, Samsung SSD 980 Pro 500GB MZ-V8P500BW | GMK NucBox 2 Iris Plus Graphics 655, i5-8259U, Netac S930E8/256GPN | Zotac ZBOX Magnus EK71080 GeForce GTX 1080 (Desktop), i7-7700HQ, Samsung PM961 MZVLW256HEHP | Aorus Gaming Box GeForce RTX 2080 Ti , i7-1165G7 | |
|---|---|---|---|---|---|---|
| Noise | -10% | 0% | 3% | -28% | -25% | |
| desligado / ambiente * (dB) | 24.5 | 28.7 -17% | 25.6 -4% | 25.6 -4% | 29.9 -22% | 26.5 -8% |
| Idle Minimum * (dB) | 25.3 | 29 -15% | 25.6 -1% | 25.7 -2% | 38.6 -53% | 34.7 -37% |
| Idle Average * (dB) | 25.3 | 29 -15% | 25.6 -1% | 25.7 -2% | 38.6 -53% | 39.1 -55% |
| Idle Maximum * (dB) | 25.3 | 29 -15% | 25.6 -1% | 25.7 -2% | 39 -54% | 39.1 -55% |
| Load Average * (dB) | 36.4 | 36 1% | 33.6 8% | 35.3 3% | 40.6 -12% | 39.5 -9% |
| Witcher 3 ultra * (dB) | 39.7 | 42 -6% | 33.6 15% | 41.7 -5% | 43.7 -10% | |
| Load Maximum * (dB) | 47.9 | 49.4 -3% | 54.5 -14% | 35.1 27% | 47 2% | 48 -0% |
* ... menor é melhor
Barulho
| Ocioso |
| 25.3 / 25.3 / 25.3 dB |
| Carga |
| 36.4 / 47.9 dB |
 | ||
30 dB silencioso 40 dB(A) audível 50 dB(A) ruidosamente alto |
||
min: | ||
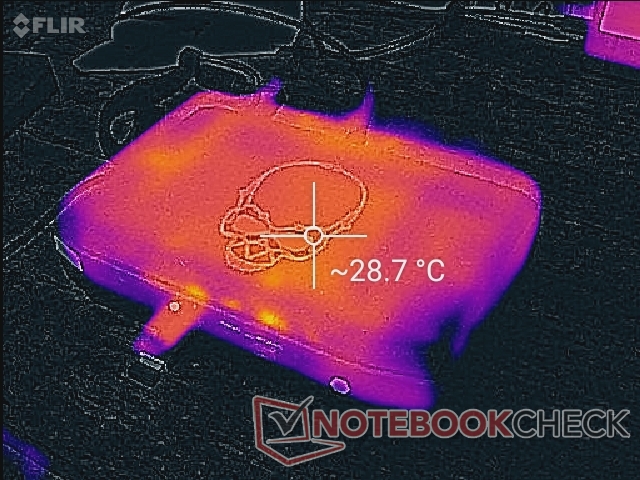
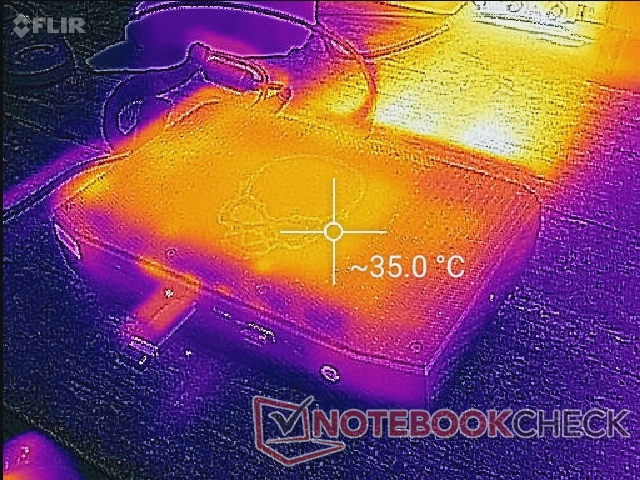
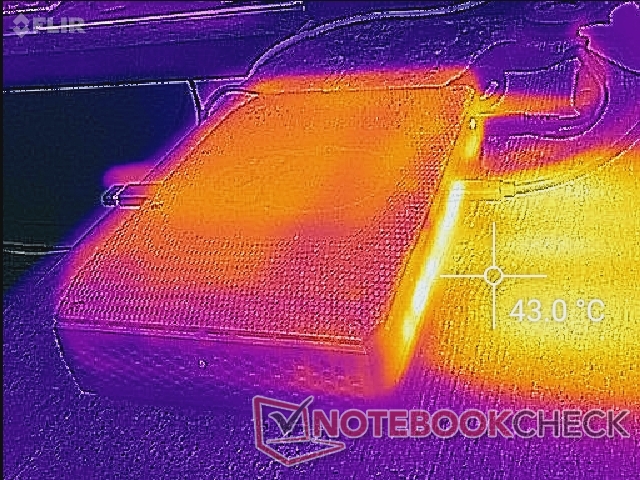
Temperatura

As temperaturas superficiais não são um problema, pois o ponto quente no topo é apenas cerca de 35 C quando se joga. Toda a exaustão é pela parte de trás, no entanto, e por isso deve ser reservado um espaço amplo atrás dela para uma ventilação adequada.
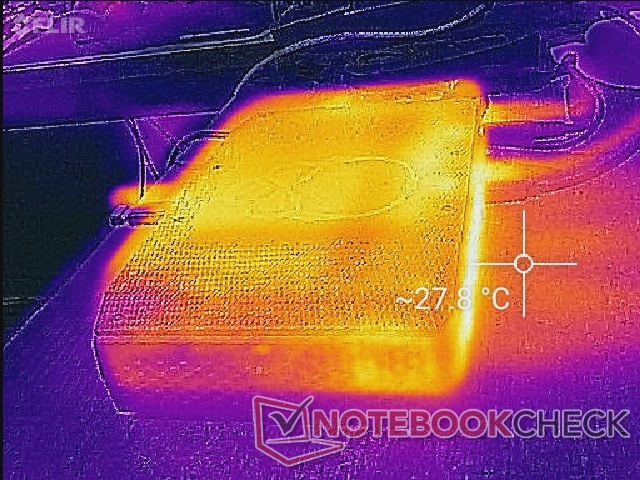
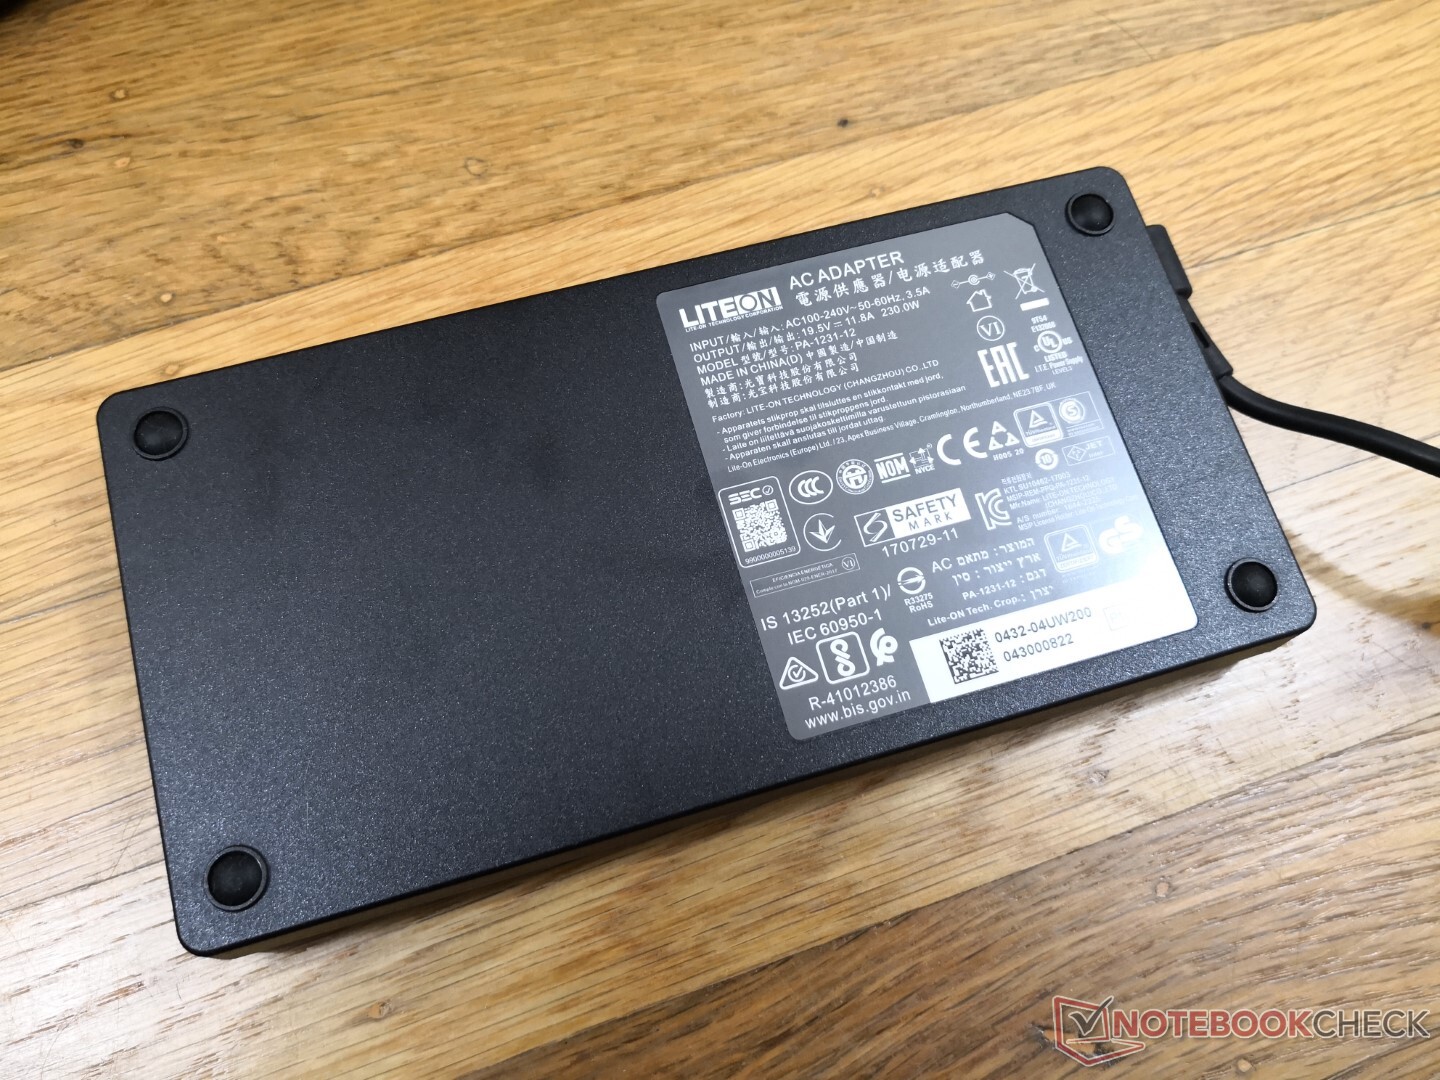
O adaptador AC pode se tornar mais quente que o próprio NUC a 43 C quando se joga. A Intel provavelmente poderia ter projetado um adaptador CA menor e mais denso, mas provavelmente funcionaria ainda mais quente, muito parecido com o que observamos no Série Razer Blade.
Teste de estresse
Ao executar Prime95 para enfatizar a CPU, as taxas de relógio aumentariam para 4,1 GHz por cerca de 20 segundos até atingir uma temperatura central de 89 C. Depois disso, as taxas de relógio diminuiriam constantemente até estabilizarem em 3,0 a 3,2 GHz e uma temperatura central de 67 C. Se o NUC for ajustado para o modo Equilibrado, as taxas de relógio cairiam ainda mais para 2,8 GHz para uma temperatura central mais fria de 57 C.
Quando em funcionamento Witcher 3 para representar cargas de jogos do mundo real, as temperaturas de CPU e GPU se estabilizariam em 63 C e 69 C, respectivamente, com um consumo constante de energia da placa GPU de cerca de 116 W. A CPU Kaby Lake-G no Hades Canyon NUC se estabilizaria em uma faixa de temperatura semelhante ao rodar o mesmo jogo.
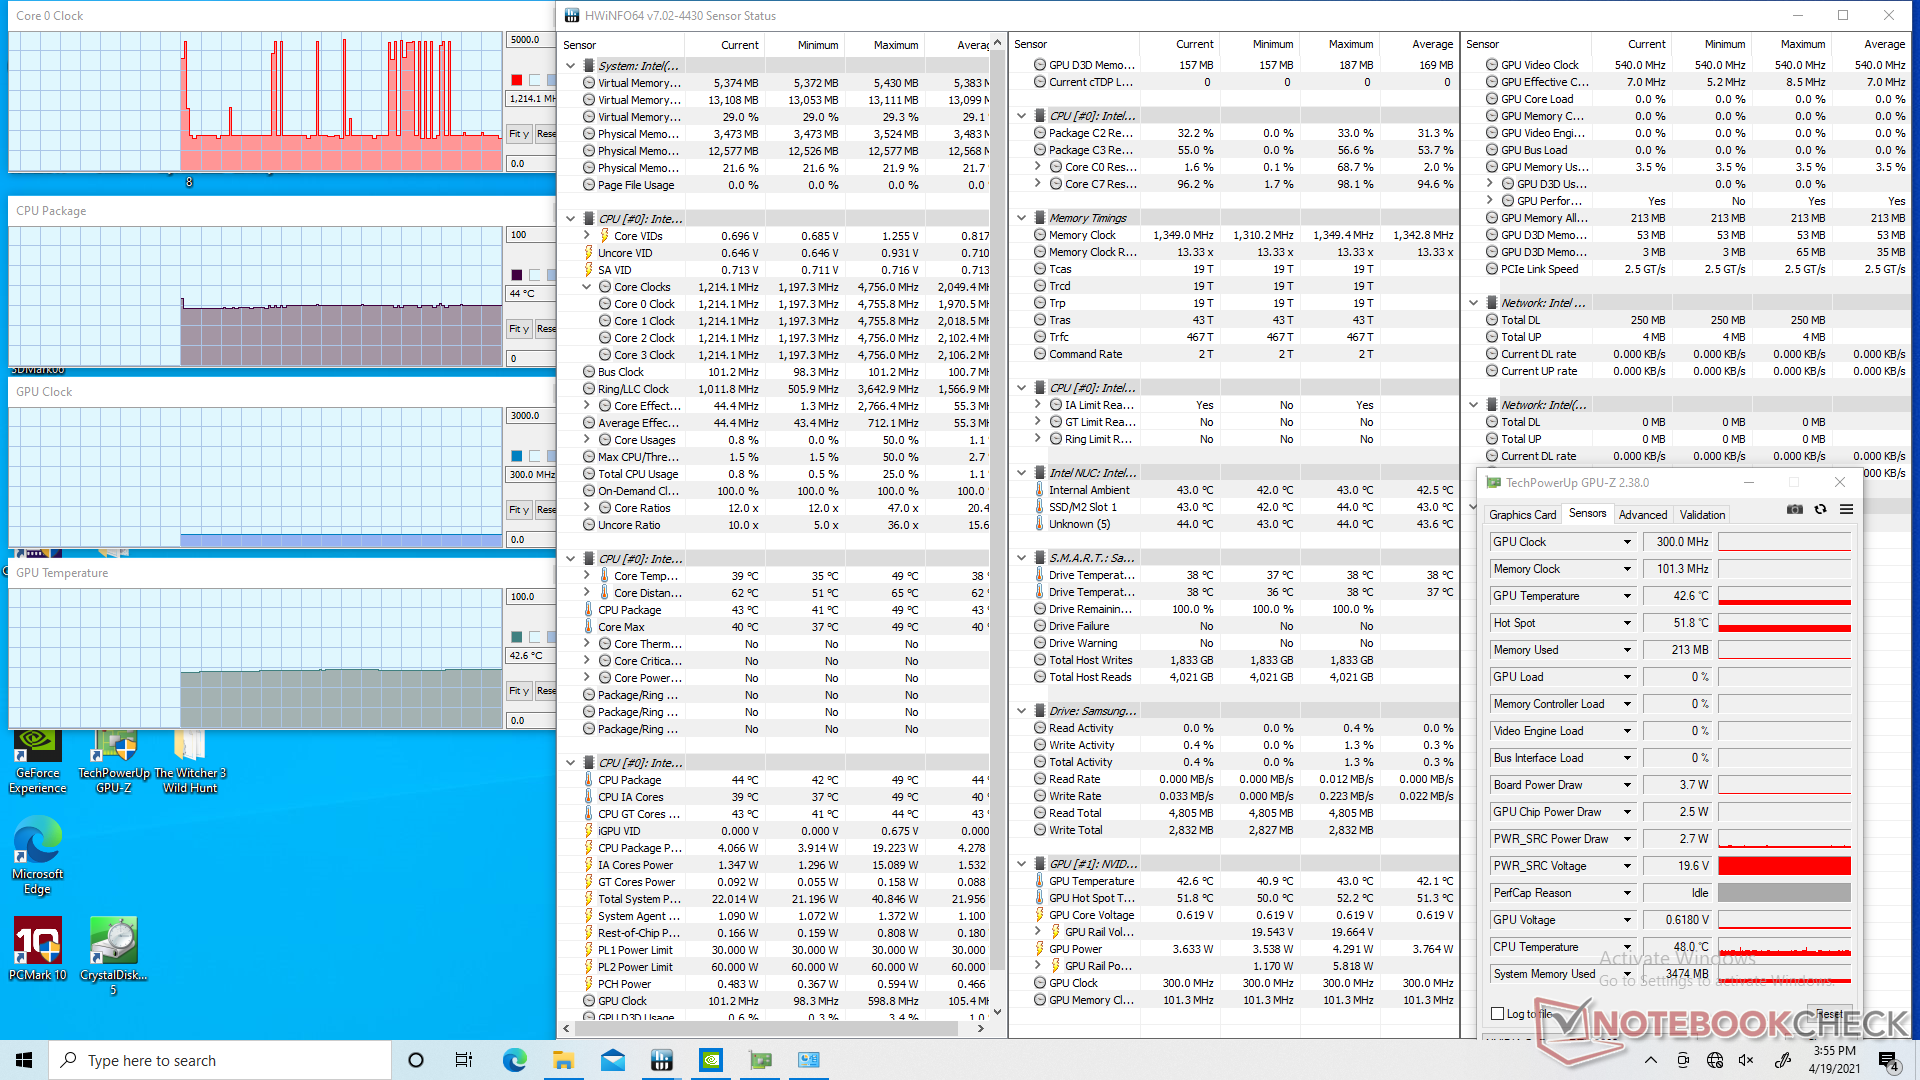
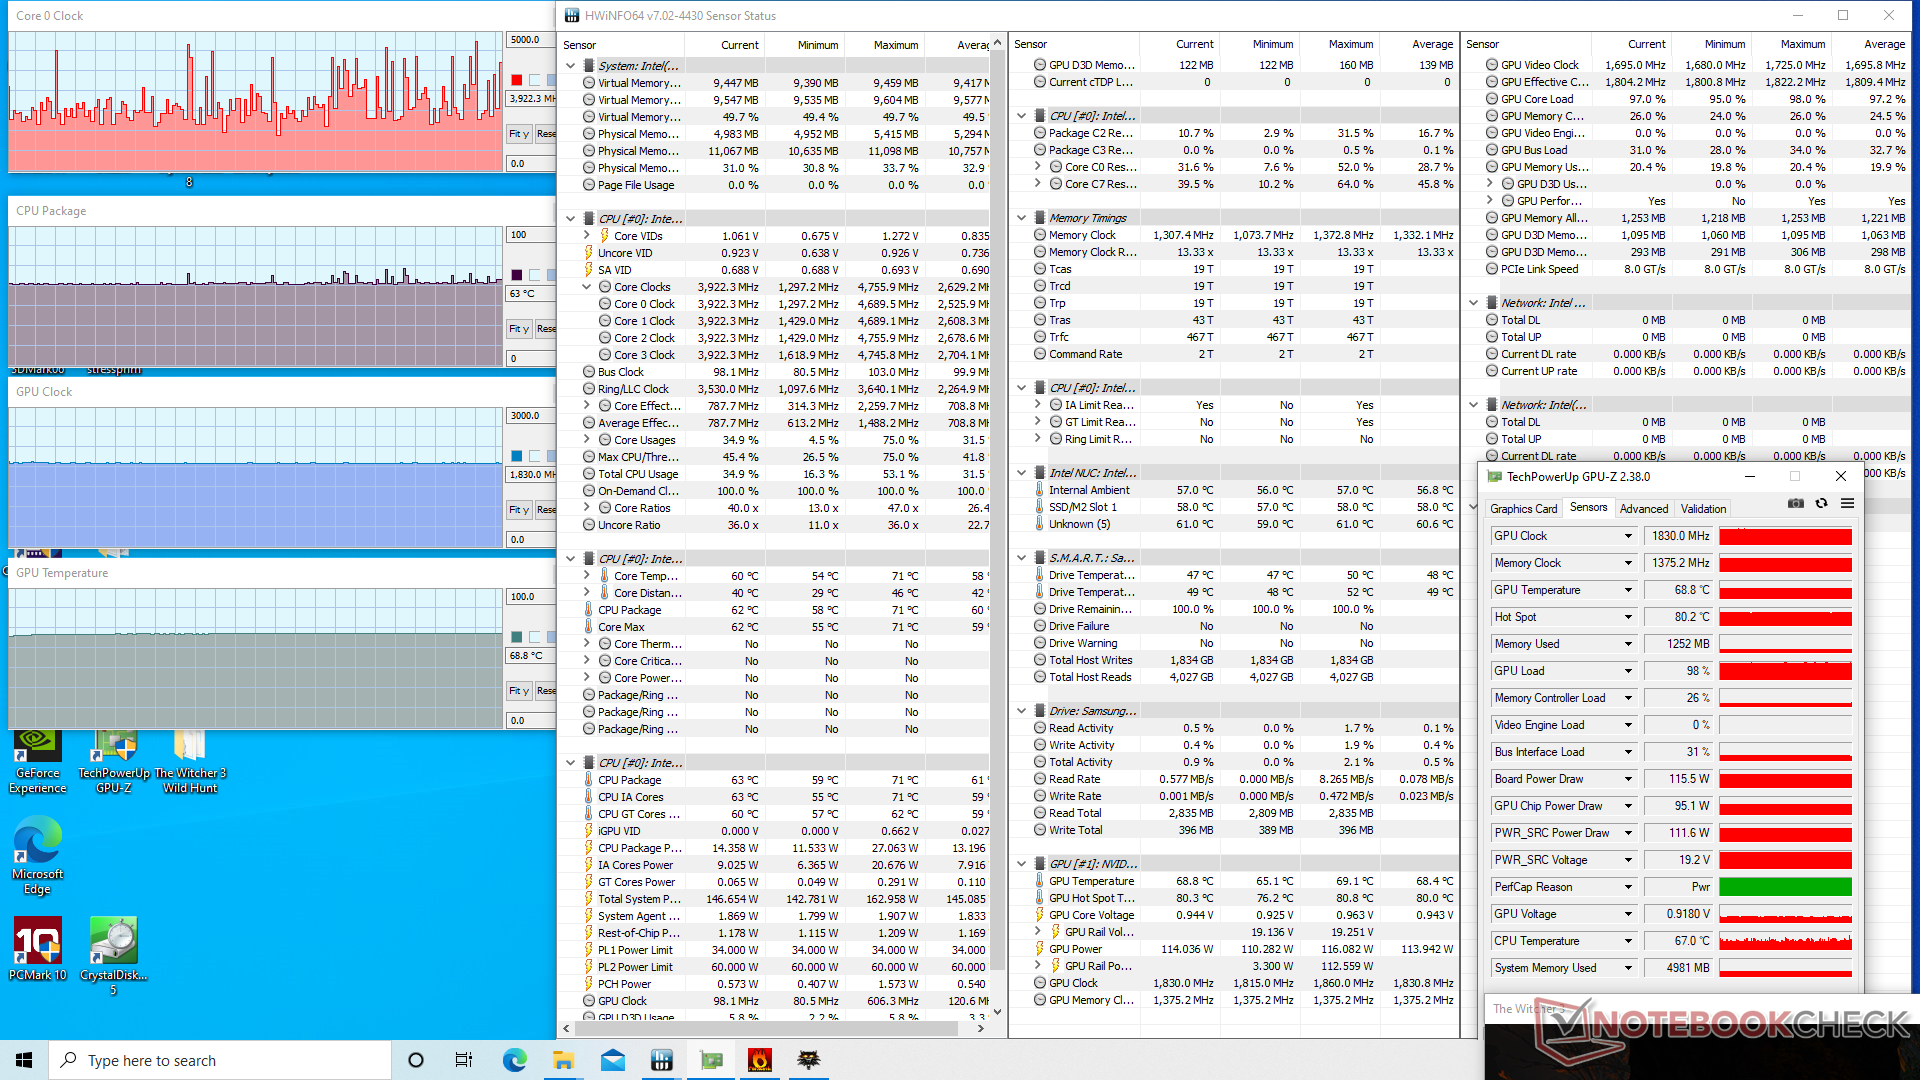
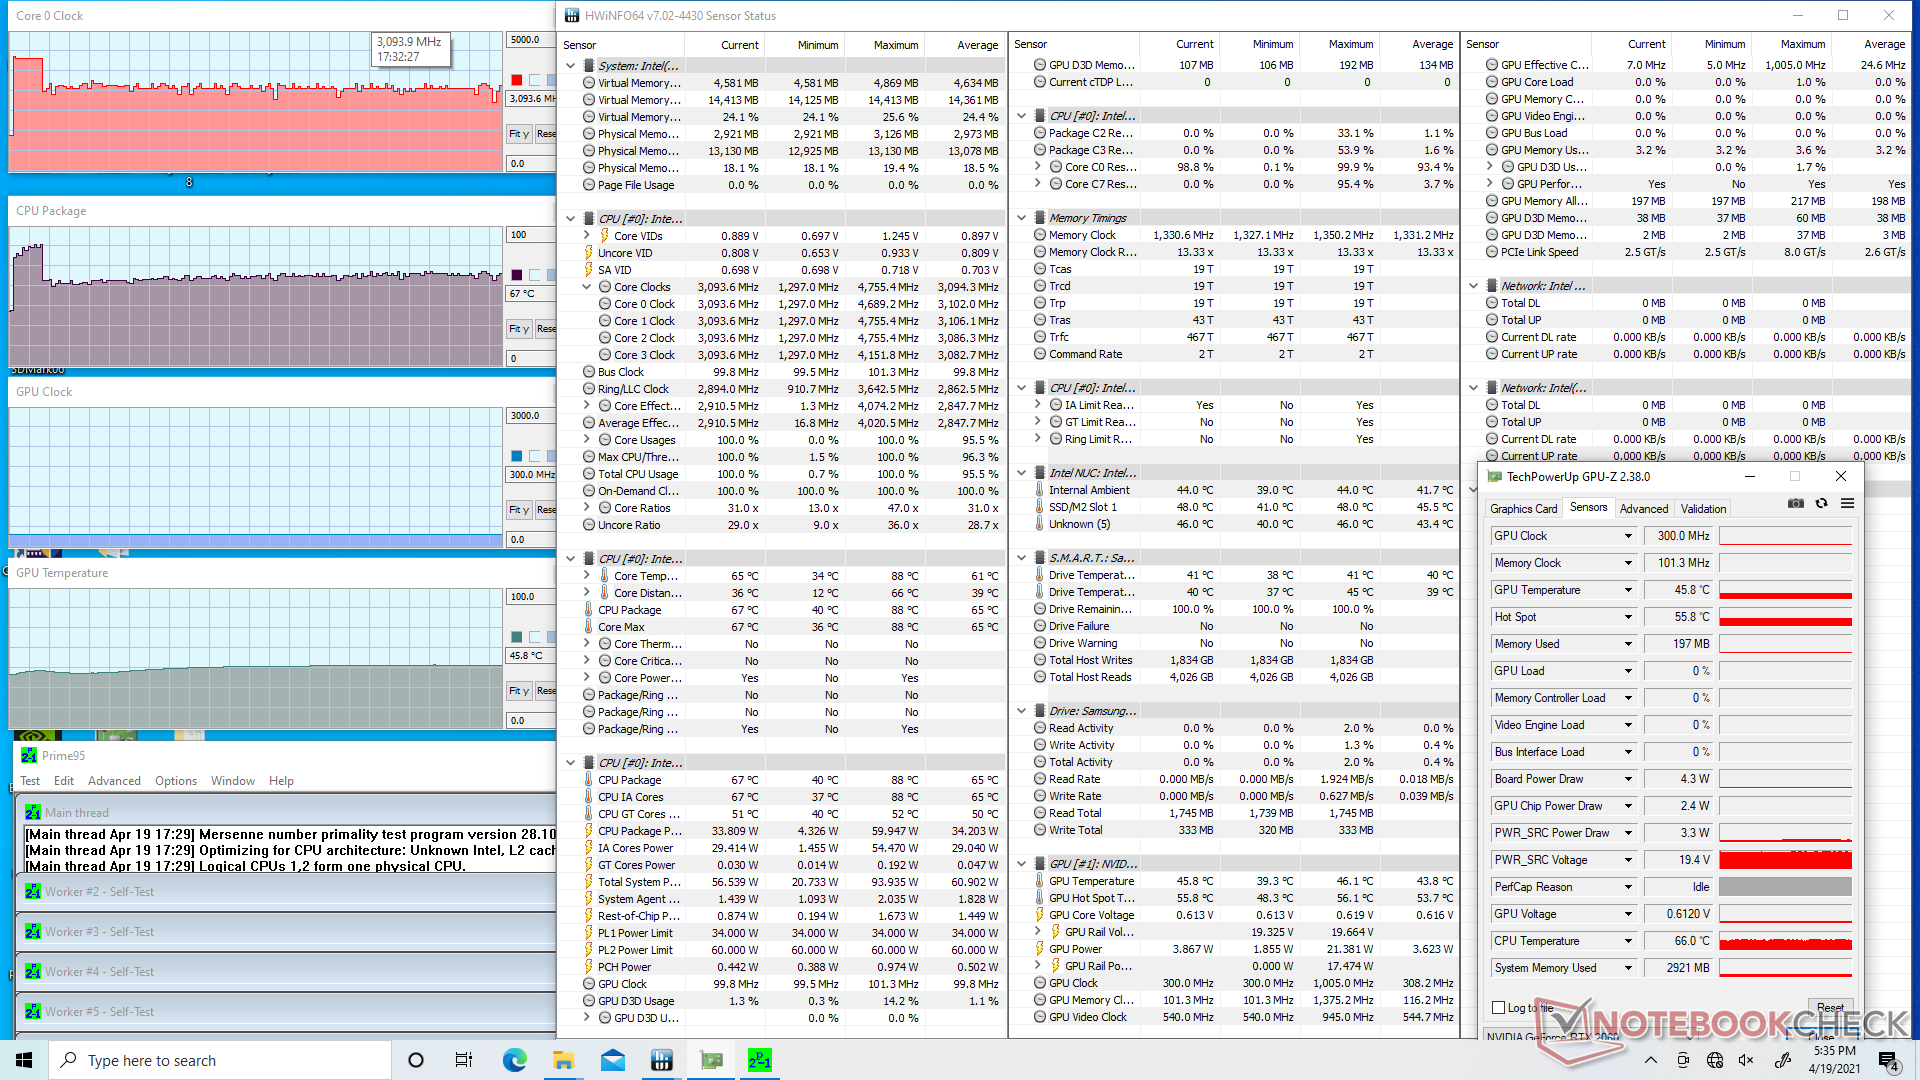
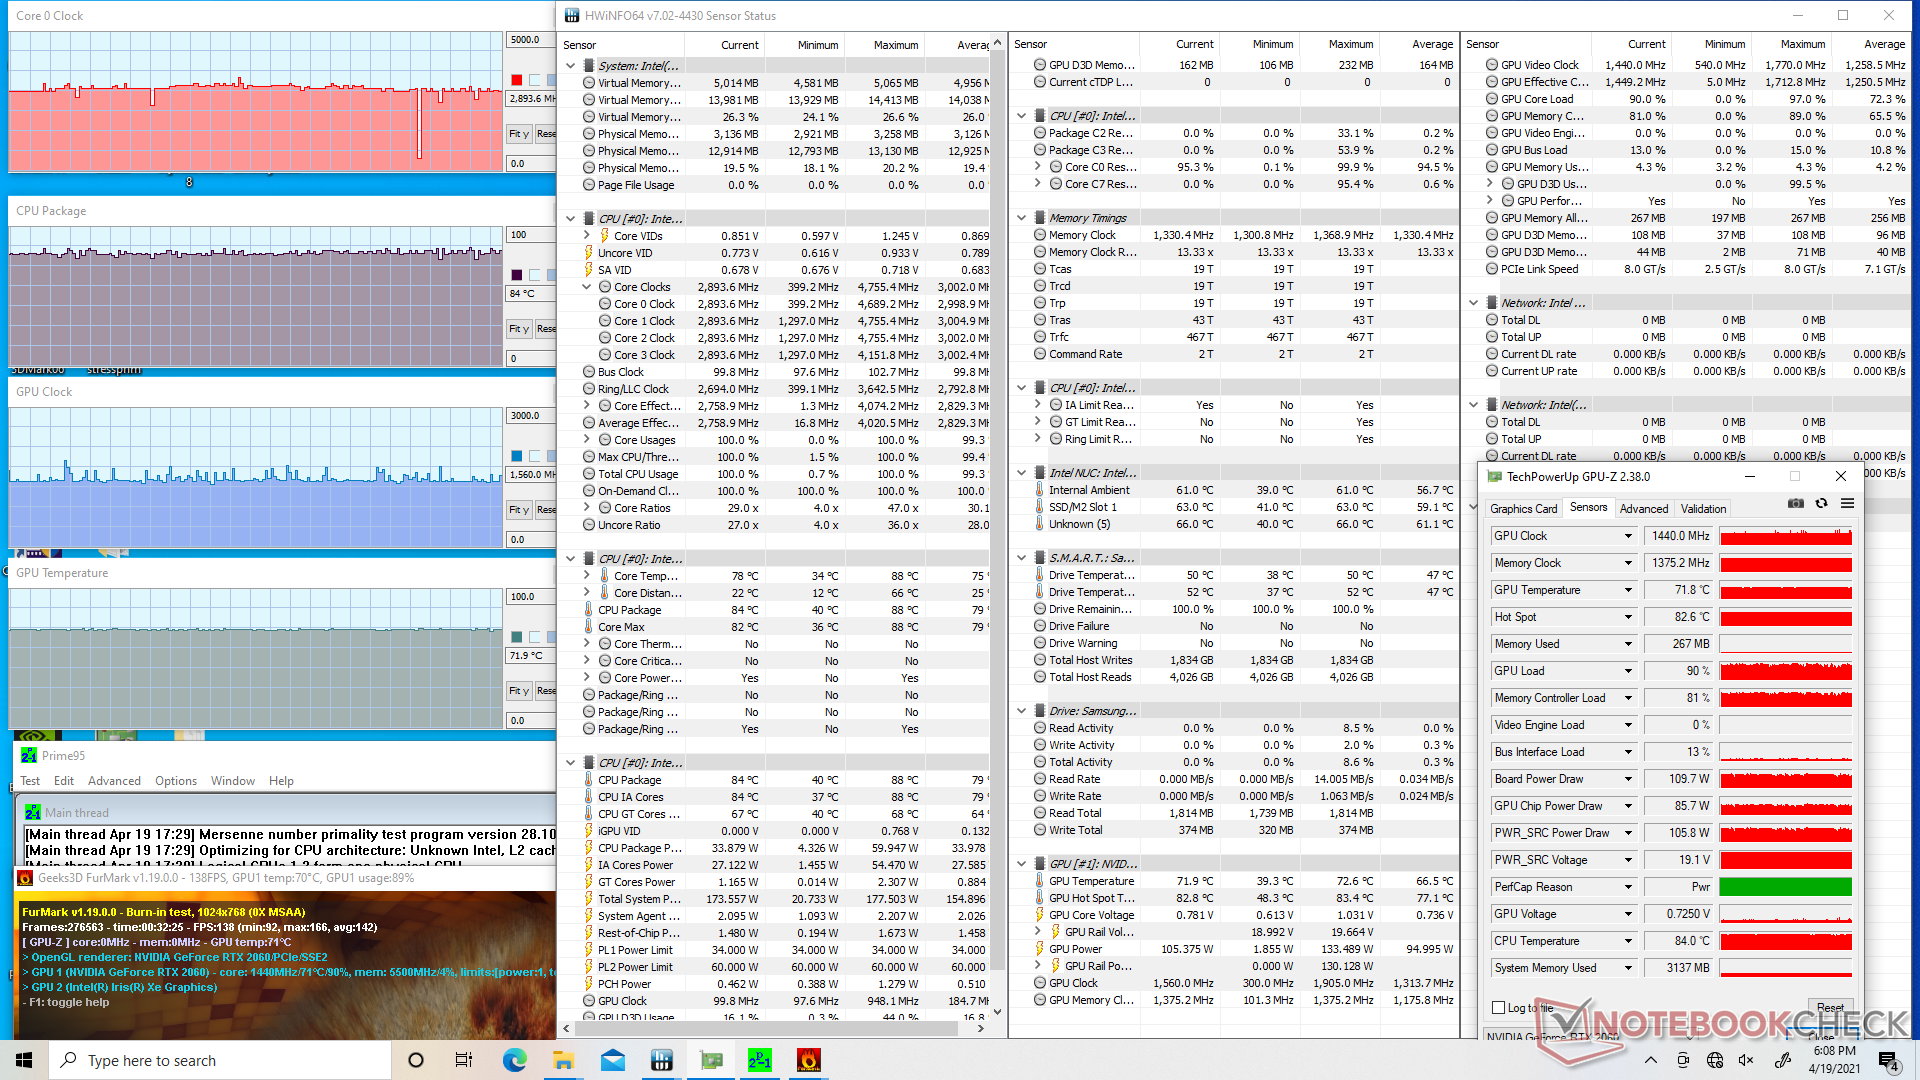
| RelógioCPU (GHz) | RelógioGPU (MHz) | Temperaturamédiada CPU (°C) | Temperaturamédiada GPU (°C) | |
| System Idle | -- | -- | 44 | 43 |
| Prime95 Stress | 3.0 - 3.2 | -- | 67 | 46 |
| Prime95 + FurMark Stress | 2.9 | 1440 | 84 | 72 |
| Witcher 3 Stress | 1.5 - 4.2 | 1830 | 63 | 69 |
Energy Management
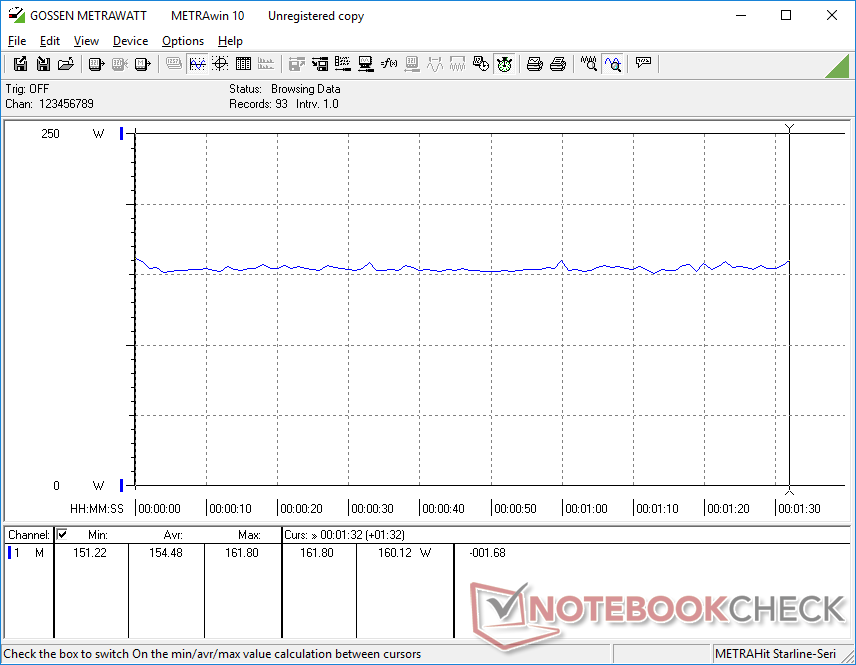
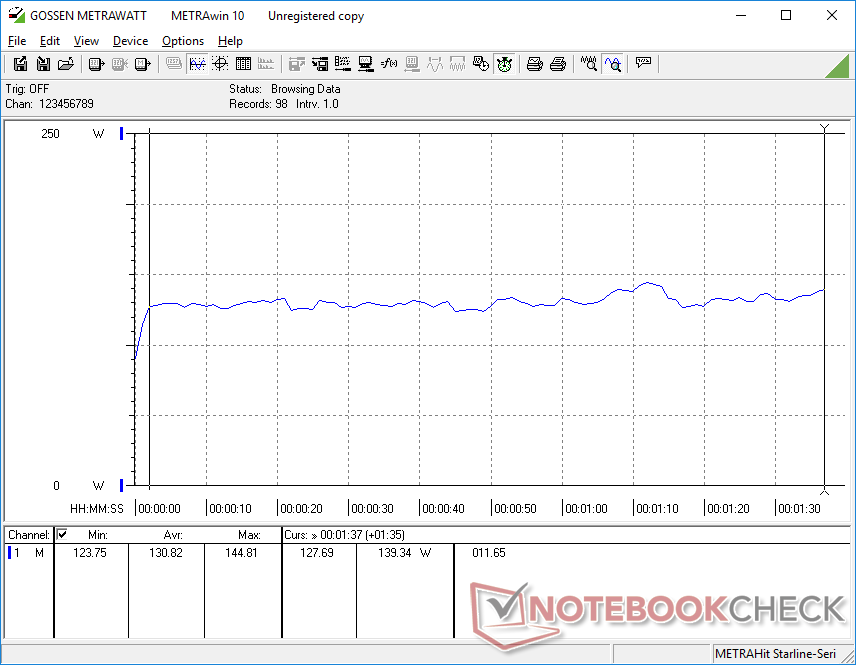
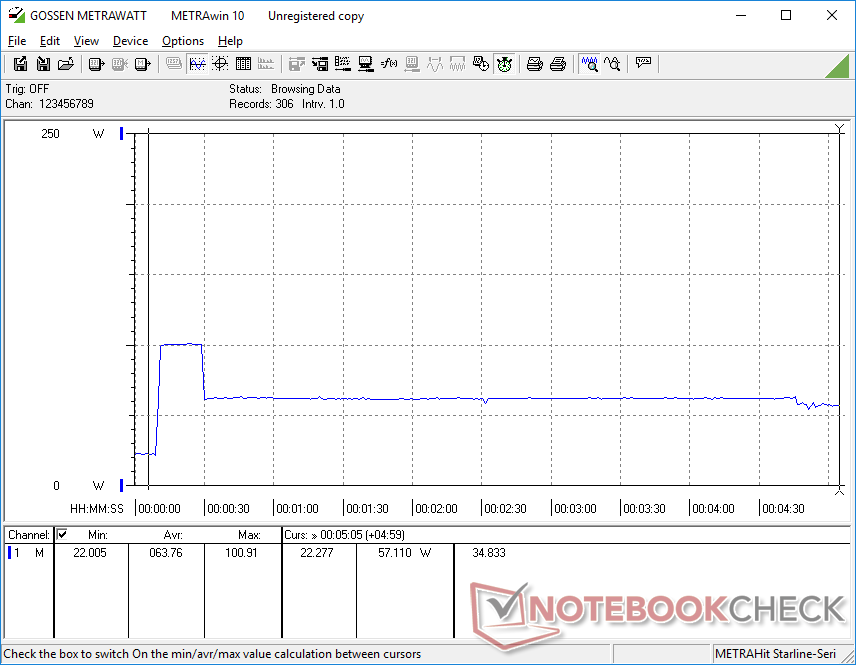
Consumo de energia
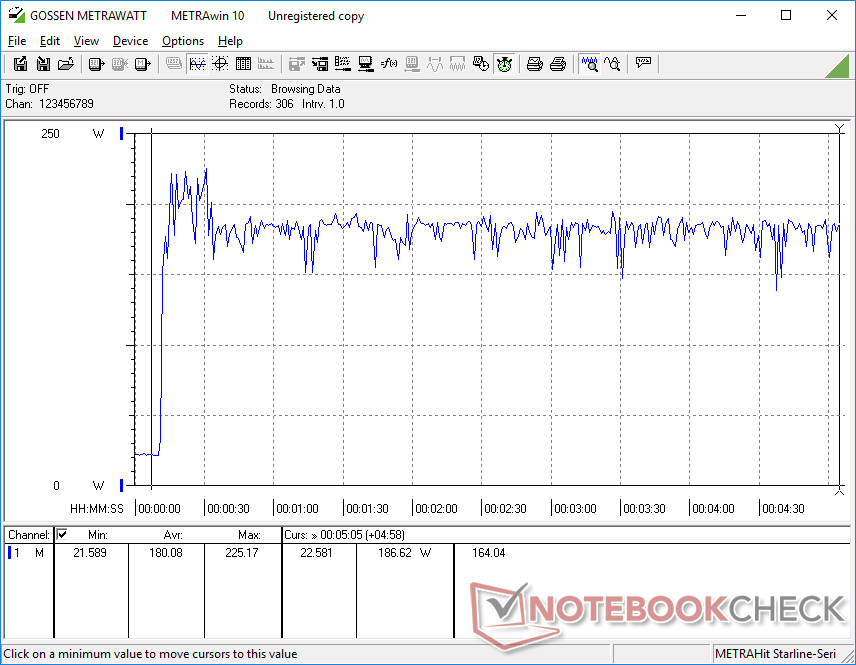
A movimentação na área de trabalho será de 5 W a 6 W quando nenhum display ou dispositivo USB estiver conectado a 21 W quando os teclados, ratos e displays estiverem conectados com a GPU discreta ativa. O consumo de energia quando os jogos podem ser cerca de 30 a 60 por cento maior do que a Hades Canyon NUC, o que é justo considerando o aumento de 70 a 100 por cento na performance gráfica.
Somos capazes de registrar um saque temporário máximo de 225 W do adaptador grande (~20 x 10 x 2 cm) 240 W AC ao executar simultaneamente Prime95 e FurMark. Note que o NUC11 Phantom Canyon usa o mesmo adaptador Lite-On AC que o NUC8 Hades Canyon e, portanto, são intercambiáveis.
| desligado | |
| Ocioso | |
| Carga |
|
Key:
min: | |
| Intel NUC11PHKi7C i7-1165G7, GeForce RTX 2060 Mobile, Samsung SSD 980 Pro 500GB MZ-V8P500BW, , x, | Intel Hades Canyon NUC8i7HVK i7-8809G, Vega M GH, Intel Optane 120 GB SSDPEK1W120GA, , x, | Intel NUC11PAQi7 i7-1165G7, Iris Xe G7 96EUs, Samsung SSD 980 Pro 500GB MZ-V8P500BW, , x, | Zotac ZBOX Magnus EK71080 i7-7700HQ, GeForce GTX 1080 (Desktop), Samsung PM961 MZVLW256HEHP, , x, 0" | Aorus Gaming Box GeForce RTX 2080 Ti i7-1165G7, , , , x, | |
|---|---|---|---|---|---|
| Power Consumption | -40% | 49% | -131% | -154% | |
| Idle Minimum * (Watt) | 5.8 | 15.5 -167% | 5.6 3% | 27.1 -367% | 29.6 -410% |
| Idle Average * (Watt) | 5.9 | 16.2 -175% | 5.6 5% | 27.4 -364% | 29.6 -402% |
| Idle Maximum * (Watt) | 20.7 | 16.5 20% | 6 71% | 28.8 -39% | 29.6 -43% |
| Load Average * (Watt) | 130.8 | 83.4 36% | 31.4 76% | 100.4 23% | 79.9 39% |
| Witcher 3 ultra * (Watt) | 154.4 | 121.7 21% | 39 75% | 243.1 -57% | 252 -63% |
| Load Maximum * (Watt) | 225.2 | 173.5 23% | 80.5 64% | 186.7 17% | 319.8 -42% |
* ... menor é melhor
Pro
Contra
Veredicto
O Phantom Canyon é a prova de que a Intel passou da Kaby Lake-G. Desapareceu a novidade de um chipset Intel-AMD em favor de mais processadores de prateleira e módulos VRAM comumente encontrados em Ultrabooks e laptops de jogos. Isto significa, em última análise, um suporte ao driver mais confiável e uma compatibilidade mais suave com os jogos que o Hades Canyon poderia esperar.
Hades Canyon quase parece obsoleto em frente ao Phantom Canyon. O último NUC pode ser um pouco maior, mas é significativamente mais rápido sem precisar correr mais alto ou mais quente para mais do que compensar o aumento do tamanho de gen para gen.
O desempenho geral é mais rápido que Hades Canyon, como esperado, mas é ótimo ver que isto não vem ao custo de ventiladores visivelmente mais altos ou temperaturas centrais mais quentes, que é sempre o medo ao atualizar para PCs mais rápidos.
Os inconvenientes incluem o tamanho ligeiramente mais grosso e maior consumo de energia do que Hades Canyon, tijolo de má aparência e seu alto preço de rua ao norte de US$ 1000 por uma unidade de barebone. Os usuários terão que realmente valorizar o fator de forma e a qualidade do nome NUC como laptops mais potentes para jogos - completos com memória RAM e armazenamento, por sinal - podem ser obtidos por aproximadamente o mesmo preço.
Preço e disponibilidade
O Intel NUC11PHKi7C Phantom Canyon ainda não está amplamente disponível a partir desta escrita. Simplynuc.com está atualmente oferecendo pré-encomendas para o sistema a partir de $1339 USD.
Price comparison

