Intel NUC11PAQi7 Panther Canyon Mini PC Review: Tiger Lake Feito corretamente
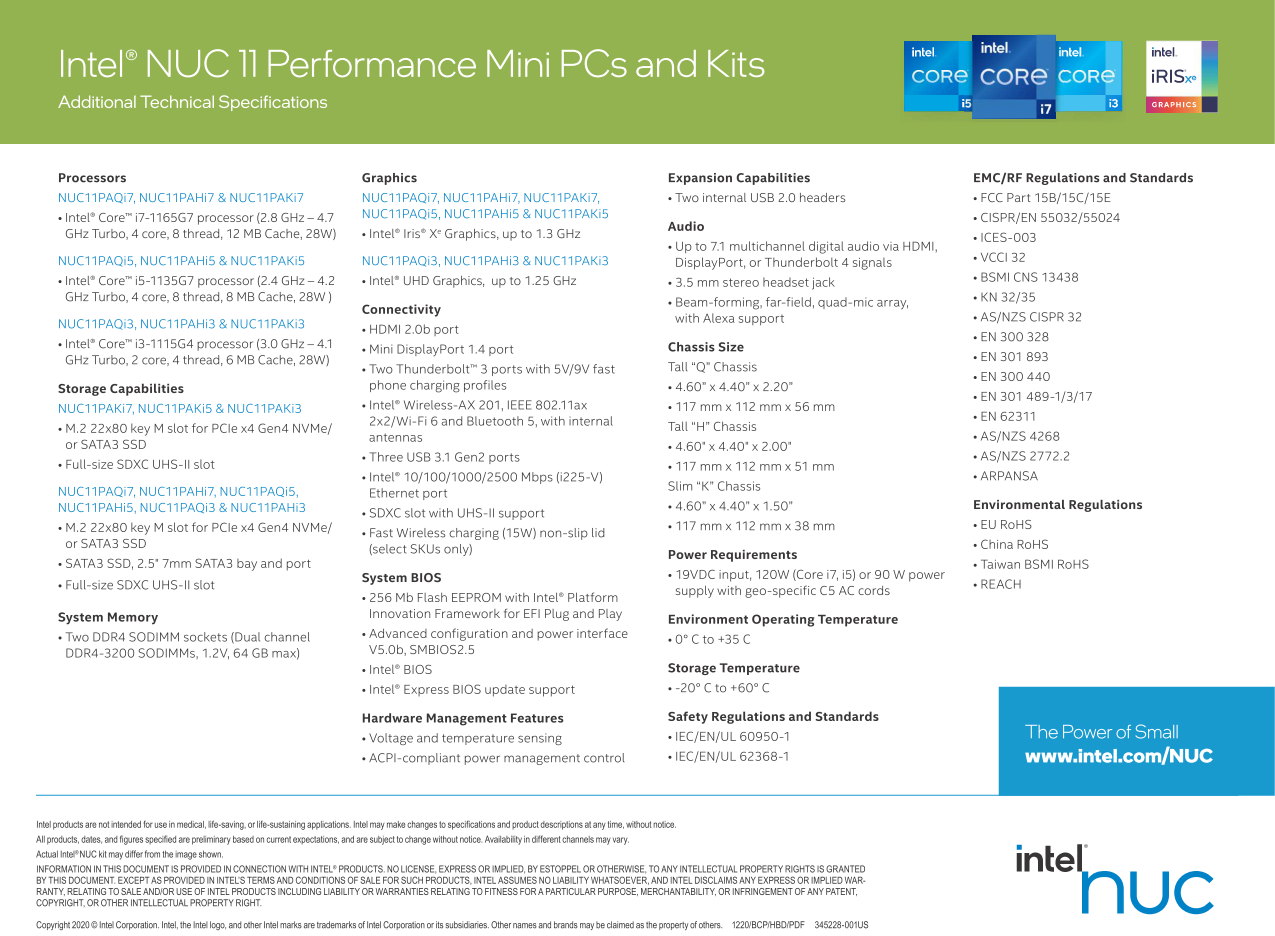
A série NUC 11 sucede a NUC 10 do ano passado introduzindo novos projetos de chassis e atualizando as opções de processadores para Tiger Lake-U. Três modelos estão disponíveis em tamanhos diferentes: o grande NUC11PAQ, o médio NUC11PAH, e o pequeno NUC11PAK. As diferenças físicas e características são todas detalhadas pelo resumo oficial do produto da Intel abaixo.
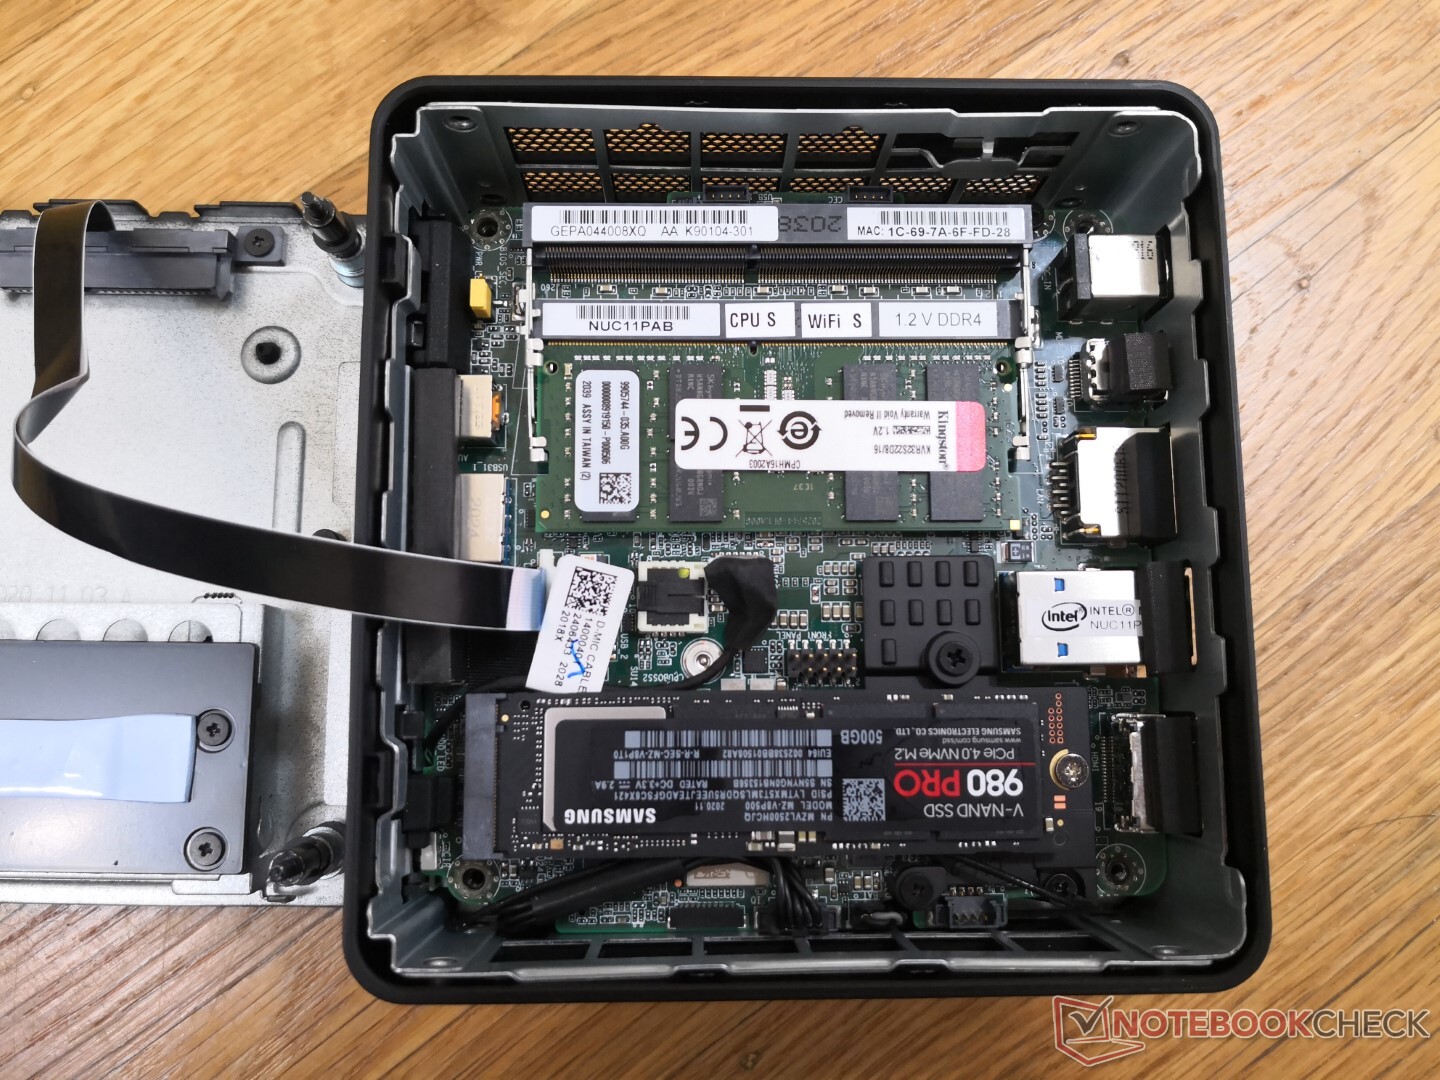
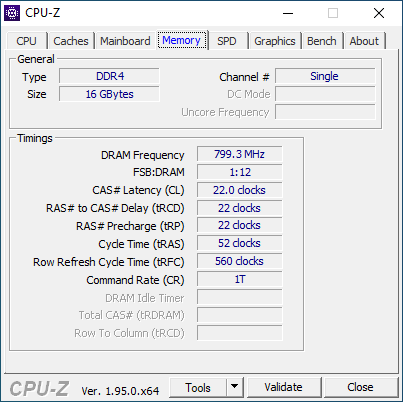
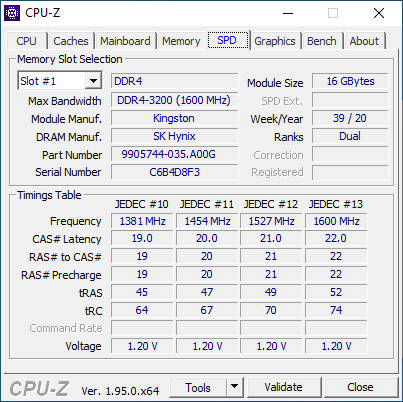
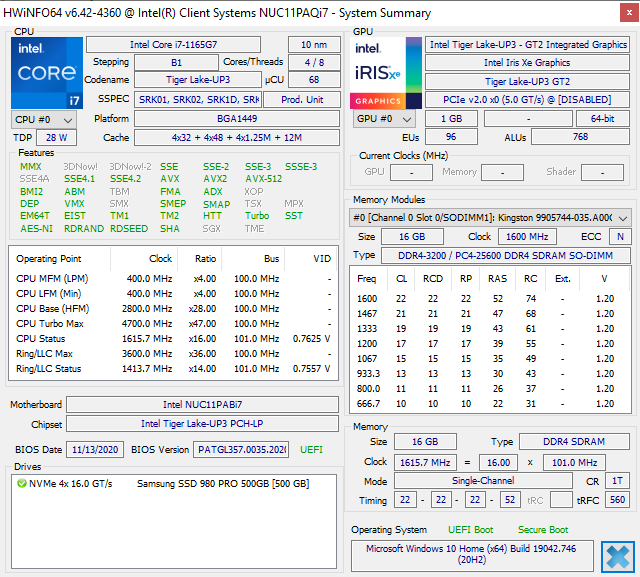
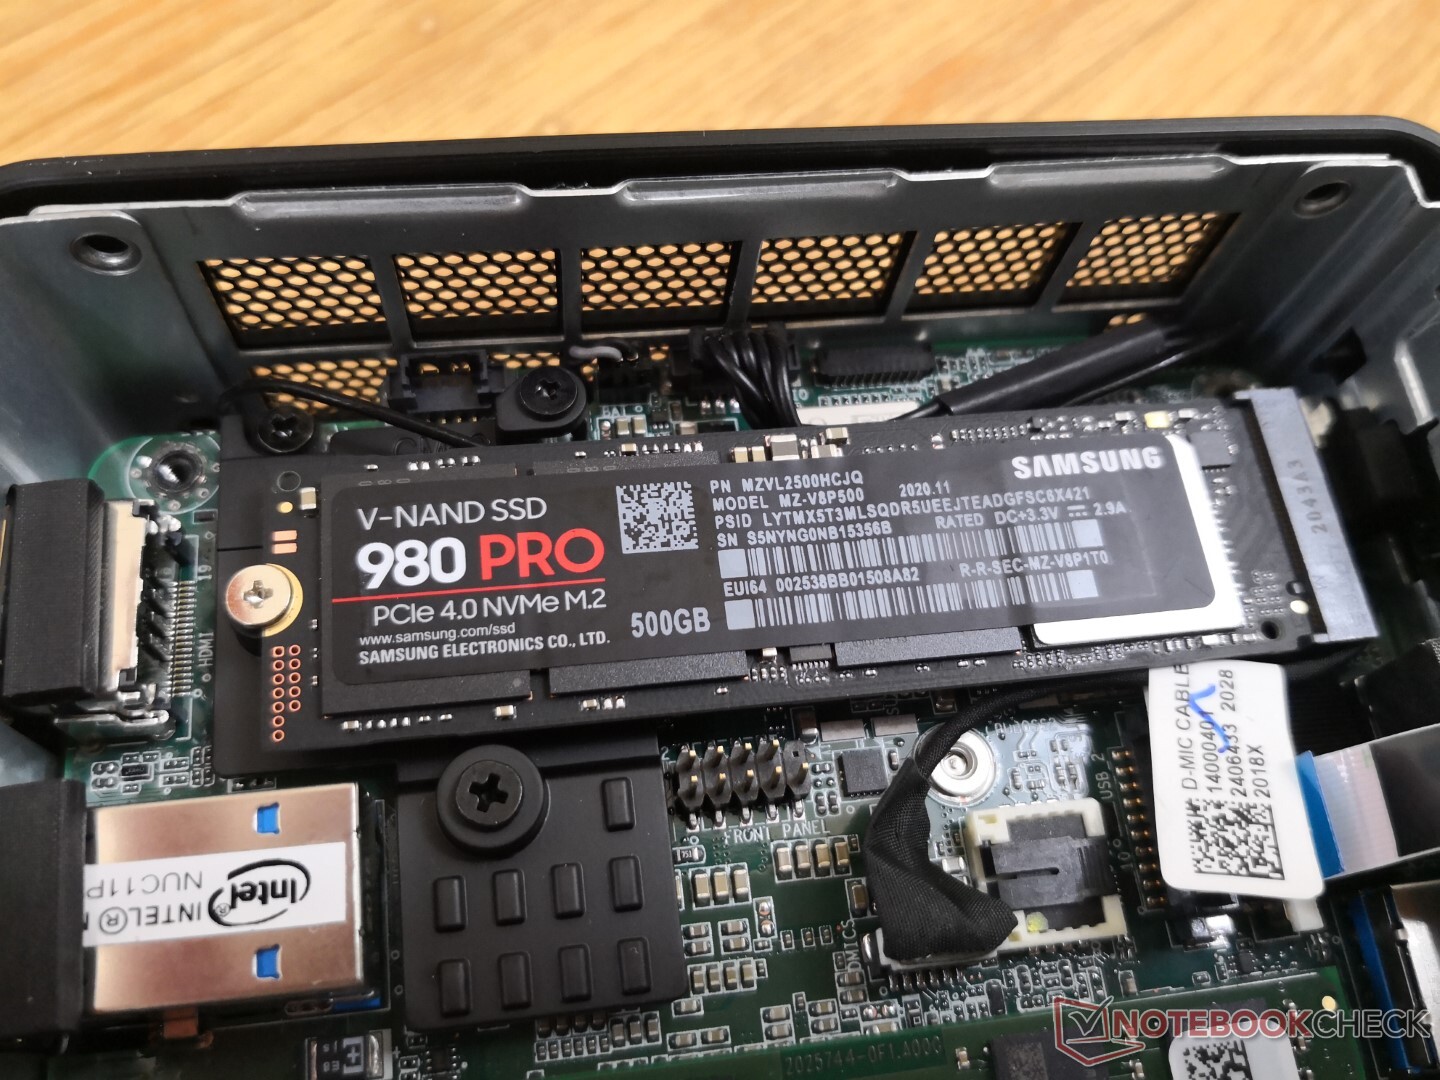
Nossa unidade de revisão aqui é a NUC11PAQ equipada com a CPU Core i7-1165G7, 16 GB de RAM de canal único e 500 GB PCIe 4.0 Samsung 980 Pro NVMe SSD. As SKUs Lesser Core i5-1135G7 e Core i3-1115G4 também estão disponíveis, todas com gráficos Iris Xe integrados.
Mais análises da Intel NUC:
potential competitors in comparison
Avaliação | Data | Modelo | Peso | Altura | Size | Resolução | Preço |
|---|---|---|---|---|---|---|---|
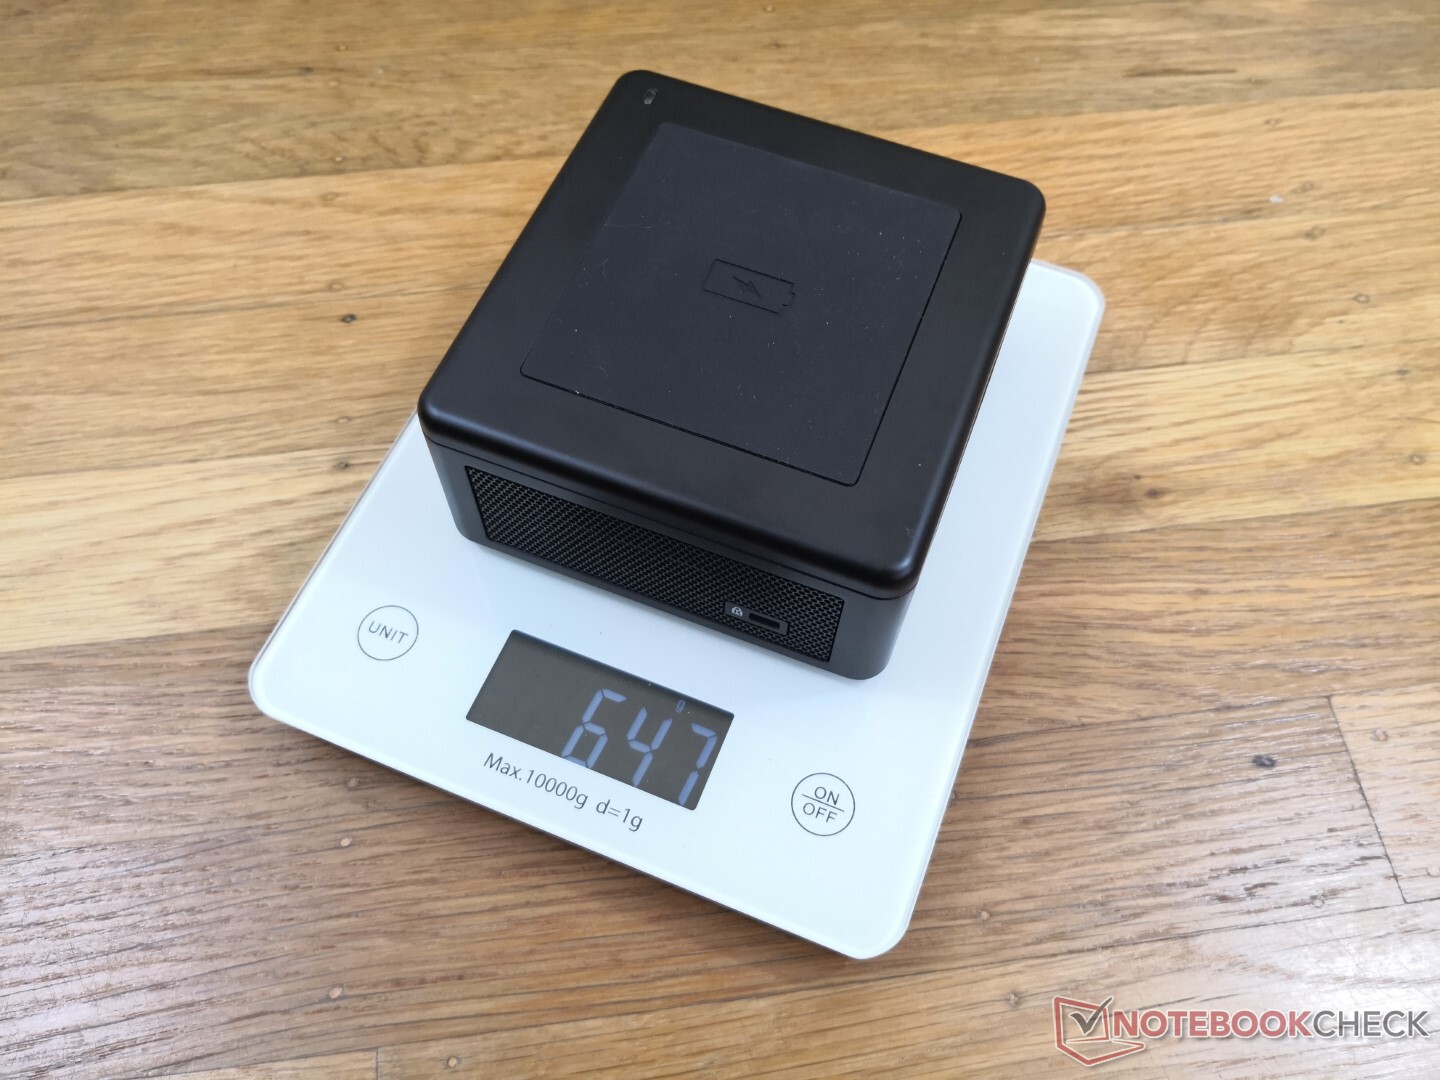
v (old) | 02/2021 | Intel NUC11PAQi7 i7-1165G7, Iris Xe G7 96EUs | 647 g | 56 mm | x | ||
v (old) | Intel NUC10i7FNH i7-10710U, UHD Graphics 620 | 697 g | 51 mm | 0.00" | 0x0 | ||
v (old) | 11/2018 | Intel NUC8i7BE i7-8559U, Iris Plus Graphics 655 | 683 g | 51 mm | x | ||
v (old) | Intel Hades Canyon NUC8i7HVK i7-8809G, Vega M GH | 1.3 kg | 39 mm | x | |||
v (old) | Beelink SEi10 i3-1005G1, UHD Graphics G1 (Ice Lake 32 EU) | 350 g | 41 mm | x | |||
v (old) | Zotac ZBox MI643 i5-10210U, UHD Graphics 620 | 550 g | 28.5 mm | x |
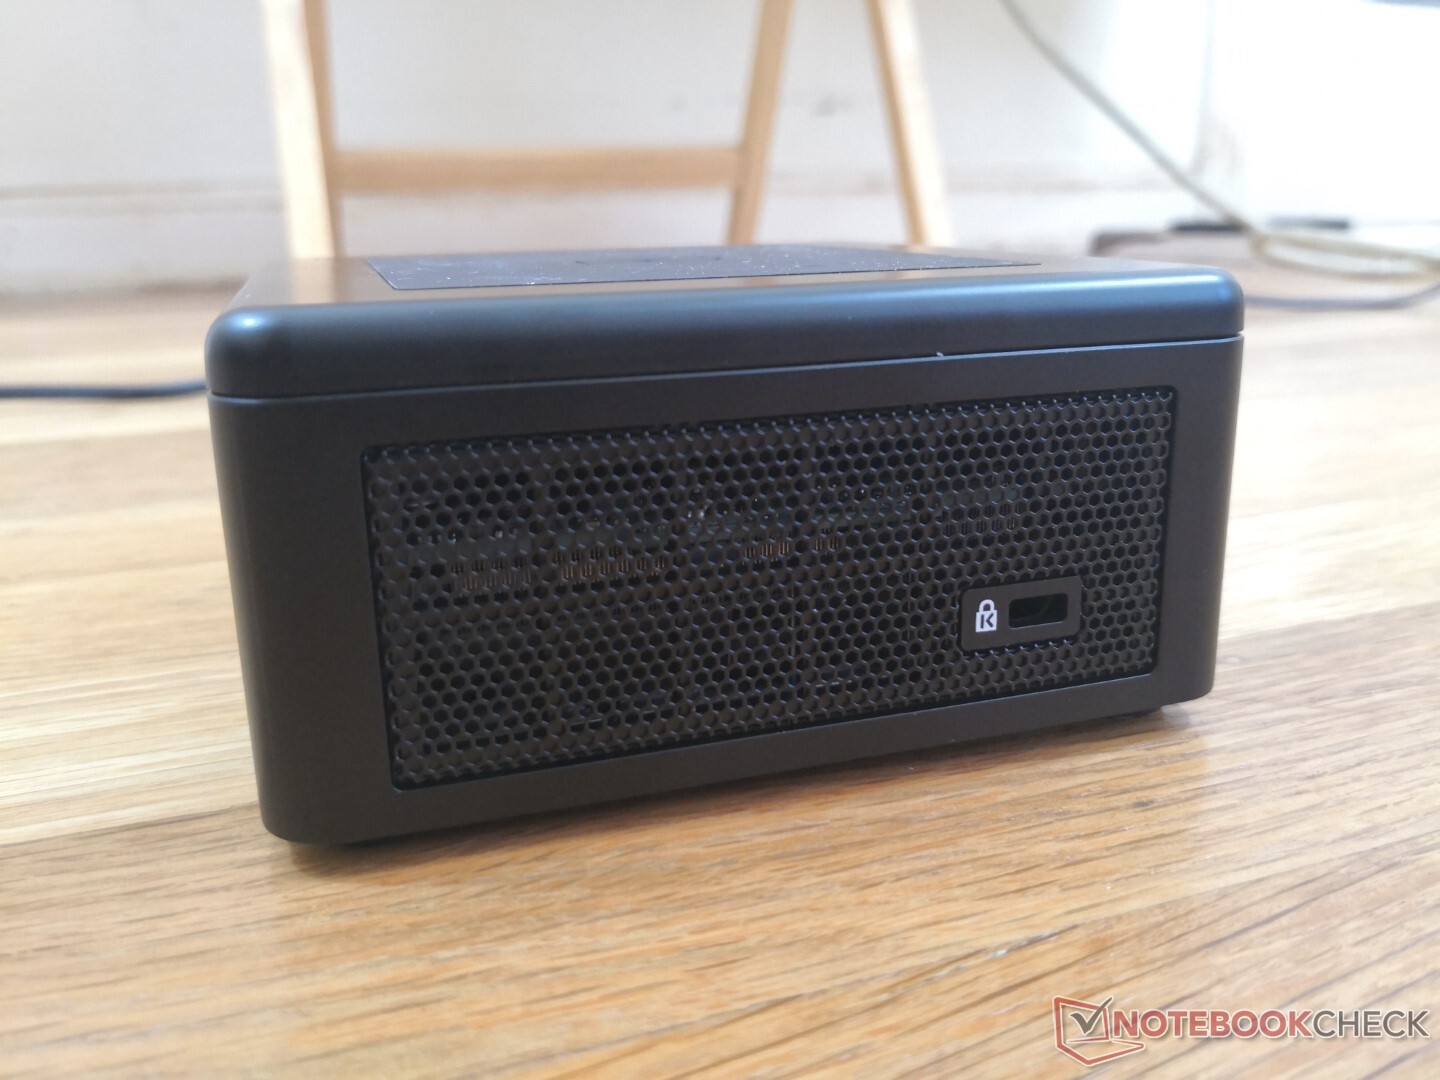
Caso
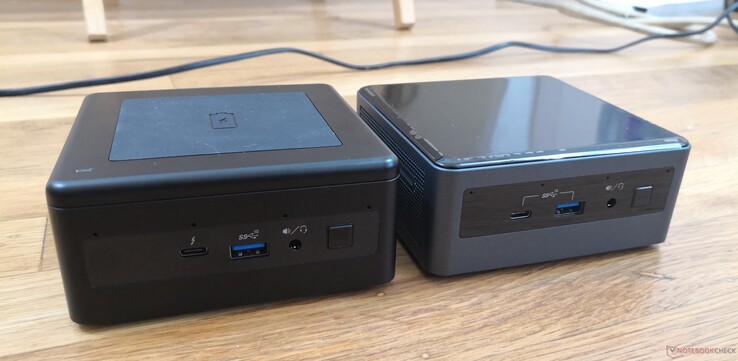
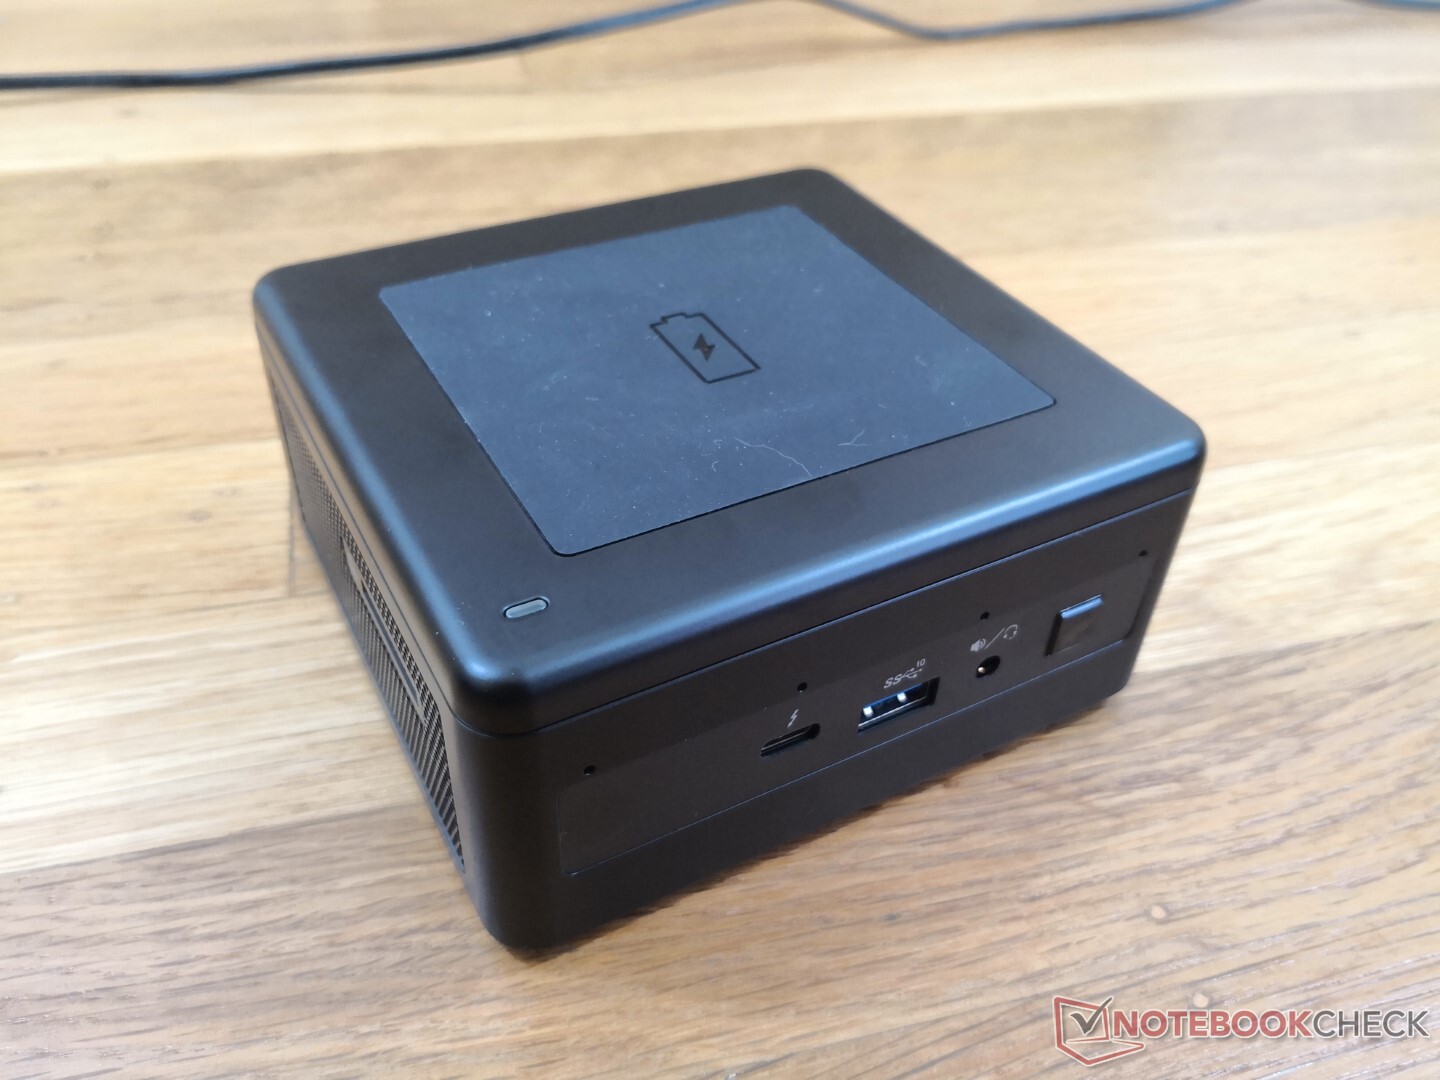
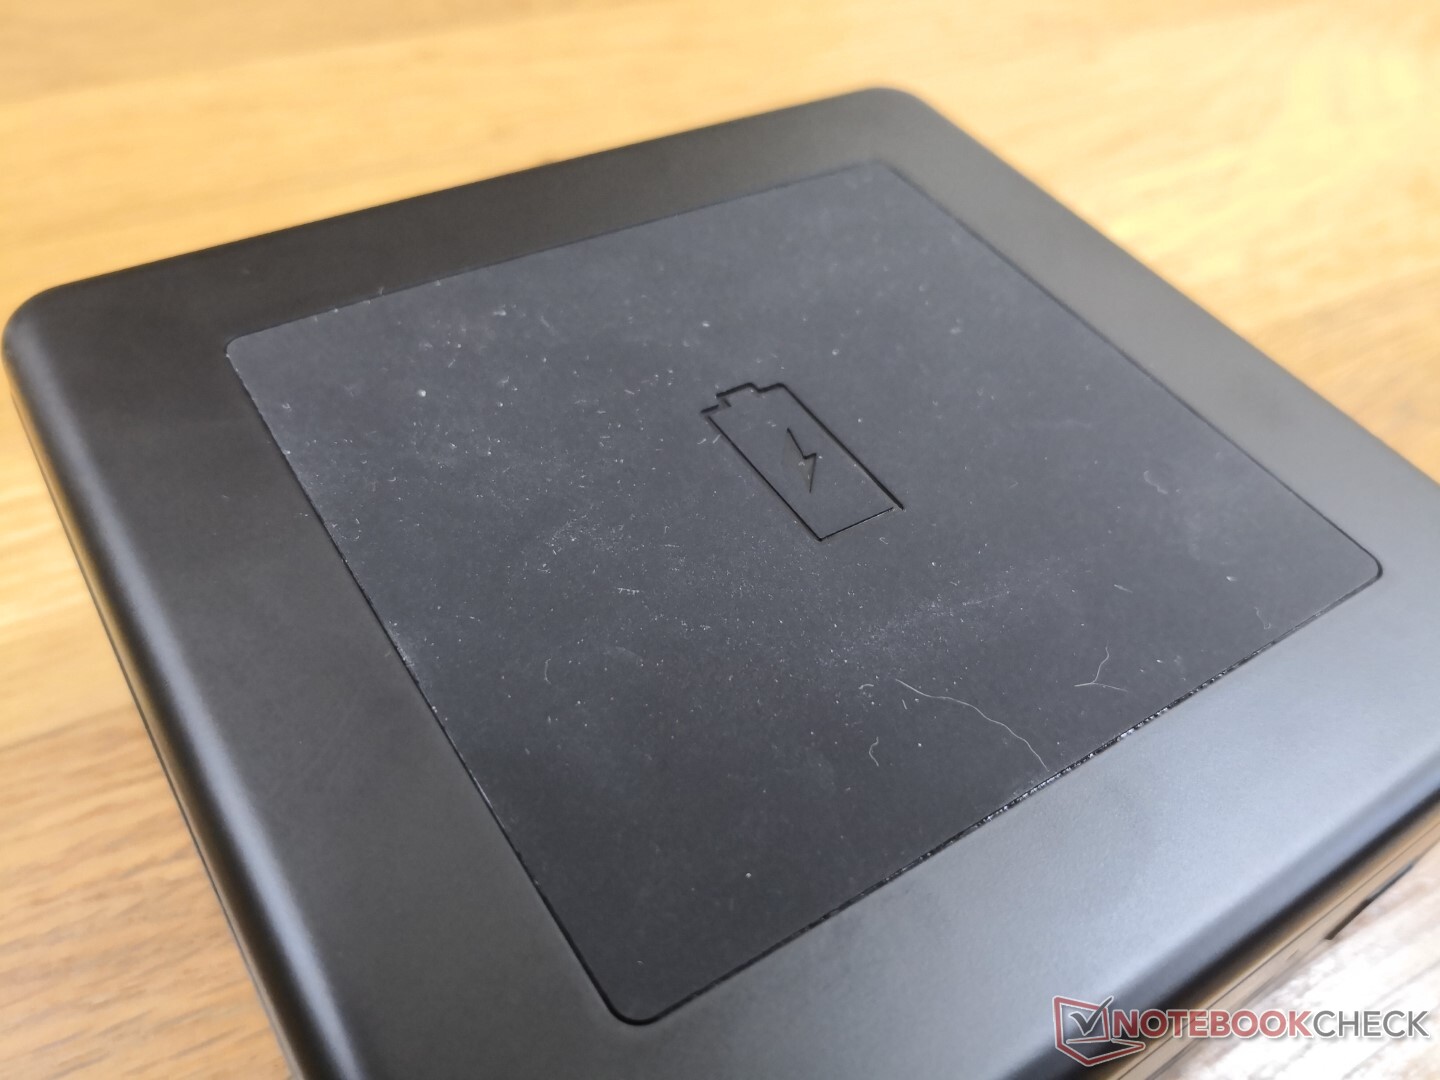
O NUC 11PAQ assume a forma familiar e os materiais dos projetos anteriores do NUC, mas com um novo "tapete" de carga de borracha Qi no topo. Tem um aspecto mais clasificado que o plástico liso e brilhante da NUC 10 do ano passado, mas a superfície de borracha atrairá poeira e pêlos como se não houvesse amanhã. A nova característica também será inútil para proprietários que pretendem esconder suas unidades NUC sob mesas ou montá-las verticalmente atrás de monitores

Conectividade
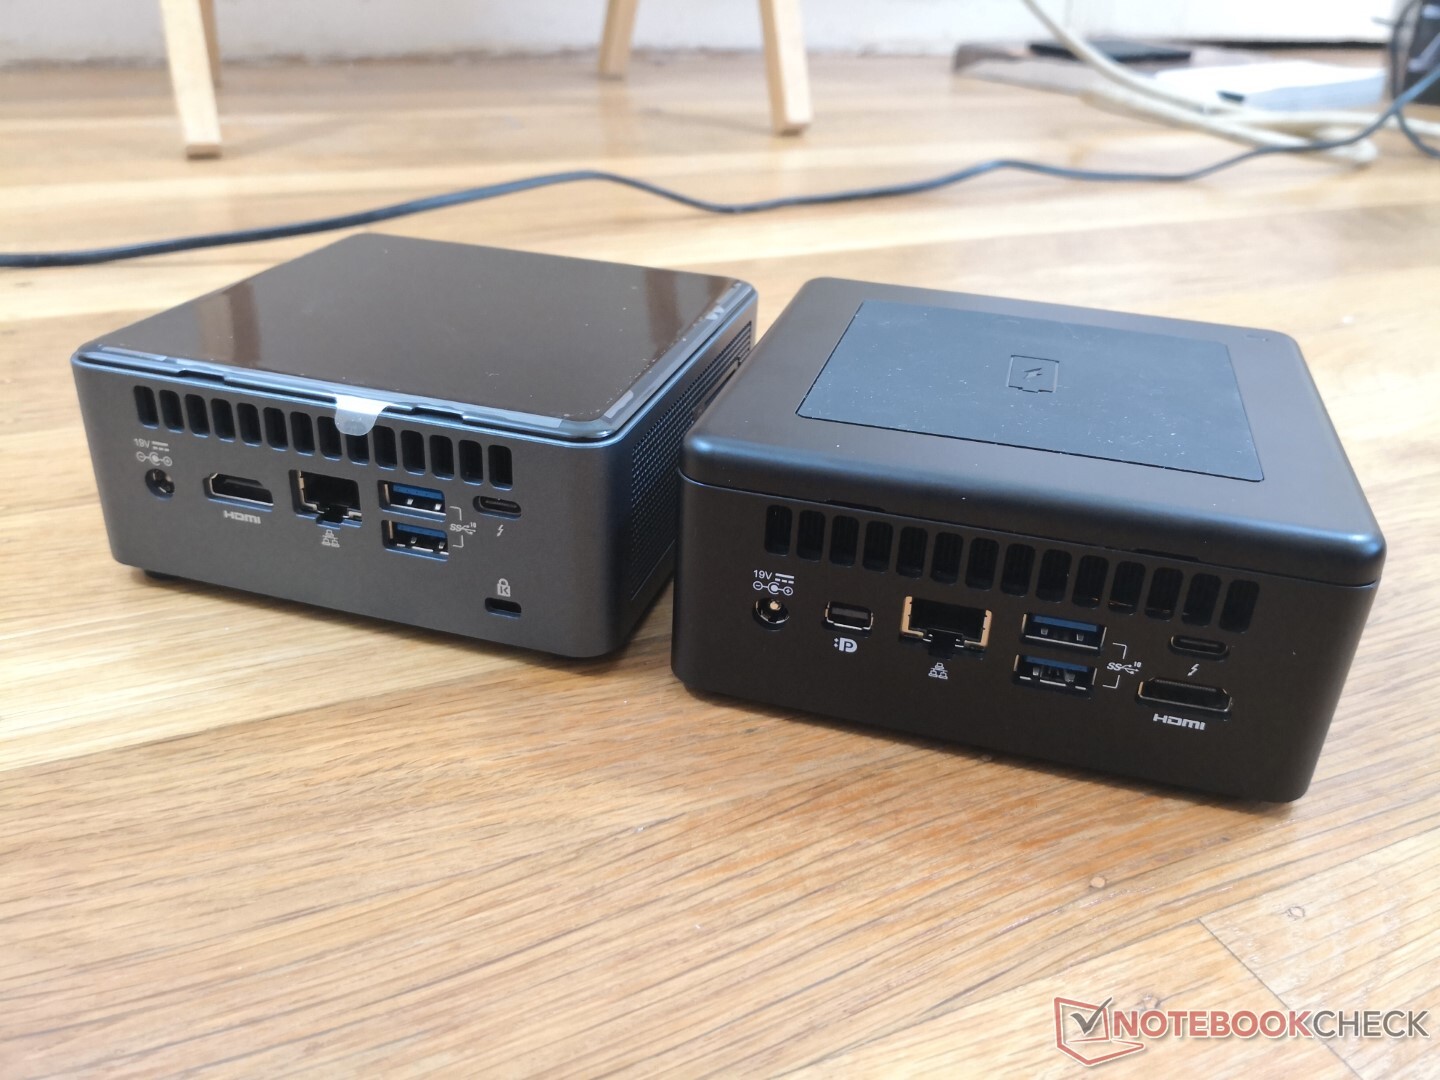
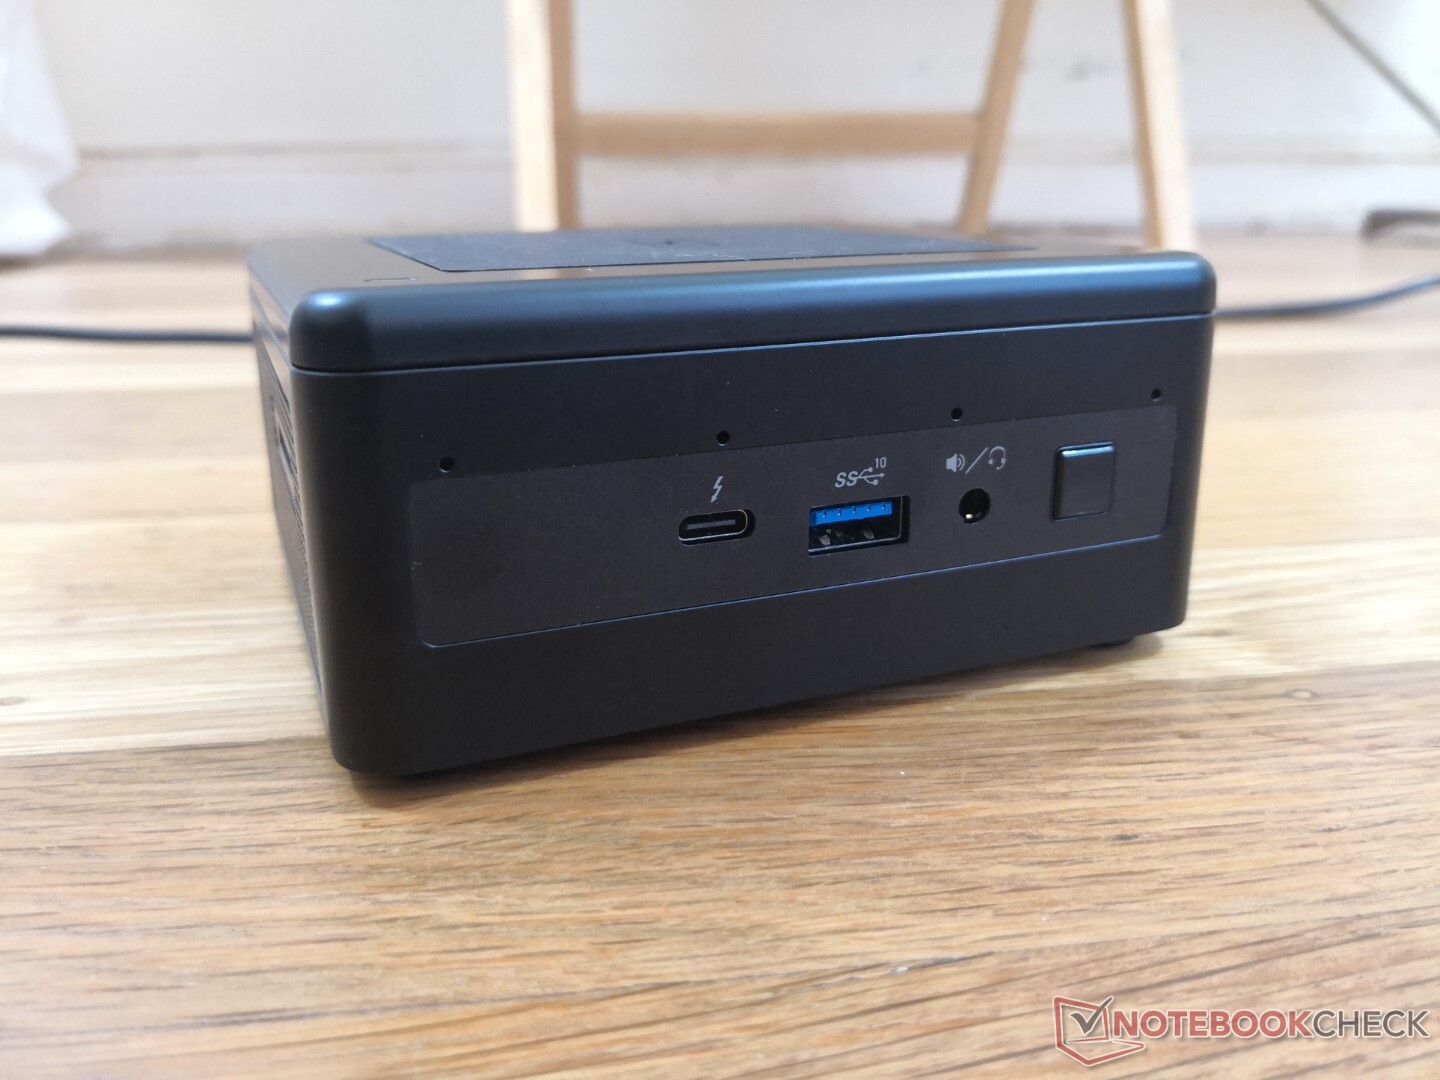
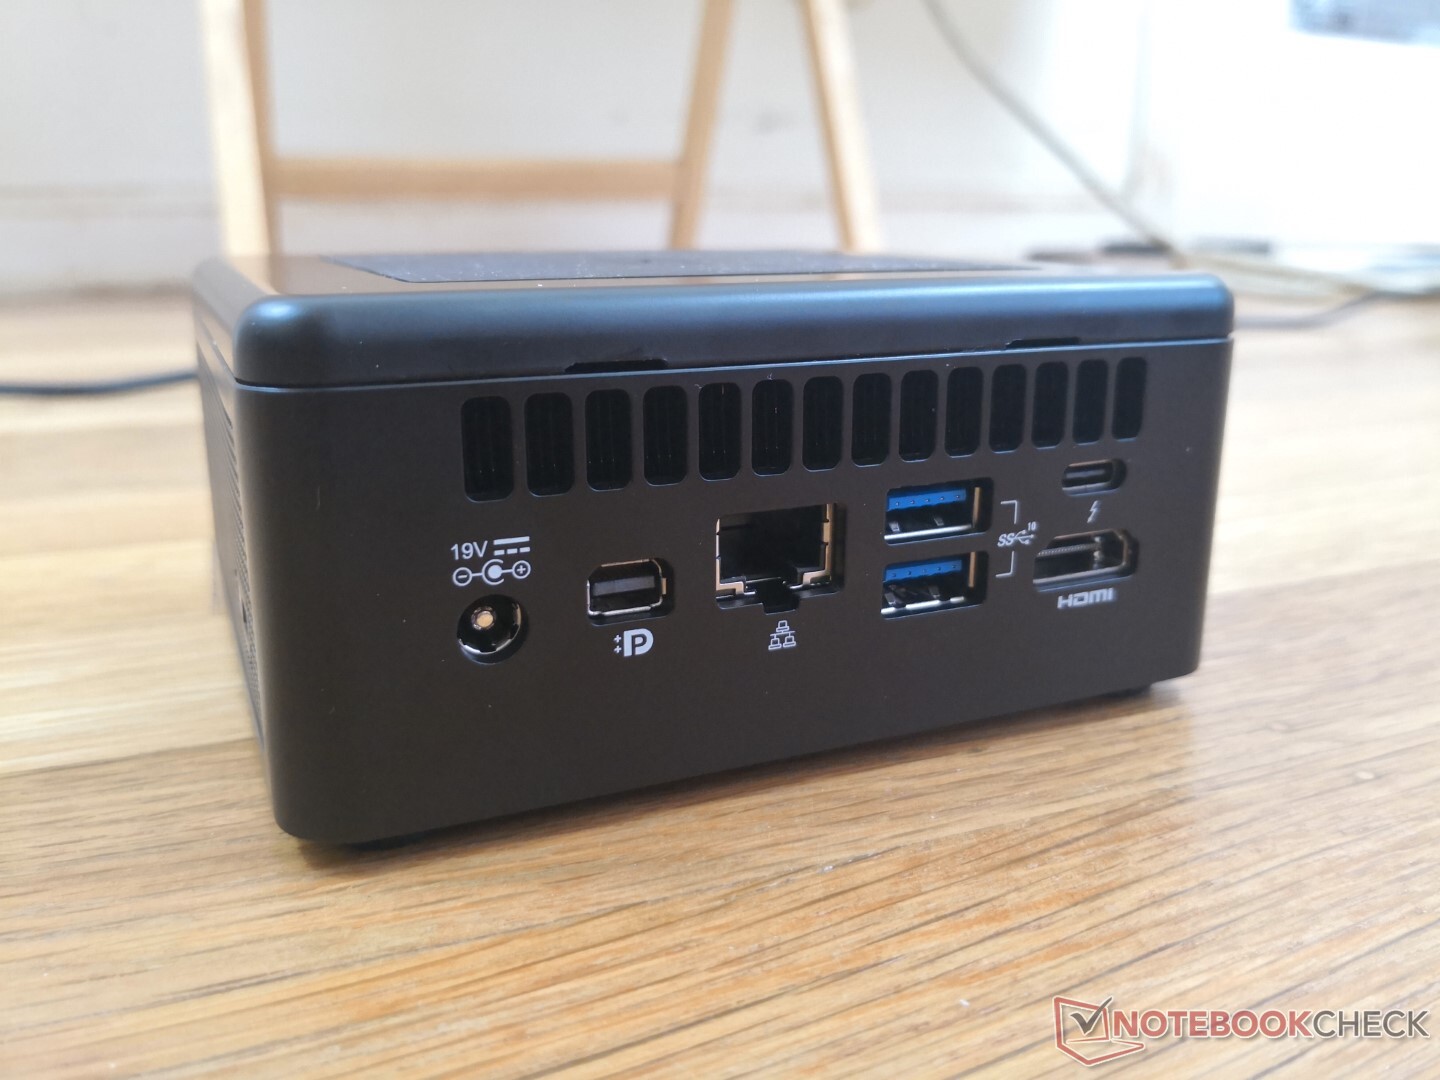
A NUC 11 inclui todos os portos encontrados na NUC 10, embora ligeiramente rearranjados. Uma nova adição é a mini DisplayPort 1.4 como quarta opção de saída de vídeo para o HDMI existente e 2x portas Thunderbolt 3.
Infelizmente, o adaptador AC proprietário ainda é necessário para alimentar o NUC, já que nenhuma das portas USB-C suporta power-in.
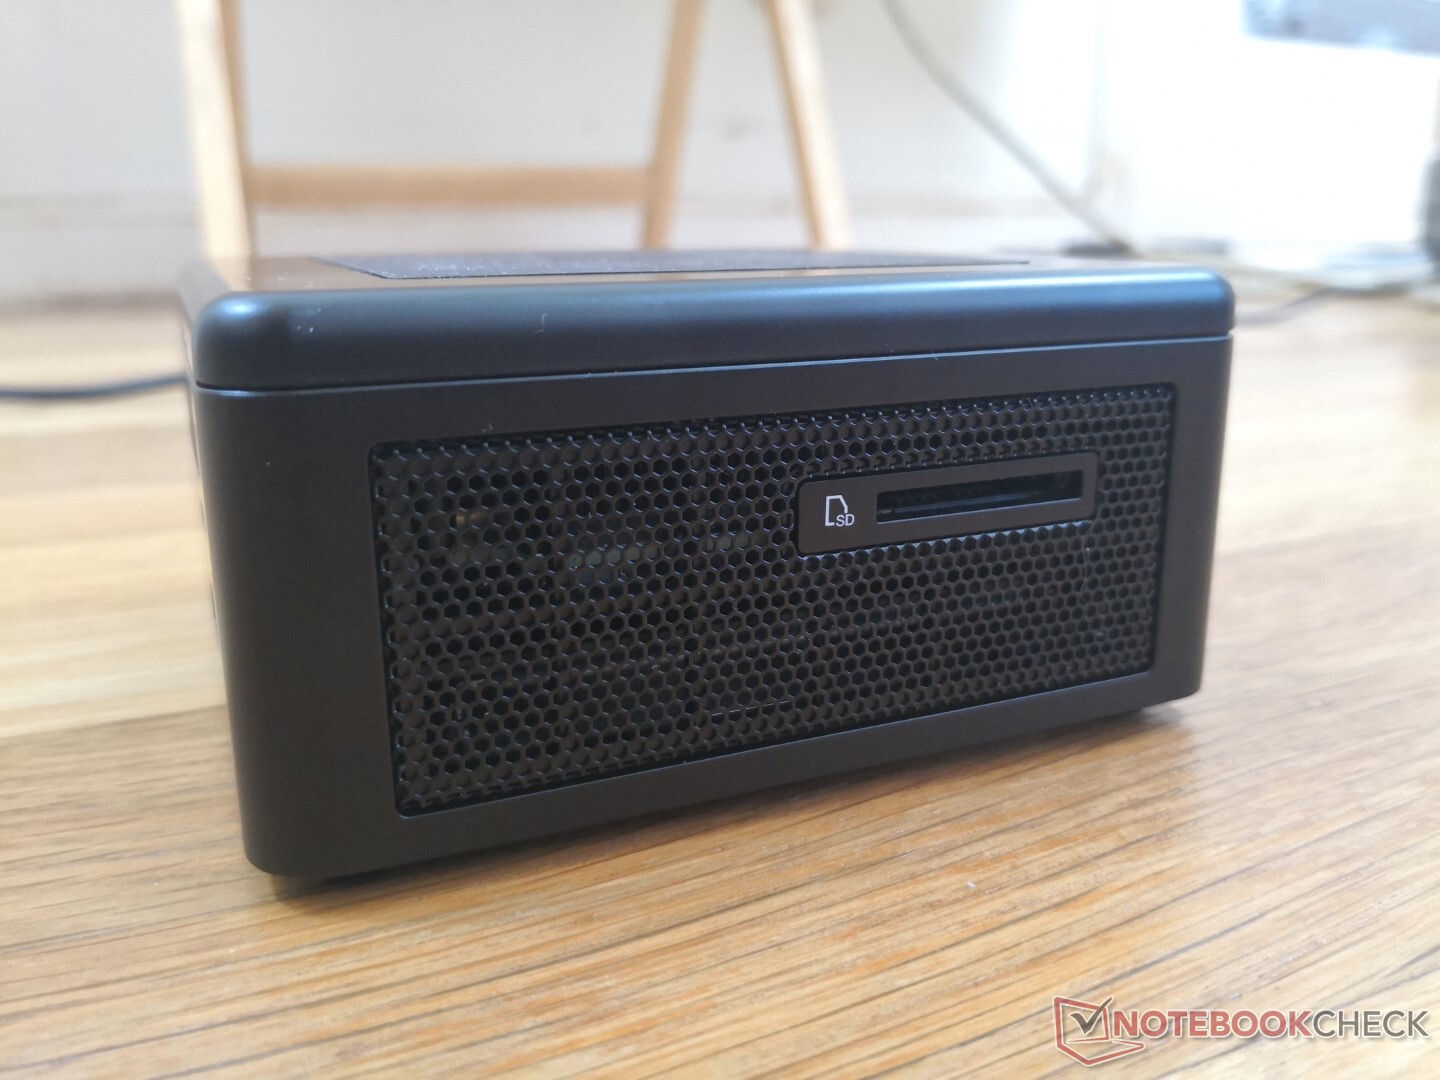
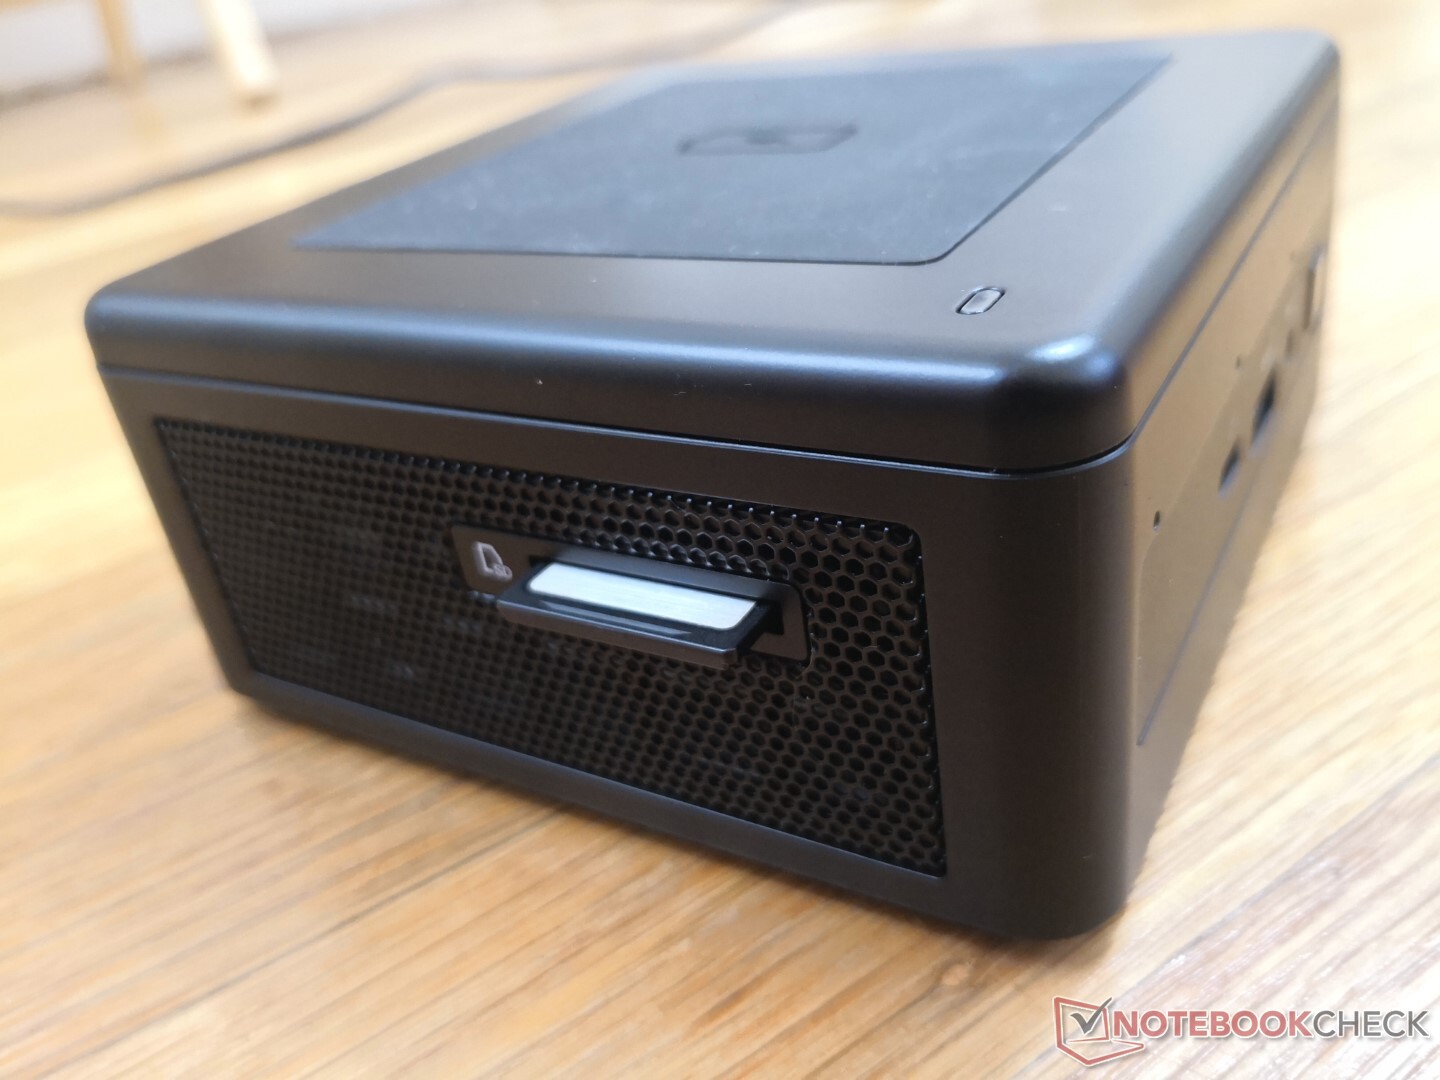
Leitor de cartões SD
As taxas de transferência do leitor de cartões integrado são mais de duas vezes mais rápidas do que no antigo Hades Canyon NUC. A movimentação de 1 GB de arquivos de nossa placa de teste UHS-II leva cerca de 5 a 6 segundos em comparação com os 12 segundos no Hades Canyon.
| SD Card Reader | |
| average JPG Copy Test (av. of 3 runs) | |
| Intel NUC11PAQi7 (Toshiba Exceria Pro SDXC 64 GB UHS-II) | |
| Intel Hades Canyon NUC8i7HVK (Toshiba Exceria Pro SDXC 64 GB UHS-II) | |
| Intel NUC8i7BE (Toshiba Exceria Pro M501 UHS-II) | |
| Zotac ZBox MI643 (Toshiba Exceria Pro M501 UHS-II) | |
| Beelink SEi10 (Toshiba Exceria Pro M501 UHS-II) | |
| maximum AS SSD Seq Read Test (1GB) | |
| Intel NUC11PAQi7 (Toshiba Exceria Pro SDXC 64 GB UHS-II) | |
| Intel Hades Canyon NUC8i7HVK (Toshiba Exceria Pro SDXC 64 GB UHS-II) | |
| Intel NUC8i7BE (Toshiba Exceria Pro M501 UHS-II) | |
| Zotac ZBox MI643 (Toshiba Exceria Pro M501 UHS-II) | |
| Beelink SEi10 (Toshiba Exceria Pro M501 UHS-II) | |
Comunicação
Wi-Fi 6 e Bluetooth 5.1 vêm de série através do Intel AX201. Embora não tenhamos tido nenhum problema de conectividade, as taxas de transferência bruta são mais lentas do que o esperado quando comparadas aos laptops com o mesmo módulo AX201 em cerca da metade. Suspeitamos que isto possa ser devido à antena mais fraca no NUC.
| Networking | |
| iperf3 transmit AX12 | |
| Beelink SEi10 | |
| Intel NUC8i7BE | |
| Intel NUC11PAQi7 | |
| Intel Hades Canyon NUC8i7HVK | |
| Zotac ZBox MI643 | |
| iperf3 receive AX12 | |
| Beelink SEi10 | |
| Intel NUC11PAQi7 | |
| Intel NUC8i7BE | |
| Intel Hades Canyon NUC8i7HVK | |
| Zotac ZBox MI643 | |
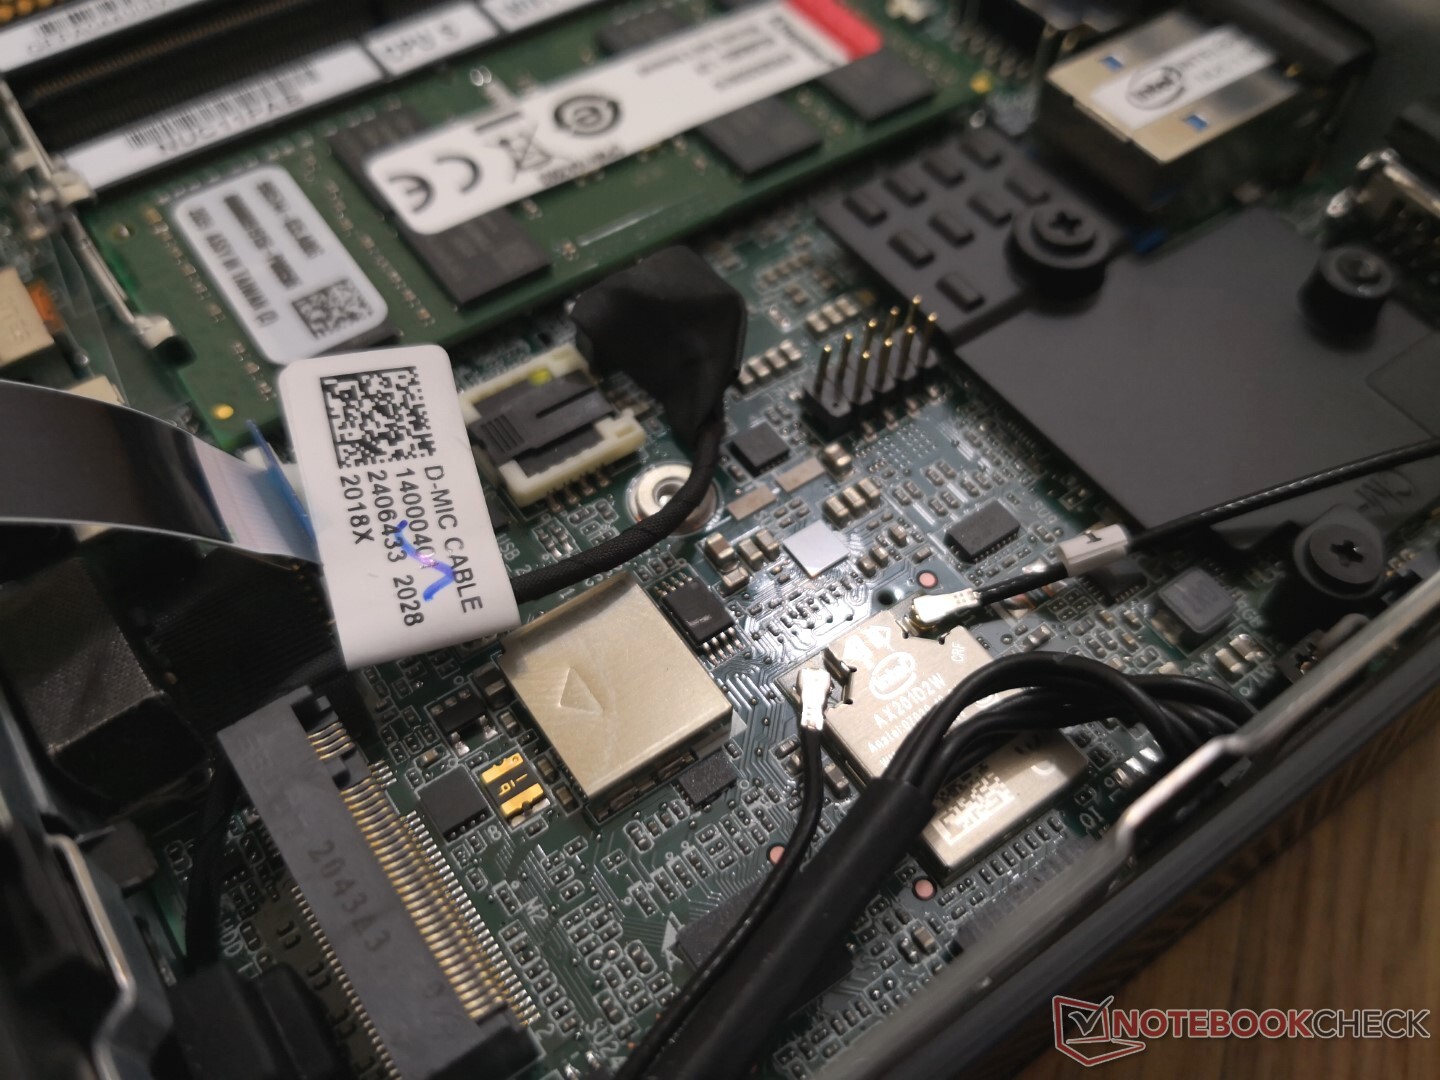
Manutenção
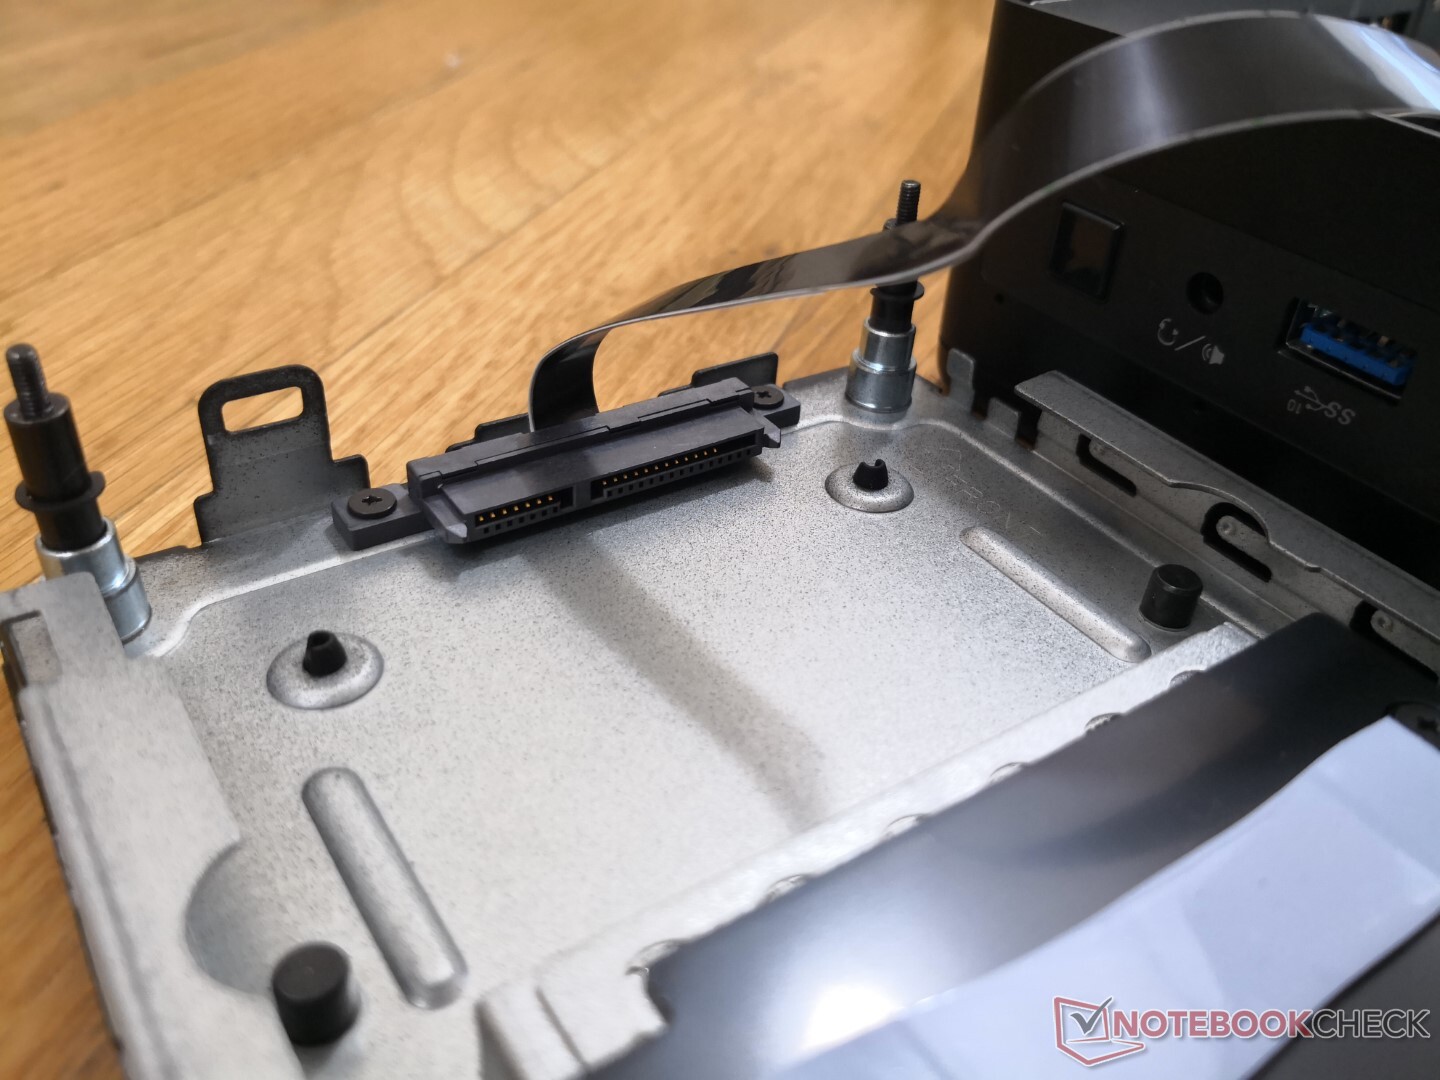
O painel inferior fornece acesso direto ao slot M.2 2280, slot SATA III de 2,5 polegadas, e ambos os slots SODIMM. É necessária uma desmontagem adicional para acessar o ventilador e a almofada de carga. A Intel tornou a fita SATA III de 2,5 polegadas mais longa desta vez para facilitar a manutenção.
Acessórios e Garantia
A caixa de varejo inclui quatro parafusos de montagem e os manuais habituais. Um suporte de montagem não está incluído.
A garantia limitada de três anos vem de série com todas as novas compras.
Desempenho
Processador
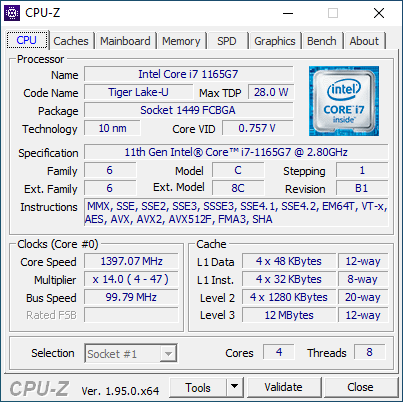
O desempenho da CPU é excelente com uma pontuação CineBench R15 xT bem acima da média do Core i7-1165G7 em nosso banco de dados em pelo menos 15%. Este delta se amplia ao comparar os resultados do CineBench R20 xT porque a Intel NUC é melhor em manter taxas de relógio mais altas por mais tempo do que a maioria dos laptops com a mesma CPU. Processadores AMD Zen 2 menos caros como o Ryzen 5 4500U ou o Ryzen 7 4700U são capazes de rivalizar com nossa Intel, embora com um desempenho mais lento de uma única linha.
A opção pelo menor Core i3-1115G4 ou Core i5-1135G7 NUC SKUs acarretará um déficit de desempenho multi-tarefa de 30% e 65%, respectivamente.
Cinebench R15: CPU Multi 64Bit | CPU Single 64Bit
Blender: v2.79 BMW27 CPU
7-Zip 18.03: 7z b 4 -mmt1 | 7z b 4
Geekbench 5.5: Single-Core | Multi-Core
HWBOT x265 Benchmark v2.2: 4k Preset
LibreOffice : 20 Documents To PDF
R Benchmark 2.5: Overall mean
| Cinebench R20 / CPU (Multi Core) | |
| Lenovo Yoga Slim 7-14ARE | |
| Lenovo Yoga Slim 7 14ARE05 82A20008GE | |
| Intel NUC11PAQi7 | |
| Honor MagicBook 15 4500U | |
| Intel NUC10i7FNH | |
| Intel Hades Canyon NUC8i7HVK | |
| Média Intel Core i7-1165G7 (1060 - 2657, n=81) | |
| Dell XPS 13 9310 Core i7 4K | |
| GPD Win 3 | |
| Intel NUC8i7BE | |
| Lenovo ThinkPad P14s Gen1 20S40009GE | |
| Lenovo IdeaPad Slim 9i 14ITL5 | |
| Beelink GTR35 II-G-16512D00W64PRO-1T | |
| Acer Swift 3 SF314-42-R27B | |
| Asus ZenBook 14 UX434FL-DB77 | |
| Zotac ZBox MI643 | |
| Microsoft Surface Laptop Go Core i5 | |
| Dell Inspiron 15 5000 5502 | |
| Beelink SEi10 | |
| Cinebench R20 / CPU (Single Core) | |
| Intel NUC11PAQi7 | |
| Dell XPS 13 9310 Core i7 4K | |
| Média Intel Core i7-1165G7 (442 - 589, n=81) | |
| GPD Win 3 | |
| Lenovo IdeaPad Slim 9i 14ITL5 | |
| Dell Inspiron 15 5000 5502 | |
| Intel NUC10i7FNH | |
| Lenovo Yoga Slim 7-14ARE | |
| Lenovo Yoga Slim 7 14ARE05 82A20008GE | |
| Intel NUC8i7BE | |
| Lenovo ThinkPad P14s Gen1 20S40009GE | |
| Asus ZenBook 14 UX434FL-DB77 | |
| Honor MagicBook 15 4500U | |
| Acer Swift 3 SF314-42-R27B | |
| Zotac ZBox MI643 | |
| Microsoft Surface Laptop Go Core i5 | |
| Intel Hades Canyon NUC8i7HVK | |
| Beelink SEi10 | |
| Beelink GTR35 II-G-16512D00W64PRO-1T | |
| Cinebench R15 / CPU Multi 64Bit | |
| Lenovo Yoga Slim 7-14ARE | |
| Lenovo Yoga Slim 7 14ARE05 82A20008GE | |
| Intel NUC10i7FNH | |
| Intel NUC11PAQi7 | |
| Honor MagicBook 15 4500U | |
| Dell XPS 13 9310 Core i7 4K | |
| Intel Hades Canyon NUC8i7HVK | |
| Média Intel Core i7-1165G7 (553 - 1027, n=86) | |
| Intel NUC8i7BE | |
| Lenovo IdeaPad Slim 9i 14ITL5 | |
| GPD Win 3 | |
| Lenovo ThinkPad P14s Gen1 20S40009GE | |
| Asus ZenBook 14 UX434FL-DB77 | |
| Beelink GTR35 II-G-16512D00W64PRO-1T | |
| Acer Swift 3 SF314-42-R27B | |
| Microsoft Surface Laptop Go Core i5 | |
| Zotac ZBox MI643 | |
| Beelink SEi10 | |
| Dell Inspiron 15 5000 5502 | |
| Cinebench R15 / CPU Single 64Bit | |
| Intel NUC11PAQi7 | |
| Dell XPS 13 9310 Core i7 4K | |
| Média Intel Core i7-1165G7 (115 - 230, n=78) | |
| Lenovo IdeaPad Slim 9i 14ITL5 | |
| GPD Win 3 | |
| Intel NUC10i7FNH | |
| Dell Inspiron 15 5000 5502 | |
| Intel NUC8i7BE | |
| Lenovo ThinkPad P14s Gen1 20S40009GE | |
| Lenovo Yoga Slim 7-14ARE | |
| Intel Hades Canyon NUC8i7HVK | |
| Asus ZenBook 14 UX434FL-DB77 | |
| Lenovo Yoga Slim 7 14ARE05 82A20008GE | |
| Zotac ZBox MI643 | |
| Honor MagicBook 15 4500U | |
| Acer Swift 3 SF314-42-R27B | |
| Microsoft Surface Laptop Go Core i5 | |
| Beelink SEi10 | |
| Beelink GTR35 II-G-16512D00W64PRO-1T | |
| Blender / v2.79 BMW27 CPU | |
| Dell Inspiron 15 5000 5502 | |
| Beelink SEi10 | |
| Microsoft Surface Laptop Go Core i5 | |
| Acer Swift 3 SF314-42-R27B | |
| Zotac ZBox MI643 | |
| Asus ZenBook 14 UX434FL-DB77 | |
| Intel NUC8i7BE | |
| Intel NUC8i7BE | |
| Beelink GTR35 II-G-16512D00W64PRO-1T | |
| Dell XPS 13 9310 Core i7 4K | |
| Lenovo ThinkPad P14s Gen1 20S40009GE | |
| GPD Win 3 | |
| Média Intel Core i7-1165G7 (468 - 1138, n=80) | |
| Lenovo IdeaPad Slim 9i 14ITL5 | |
| Honor MagicBook 15 4500U | |
| Intel Hades Canyon NUC8i7HVK | |
| Lenovo Yoga Slim 7 14ARE05 82A20008GE | |
| Intel NUC10i7FNH | |
| Intel NUC11PAQi7 | |
| Lenovo Yoga Slim 7-14ARE | |
| 7-Zip 18.03 / 7z b 4 -mmt1 | |
| Intel NUC8i7BE | |
| Intel NUC8i7BE | |
| Intel NUC11PAQi7 | |
| Lenovo IdeaPad Slim 9i 14ITL5 | |
| Média Intel Core i7-1165G7 (4478 - 5507, n=80) | |
| Dell XPS 13 9310 Core i7 4K | |
| Lenovo ThinkPad P14s Gen1 20S40009GE | |
| GPD Win 3 | |
| Intel NUC10i7FNH | |
| Dell Inspiron 15 5000 5502 | |
| Zotac ZBox MI643 | |
| Lenovo Yoga Slim 7-14ARE | |
| Lenovo Yoga Slim 7 14ARE05 82A20008GE | |
| Honor MagicBook 15 4500U | |
| Intel Hades Canyon NUC8i7HVK | |
| Beelink SEi10 | |
| Acer Swift 3 SF314-42-R27B | |
| Microsoft Surface Laptop Go Core i5 | |
| Asus ZenBook 14 UX434FL-DB77 | |
| Beelink GTR35 II-G-16512D00W64PRO-1T | |
| 7-Zip 18.03 / 7z b 4 | |
| Lenovo Yoga Slim 7-14ARE | |
| Lenovo Yoga Slim 7 14ARE05 82A20008GE | |
| Intel NUC8i7BE | |
| Intel NUC8i7BE | |
| Intel NUC10i7FNH | |
| Intel NUC11PAQi7 | |
| Honor MagicBook 15 4500U | |
| Lenovo IdeaPad Slim 9i 14ITL5 | |
| Média Intel Core i7-1165G7 (15347 - 27405, n=80) | |
| GPD Win 3 | |
| Dell XPS 13 9310 Core i7 4K | |
| Intel Hades Canyon NUC8i7HVK | |
| Lenovo ThinkPad P14s Gen1 20S40009GE | |
| Zotac ZBox MI643 | |
| Asus ZenBook 14 UX434FL-DB77 | |
| Beelink GTR35 II-G-16512D00W64PRO-1T | |
| Acer Swift 3 SF314-42-R27B | |
| Microsoft Surface Laptop Go Core i5 | |
| Dell Inspiron 15 5000 5502 | |
| Beelink SEi10 | |
| Geekbench 5.5 / Single-Core | |
| Lenovo IdeaPad Slim 9i 14ITL5 | |
| Intel NUC11PAQi7 | |
| Dell XPS 13 9310 Core i7 4K | |
| Média Intel Core i7-1165G7 (1302 - 1595, n=77) | |
| GPD Win 3 | |
| Dell Inspiron 15 5000 5502 | |
| Intel NUC10i7FNH | |
| Lenovo ThinkPad P14s Gen1 20S40009GE | |
| Honor MagicBook 15 4500U | |
| Asus ZenBook 14 UX434FL-DB77 | |
| Lenovo Yoga Slim 7-14ARE | |
| Lenovo Yoga Slim 7-14ARE | |
| Microsoft Surface Laptop Go Core i5 | |
| Zotac ZBox MI643 | |
| Lenovo Yoga Slim 7 14ARE05 82A20008GE | |
| Beelink SEi10 | |
| Acer Swift 3 SF314-42-R27B | |
| Beelink GTR35 II-G-16512D00W64PRO-1T | |
| Intel NUC8i7BE | |
| Geekbench 5.5 / Multi-Core | |
| Lenovo Yoga Slim 7-14ARE | |
| Lenovo Yoga Slim 7-14ARE | |
| Lenovo Yoga Slim 7 14ARE05 82A20008GE | |
| Honor MagicBook 15 4500U | |
| Intel NUC10i7FNH | |
| Dell XPS 13 9310 Core i7 4K | |
| Lenovo IdeaPad Slim 9i 14ITL5 | |
| Média Intel Core i7-1165G7 (3078 - 5926, n=77) | |
| Intel NUC11PAQi7 | |
| GPD Win 3 | |
| Zotac ZBox MI643 | |
| Lenovo ThinkPad P14s Gen1 20S40009GE | |
| Intel NUC8i7BE | |
| Microsoft Surface Laptop Go Core i5 | |
| Acer Swift 3 SF314-42-R27B | |
| Beelink GTR35 II-G-16512D00W64PRO-1T | |
| Asus ZenBook 14 UX434FL-DB77 | |
| Dell Inspiron 15 5000 5502 | |
| Beelink SEi10 | |
| HWBOT x265 Benchmark v2.2 / 4k Preset | |
| Lenovo Yoga Slim 7-14ARE | |
| Lenovo Yoga Slim 7 14ARE05 82A20008GE | |
| Intel NUC11PAQi7 | |
| Intel NUC10i7FNH | |
| Honor MagicBook 15 4500U | |
| Intel Hades Canyon NUC8i7HVK | |
| Lenovo IdeaPad Slim 9i 14ITL5 | |
| Média Intel Core i7-1165G7 (1.39 - 8.47, n=80) | |
| GPD Win 3 | |
| Intel NUC8i7BE | |
| Intel NUC8i7BE | |
| Dell XPS 13 9310 Core i7 4K | |
| Lenovo ThinkPad P14s Gen1 20S40009GE | |
| Asus ZenBook 14 UX434FL-DB77 | |
| Acer Swift 3 SF314-42-R27B | |
| Zotac ZBox MI643 | |
| Beelink GTR35 II-G-16512D00W64PRO-1T | |
| Microsoft Surface Laptop Go Core i5 | |
| Beelink SEi10 | |
| Dell Inspiron 15 5000 5502 | |
| LibreOffice / 20 Documents To PDF | |
| Beelink GTR35 II-G-16512D00W64PRO-1T | |
| Asus ZenBook 14 UX434FL-DB77 | |
| Lenovo Yoga Slim 7 14ARE05 82A20008GE | |
| Honor MagicBook 15 4500U | |
| Microsoft Surface Laptop Go Core i5 | |
| Dell Inspiron 15 5000 5502 | |
| Acer Swift 3 SF314-42-R27B | |
| Lenovo Yoga Slim 7-14ARE | |
| Zotac ZBox MI643 | |
| Lenovo ThinkPad P14s Gen1 20S40009GE | |
| Beelink SEi10 | |
| Lenovo IdeaPad Slim 9i 14ITL5 | |
| Média Intel Core i7-1165G7 (21.5 - 88.1, n=78) | |
| GPD Win 3 | |
| Dell XPS 13 9310 Core i7 4K | |
| Intel NUC11PAQi7 | |
| R Benchmark 2.5 / Overall mean | |
| Asus ZenBook 14 UX434FL-DB77 | |
| Beelink SEi10 | |
| Microsoft Surface Laptop Go Core i5 | |
| Beelink GTR35 II-G-16512D00W64PRO-1T | |
| Acer Swift 3 SF314-42-R27B | |
| Lenovo ThinkPad P14s Gen1 20S40009GE | |
| Zotac ZBox MI643 | |
| Dell Inspiron 15 5000 5502 | |
| Intel NUC10i7FNH | |
| GPD Win 3 | |
| Intel NUC8i7BE | |
| Honor MagicBook 15 4500U | |
| Lenovo Yoga Slim 7 14ARE05 82A20008GE | |
| Lenovo Yoga Slim 7-14ARE | |
| Dell XPS 13 9310 Core i7 4K | |
| Média Intel Core i7-1165G7 (0.552 - 1.002, n=80) | |
| Lenovo IdeaPad Slim 9i 14ITL5 | |
| Intel NUC11PAQi7 | |
Cinebench R15: CPU Multi 64Bit | CPU Single 64Bit
Blender: v2.79 BMW27 CPU
7-Zip 18.03: 7z b 4 -mmt1 | 7z b 4
Geekbench 5.5: Single-Core | Multi-Core
HWBOT x265 Benchmark v2.2: 4k Preset
LibreOffice : 20 Documents To PDF
R Benchmark 2.5: Overall mean
* ... menor é melhor
Desempenho do sistema
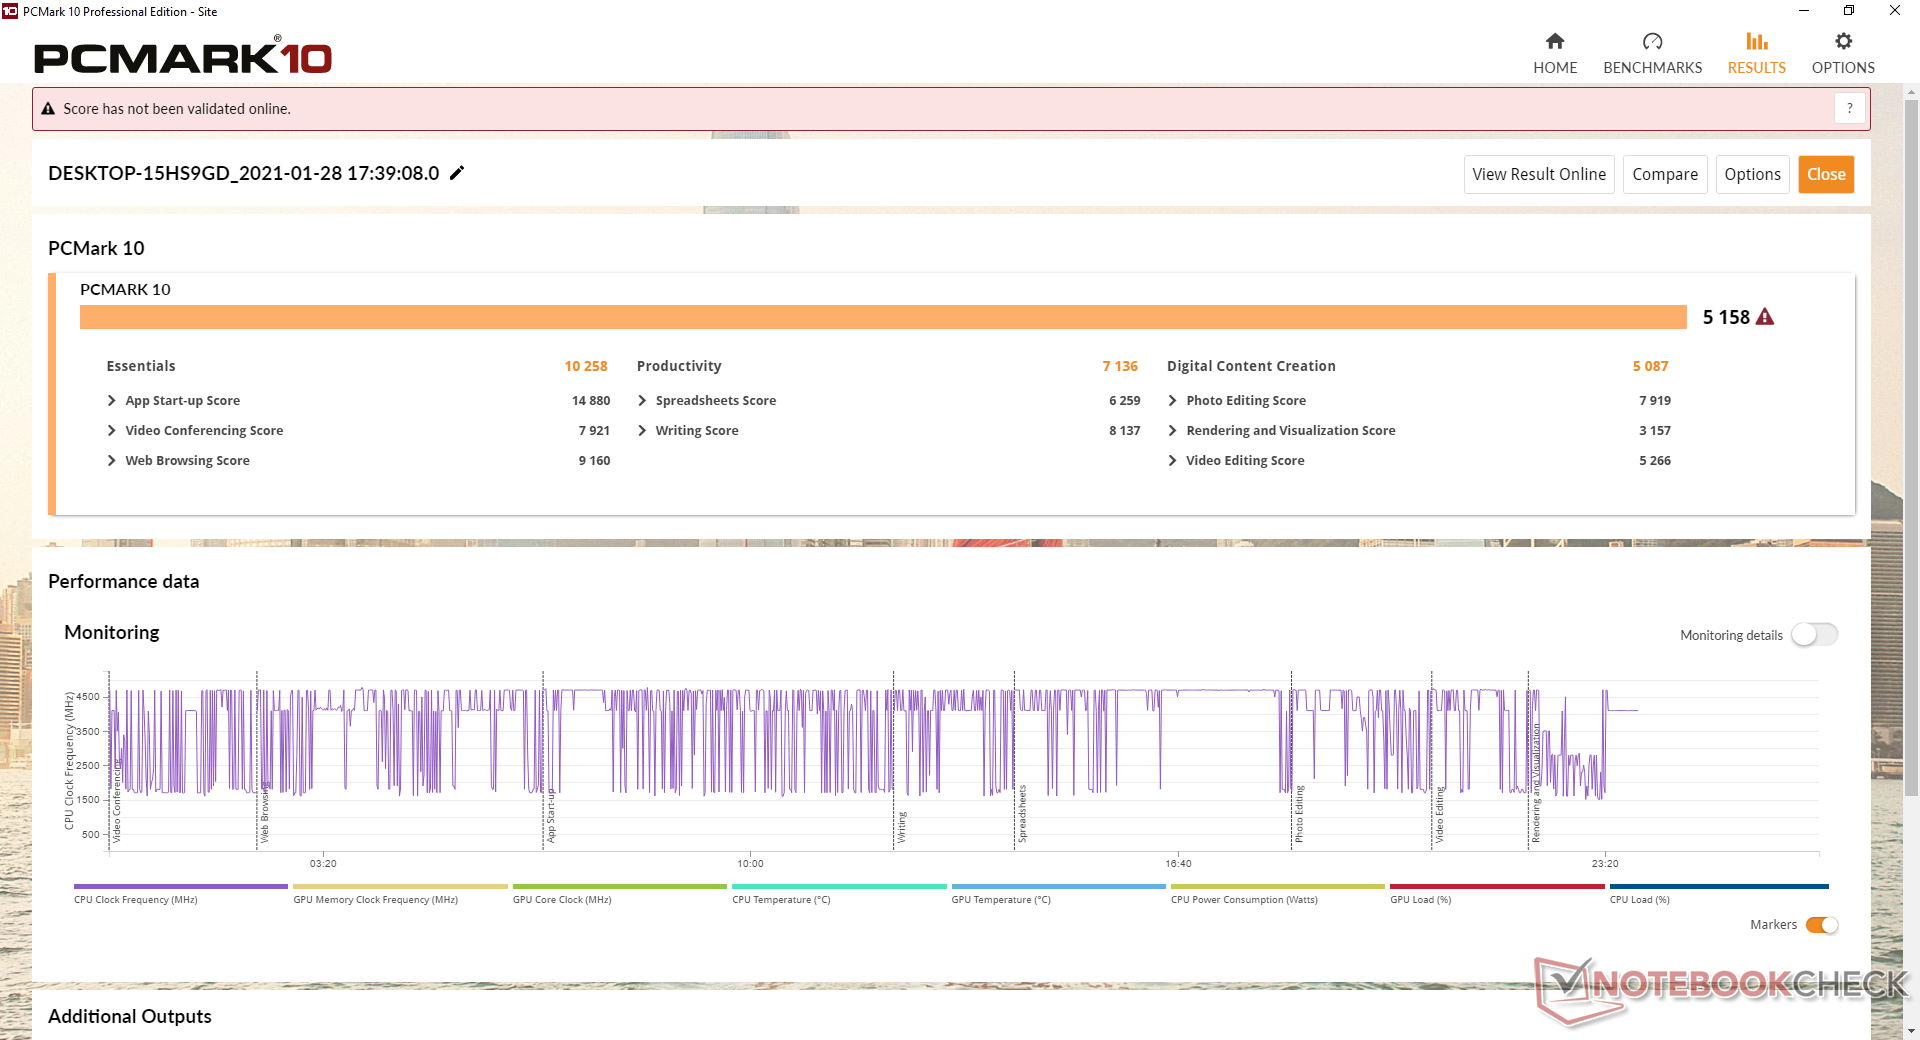
| PCMark 10 | |
| Score | |
| Intel Hades Canyon NUC8i7HVK | |
| Intel NUC11PAQi7 | |
| Média Intel Core i7-1165G7, Intel Iris Xe Graphics G7 96EUs (4531 - 5454, n=50) | |
| Intel NUC8i7BE | |
| Intel NUC10i7FNH | |
| Beelink GTR35 II-G-16512D00W64PRO-1T | |
| Zotac ZBox MI643 | |
| Beelink SEi10 | |
| Essentials | |
| Intel NUC11PAQi7 | |
| Média Intel Core i7-1165G7, Intel Iris Xe Graphics G7 96EUs (8997 - 11505, n=50) | |
| Zotac ZBox MI643 | |
| Intel Hades Canyon NUC8i7HVK | |
| Intel NUC10i7FNH | |
| Intel NUC8i7BE | |
| Beelink GTR35 II-G-16512D00W64PRO-1T | |
| Beelink SEi10 | |
| Productivity | |
| Intel Hades Canyon NUC8i7HVK | |
| Intel NUC8i7BE | |
| Intel NUC11PAQi7 | |
| Zotac ZBox MI643 | |
| Intel NUC10i7FNH | |
| Média Intel Core i7-1165G7, Intel Iris Xe Graphics G7 96EUs (5570 - 7136, n=50) | |
| Beelink GTR35 II-G-16512D00W64PRO-1T | |
| Beelink SEi10 | |
| Digital Content Creation | |
| Intel Hades Canyon NUC8i7HVK | |
| Intel NUC11PAQi7 | |
| Média Intel Core i7-1165G7, Intel Iris Xe Graphics G7 96EUs (4083 - 5550, n=50) | |
| Intel NUC8i7BE | |
| Beelink GTR35 II-G-16512D00W64PRO-1T | |
| Intel NUC10i7FNH | |
| Zotac ZBox MI643 | |
| Beelink SEi10 | |
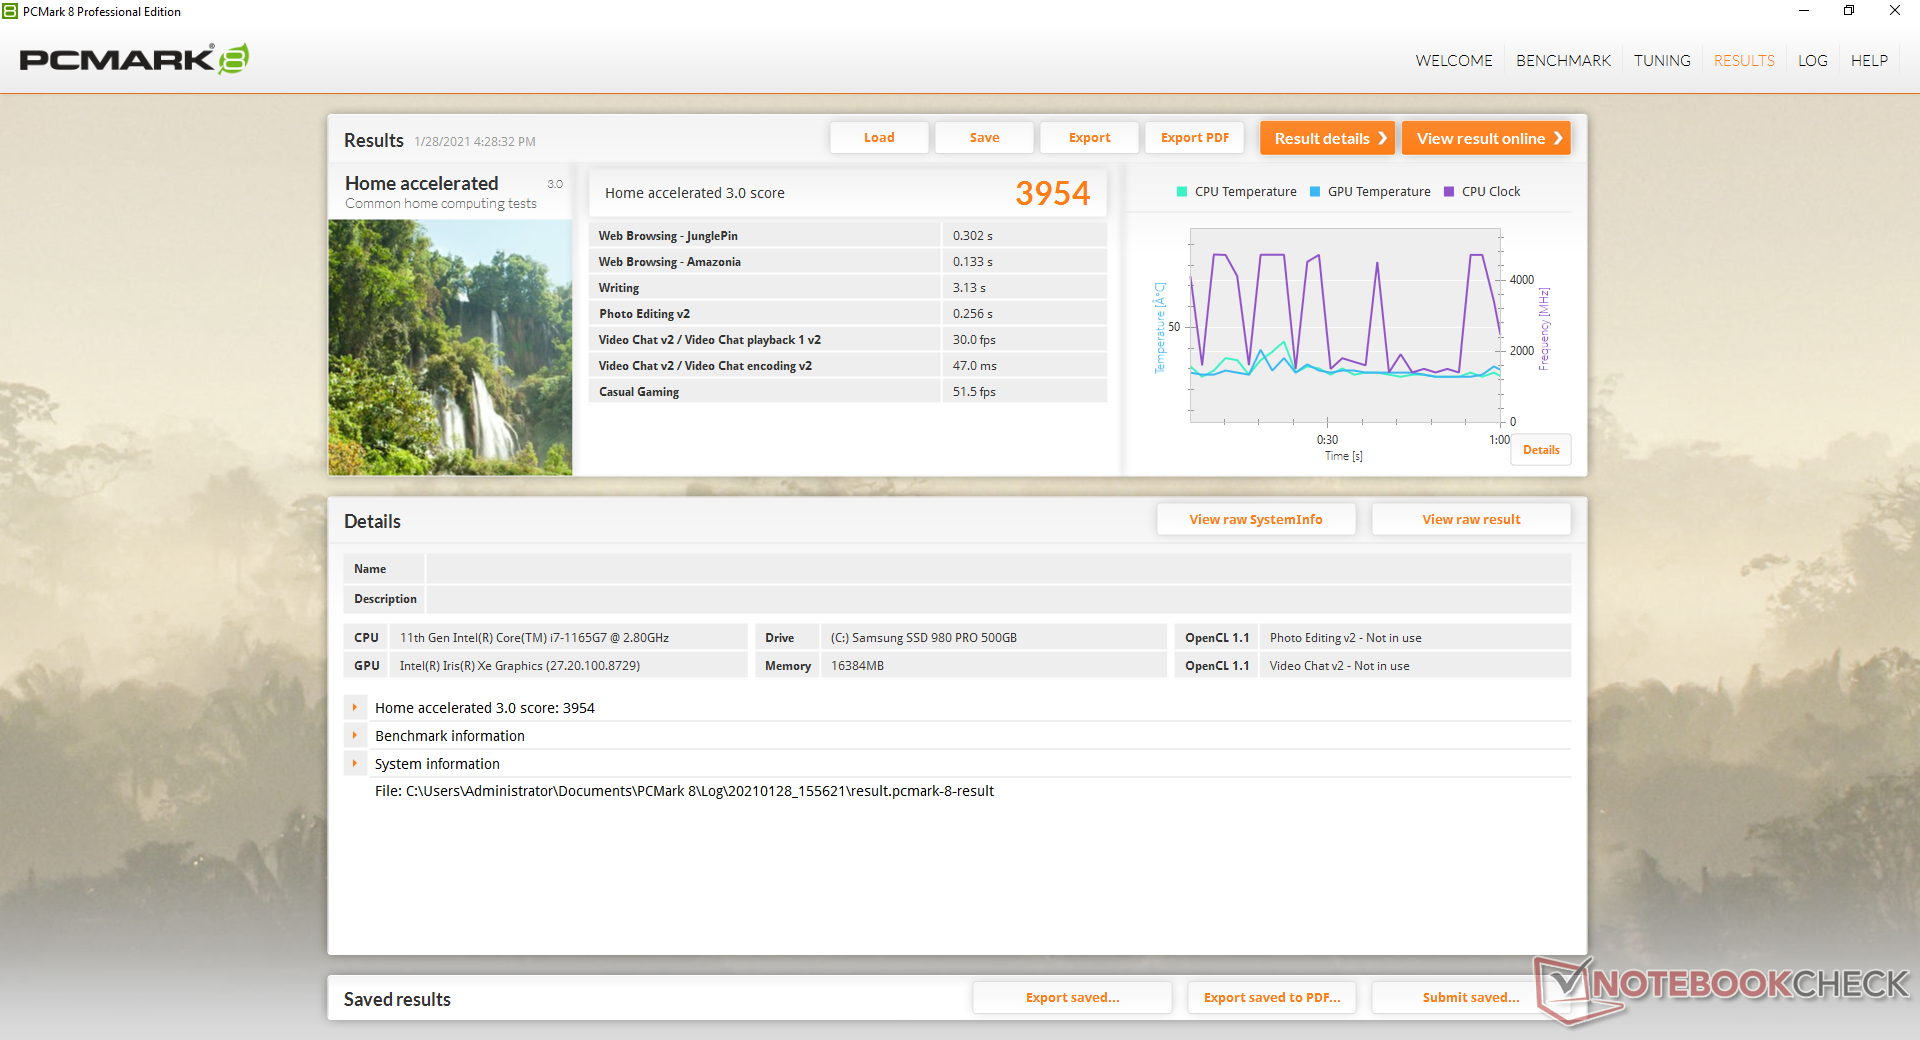
| PCMark 8 | |
| Home Score Accelerated v2 | |
| Intel Hades Canyon NUC8i7HVK | |
| Intel NUC8i7BE | |
| Média Intel Core i7-1165G7, Intel Iris Xe Graphics G7 96EUs (3769 - 5686, n=17) | |
| Intel NUC11PAQi7 | |
| Intel NUC10i7FNH | |
| Beelink GTR35 II-G-16512D00W64PRO-1T | |
| Zotac ZBox MI643 | |
| Beelink SEi10 | |
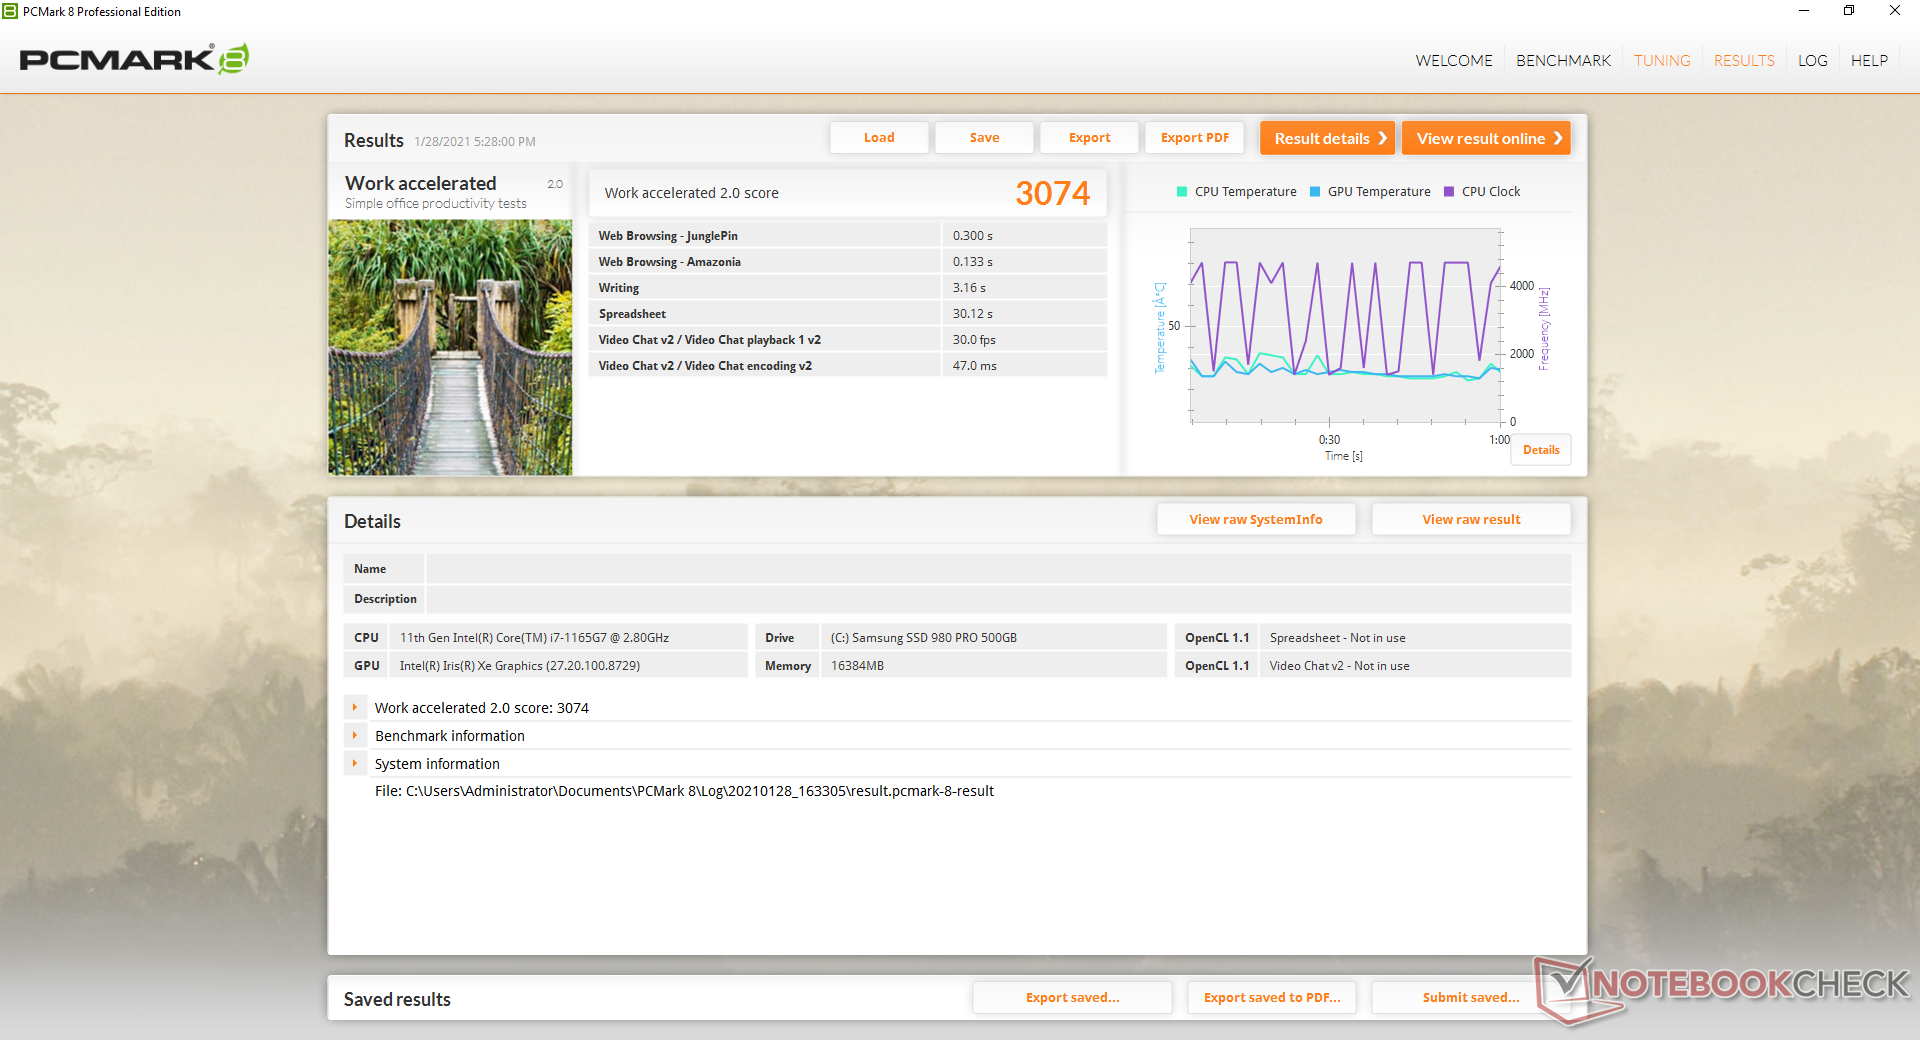
| Work Score Accelerated v2 | |
| Intel Hades Canyon NUC8i7HVK | |
| Beelink GTR35 II-G-16512D00W64PRO-1T | |
| Zotac ZBox MI643 | |
| Intel NUC10i7FNH | |
| Intel NUC11PAQi7 | |
| Média Intel Core i7-1165G7, Intel Iris Xe Graphics G7 96EUs (2431 - 3221, n=15) | |
| Beelink SEi10 | |
| PCMark 8 Home Score Accelerated v2 | 3954 pontos | |
| PCMark 8 Work Score Accelerated v2 | 3074 pontos | |
| PCMark 10 Score | 5158 pontos | |
Ajuda | ||
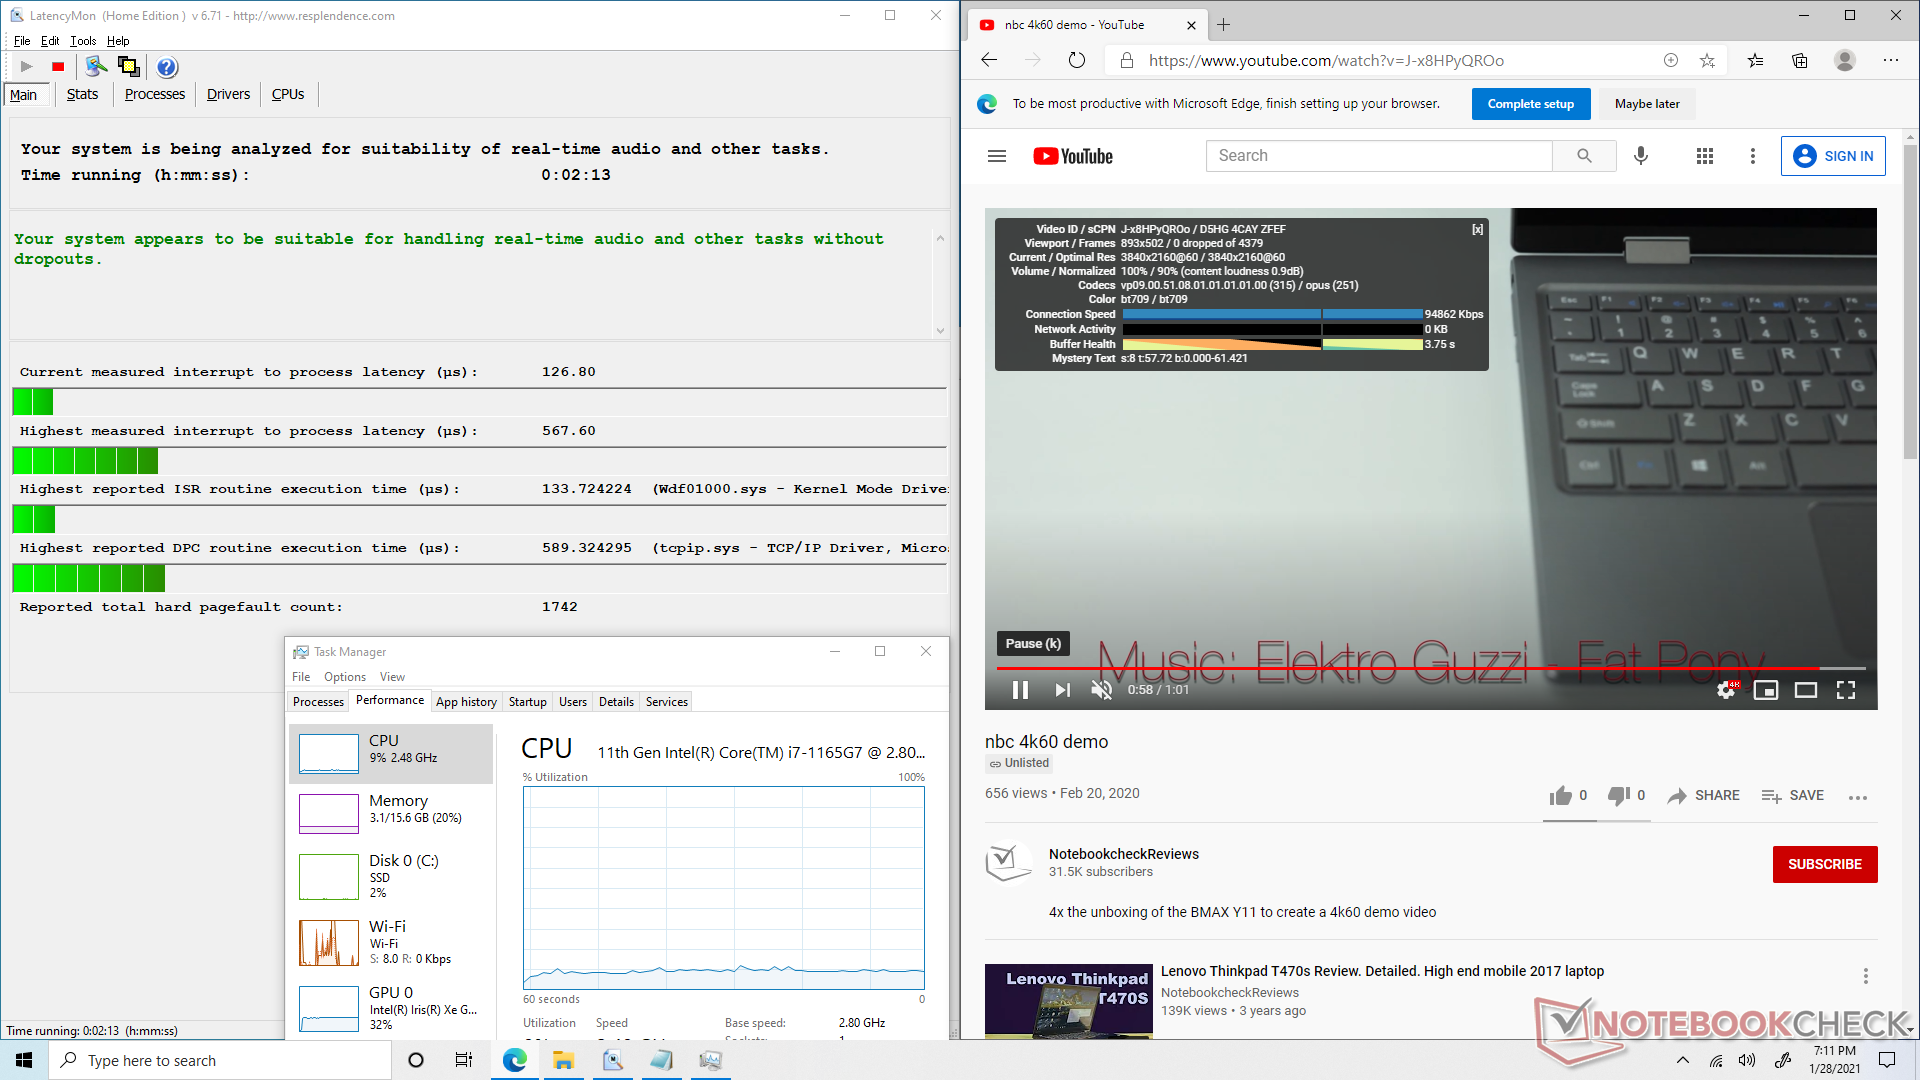
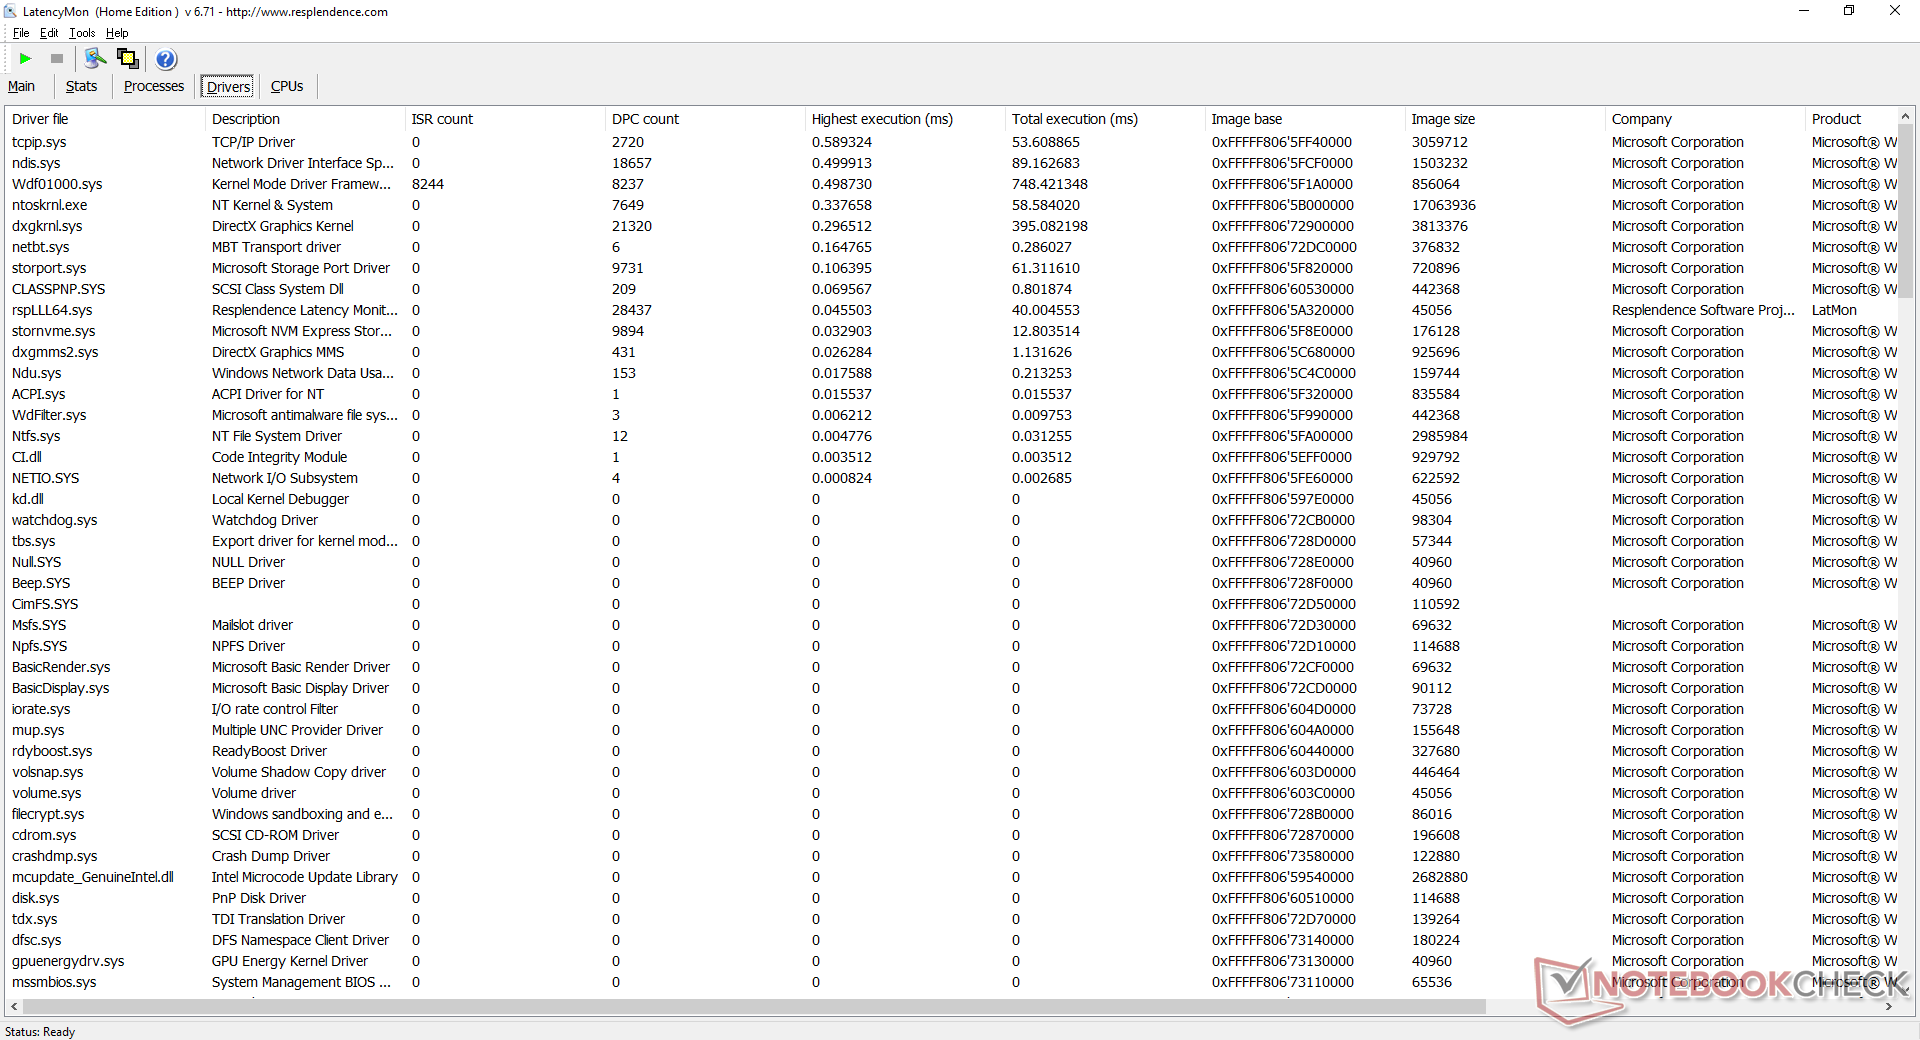
Latência do DPC
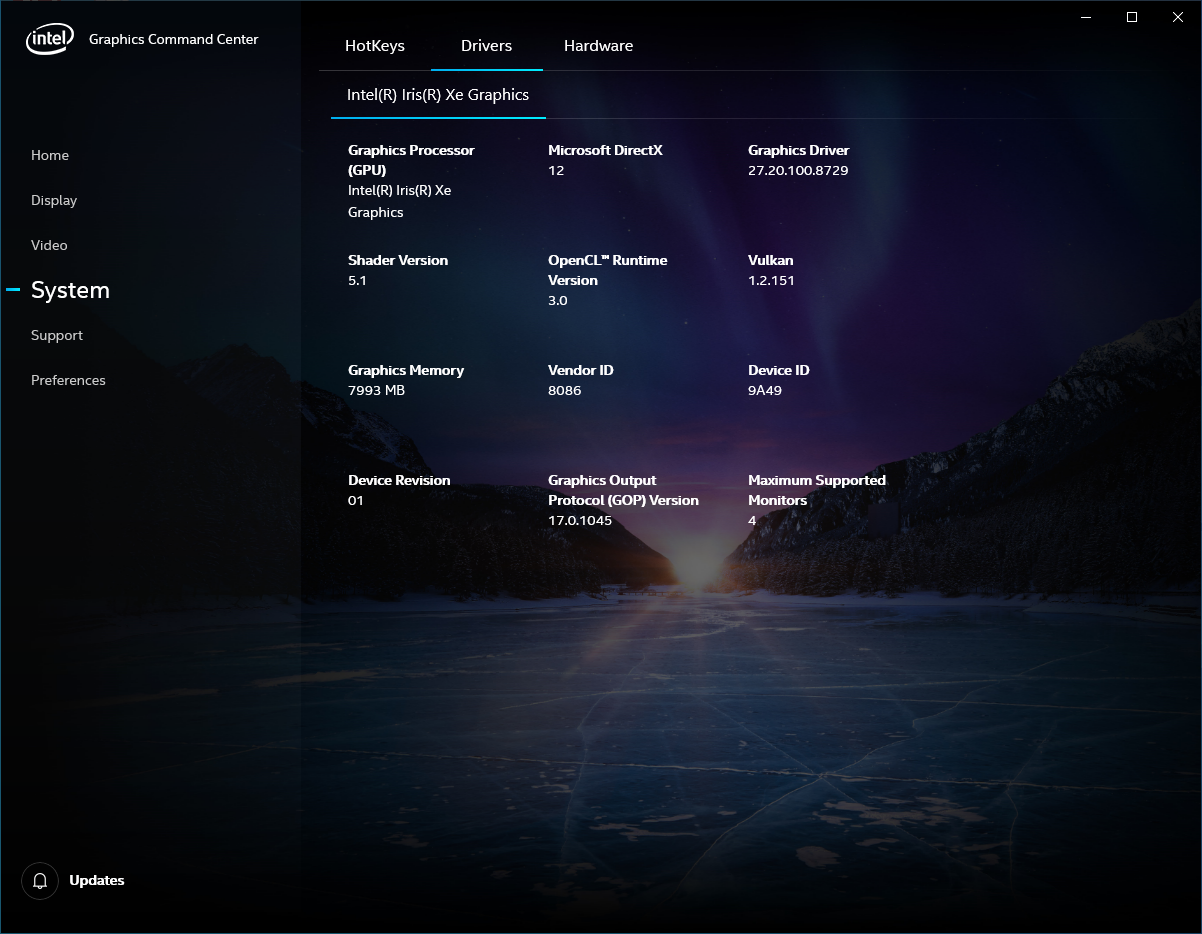
LatencyMon não apresenta problemas de latência DPC. A reprodução do vídeo 4K a 60 FPS também é suave e sem queda de quadros. A GPU Iris Xe é estável em 32% de utilização em comparação com ~50% na antiga Iris Plus G7.
| DPC Latencies / LatencyMon - interrupt to process latency (max), Web, Youtube, Prime95 | |
| Beelink SEi10 | |
| Zotac ZBox MI643 | |
| Intel NUC11PAQi7 | |
* ... menor é melhor
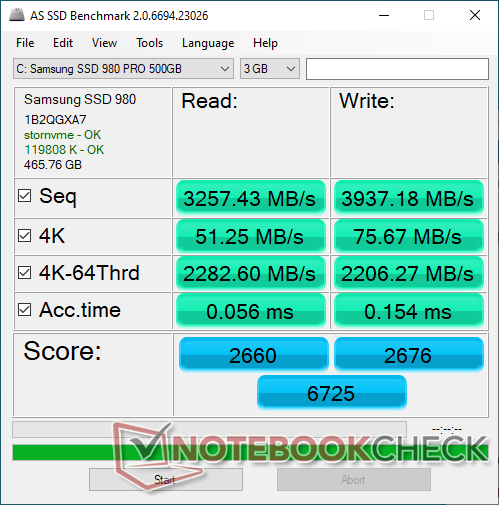
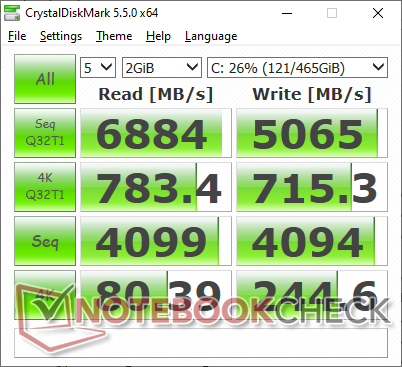
Dispositivos de armazenamento
Nossa unidade vem com um Samsung SSD 980 Pro de 500 GB para taxas teóricas de leitura e escrita de até 6900 MB/s e 5000 MB/s, respectivamente. Podemos confirmar estes números anunciados ao executar o DiskSpd em um loop, como mostra o gráfico abaixo. Note que o acolchoamento térmico e um espalhador de calor fino estão incluídos.
| Intel NUC11PAQi7 Samsung SSD 980 Pro 500GB MZ-V8P500BW | Intel NUC10i7FNH Kingston RBUSNS8154P3256GJ1 | Intel Hades Canyon NUC8i7HVK Intel Optane 120 GB SSDPEK1W120GA | Beelink SEi10 Silicon Motion AZW 256G M.2280 NVMe 4X 200725 D | Zotac ZBox MI643 Lexar NM610 1TB | |
|---|---|---|---|---|---|
| AS SSD | -58% | -20% | -83% | -40% | |
| Seq Read (MB/s) | 3257 | 1306 -60% | 1379 -58% | 1111 -66% | 1511 -54% |
| Seq Write (MB/s) | 3937 | 611 -84% | 553 -86% | 323.5 -92% | 1558 -60% |
| 4K Read (MB/s) | 51.3 | 21.53 -58% | 127.9 149% | 33.1 -35% | 43.77 -15% |
| 4K Write (MB/s) | 75.7 | 53.5 -29% | 103.5 37% | 66.2 -13% | 119.5 58% |
| 4K-64 Read (MB/s) | 2283 | 652 -71% | 1258 -45% | 357.3 -84% | 839 -63% |
| 4K-64 Write (MB/s) | 2206 | 648 -71% | 556 -75% | 154.8 -93% | 909 -59% |
| Access Time Read * (ms) | 0.056 | 0.114 -104% | 0.025 55% | 0.066 -18% | 0.032 43% |
| Access Time Write * (ms) | 0.154 | 0.07 55% | 0.033 79% | 0.616 -300% | 0.242 -57% |
| Score Read (Points) | 2660 | 804 -70% | 1524 -43% | 501 -81% | 1034 -61% |
| Score Write (Points) | 2676 | 762 -72% | 714 -73% | 253 -91% | 1185 -56% |
| Score Total (Points) | 6725 | 1944 -71% | 3023 -55% | 983 -85% | 2760 -59% |
| Copy ISO MB/s (MB/s) | 2030 | 976 -52% | 1125 -45% | 1160 -43% | 1373 -32% |
| Copy Program MB/s (MB/s) | 883 | 346 -61% | 342.4 -61% | 121.1 -86% | 280.4 -68% |
| Copy Game MB/s (MB/s) | 1817 | 735 -60% | 768 -58% | 364.4 -80% | 531 -71% |
| CrystalDiskMark 5.2 / 6 | 6% | -45% | -51% | -48% | |
| Write 4K (MB/s) | 244.6 | 442.4 81% | 133.7 -45% | 203 -17% | 214.1 -12% |
| Read 4K (MB/s) | 80.4 | 371.1 362% | 178.6 122% | 63.2 -21% | 62.1 -23% |
| Write Seq (MB/s) | 4094 | 900 -78% | 608 -85% | 1114 -73% | 1664 -59% |
| Read Seq (MB/s) | 4099 | 1582 -61% | 1428 -65% | 1765 -57% | 1797 -56% |
| Write 4K Q32T1 (MB/s) | 715 | 373.8 -48% | 323.6 -55% | 423.9 -41% | 421.8 -41% |
| Read 4K Q32T1 (MB/s) | 783 | 374.9 -52% | 282.3 -64% | 389.2 -50% | 512 -35% |
| Write Seq Q32T1 (MB/s) | 5065 | 893 -82% | 627 -88% | 1104 -78% | 564 -89% |
| Read Seq Q32T1 (MB/s) | 6884 | 1582 -77% | 1521 -78% | 1990 -71% | 2073 -70% |
| Write 4K Q8T8 (MB/s) | 399.1 | ||||
| Read 4K Q8T8 (MB/s) | 688 | ||||
| Média Total (Programa/Configurações) | -26% /
-35% | -33% /
-29% | -67% /
-72% | -44% /
-43% |
* ... menor é melhor

Disk Throttling: DiskSpd Read Loop, Queue Depth 8
Desempenho da GPU
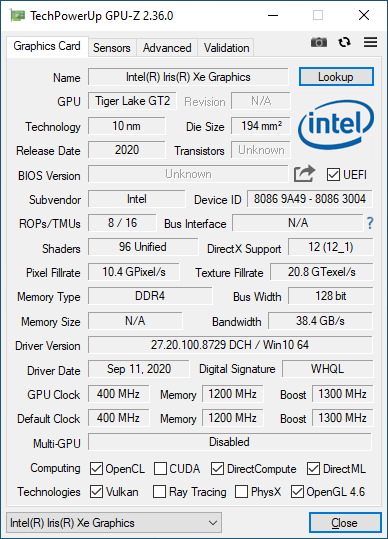
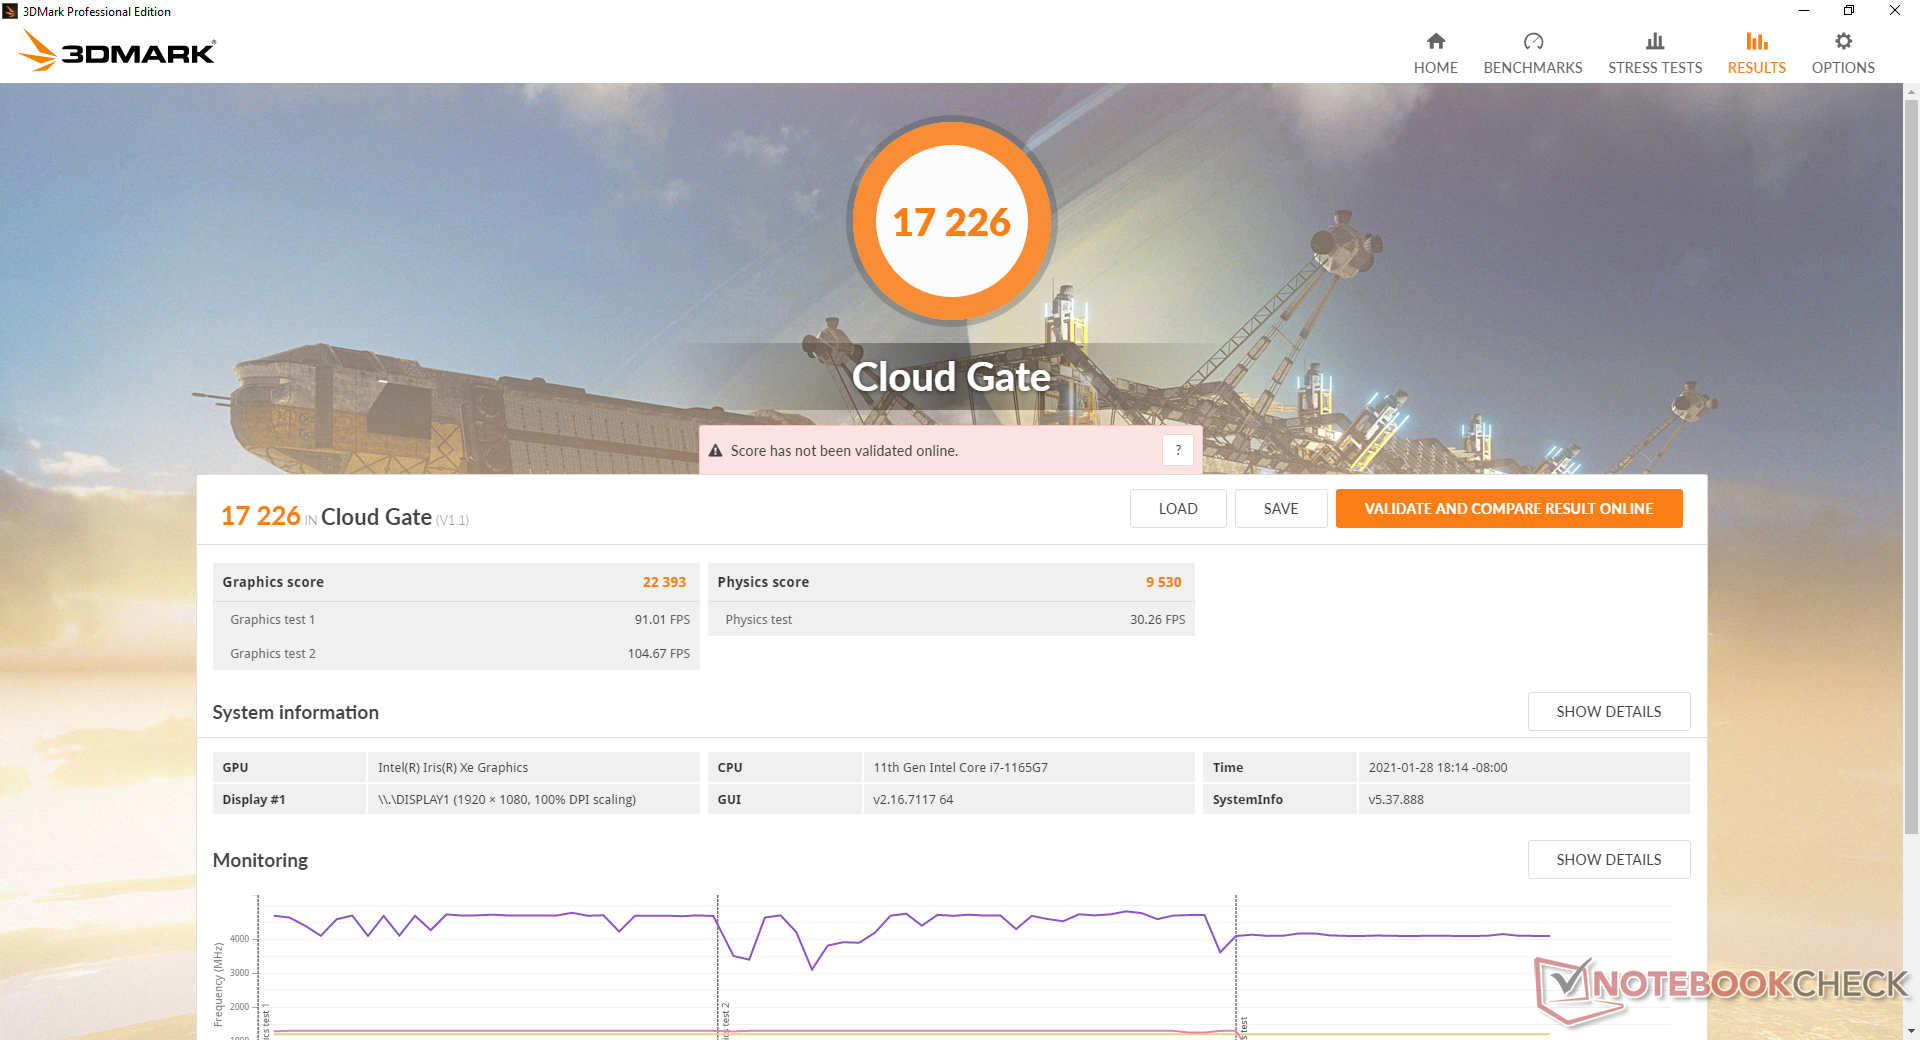
As pontuações do 3DMark são cerca de 15% mais lentas do que a média do Iris Xe 96 EU em nosso banco de dados, apesar do desempenho da CPU ser mais rápido do que a média registrada acima. A discrepância é provavelmente atribuída à RAM de canal único em nossa unidade de revisão. Se fosse de canal duplo, então os resultados provavelmente seriam 30% ou mais altos como o que observamos no Lenovo IdeaPad Slim 9i.
Mais referências e informações técnicas sobre o Iris Xe 96 EU podem ser encontradas aqui. Optar pelo menor Core i5 Iris Xe 80 EUs pode não significar necessariamente um desempenho gráfico mais lento, dependendo da configuração da RAM. Entretanto, espere que a opção Core i3 UHD Graphics 620 (ou Iris Xe 48 EUs) seja significativamente mais lenta.
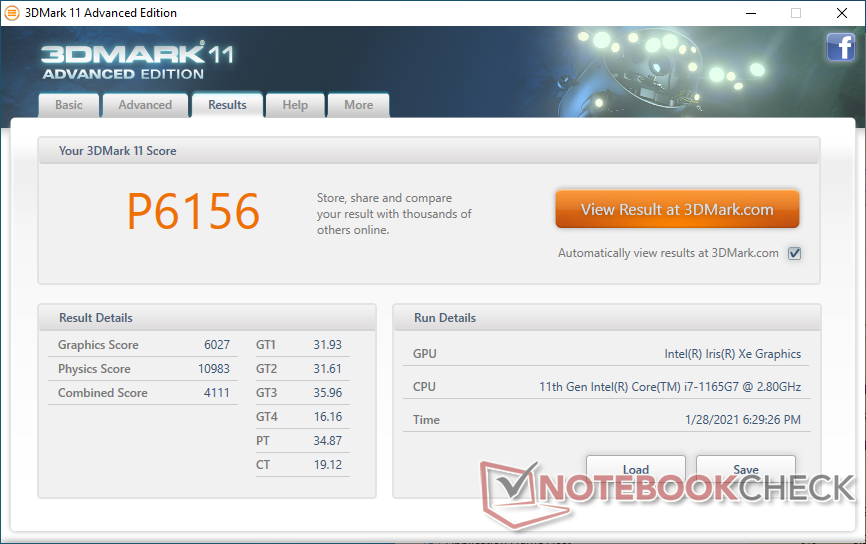
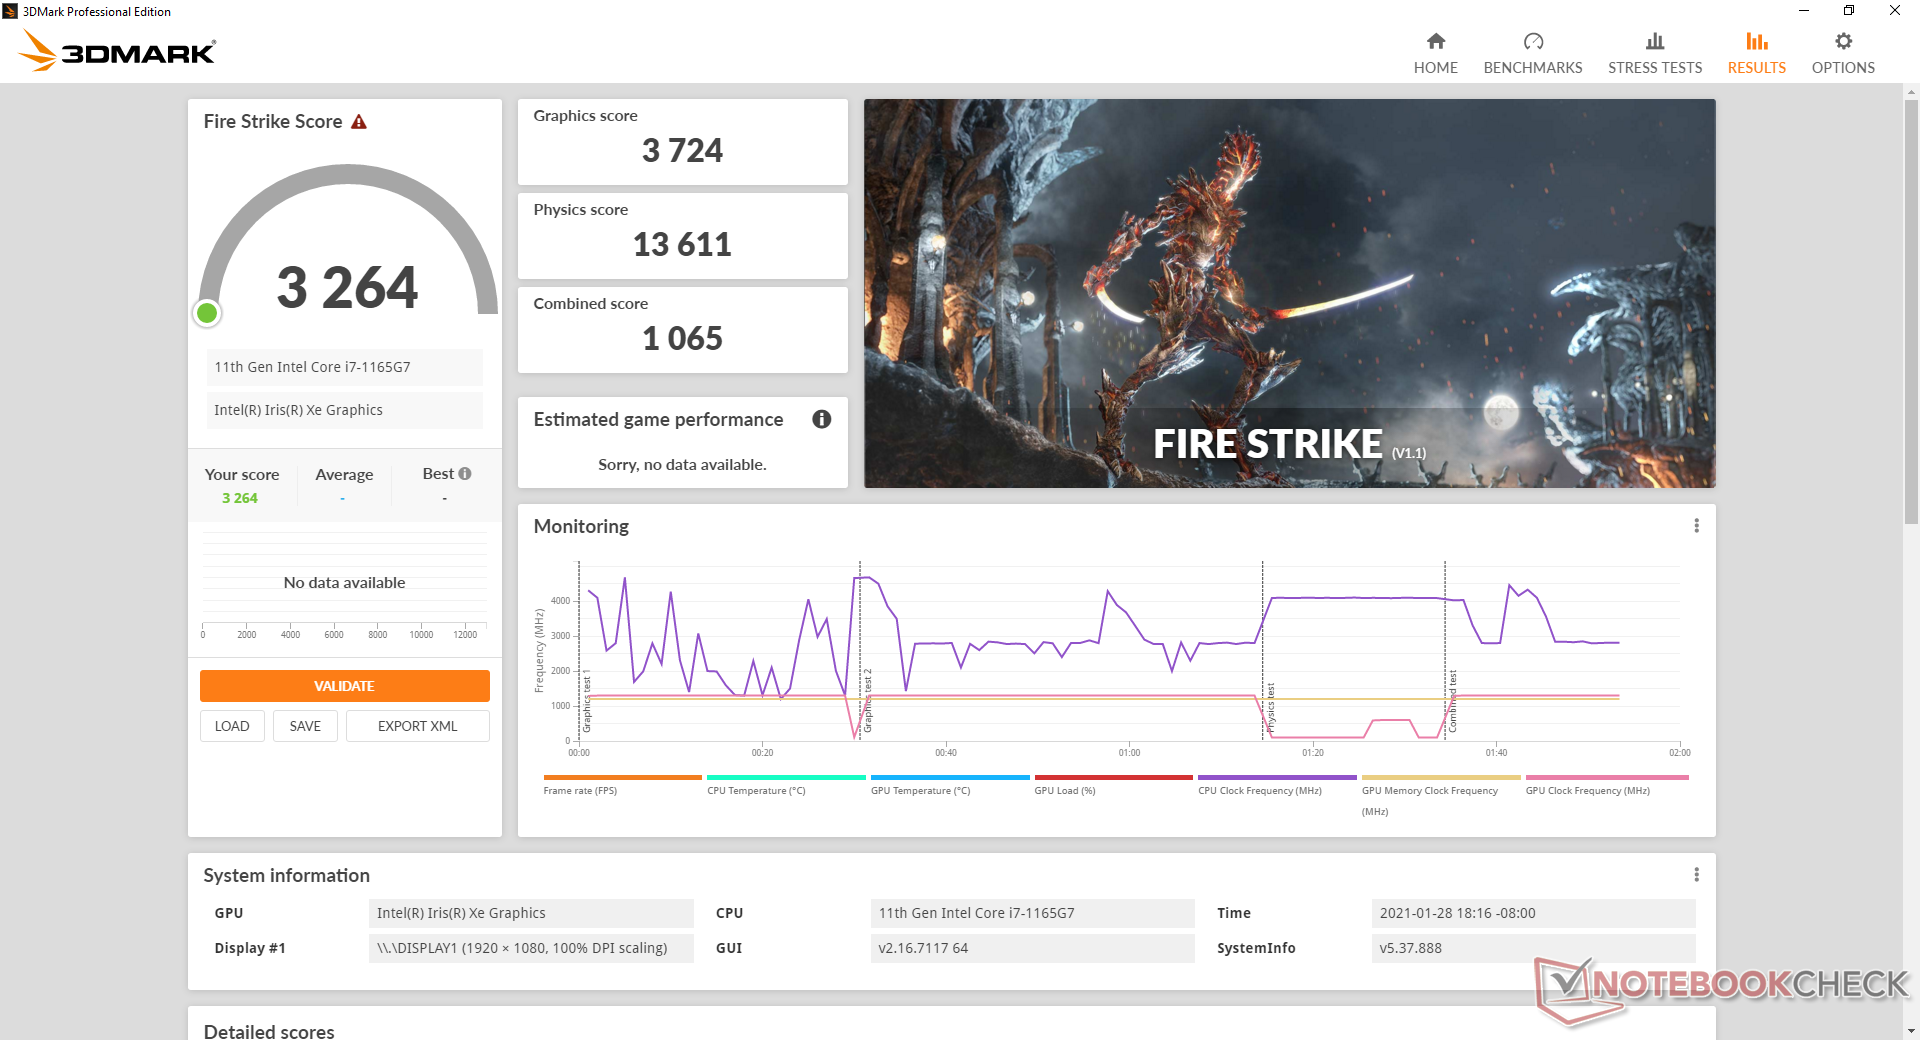
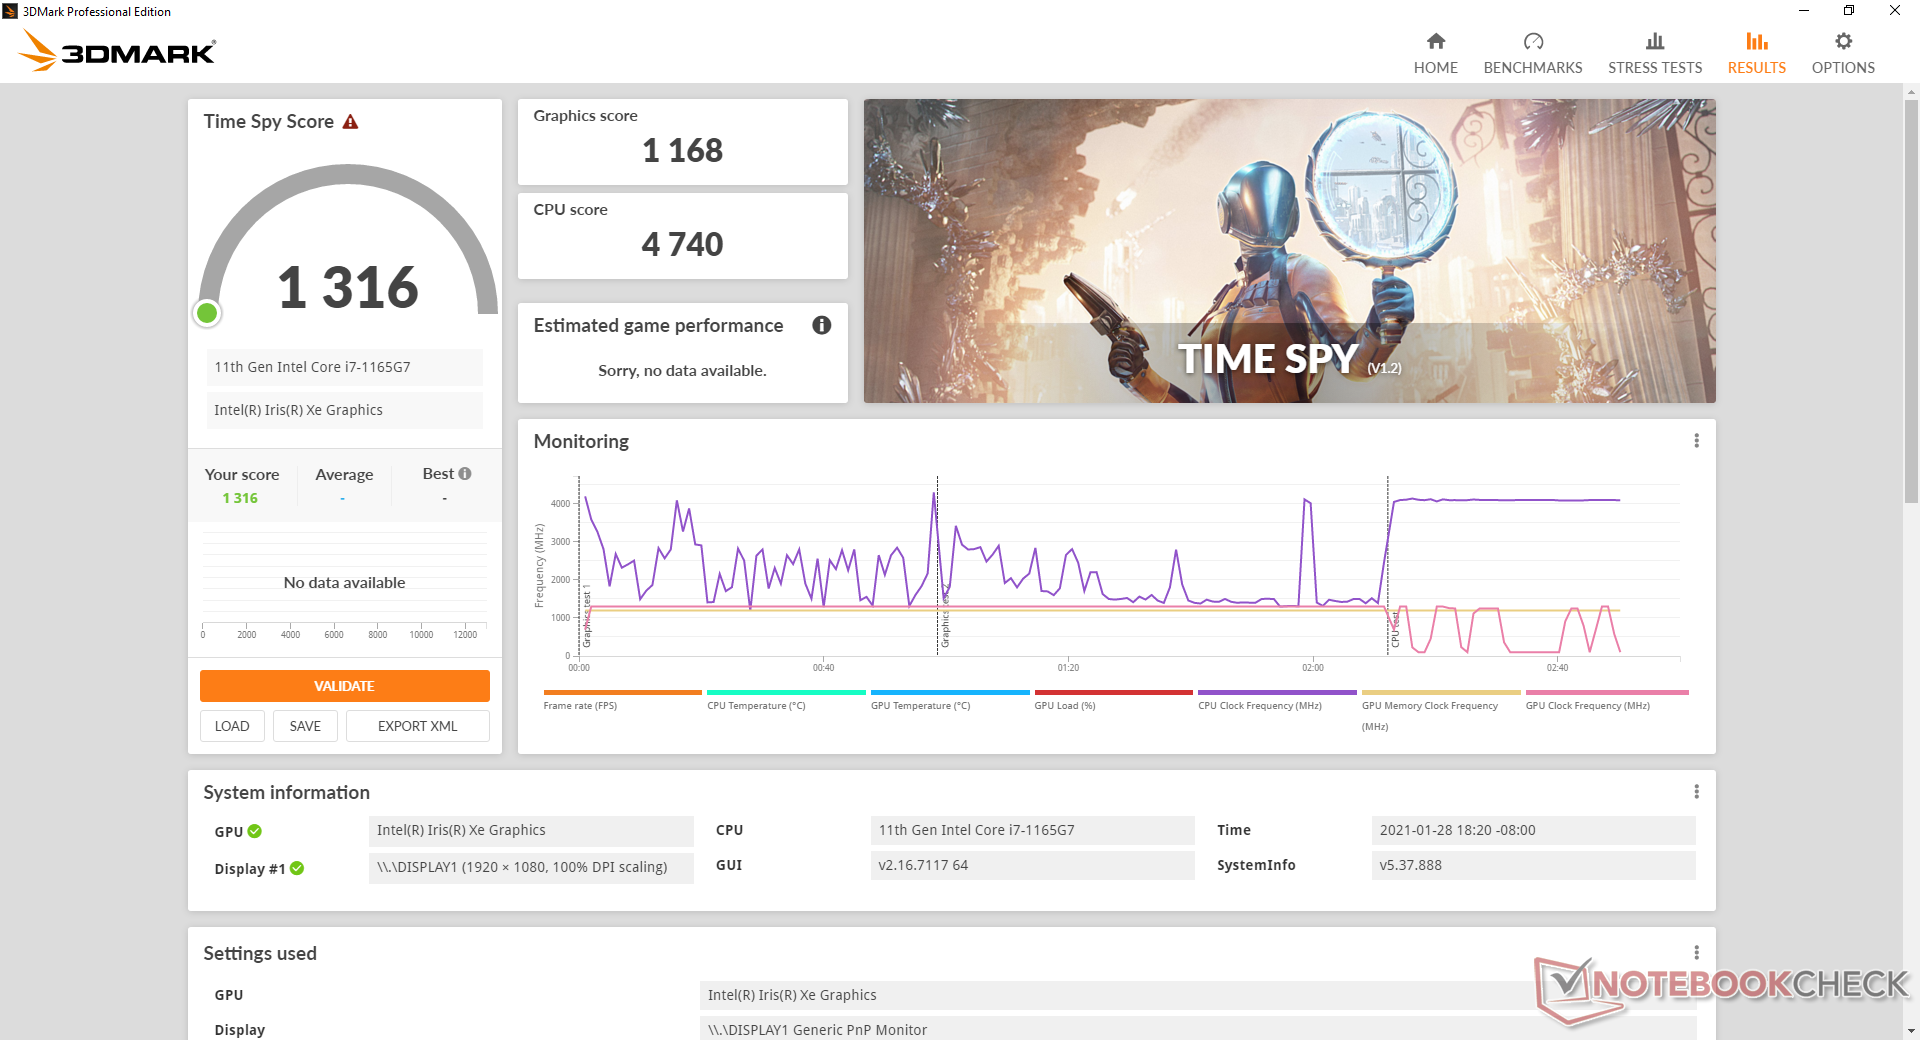
| 3DMark 11 Performance | 6156 pontos | |
| 3DMark Cloud Gate Standard Score | 17226 pontos | |
| 3DMark Fire Strike Score | 3264 pontos | |
| 3DMark Time Spy Score | 1316 pontos | |
Ajuda | ||
| baixo | média | alto | ultra | |
|---|---|---|---|---|
| GTA V (2015) | 67.6 | 52.5 | 12.6 | 5.72 |
| The Witcher 3 (2015) | 70.3 | 43.7 | 20.7 | 10.3 |
| Dota 2 Reborn (2015) | 78.8 | 61.8 | 37.7 | 35 |
| Final Fantasy XV Benchmark (2018) | 30.3 | 15.6 | 12.7 | |
| X-Plane 11.11 (2018) | 42.3 | 32.7 | 28.8 | |
| Strange Brigade (2018) | 66.2 | 23.8 | 20.1 | 16.9 |
Emissions
Ruído do sistema
O ventilador interno irá pulsar entre ocioso e 33,6 dB(A) mesmo quando simplesmente navegando na web ou ocioso na área de trabalho. Embora não seja suficientemente alto para ser incômodo ou muito perceptível, uma abordagem mais firme teria sido preferível. Ruído do ventilador quando em funcionamento Witcher 3 é estável em 33,6 dB(A) para ser mais silencioso do que inicialmente esperado. A execução de outros jogos em configurações mais baixas para taxas de quadros mais altas fará com que o ruído do ventilador salte ligeiramente.
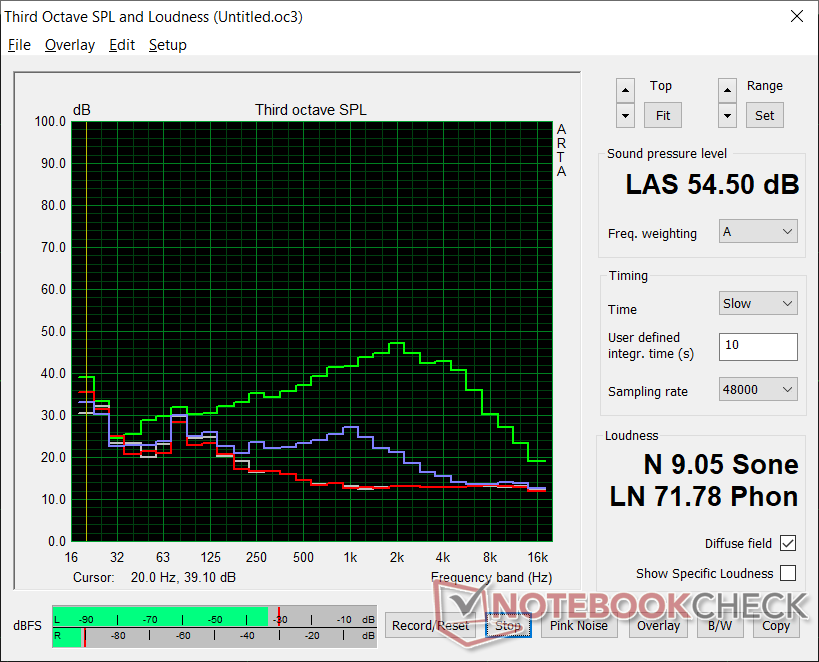
Cargas extremas como Prime95 farão barulho de ventoinha até 49,2 dB(A) e até 54,5 dB(A) para ser muito mais alto do que a maioria dos outros mini PCs quando em condições similares. A CPU pode ser rápida, mas o ventilador estará trabalhando para manter esses impressionantes níveis de desempenho.
Podemos notar pequenos choramingos de bobina ou ruídos eletrônicos de nossa unidade de teste.
| Intel NUC11PAQi7 Iris Xe G7 96EUs, i7-1165G7, Samsung SSD 980 Pro 500GB MZ-V8P500BW | Intel NUC8i7BE Iris Plus Graphics 655, i7-8559U | Intel Hades Canyon NUC8i7HVK Vega M GH, i7-8809G, Intel Optane 120 GB SSDPEK1W120GA | Beelink SEi10 UHD Graphics G1 (Ice Lake 32 EU), i3-1005G1, Silicon Motion AZW 256G M.2280 NVMe 4X 200725 D | Zotac ZBox MI643 UHD Graphics 620, i5-10210U, Lexar NM610 1TB | GMK NucBox K1 UHD Graphics 600, Celeron J4125, HIKVision C100 NGFF SSD 128GB | |
|---|---|---|---|---|---|---|
| Noise | -10% | -11% | -17% | 2% | -10% | |
| desligado / ambiente * (dB) | 25.6 | 28.7 -12% | 28.7 -12% | 27.5 -7% | 26.1 -2% | 27.8 -9% |
| Idle Minimum * (dB) | 25.6 | 28.7 -12% | 29 -13% | 30.9 -21% | 27.5 -7% | 27.8 -9% |
| Idle Average * (dB) | 25.6 | 29.3 -14% | 29 -13% | 33.5 -31% | 27.5 -7% | 27.8 -9% |
| Idle Maximum * (dB) | 25.6 | 31.8 -24% | 29 -13% | 33.5 -31% | 27.5 -7% | 27.8 -9% |
| Load Average * (dB) | 33.6 | 39 -16% | 36 -7% | 38.5 -15% | 28.9 14% | 46.8 -39% |
| Witcher 3 ultra * (dB) | 33.6 | 39 -16% | 42 -25% | |||
| Load Maximum * (dB) | 54.5 | 41.4 24% | 49.4 9% | 51.6 5% | 42 23% | 46.8 14% |
* ... menor é melhor
Barulho
| Ocioso |
| 25.6 / 25.6 / 25.6 dB |
| Carga |
| 33.6 / 54.5 dB |
 | ||
30 dB silencioso 40 dB(A) audível 50 dB(A) ruidosamente alto |
||
min: | ||
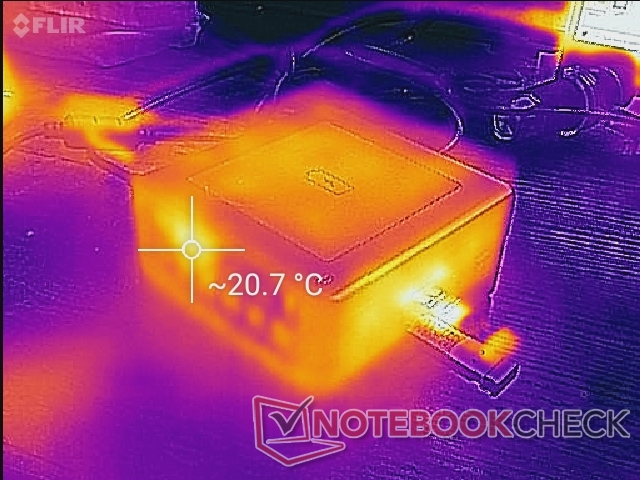
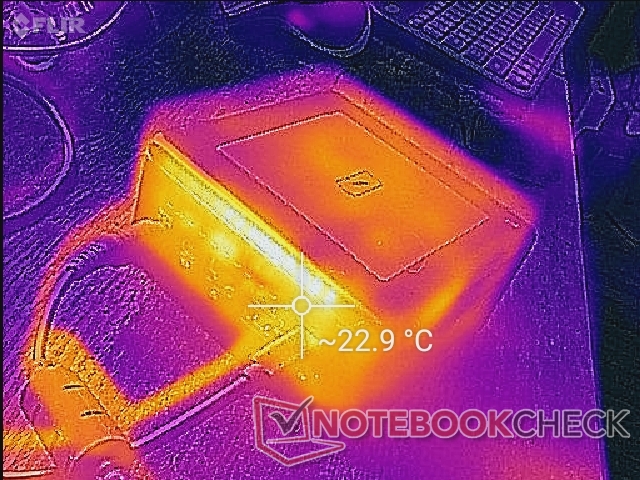
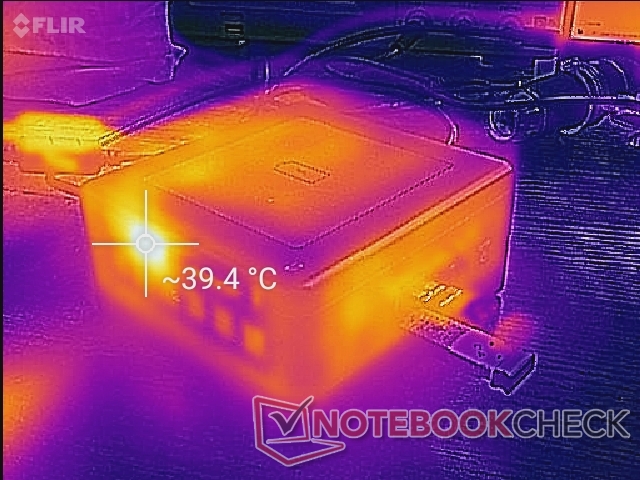
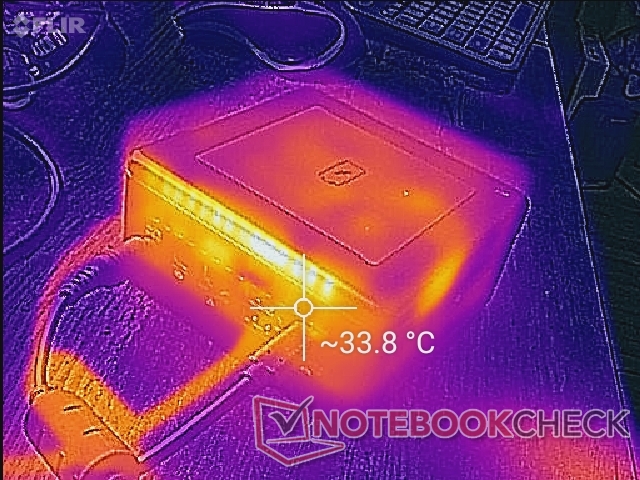
Temperatura
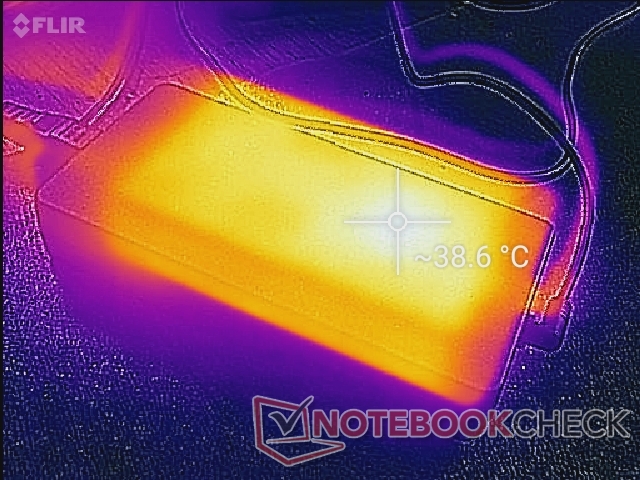
As temperaturas superficiais não são um problema, mesmo quando sob carga. A unidade funcionará bem sentada de lado, mas isto não é recomendado, uma vez que as grelhas de ventilação serão bloqueadas.
O adaptador AC pode ser visivelmente mais quente do que o próprio mini PC a cerca de 40 C quando se joga.
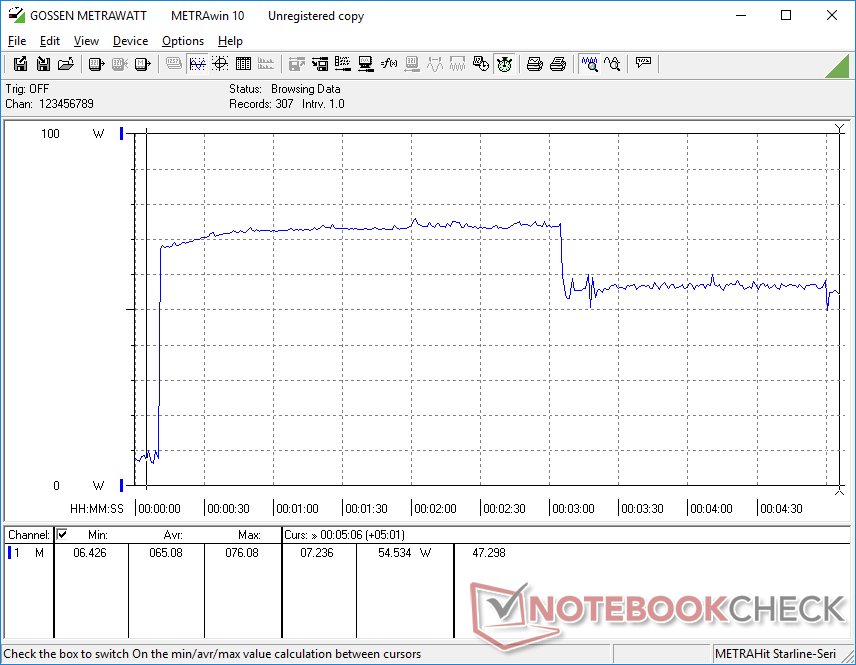
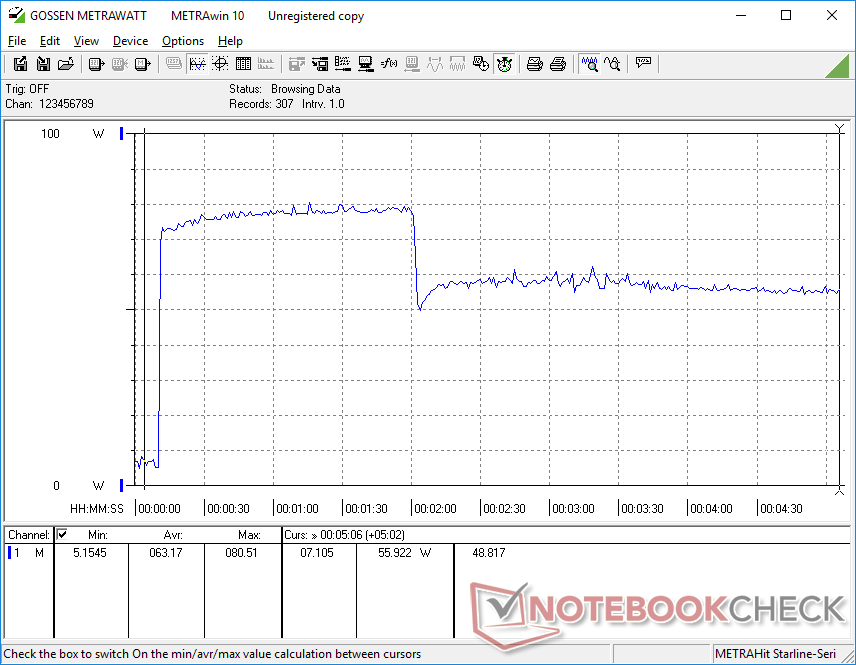
Teste de estresse
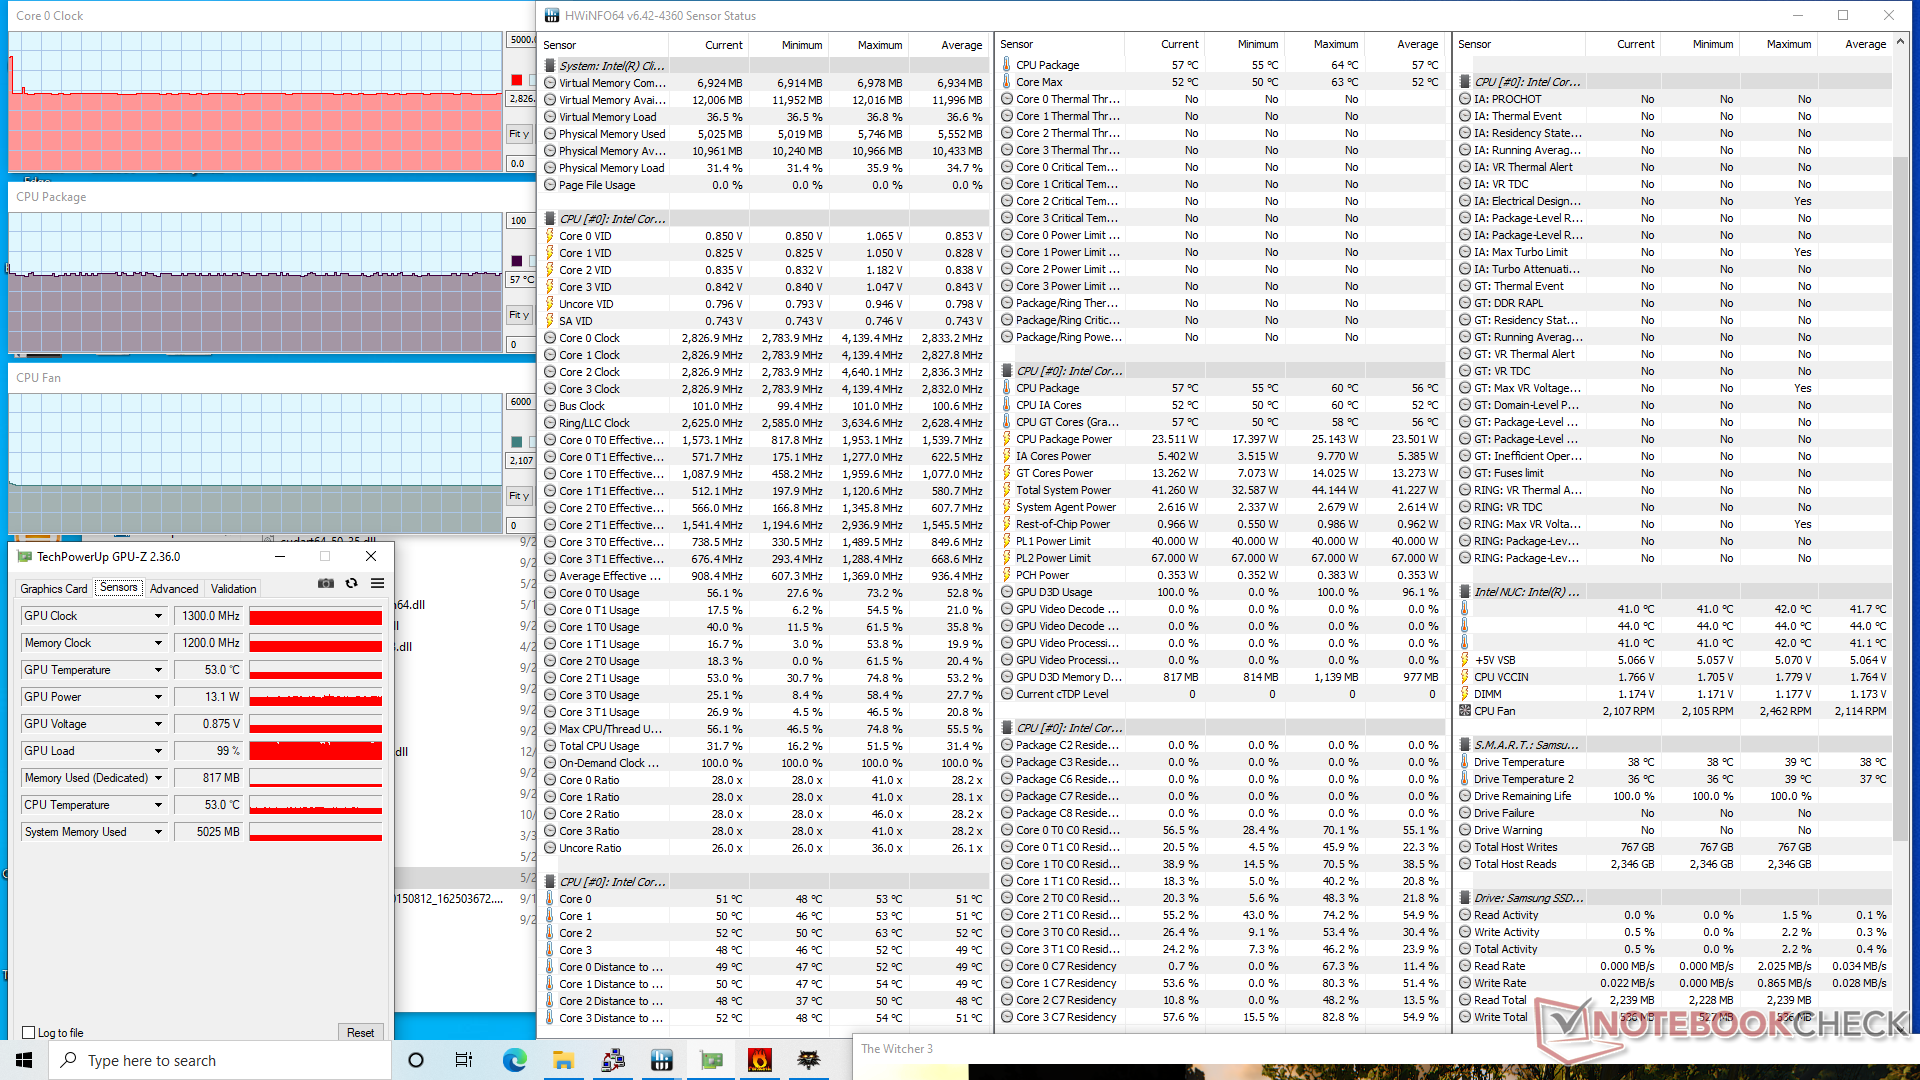
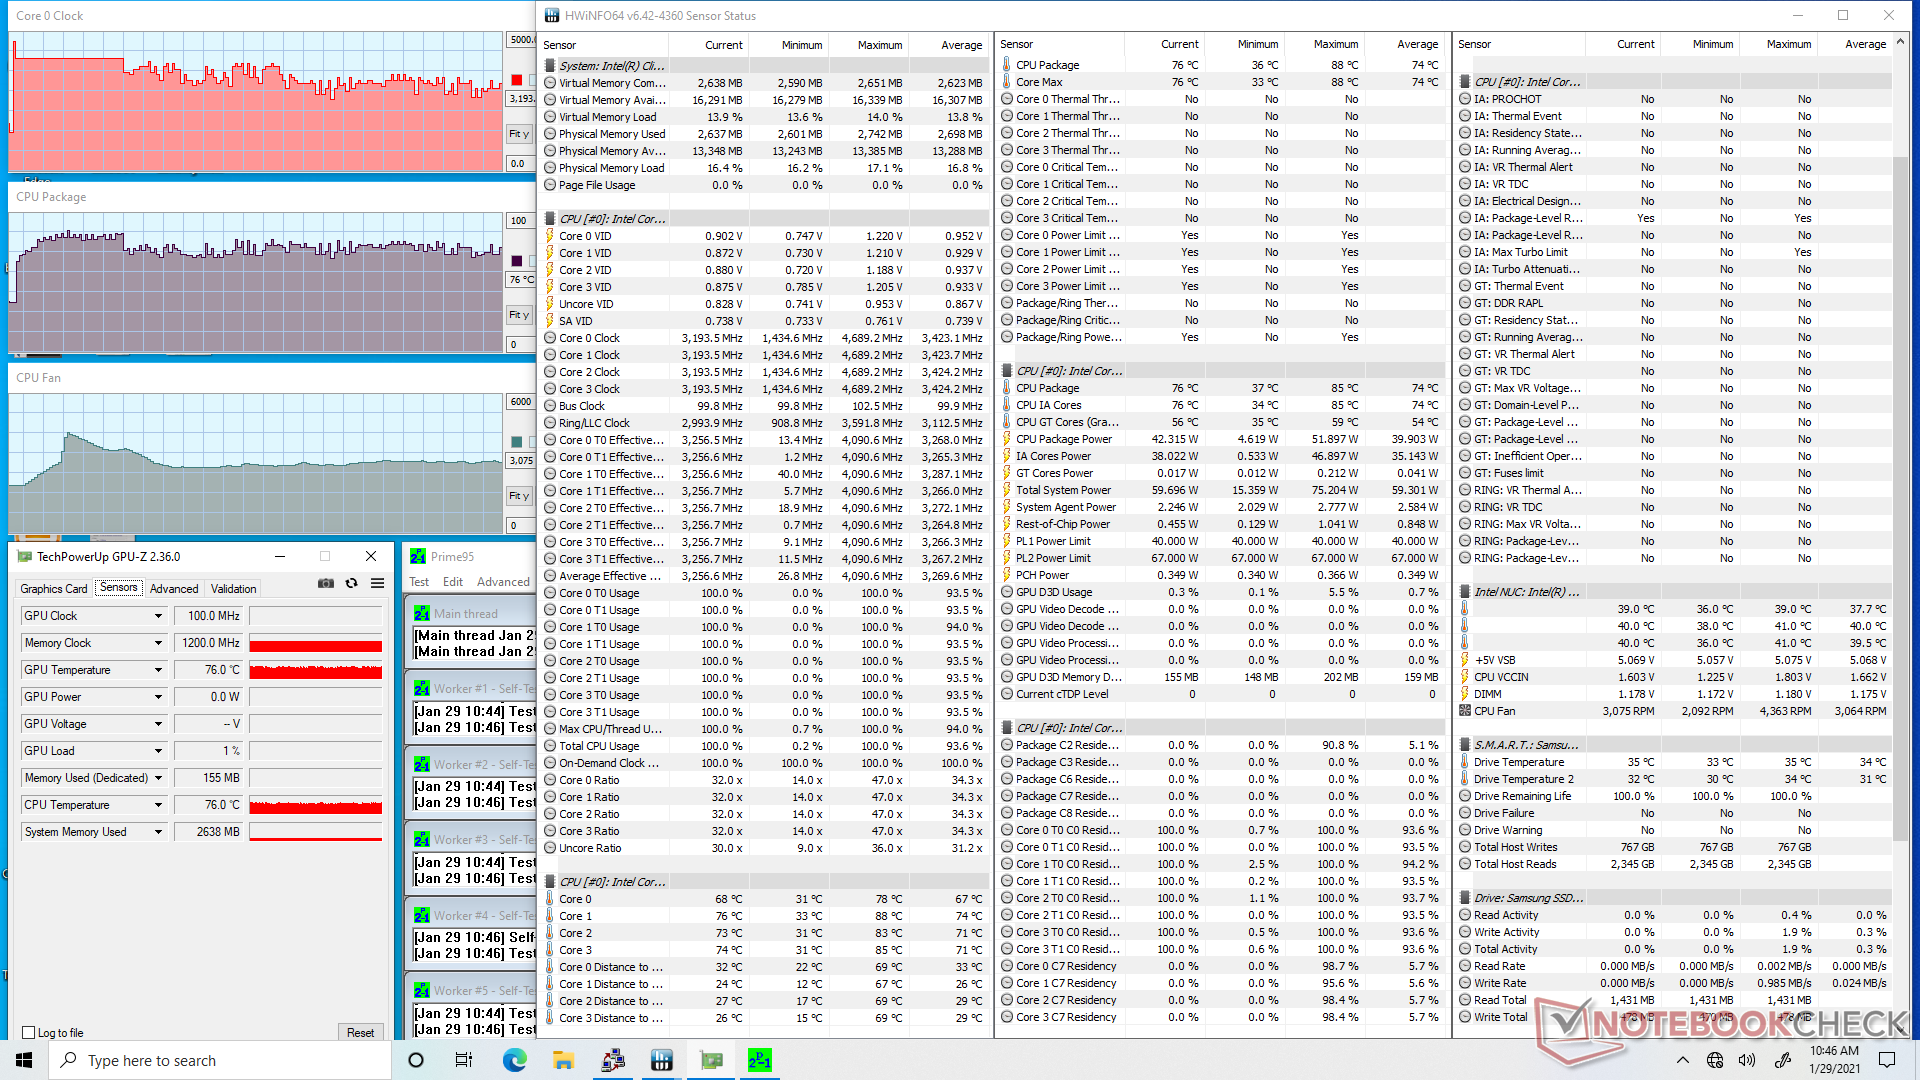
Ressaltamos a NUC para identificar qualquer problema potencial de estrangulamento. Ao executar Prime95, as taxas de relógio aumentariam para 4,1 GHz durante os primeiros minutos e a uma temperatura central estável de 86 C. Eventualmente, porém, tanto as taxas de relógio como a temperatura caem automaticamente e flutuam entre 2,7 a 3,4 GHz e 71 C a 79 C, respectivamente. Uma opção de funcionar a 4,1 GHz e 86 C indefinidamente para um desempenho máximo sustentado teria sido ótima para os usuários de energia. Ao rodar Witcher 3 para representar as cargas de jogos do mundo real, as taxas de relógio e a temperatura são muito mais baixas a apenas 57 C.
Observe que o RPM do ventilador flutua entre 0 e 2000 mesmo quando o sistema está ocioso, como mostra a captura de tela abaixo.
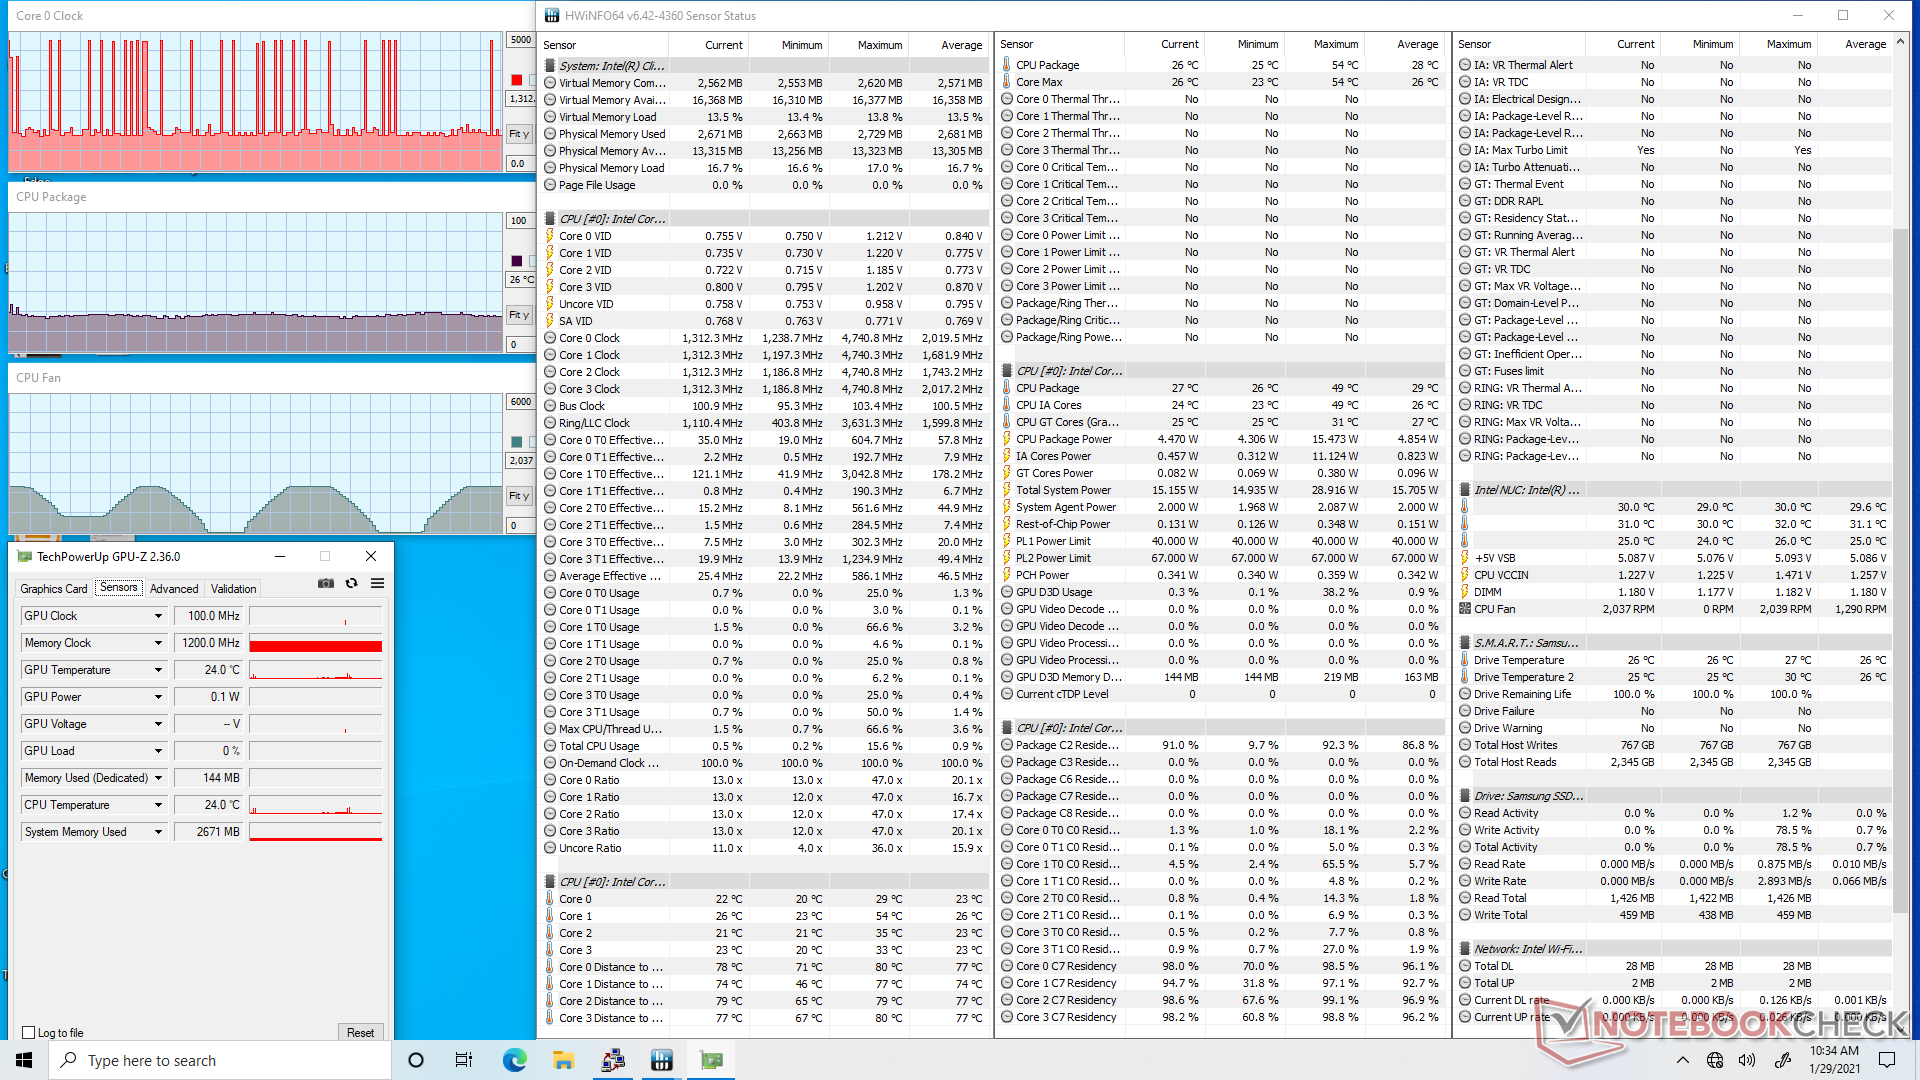
| RelógioCPU (GHz) | RelógioGPU (MHz) | Temperaturamédiada CPU (°C) | |
| System Idle | -- | -- | 26 |
| Prime95 Stress | 2.7 - 3.4 | -71 - 79 | |
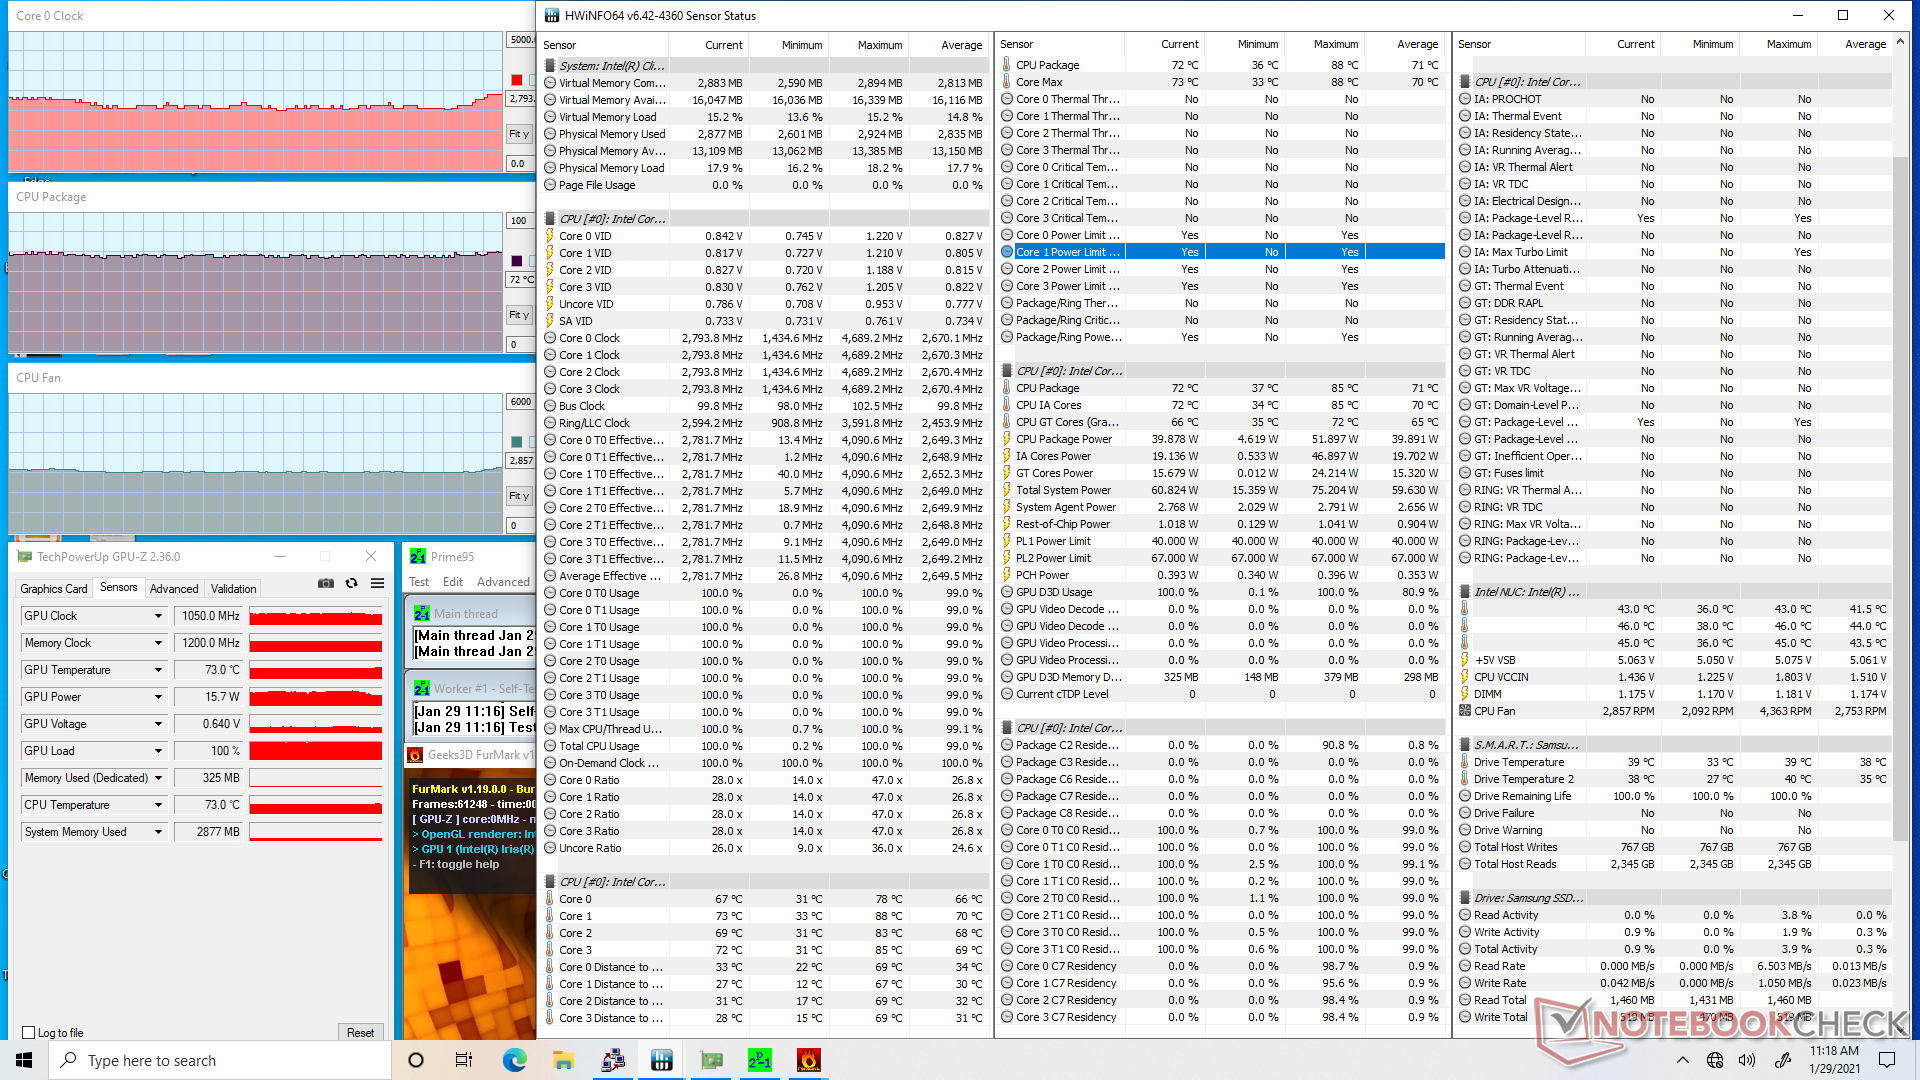
| Prime95 + FurMark Stress | 2.1 - 2.8 | ~1050 | 72 |
| Witcher 3 Stress | 2.8 | 1300 | 57 |
Energy Management
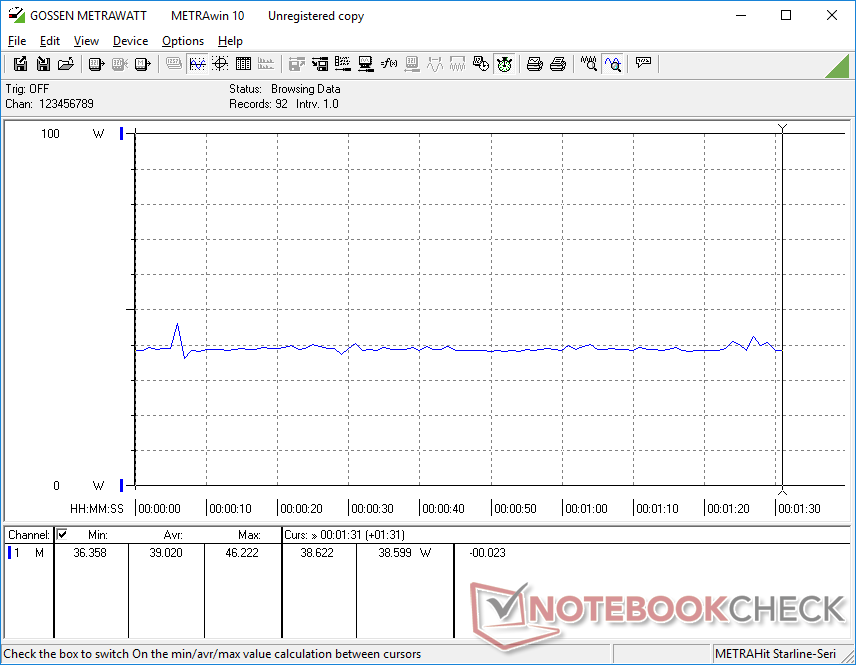
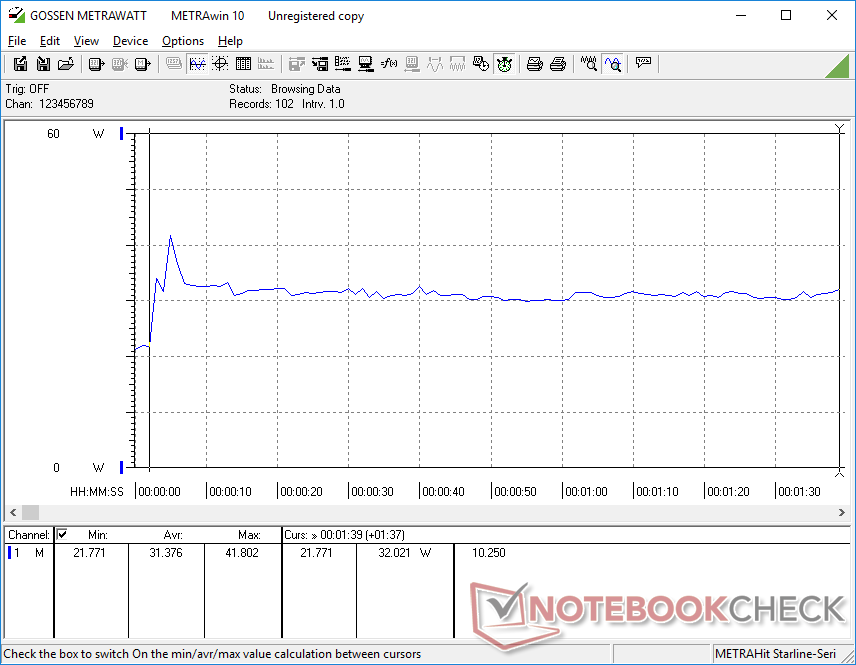
Consumo de energia
Os modelos da NUC sempre foram muito eficientes em termos de potência e a NUC 11 continua a tendência. O sistema consome apenas 31 W a 39 W quando comparado a 63 W e 50 W no Skull Canyon NUC e no concorrente Beelink GT-R35, respectivamente, tudo isso enquanto fornece um desempenho significativamente mais rápido de CPU e GPU do que ambos. O Hades Canyon ainda é duas vezes mais potente quando se trata de performance gráfica, mas também consome 3 vezes mais potência no processo.
Somos capazes de medir um consumo máximo de 80,5 W quando executamos cargas extremas, como mostram os gráficos abaixo. Este sorteio é apenas temporário e corresponde a nossas observações de taxa de clock ao rodar Prime95 na seção de Teste de Estresse acima.
Vale notar que o adaptador externo de 120 W AC é relativamente grande (~15 x 7,5 x 2,5 cm) e com mais de dois terços do peso da unidade NUC (448 g vs. 647 g).
| desligado | |
| Ocioso | |
| Carga |
|
Key:
min: | |
| Intel NUC11PAQi7 i7-1165G7, Iris Xe G7 96EUs, Samsung SSD 980 Pro 500GB MZ-V8P500BW, , x, | Intel NUC8i7BE i7-8559U, Iris Plus Graphics 655, , , x, | Intel Hades Canyon NUC8i7HVK i7-8809G, Vega M GH, Intel Optane 120 GB SSDPEK1W120GA, , x, | Zotac ZBox MI643 i5-10210U, UHD Graphics 620, Lexar NM610 1TB, , x, | Beelink GTR35 II-G-16512D00W64PRO-1T R5 3550H, Vega 8, Silicon Motion AZW 512G NV428, , x, | |
|---|---|---|---|---|---|
| Power Consumption | -3% | -173% | -29% | -44% | |
| Idle Minimum * (Watt) | 5.6 | 2.7 52% | 15.5 -177% | 7.5 -34% | 8.8 -57% |
| Idle Average * (Watt) | 5.6 | 3.1 45% | 16.2 -189% | 9.2 -64% | 9.1 -63% |
| Idle Maximum * (Watt) | 6 | 6.3 -5% | 16.5 -175% | 9.6 -60% | 9.6 -60% |
| Load Average * (Watt) | 31.4 | 59.7 -90% | 83.4 -166% | 34.4 -10% | 55.3 -76% |
| Witcher 3 ultra * (Watt) | 39 | 47.2 -21% | 121.7 -212% | 50.3 -29% | |
| Load Maximum * (Watt) | 80.5 | 78 3% | 173.5 -116% | 60.6 25% | 65.6 19% |
* ... menor é melhor
Pro
Contra
Veredicto

Em termos de desempenho, nosso Tiger Lake Core i7 está aproximadamente no mesmo nível do Comet Lake NUC 10 em cargas com múltiplas roscas, sendo cerca de 20% mais rápido em cargas com uma única rosca. Sua maior vantagem, entretanto, está no desempenho gráfico onde o Iris Xe pode ser mais de 3x mais rápido do que o UHD Graphics 620 sem sequer precisar consumir muito mais energia. Se a potência e eficiência da GPU são mais importantes, então o NUC 11 será o melhor investimento. Caso contrário, os usuários que pretendem executar principalmente cargas HTPC como 4K streaming ou navegação de vídeo, seria ótimo com um NUC 10 mais antigo, enquanto o Hades Canyon NUC ainda será a melhor opção para jogos brutos.
O NUC coloca o Tiger Lake sob uma luz melhor do que a maioria dos laptops conseguiu fazer com a mesma série de processadores. Vai custar mais do que a maioria dos outros mini PCs da série Core U, mas a qualidade e a garantia de 3 anos fazem dele um investimento mais seguro.
É altamente recomendável configurar o NUC 11 com memória de dois canais para aumentar o desempenho gráfico. Nosso kit de canal único fornecido pela Intel retornou pontuações 3DMark mais lentas do que o esperado e taxas de quadros que não fazem nenhuma justiça ao Iris Xe.
Nos futuros NUCs, gostaríamos de ver um leitor de impressão digital integrado e suporte para adaptadores USB-C AC. O concorrente Beelink GT-R mini PC inclui um leitor de impressão digital enquanto uma fonte de alimentação externa USB-C seria uma solução mais universal que avança.
Preço e disponibilidade
A série NUC 11 não deve ser enviada até março de 2021 e, portanto, ainda não está amplamente disponível no momento em que é redigida
Price comparison

