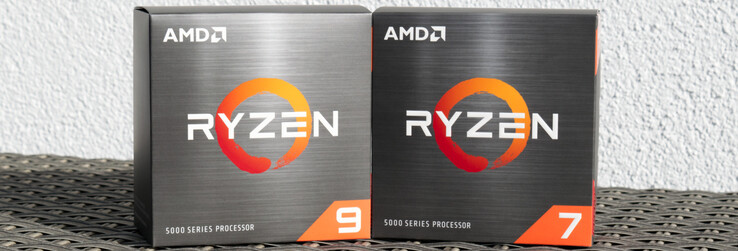
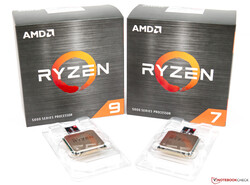
AMD Ryzen 9 5900X e AMD Ryzen 7 5800X em Revista: A AMD destrona a Intel como a CPU de jogo mais rápida
O início da AMD de sua série Ryzen 3000 trouxe nova vida ao mercado de CPU. Pela primeira vez, foi possível obter uma CPU de 16 núcleos que cabe em um soquete AM4. Em relação ao desempenho, estas novas CPUs estavam na maioria das vezes rodando em volta dos processadores da Intel em cenários de múltiplos núcleos, onde estavam quilômetros à frente de sua concorrência. Entretanto, o desempenho de um único núcleo permaneceu um ponto doloroso, e a Intel continuou a vender a CPU de jogos mais rápida disponível e conseguiu aumentar ainda mais essa barra com oIntel Core i9-10900K sacrificando a eficiência energética para um desempenho extra de um só núcleo. A AMD, em troca, continuou a otimizar sua arquitetura Zen 3, que traz unidades de carga e armazenamento atualizadas que, combinadas com o cache, são muito mais poderosas do que antes. No papel, a Zen 3 deve oferecer um IPC 19 % maior do que a Zen 2. Pelo menos em parte responsáveis por este aumento de desempenho são a notável melhoria da largura de banda e as latências mais baixas. O Tecido Infinity, o conector entre a matriz da CPU e a matriz de E/S, funciona em até 2.000 MHz, resultando agora em uma velocidade de RAM ideal de 4.000 MHz.
Visualmente, não houve muita mudança nas matrizes da CPU. Um CCX Zen 3 contém agora oito núcleos onde antes eram apenas quatro. Cada núcleo tem acesso a 32 MB de cache L3. O molde de E/S permaneceu inalterado e, ao contrário dos moldes de 7 nm da CPU, continua a ser fabricado em um processo de 12 nm. O próximo passo na evolução litográfica, o processo de fabricação de 5 nm, deve chegar com Zen 4.
Ao contrário da Intel AMD, não foi necessário aumentar a classificação TDP em nenhuma quantidade significativa, e as novas CPUs Vermeer são, portanto, compatíveis com os chipsets da série 500 existentes. Em comparação com o Core i9-10900K da Intel, o consumo de energia de até 250 W da nova CPU da AMD é significativamente mais eficiente em termos energéticos.
Os Top 10
» Os Top 10 Portáteis Multimídia
» Os Top 10 Portáteis de Jogos
» Os Top 10 Portáteis Leves para Jogos
» Os Top 10 Portáteis Acessíveis de Escritório/Empresariais
» Os Top 10 Portáteis Premium de Escritório/Empresariais
» Os Top 10 dos Portáteis Workstation
» Os Top 10 Subportáteis
» Os Top 10 Ultrabooks
» Os Top 10 Conversíveis
» Os Top 10 Tablets
» Os Top 10 Smartphones
» A melhores Telas de Portáteis Analisadas Pela Notebookcheck
» Top 10 dos portáteis abaixo dos 500 Euros da Notebookcheck
» Top 10 dos Portáteis abaixo dos 300 Euros
Die AMD-Ryzen-Prozessoren im Überblick
| Modelo | Cores/Threads | Relógio de Base | Relógio Turbo | L3-Cache | TDP | MSRP no lançamento |
|---|---|---|---|---|---|---|
| Ryzen 9 5950X | 16/32 | 3.4 GHz | 4.9 GHz | 64MB | 105Watts | $799 |
| Ryzen 9 3950X | 16/32 | 3.5 GHz | 4.7 GHz | 64 MB | 105 Watts | $749 |
| Ryzen 9 5900X | 12/24 | 3.7 GHz | 4.8 GHz | 64MB | 105Watts | $549 |
| Ryzen 9 3900XT | 12/24 | 3.8 GHz | 4.7 GHz | 64 MB | 105 Watts | $499 |
| Ryzen 9 3900X | 12/24 | 3.8 GHz | 4.6 GHz | 64 MB | 105 Watts | $499 |
| Ryzen 7 5800X | 8/16 | 3,8 GHz | 4,7 GHz | 32 MB | 105Watts | $449 |
| Ryzen 7 3800XT | 8/16 | 3,9 GHz | 4,7 GHz | 32 MB | 105 Watts | $399 |
| Ryzen 7 3800X | 8/16 | 3,9 GHz | 4,5 GHz | 32 MB | 105 Watts | $399 |
| Ryzen 7 3700X | 8/16 | 3,6 GHz | 4,4 GHz | 32 MB | 65 Watts | $329 |
| Ryzen 5 5600X | 6/12 | 3.7 GHz | 4.6 GHz | 32MB | 65Watt | $299 |
| Ryzen 5 3600XT | 6/12 | 3.8 GHz | 4.5 GHz | 32 MB | 95 Watts | $249 |
| Ryzen 5 3600X | 6/12 | 3.8 GHz | 4.4 GHz | 32 MB | 95 Watts | $229 |
| Ryzen 5 3600 | 6/12 | 3,6 GHz | 4,2 GHz | 32 MB | 65 Watts | $199 |
Detalhes do sistema de teste
Utilizamos o seguinte sistema para executar todos os benchmarks e testes nesta revisão:
- Raijintek Pean Benchtable
- AMD Ryzen 9 5900X, AMD Ryzen 7 5800X
- MSI MEG X570 Parecido com Deus
- Alphacool Eisbear 280 AiO
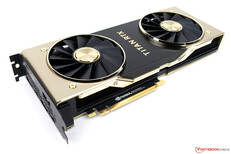
- Nvidia Titan RTX
- Fonte de alimentação Corsair HX 1200i
- Corsair Vengeance RGB Pro DDR4-4000 kit de memória 2 x 16 GB
- SSD Intel Optane 905P 480GB PCIe
- Microsoft Windows 10 Professional 64-Bit (Versão 2004)
Gostaríamos de agradecer à Caseking por nos fornecer o Raijintek Pean, que até continha uma gravação individual a laser, bem como à AMD para a placa principal, que fazia parte do kit de imprensa Zen 2 que a AMD enviou com seus processadores anteriores Ryzen 9 3900X e Ryzen 7 3700X. Nosso refrigerador de escolha foi um Alphacool Eisbear 280, que foi fornecido pela Alphacool. Gostaríamos ainda de agradecer à Corsair por nos apoiar e nos fornecer RAM
Benchmarks de Processador
Os benefícios da arquitetura Zen 3 atualizada da AMD foram imediatamente perceptíveis em nossos benchmarks de CPU. O desempenho comparativamente pobre da AMD em uma única linha não é mais graças a melhorias significativas no desempenho de um único núcleo. O resultado: A Intel Núcleo i9-10900K ficou cerca de 20% atrás do Ryzen 9 5900X da AMD. Mesmo o mais lento Ryzen 7 5800X de 8 núcleos não teve problemas em acompanhar o processador Intel de 10 núcleos, e seu desempenho multi-núcleo também foi muitas vezes maior. Em comparação com seus próprios antecessores internos e concorrentes, o Ryzen 9 5800X conseguiu facilmente se manter em dia com o Ryzen 9 3950X. A nova CPU emblemática, a AMD Ryzen 9 5950X, será revista separadamente juntamente com a nova oferta inicial da AMD, a Ryzen 5 5600X.
Outros pontos de referência adicionais podem ser encontrados aqui.
| Cinebench R20 | |
| CPU (Single Core) | |
| AMD Ryzen 9 5900X | |
| AMD Ryzen 7 5800X | |
| Intel Core i9-10900K | |
| AMD Ryzen 9 3950X | |
| AMD Ryzen 9 3900X | |
| AMD Ryzen 7 3700X | |
| AMD Ryzen 3 3300X | |
| CPU (Multi Core) | |
| AMD Ryzen 9 3950X | |
| AMD Ryzen 9 5900X | |
| AMD Ryzen 9 3900X | |
| Intel Core i9-10900K | |
| AMD Ryzen 7 5800X | |
| AMD Ryzen 7 3700X | |
| AMD Ryzen 3 3300X | |
| Cinebench R15 | |
| CPU Single 64Bit | |
| AMD Ryzen 9 5900X | |
| AMD Ryzen 7 5800X | |
| Intel Core i9-10900K | |
| AMD Ryzen 9 3900X | |
| AMD Ryzen 9 3950X | |
| AMD Ryzen 7 3700X | |
| AMD Ryzen 3 3300X | |
| CPU Multi 64Bit | |
| AMD Ryzen 9 3950X | |
| AMD Ryzen 9 5900X | |
| AMD Ryzen 9 3900X | |
| Intel Core i9-10900K | |
| AMD Ryzen 7 5800X | |
| AMD Ryzen 7 3700X | |
| AMD Ryzen 3 3300X | |
| Cinebench R11.5 | |
| CPU Single 64Bit | |
| AMD Ryzen 9 5900X | |
| AMD Ryzen 7 5800X | |
| Intel Core i9-10900K | |
| AMD Ryzen 9 3950X | |
| AMD Ryzen 9 3900X | |
| AMD Ryzen 7 3700X | |
| AMD Ryzen 3 3300X | |
| CPU Multi 64Bit | |
| AMD Ryzen 9 3950X | |
| AMD Ryzen 9 5900X | |
| AMD Ryzen 9 3900X | |
| AMD Ryzen 7 5800X | |
| Intel Core i9-10900K | |
| AMD Ryzen 7 3700X | |
| AMD Ryzen 3 3300X | |
| Cinebench R10 | |
| Rendering Single CPUs 64Bit | |
| AMD Ryzen 7 5800X | |
| AMD Ryzen 9 5900X | |
| Intel Core i9-10900K | |
| AMD Ryzen 9 3950X | |
| AMD Ryzen 9 3900X | |
| AMD Ryzen 3 3300X | |
| AMD Ryzen 7 3700X | |
| Rendering Multiple CPUs 64Bit | |
| AMD Ryzen 9 5900X | |
| AMD Ryzen 9 3950X | |
| AMD Ryzen 7 5800X | |
| Intel Core i9-10900K | |
| AMD Ryzen 9 3900X | |
| AMD Ryzen 7 3700X | |
| AMD Ryzen 3 3300X | |
| Blender - v2.79 BMW27 CPU | |
| AMD Ryzen 3 3300X | |
| AMD Ryzen 7 5800X | |
| AMD Ryzen 7 3700X | |
| Intel Core i9-10900K | |
| AMD Ryzen 9 3900X | |
| AMD Ryzen 9 5900X | |
| AMD Ryzen 9 3950X | |
| wPrime 2.10 | |
| 32m | |
| AMD Ryzen 3 3300X | |
| AMD Ryzen 9 3950X | |
| AMD Ryzen 7 3700X | |
| Intel Core i9-10900K | |
| AMD Ryzen 7 5800X | |
| AMD Ryzen 9 3900X | |
| 1024m | |
| AMD Ryzen 3 3300X | |
| AMD Ryzen 7 3700X | |
| AMD Ryzen 7 5800X | |
| Intel Core i9-10900K | |
| AMD Ryzen 9 3900X | |
| AMD Ryzen 9 3950X | |
| X264 HD Benchmark 4.0 | |
| Pass 1 | |
| AMD Ryzen 7 5800X | |
| AMD Ryzen 9 5900X | |
| Intel Core i9-10900K | |
| AMD Ryzen 7 3700X | |
| AMD Ryzen 9 3900X | |
| AMD Ryzen 9 3950X | |
| AMD Ryzen 3 3300X | |
| Pass 2 | |
| AMD Ryzen 9 5900X | |
| AMD Ryzen 9 3950X | |
| AMD Ryzen 7 5800X | |
| Intel Core i9-10900K | |
| AMD Ryzen 9 3900X | |
| AMD Ryzen 7 3700X | |
| AMD Ryzen 3 3300X | |
| WinRAR - Result | |
| AMD Ryzen 7 5800X | |
| AMD Ryzen 9 5900X | |
| Intel Core i9-10900K | |
| AMD Ryzen 9 3900X | |
| AMD Ryzen 7 3700X | |
| AMD Ryzen 9 3950X | |
| AMD Ryzen 3 3300X | |
| TrueCrypt | |
| AES Mean 100MB | |
| AMD Ryzen 9 5900X | |
| AMD Ryzen 7 5800X | |
| Intel Core i9-10900K | |
| AMD Ryzen 7 3700X | |
| AMD Ryzen 9 3900X | |
| AMD Ryzen 9 3950X | |
| AMD Ryzen 3 3300X | |
| Twofish Mean 100MB | |
| AMD Ryzen 9 3950X | |
| AMD Ryzen 9 3900X | |
| AMD Ryzen 9 5900X | |
| Intel Core i9-10900K | |
| AMD Ryzen 7 3700X | |
| AMD Ryzen 7 5800X | |
| AMD Ryzen 3 3300X | |
| Serpent Mean 100MB | |
| AMD Ryzen 9 3950X | |
| AMD Ryzen 9 5900X | |
| AMD Ryzen 9 3900X | |
| Intel Core i9-10900K | |
| AMD Ryzen 7 5800X | |
| AMD Ryzen 7 3700X | |
| AMD Ryzen 3 3300X | |
| Geekbench 5.5 | |
| Multi-Core | |
| AMD Ryzen 9 5900X | |
| AMD Ryzen 9 3950X | |
| Intel Core i9-10900K | |
| AMD Ryzen 7 5800X | |
| AMD Ryzen 9 3900X | |
| AMD Ryzen 7 3700X | |
| AMD Ryzen 3 3300X | |
| Single-Core | |
| AMD Ryzen 9 5900X | |
| AMD Ryzen 7 5800X | |
| Intel Core i9-10900K | |
| AMD Ryzen 9 3950X | |
| AMD Ryzen 7 3700X | |
| AMD Ryzen 3 3300X | |
| AMD Ryzen 9 3900X | |
| Geekbench 5.0 | |
| 5.0 Multi-Core | |
| AMD Ryzen 9 3950X | |
| AMD Ryzen 9 5900X | |
| Intel Core i9-10900K | |
| AMD Ryzen 7 5800X | |
| AMD Ryzen 9 3900X | |
| AMD Ryzen 3 3300X | |
| 5.0 Single-Core | |
| AMD Ryzen 7 5800X | |
| AMD Ryzen 9 5900X | |
| Intel Core i9-10900K | |
| AMD Ryzen 9 3950X | |
| AMD Ryzen 3 3300X | |
| AMD Ryzen 9 3900X | |
| Geekbench 4.4 | |
| 64 Bit Single-Core Score | |
| AMD Ryzen 7 5800X | |
| AMD Ryzen 9 5900X | |
| Intel Core i9-10900K | |
| AMD Ryzen 9 3900X | |
| AMD Ryzen 7 3700X | |
| AMD Ryzen 3 3300X | |
| AMD Ryzen 9 3950X | |
| 64 Bit Multi-Core Score | |
| AMD Ryzen 9 5900X | |
| AMD Ryzen 9 3950X | |
| AMD Ryzen 7 5800X | |
| AMD Ryzen 9 3900X | |
| Intel Core i9-10900K | |
| AMD Ryzen 7 3700X | |
| AMD Ryzen 3 3300X | |
| 3DMark 11 - 1280x720 Performance Physics | |
| AMD Ryzen 9 5900X | |
| AMD Ryzen 7 5800X | |
| Intel Core i9-10900K | |
| AMD Ryzen 9 3950X | |
| AMD Ryzen 9 3900X | |
| AMD Ryzen 7 3700X | |
| AMD Ryzen 3 3300X | |
| 7-Zip 18.03 | |
| 7z b 4 | |
| AMD Ryzen 9 3950X | |
| AMD Ryzen 9 5900X | |
| AMD Ryzen 9 3900X | |
| AMD Ryzen 7 5800X | |
| Intel Core i9-10900K | |
| AMD Ryzen 7 3700X | |
| AMD Ryzen 3 3300X | |
| 7z b 4 -mmt1 | |
| AMD Ryzen 7 5800X | |
| AMD Ryzen 9 5900X | |
| Intel Core i9-10900K | |
| AMD Ryzen 9 3900X | |
| AMD Ryzen 9 3950X | |
| AMD Ryzen 7 3700X | |
| AMD Ryzen 3 3300X | |
| HWBOT x265 Benchmark v2.2 - 4k Preset | |
| AMD Ryzen 9 5900X | |
| Intel Core i9-10900K | |
| AMD Ryzen 9 3900X | |
| AMD Ryzen 7 5800X | |
| AMD Ryzen 9 3950X | |
| AMD Ryzen 7 3700X | |
| AMD Ryzen 3 3300X | |
| R Benchmark 2.5 - Overall mean | |
| AMD Ryzen 9 3900X | |
| AMD Ryzen 3 3300X | |
| Intel Core i9-10900K | |
| AMD Ryzen 9 3950X | |
| AMD Ryzen 9 5900X | |
| AMD Ryzen 7 5800X | |
| LibreOffice - 20 Documents To PDF | |
| Intel Core i9-10900K | |
| AMD Ryzen 9 3900X | |
| AMD Ryzen 9 3950X | |
| AMD Ryzen 3 3300X | |
| AMD Ryzen 9 5900X | |
| AMD Ryzen 7 5800X | |
| WebXPRT 3 - Overall | |
| AMD Ryzen 7 5800X | |
| AMD Ryzen 9 5900X | |
| Intel Core i9-10900K | |
| AMD Ryzen 9 3950X | |
| AMD Ryzen 3 3300X | |
| Mozilla Kraken 1.1 - Total | |
| AMD Ryzen 3 3300X | |
| Intel Core i9-10900K | |
| AMD Ryzen 9 3950X | |
| AMD Ryzen 9 5900X | |
| AMD Ryzen 7 5800X | |
| 3DMark | |
| 3840x2160 Fire Strike Ultra Physics | |
| AMD Ryzen 9 5900X | |
| AMD Ryzen 9 3950X | |
| AMD Ryzen 7 5800X | |
| Intel Core i9-10900K | |
| AMD Ryzen 9 3900X | |
| AMD Ryzen 7 3700X | |
| AMD Ryzen 3 3300X | |
| 1920x1080 Fire Strike Physics | |
| AMD Ryzen 9 5900X | |
| AMD Ryzen 9 3950X | |
| AMD Ryzen 7 5800X | |
| Intel Core i9-10900K | |
| AMD Ryzen 9 3900X | |
| AMD Ryzen 7 3700X | |
| AMD Ryzen 3 3300X | |
| 2560x1440 Time Spy CPU | |
| Intel Core i9-10900K | |
| AMD Ryzen 9 5900X | |
| AMD Ryzen 9 3950X | |
| AMD Ryzen 9 3900X | |
| AMD Ryzen 7 5800X | |
| AMD Ryzen 7 3700X | |
| AMD Ryzen 3 3300X | |
* ... menor é melhor
Teste de Carga Sustentada Executando Nosso CineBench R15 Loop
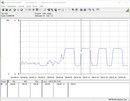
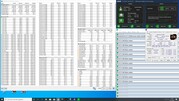
Nem o Ryzen 9 5900X nem o Ryzen 7 5800X tinham qualquer problema com o nosso loop multi-tarefa CineBench R15. O AiO combinado com o radiador de 280 mm conseguiu manter as CPUs sempre frias
Desempenho no jogo Vermeer
Até agora, a Intel tornou a CPU de jogos mais rápida disponível. Graças à nova série Ryzen 5000, esta honra agora vai para a AMD. Vamos começar com as referências sintéticas: ambos, o Ryzen 9 5900X e o Ryzen 7 5800X conseguiram superar seus respectivos antecessores. Entretanto, o processador Comet Lake S da Intel continua a superar as CPUs da AMD por margens de um dígito.
Isto muda completamente quando damos uma olhada em nossos benchmarks de jogo. O Zen 3 consegue superar o desempenho da IntelIntel Core i9-10900K em até 20 %. Quanto maior a resolução e os detalhes, menor a diferença entre os dois concorrentes. No entanto, ambas as nossas amostras de revisão tiveram um desempenho excepcionalmente bom quando pareadas com o Nvidia Titan RTX. A diferença em relação aos processadores anteriores da série Ryzen 3000 é imensa, e em algum lugar entre 10 e 40 % dependendo do jogo.
| 3DMark 11 - 1280x720 Performance GPU | |
| Intel Core i7-10700K | |
| Intel Core i9-10900K | |
| AMD Ryzen 7 5800X | |
| AMD Ryzen 7 3800XT | |
| AMD Ryzen 3 3300X | |
| AMD Ryzen 9 5900X | |
| AMD Ryzen 3 3100 | |
| AMD Ryzen 9 3950X | |
| AMD Ryzen 5 1600 | |
| AMD Ryzen 3 3100 | |
| AMD Ryzen 9 3900X | |
| AMD Ryzen 7 2700X | |
| 3DMark | |
| 2560x1440 Time Spy Graphics | |
| AMD Ryzen 9 5900X | |
| AMD Ryzen 7 3800XT | |
| AMD Ryzen 7 5800X | |
| AMD Ryzen 3 3300X | |
| Intel Core i9-10900K | |
| AMD Ryzen 9 3900X | |
| AMD Ryzen 5 1600 | |
| AMD Ryzen 3 3100 | |
| Intel Core i7-10700K | |
| AMD Ryzen 9 3950X | |
| AMD Ryzen 7 2700X | |
| 1280x720 Sky Diver Graphics | |
| Intel Core i7-10700K | |
| Intel Core i9-10900K | |
| AMD Ryzen 9 5900X | |
| AMD Ryzen 7 5800X | |
| AMD Ryzen 9 3900X | |
| AMD Ryzen 9 3950X | |
| AMD Ryzen 7 3800XT | |
| AMD Ryzen 3 3300X | |
| AMD Ryzen 7 2700X | |
| AMD Ryzen 5 1600 | |
| AMD Ryzen 3 3100 | |
| 1280x720 Cloud Gate Standard Graphics | |
| Intel Core i7-10700K | |
| Intel Core i9-10900K | |
| AMD Ryzen 7 5800X | |
| AMD Ryzen 9 5900X | |
| AMD Ryzen 9 3900X | |
| AMD Ryzen 9 3950X | |
| AMD Ryzen 7 3800XT | |
| AMD Ryzen 3 3300X | |
| AMD Ryzen 3 3100 | |
| AMD Ryzen 5 1600 | |
| AMD Ryzen 7 2700X | |
| 1920x1080 Fire Strike Graphics | |
| Intel Core i7-10700K | |
| AMD Ryzen 7 5800X | |
| Intel Core i9-10900K | |
| AMD Ryzen 3 3100 | |
| AMD Ryzen 3 3100 | |
| AMD Ryzen 3 3300X | |
| AMD Ryzen 7 3800XT | |
| AMD Ryzen 7 2700X | |
| AMD Ryzen 9 3900X | |
| AMD Ryzen 9 5900X | |
| AMD Ryzen 5 1600 | |
| AMD Ryzen 9 3950X | |
| Unigine Heaven 4.0 | |
| Extreme Preset DX11 | |
| AMD Ryzen 9 5900X | |
| AMD Ryzen 7 5800X | |
| AMD Ryzen 9 3900X | |
| AMD Ryzen 7 2700X | |
| Extreme Preset OpenGL | |
| AMD Ryzen 7 5800X | |
| AMD Ryzen 9 5900X | |
| AMD Ryzen 9 3900X | |
| AMD Ryzen 7 2700X | |
| Unigine Valley 1.0 | |
| 1920x1080 Extreme HD Preset OpenGL AA:x8 | |
| AMD Ryzen 9 5900X | |
| AMD Ryzen 7 5800X | |
| AMD Ryzen 9 3900X | |
| AMD Ryzen 7 2700X | |
| 1920x1080 Extreme HD DirectX AA:x8 | |
| AMD Ryzen 9 5900X | |
| AMD Ryzen 7 5800X | |
| AMD Ryzen 9 3900X | |
| AMD Ryzen 7 2700X | |
| Unigine Superposition | |
| 1280x720 720p Low | |
| AMD Ryzen 7 5800X | |
| AMD Ryzen 9 5900X | |
| AMD Ryzen 9 3900X | |
| 1920x1080 1080p Extreme | |
| AMD Ryzen 9 5900X | |
| AMD Ryzen 7 5800X | |
| AMD Ryzen 9 3900X | |
| 7680x4320 8k Optimized | |
| AMD Ryzen 9 5900X | |
| AMD Ryzen 7 5800X | |
| AMD Ryzen 9 3900X | |
| Borderlands 3 | |
| 1280x720 Very Low Overall Quality (DX11) | |
| AMD Ryzen 9 5900X, NVIDIA Titan RTX | |
| AMD Ryzen 7 5800X, NVIDIA Titan RTX | |
| Intel Core i9-10900K, NVIDIA Titan RTX | |
| Intel Core i7-10700K, NVIDIA Titan RTX | |
| AMD Ryzen 9 3900X, NVIDIA Titan RTX | |
| AMD Ryzen 9 3950X, NVIDIA Titan RTX | |
| AMD Ryzen 7 3800XT, NVIDIA Titan RTX | |
| AMD Ryzen 3 3300X, NVIDIA Titan RTX | |
| AMD Ryzen 3 3100, NVIDIA Titan RTX | |
| AMD Ryzen 5 1600, NVIDIA Titan RTX | |
| 1920x1080 Badass Overall Quality (DX11) | |
| AMD Ryzen 9 5900X, NVIDIA Titan RTX | |
| Intel Core i9-10900K, NVIDIA Titan RTX | |
| Intel Core i7-10700K, NVIDIA Titan RTX | |
| AMD Ryzen 7 3800XT, NVIDIA Titan RTX | |
| AMD Ryzen 7 5800X, NVIDIA Titan RTX | |
| AMD Ryzen 9 3900X, NVIDIA Titan RTX | |
| AMD Ryzen 9 3950X, NVIDIA Titan RTX | |
| AMD Ryzen 3 3300X, NVIDIA Titan RTX | |
| AMD Ryzen 3 3100, NVIDIA Titan RTX | |
| AMD Ryzen 5 1600, NVIDIA Titan RTX | |
| Metro Exodus | |
| 1280x720 Low Quality AF:4x | |
| AMD Ryzen 7 5800X, NVIDIA Titan RTX | |
| AMD Ryzen 9 5900X, NVIDIA Titan RTX | |
| Intel Core i9-10900K, NVIDIA Titan RTX | |
| Intel Core i7-10700K, NVIDIA Titan RTX | |
| AMD Ryzen 7 3800XT, NVIDIA Titan RTX | |
| AMD Ryzen 9 3900X, NVIDIA Titan RTX | |
| AMD Ryzen 3 3300X, NVIDIA Titan RTX | |
| AMD Ryzen 9 3950X, NVIDIA Titan RTX | |
| AMD Ryzen 3 3100, NVIDIA Titan RTX | |
| AMD Ryzen 5 1600, NVIDIA Titan RTX | |
| 1920x1080 Ultra Quality AF:16x | |
| Intel Core i7-10700K, NVIDIA Titan RTX | |
| Intel Core i9-10900K, NVIDIA Titan RTX | |
| AMD Ryzen 9 5900X, NVIDIA Titan RTX | |
| AMD Ryzen 7 5800X, NVIDIA Titan RTX | |
| AMD Ryzen 3 3300X, NVIDIA Titan RTX | |
| AMD Ryzen 7 3800XT, NVIDIA Titan RTX | |
| AMD Ryzen 9 3900X, NVIDIA Titan RTX | |
| AMD Ryzen 9 3950X, NVIDIA Titan RTX | |
| AMD Ryzen 3 3100, NVIDIA Titan RTX | |
| AMD Ryzen 5 1600, NVIDIA Titan RTX | |
| Far Cry New Dawn | |
| 1280x720 Low Preset | |
| AMD Ryzen 9 5900X, NVIDIA Titan RTX | |
| AMD Ryzen 7 5800X, NVIDIA Titan RTX | |
| Intel Core i7-10700K, NVIDIA Titan RTX | |
| Intel Core i9-10900K, NVIDIA Titan RTX | |
| AMD Ryzen 9 3900X, NVIDIA Titan RTX | |
| AMD Ryzen 7 3800XT, NVIDIA Titan RTX | |
| AMD Ryzen 9 3950X, NVIDIA Titan RTX | |
| AMD Ryzen 3 3300X, NVIDIA Titan RTX | |
| AMD Ryzen 5 1600, NVIDIA Titan RTX | |
| AMD Ryzen 3 3100, NVIDIA Titan RTX | |
| 1920x1080 Ultra Preset | |
| AMD Ryzen 9 5900X, NVIDIA Titan RTX | |
| Intel Core i7-10700K, NVIDIA Titan RTX | |
| AMD Ryzen 7 5800X, NVIDIA Titan RTX | |
| AMD Ryzen 7 3800XT, NVIDIA Titan RTX | |
| Intel Core i9-10900K, NVIDIA Titan RTX | |
| AMD Ryzen 9 3950X, NVIDIA Titan RTX | |
| AMD Ryzen 9 3900X, NVIDIA Titan RTX | |
| AMD Ryzen 3 3300X, NVIDIA Titan RTX | |
| AMD Ryzen 3 3100, NVIDIA Titan RTX | |
| AMD Ryzen 5 1600, NVIDIA Titan RTX | |
| Far Cry 5 | |
| 1280x720 Low Preset AA:T | |
| AMD Ryzen 9 5900X, NVIDIA Titan RTX | |
| AMD Ryzen 7 5800X, NVIDIA Titan RTX | |
| Intel Core i9-10900K, NVIDIA Titan RTX | |
| Intel Core i7-10700K, NVIDIA Titan RTX | |
| AMD Ryzen 9 3900X, NVIDIA Titan RTX | |
| AMD Ryzen 7 3800XT, NVIDIA Titan RTX | |
| AMD Ryzen 9 3950X, NVIDIA Titan RTX | |
| AMD Ryzen 3 3300X, NVIDIA Titan RTX | |
| AMD Ryzen 3 3100, NVIDIA Titan RTX | |
| AMD Ryzen 5 1600, NVIDIA Titan RTX | |
| 1920x1080 Ultra Preset AA:T | |
| AMD Ryzen 9 5900X, NVIDIA Titan RTX | |
| AMD Ryzen 7 5800X, NVIDIA Titan RTX | |
| Intel Core i7-10700K, NVIDIA Titan RTX | |
| Intel Core i9-10900K, NVIDIA Titan RTX | |
| AMD Ryzen 9 3900X, NVIDIA Titan RTX | |
| AMD Ryzen 7 3800XT, NVIDIA Titan RTX | |
| AMD Ryzen 9 3950X, NVIDIA Titan RTX | |
| AMD Ryzen 3 3300X, NVIDIA Titan RTX | |
| AMD Ryzen 3 3100, NVIDIA Titan RTX | |
| AMD Ryzen 5 1600, NVIDIA Titan RTX | |
| X-Plane 11.11 | |
| 1280x720 low (fps_test=1) | |
| AMD Ryzen 7 5800X, NVIDIA Titan RTX | |
| AMD Ryzen 9 5900X, NVIDIA Titan RTX | |
| Intel Core i9-10900K, NVIDIA Titan RTX | |
| Intel Core i7-10700K, NVIDIA Titan RTX | |
| AMD Ryzen 7 3800XT, NVIDIA Titan RTX | |
| AMD Ryzen 9 3900X, NVIDIA Titan RTX | |
| AMD Ryzen 9 3950X, NVIDIA Titan RTX | |
| AMD Ryzen 3 3300X, NVIDIA Titan RTX | |
| AMD Ryzen 3 3100, NVIDIA Titan RTX | |
| AMD Ryzen 5 1600, NVIDIA Titan RTX | |
| 1920x1080 high (fps_test=3) | |
| AMD Ryzen 9 5900X, NVIDIA Titan RTX | |
| AMD Ryzen 7 5800X, NVIDIA Titan RTX | |
| Intel Core i9-10900K, NVIDIA Titan RTX | |
| Intel Core i7-10700K, NVIDIA Titan RTX | |
| AMD Ryzen 7 3800XT, NVIDIA Titan RTX | |
| AMD Ryzen 9 3900X, NVIDIA Titan RTX | |
| AMD Ryzen 9 3950X, NVIDIA Titan RTX | |
| AMD Ryzen 3 3300X, NVIDIA Titan RTX | |
| AMD Ryzen 3 3100, NVIDIA Titan RTX | |
| AMD Ryzen 5 1600, NVIDIA Titan RTX | |
| Final Fantasy XV Benchmark | |
| 1280x720 Lite Quality | |
| AMD Ryzen 9 5900X, NVIDIA Titan RTX | |
| AMD Ryzen 7 5800X, NVIDIA Titan RTX | |
| Intel Core i9-10900K, NVIDIA Titan RTX | |
| Intel Core i7-10700K, NVIDIA Titan RTX | |
| AMD Ryzen 7 3800XT, NVIDIA Titan RTX | |
| AMD Ryzen 9 3950X, NVIDIA Titan RTX | |
| AMD Ryzen 9 3900X, NVIDIA Titan RTX | |
| AMD Ryzen 3 3300X, NVIDIA Titan RTX | |
| AMD Ryzen 3 3100, NVIDIA Titan RTX | |
| AMD Ryzen 5 1600, NVIDIA Titan RTX | |
| 1920x1080 High Quality | |
| Intel Core i9-10900K, NVIDIA Titan RTX | |
| AMD Ryzen 7 5800X, NVIDIA Titan RTX | |
| AMD Ryzen 9 5900X, NVIDIA Titan RTX | |
| Intel Core i7-10700K, NVIDIA Titan RTX | |
| AMD Ryzen 9 3950X, NVIDIA Titan RTX | |
| AMD Ryzen 9 3900X, NVIDIA Titan RTX | |
| AMD Ryzen 7 3800XT, NVIDIA Titan RTX | |
| AMD Ryzen 3 3300X, NVIDIA Titan RTX | |
| AMD Ryzen 5 1600, NVIDIA Titan RTX | |
| AMD Ryzen 3 3100, NVIDIA Titan RTX | |
| Dota 2 Reborn | |
| 1280x720 min (0/3) fastest | |
| AMD Ryzen 7 5800X, NVIDIA Titan RTX | |
| AMD Ryzen 9 5900X, NVIDIA Titan RTX | |
| Intel Core i9-10900K, NVIDIA Titan RTX | |
| Intel Core i7-10700K, NVIDIA Titan RTX | |
| AMD Ryzen 7 3800XT, NVIDIA Titan RTX | |
| AMD Ryzen 9 3900X, NVIDIA Titan RTX | |
| AMD Ryzen 9 3950X, NVIDIA Titan RTX | |
| AMD Ryzen 3 3300X, NVIDIA Titan RTX | |
| AMD Ryzen 5 1600, NVIDIA Titan RTX | |
| AMD Ryzen 3 3100, NVIDIA Titan RTX | |
| 1920x1080 ultra (3/3) best looking | |
| AMD Ryzen 7 5800X, NVIDIA Titan RTX | |
| AMD Ryzen 9 5900X, NVIDIA Titan RTX | |
| Intel Core i9-10900K, NVIDIA Titan RTX | |
| Intel Core i7-10700K, NVIDIA Titan RTX | |
| AMD Ryzen 7 3800XT, NVIDIA Titan RTX | |
| AMD Ryzen 9 3900X, NVIDIA Titan RTX | |
| AMD Ryzen 9 3950X, NVIDIA Titan RTX | |
| AMD Ryzen 3 3300X, NVIDIA Titan RTX | |
| AMD Ryzen 5 1600, NVIDIA Titan RTX | |
| AMD Ryzen 3 3100, NVIDIA Titan RTX | |
| The Witcher 3 | |
| 1024x768 Low Graphics & Postprocessing | |
| AMD Ryzen 9 5900X, NVIDIA Titan RTX | |
| AMD Ryzen 7 5800X, NVIDIA Titan RTX | |
| Intel Core i9-10900K, NVIDIA Titan RTX | |
| Intel Core i7-10700K, NVIDIA Titan RTX | |
| AMD Ryzen 9 3900X, NVIDIA Titan RTX | |
| AMD Ryzen 7 3800XT, NVIDIA Titan RTX | |
| AMD Ryzen 9 3950X, NVIDIA Titan RTX | |
| AMD Ryzen 3 3300X, NVIDIA Titan RTX | |
| AMD Ryzen 5 1600, NVIDIA Titan RTX | |
| AMD Ryzen 3 3100, NVIDIA Titan RTX | |
| 1920x1080 Ultra Graphics & Postprocessing (HBAO+) | |
| Intel Core i7-10700K, NVIDIA Titan RTX | |
| AMD Ryzen 9 5900X, NVIDIA Titan RTX | |
| Intel Core i9-10900K, NVIDIA Titan RTX | |
| AMD Ryzen 7 3800XT, NVIDIA Titan RTX | |
| AMD Ryzen 7 5800X, NVIDIA Titan RTX | |
| AMD Ryzen 9 3900X, NVIDIA Titan RTX | |
| AMD Ryzen 5 1600, NVIDIA Titan RTX | |
| AMD Ryzen 9 3950X, NVIDIA Titan RTX | |
| AMD Ryzen 3 3300X, NVIDIA Titan RTX | |
| AMD Ryzen 3 3100, NVIDIA Titan RTX | |
| Shadow of the Tomb Raider | |
| 1280x720 Lowest Preset | |
| AMD Ryzen 7 5800X, NVIDIA Titan RTX | |
| AMD Ryzen 9 5900X, NVIDIA Titan RTX | |
| Intel Core i9-10900K, NVIDIA Titan RTX | |
| AMD Ryzen 9 3950X, NVIDIA Titan RTX | |
| AMD Ryzen 7 3800XT, NVIDIA Titan RTX | |
| AMD Ryzen 9 3900X, NVIDIA Titan RTX | |
| AMD Ryzen 3 3300X, NVIDIA Titan RTX | |
| AMD Ryzen 3 3100, NVIDIA Titan RTX | |
| AMD Ryzen 5 1600, NVIDIA Titan RTX | |
| 1920x1080 Highest Preset AA:T | |
| AMD Ryzen 7 5800X, NVIDIA Titan RTX | |
| AMD Ryzen 9 5900X, NVIDIA Titan RTX | |
| Intel Core i9-10900K, NVIDIA Titan RTX | |
| AMD Ryzen 7 3800XT, NVIDIA Titan RTX | |
| AMD Ryzen 9 3950X, NVIDIA Titan RTX | |
| AMD Ryzen 3 3300X, NVIDIA Titan RTX | |
| AMD Ryzen 9 3900X, NVIDIA Titan RTX | |
| AMD Ryzen 3 3100, NVIDIA Titan RTX | |
| AMD Ryzen 5 1600, NVIDIA Titan RTX | |
| Strange Brigade | |
| 1280x720 lowest AF:1 | |
| AMD Ryzen 7 5800X, NVIDIA Titan RTX | |
| AMD Ryzen 9 5900X, NVIDIA Titan RTX | |
| Intel Core i7-10700K, NVIDIA Titan RTX | |
| AMD Ryzen 9 3900X, NVIDIA Titan RTX | |
| 1920x1080 ultra AA:ultra AF:16 | |
| AMD Ryzen 9 5900X, NVIDIA Titan RTX | |
| AMD Ryzen 7 5800X, NVIDIA Titan RTX | |
| Intel Core i7-10700K, NVIDIA Titan RTX | |
| AMD Ryzen 9 3900X, NVIDIA Titan RTX | |
| GTA V | |
| 1024x768 Lowest Settings possible | |
| Intel Core i7-10700K, NVIDIA Titan RTX | |
| AMD Ryzen 9 5900X, NVIDIA Titan RTX | |
| AMD Ryzen 7 5800X, NVIDIA Titan RTX | |
| 1920x1080 Highest AA:4xMSAA + FX AF:16x | |
| AMD Ryzen 9 5900X, NVIDIA Titan RTX | |
| AMD Ryzen 7 5800X, NVIDIA Titan RTX | |
| Intel Core i7-10700K, NVIDIA Titan RTX | |
Ryzen 9 5900X mit Nvidia Titan RTX
| baixo | média | alto | ultra | QHD | 4K | |
|---|---|---|---|---|---|---|
| GTA V (2015) | 187 | 186 | 184 | 128 | 115 | 134 |
| The Witcher 3 (2015) | 617 | 437 | 276 | 141 | 104 | |
| Dota 2 Reborn (2015) | 232.6 | 208.7 | 199.4 | 180.3 | 172.1 | |
| Final Fantasy XV Benchmark (2018) | 225 | 182 | 139 | 105 | 63.6 | |
| X-Plane 11.11 (2018) | 177 | 158 | 130 | 111 | ||
| Far Cry 5 (2018) | 212 | 184 | 173 | 161 | 136 | 81 |
| Strange Brigade (2018) | 607 | 352 | 287 | 243 | 183 | 110 |
| Shadow of the Tomb Raider (2018) | 225 | 183 | 177 | 166 | 120 | 66.3 |
| Far Cry New Dawn (2019) | 176 | 152 | 147 | 131 | 121 | 84 |
| Metro Exodus (2019) | 241 | 173 | 133 | 106 | 84.9 | 54.9 |
| Borderlands 3 (2019) | 229 | 187 | 144 | 118 | 84.7 | 46.7 |
| Crysis Remastered (2020) | 273 | 74.5 | 212 | 115 | 90.9 | 48.9 |
| Dirt 5 (2020) | 187 | 128 | 106 | 95.9 | 79.5 | 57 |
| Assassin´s Creed Valhalla (2020) | 137 | 104 | 88 | 80 | 66 | 43 |
| Call of Duty Black Ops Cold War (2020) | 254 | 238 | 162 | 144 | 87.6 | 52.9 |
| Yakuza Like a Dragon (2020) | 119 | 117 | 116 | 111 | 100 | 55.2 |
| Immortals Fenyx Rising (2020) | 136 | 106 | 93 | 71 | 64 | 48 |
| Cyberpunk 2077 1.0 (2020) | 109 | 103 | 93.2 | 82.3 | 58.4 | 30.9 |
| Hitman 3 (2021) | 271 | 222 | 210 | 202 | 145 | 82 |
| Outriders (2021) | 136 | 162 | 158 | 156 | 119 | 64 |
| Resident Evil Village (2021) | 304 | 264 | 241 | 212 | 142 | 74.2 |
| Mass Effect Legendary Edition (2021) | 106 | 113 | 107 | 106 | ||
| Days Gone (2021) | 190 | 181 | 174 | 141 | 108 | 64.9 |
| Monster Hunter Stories 2 (2021) | 144 | 144 | 144 | 144 | 144 | |
| F1 2021 (2021) | 451 | 388 | 331 | 165 | 126 | 74.3 |
| Deathloop (2021) | 128 | 125 | 124 | 119 | 91.6 | 51.8 |
| New World (2021) | 180 | 139 | 131 | 123 | 101 | 54.5 |
| Alan Wake Remastered (2021) | 93.1 | 88.3 | 88.4 | 88.5 | ||
| Far Cry 6 (2021) | 143 | 106 | 95.8 | 94.7 | 80.9 | 52.8 |
| Back 4 Blood (2021) | 294 | 270 | 255 | 182 | 101 | |
| Guardians of the Galaxy (2021) | 135 | 134 | 134 | 133 | 131 | 82 |
| Riders Republic (2021) | 221 | 179 | 152 | 143 | 109 | 65 |
| Call of Duty Vanguard (2021) | 113 | 153 | 144 | 133 | 100 | 59.6 |
| Forza Horizon 5 (2021) | 237 | 161 | 148 | 96 | 84 | 62 |
| Battlefield 2042 (2021) | 99.3 | 139 | 129 | 117 | 93.6 | 60.2 |
| Farming Simulator 22 (2021) | 279 | 221 | 186 | 164 | 163 | 122 |
| Halo Infinite (2021) | 144 | 125 | 119 | 95.5 | 68.8 | |
| God of War (2022) | 174 | 149 | 124 | 89 | 72.8 | 48.9 |
| Rainbow Six Extraction (2022) | 264 | 225 | 223 | 179 | 130 | 70 |
| Dying Light 2 (2022) | 169 | 110 | 93.6 | 66.5 | 37.1 | |
| GRID Legends (2022) | 215.9 | 195.2 | 172.8 | 132.5 | 112.2 | 78.6 |
| Elden Ring (2022) | 59.9 | 59.9 | 59.7 | 59.9 | 59.9 | 59.6 |
| Cyberpunk 2077 1.6 (2022) | 78.9 | 78.7 | 78.6 | 78.3 | 66.2 | 32.8 |
| Elex 2 (2022) | 111 | 105 | 98 | 95.4 | 81.2 | 47.7 |
| Ghostwire Tokyo (2022) | 205 | 196.8 | 203 | 202 | 141 | 73.3 |
| Tiny Tina's Wonderlands (2022) | 245 | 201 | 151.3 | 124.3 | 92.4 | 50.4 |
| Vampire Bloodhunt (2022) | 391 | 267 | 252 | 244 | 173.2 | 93.6 |
Ryzen 7 5800X mit Nvidia Titan RTX
| baixo | média | alto | ultra | QHD | 4K | |
|---|---|---|---|---|---|---|
| GTA V (2015) | 187 | 187 | 184 | 123 | 112 | 125 |
| The Witcher 3 (2015) | 602 | 431 | 274 | 139 | 102 | |
| Dota 2 Reborn (2015) | 242.5 | 213.8 | 204 | 186.8 | 175.6 | |
| Final Fantasy XV Benchmark (2018) | 225 | 184 | 140 | 106 | 63.1 | |
| X-Plane 11.11 (2018) | 178 | 158 | 128 | 109 | ||
| Far Cry 5 (2018) | 207 | 177 | 168 | 158 | 134 | 79 |
| Strange Brigade (2018) | 662 | 352 | 288 | 242 | 183 | 110 |
| Shadow of the Tomb Raider (2018) | 230 | 193 | 183 | 170 | 121 | 66.3 |
| Far Cry New Dawn (2019) | 166 | 145 | 140 | 124 | 115 | 82 |
| Metro Exodus (2019) | 251 | 172 | 133 | 106 | 84.7 | 54.9 |
| Borderlands 3 (2019) | 221 | 183 | 141 | 116 | 83.8 | 46.3 |
Desempenho de aplicação
Considerando que os novos processadores Vermeer são as CPUs mais rápidas atualmente disponíveis, não deve ser uma surpresa que o desempenho das aplicações diárias tenha sido impecável. Usamos um SSD Intel Optane 905p para nossos testes, que continha o sistema operacional, bem como alguns benchmarks sintéticos.
Assim como nos testes de CPU, ambas as nossas amostras de teste conseguiram garantir os dois primeiros pontos em quase todos os benchmarks de aplicação. Eles conseguiram até mesmo encontrar algum desempenho extra no teste de renderização. As melhorias de desempenho de até 20% não foram exceção.
O rei da colina em PCMark 10, AMD's Ryzen 9 3950XA empresa foi superada por margens significativas Core i9-10900K da Intel não teve nenhuma chance de se manter e teve um desempenho 11% mais lento que o do Ryzen 9 5900X da AMD e um pouco melhor e ainda assim 8% mais lento que o do Ryzen 7 5800X da AMD.
| PCMark 10 - Score | |
| AMD Ryzen 9 5900X, NVIDIA Titan RTX | |
| AMD Ryzen 7 5800X, NVIDIA Titan RTX | |
| AMD Ryzen 9 3950X, NVIDIA Titan RTX | |
| AMD Ryzen 7 3800XT, NVIDIA Titan RTX | |
| Intel Core i9-10900K, NVIDIA Titan RTX | |
| Intel Core i7-10700K, NVIDIA Titan RTX | |
| AMD Ryzen 9 3900X, NVIDIA Titan RTX | |
| AMD Ryzen 3 3300X, NVIDIA Titan RTX | |
| AMD Ryzen 3 3100, NVIDIA Titan RTX | |
| AMD Ryzen 5 1600, NVIDIA Titan RTX | |
| PCMark 8 | |
| Work Score Accelerated v2 | |
| AMD Ryzen 7 5800X, NVIDIA Titan RTX | |
| AMD Ryzen 9 3950X, NVIDIA Titan RTX | |
| AMD Ryzen 7 3800XT, NVIDIA Titan RTX | |
| AMD Ryzen 9 5900X, NVIDIA Titan RTX | |
| AMD Ryzen 3 3300X, NVIDIA Titan RTX | |
| AMD Ryzen 9 3900X, NVIDIA Titan RTX | |
| Intel Core i9-10900K, NVIDIA Titan RTX | |
| Intel Core i7-10700K, NVIDIA Titan RTX | |
| AMD Ryzen 3 3100, NVIDIA Titan RTX | |
| AMD Ryzen 5 1600, NVIDIA Titan RTX | |
| Creative Score Accelerated v2 | |
| AMD Ryzen 7 5800X, NVIDIA Titan RTX | |
| AMD Ryzen 9 5900X, NVIDIA Titan RTX | |
| AMD Ryzen 7 3800XT, NVIDIA Titan RTX | |
| AMD Ryzen 9 3950X, NVIDIA Titan RTX | |
| AMD Ryzen 9 3900X, NVIDIA Titan RTX | |
| AMD Ryzen 3 3300X, NVIDIA Titan RTX | |
| Intel Core i9-10900K, NVIDIA Titan RTX | |
| Intel Core i7-10700K, NVIDIA Titan RTX | |
| AMD Ryzen 3 3100, NVIDIA Titan RTX | |
| AMD Ryzen 5 1600, NVIDIA Titan RTX | |
| Home Score Accelerated v2 | |
| AMD Ryzen 7 5800X, NVIDIA Titan RTX | |
| AMD Ryzen 9 5900X, NVIDIA Titan RTX | |
| AMD Ryzen 7 3800XT, NVIDIA Titan RTX | |
| AMD Ryzen 3 3300X, NVIDIA Titan RTX | |
| AMD Ryzen 9 3950X, NVIDIA Titan RTX | |
| AMD Ryzen 9 3900X, NVIDIA Titan RTX | |
| Intel Core i9-10900K, NVIDIA Titan RTX | |
| Intel Core i7-10700K, NVIDIA Titan RTX | |
| AMD Ryzen 3 3100, NVIDIA Titan RTX | |
| AMD Ryzen 5 1600, NVIDIA Titan RTX | |
| SPECviewperf 12 | |
| 1900x1060 Solidworks (sw-03) | |
| AMD Ryzen 7 5800X, NVIDIA Titan RTX | |
| AMD Ryzen 9 5900X, NVIDIA Titan RTX | |
| Intel Core i9-10900K, NVIDIA Titan RTX | |
| Intel Core i7-10700K, NVIDIA Titan RTX | |
| AMD Ryzen 7 3800XT, NVIDIA Titan RTX | |
| AMD Ryzen 9 3950X, NVIDIA Titan RTX | |
| AMD Ryzen 9 3900X, NVIDIA Titan RTX | |
| AMD Ryzen 3 3300X, NVIDIA Titan RTX | |
| AMD Ryzen 7 2700X, NVIDIA Titan RTX | |
| AMD Ryzen 5 1600, NVIDIA Titan RTX | |
| AMD Ryzen 3 3100, NVIDIA Titan RTX | |
| 1900x1060 Siemens NX (snx-02) | |
| Intel Core i7-10700K, NVIDIA Titan RTX | |
| AMD Ryzen 9 5900X, NVIDIA Titan RTX | |
| AMD Ryzen 7 5800X, NVIDIA Titan RTX | |
| AMD Ryzen 9 3900X, NVIDIA Titan RTX | |
| Intel Core i9-10900K, NVIDIA Titan RTX | |
| AMD Ryzen 7 3800XT, NVIDIA Titan RTX | |
| AMD Ryzen 7 2700X, NVIDIA Titan RTX | |
| AMD Ryzen 9 3950X, NVIDIA Titan RTX | |
| AMD Ryzen 3 3300X, NVIDIA Titan RTX | |
| AMD Ryzen 5 1600, NVIDIA Titan RTX | |
| AMD Ryzen 3 3100, NVIDIA Titan RTX | |
| 1900x1060 Showcase (showcase-01) | |
| Intel Core i7-10700K, NVIDIA Titan RTX | |
| Intel Core i9-10900K, NVIDIA Titan RTX | |
| AMD Ryzen 7 2700X, NVIDIA Titan RTX | |
| AMD Ryzen 9 5900X, NVIDIA Titan RTX | |
| AMD Ryzen 9 3900X, NVIDIA Titan RTX | |
| AMD Ryzen 7 5800X, NVIDIA Titan RTX | |
| AMD Ryzen 3 3300X, NVIDIA Titan RTX | |
| AMD Ryzen 5 1600, NVIDIA Titan RTX | |
| AMD Ryzen 7 3800XT, NVIDIA Titan RTX | |
| AMD Ryzen 9 3950X, NVIDIA Titan RTX | |
| AMD Ryzen 3 3100, NVIDIA Titan RTX | |
| 1900x1060 Medical (medical-01) | |
| Intel Core i9-10900K, NVIDIA Titan RTX | |
| Intel Core i7-10700K, NVIDIA Titan RTX | |
| AMD Ryzen 9 5900X, NVIDIA Titan RTX | |
| AMD Ryzen 7 3800XT, NVIDIA Titan RTX | |
| AMD Ryzen 7 5800X, NVIDIA Titan RTX | |
| AMD Ryzen 9 3950X, NVIDIA Titan RTX | |
| AMD Ryzen 3 3300X, NVIDIA Titan RTX | |
| AMD Ryzen 5 1600, NVIDIA Titan RTX | |
| AMD Ryzen 7 2700X, NVIDIA Titan RTX | |
| AMD Ryzen 9 3900X, NVIDIA Titan RTX | |
| AMD Ryzen 3 3100, NVIDIA Titan RTX | |
| 1900x1060 Maya (maya-04) | |
| AMD Ryzen 7 5800X, NVIDIA Titan RTX | |
| Intel Core i9-10900K, NVIDIA Titan RTX | |
| AMD Ryzen 9 5900X, NVIDIA Titan RTX | |
| Intel Core i7-10700K, NVIDIA Titan RTX | |
| AMD Ryzen 7 3800XT, NVIDIA Titan RTX | |
| AMD Ryzen 9 3950X, NVIDIA Titan RTX | |
| AMD Ryzen 3 3300X, NVIDIA Titan RTX | |
| AMD Ryzen 9 3900X, NVIDIA Titan RTX | |
| AMD Ryzen 7 2700X, NVIDIA Titan RTX | |
| AMD Ryzen 3 3100, NVIDIA Titan RTX | |
| AMD Ryzen 5 1600, NVIDIA Titan RTX | |
| 1900x1060 Energy (energy-01) | |
| Intel Core i9-10900K, NVIDIA Titan RTX | |
| Intel Core i7-10700K, NVIDIA Titan RTX | |
| AMD Ryzen 9 5900X, NVIDIA Titan RTX | |
| AMD Ryzen 5 1600, NVIDIA Titan RTX | |
| AMD Ryzen 7 3800XT, NVIDIA Titan RTX | |
| AMD Ryzen 9 3950X, NVIDIA Titan RTX | |
| AMD Ryzen 3 3300X, NVIDIA Titan RTX | |
| AMD Ryzen 7 2700X, NVIDIA Titan RTX | |
| AMD Ryzen 3 3100, NVIDIA Titan RTX | |
| AMD Ryzen 7 5800X, NVIDIA Titan RTX | |
| AMD Ryzen 9 3900X, NVIDIA Titan RTX | |
| 1900x1060 Creo (creo-01) | |
| AMD Ryzen 7 5800X, NVIDIA Titan RTX | |
| AMD Ryzen 9 5900X, NVIDIA Titan RTX | |
| Intel Core i9-10900K, NVIDIA Titan RTX | |
| Intel Core i7-10700K, NVIDIA Titan RTX | |
| AMD Ryzen 7 3800XT, NVIDIA Titan RTX | |
| AMD Ryzen 9 3950X, NVIDIA Titan RTX | |
| AMD Ryzen 9 3900X, NVIDIA Titan RTX | |
| AMD Ryzen 3 3300X, NVIDIA Titan RTX | |
| AMD Ryzen 3 3100, NVIDIA Titan RTX | |
| AMD Ryzen 5 1600, NVIDIA Titan RTX | |
| AMD Ryzen 7 2700X, NVIDIA Titan RTX | |
| 1900x1060 Catia (catia-04) | |
| AMD Ryzen 7 5800X, NVIDIA Titan RTX | |
| AMD Ryzen 9 5900X, NVIDIA Titan RTX | |
| Intel Core i9-10900K, NVIDIA Titan RTX | |
| AMD Ryzen 7 3800XT, NVIDIA Titan RTX | |
| AMD Ryzen 9 3950X, NVIDIA Titan RTX | |
| AMD Ryzen 9 3900X, NVIDIA Titan RTX | |
| Intel Core i7-10700K, NVIDIA Titan RTX | |
| AMD Ryzen 3 3300X, NVIDIA Titan RTX | |
| AMD Ryzen 7 2700X, NVIDIA Titan RTX | |
| AMD Ryzen 3 3100, NVIDIA Titan RTX | |
| AMD Ryzen 5 1600, NVIDIA Titan RTX | |
| 1900x1060 3ds Max (3dsmax-05) | |
| Intel Core i9-10900K, NVIDIA Titan RTX | |
| AMD Ryzen 7 5800X, NVIDIA Titan RTX | |
| Intel Core i7-10700K, NVIDIA Titan RTX | |
| AMD Ryzen 9 5900X, NVIDIA Titan RTX | |
| AMD Ryzen 9 3900X, NVIDIA Titan RTX | |
| AMD Ryzen 7 3800XT, NVIDIA Titan RTX | |
| AMD Ryzen 9 3950X, NVIDIA Titan RTX | |
| AMD Ryzen 7 2700X, NVIDIA Titan RTX | |
| AMD Ryzen 3 3300X, NVIDIA Titan RTX | |
| AMD Ryzen 3 3100, NVIDIA Titan RTX | |
| AMD Ryzen 5 1600, NVIDIA Titan RTX | |
| SPECviewperf 13 | |
| Solidworks (sw-04) | |
| AMD Ryzen 7 5800X, NVIDIA Titan RTX | |
| AMD Ryzen 9 5900X, NVIDIA Titan RTX | |
| Intel Core i9-10900K, NVIDIA Titan RTX | |
| Intel Core i7-10700K, NVIDIA Titan RTX | |
| AMD Ryzen 7 3800XT, NVIDIA Titan RTX | |
| AMD Ryzen 9 3950X, NVIDIA Titan RTX | |
| AMD Ryzen 9 3900X, NVIDIA Titan RTX | |
| AMD Ryzen 3 3300X, NVIDIA Titan RTX | |
| AMD Ryzen 7 2700X, NVIDIA Titan RTX | |
| AMD Ryzen 3 3100, NVIDIA Titan RTX | |
| AMD Ryzen 5 1600, NVIDIA Titan RTX | |
| Siemens NX (snx-03) | |
| Intel Core i7-10700K, NVIDIA Titan RTX | |
| AMD Ryzen 9 5900X, NVIDIA Titan RTX | |
| AMD Ryzen 7 5800X, NVIDIA Titan RTX | |
| AMD Ryzen 9 3900X, NVIDIA Titan RTX | |
| Intel Core i9-10900K, NVIDIA Titan RTX | |
| AMD Ryzen 7 3800XT, NVIDIA Titan RTX | |
| AMD Ryzen 7 2700X, NVIDIA Titan RTX | |
| AMD Ryzen 9 3950X, NVIDIA Titan RTX | |
| AMD Ryzen 3 3300X, NVIDIA Titan RTX | |
| AMD Ryzen 5 1600, NVIDIA Titan RTX | |
| AMD Ryzen 3 3100, NVIDIA Titan RTX | |
| Showcase (showcase-02) | |
| Intel Core i7-10700K, NVIDIA Titan RTX | |
| Intel Core i9-10900K, NVIDIA Titan RTX | |
| AMD Ryzen 7 2700X, NVIDIA Titan RTX | |
| AMD Ryzen 7 5800X, NVIDIA Titan RTX | |
| AMD Ryzen 9 3900X, NVIDIA Titan RTX | |
| AMD Ryzen 9 5900X, NVIDIA Titan RTX | |
| AMD Ryzen 3 3300X, NVIDIA Titan RTX | |
| AMD Ryzen 5 1600, NVIDIA Titan RTX | |
| AMD Ryzen 7 3800XT, NVIDIA Titan RTX | |
| AMD Ryzen 9 3950X, NVIDIA Titan RTX | |
| AMD Ryzen 3 3100, NVIDIA Titan RTX | |
| Medical (medical-02) | |
| AMD Ryzen 9 5900X, NVIDIA Titan RTX | |
| AMD Ryzen 7 5800X, NVIDIA Titan RTX | |
| Intel Core i7-10700K, NVIDIA Titan RTX | |
| AMD Ryzen 7 3800XT, NVIDIA Titan RTX | |
| AMD Ryzen 9 3950X, NVIDIA Titan RTX | |
| AMD Ryzen 9 3900X, NVIDIA Titan RTX | |
| AMD Ryzen 7 2700X, NVIDIA Titan RTX | |
| AMD Ryzen 3 3300X, NVIDIA Titan RTX | |
| Intel Core i9-10900K, NVIDIA Titan RTX | |
| AMD Ryzen 3 3100, NVIDIA Titan RTX | |
| AMD Ryzen 5 1600, NVIDIA Titan RTX | |
| Maya (maya-05) | |
| AMD Ryzen 7 5800X, NVIDIA Titan RTX | |
| AMD Ryzen 9 5900X, NVIDIA Titan RTX | |
| AMD Ryzen 7 3800XT, NVIDIA Titan RTX | |
| Intel Core i7-10700K, NVIDIA Titan RTX | |
| Intel Core i9-10900K, NVIDIA Titan RTX | |
| AMD Ryzen 9 3900X, NVIDIA Titan RTX | |
| AMD Ryzen 9 3950X, NVIDIA Titan RTX | |
| AMD Ryzen 7 2700X, NVIDIA Titan RTX | |
| AMD Ryzen 3 3300X, NVIDIA Titan RTX | |
| AMD Ryzen 3 3100, NVIDIA Titan RTX | |
| AMD Ryzen 5 1600, NVIDIA Titan RTX | |
| Energy (energy-02) | |
| AMD Ryzen 5 1600, NVIDIA Titan RTX | |
| AMD Ryzen 3 3100, NVIDIA Titan RTX | |
| AMD Ryzen 3 3300X, NVIDIA Titan RTX | |
| Intel Core i9-10900K, NVIDIA Titan RTX | |
| AMD Ryzen 9 3950X, NVIDIA Titan RTX | |
| AMD Ryzen 7 3800XT, NVIDIA Titan RTX | |
| Intel Core i7-10700K, NVIDIA Titan RTX | |
| AMD Ryzen 9 3900X, NVIDIA Titan RTX | |
| AMD Ryzen 7 5800X, NVIDIA Titan RTX | |
| AMD Ryzen 9 5900X, NVIDIA Titan RTX | |
| AMD Ryzen 7 2700X, NVIDIA Titan RTX | |
| Creo (creo-02) | |
| Intel Core i7-10700K, NVIDIA Titan RTX | |
| AMD Ryzen 7 5800X, NVIDIA Titan RTX | |
| AMD Ryzen 9 5900X, NVIDIA Titan RTX | |
| AMD Ryzen 9 3900X, NVIDIA Titan RTX | |
| AMD Ryzen 7 3800XT, NVIDIA Titan RTX | |
| Intel Core i9-10900K, NVIDIA Titan RTX | |
| AMD Ryzen 9 3950X, NVIDIA Titan RTX | |
| AMD Ryzen 3 3300X, NVIDIA Titan RTX | |
| AMD Ryzen 7 2700X, NVIDIA Titan RTX | |
| AMD Ryzen 3 3100, NVIDIA Titan RTX | |
| AMD Ryzen 5 1600, NVIDIA Titan RTX | |
| Catia (catia-05) | |
| AMD Ryzen 7 5800X, NVIDIA Titan RTX | |
| AMD Ryzen 9 5900X, NVIDIA Titan RTX | |
| AMD Ryzen 7 3800XT, NVIDIA Titan RTX | |
| Intel Core i9-10900K, NVIDIA Titan RTX | |
| AMD Ryzen 9 3950X, NVIDIA Titan RTX | |
| Intel Core i7-10700K, NVIDIA Titan RTX | |
| AMD Ryzen 9 3900X, NVIDIA Titan RTX | |
| AMD Ryzen 3 3300X, NVIDIA Titan RTX | |
| AMD Ryzen 7 2700X, NVIDIA Titan RTX | |
| AMD Ryzen 3 3100, NVIDIA Titan RTX | |
| AMD Ryzen 5 1600, NVIDIA Titan RTX | |
| 3ds Max (3dsmax-06) | |
| AMD Ryzen 7 5800X, NVIDIA Titan RTX | |
| Intel Core i9-10900K, NVIDIA Titan RTX | |
| AMD Ryzen 9 5900X, NVIDIA Titan RTX | |
| Intel Core i7-10700K, NVIDIA Titan RTX | |
| AMD Ryzen 9 3900X, NVIDIA Titan RTX | |
| AMD Ryzen 9 3950X, NVIDIA Titan RTX | |
| AMD Ryzen 7 3800XT, NVIDIA Titan RTX | |
| AMD Ryzen 7 2700X, NVIDIA Titan RTX | |
| AMD Ryzen 3 3300X, NVIDIA Titan RTX | |
| AMD Ryzen 3 3100, NVIDIA Titan RTX | |
| AMD Ryzen 5 1600, NVIDIA Titan RTX | |
* ... menor é melhor
Consumo de energia
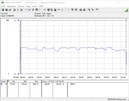
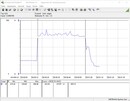
Oficialmente, a AMD especifica tanto o Ryzen 9 5900X quanto o Ryzen 7 5800X com um TDP de 105 W. Entretanto, já sabemos de seu predecessor que esta especificação oficial não é mais do que um estádio de bolas em bruto, e no passado, vimos picos de até 142 W. O mesmo é basicamente verdade para as novas CPUs Ryzen, assim como é permitido o consumo de até 142 W graças ao PBO2 (Precision Boost 2) com uma temperatura tCase de não mais do que 61,8 °C. ONúcleo i9-10900K é especificado com até 250 W. Considerando que a AMD não criou uma nova especificação de plataforma para acompanhar as CPUs Vermeer, podemos esperar que todas as outras especificações relativas ao consumo de energia permaneçam inalteradas. O Zen 3 deve, portanto, consumir cerca de tanta energia quanto o Zen 2. Entretanto, nossos próprios testes revelaram que tanto o Ryzen 9 5900X quanto o Ryzen 7 5800X requerem um pouco mais de energia do que oRyzen 9 3950X mas menos do que o Core i9-10900K. Este último exigiu cerca de 14% a mais de energia durante nosso teste de estresse e o teste multi-tarefa CineBench R15. A maré virou a favor do Core i9-10900K da Intel em nossos benchmarks de jogo onde era cerca de 11% mais eficiente em termos de energia do que o Ryzen 9 5900X quando equipado com a GPU idêntica.
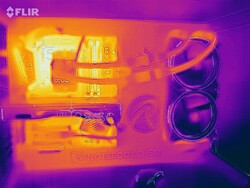
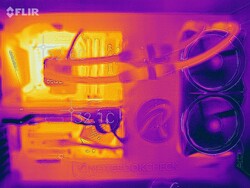
Nenhuma de nossas duas amostras de teste exibiu qualquer problema térmico durante nosso teste de estresse. O Alphacool Eisbear 280 não teve problemas em manter a temperatura em ambas as amostras em nossa mesa de banco aberta, embora devamos notar que o Ryzen 7 5800X ficou um pouco mais quente que o Ryzen 9 5900X durante nossos testes.
Ao contrário daAMD Ryzen 9 3900X estas CPUs não vêm com um refrigerador de caixa. Se você optar por um processador Ryzen série 5000, você mesmo precisará fornecer um poderoso resfriador de CPU.
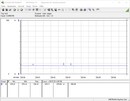
Favor observar que o consumo de energia, conforme observado neste teste, é para todo o sistema sem monitor.
AMD Ryzen 9 5900X
AMD Ryzen 7 5800X
| Power Consumption | |
| 1920x1080 The Witcher 3 ultra (external Monitor) | |
| AMD Ryzen 9 5900X, NVIDIA Titan RTX (Idle: 78.1 W) | |
| AMD Ryzen 7 2700X, NVIDIA Titan RTX | |
| AMD Ryzen 9 3950X, NVIDIA Titan RTX (Idle: 95 W) | |
| AMD Ryzen 9 3900X, NVIDIA Titan RTX (Idle: 87.4 W) | |
| AMD Ryzen 7 5800X, NVIDIA Titan RTX (Idle: 77.5 W) | |
| AMD Ryzen 7 3800XT, NVIDIA Titan RTX (Idle: 96.1 W) | |
| AMD Ryzen 5 1600, NVIDIA Titan RTX (Idle: 85.9 W) | |
| Intel Core i7-10700K, NVIDIA Titan RTX (Idle: 67.7 W) | |
| AMD Ryzen 3 3300X, NVIDIA Titan RTX (Idle: 88.8 W) | |
| Intel Core i9-10900K, NVIDIA Titan RTX (Idle: 52.3 W) | |
| AMD Ryzen 3 3100, NVIDIA Titan RTX (Idle: 86 W) | |
| Prime95 V2810 Stress (external Monitor) | |
| Intel Core i9-10900K, NVIDIA Titan RTX (Idle: 52.3 W) | |
| AMD Ryzen 7 5800X, NVIDIA Titan RTX (Idle: 77.5 W) | |
| AMD Ryzen 9 5900X, NVIDIA Titan RTX (Idle: 78.1 W) | |
| Intel Core i7-10700K, NVIDIA Titan RTX (Idle: 67.7 W) | |
| AMD Ryzen 9 3950X, NVIDIA Titan RTX (Idle: 95 W) | |
| AMD Ryzen 9 3900X, NVIDIA Titan RTX (Idle: 87.4 W) | |
| AMD Ryzen 7 3800XT, NVIDIA Titan RTX (Idle: 96.1 W) | |
| AMD Ryzen 5 1600, NVIDIA Titan RTX (Idle: 85.9 W) | |
| AMD Ryzen 3 3300X, NVIDIA Titan RTX (Idle: 88.8 W) | |
| AMD Ryzen 3 3100, NVIDIA Titan RTX (Idle: 86 W) | |
| Cinebench R15 Multi (external Monitor) | |
| Intel Core i9-10900K, NVIDIA Titan RTX (Idle: 52.3 W) | |
| AMD Ryzen 9 5900X, NVIDIA Titan RTX (Idle: 78.1 W) | |
| AMD Ryzen 7 5800X, NVIDIA Titan RTX (Idle: 77.5 W) | |
| AMD Ryzen 9 3950X, NVIDIA Titan RTX (Idle: 95 W) | |
| AMD Ryzen 9 3900X, NVIDIA Titan RTX (Idle: 87.4 W) | |
| Intel Core i7-10700K, NVIDIA Titan RTX (Idle: 67.7 W) | |
| AMD Ryzen 7 3800XT, NVIDIA Titan RTX (Idle: 96.1 W) | |
| AMD Ryzen 5 1600, NVIDIA Titan RTX (Idle: 85.9 W) | |
| AMD Ryzen 3 3300X, NVIDIA Titan RTX (Idle: 88.8 W) | |
| AMD Ryzen 3 3100, NVIDIA Titan RTX (Idle: 86 W) | |
* ... menor é melhor
Overclocking - Não recomendaria
O overclocking é uma maneira de espremer esse pouco a mais de desempenho dos componentes. Entretanto, ele requer um resfriador de CPU muito potente, e você não ganhará nenhum terreno de outra forma.
Como já estabelecemos no passado, os processadores Ryzen não são particularmente adequados para overclocking, e isto se aplica também à última geração Zen 3. Considerando o aumento da voltagem da CPU e as temperaturas mais altas resultantes, não consideraríamos um aumento de desempenho de 5% como um compromisso que vale a pena. Especialmente considerando que você realmente perde desempenho de um único núcleo devido ao fato de que o PBO é desativado quando o overclocking é feito manualmente.
Pro
Contra
Veredicto - AMD tem a CPU de jogo mais rápida
A família Ryzen 5000 da AMD é uma continuação perfeita da história de sucesso da AMD Ryzen, e pela primeira vez um processador Ryzen é a melhor CPU de jogos e bate o pino mestre anterior, o Núcleo i9-10900K. E ainda não levamos em consideração o novo modelo de navio de bandeira de ponta, o Ryzen 9 5950X, e baseamos nossas opiniões no AMD Ryzen 9 5900X e no AMD Ryzen 7 5800X. Esperamos que o 5950X aumente ainda mais a fasquia para a CPU de jogos mais rápida, esperemos que em não mais do que alguns dias.
Até então, podemos concluir que as melhorias da AMD Zen 3 funcionaram brilhantemente bem. A AMD não só conseguiu embalar ainda mais núcleos em um único molde, como também redesenhou completamente o CCX a fim de melhorar o IPC. E, sem surpresas, é exatamente aqui que os novos processadores Ryzen série 5000 brilham e conseguem superar a atual CPU da Intel em muitos benchmarks de CPU de núcleo único. Além disso, este desempenho aprimorado de núcleo único também se correlaciona diretamente com o desempenho aprimorado de vários núcleos, que melhorou significativamente com a geração Zen 2 da série 3000.
O MSRP da AMD de US$ 549 é ligeiramente superior ao preço solicitado pela Intel para o Core i9-10900K. O Ryzen 7 5800X menos potente custa US$ 100 a menos, e a US$ 449 está a um nível de preço similar ao do concorrente da Intel, oferecendo ao mesmo tempo um desempenho superior. Outro benefício é o menor TDP, que pode se contentar com um sistema de resfriamento menor do que o que funcionaria no Core i9-10900K. Além disso, o PCI Express 4.0 está atualmente disponível apenas na plataforma AMD. Espera-se que as plataformas Intel obtenham suporte PCIe 4.0 com o Rocket Lake em um futuro próximo.
A AMD venceu a Intel e tem a CPU de jogos mais rápida atualmente disponível. O forte desempenho da Intel, com um único núcleo, foi quebrado em pedaços.
Os clientes agora têm uma escolha e podem decidir entre uma CPU rápida de 8 núcleos e uma ainda mais rápida de 12 núcleos. Ambas as amostras tiveram um desempenho excepcionalmente bom em nossos testes. Entretanto, se seu principal interesse for jogos, então você deve ter em mente que o Ryzen 7 5800X ofereceu um desempenho praticamente idêntico ao do Ryzen 9 5900X. Os criadores de conteúdo e streamers que não querem rodar um PC de streaming dedicado provavelmente se beneficiarão do Ryzen 9 5900X ou possivelmente até mesmo do Ryzen 9 5950X.


