Análise do HP ProBook 450 G10: GeForce Potência RTX em um laptop de escritório
Na série ProBook 400, a HP reuniu laptops empresariais de nível básico e médio que não custarão caro. Os modelos mais baratos de 15,6 polegadas custam a partir de cerca de US$ 750. Para o nosso dispositivo de teste, o modelo topo de linha dessa série, o senhor provavelmente terá que gastar cerca de US$ 1.000. A HP conta com CPUs Raptor Lake da Intel para esse modelo. Várias versões apresentam adicionalmente uma GeForce RTX 2050 nosso dispositivo de teste é uma delas.
A concorrência inclui dispositivos como o Acer Aspire 5 A515-58GM, Schenker VIA 15 Pro M22, Lenovo ThinkPad L15 Gen 4, Fujitsu LifeBook E5412A e o Dell Latitude 3440 - no caso dos dois últimos laptops, isso se aplica em maior medida aos seus respectivos modelos irmãos de 15,6 polegadas.
Possíveis concorrentes em comparação
Avaliação | Data | Modelo | Peso | Altura | Size | Resolução | Preço |
|---|---|---|---|---|---|---|---|
| 86.2 % v7 (old) | 12/2023 | HP ProBook 450 G10 i7-1355U, GeForce RTX 2050 Mobile | 1.8 kg | 19.9 mm | 15.60" | 1920x1080 | |
| 82 % v7 (old) | 09/2023 | Acer Aspire 5 A515-58GM-76S8 i7-1355U, GeForce RTX 2050 Mobile | 1.8 kg | 19.7 mm | 15.60" | 1920x1080 | |
| 87.1 % v7 (old) | Schenker VIA 15 Pro M22 R7 5700U, Vega 8 | 1.4 kg | 16.8 mm | 15.60" | 2560x1440 | ||
| 86.6 % v7 (old) | 12/2023 | Lenovo ThinkPad L15 Gen 4 21H70021GE R7 PRO 7730U, Vega 8 | 1.9 kg | 19.93 mm | 15.60" | 1920x1080 | |
| 82.1 % v7 (old) | 06/2023 | Fujitsu LifeBook E5412A E542AMHAAMDE R5 PRO 5675U, Vega 7 | 1.4 kg | 19.9 mm | 14.00" | 1920x1080 | |
| 85.3 % v7 (old) | 06/2023 | Dell Latitude 3440 i5-1345U, Iris Xe G7 80EUs | 1.5 kg | 19.4 mm | 14.00" | 1920x1080 |
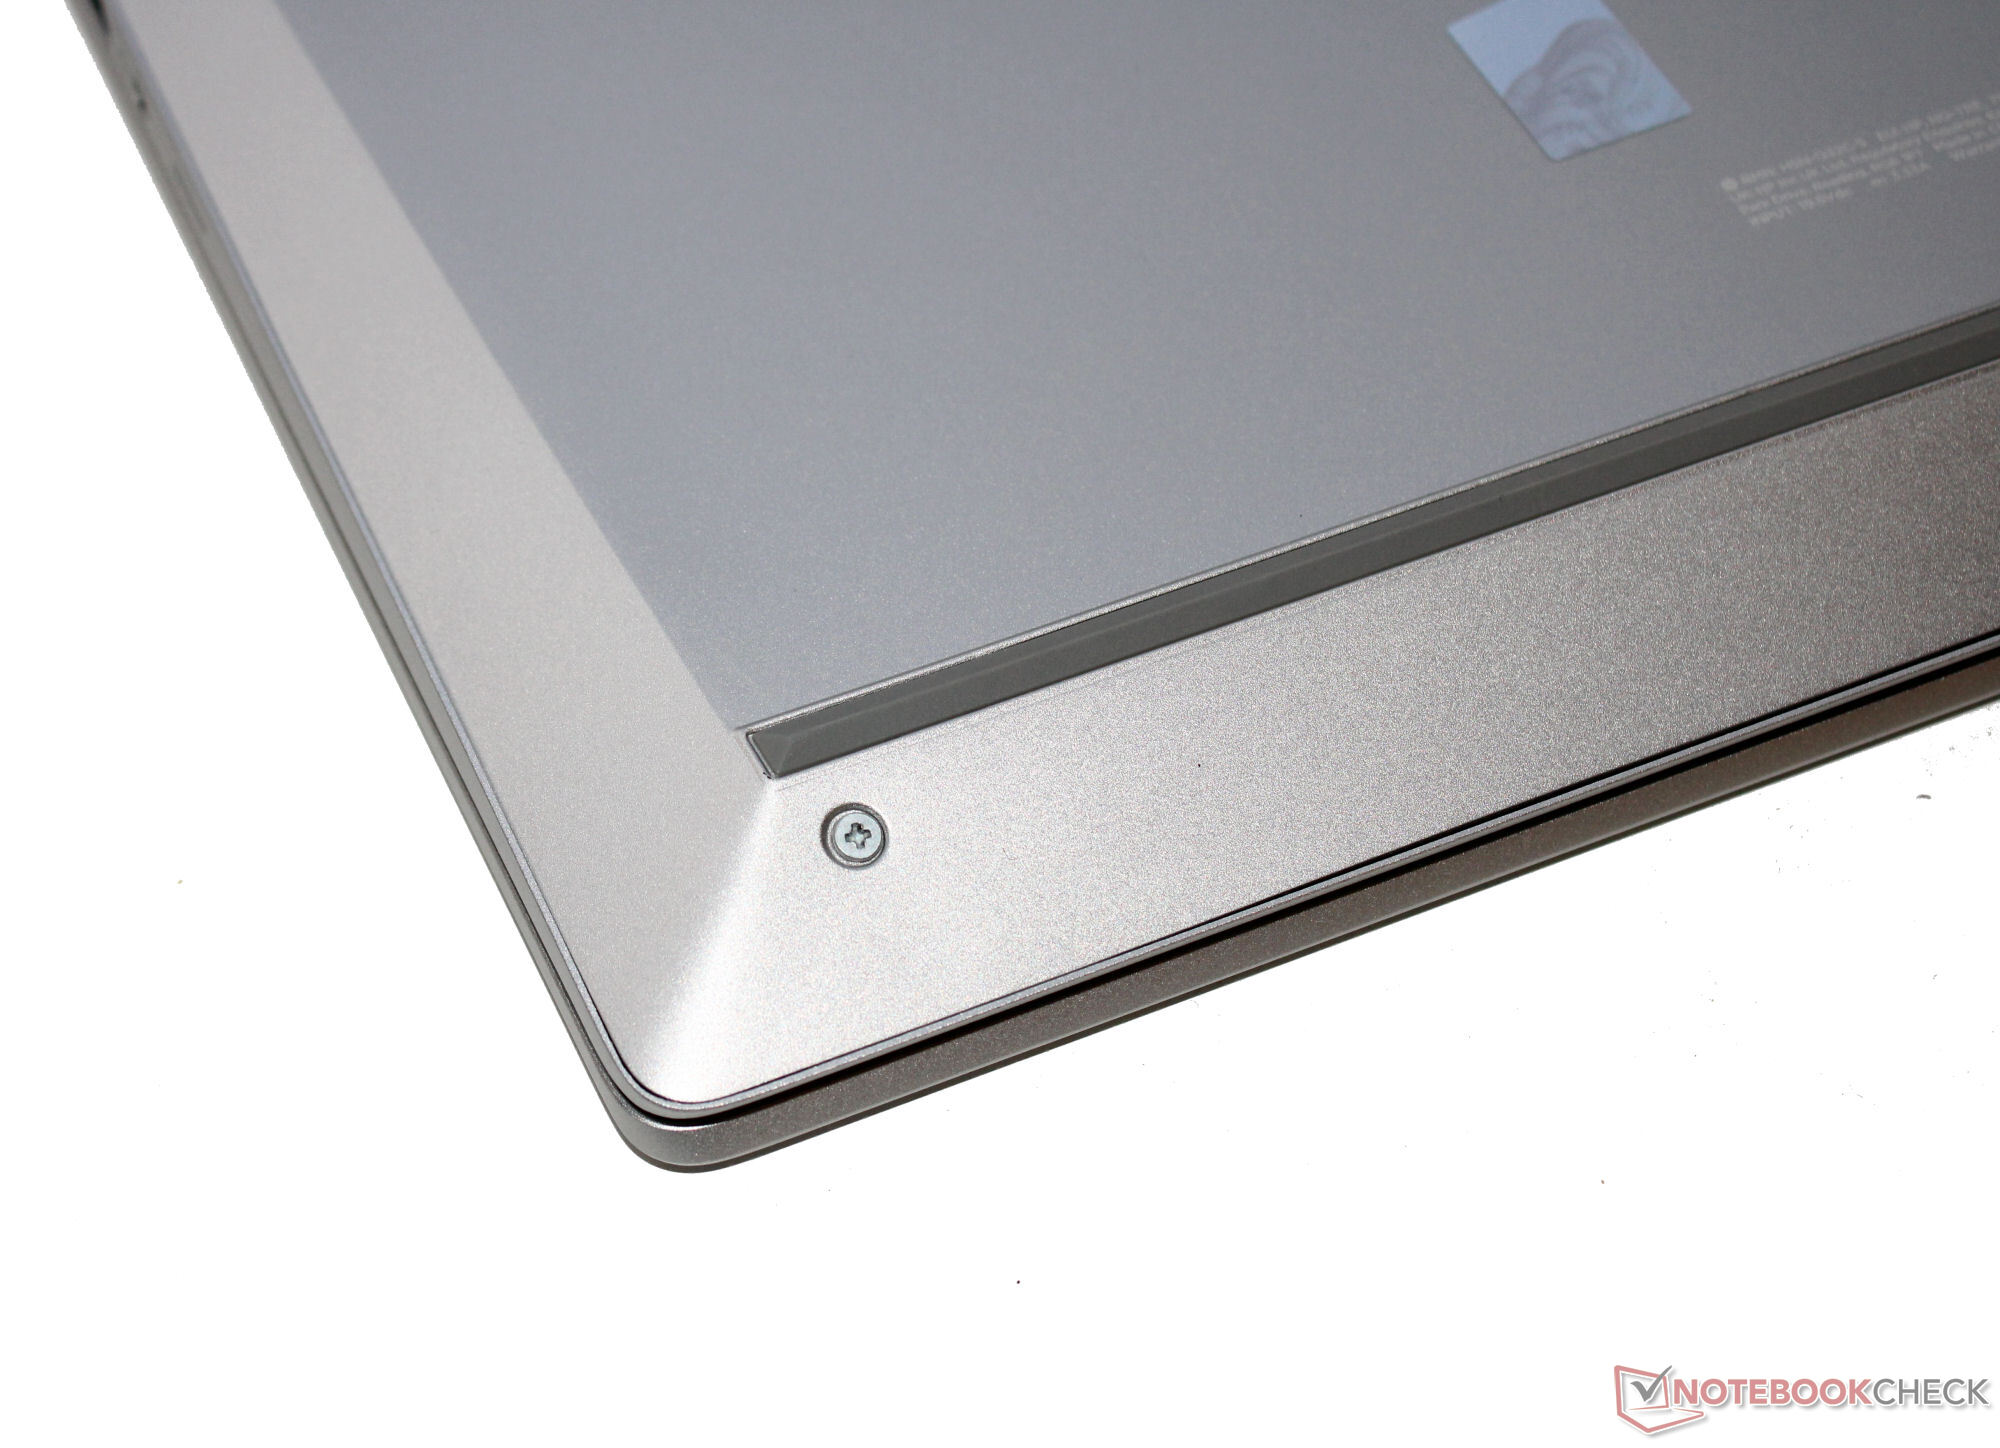
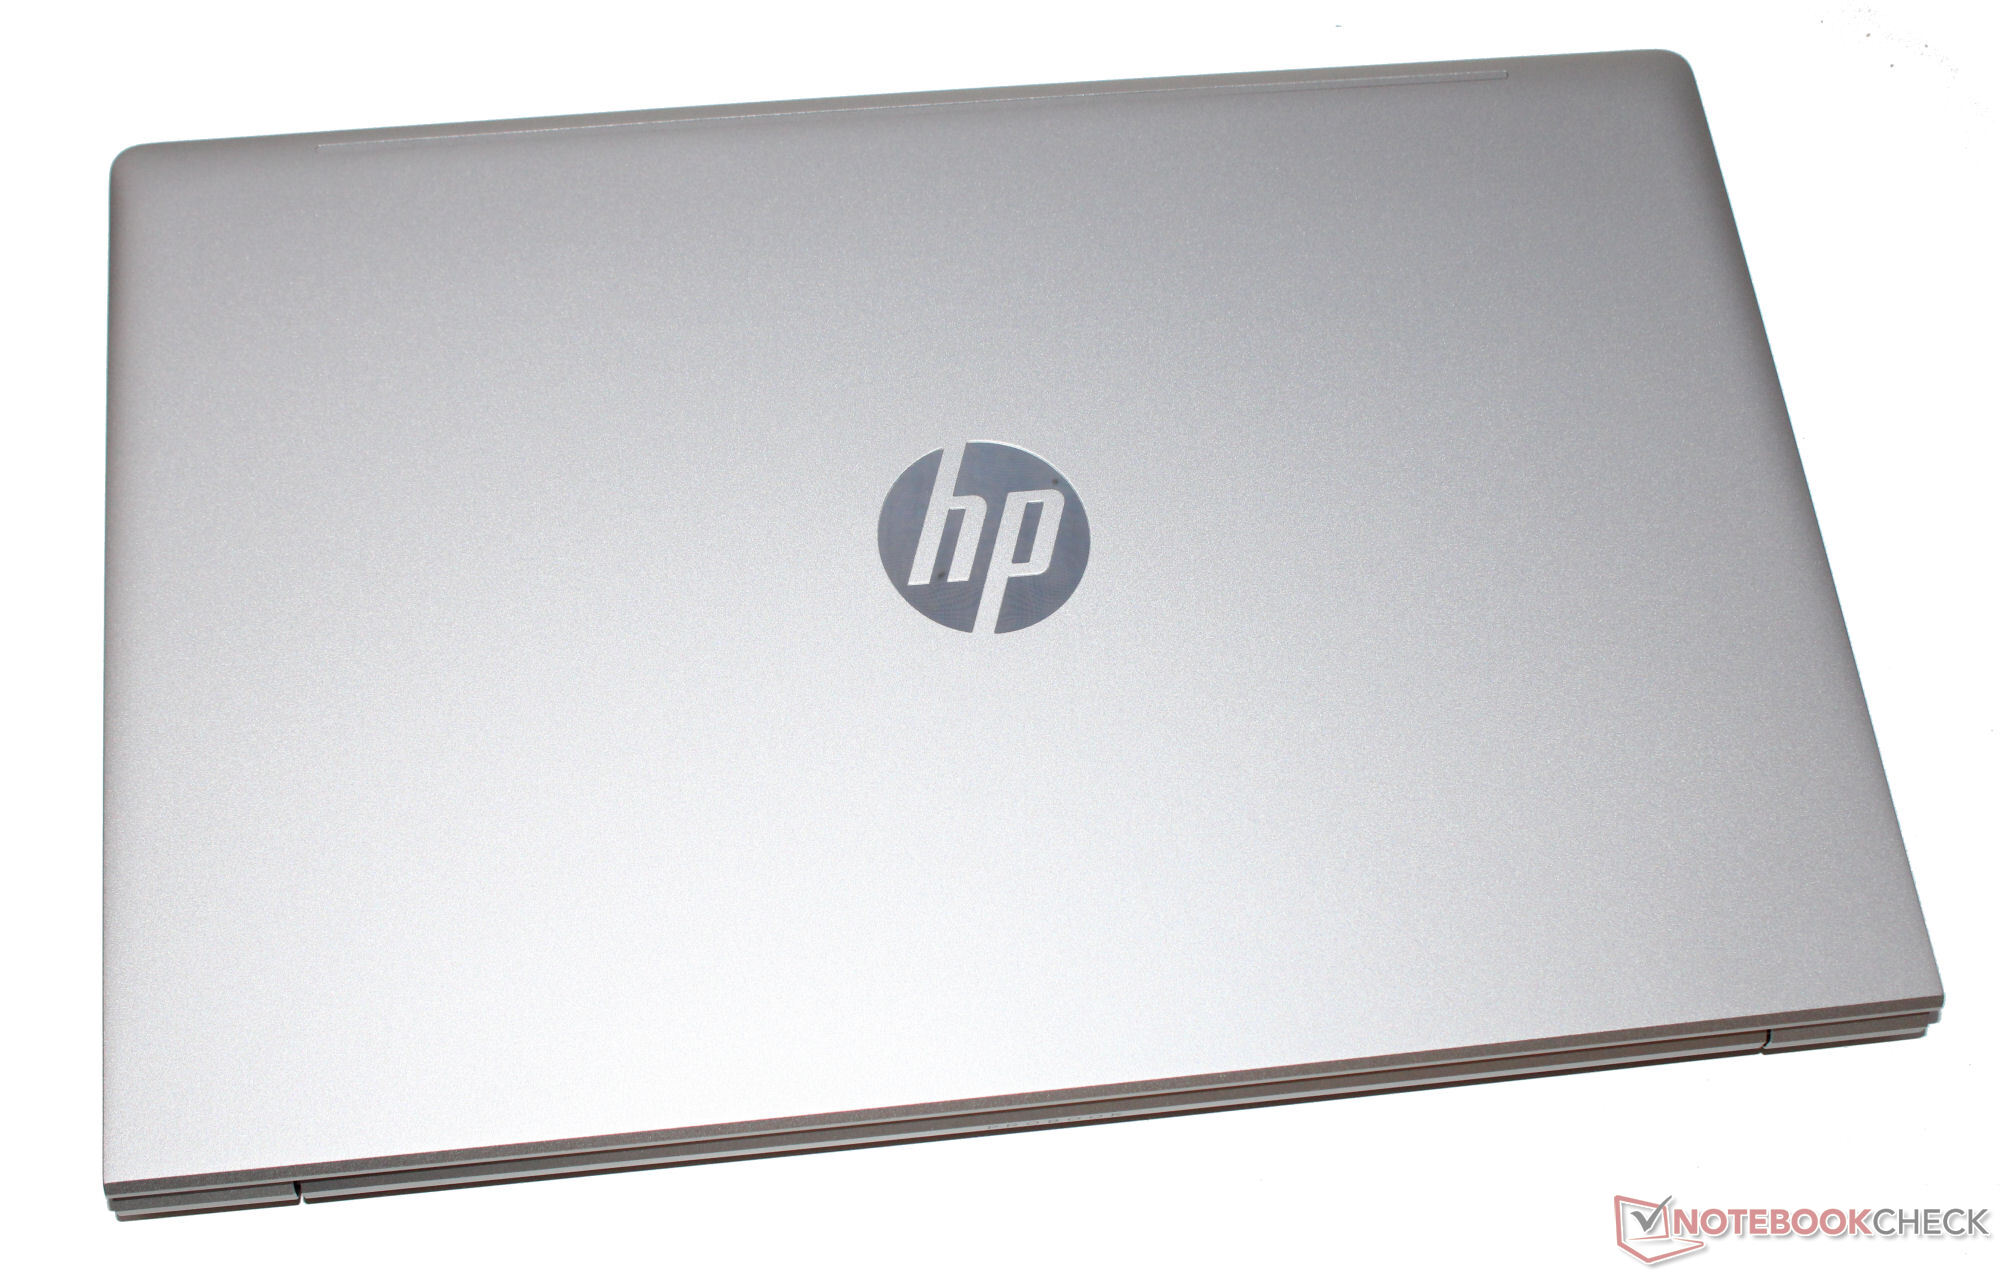
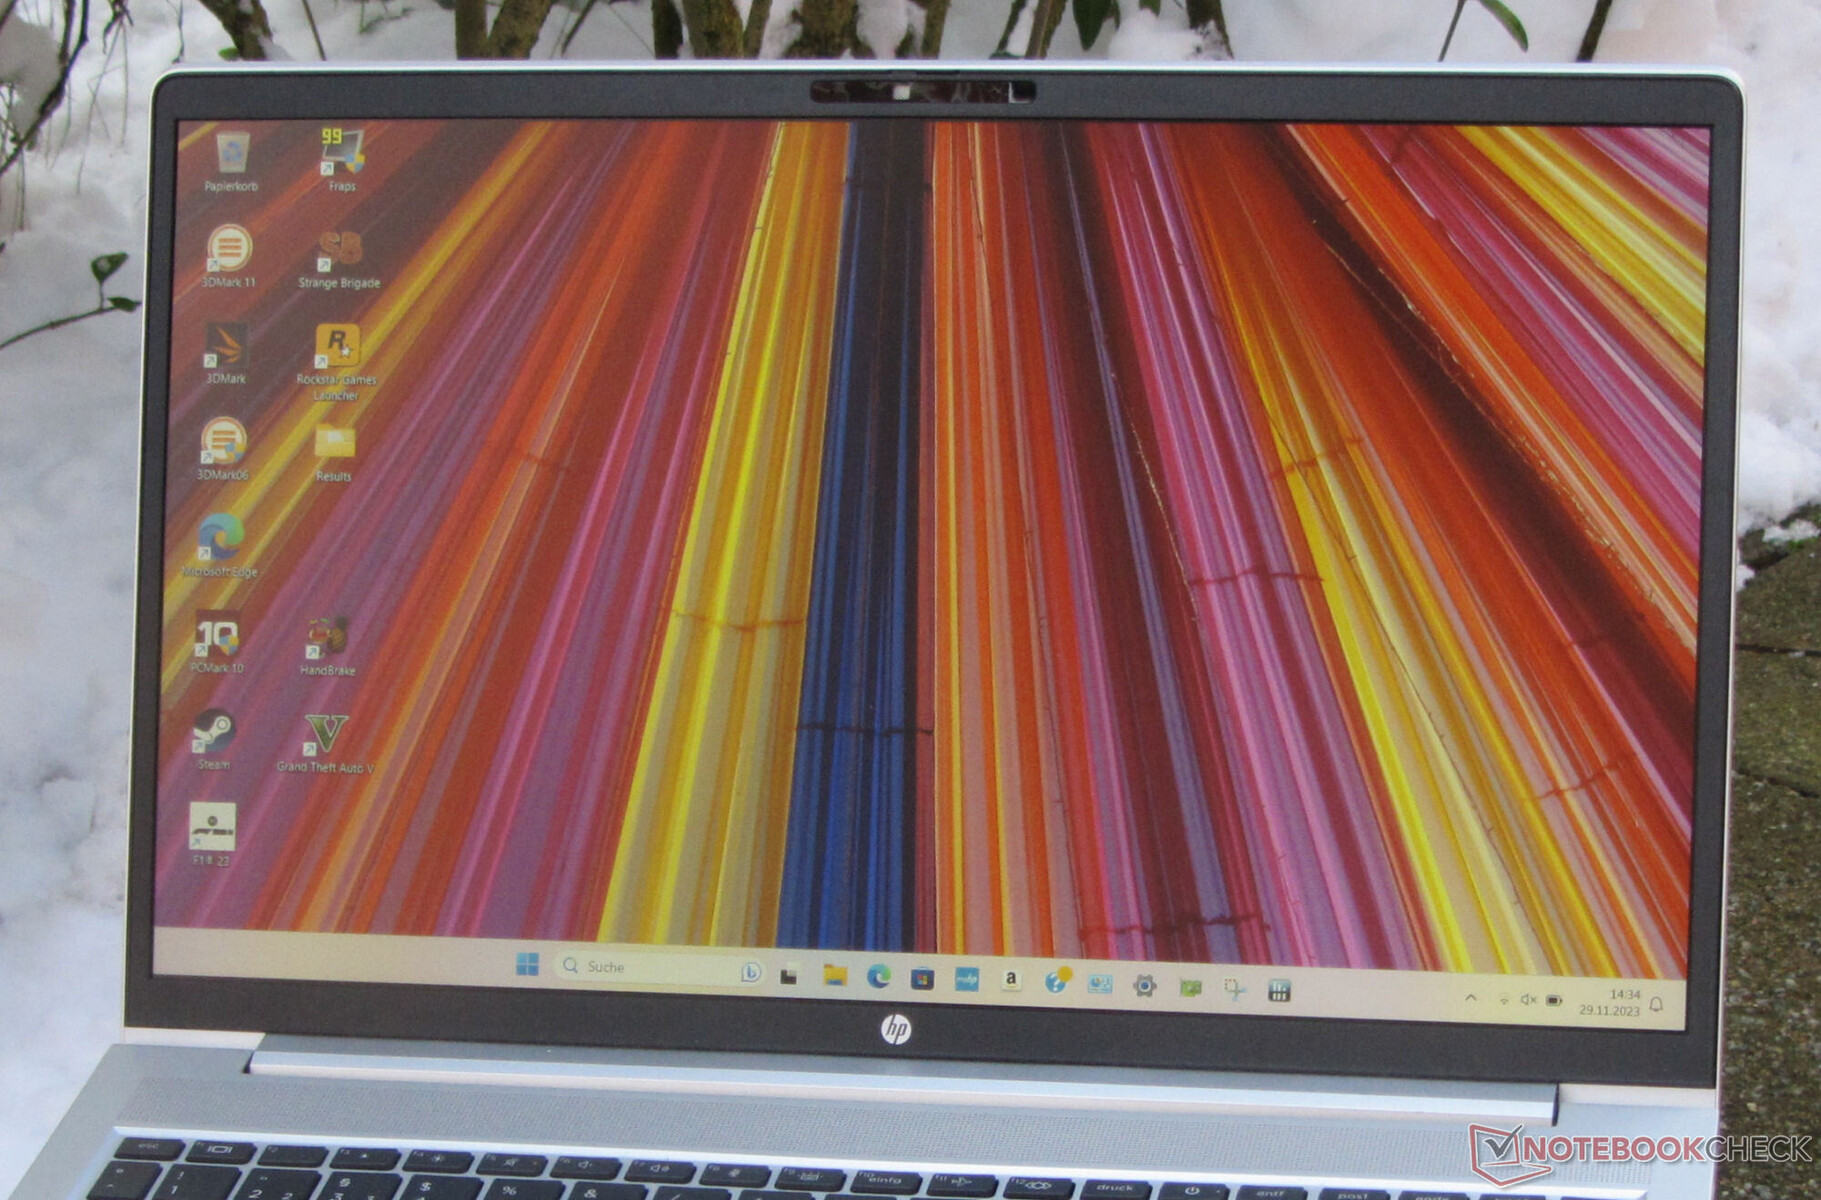
Gabinete - A HP usa alumínio e plástico
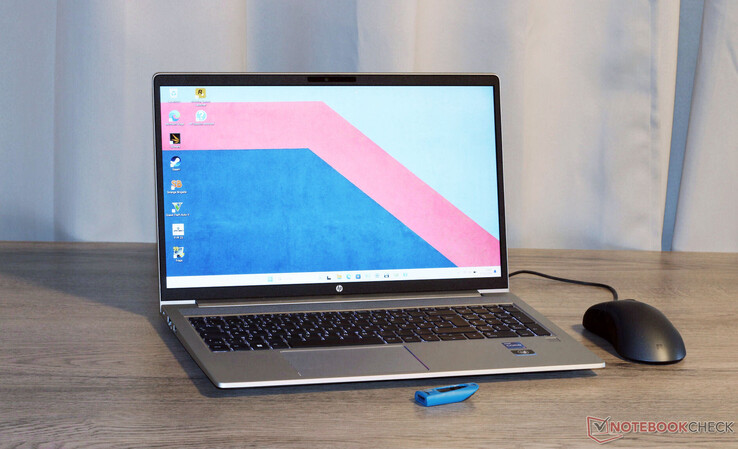
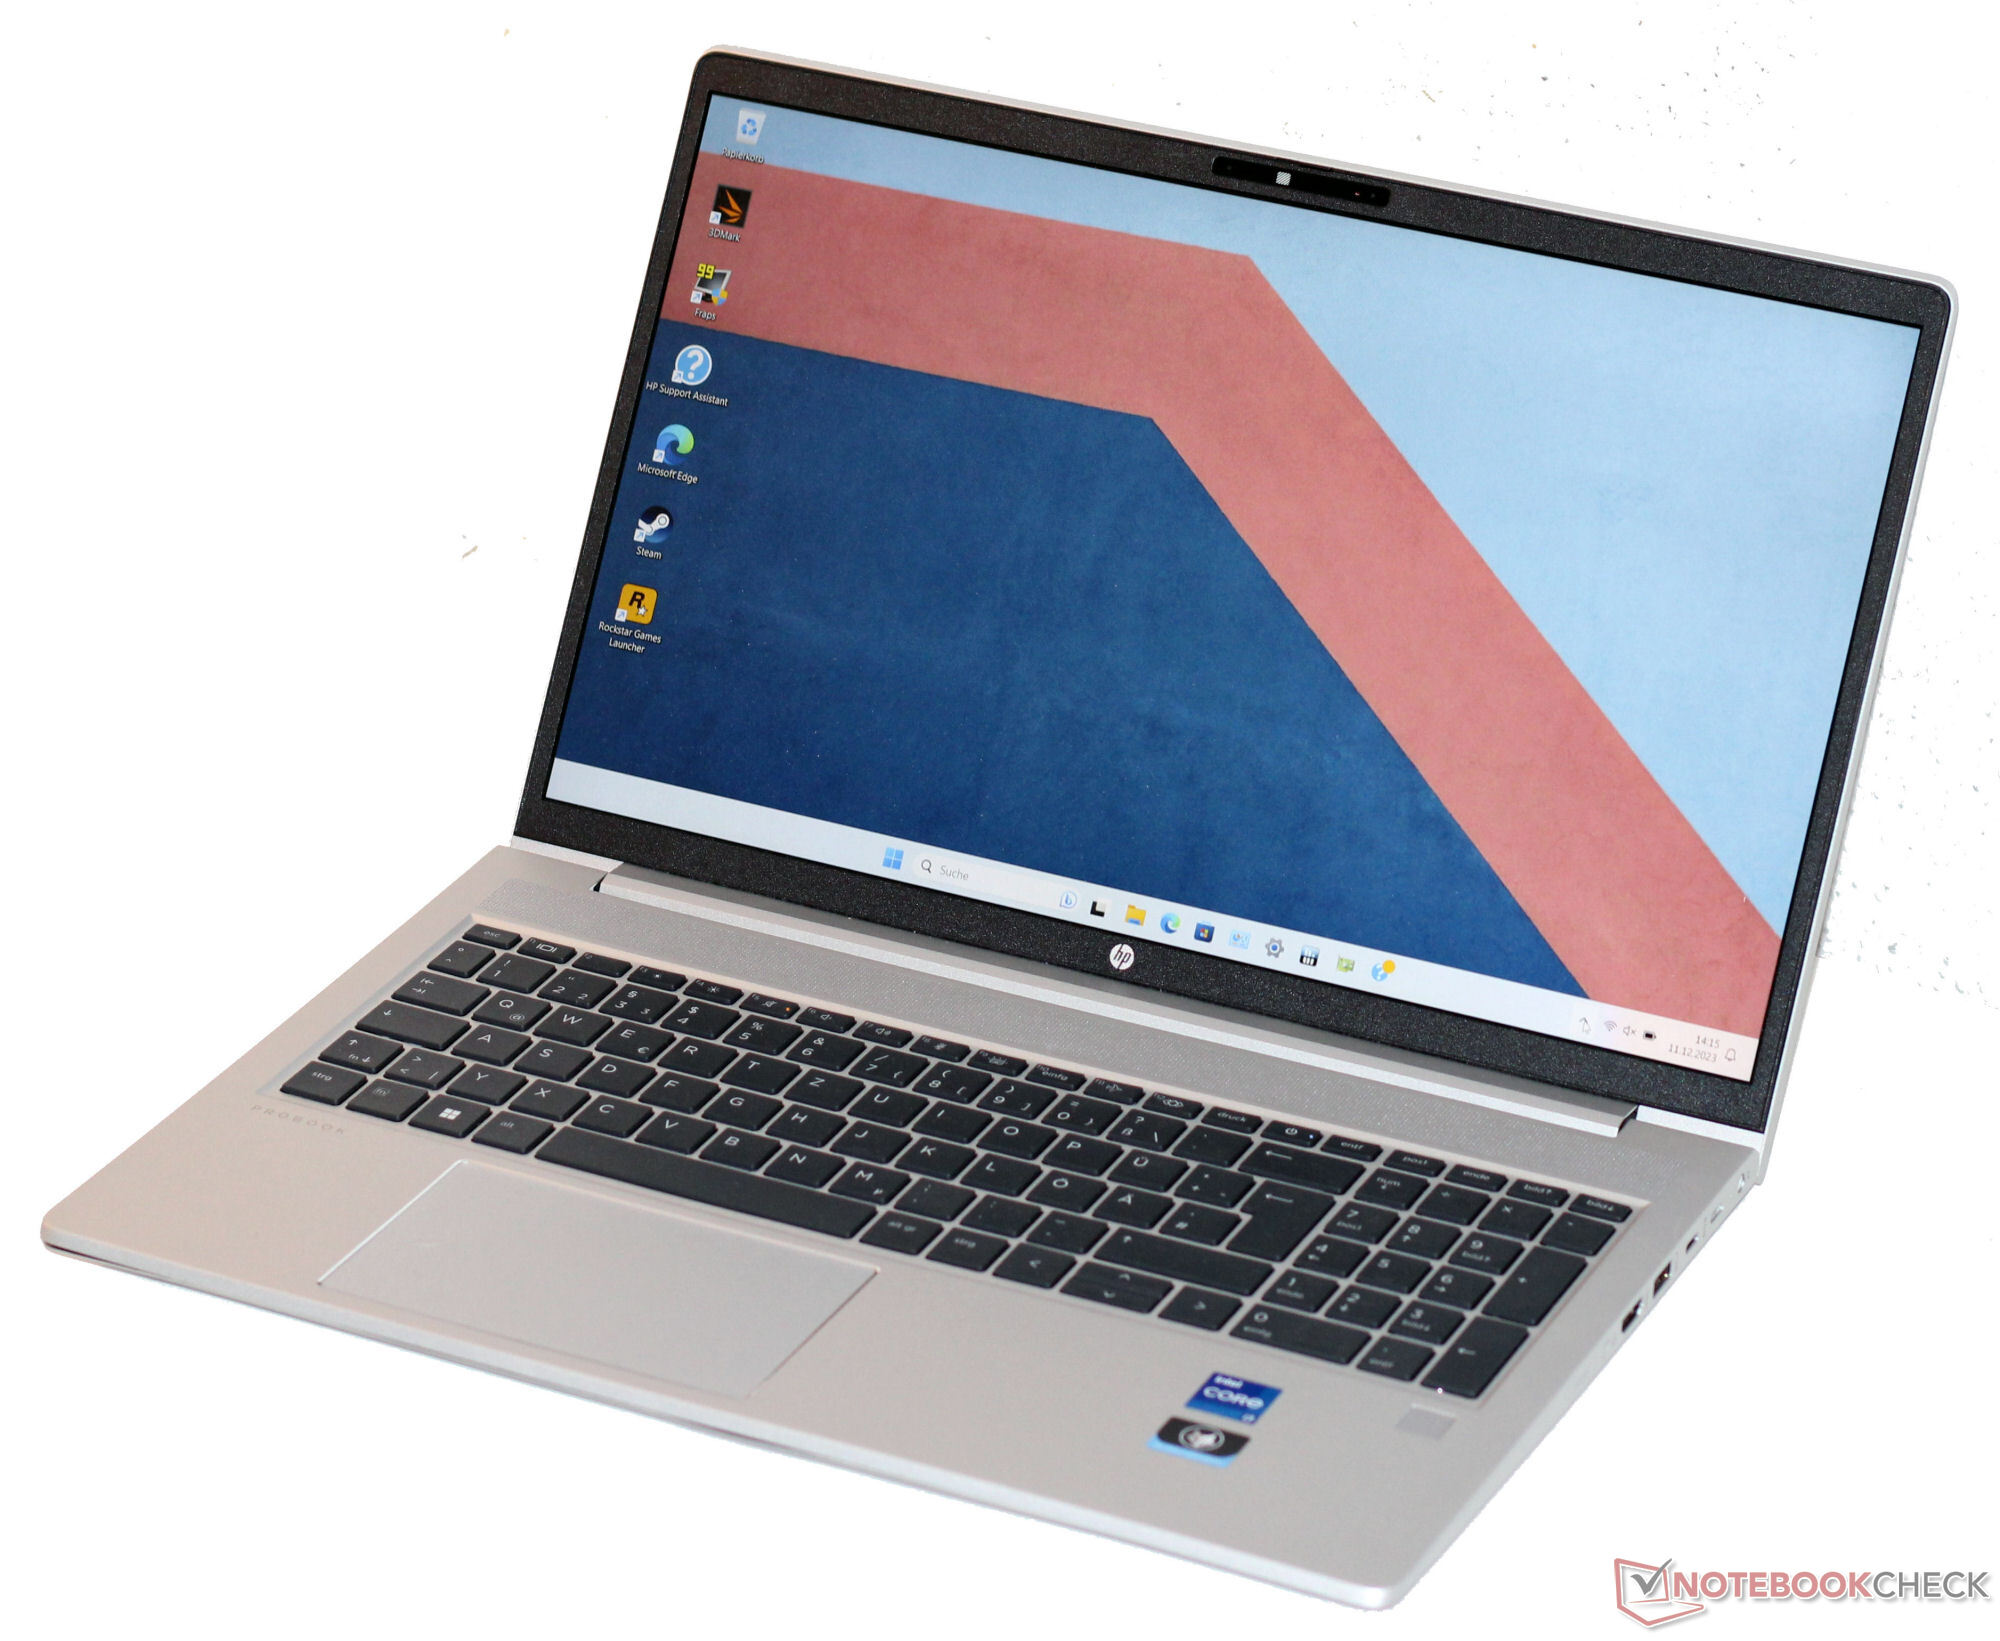
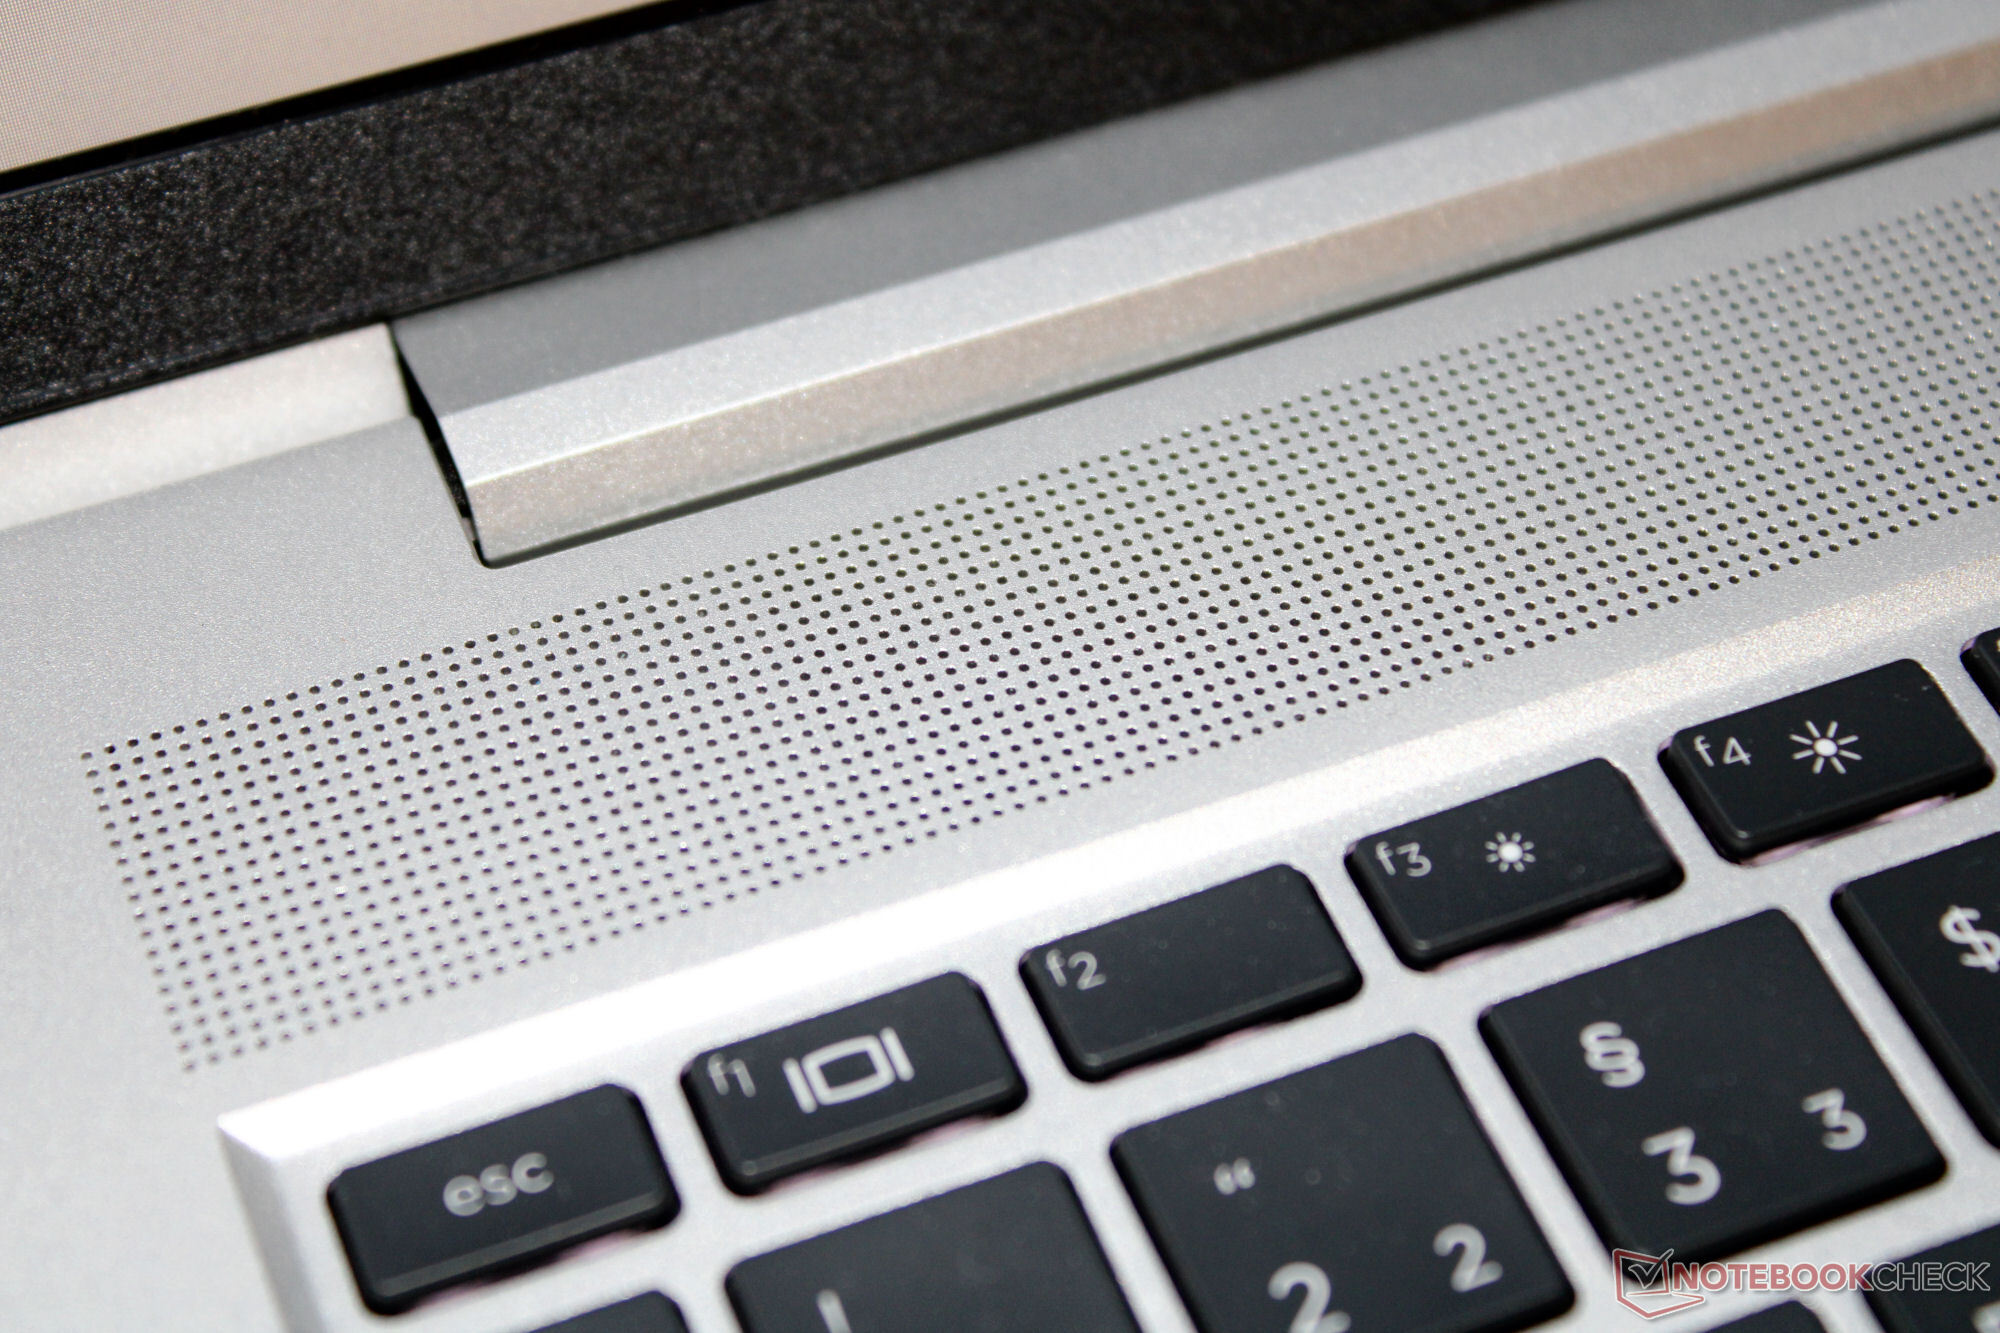
Visualmente, nada mudou em comparação com o antecessor do laptop: A HP usa um gabinete cinza-prateado, elegante e simples (alumínio e plástico) conhecido do 450 G9 que apresenta superfícies lisas e foscas. O calor é dissipado pela parte posterior do gabinete. Se a tampa estiver fechada (por exemplo, se o laptop estiver acoplado), pode haver acúmulo de calor. Para acessar a bateria (aparafusada, não colada) e o restante do hardware do laptop, o senhor terá que remover a placa inferior.
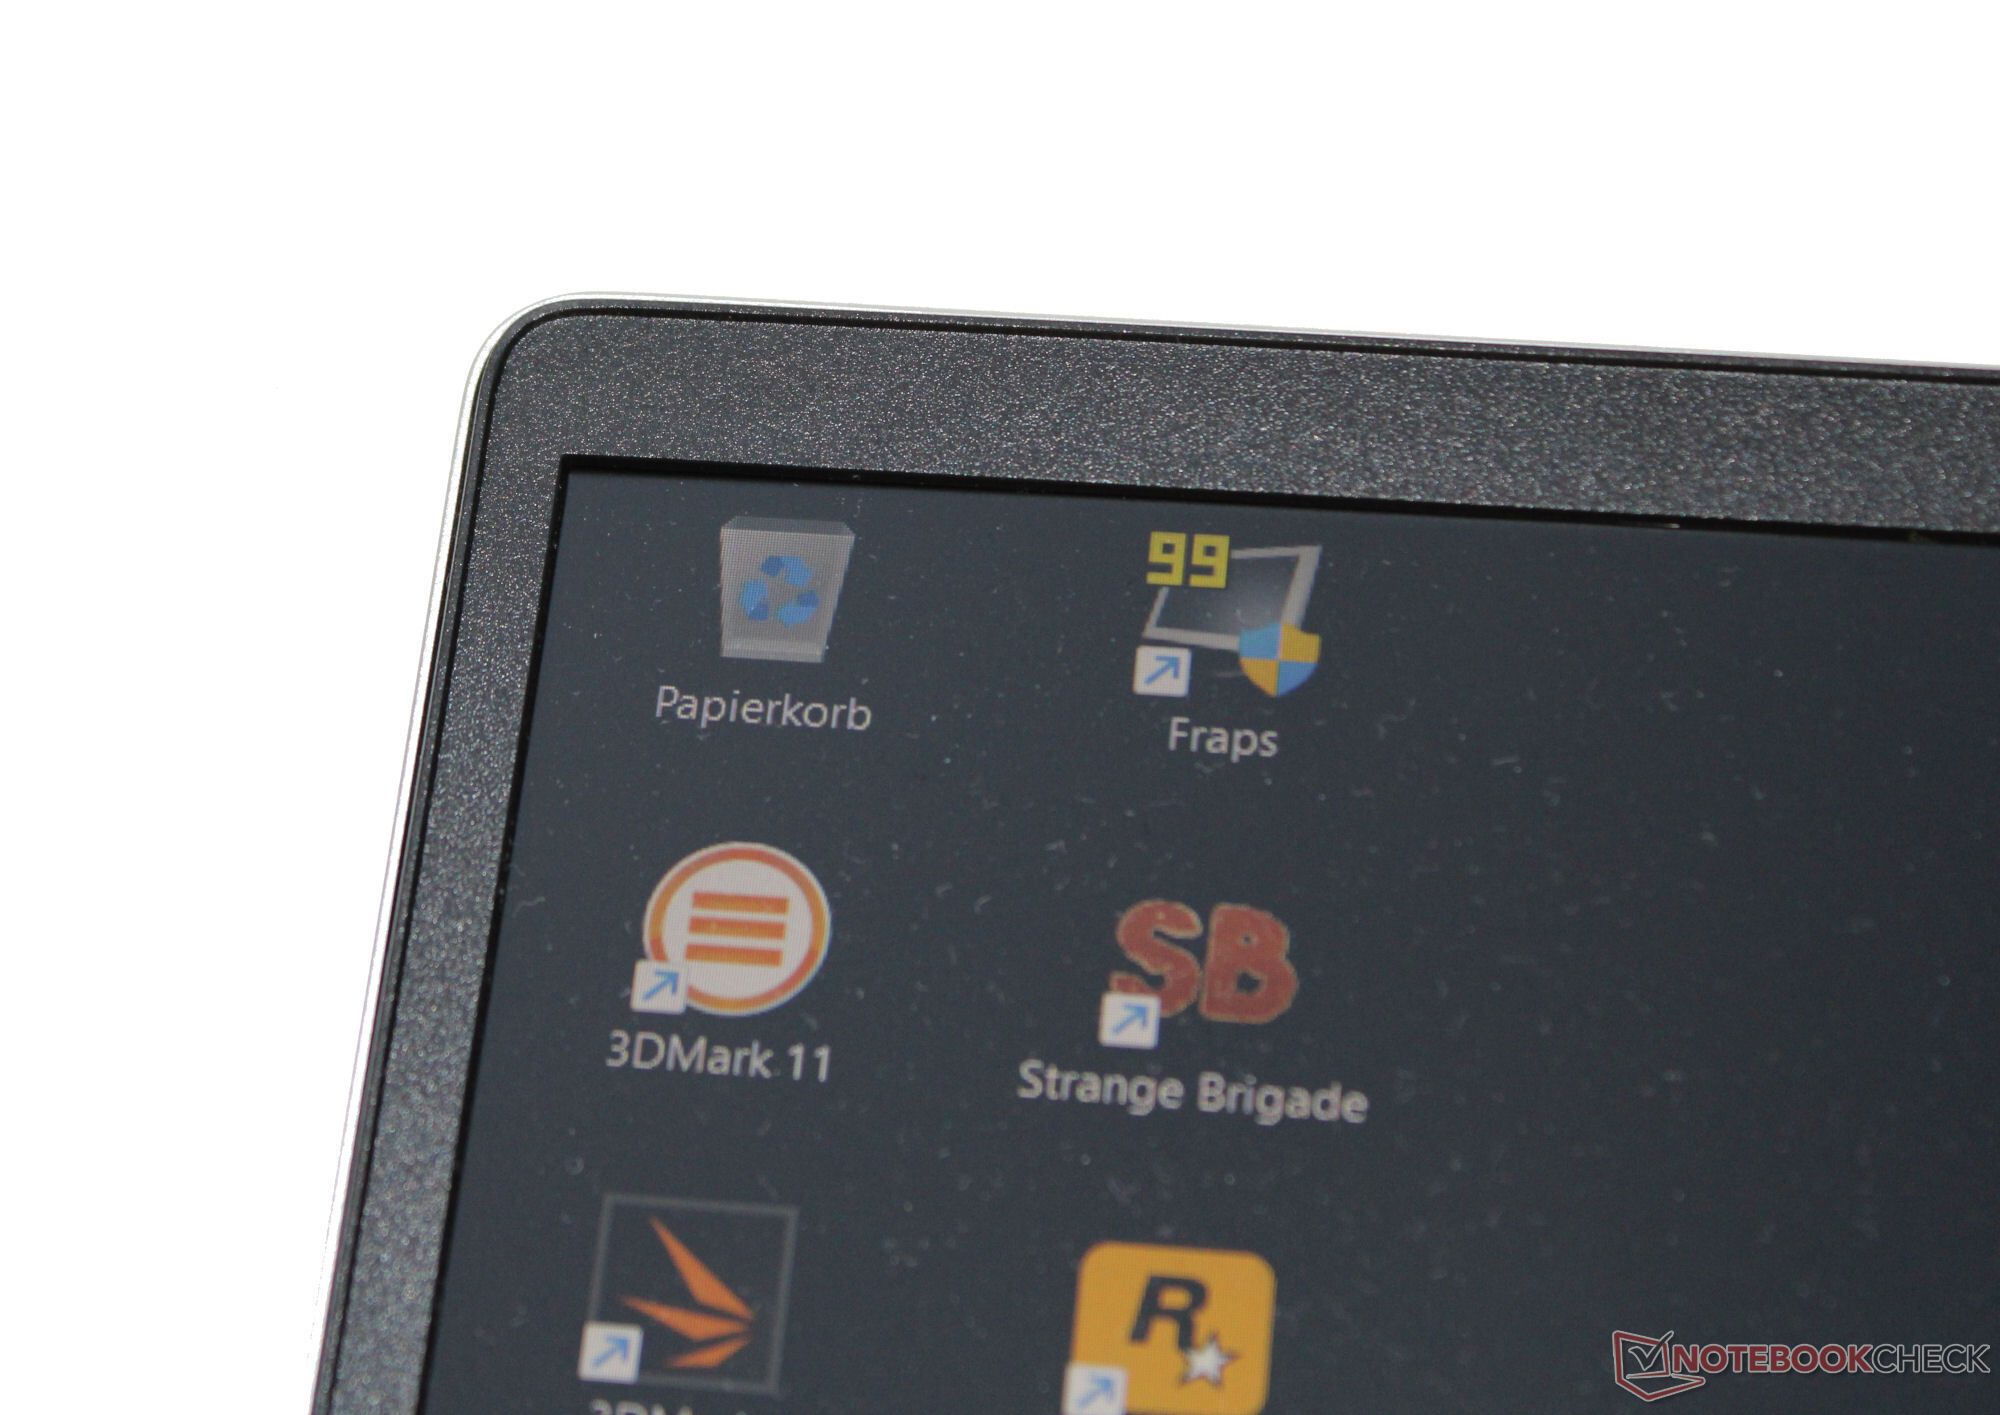
Sua construção não apresenta motivos para críticas. Não há lacunas ou excessos de material. A unidade de base e a tampa podem ser torcidas um pouco demais. O senhor esperaria mais de um laptop que custa esse valor. Pressionar a parte de trás da tampa não causa nenhuma mudança de imagem. As dobradiças mantêm a tampa firmemente na posição até o ângulo máximo de abertura (180 graus). É possível abrir a tampa com uma mão.

Dentro do campo de comparação, o ProBook tem um peso relativamente médio para um laptop (cerca de 1,8 kg). Em termos de dimensões, os dispositivos de 15,6 polegadas são todos muito semelhantes. Obviamente, os concorrentes de 14 polegadas são consideravelmente mais compactos e leves.
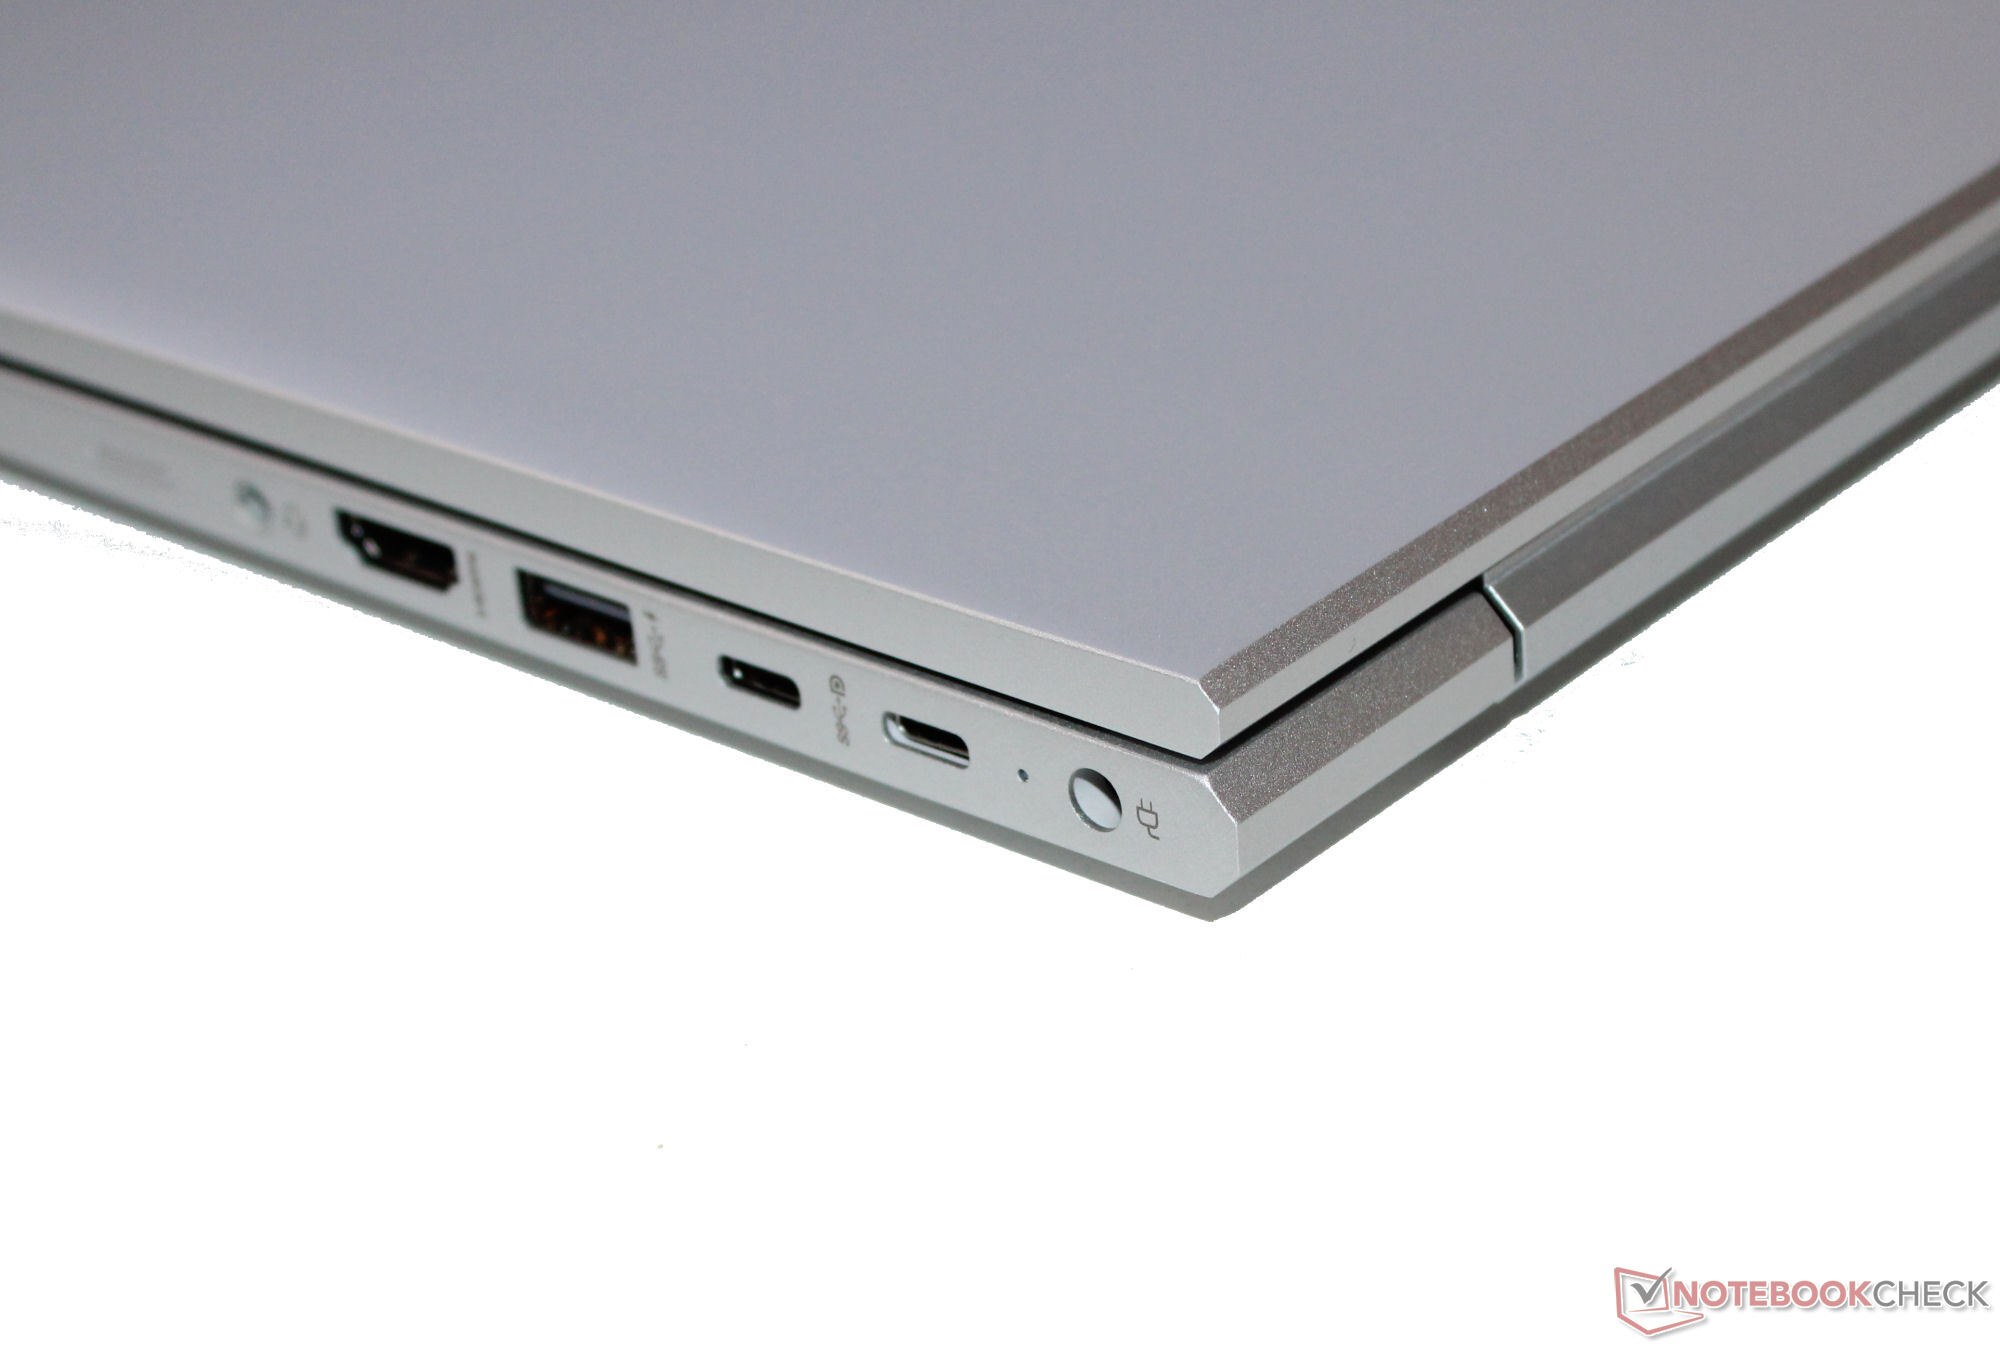
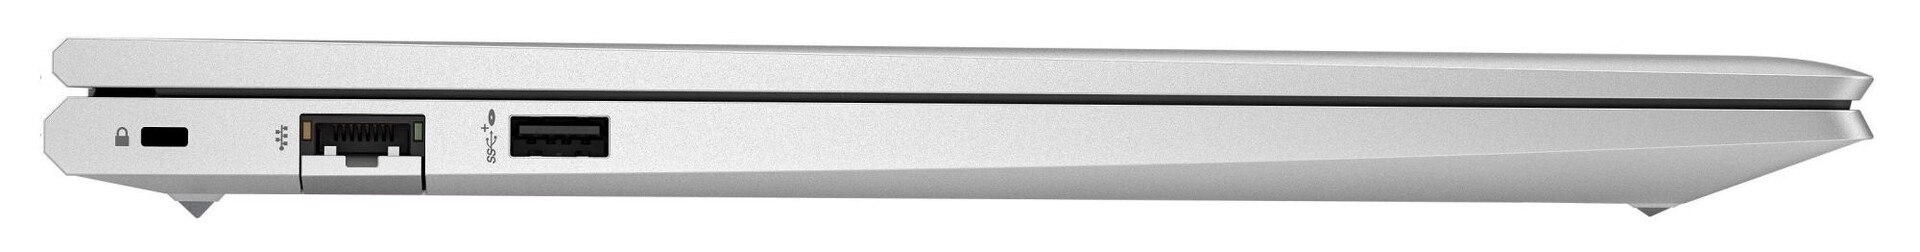
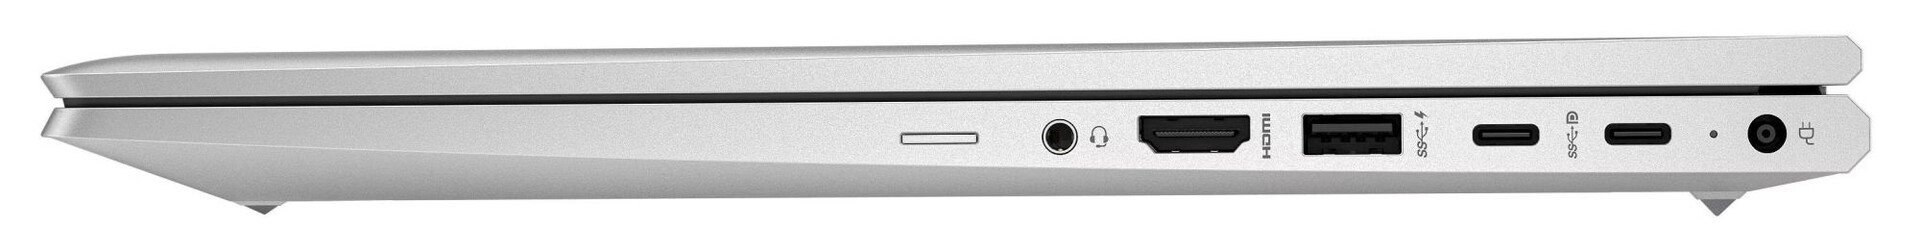
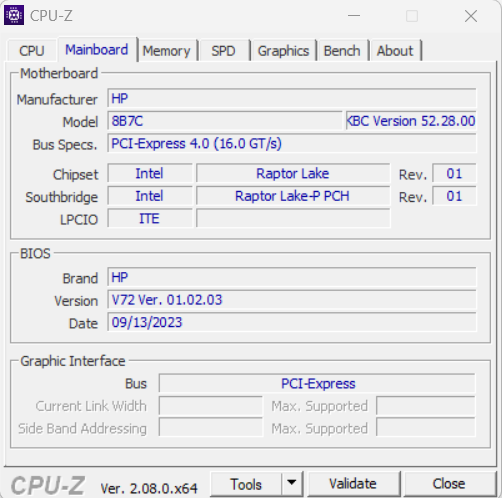
Conectividade - Não há Thunderbolt 4 no ProBook 450
O ProBook apresenta duas conexões USB-A (USB 3.2 Gen 1) e duas portas USB-C (USB 3.2 Gen 2; Power Delivery, DisplayPort). No total, o laptop tem três saídas de vídeo (2x DP, 1x HDMI). Um conector de áudio combinado e uma porta Gigabit Ethernet completam a configuração. O dispositivo não tem um leitor de cartão SD.
Comunicação
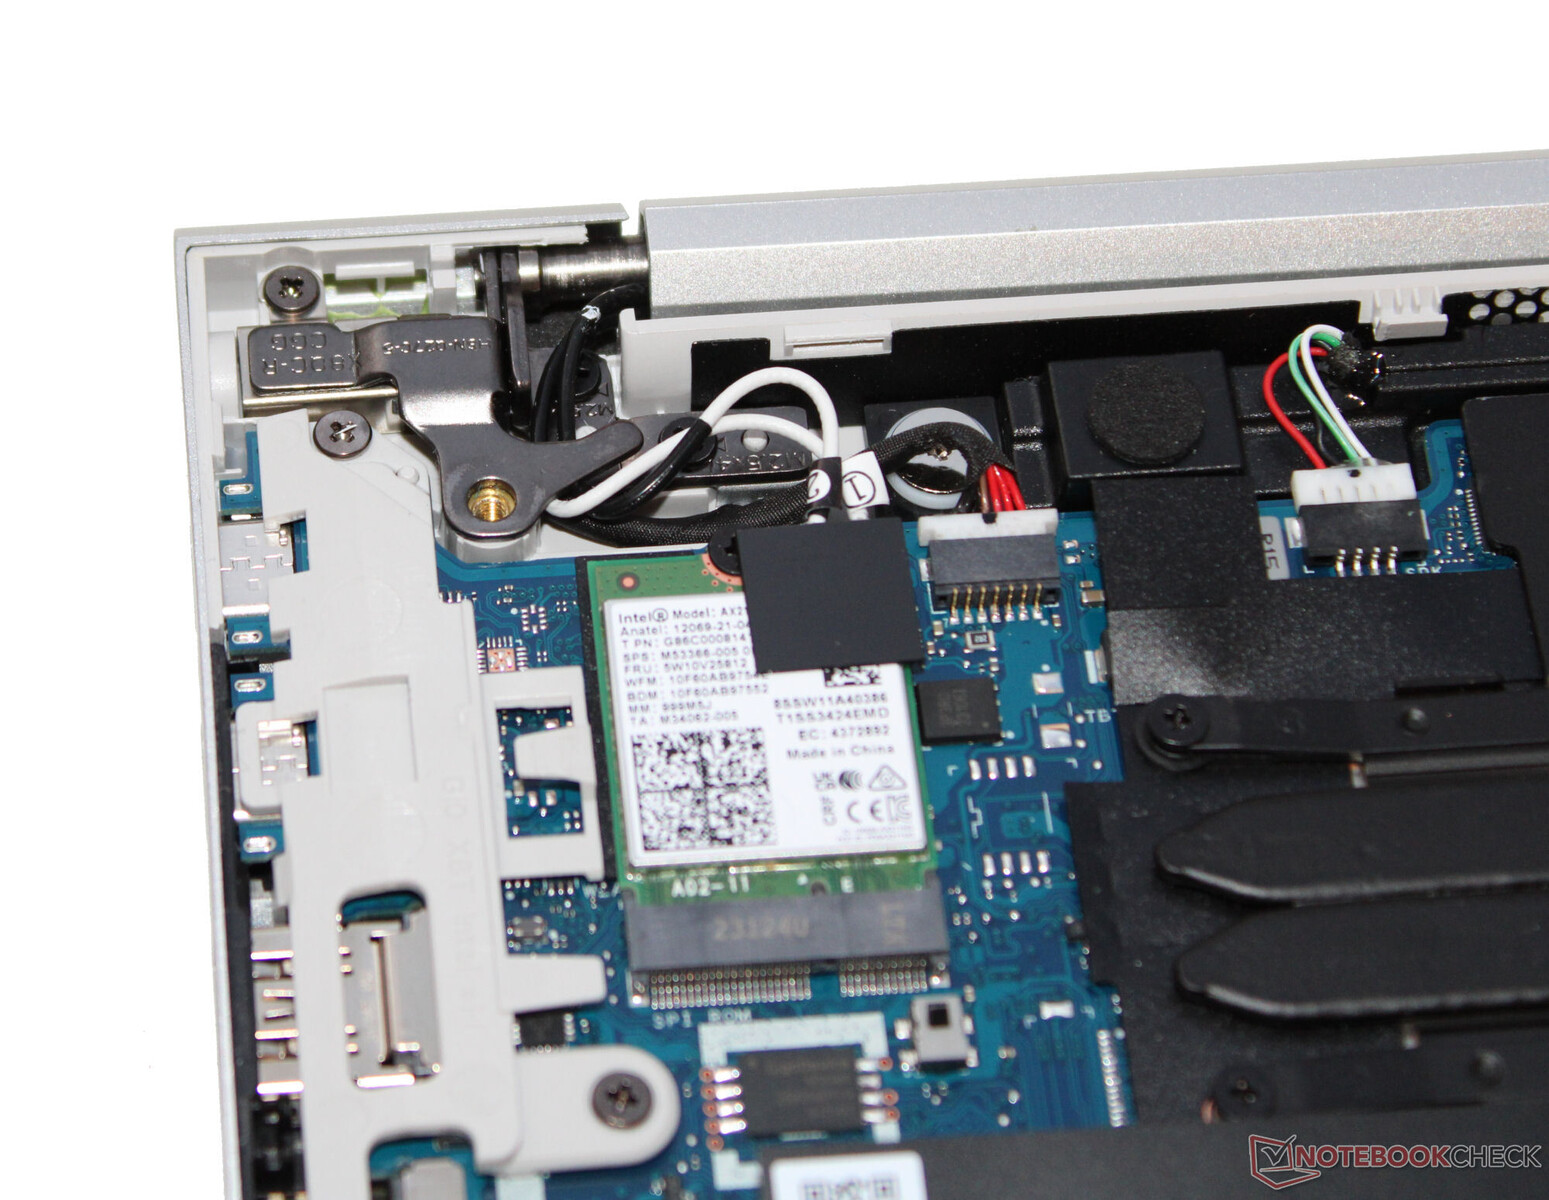
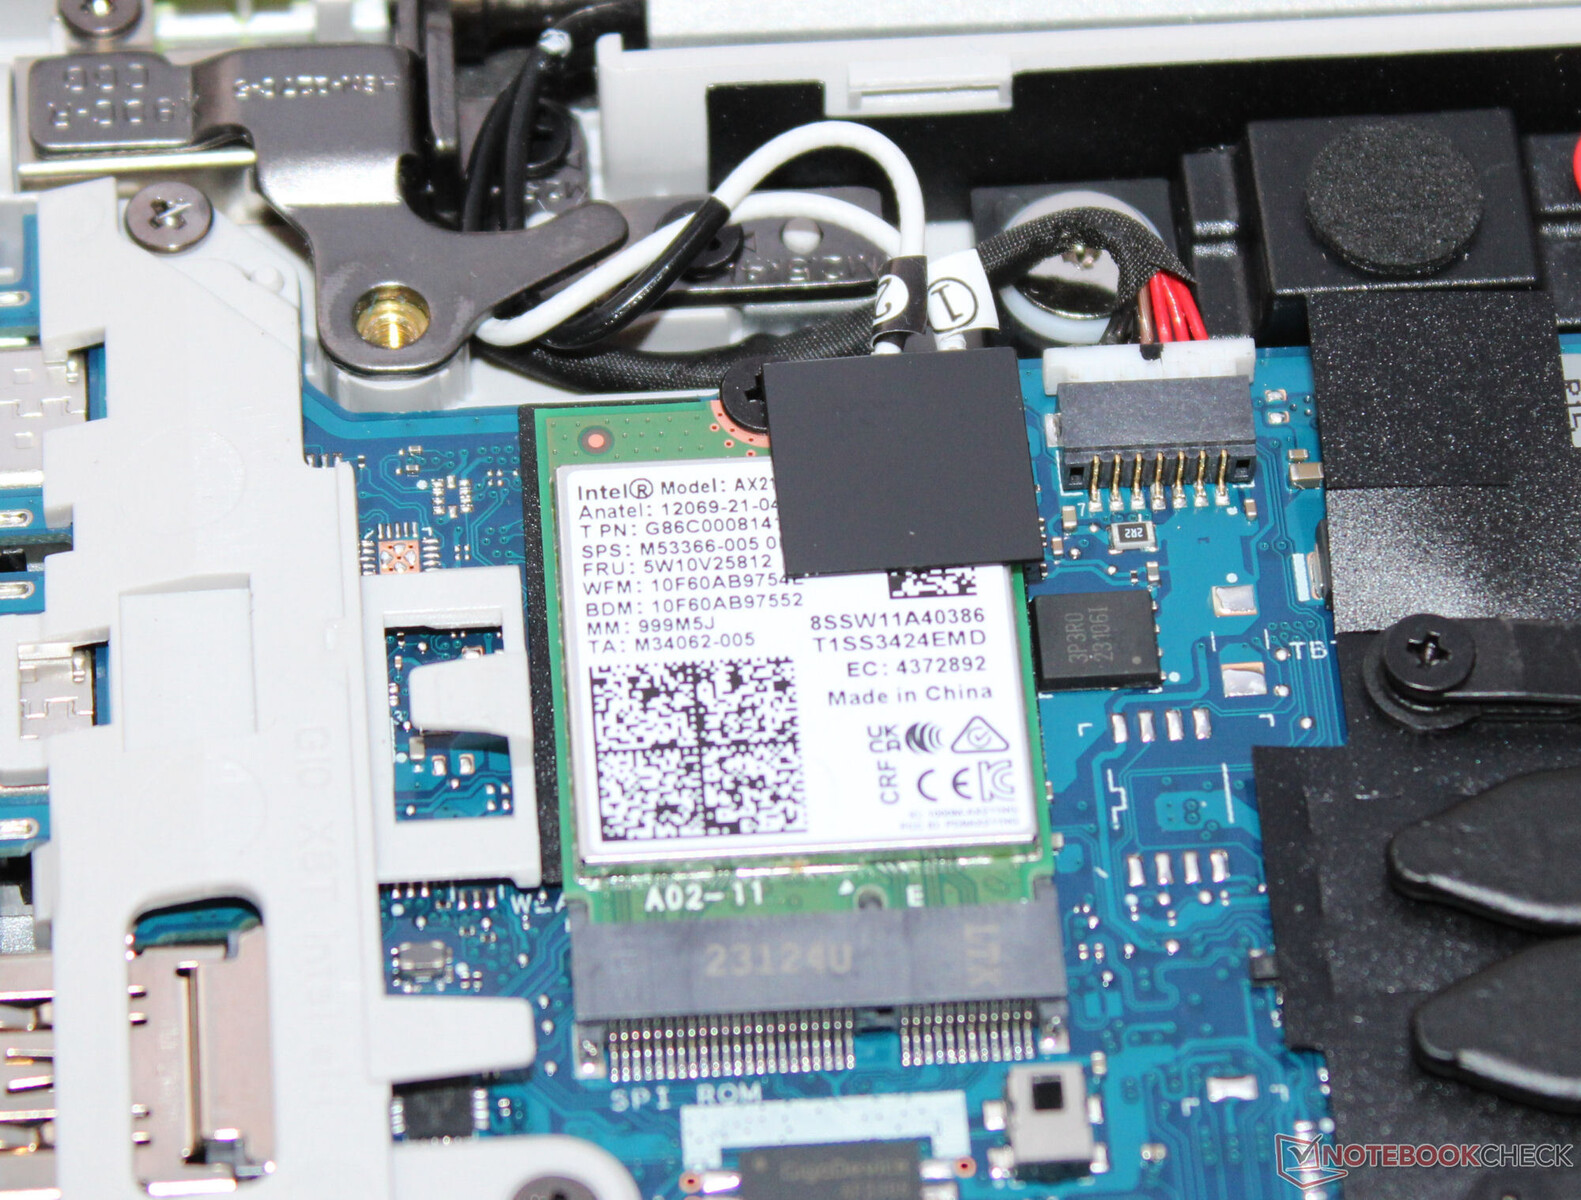
Em condições ideais (sem dispositivos WLAN nas proximidades, curta distância entre o laptop e o PC servidor), ele atinge taxas de dados WiFi muito boas. O 450 usa um chip WiFi 6E (Intel AX211). As conexões com fio são feitas por um controlador (RTL8168/8111; 1 GBit/s) fabricado pela Realtek.
O dispositivo de teste atual não possui um modem LTE/5G, nem pode ser equipado com um. Ele não tem uma antena nem um leitor de cartão SIM. Se o senhor precisar disso, terá que optar por um modelo diferente do ProBook. Em geral, a série oferece suporte a WWAN.
Webcam
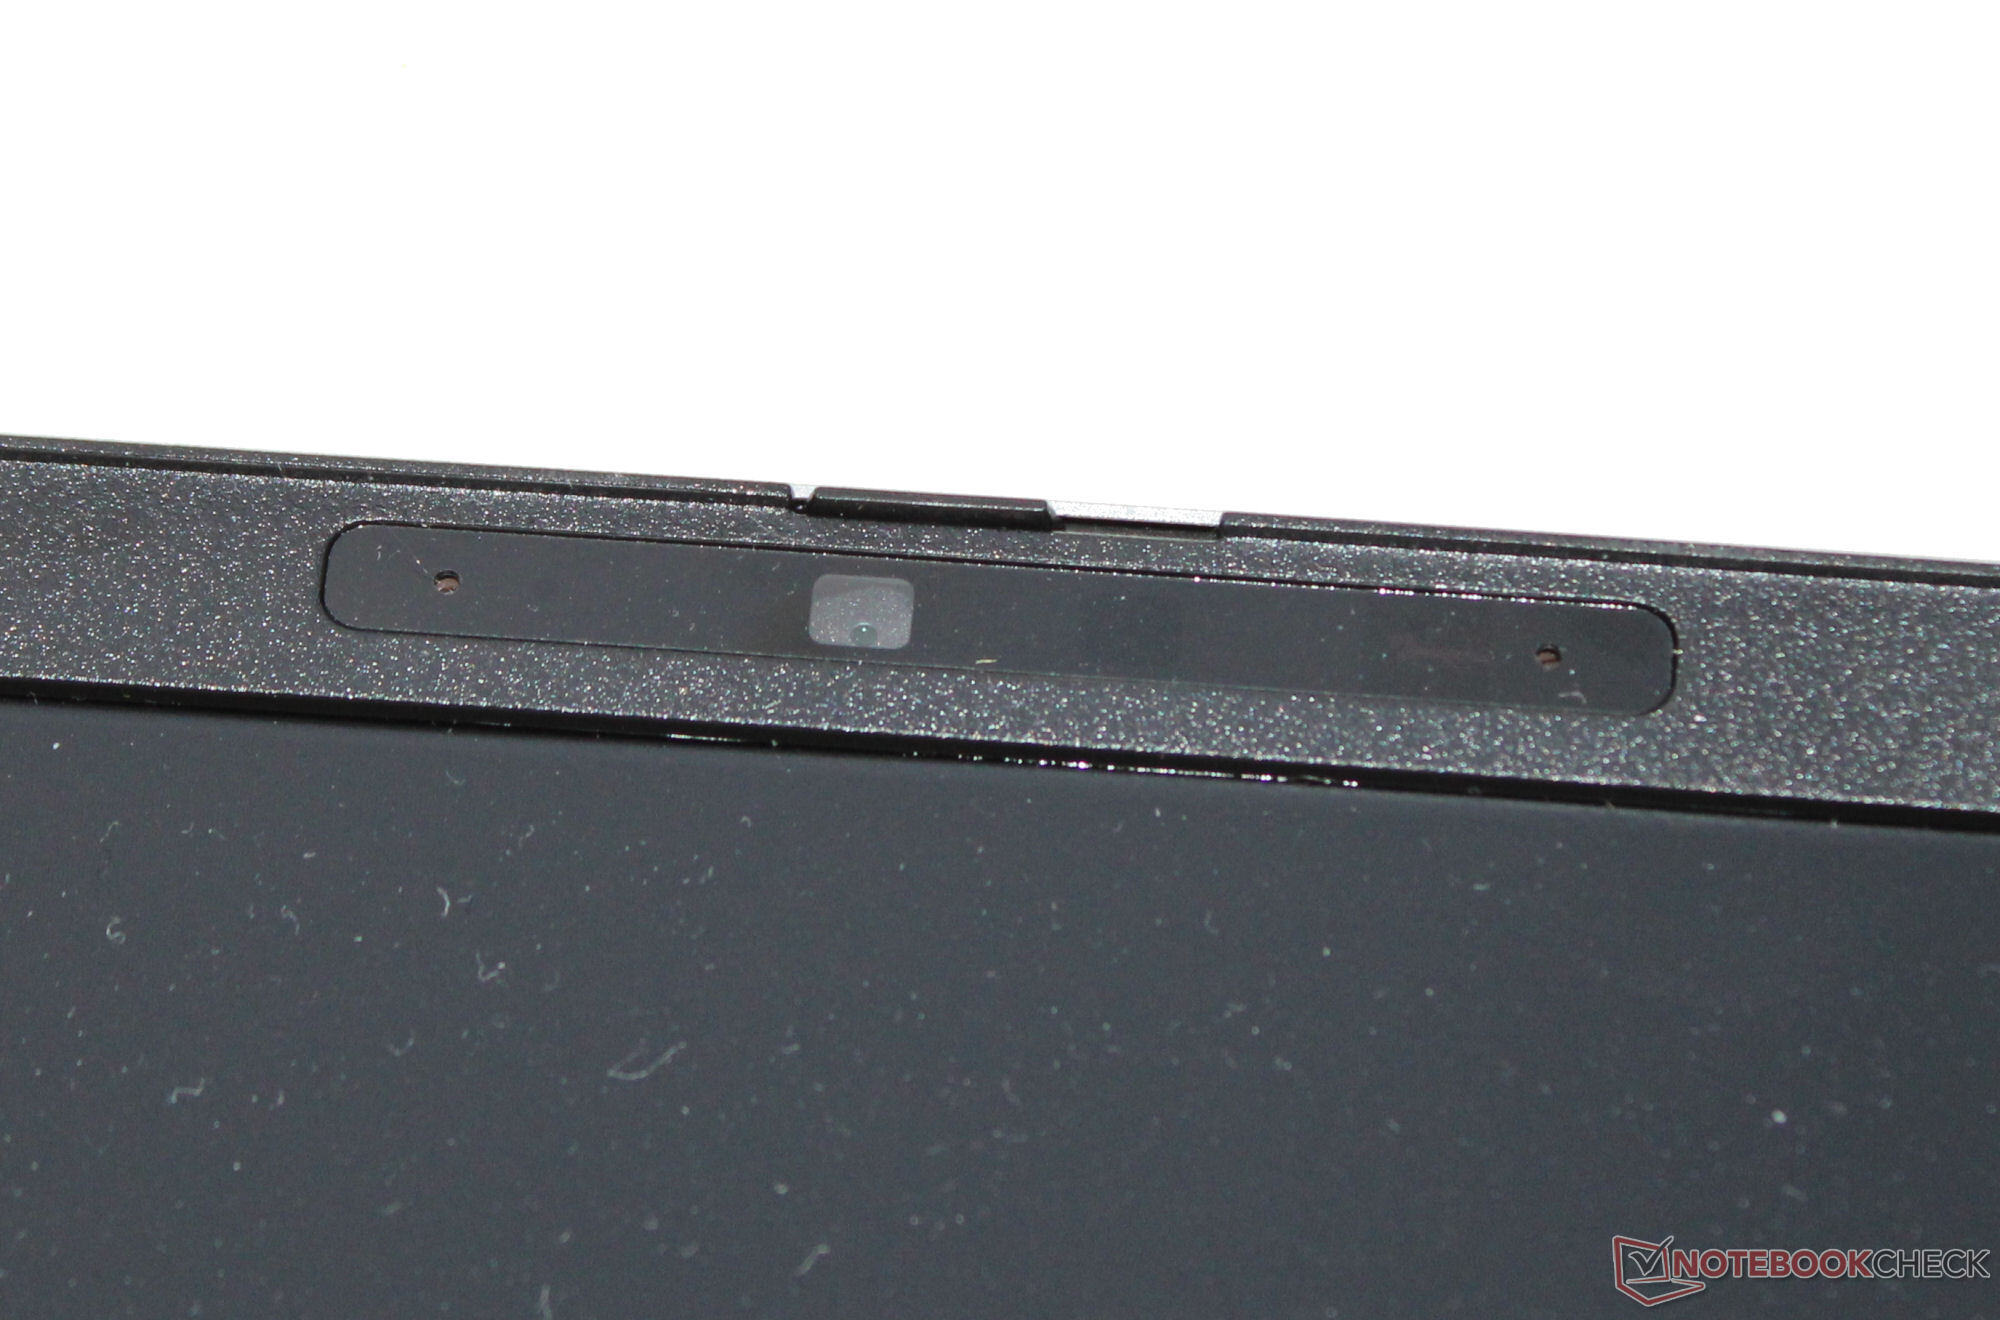
A HP acomoda a tendência contínua de videoconferências e reuniões pelo Zoom com uma webcam de 5 MP (máx. 2.560 x 1.440 pixels, infravermelho). Ela provavelmente não produzirá nenhuma obra de arte: a qualidade da imagem é mediana, na melhor das hipóteses. Além disso: Com um desvio de cor de quase 20, o objetivo (DeltaE < 3) é muito difícil de ser alcançado. Pontos positivos: A câmera tem uma tampa mecânica.


Segurança
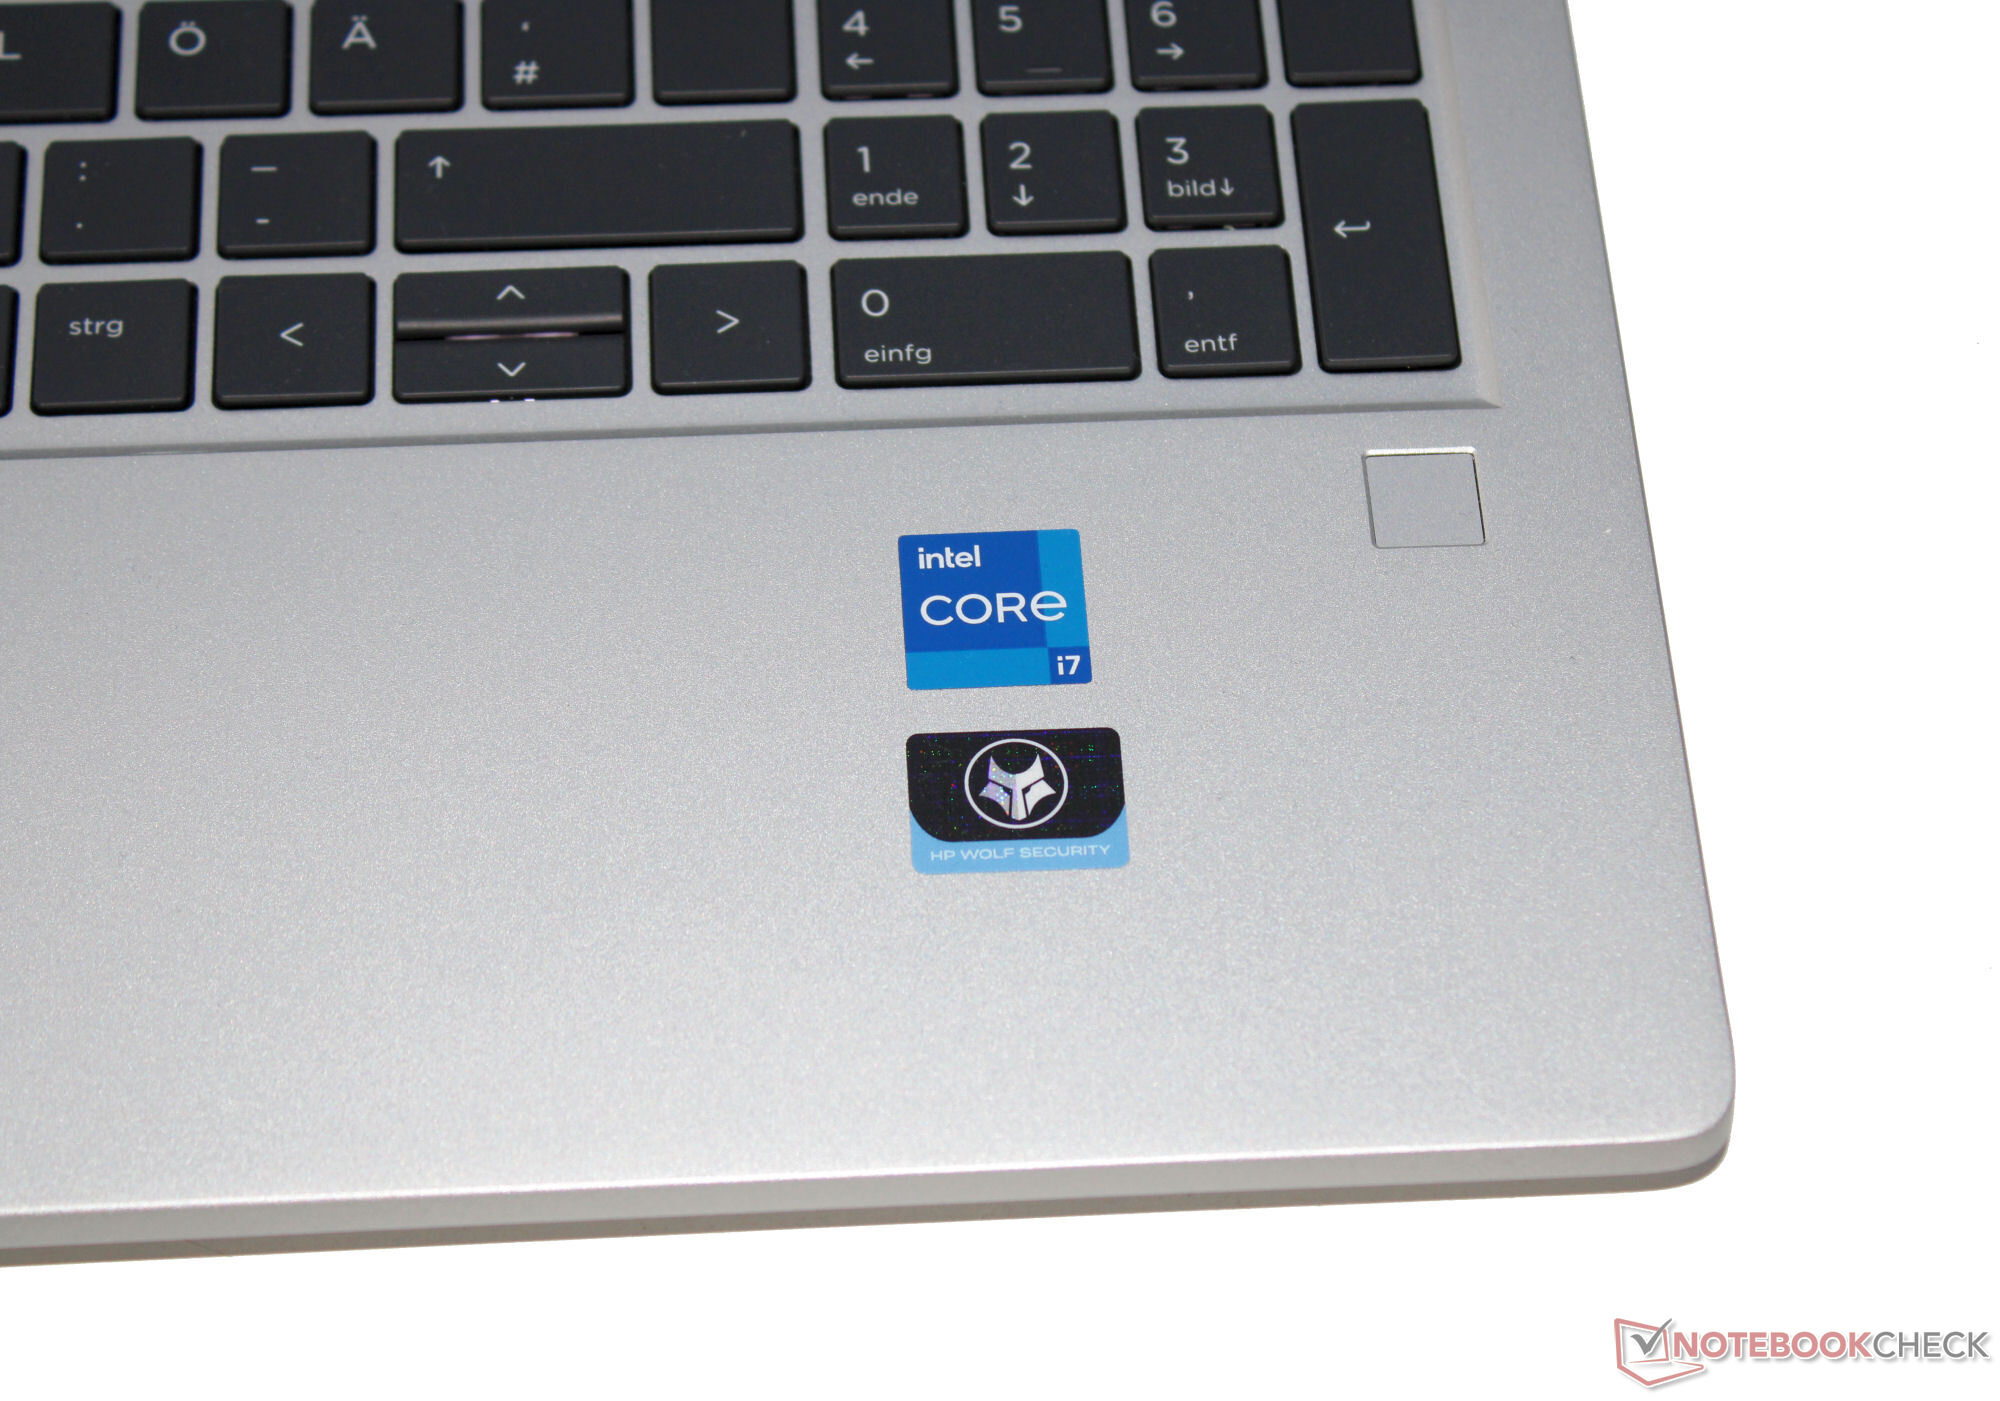
O laptop permite a segurança de acesso por meio de impressão digital e do Windows Hello. Há também um Trusted Platform Module (2.0) integrado. O dispositivo pode ser fisicamente protegido por meio de uma trava de cabo. Quanto ao software, há vários aplicativos proprietários da HP, como o HP Sure Run (que monitora os aplicativos em busca de ataques) e o HP Wolf Security for Business (que protege os dispositivos finais contra ataques).
Acessórios
Além dos documentos habituais (informações sobre garantia, pôster de início rápido), o 450 não vem com nenhum acessório adicional.
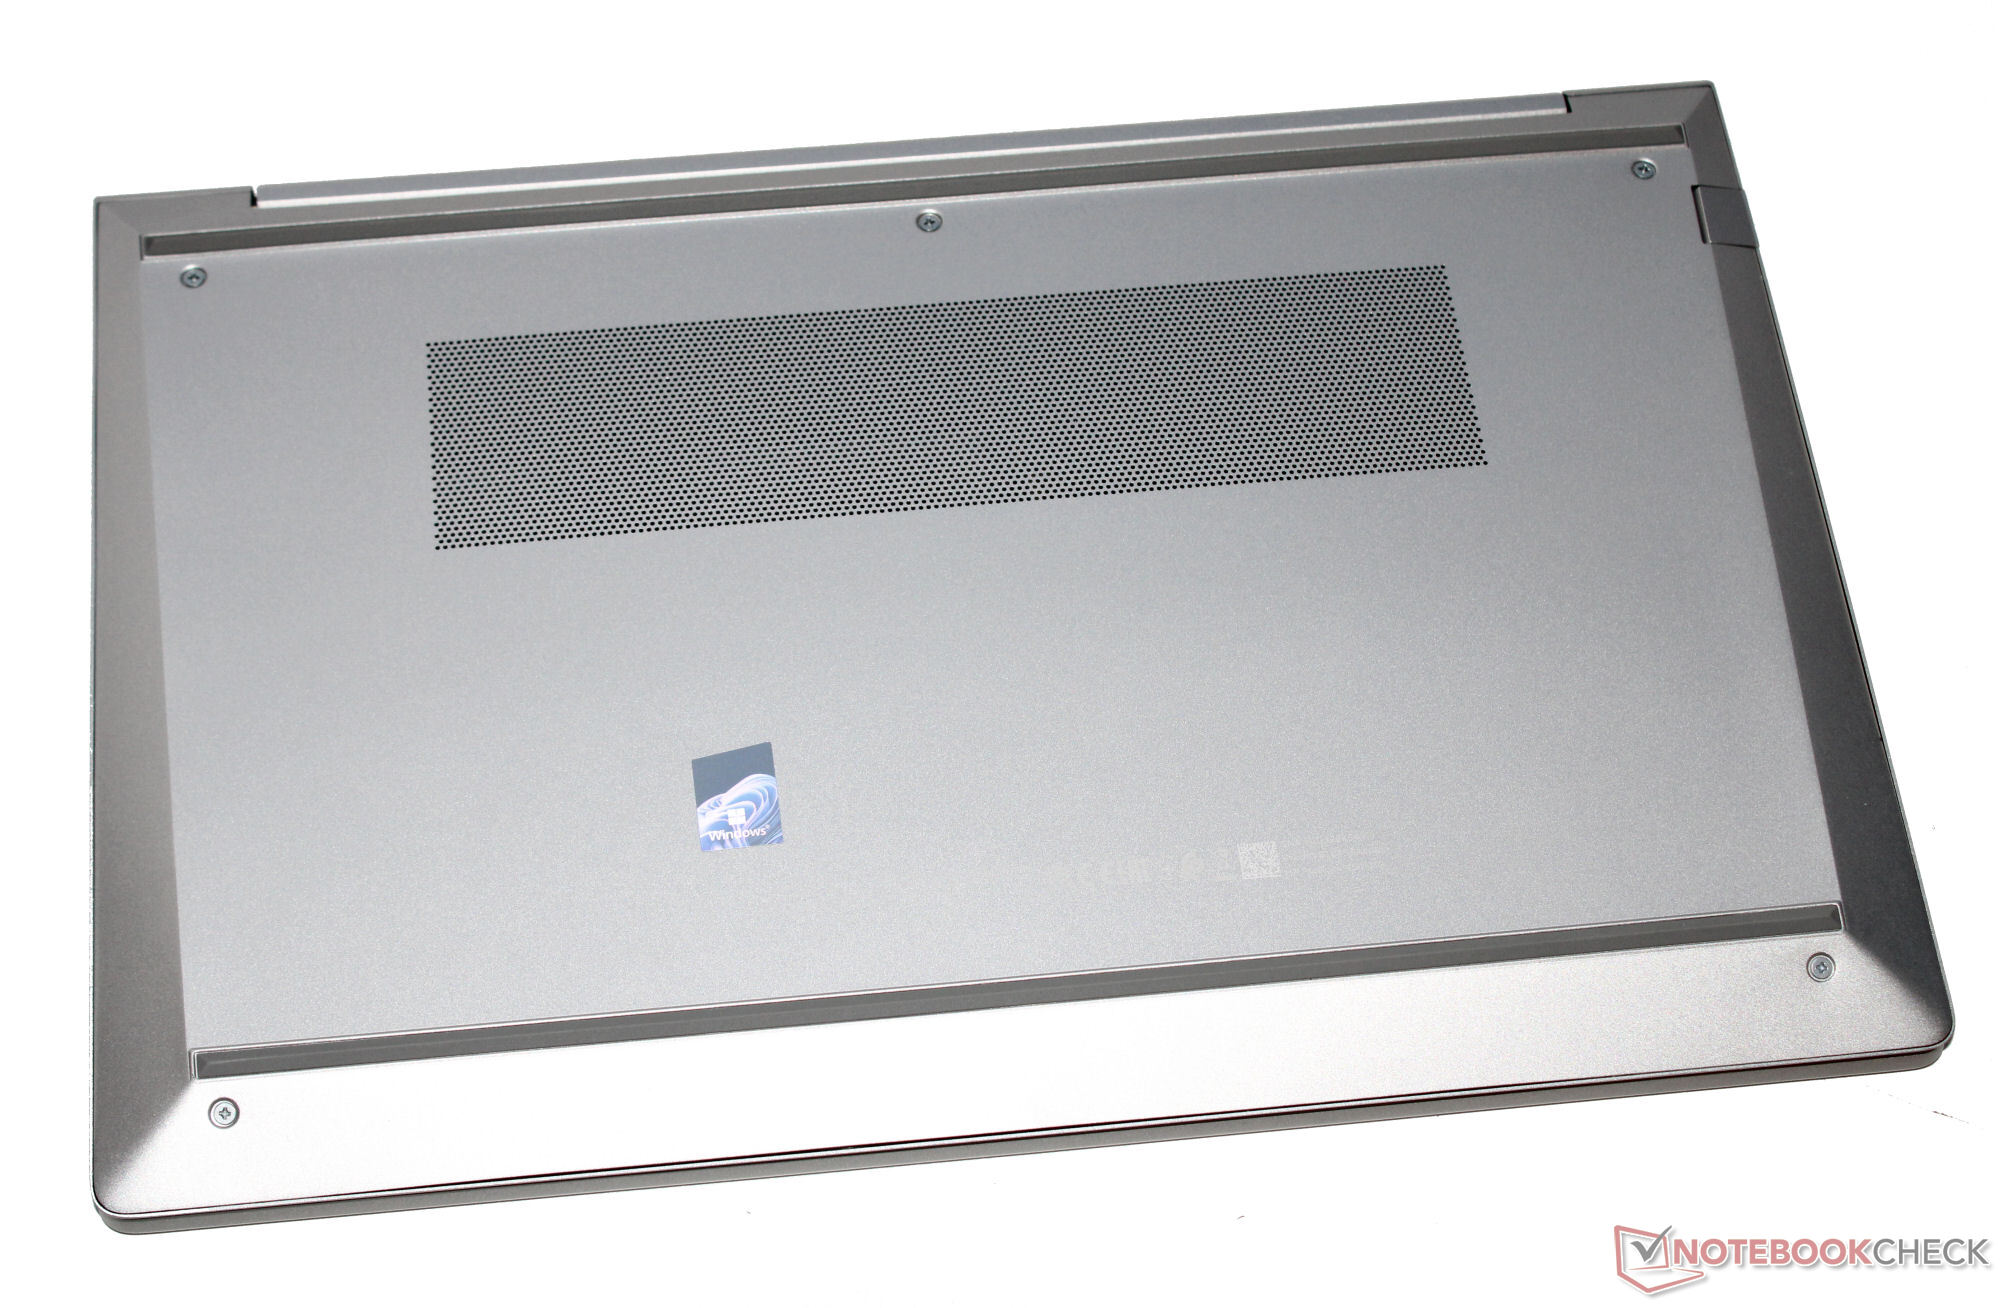
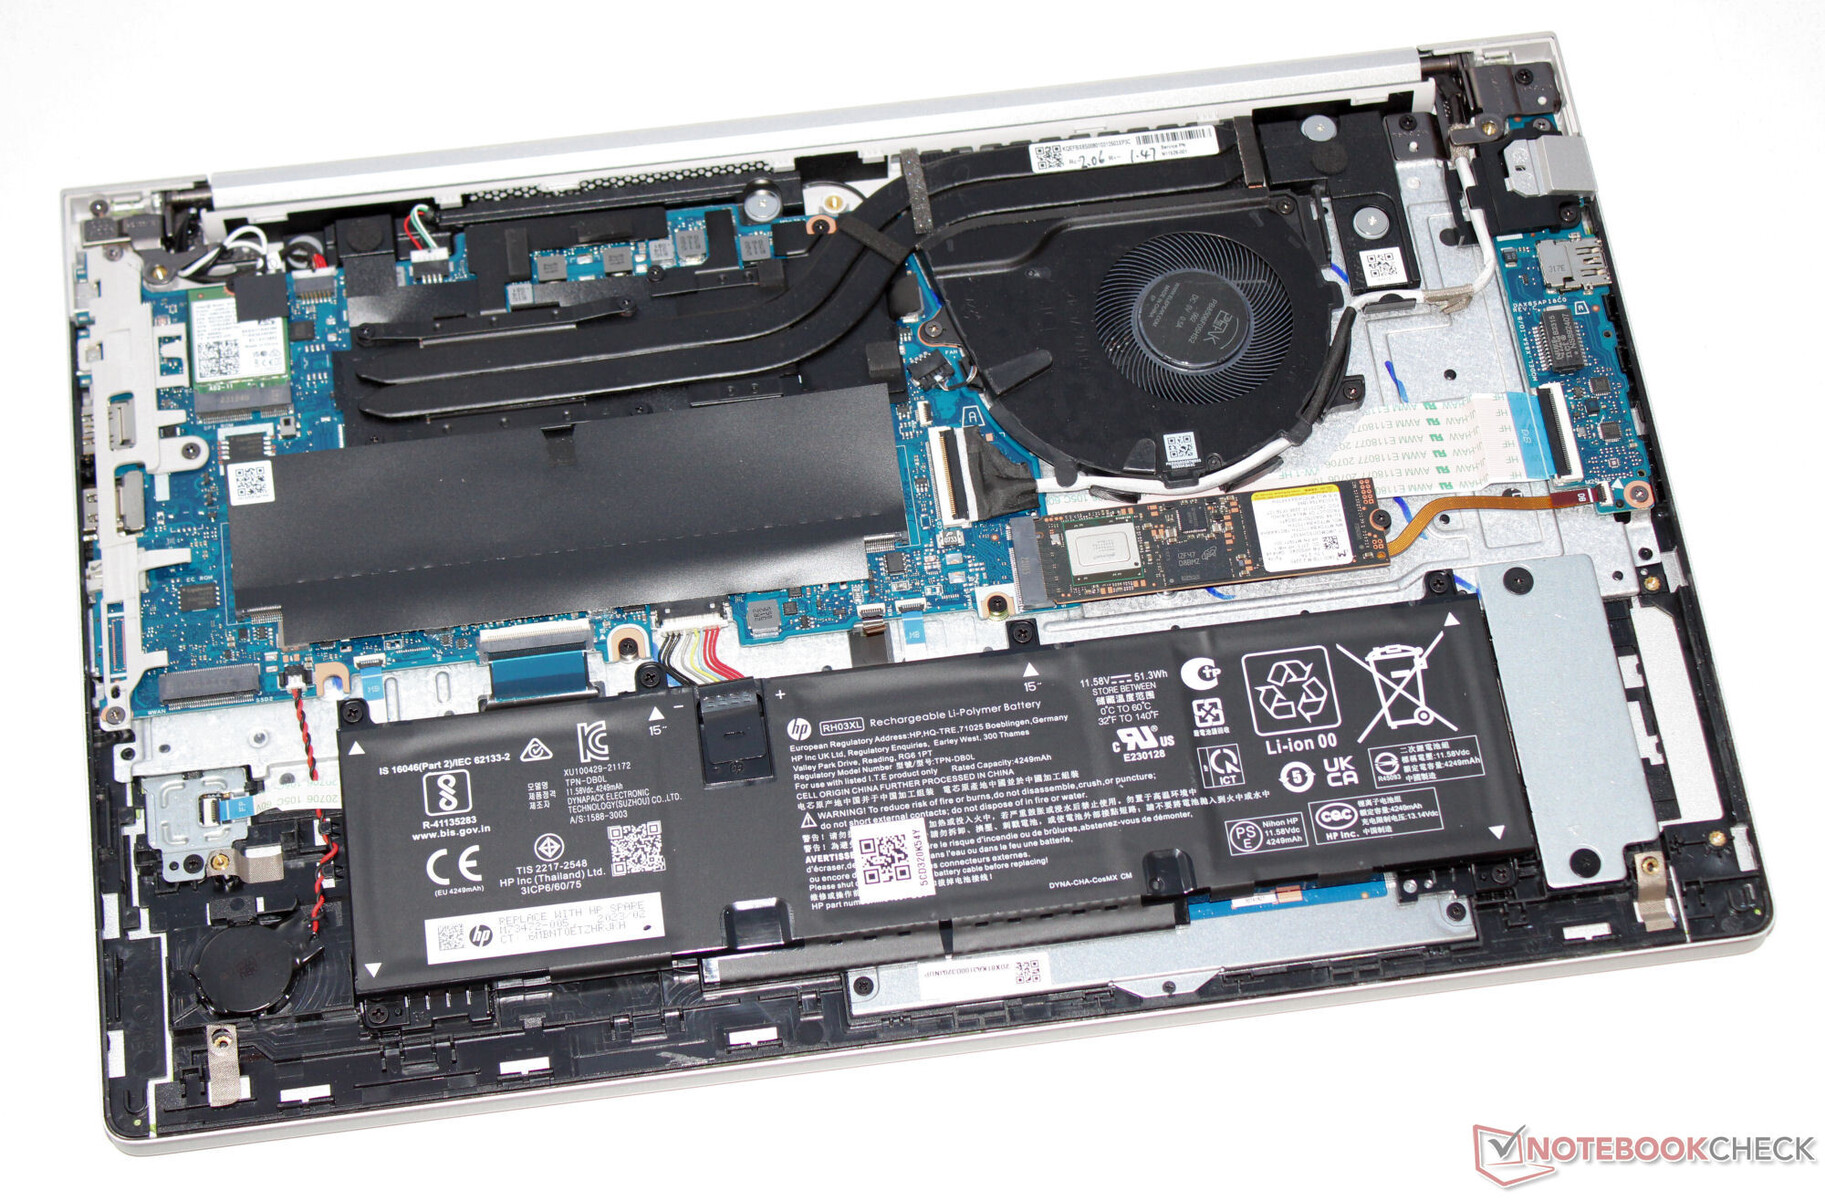
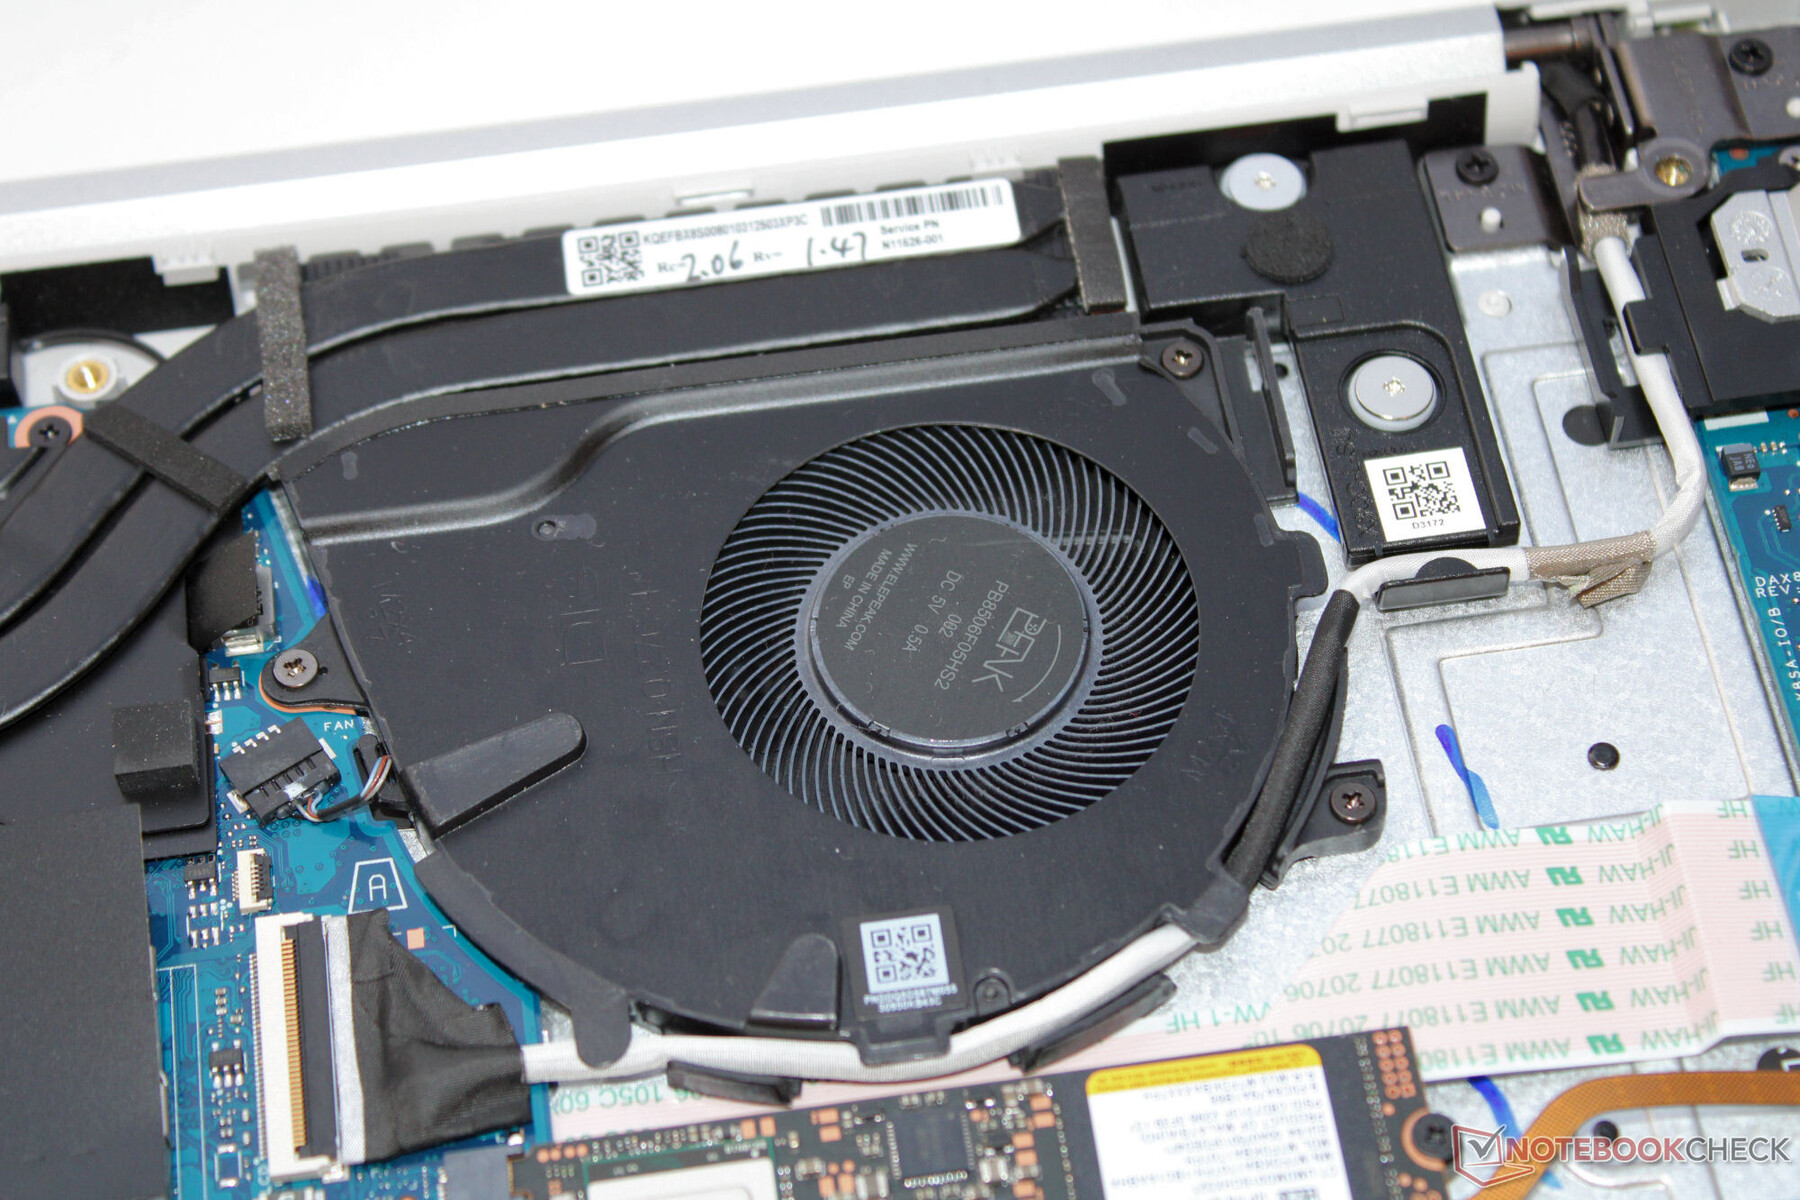
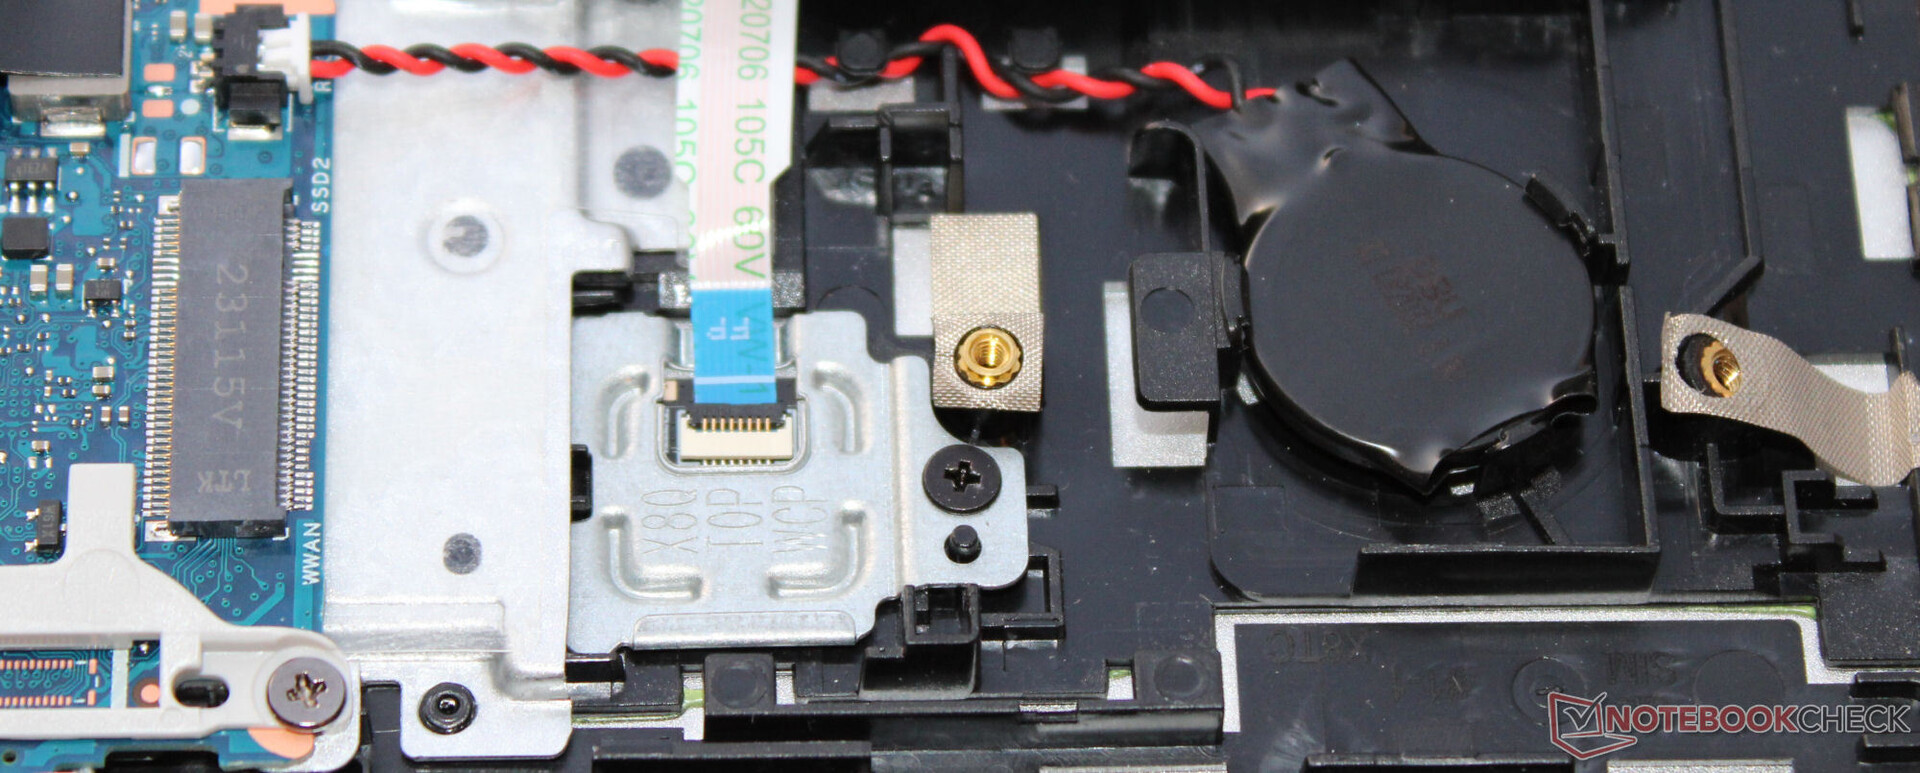
Manutenção
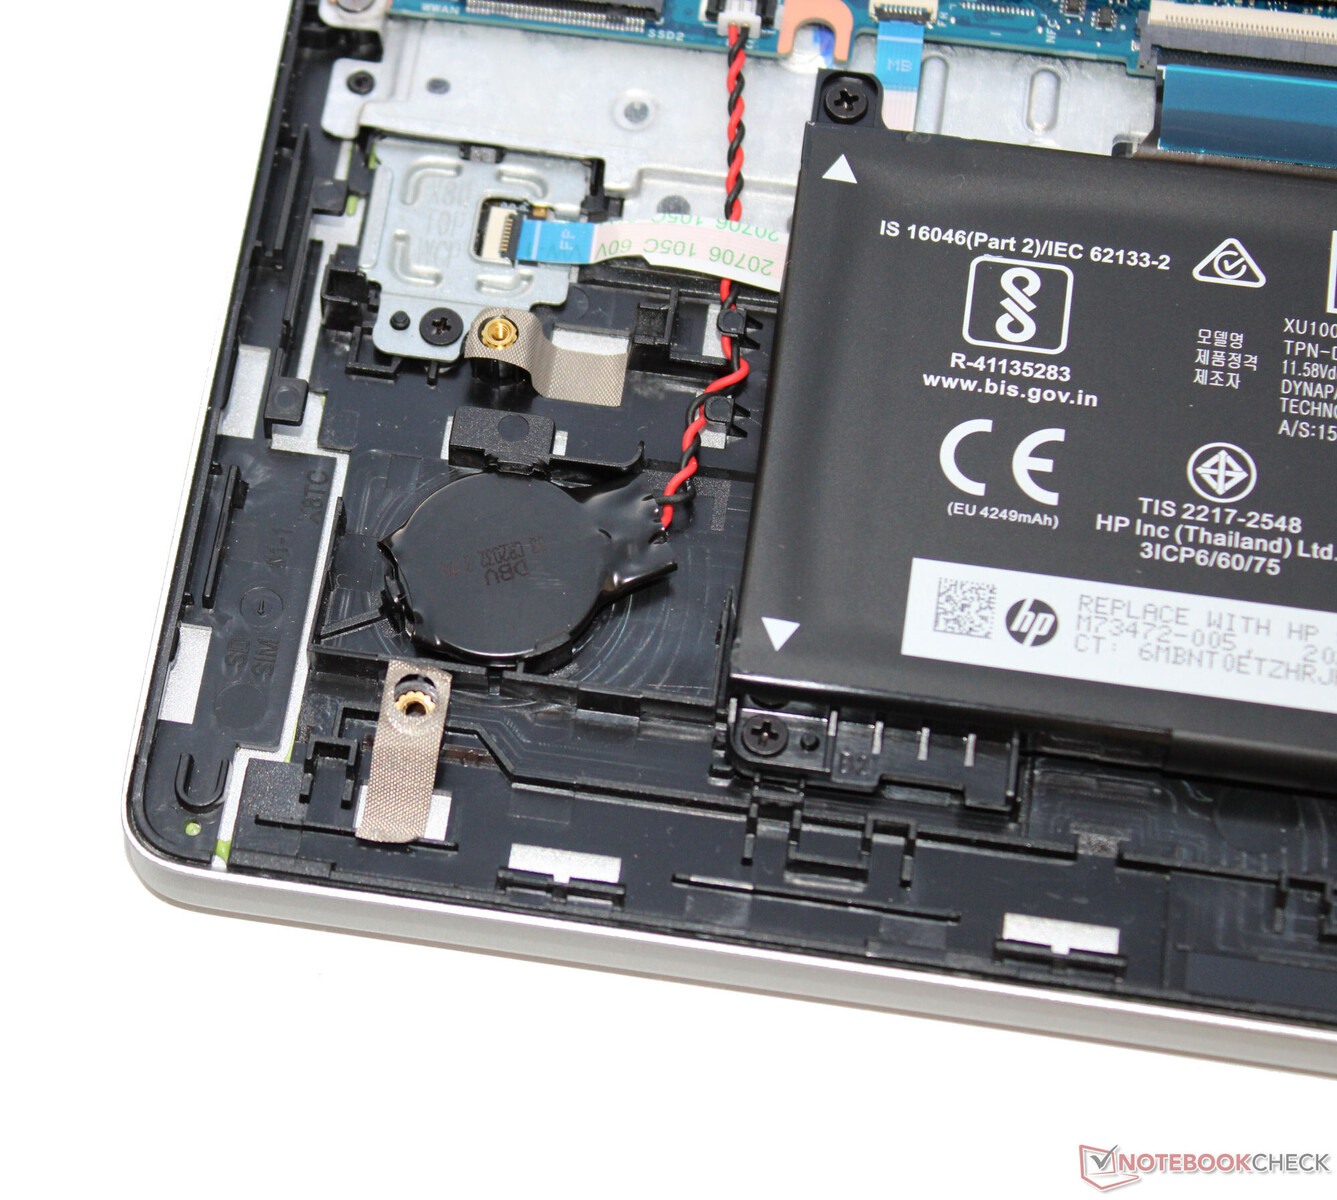
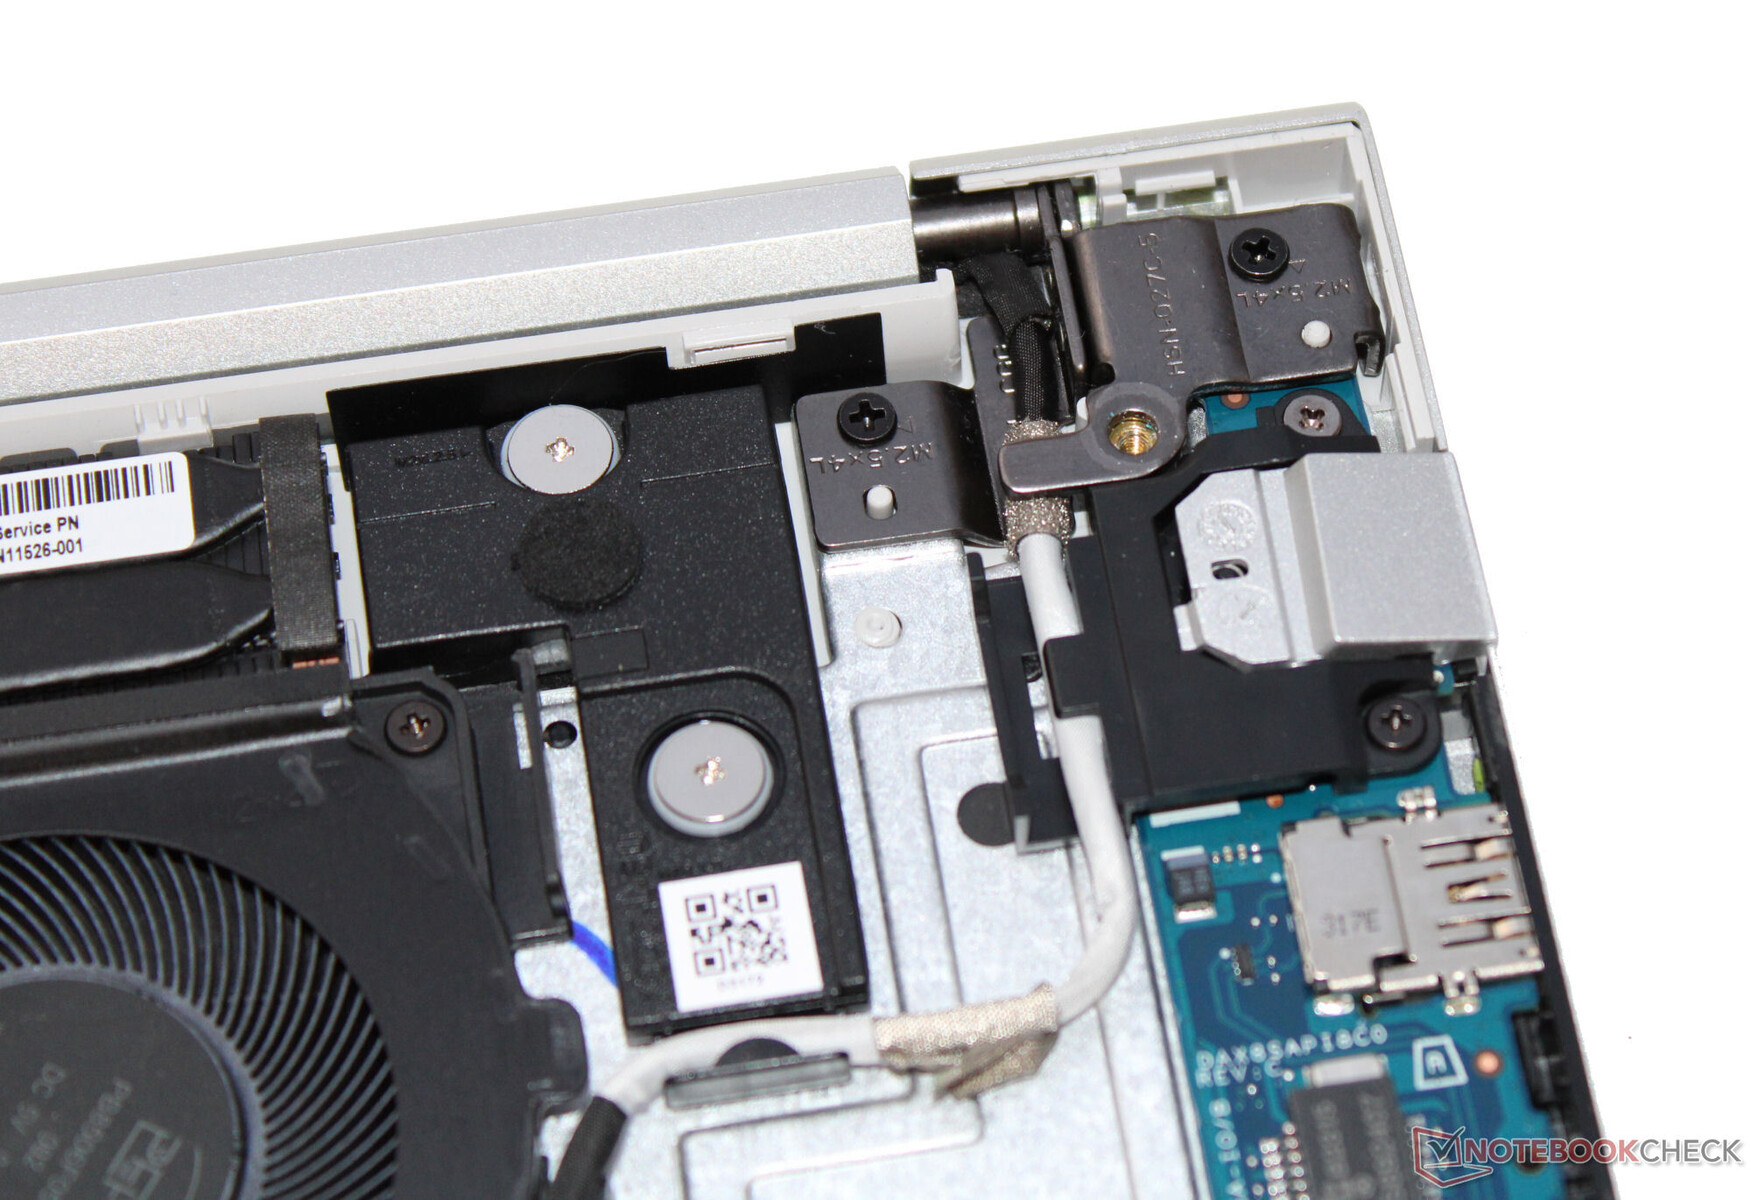
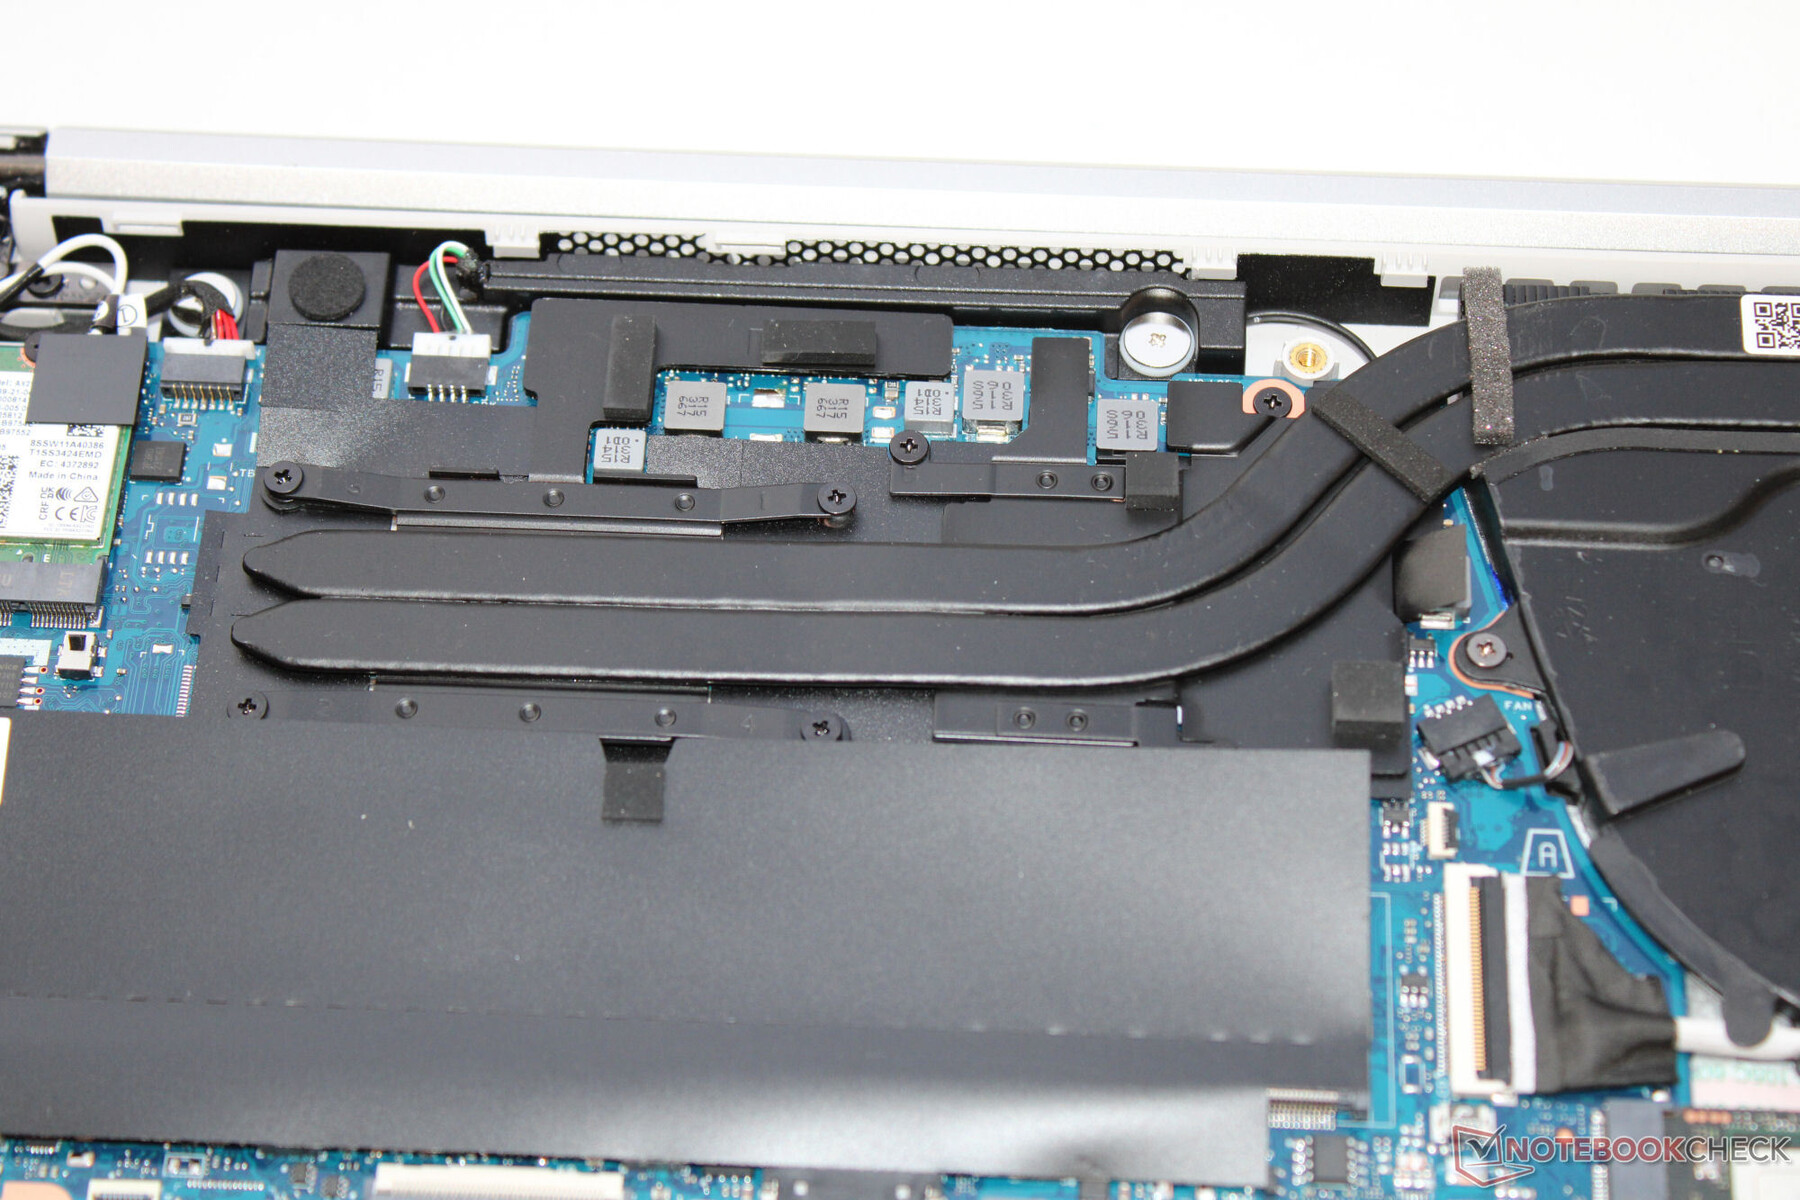
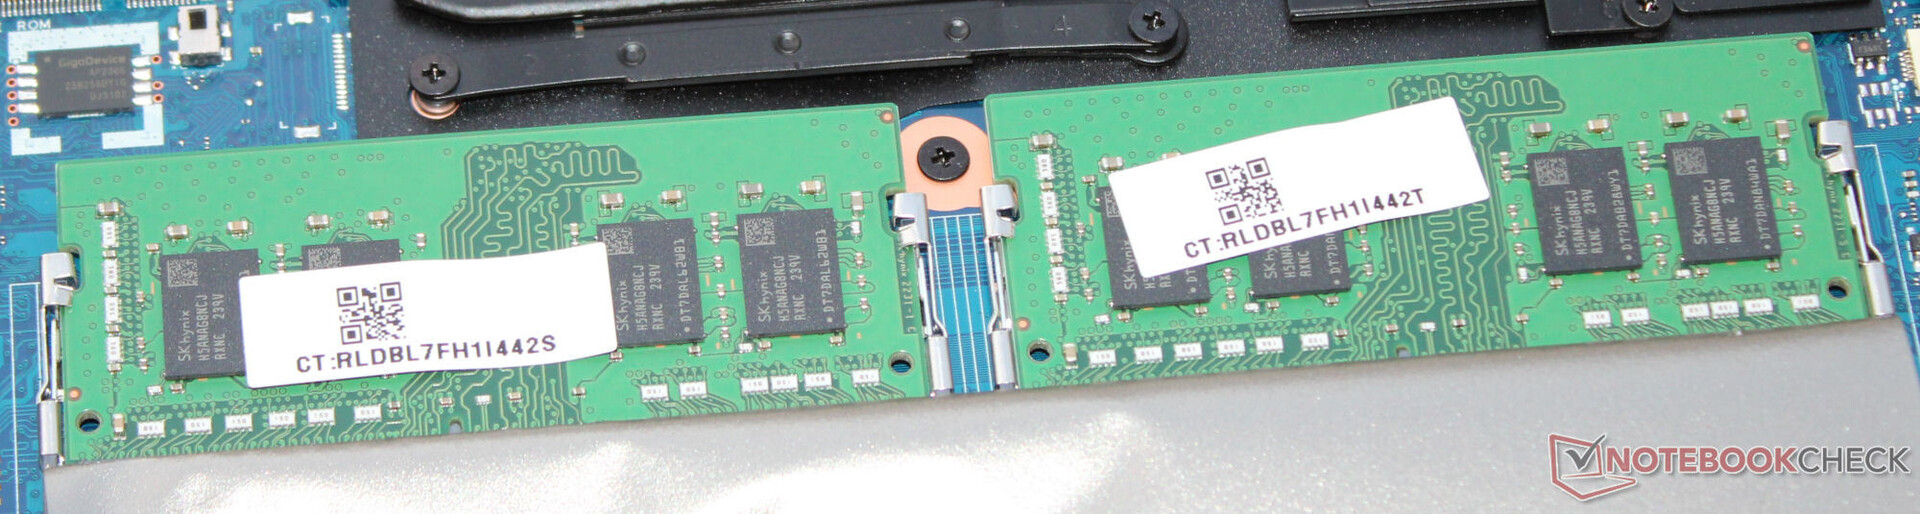
Depois de remover os cinco parafusos na parte inferior (a tira de borracha não esconde nenhum parafuso adicional), o senhor pode retirar a placa inferior com a ajuda de uma espátula ou de um plectro. Em seguida, é possível acessar o SSD (PCIe 4), o segundo slot SSD (M.2-2242 ou M.2-2230 com a extensão correspondente), o módulo WLAN, os bancos de memória, a bateria, os alto-falantes, os ventiladores e a bateria do BIOS.
Ao contrário dos modelos anteriores do ProBook HP ProBook 450 G5 (i5-8250U, FHD) Laptop Review , o teclado do G10 não pode ser simplesmente substituído. Para fazer isso, o senhor teria que substituir a parte superior do gabinete, o que exigiria a desmontagem de todo o laptop.
Garantia
Nos EUA, o ProBook tem uma garantia limitada de um ano. Há opções para estender essa garantia no site da HP por uma taxa adicional.
Dispositivos de entrada - O laptop HP com um teclado nítido
Teclado
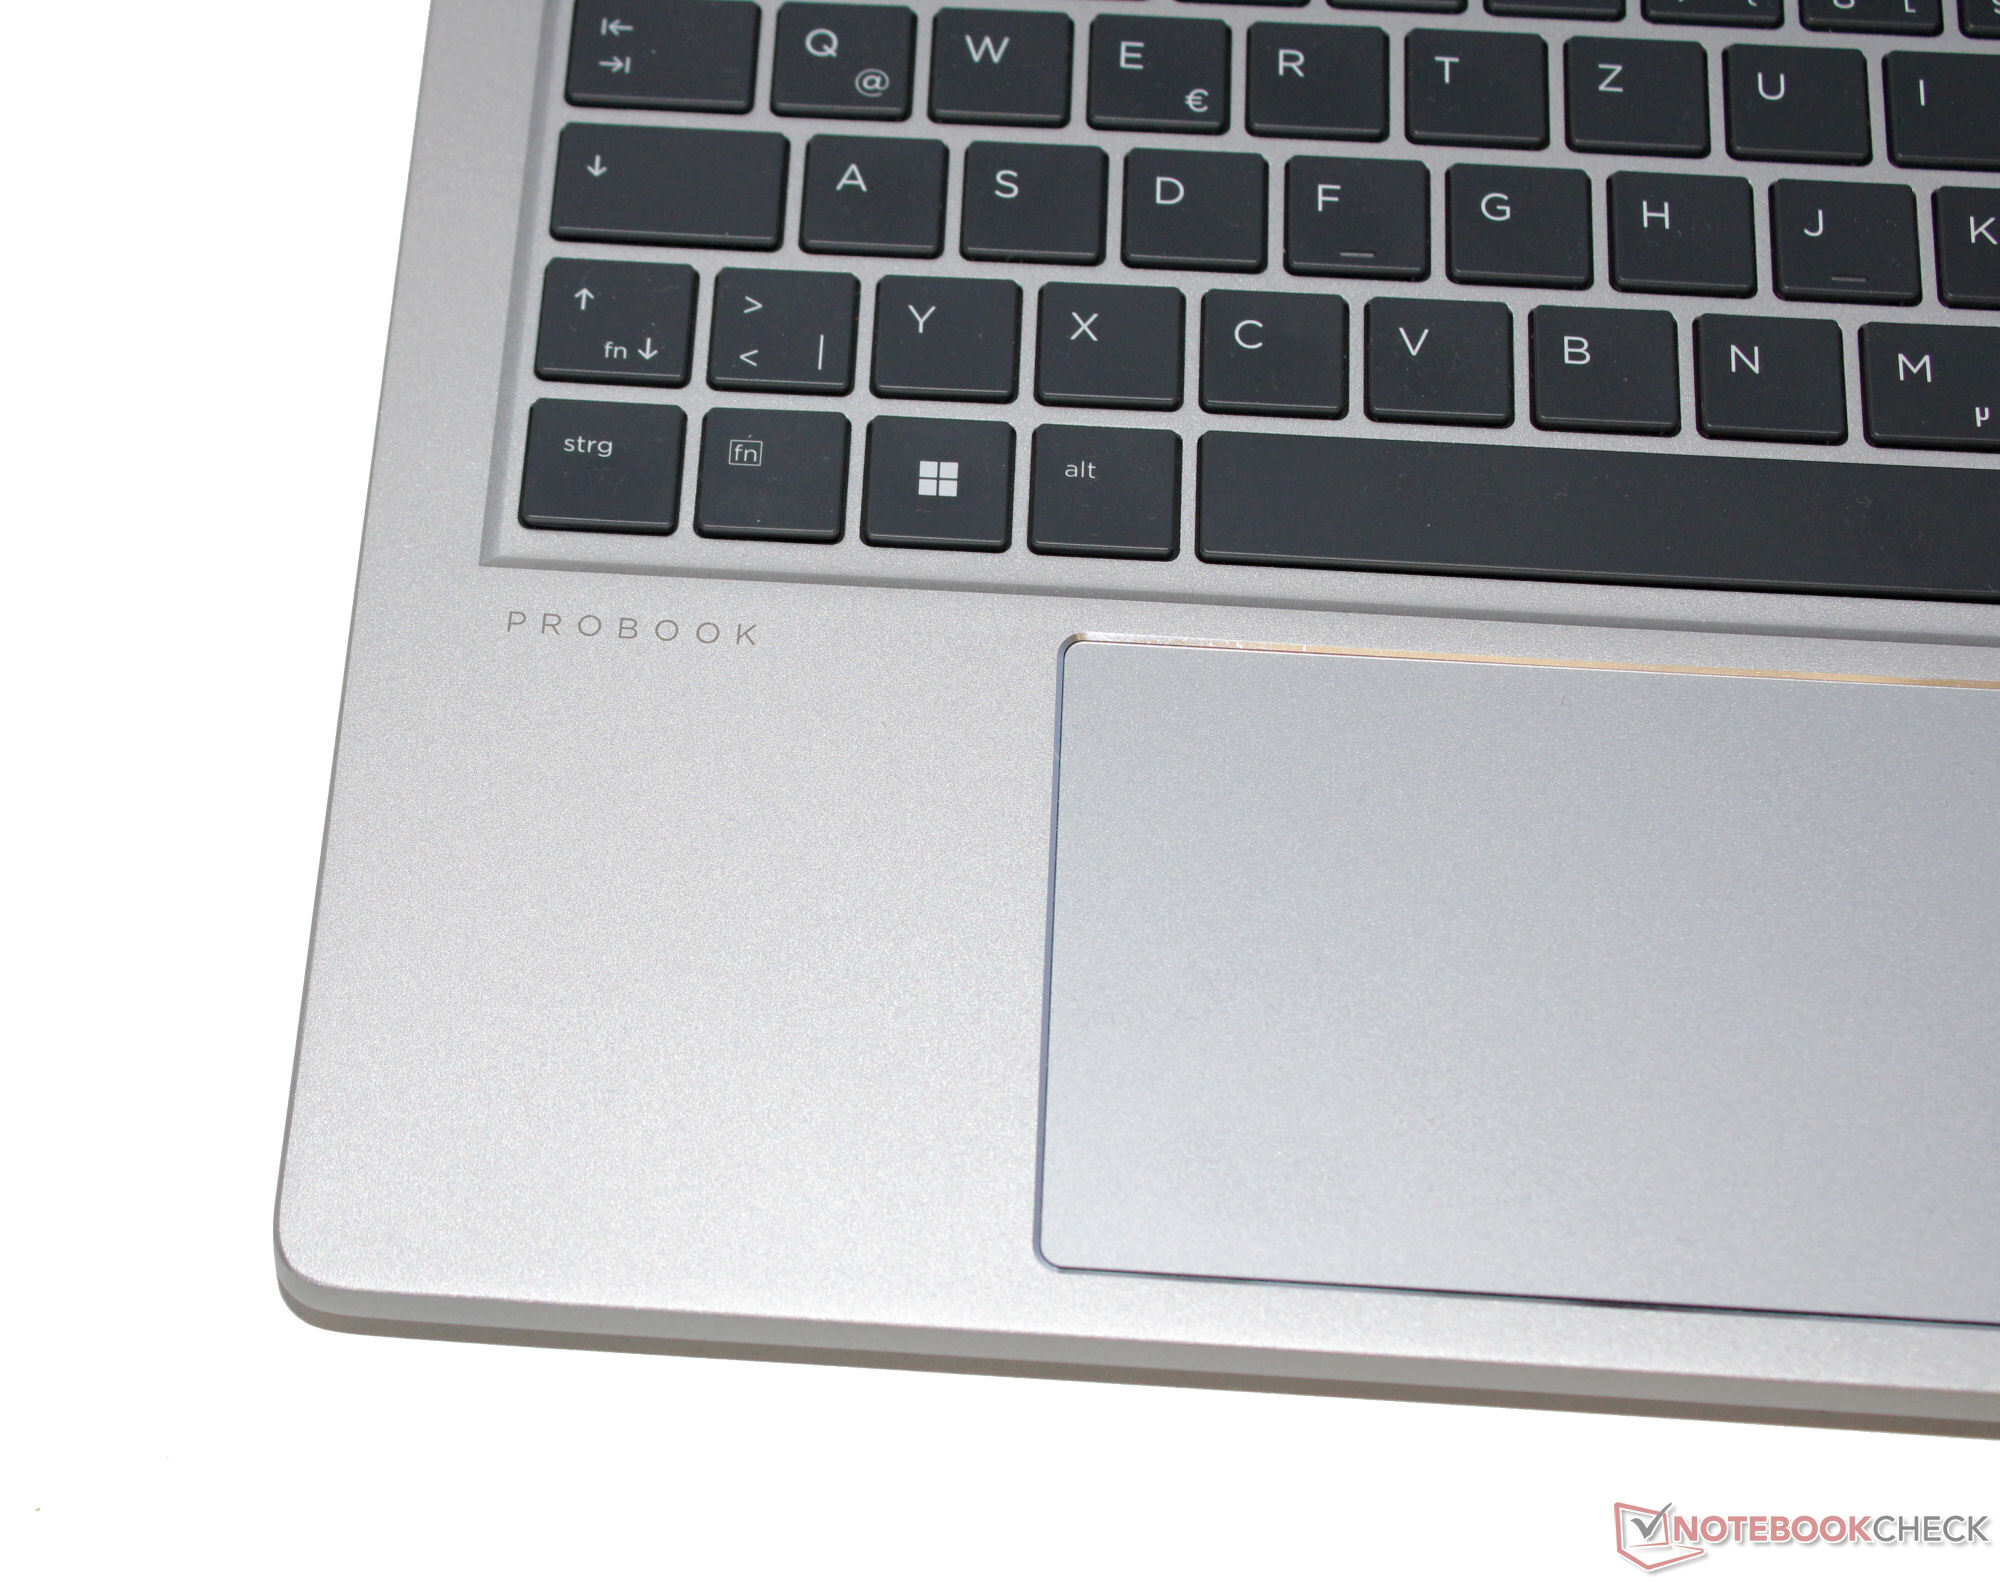
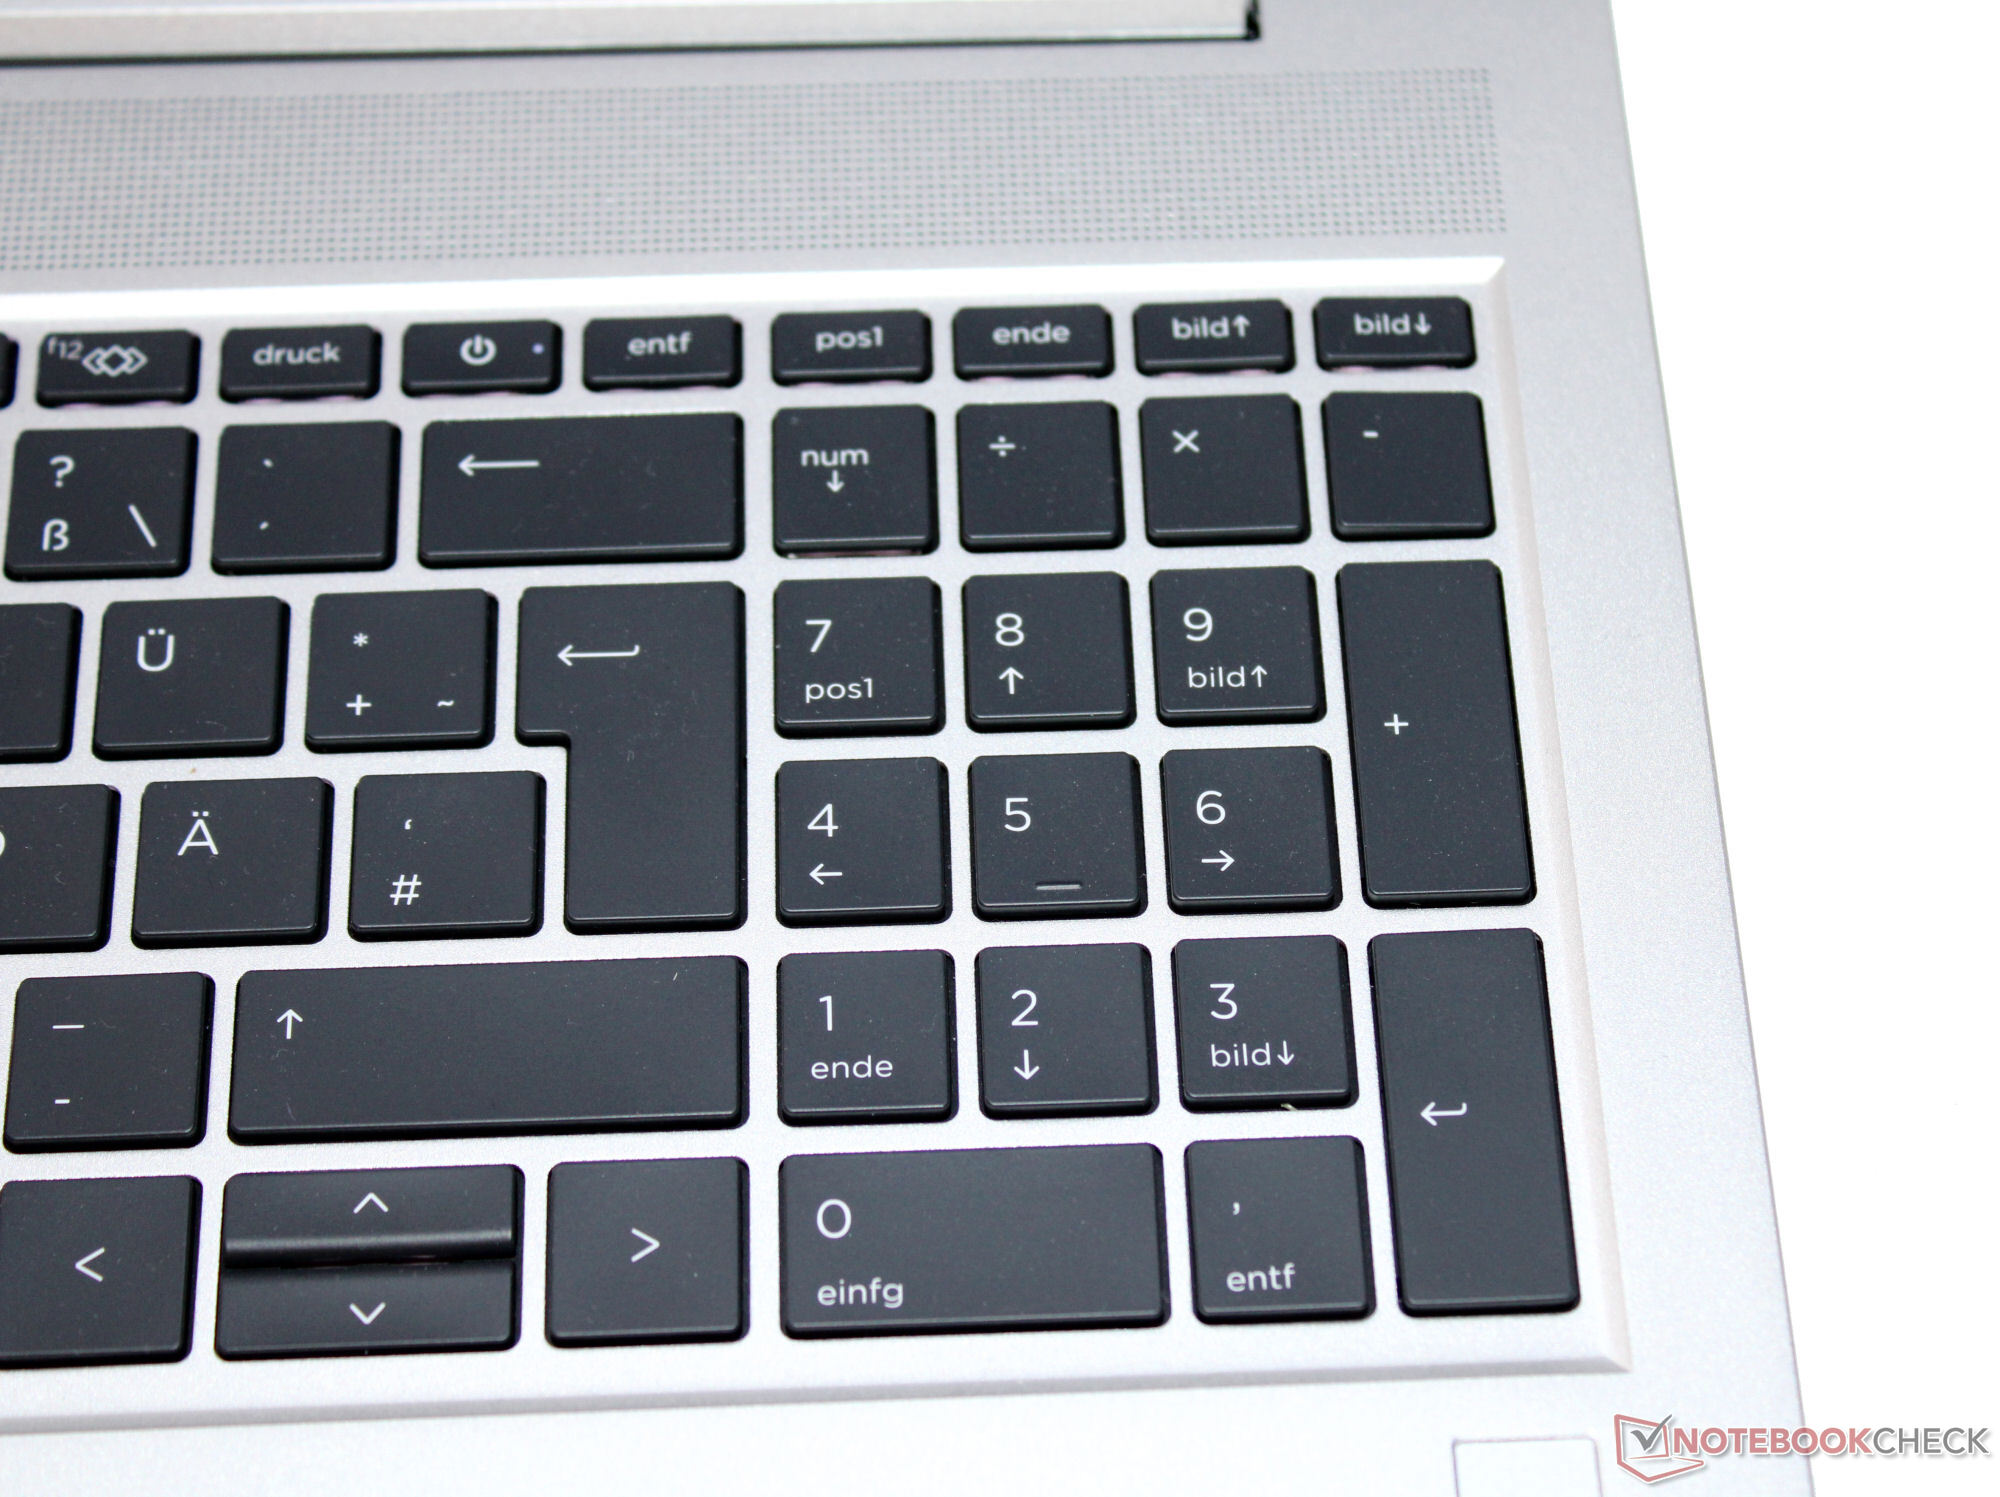
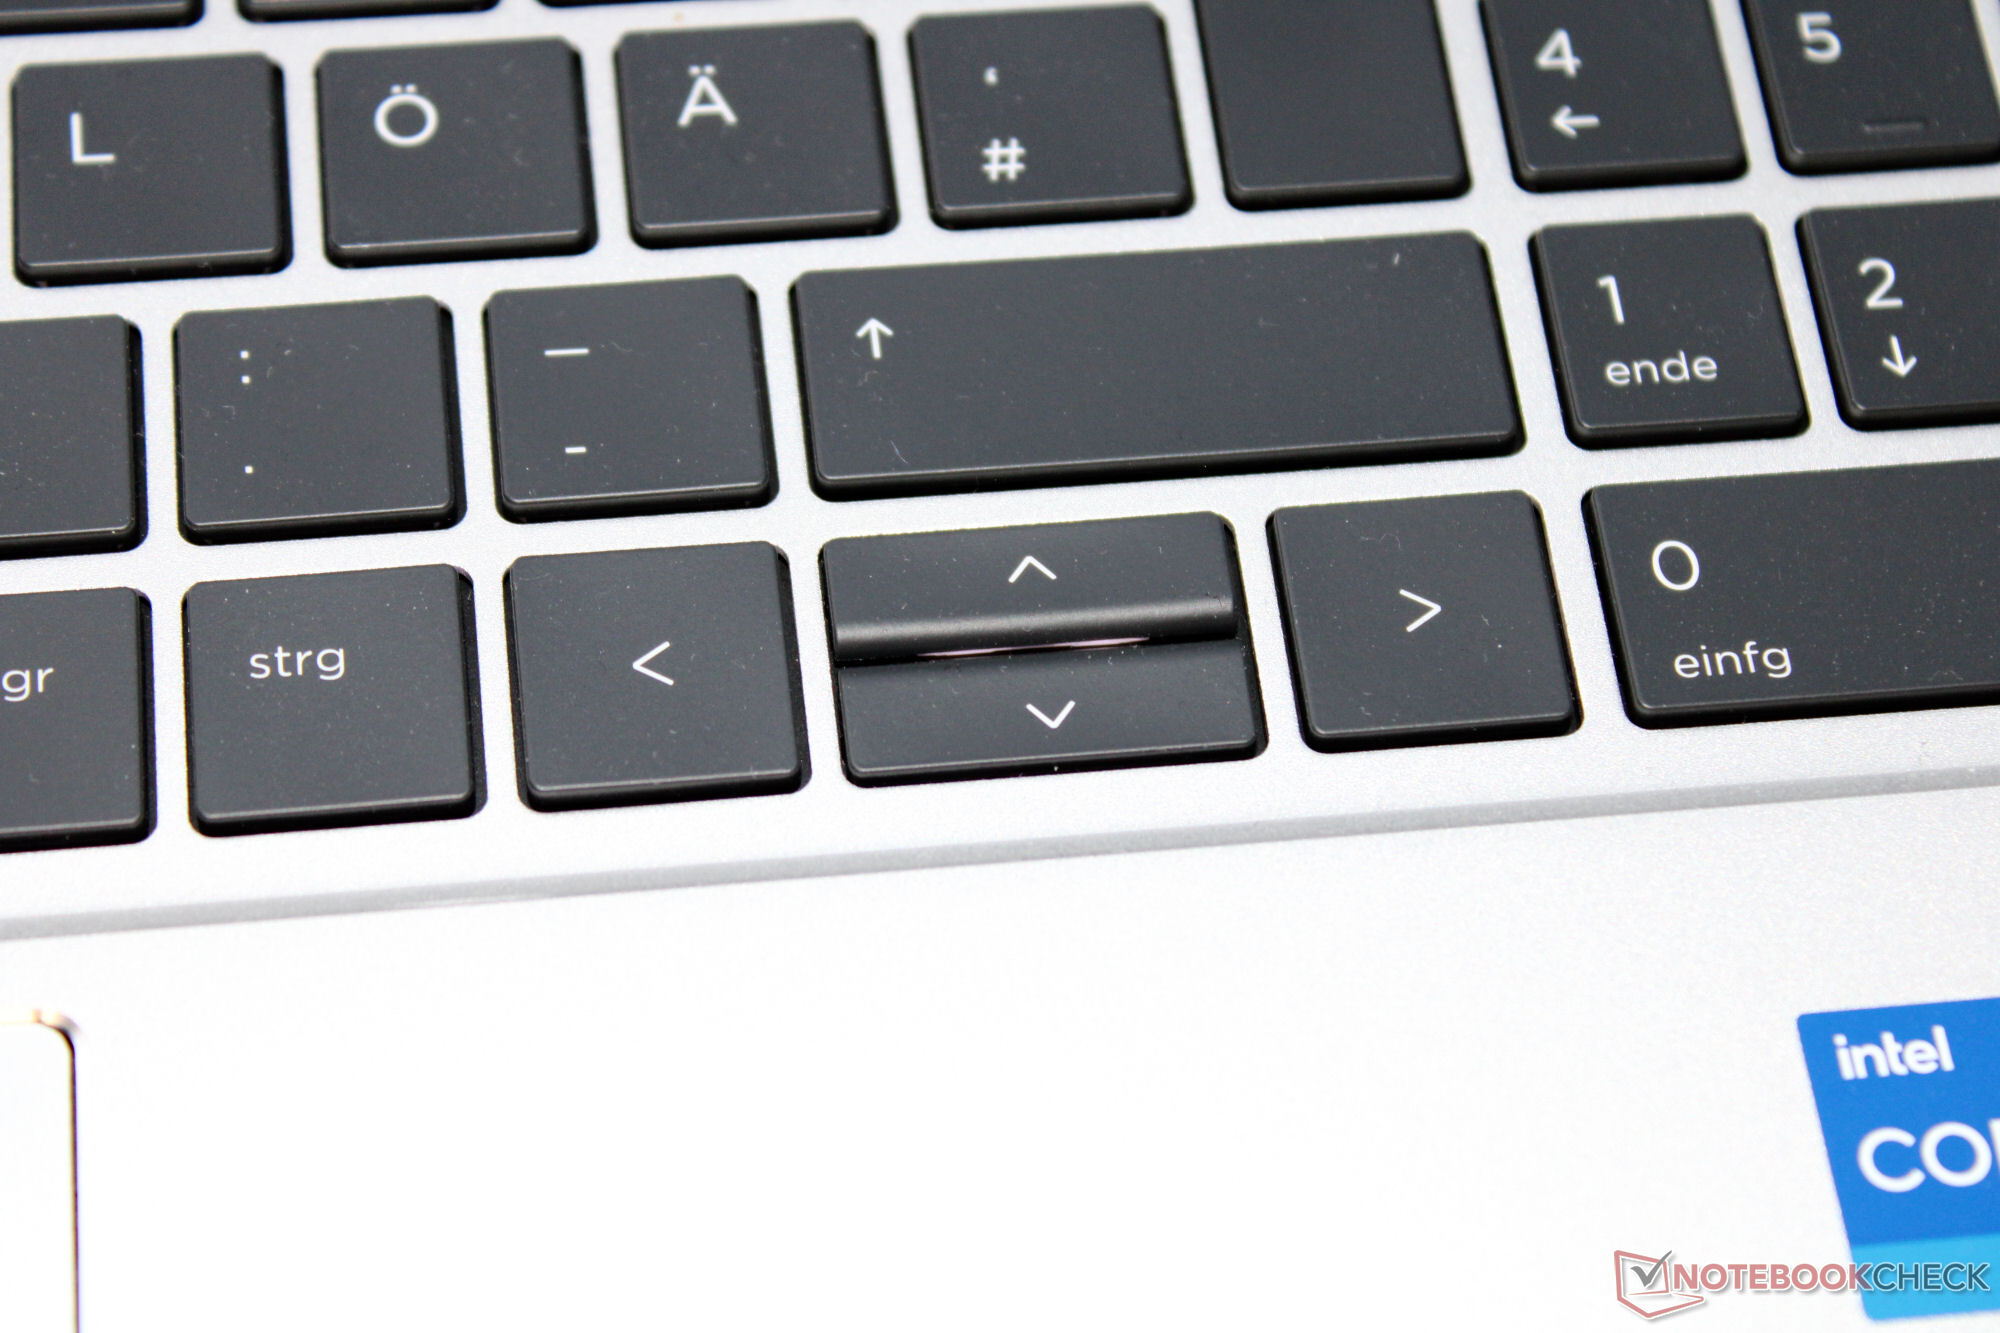
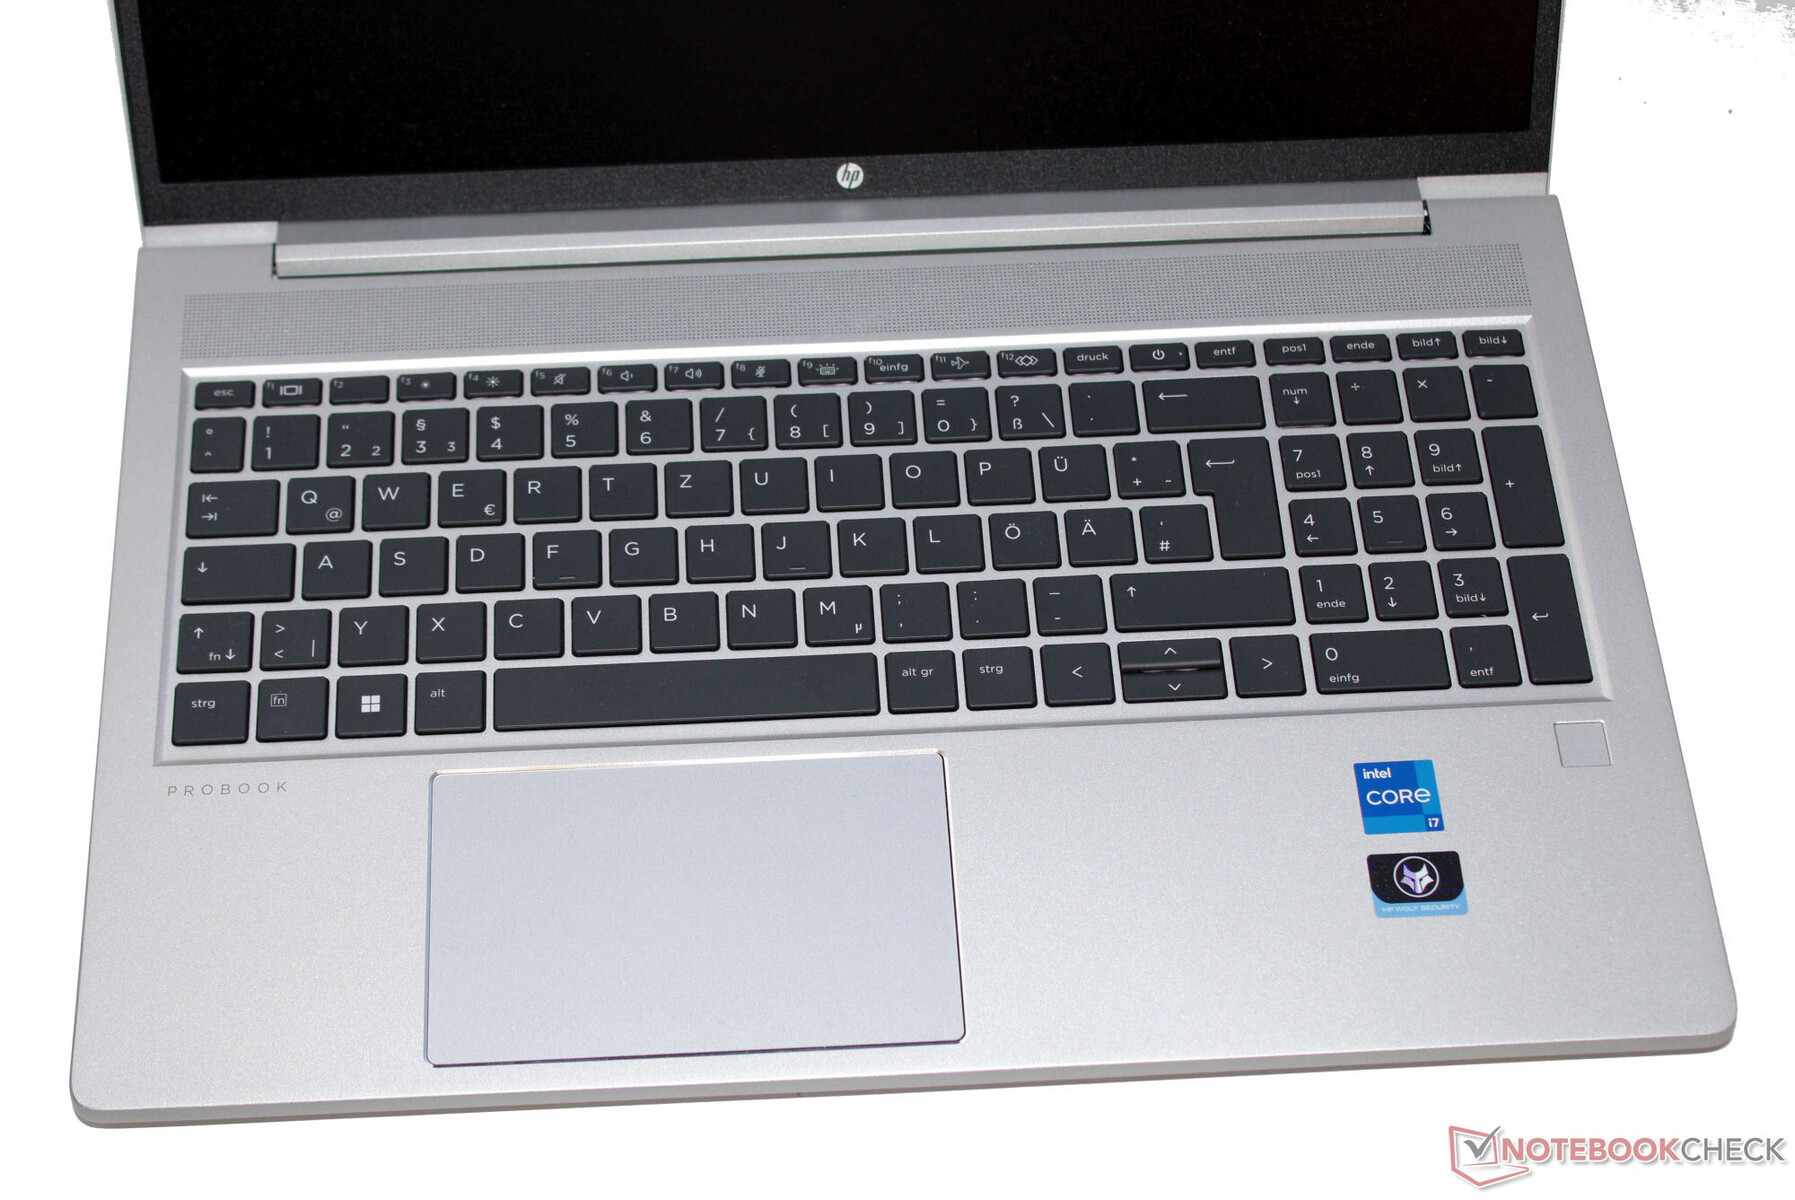
O teclado chiclet instalado no laptop possui luz de fundo (dois níveis), um teclado numérico e alguma proteção contra água. Suas teclas côncavas apresentam uma elevação curta e um ponto de pressão preciso. A resistência nítida das teclas merece alguns elogios. O teclado balança levemente enquanto o usuário digita, mas isso não foi incômodo durante nosso teste. O botão liga/desliga do laptop está localizado entre as teclas de função. Tocar nele acidentalmente não faz com que o laptop seja desligado. Em suma, a HP forneceu um teclado bem-sucedido, adequado para o uso diário.
Touchpad
Um click pad (aprox. 11,5 x 7 cm) com um ponto de pressão curto e nítido serve como substituto do mouse.
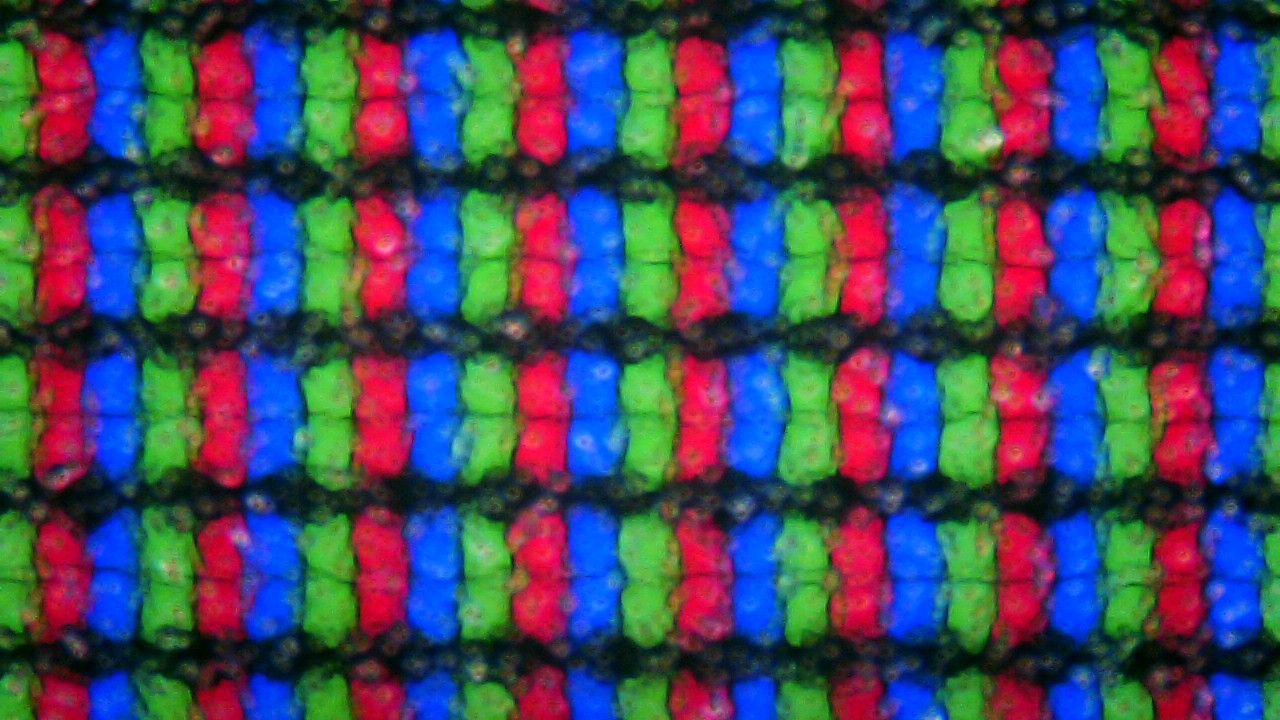
Tela - Painel FHD com pouca cobertura do espaço de cores
A HP equipou o ProBook com uma tela fosca de 15,6 polegadas com ângulo de visão estável (1.920 x 1.080 pixels) que tem uma proporção de 16:9. Embora seus níveis de contraste tenham atingido o valor desejado (> 1.000:1), seu brilho deixa mais a desejar (objetivo: > 300 cd/m²). Positivo: Não notamos nenhuma oscilação de PWM. Como alternativa, o 450 G10 pode ser adquirido com um painel FHD mais brilhante (cerca de 400 cd/m²).

| |||||||||||||||||||||||||
iluminação: 88 %
iluminação com acumulador: 285 cd/m²
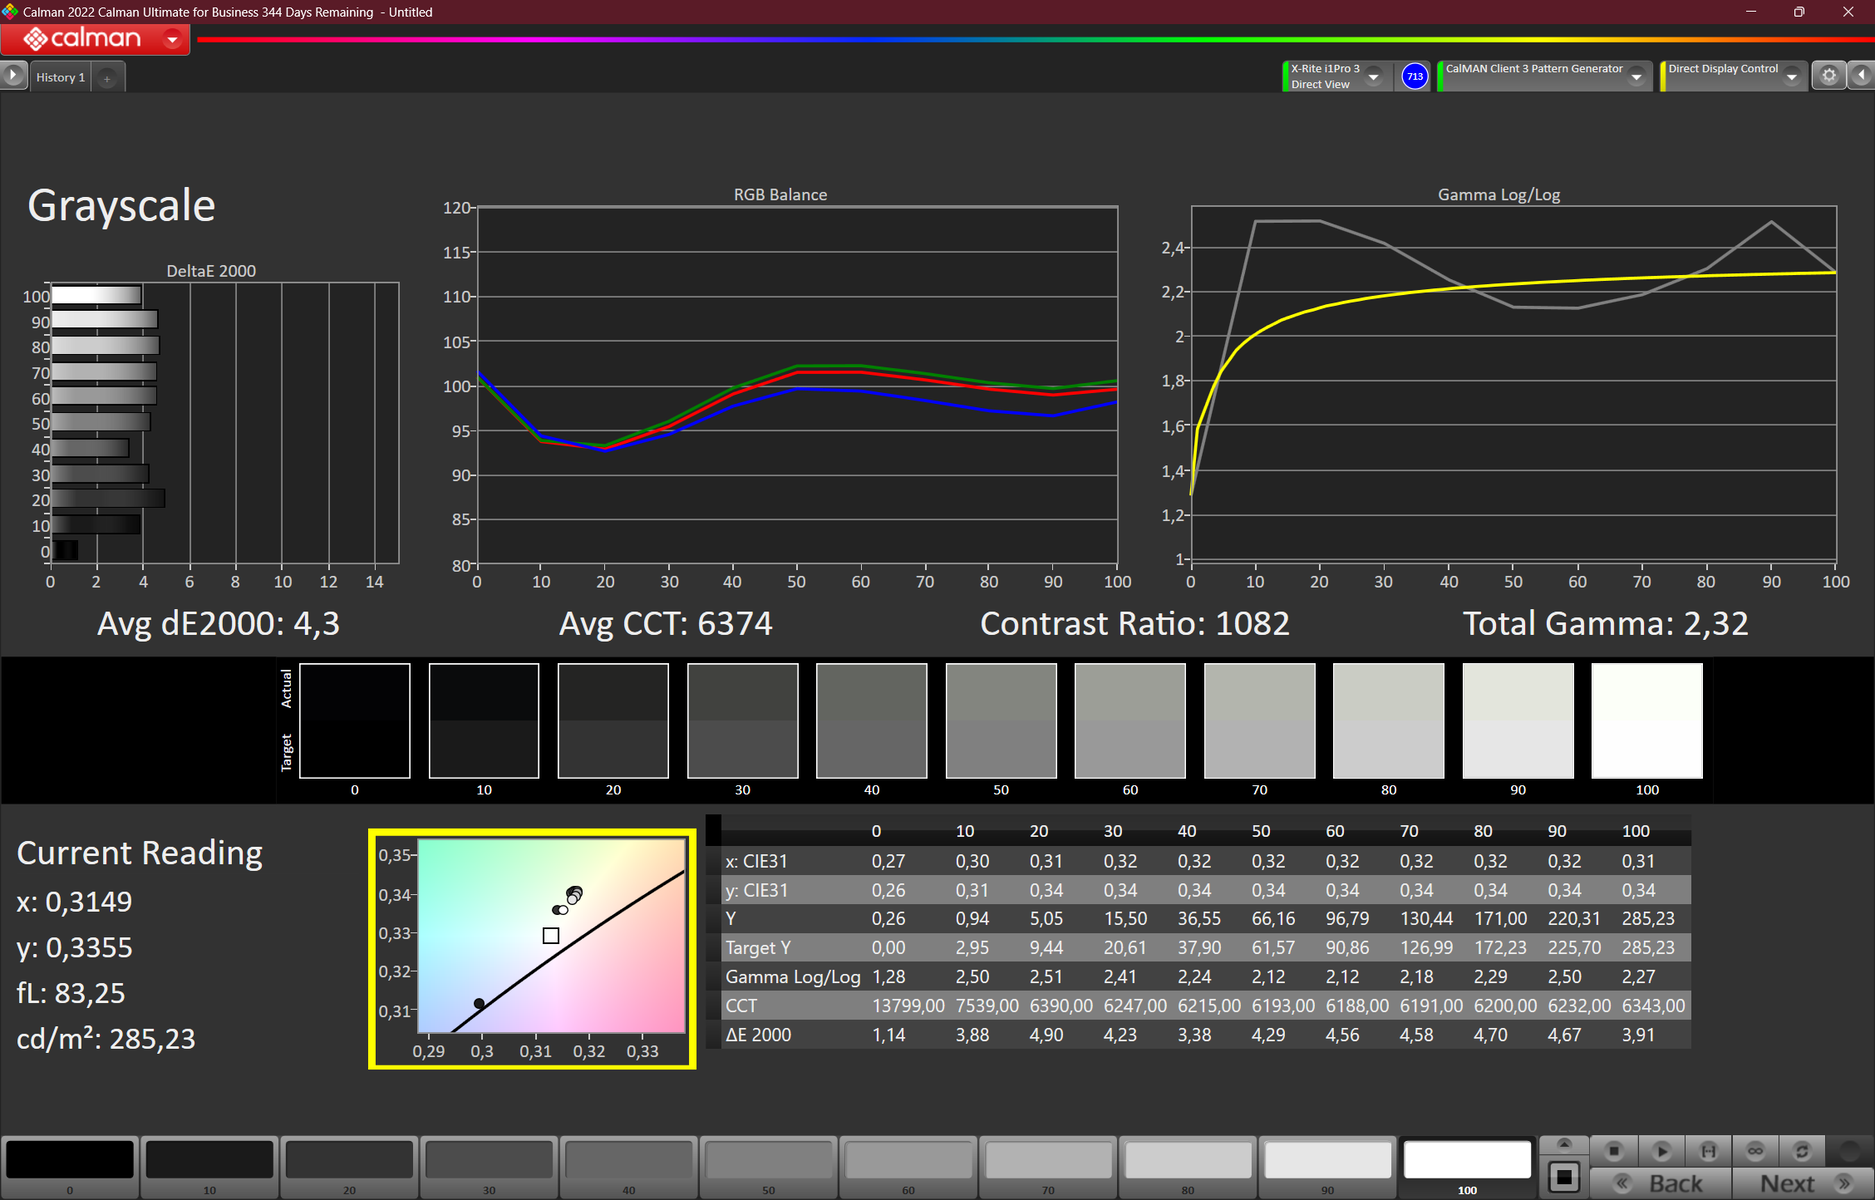
Contraste: 1096:1 (Preto: 0.26 cd/m²)
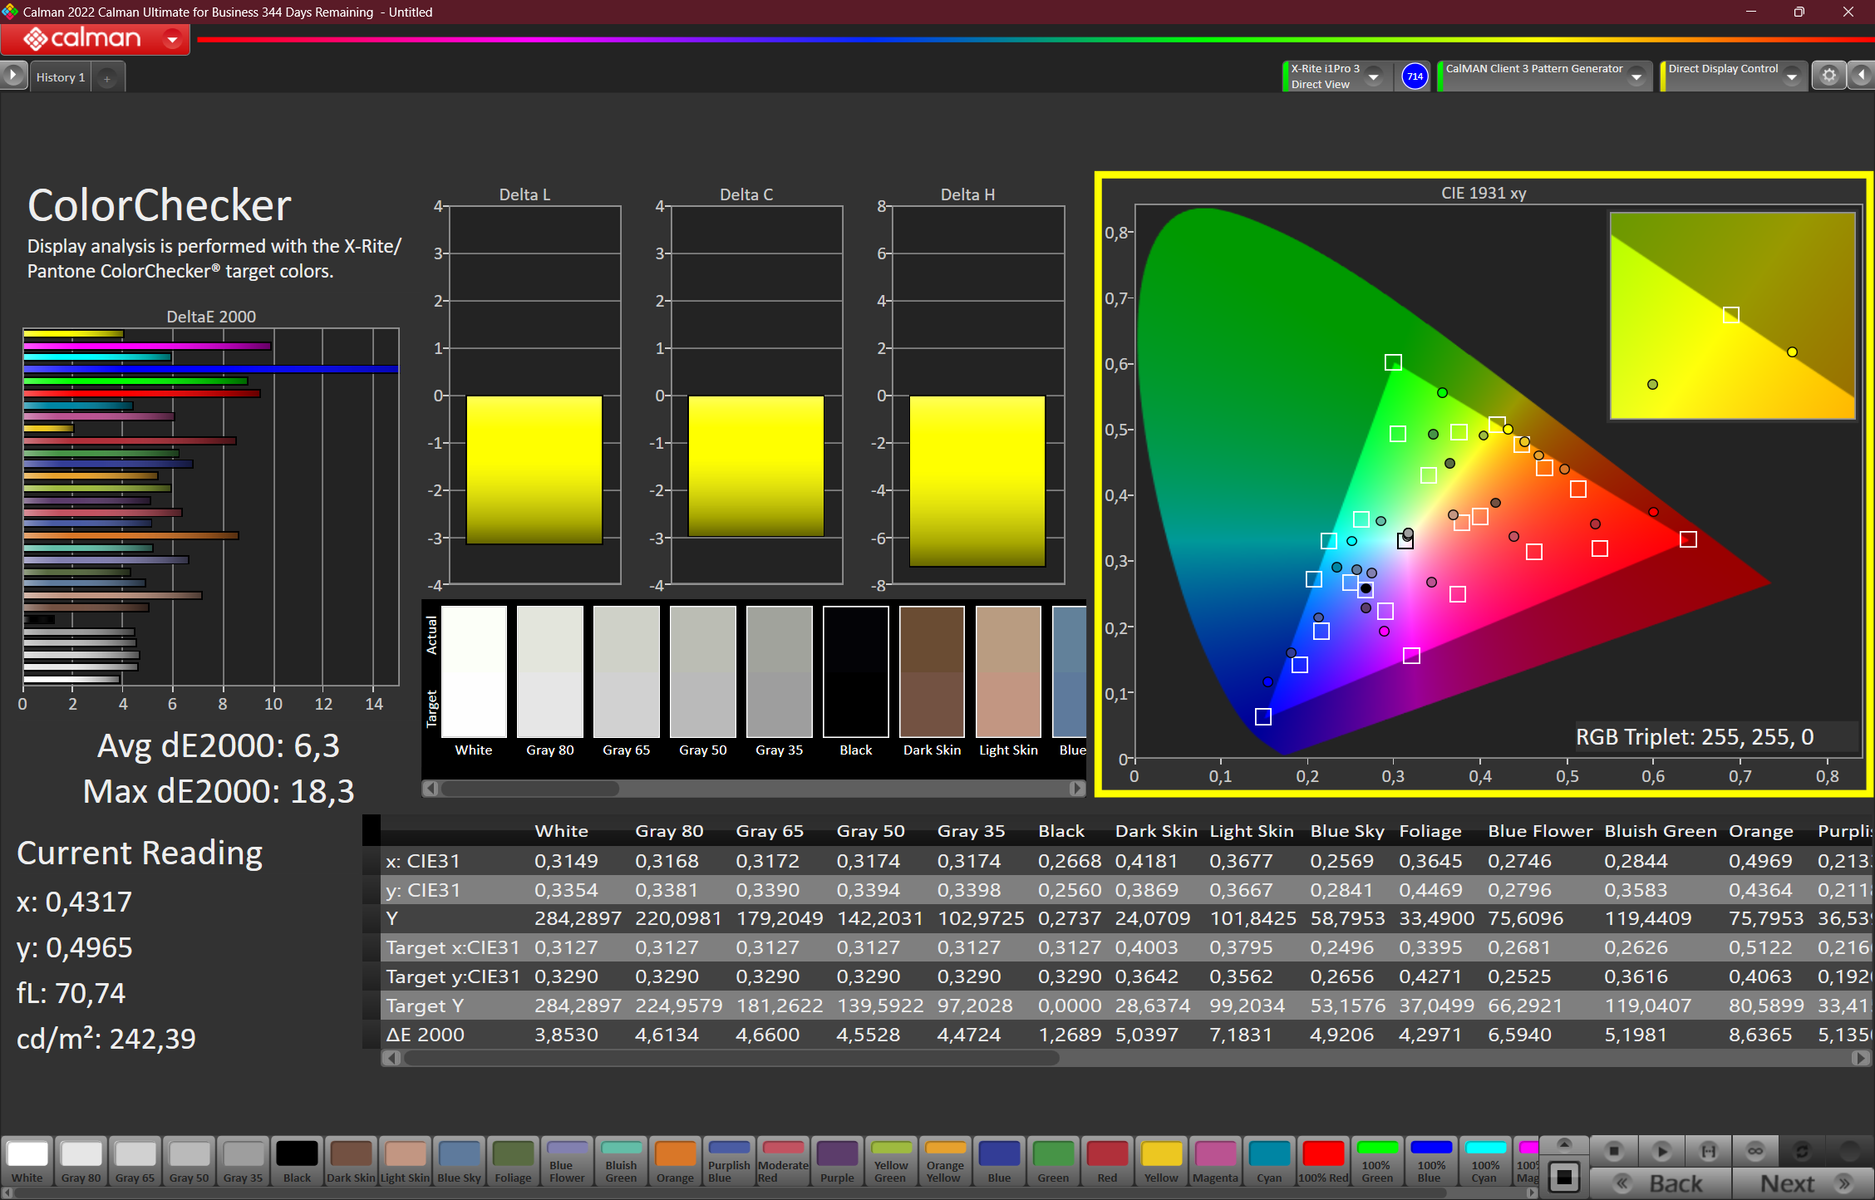
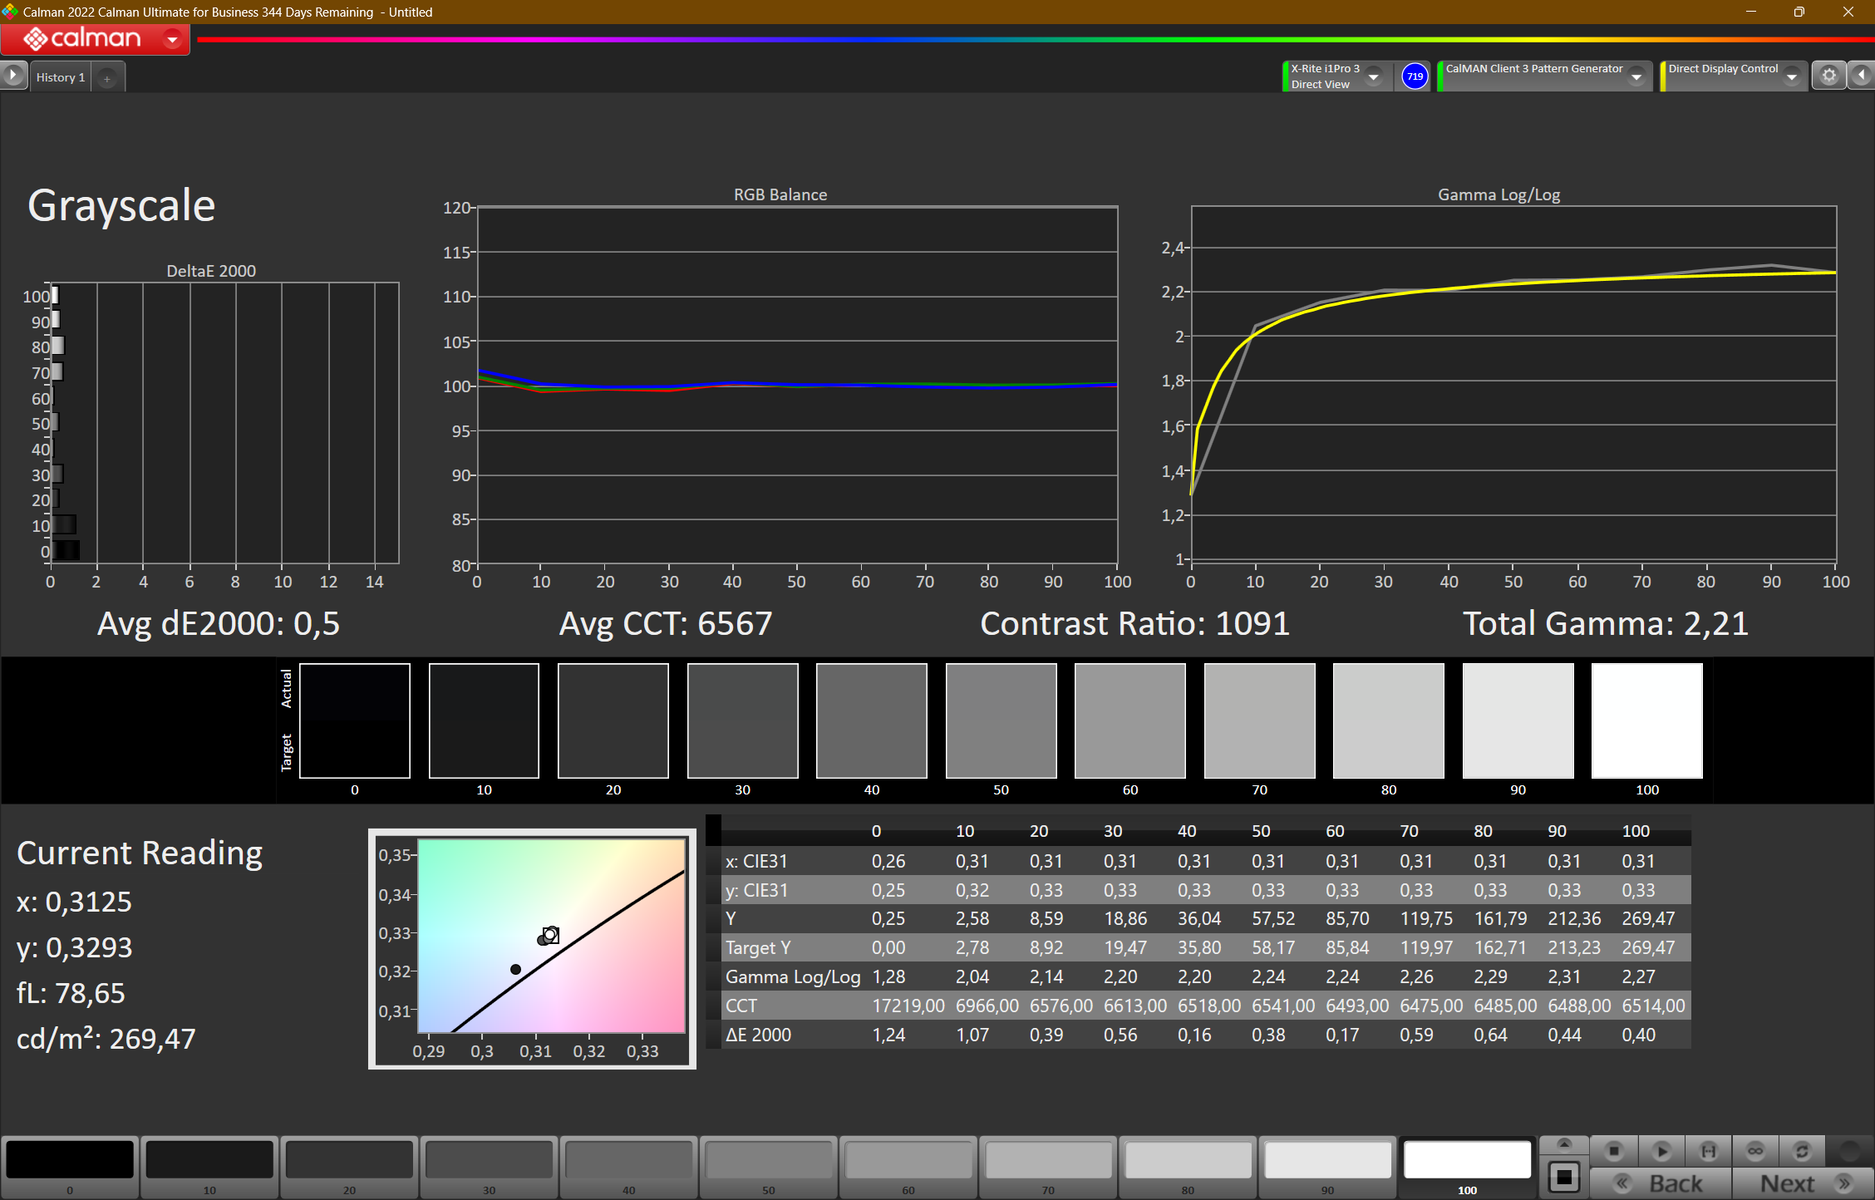
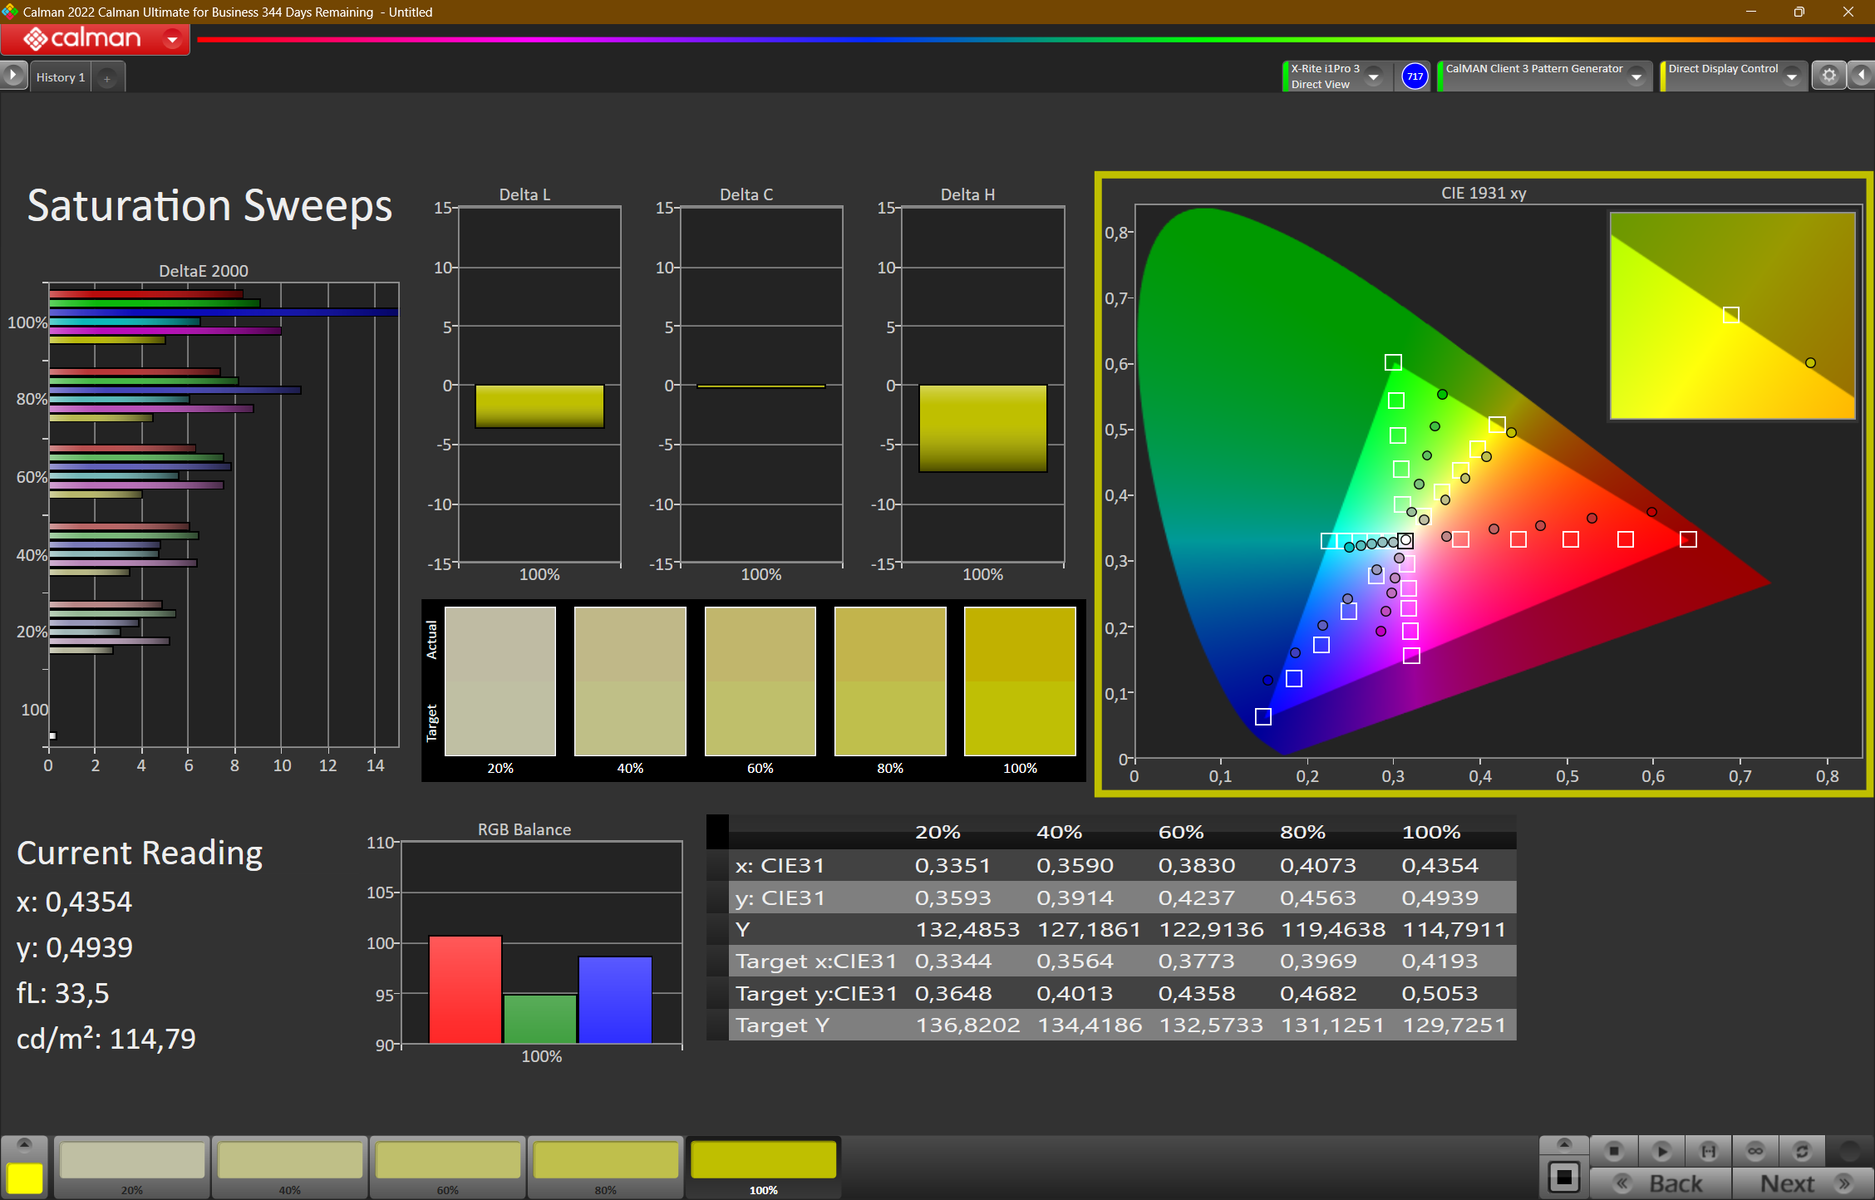
ΔE ColorChecker Calman: 6.3 | ∀{0.5-29.43 Ø4.71}
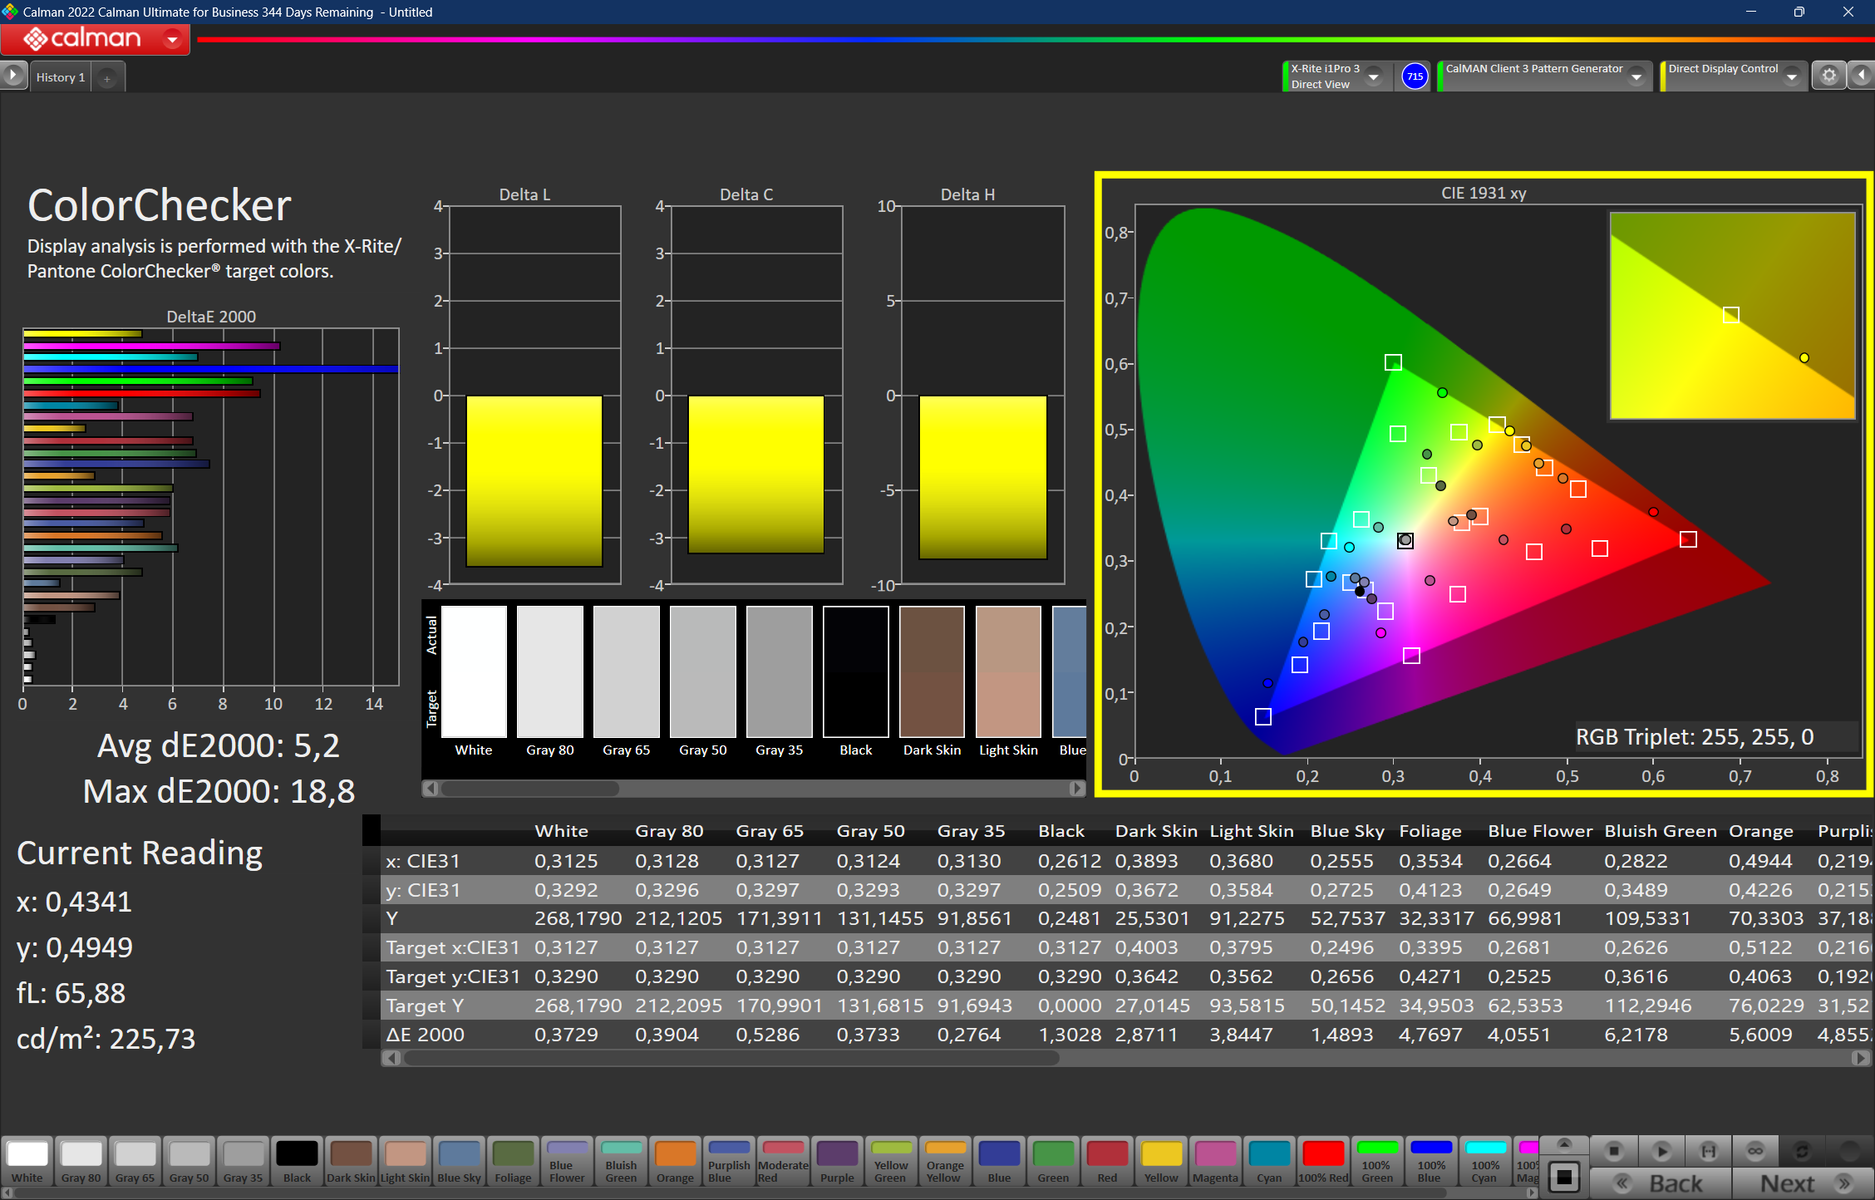
calibrated: 5.2
ΔE Greyscale Calman: 4.3 | ∀{0.09-98 Ø4.96}
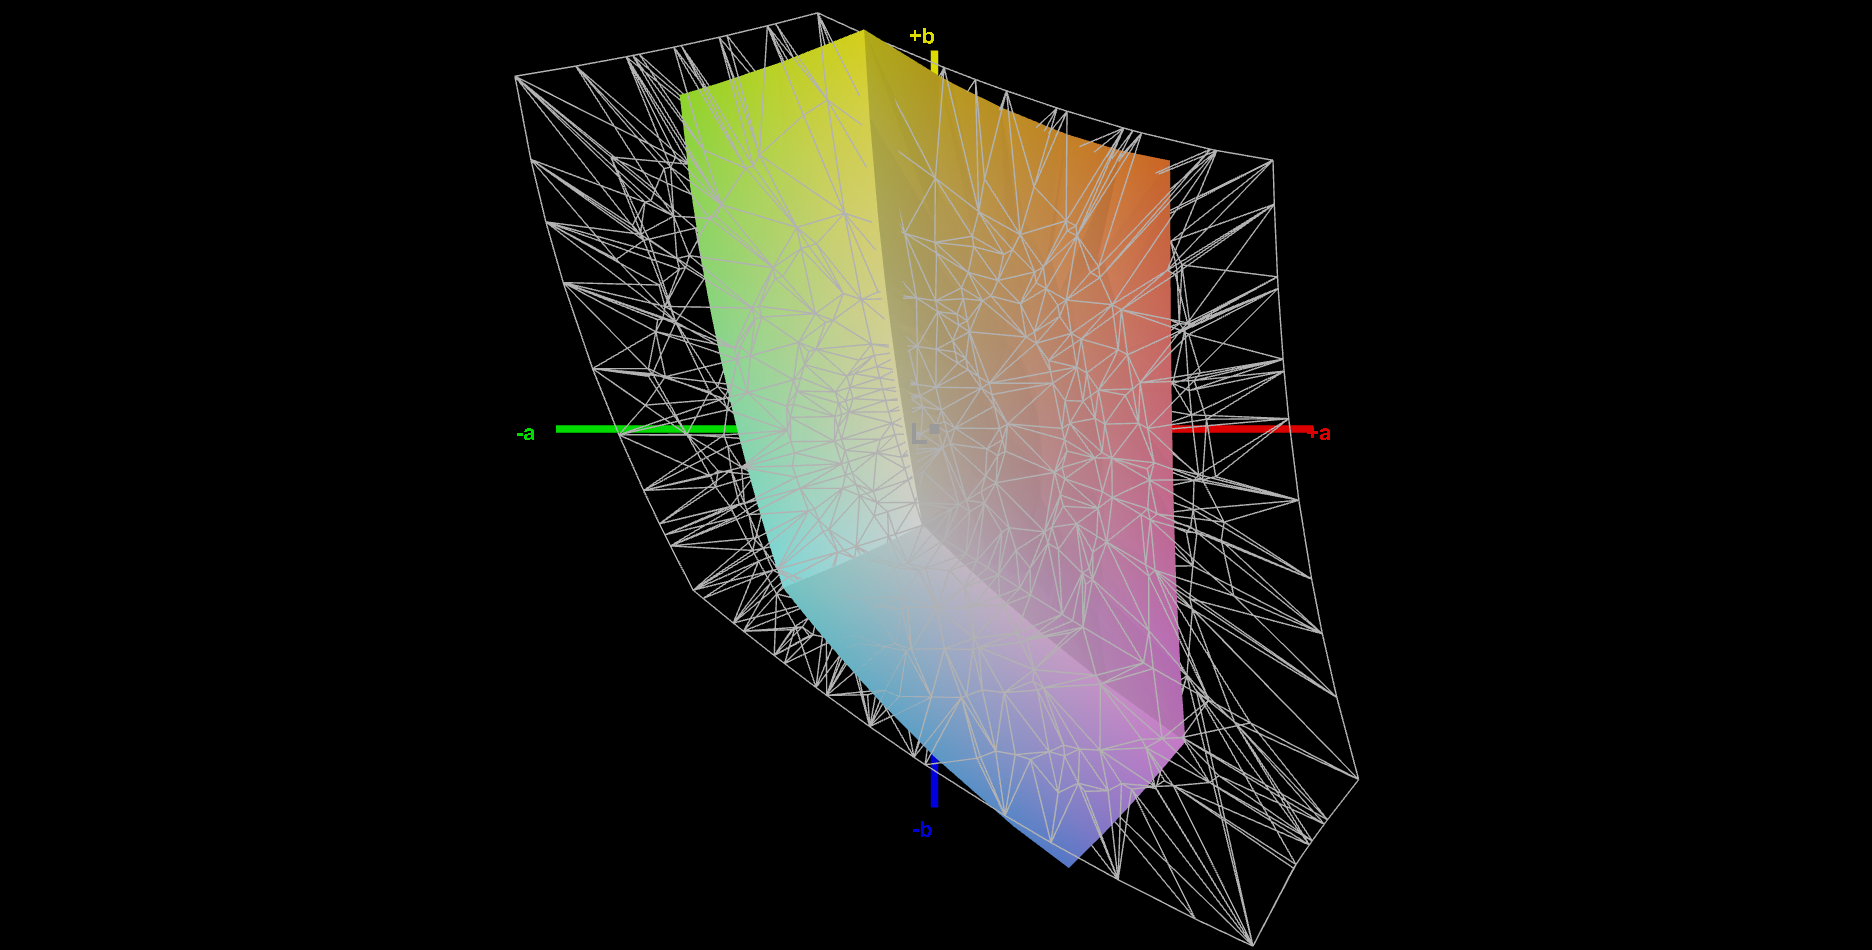
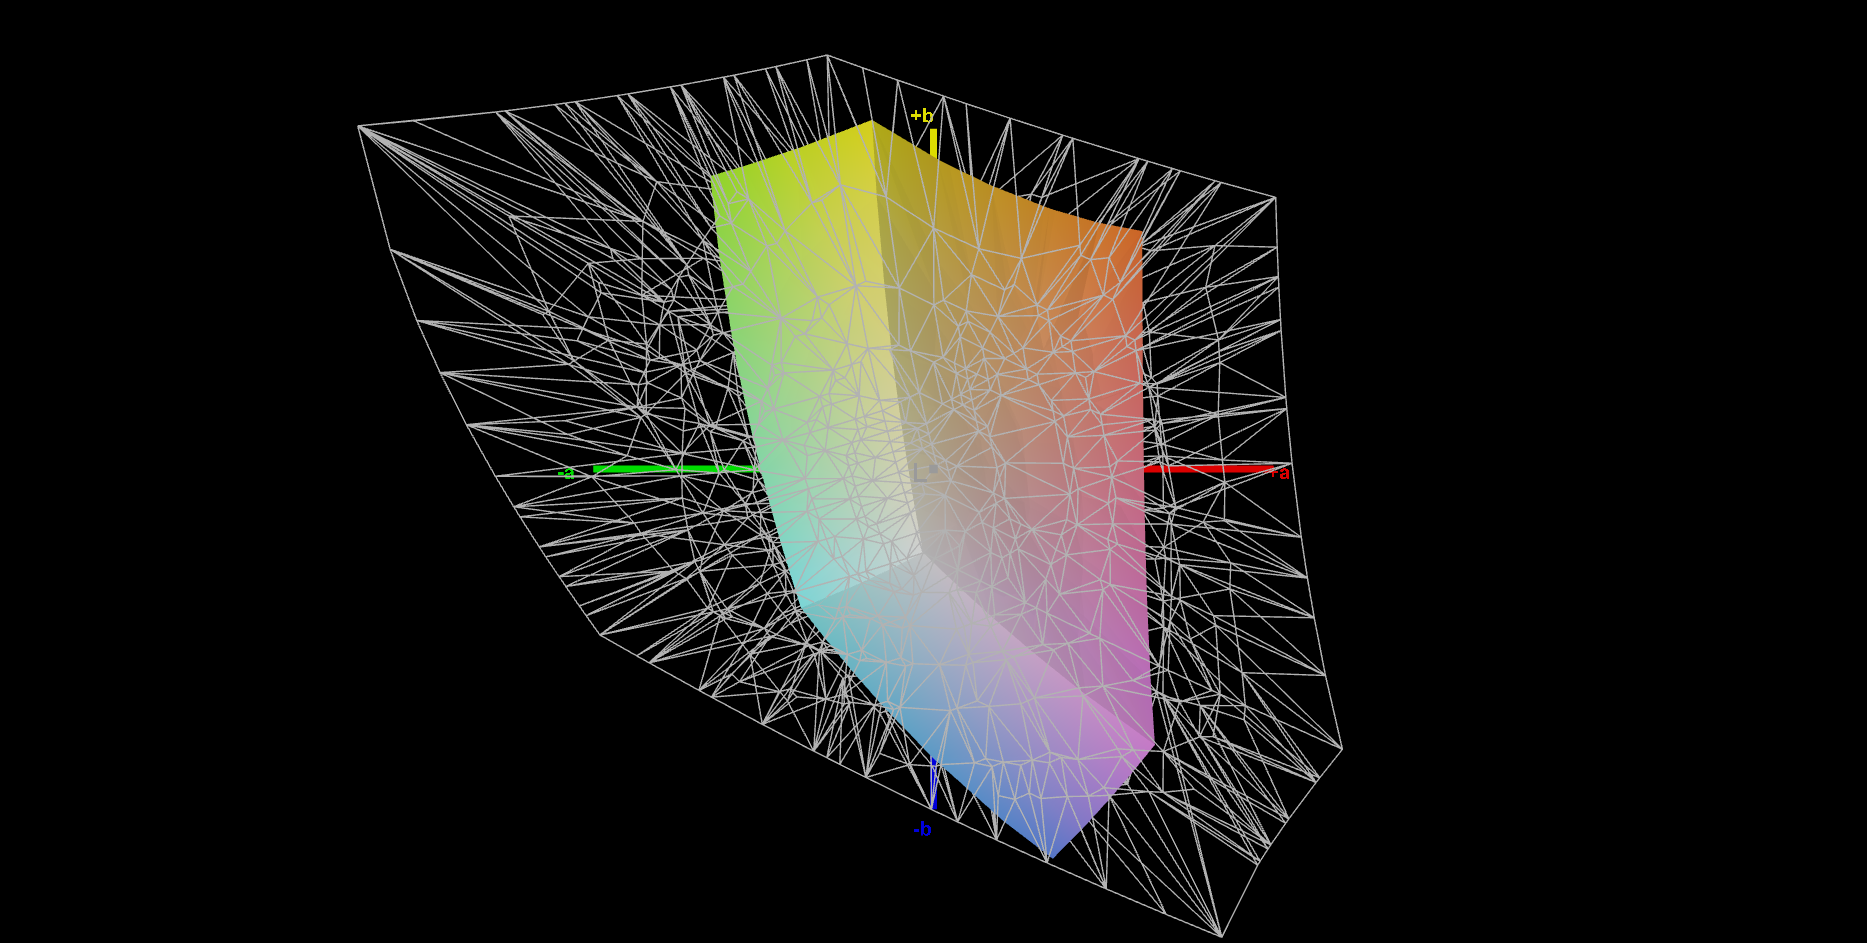
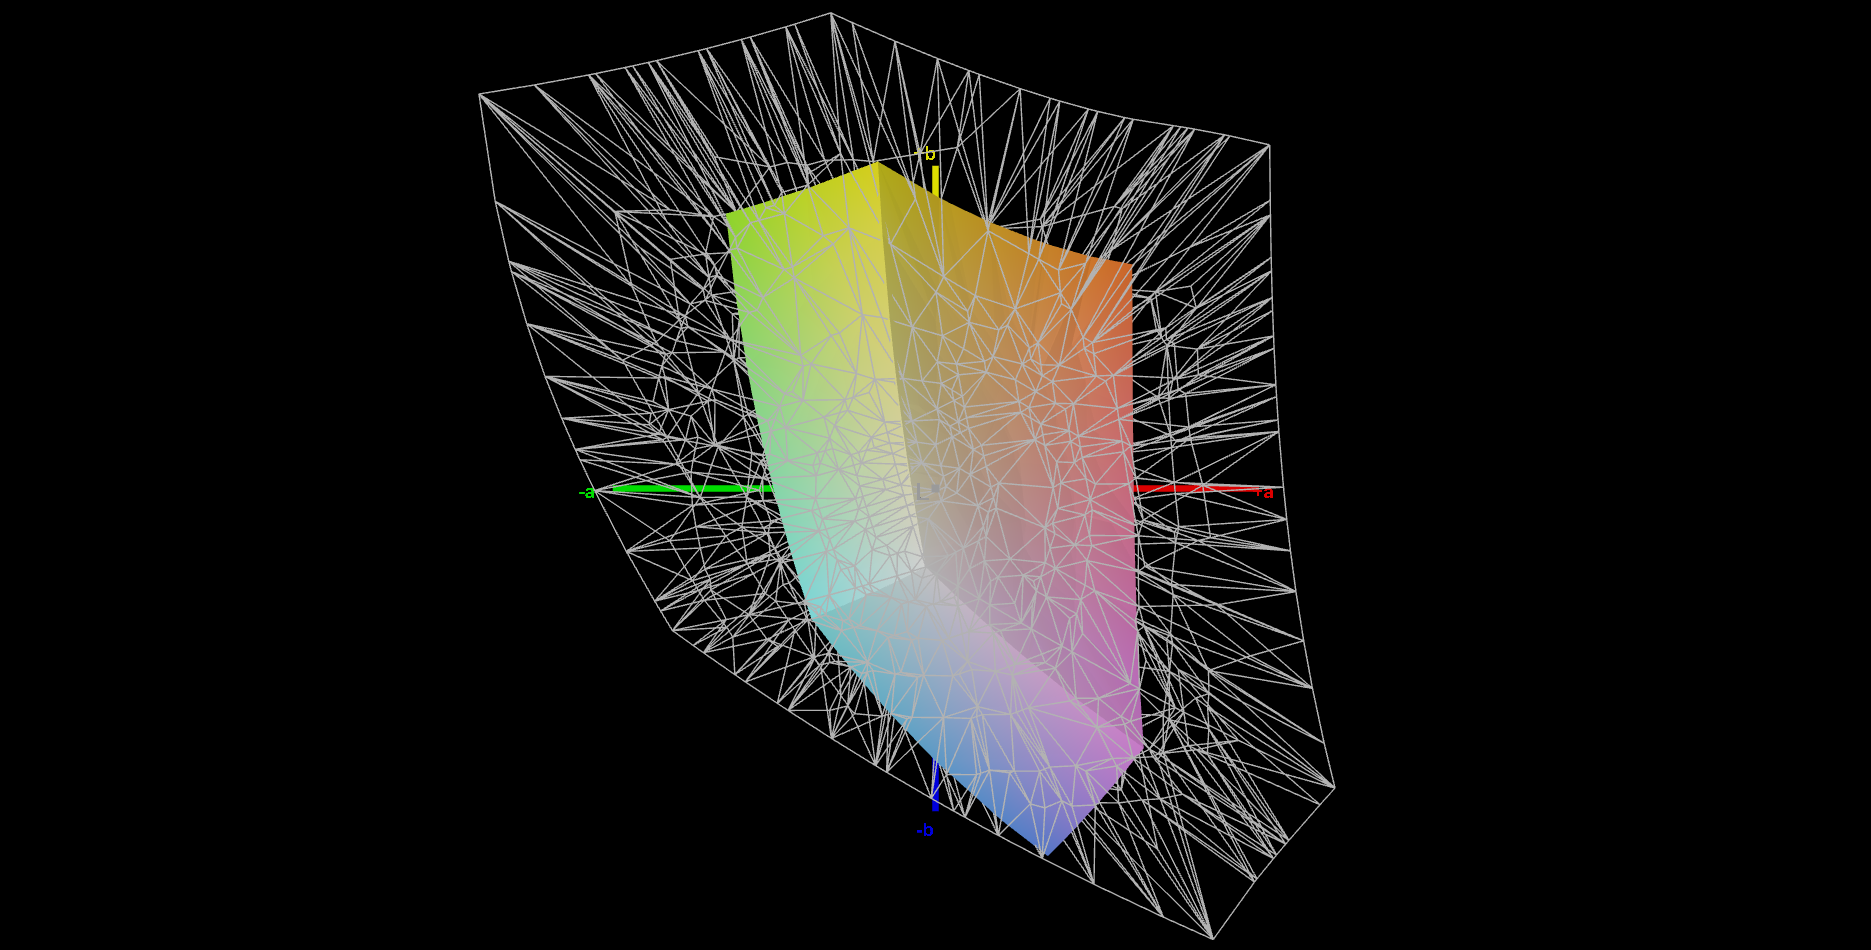
39.7% AdobeRGB 1998 (Argyll 3D)
57.3% sRGB (Argyll 3D)
38.4% Display P3 (Argyll 3D)
Gamma: 2.32
CCT: 6374 K
| HP ProBook 450 G10 LG Philips LP156WFC-SPMD, IPS, 1920x1080, 15.6" | Acer Aspire 5 A515-58GM-76S8 LP156WFH-SPD5, IPS, 1920x1080, 15.6" | Schenker VIA 15 Pro M22 NE156QHM-NY2, IPS, 2560x1440, 15.6" | Lenovo ThinkPad L15 Gen 4 21H70021GE N156HCA-E5B, IPS, 1920x1080, 15.6" | Fujitsu LifeBook E5412A E542AMHAAMDE LP140WFH-SPD1, IPS, 1920x1080, 14" | Dell Latitude 3440 BOE NE140FH, IPS, 1920x1080, 14" | |
|---|---|---|---|---|---|---|
| Display | -0% | 73% | 9% | -2% | 5% | |
| Display P3 Coverage (%) | 38.4 | 38.11 -1% | 67.5 76% | 41.8 9% | 37.5 -2% | 40.4 5% |
| sRGB Coverage (%) | 57.3 | 57.7 1% | 97.1 69% | 62.5 9% | 56.1 -2% | 60.7 6% |
| AdobeRGB 1998 Coverage (%) | 39.7 | 39.41 -1% | 68.5 73% | 43.2 9% | 38.8 -2% | 41.8 5% |
| Response Times | -2% | 59% | 23% | -5% | -15% | |
| Response Time Grey 50% / Grey 80% * (ms) | 35.5 ? | 33.6 ? 5% | 13.8 ? 61% | 24.4 ? 31% | 35 ? 1% | 35.3 ? 1% |
| Response Time Black / White * (ms) | 23 ? | 24.8 ? -8% | 9.8 ? 57% | 19.7 ? 14% | 25.6 ? -11% | 29.8 ? -30% |
| PWM Frequency (Hz) | 60 ? | |||||
| Screen | -5% | 21% | 11% | -17% | 21% | |
| Brightness middle (cd/m²) | 285 | 257.4 -10% | 354 24% | 275 -4% | 231 -19% | 292.6 3% |
| Brightness (cd/m²) | 266 | 248 -7% | 331 24% | 252 -5% | 228 -14% | 270 2% |
| Brightness Distribution (%) | 88 | 88 0% | 80 -9% | 84 -5% | 77 -12% | 88 0% |
| Black Level * (cd/m²) | 0.26 | 0.3209 -23% | 0.41 -58% | 0.16 38% | 0.31 -19% | 0.19 27% |
| Contrast (:1) | 1096 | 802 -27% | 863 -21% | 1719 57% | 745 -32% | 1540 41% |
| Colorchecker dE 2000 * | 6.3 | 6.26 1% | 2.4 62% | 6.2 2% | 7.2 -14% | 4.63 27% |
| Colorchecker dE 2000 max. * | 18.3 | 18.28 -0% | 6.4 65% | 19.2 -5% | 20.8 -14% | 17.1 7% |
| Colorchecker dE 2000 calibrated * | 5.2 | 4.99 4% | 1.4 73% | 4.2 19% | 5.5 -6% | 2.13 59% |
| Greyscale dE 2000 * | 4.3 | 3.7 14% | 3.2 26% | 4.1 5% | 5.3 -23% | 3.2 26% |
| Gamma | 2.32 95% | 2.186 101% | 2.08 106% | 1.91 115% | 2.16 102% | 2.34 94% |
| CCT | 6374 102% | 6606 98% | 6786 96% | 6352 102% | 6407 101% | 7184 90% |
| Média Total (Programa/Configurações) | -2% /
-4% | 51% /
37% | 14% /
12% | -8% /
-12% | 4% /
13% |
* ... menor é melhor
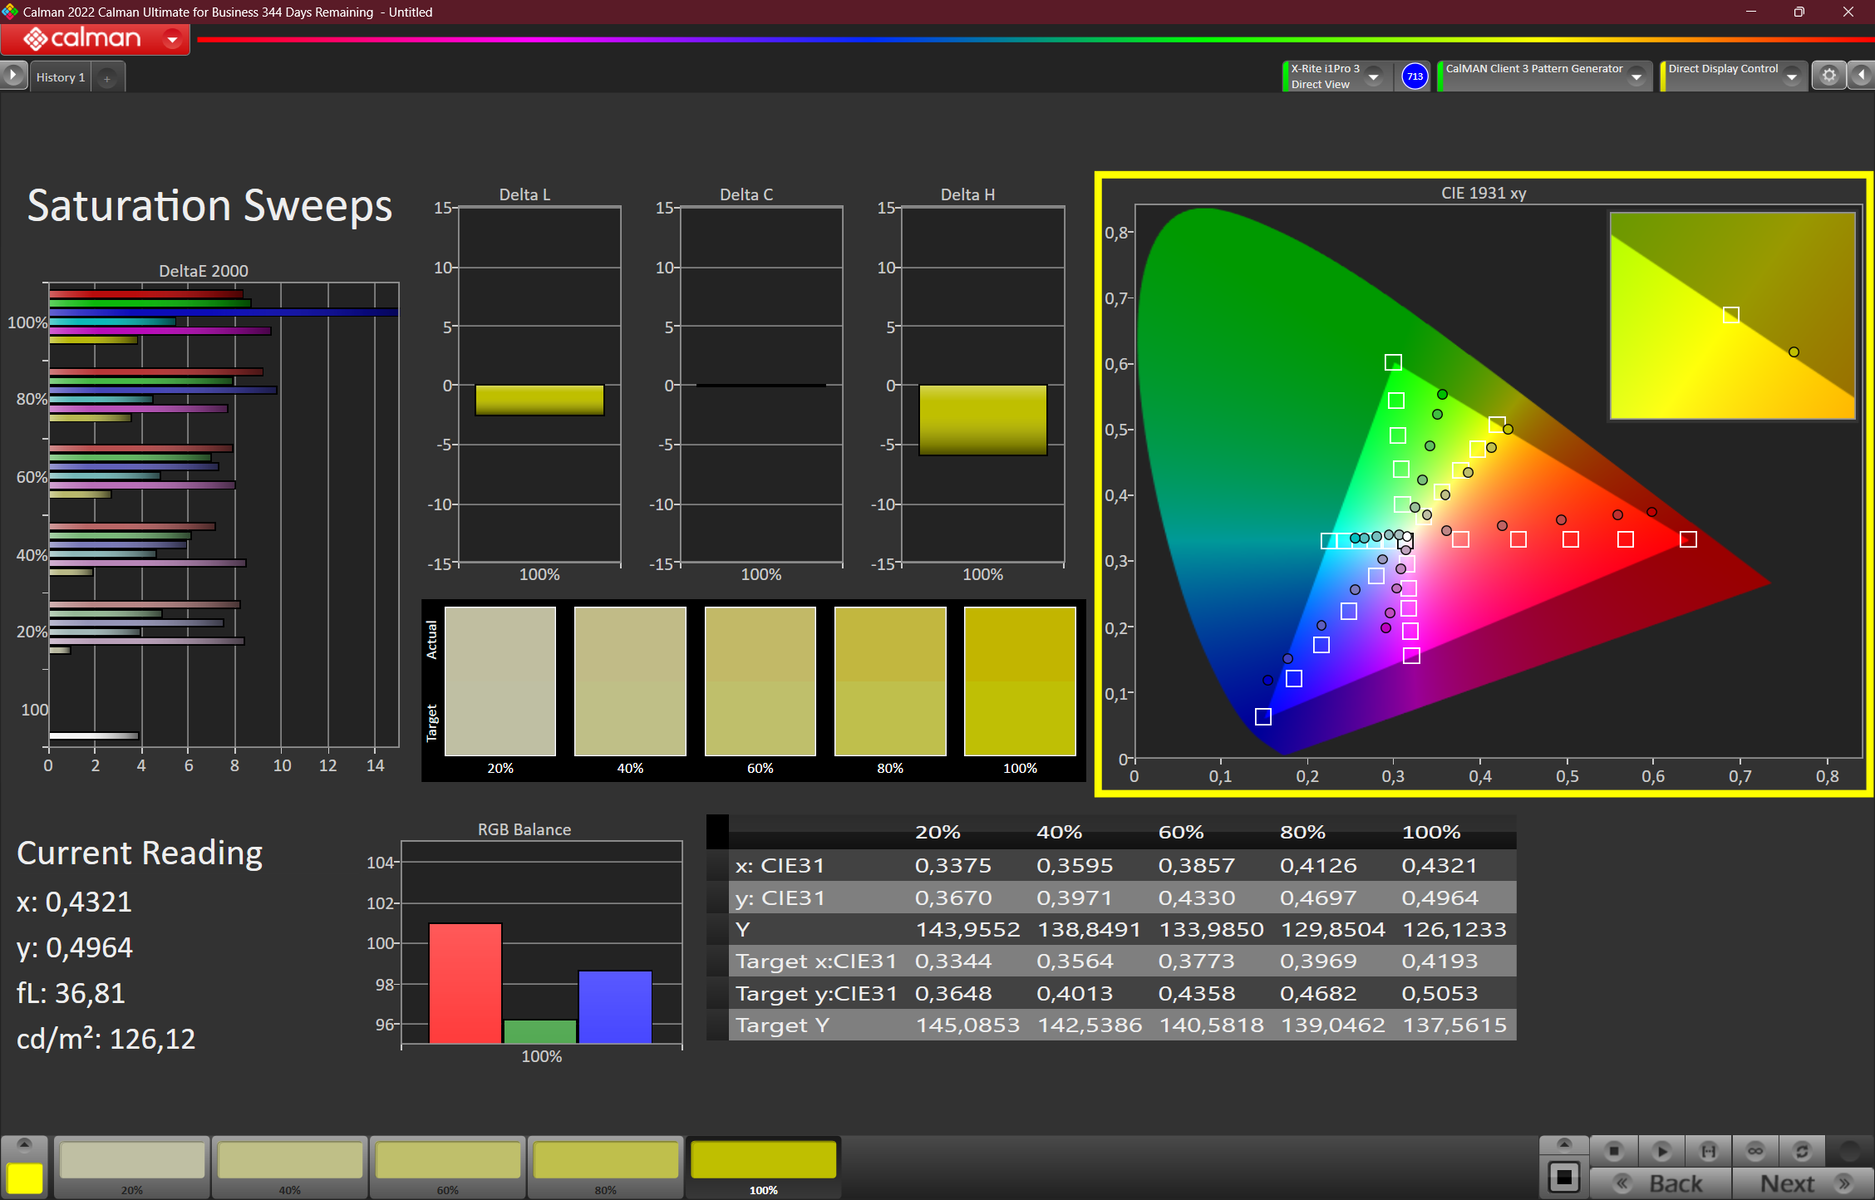
Ex works, a tela mostra uma representação de cores aceitável: Com um desvio de cerca de 6,3, seu valor-alvo infelizmente não foi atingido (DeltaE < 3). A calibração reduz o valor para 5,2 e faz com que os tons de cinza pareçam mais equilibrados. Os espaços de cores DCI-P3, sRGB e AdobeRGB não podem ser representados pelo painel - o mesmo pode ser dito da maioria das telas dos concorrentes. O painel FHD alternativo disponível, mais brilhante, oferece melhor representação de cores (sRGB).
Exibir tempos de resposta
| ↔ Tempo de resposta preto para branco | ||
|---|---|---|
| 23 ms ... ascensão ↗ e queda ↘ combinadas | ↗ 13 ms ascensão | 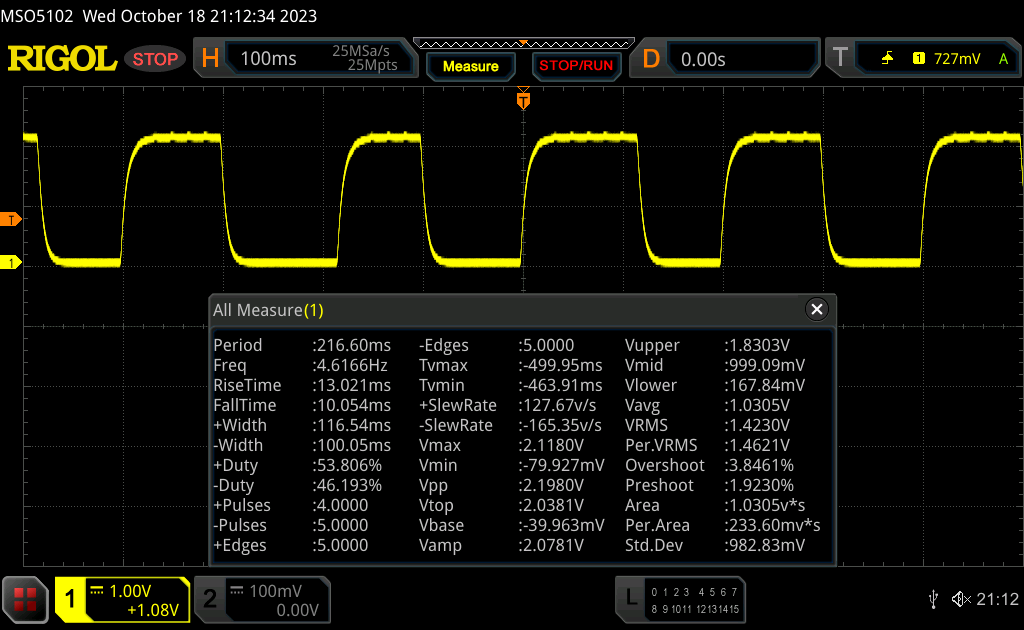 |
| ↘ 10 ms queda | ||
| A tela mostra boas taxas de resposta em nossos testes, mas pode ser muito lenta para jogadores competitivos. Em comparação, todos os dispositivos testados variam de 0.1 (mínimo) a 240 (máximo) ms. » 52 % de todos os dispositivos são melhores. Isso significa que o tempo de resposta medido é pior que a média de todos os dispositivos testados (19.8 ms). | ||
| ↔ Tempo de resposta 50% cinza a 80% cinza | ||
| 35.5 ms ... ascensão ↗ e queda ↘ combinadas | ↗ 18.6 ms ascensão | 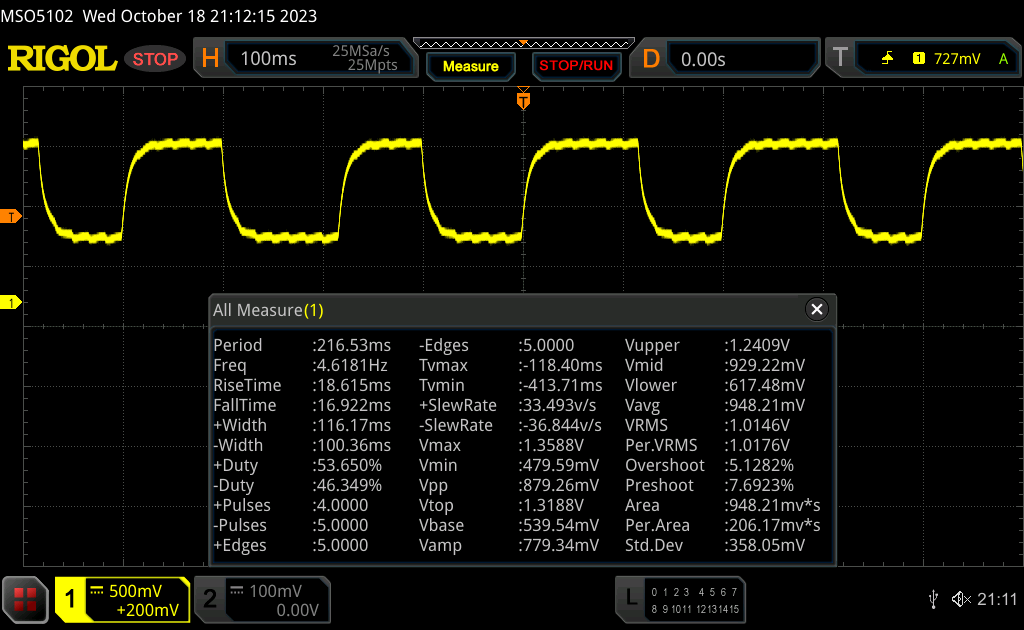 |
| ↘ 16.9 ms queda | ||
| A tela mostra taxas de resposta lentas em nossos testes e será insatisfatória para os jogadores. Em comparação, todos os dispositivos testados variam de 0.165 (mínimo) a 636 (máximo) ms. » 50 % de todos os dispositivos são melhores. Isso significa que o tempo de resposta medido é pior que a média de todos os dispositivos testados (31 ms). | ||
Cintilação da tela / PWM (modulação por largura de pulso)
| Tela tremeluzindo / PWM não detectado | 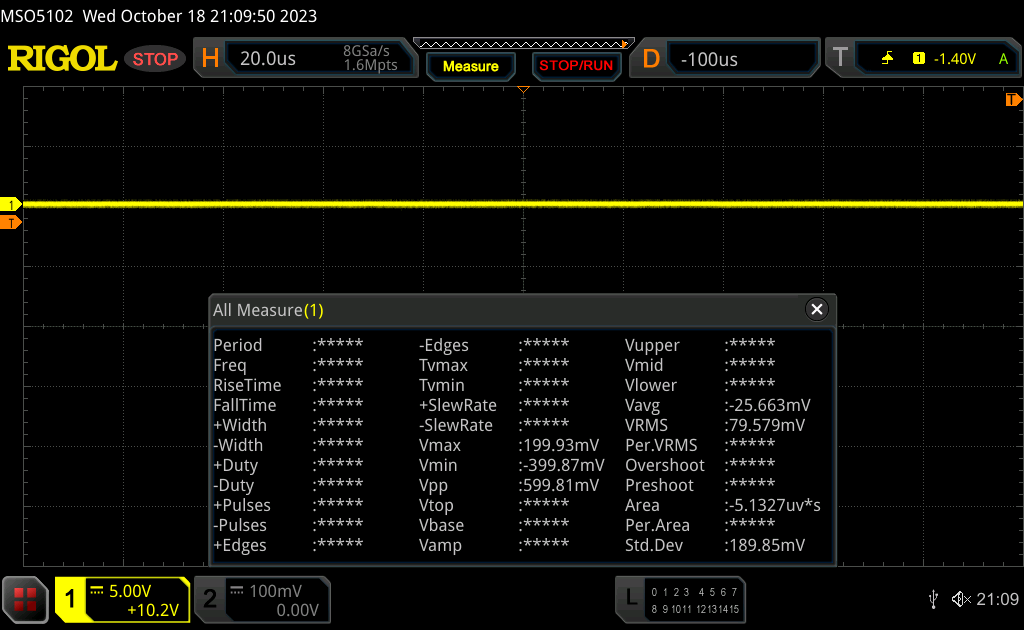 | ||
[pwm_comparison] Em comparação: 52 % de todos os dispositivos testados não usam PWM para escurecer a tela. Se PWM foi detectado, uma média de 7757 (mínimo: 5 - máximo: 343500) Hz foi medida. | |||
O painel IPS estável em termos de ângulo de visão permanece legível de todos os ângulos. Na área externa, é possível ler na tela, desde que o sol não esteja brilhando muito forte.

Desempenho - Raptor Lake e Ampere alimentam o laptop HP
Na série ProBook 400 G10, a HP conta com APUs da AMD (ProBook 455), bem como CPUs da Intel (ProBook 450). Os modelos 450 G10 disponíveis no momento do teste podem ser encontrados entre US$750 e US$1.100. A variante atual pode ser adquirida por cerca de US$ 1.000.
Condições de teste
Em vez de usar seu próprio perfil de energia, a HP usa os perfis do Windows, chamados Power Status (consulte a tabela). Usamos os perfis "melhor desempenho" (benchmarks, tempos de execução de carga) e "equilibrado" (outros testes de tempo de execução).
Como os limites de energia são idênticos em todos os três perfis, quase não há diferenças em relação ao desempenho da CPU. O desempenho da GPU, por outro lado, varia de acordo com o perfil.
| Melhor desempenho | Balanceado | Melhor economia de energia | |
|---|---|---|---|
| Limite de energia 1 (HWInfo) | 24 watts | 24 watts | 24 watts |
| Limite de energia 2 (HWInfo) | 55 watts | 55 watts | 55 watts |
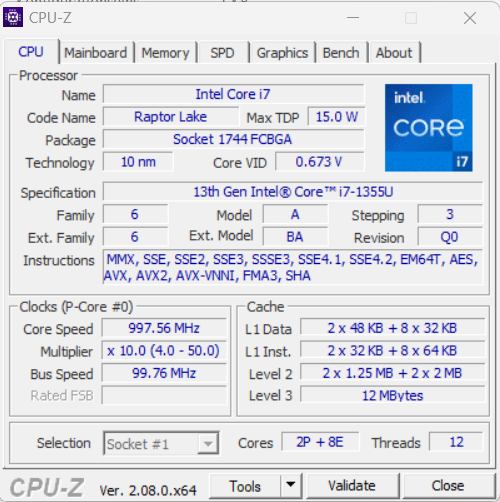
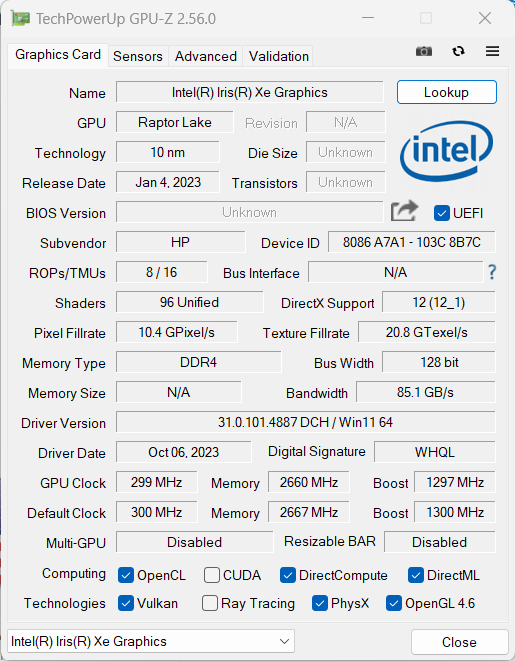
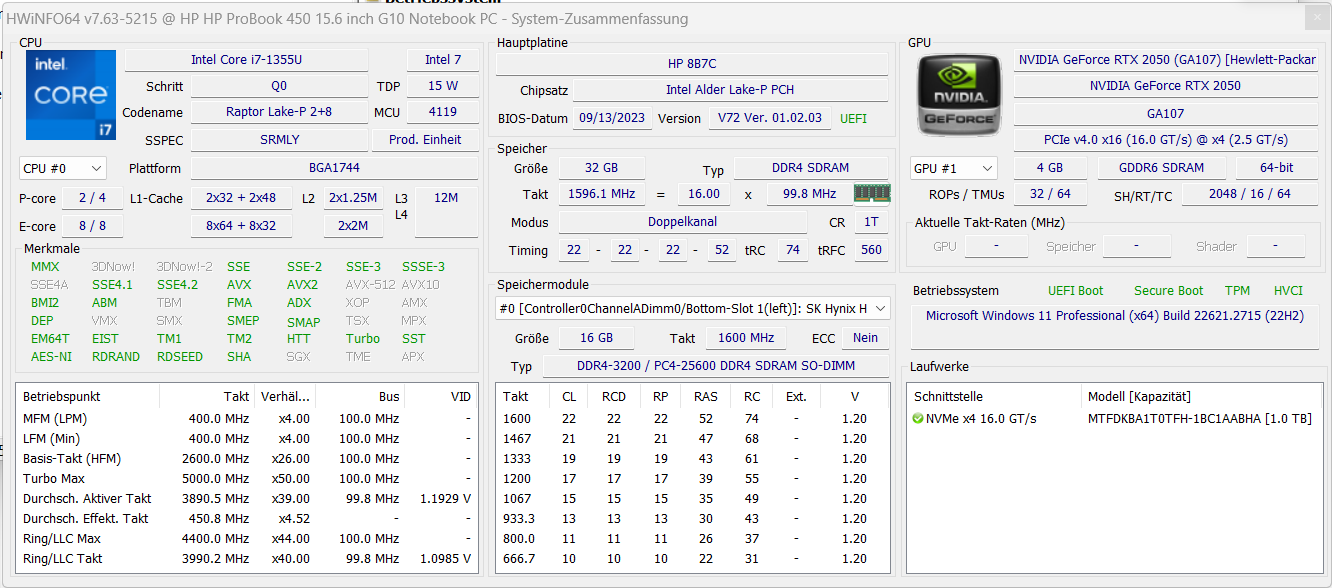
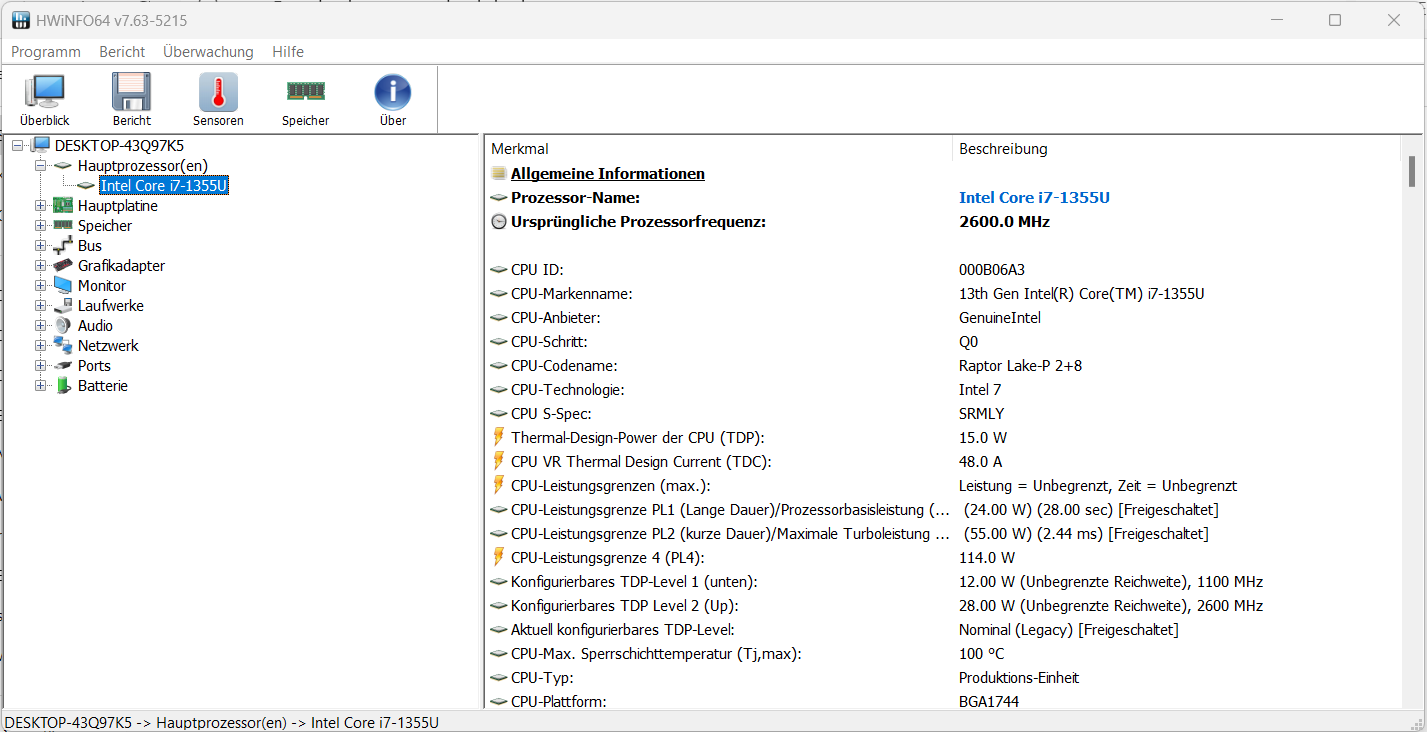
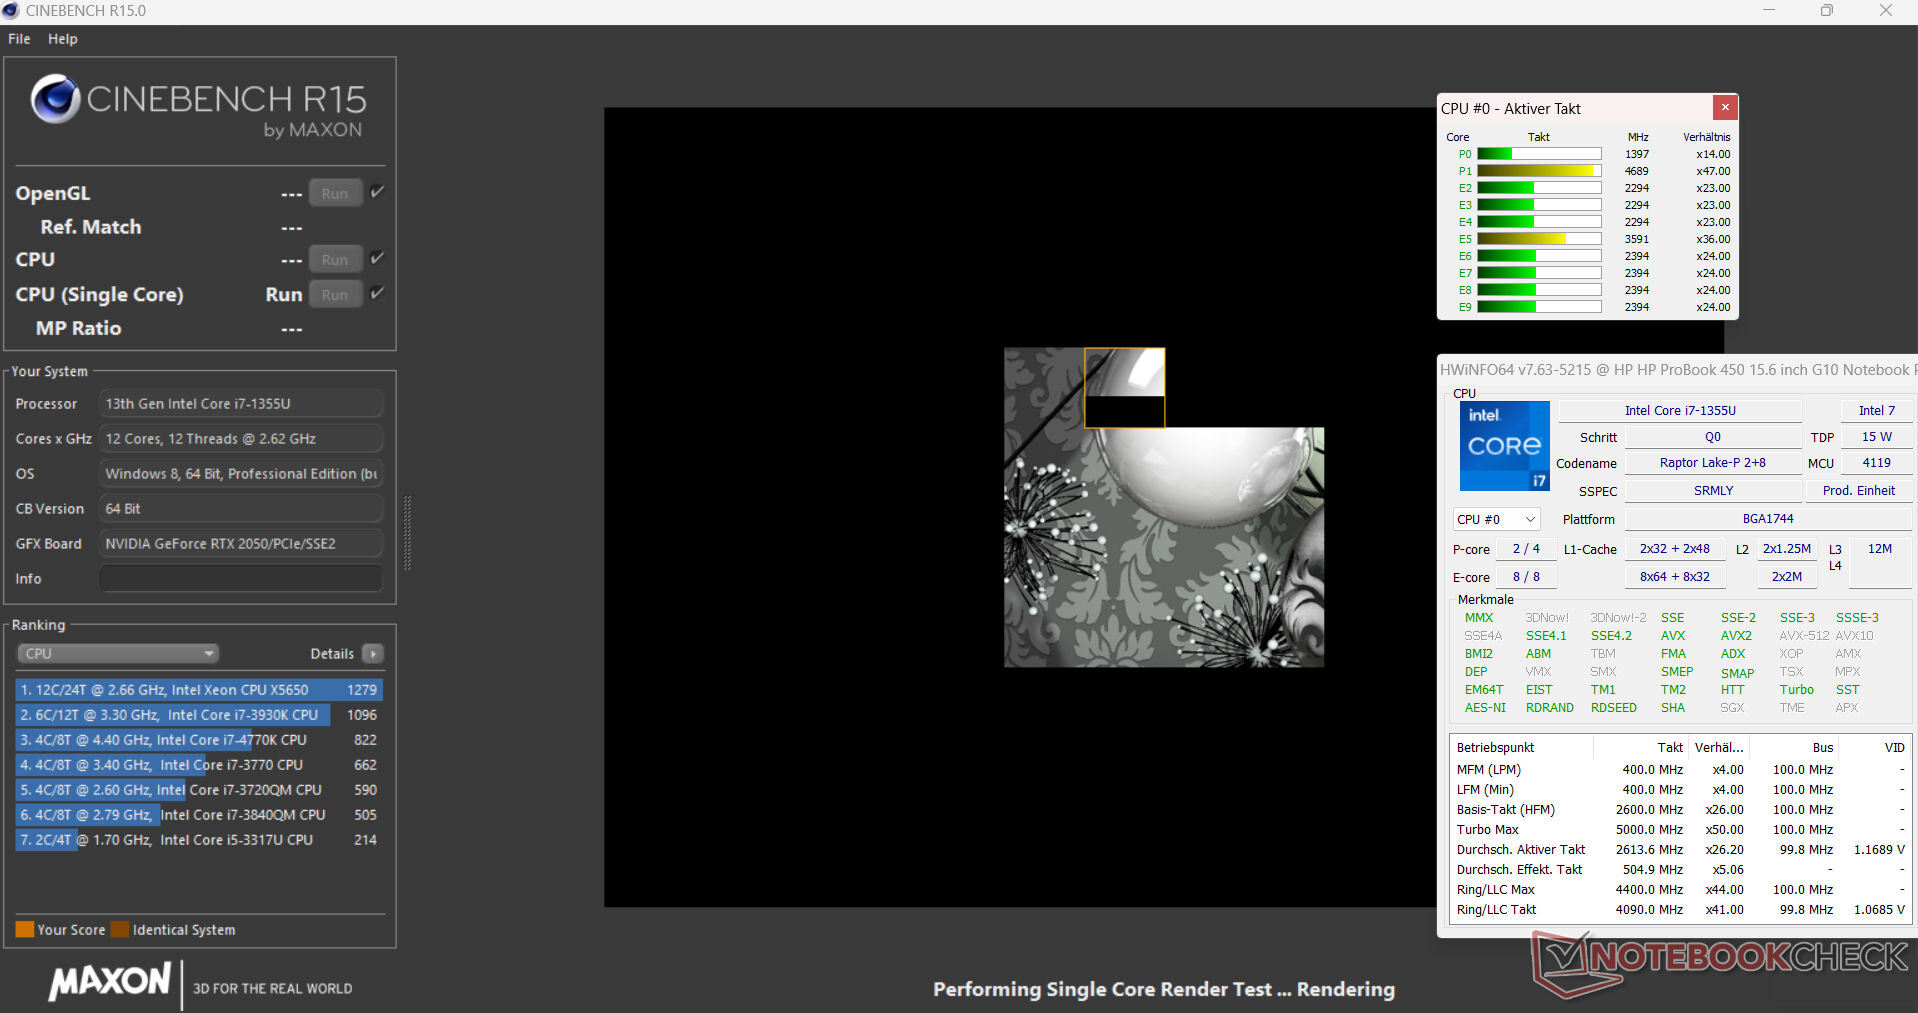
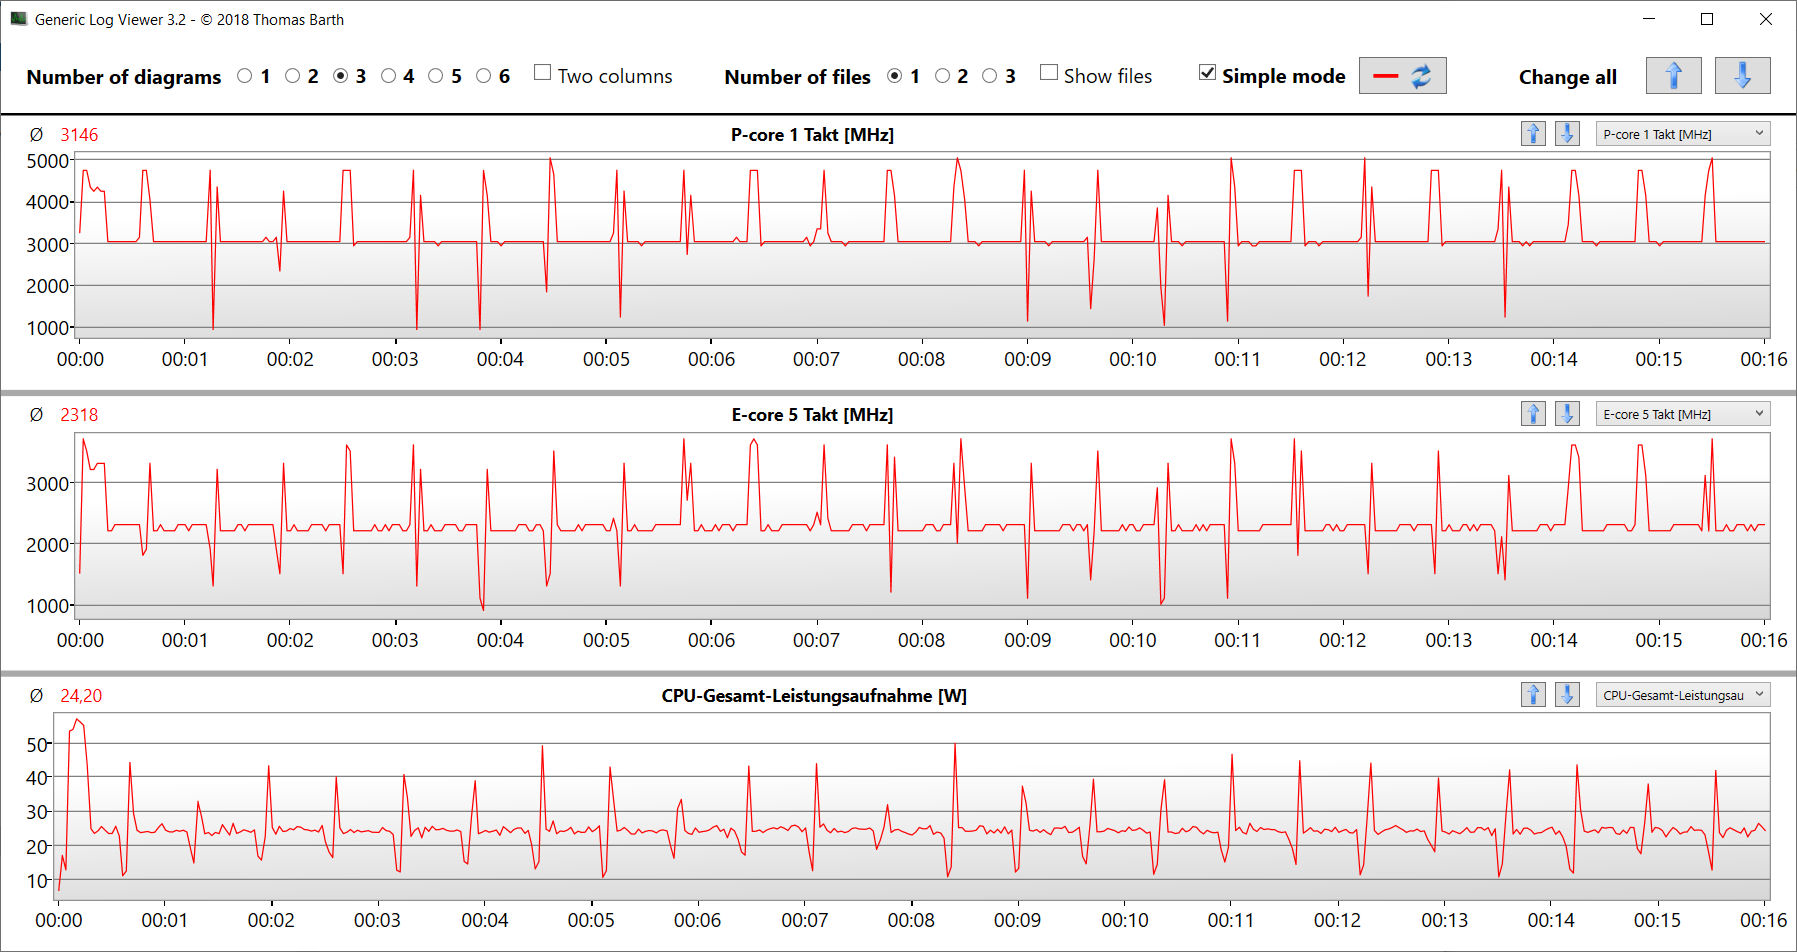
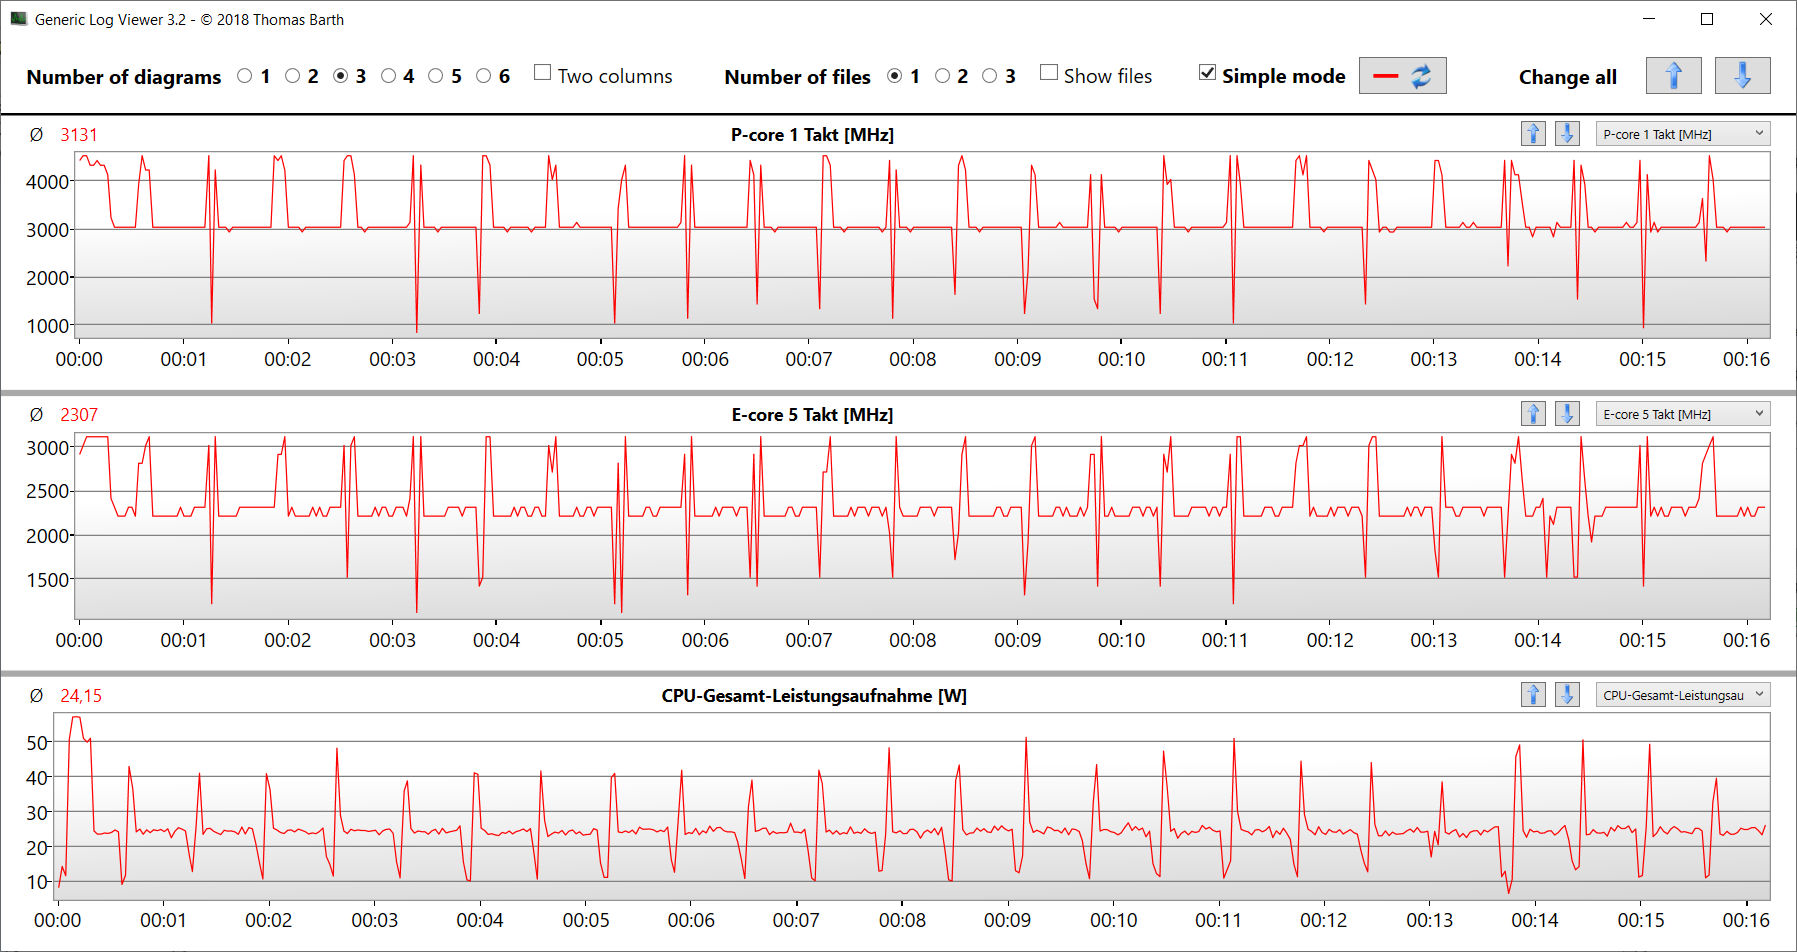
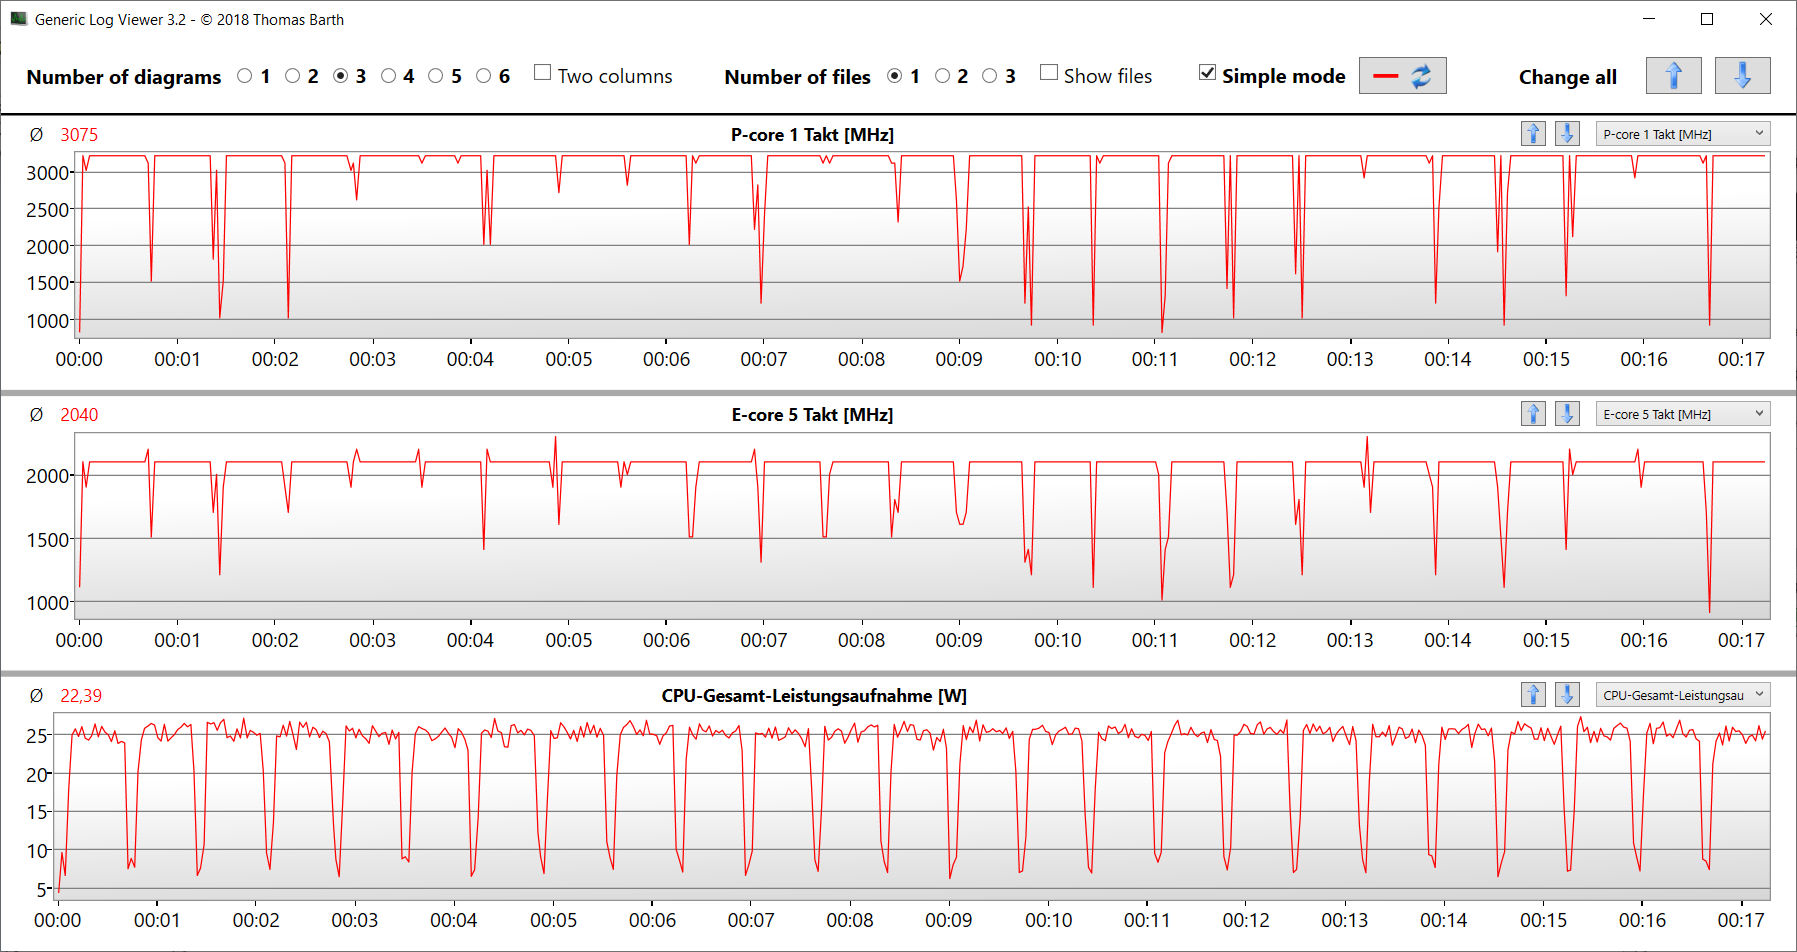
Processador
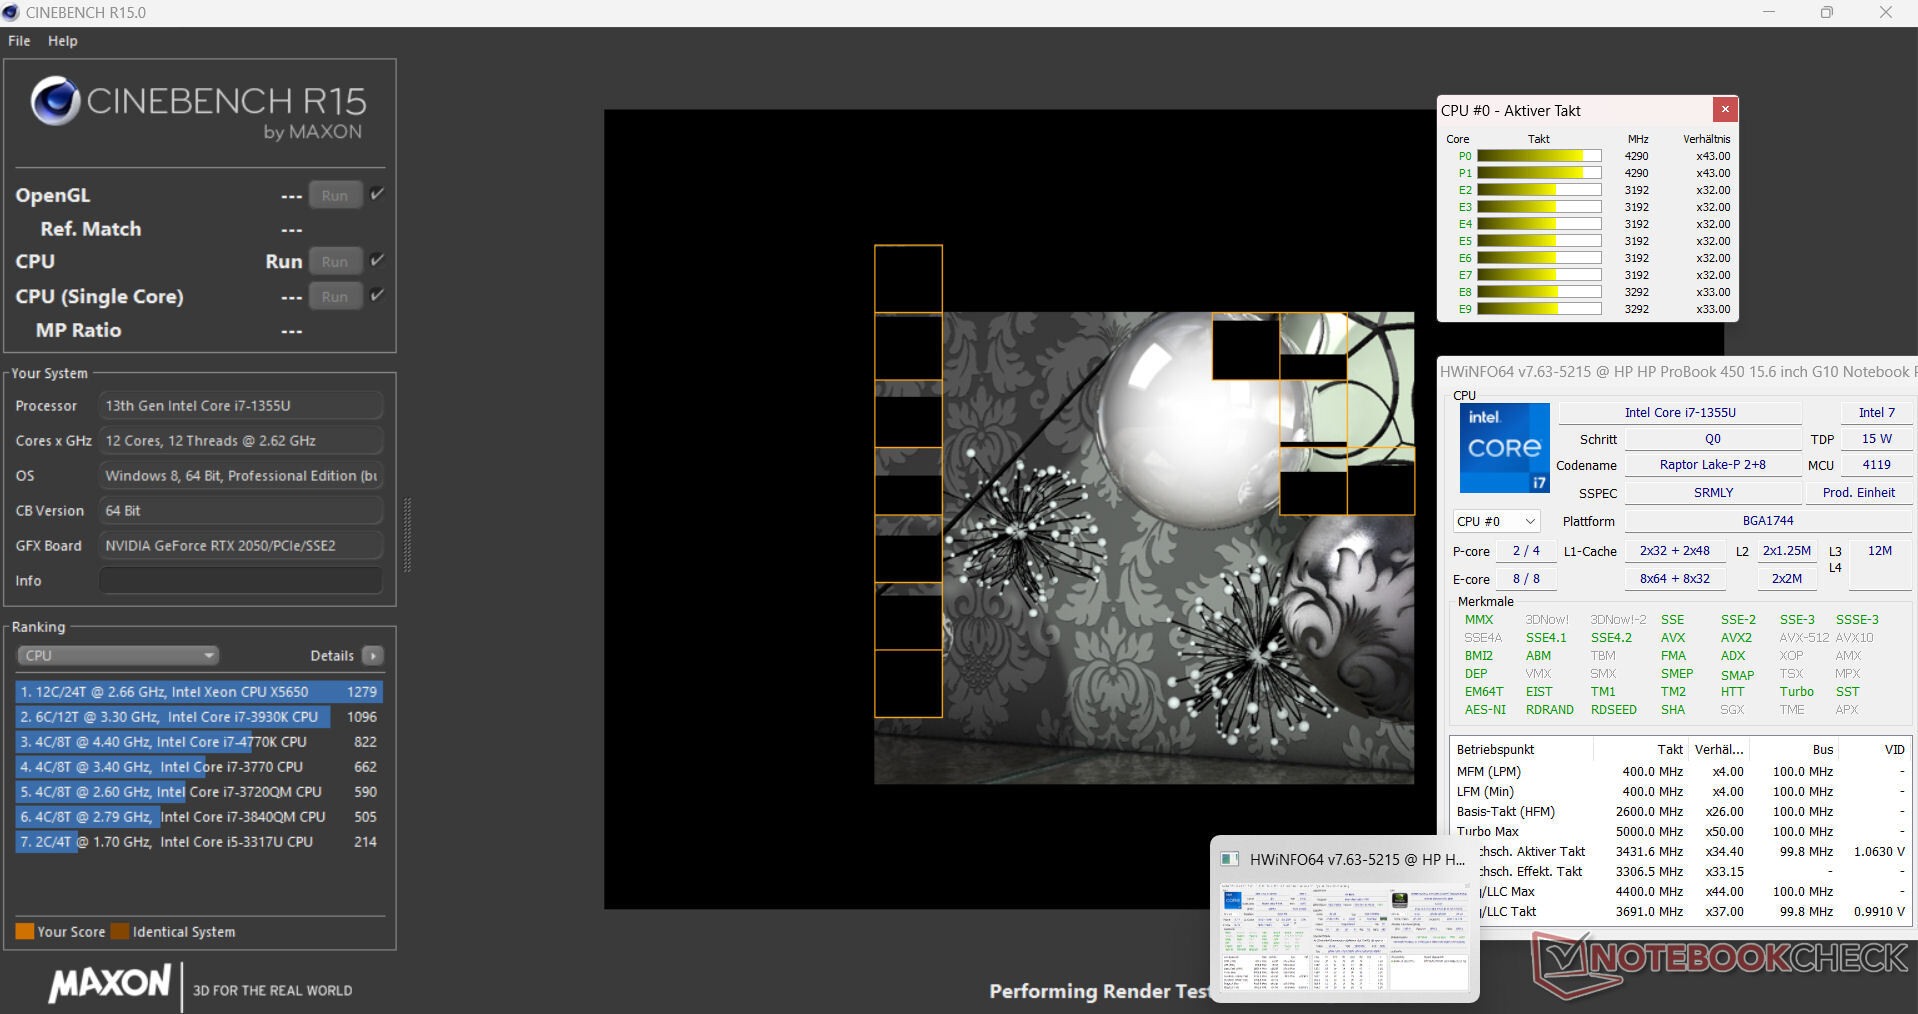
O Core i7-1355Uos 10 núcleos de CPU do Core i7-1355U (2P, 8E) atingem taxas de clock máximas de 5 GHz (P) e 3,7 GHz (E). A carga multithread permanente (CB15 Loop) faz com que a taxa de clock diminua um pouco da primeira para a segunda execução. Depois disso, ela permanece constante.
O Aspire equipado com a mesma CPU obteve melhores resultados de benchmark do que o ProBook devido ao seu Power Limit 1 mais alto (28 watts vs. 24 watts). Este último apresentou resultados médios para a CPU instalada (quando conectado à rede elétrica). No uso da bateria, seu desempenho single-thread mais relevante (162 pontos; CB15) caiu menos do que seu desempenho multi-thread (673 pontos; CB15).
Cinebench R15 Multi continuous test
| CPU Performance rating - Percent | |
| Média da turma Office | |
| Acer Aspire 5 A515-58GM-76S8 | |
| Média Intel Core i7-1355U | |
| Lenovo ThinkPad L15 Gen 4 21H70021GE | |
| HP ProBook 450 G10 | |
| Schenker VIA 15 Pro M22 | |
| Dell Latitude 3440 | |
| Fujitsu LifeBook E5412A E542AMHAAMDE | |
| HWBOT x265 Benchmark v2.2 - 4k Preset | |
| Média da turma Office (2.21 - 26, n=76, últimos 2 anos) | |
| Schenker VIA 15 Pro M22 | |
| Lenovo ThinkPad L15 Gen 4 21H70021GE | |
| Acer Aspire 5 A515-58GM-76S8 | |
| Fujitsu LifeBook E5412A E542AMHAAMDE | |
| Média Intel Core i7-1355U (7.83 - 11.4, n=18) | |
| HP ProBook 450 G10 | |
| Dell Latitude 3440 | |
| LibreOffice - 20 Documents To PDF | |
| Schenker VIA 15 Pro M22 | |
| Média da turma Office (39.9 - 102.3, n=76, últimos 2 anos) | |
| Fujitsu LifeBook E5412A E542AMHAAMDE | |
| HP ProBook 450 G10 | |
| Média Intel Core i7-1355U (41.1 - 108.6, n=18) | |
| Lenovo ThinkPad L15 Gen 4 21H70021GE | |
| Dell Latitude 3440 | |
| Acer Aspire 5 A515-58GM-76S8 | |
| R Benchmark 2.5 - Overall mean | |
| Schenker VIA 15 Pro M22 | |
| Fujitsu LifeBook E5412A E542AMHAAMDE | |
| Lenovo ThinkPad L15 Gen 4 21H70021GE | |
| Média da turma Office (0.393 - 0.888, n=76, últimos 2 anos) | |
| Dell Latitude 3440 | |
| Média Intel Core i7-1355U (0.4481 - 0.832, n=18) | |
| Acer Aspire 5 A515-58GM-76S8 | |
| HP ProBook 450 G10 | |
* ... menor é melhor
AIDA64: FP32 Ray-Trace | FPU Julia | CPU SHA3 | CPU Queen | FPU SinJulia | FPU Mandel | CPU AES | CPU ZLib | FP64 Ray-Trace | CPU PhotoWorxx
| Performance rating | |
| Schenker VIA 15 Pro M22 | |
| Média da turma Office | |
| Lenovo ThinkPad L15 Gen 4 21H70021GE | |
| Acer Aspire 5 A515-58GM-76S8 | |
| Fujitsu LifeBook E5412A E542AMHAAMDE | |
| Média Intel Core i7-1355U | |
| HP ProBook 450 G10 | |
| Dell Latitude 3440 | |
| AIDA64 / FP32 Ray-Trace | |
| Média da turma Office (2083 - 31245, n=83, últimos 2 anos) | |
| Schenker VIA 15 Pro M22 | |
| Lenovo ThinkPad L15 Gen 4 21H70021GE | |
| Fujitsu LifeBook E5412A E542AMHAAMDE | |
| Acer Aspire 5 A515-58GM-76S8 | |
| HP ProBook 450 G10 | |
| Dell Latitude 3440 | |
| Média Intel Core i7-1355U (5673 - 8424, n=18) | |
| AIDA64 / FPU Julia | |
| Lenovo ThinkPad L15 Gen 4 21H70021GE | |
| Schenker VIA 15 Pro M22 | |
| Média da turma Office (8191 - 125394, n=83, últimos 2 anos) | |
| Fujitsu LifeBook E5412A E542AMHAAMDE | |
| Acer Aspire 5 A515-58GM-76S8 | |
| Média Intel Core i7-1355U (29580 - 42706, n=18) | |
| HP ProBook 450 G10 | |
| Dell Latitude 3440 | |
| AIDA64 / CPU SHA3 | |
| Média da turma Office (433 - 5755, n=83, últimos 2 anos) | |
| Lenovo ThinkPad L15 Gen 4 21H70021GE | |
| Schenker VIA 15 Pro M22 | |
| Acer Aspire 5 A515-58GM-76S8 | |
| Fujitsu LifeBook E5412A E542AMHAAMDE | |
| Média Intel Core i7-1355U (1529 - 2200, n=18) | |
| Dell Latitude 3440 | |
| HP ProBook 450 G10 | |
| AIDA64 / CPU Queen | |
| Schenker VIA 15 Pro M22 | |
| Lenovo ThinkPad L15 Gen 4 21H70021GE | |
| Fujitsu LifeBook E5412A E542AMHAAMDE | |
| Acer Aspire 5 A515-58GM-76S8 | |
| HP ProBook 450 G10 | |
| Média da turma Office (22784 - 115197, n=67, últimos 2 anos) | |
| Média Intel Core i7-1355U (21547 - 66907, n=18) | |
| Dell Latitude 3440 | |
| AIDA64 / FPU SinJulia | |
| Schenker VIA 15 Pro M22 | |
| Lenovo ThinkPad L15 Gen 4 21H70021GE | |
| Fujitsu LifeBook E5412A E542AMHAAMDE | |
| Média da turma Office (1378 - 18321, n=83, últimos 2 anos) | |
| Acer Aspire 5 A515-58GM-76S8 | |
| HP ProBook 450 G10 | |
| Média Intel Core i7-1355U (4045 - 5426, n=18) | |
| Dell Latitude 3440 | |
| AIDA64 / FPU Mandel | |
| Lenovo ThinkPad L15 Gen 4 21H70021GE | |
| Schenker VIA 15 Pro M22 | |
| Média da turma Office (4601 - 66922, n=83, últimos 2 anos) | |
| Fujitsu LifeBook E5412A E542AMHAAMDE | |
| Acer Aspire 5 A515-58GM-76S8 | |
| Média Intel Core i7-1355U (14596 - 21627, n=18) | |
| HP ProBook 450 G10 | |
| Dell Latitude 3440 | |
| AIDA64 / CPU AES | |
| Acer Aspire 5 A515-58GM-76S8 | |
| Média da turma Office (4854 - 155900, n=83, últimos 2 anos) | |
| Lenovo ThinkPad L15 Gen 4 21H70021GE | |
| Schenker VIA 15 Pro M22 | |
| Média Intel Core i7-1355U (31432 - 75408, n=18) | |
| HP ProBook 450 G10 | |
| Dell Latitude 3440 | |
| Fujitsu LifeBook E5412A E542AMHAAMDE | |
| AIDA64 / CPU ZLib | |
| Schenker VIA 15 Pro M22 | |
| Média da turma Office (114.6 - 1366, n=83, últimos 2 anos) | |
| Lenovo ThinkPad L15 Gen 4 21H70021GE | |
| Acer Aspire 5 A515-58GM-76S8 | |
| Média Intel Core i7-1355U (454 - 684, n=18) | |
| Dell Latitude 3440 | |
| HP ProBook 450 G10 | |
| Fujitsu LifeBook E5412A E542AMHAAMDE | |
| AIDA64 / FP64 Ray-Trace | |
| Média da turma Office (1109 - 17834, n=83, últimos 2 anos) | |
| Schenker VIA 15 Pro M22 | |
| Lenovo ThinkPad L15 Gen 4 21H70021GE | |
| Fujitsu LifeBook E5412A E542AMHAAMDE | |
| Acer Aspire 5 A515-58GM-76S8 | |
| Dell Latitude 3440 | |
| HP ProBook 450 G10 | |
| Média Intel Core i7-1355U (2991 - 4453, n=18) | |
| AIDA64 / CPU PhotoWorxx | |
| Média da turma Office (11090 - 65229, n=83, últimos 2 anos) | |
| Média Intel Core i7-1355U (21800 - 46154, n=18) | |
| HP ProBook 450 G10 | |
| Schenker VIA 15 Pro M22 | |
| Dell Latitude 3440 | |
| Acer Aspire 5 A515-58GM-76S8 | |
| Fujitsu LifeBook E5412A E542AMHAAMDE | |
| Lenovo ThinkPad L15 Gen 4 21H70021GE | |
Desempenho do sistema
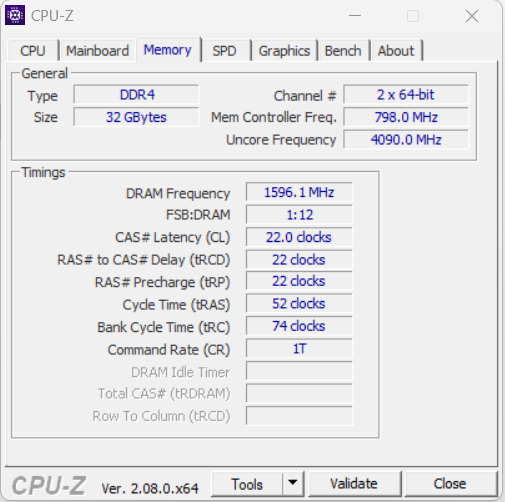
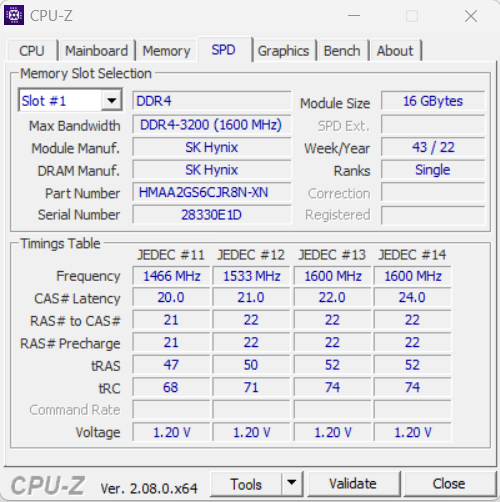
O sistema de funcionamento suave domina o uso do escritório e da Internet, programas com uso intensivo de GPU, bem como jogos com requisitos moderados. Da mesma forma que em seu antecessor, a HP conta com a RAM DDR4-3200 para esse laptop. Uma memória DDR5 mais moderna poderia ter obtido um pouco mais de desempenho da CPU. As taxas de dados da RAM são normais para a RAM DDR4-3200. Os resultados do PC Mark foram bons.
CrossMark: Overall | Productivity | Creativity | Responsiveness
| PCMark 10 / Score | |
| Média da turma Office (2601 - 9298, n=68, últimos 2 anos) | |
| Acer Aspire 5 A515-58GM-76S8 | |
| Média Intel Core i7-1355U, NVIDIA GeForce RTX 2050 Mobile (6235 - 6540, n=3) | |
| HP ProBook 450 G10 | |
| Fujitsu LifeBook E5412A E542AMHAAMDE | |
| Lenovo ThinkPad L15 Gen 4 21H70021GE | |
| Dell Latitude 3440 | |
| Schenker VIA 15 Pro M22 | |
| PCMark 10 / Essentials | |
| Acer Aspire 5 A515-58GM-76S8 | |
| Média Intel Core i7-1355U, NVIDIA GeForce RTX 2050 Mobile (10174 - 20841, n=3) | |
| Dell Latitude 3440 | |
| HP ProBook 450 G10 | |
| Média da turma Office (3245 - 11594, n=68, últimos 2 anos) | |
| Lenovo ThinkPad L15 Gen 4 21H70021GE | |
| Fujitsu LifeBook E5412A E542AMHAAMDE | |
| Schenker VIA 15 Pro M22 | |
| PCMark 10 / Productivity | |
| Média da turma Office (5336 - 17243, n=68, últimos 2 anos) | |
| Fujitsu LifeBook E5412A E542AMHAAMDE | |
| Lenovo ThinkPad L15 Gen 4 21H70021GE | |
| HP ProBook 450 G10 | |
| Acer Aspire 5 A515-58GM-76S8 | |
| Média Intel Core i7-1355U, NVIDIA GeForce RTX 2050 Mobile (8449 - 8841, n=3) | |
| Schenker VIA 15 Pro M22 | |
| Dell Latitude 3440 | |
| PCMark 10 / Digital Content Creation | |
| Média da turma Office (2049 - 13541, n=68, últimos 2 anos) | |
| Acer Aspire 5 A515-58GM-76S8 | |
| Média Intel Core i7-1355U, NVIDIA GeForce RTX 2050 Mobile (7278 - 7967, n=3) | |
| HP ProBook 450 G10 | |
| Schenker VIA 15 Pro M22 | |
| Dell Latitude 3440 | |
| Fujitsu LifeBook E5412A E542AMHAAMDE | |
| Lenovo ThinkPad L15 Gen 4 21H70021GE | |
| CrossMark / Overall | |
| Acer Aspire 5 A515-58GM-76S8 | |
| Média Intel Core i7-1355U, NVIDIA GeForce RTX 2050 Mobile (1629 - 1794, n=3) | |
| HP ProBook 450 G10 | |
| Média da turma Office (381 - 2010, n=75, últimos 2 anos) | |
| Dell Latitude 3440 | |
| Fujitsu LifeBook E5412A E542AMHAAMDE | |
| Lenovo ThinkPad L15 Gen 4 21H70021GE | |
| Schenker VIA 15 Pro M22 | |
| CrossMark / Productivity | |
| Acer Aspire 5 A515-58GM-76S8 | |
| Média Intel Core i7-1355U, NVIDIA GeForce RTX 2050 Mobile (1635 - 1870, n=3) | |
| HP ProBook 450 G10 | |
| Média da turma Office (464 - 1880, n=75, últimos 2 anos) | |
| Dell Latitude 3440 | |
| Fujitsu LifeBook E5412A E542AMHAAMDE | |
| Lenovo ThinkPad L15 Gen 4 21H70021GE | |
| Schenker VIA 15 Pro M22 | |
| CrossMark / Creativity | |
| Média Intel Core i7-1355U, NVIDIA GeForce RTX 2050 Mobile (1655 - 1766, n=3) | |
| HP ProBook 450 G10 | |
| Média da turma Office (319 - 2361, n=75, últimos 2 anos) | |
| Acer Aspire 5 A515-58GM-76S8 | |
| Dell Latitude 3440 | |
| Fujitsu LifeBook E5412A E542AMHAAMDE | |
| Lenovo ThinkPad L15 Gen 4 21H70021GE | |
| Schenker VIA 15 Pro M22 | |
| CrossMark / Responsiveness | |
| Acer Aspire 5 A515-58GM-76S8 | |
| Média Intel Core i7-1355U, NVIDIA GeForce RTX 2050 Mobile (1504 - 2017, n=3) | |
| HP ProBook 450 G10 | |
| Média da turma Office (360 - 1820, n=75, últimos 2 anos) | |
| Dell Latitude 3440 | |
| Schenker VIA 15 Pro M22 | |
| Lenovo ThinkPad L15 Gen 4 21H70021GE | |
| Fujitsu LifeBook E5412A E542AMHAAMDE | |
| PCMark 10 Score | 6235 pontos | |
Ajuda | ||
| AIDA64 / Memory Copy | |
| Média da turma Office (20075 - 110930, n=80, últimos 2 anos) | |
| Média Intel Core i7-1355U (35017 - 71600, n=18) | |
| HP ProBook 450 G10 | |
| Acer Aspire 5 A515-58GM-76S8 | |
| Dell Latitude 3440 | |
| Schenker VIA 15 Pro M22 | |
| Fujitsu LifeBook E5412A E542AMHAAMDE | |
| Lenovo ThinkPad L15 Gen 4 21H70021GE | |
| AIDA64 / Memory Read | |
| Média da turma Office (10084 - 128030, n=81, últimos 2 anos) | |
| Média Intel Core i7-1355U (38551 - 73377, n=18) | |
| HP ProBook 450 G10 | |
| Schenker VIA 15 Pro M22 | |
| Acer Aspire 5 A515-58GM-76S8 | |
| Dell Latitude 3440 | |
| Fujitsu LifeBook E5412A E542AMHAAMDE | |
| Lenovo ThinkPad L15 Gen 4 21H70021GE | |
| AIDA64 / Memory Write | |
| Média da turma Office (20073 - 119858, n=81, últimos 2 anos) | |
| Média Intel Core i7-1355U (35910 - 93342, n=18) | |
| HP ProBook 450 G10 | |
| Schenker VIA 15 Pro M22 | |
| Dell Latitude 3440 | |
| Acer Aspire 5 A515-58GM-76S8 | |
| Fujitsu LifeBook E5412A E542AMHAAMDE | |
| Lenovo ThinkPad L15 Gen 4 21H70021GE | |
| AIDA64 / Memory Latency | |
| Média Intel Core i7-1355U (72.2 - 346, n=18) | |
| Média da turma Office (7.6 - 162.9, n=76, últimos 2 anos) | |
| Lenovo ThinkPad L15 Gen 4 21H70021GE | |
| Fujitsu LifeBook E5412A E542AMHAAMDE | |
| Schenker VIA 15 Pro M22 | |
| Dell Latitude 3440 | |
| Acer Aspire 5 A515-58GM-76S8 | |
| HP ProBook 450 G10 | |
* ... menor é melhor
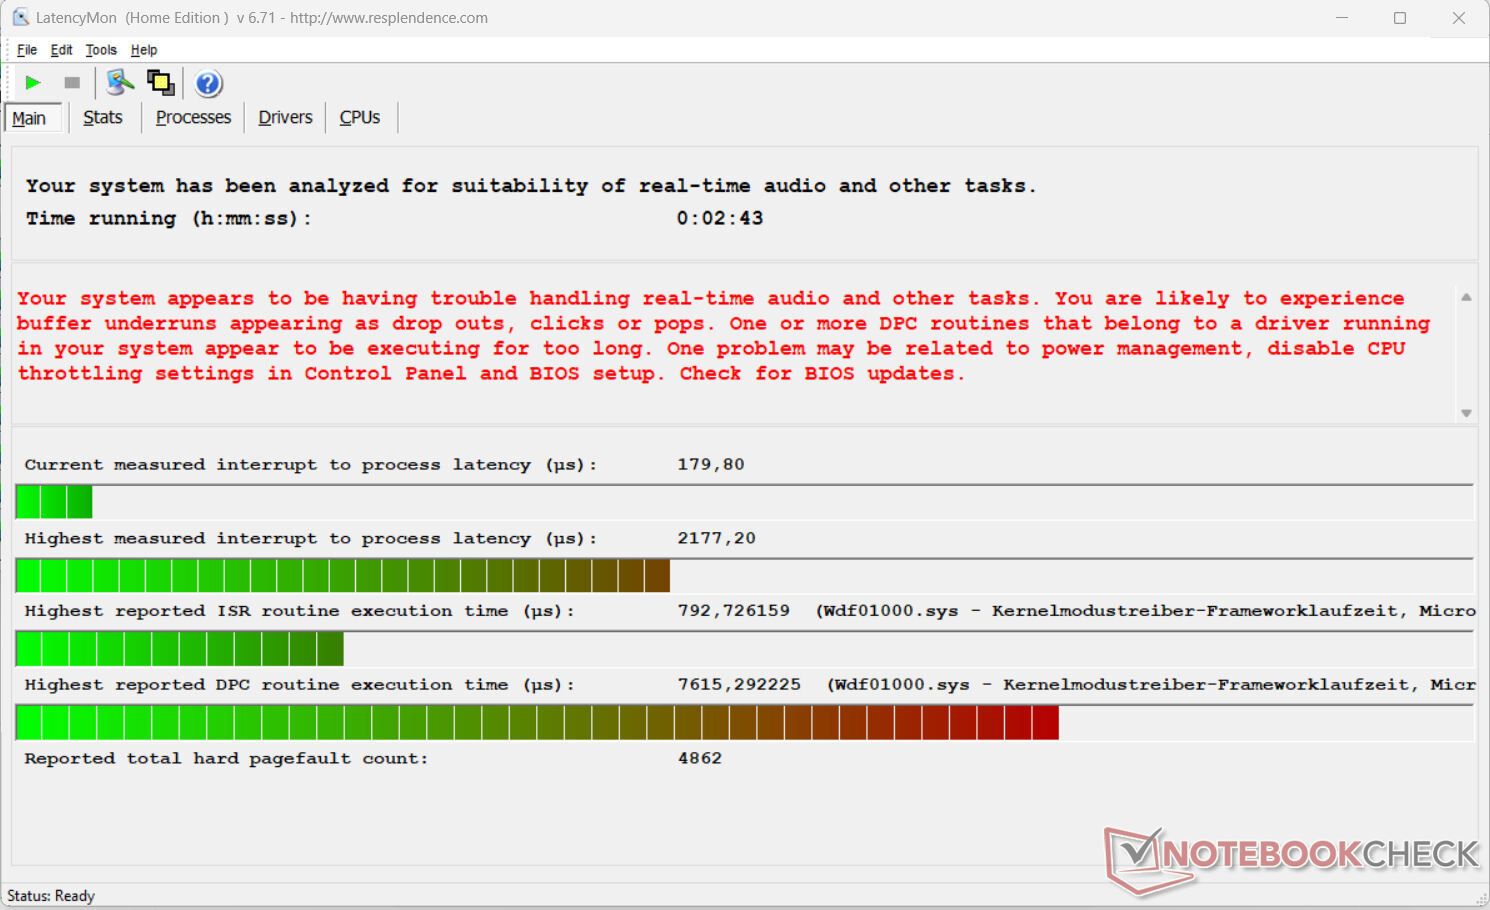
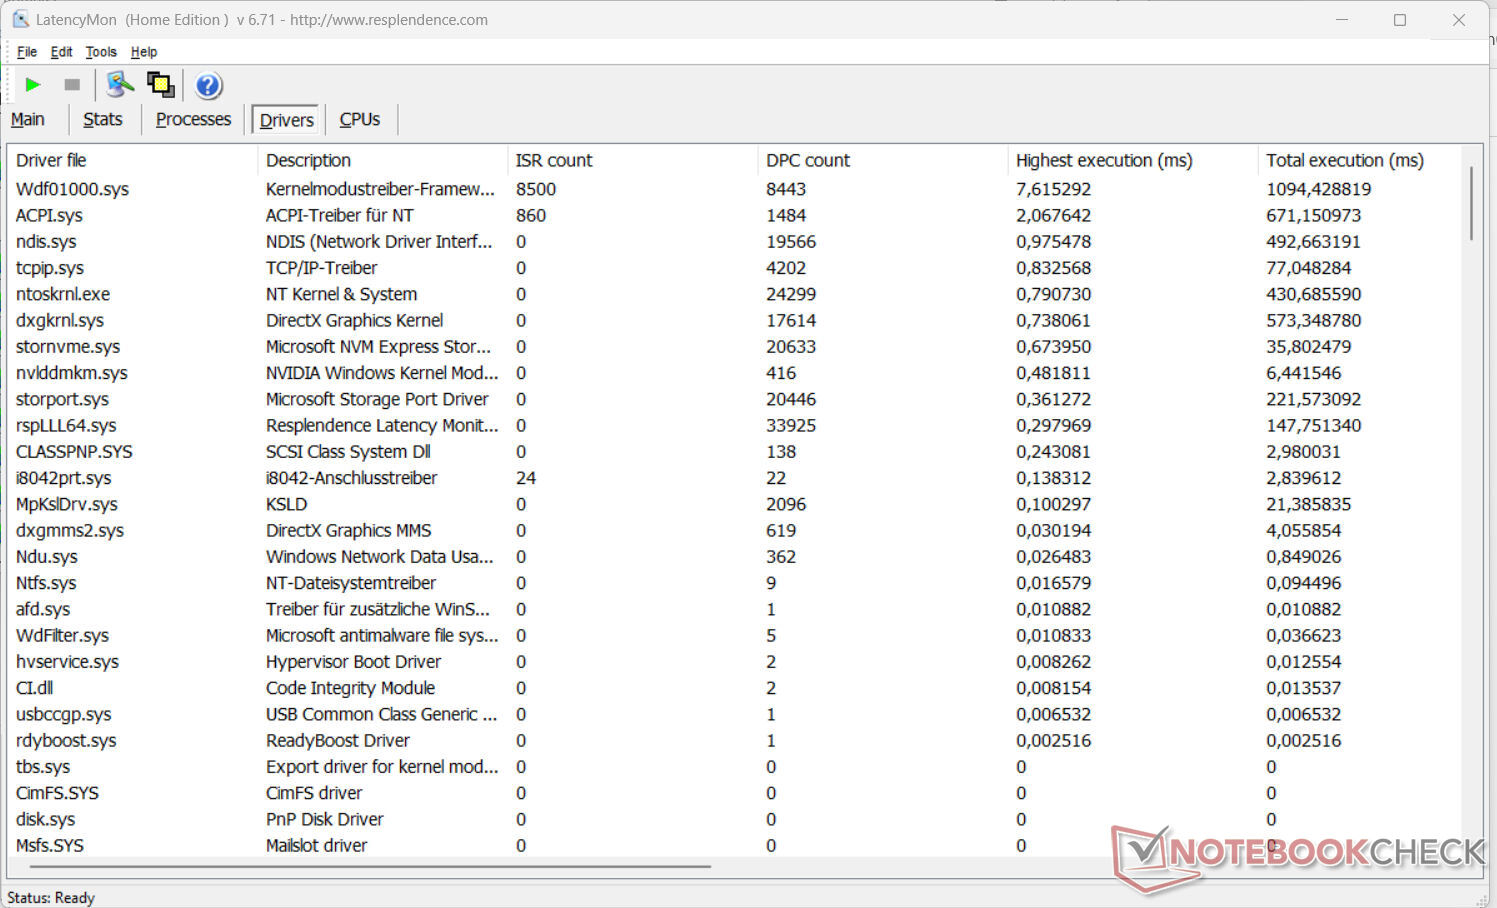
Latência DPC
O teste padronizado do monitor de latência (navegação na Web, reprodução de vídeo 4k, alta carga do Prime95) revelou algumas anomalias. O sistema não parece ser adequado para edição de vídeo e áudio em tempo real. Futuras atualizações de software podem levar a melhorias ou até mesmo a deteriorações.
| DPC Latencies / LatencyMon - interrupt to process latency (max), Web, Youtube, Prime95 | |
| HP ProBook 450 G10 | |
| Schenker VIA 15 Pro M22 | |
| Dell Latitude 3440 | |
| Fujitsu LifeBook E5412A E542AMHAAMDE | |
| Lenovo ThinkPad L15 Gen 4 21H70021GE | |
| Acer Aspire 5 A515-58GM-76S8 | |
* ... menor é melhor
Dispositivos de armazenamento
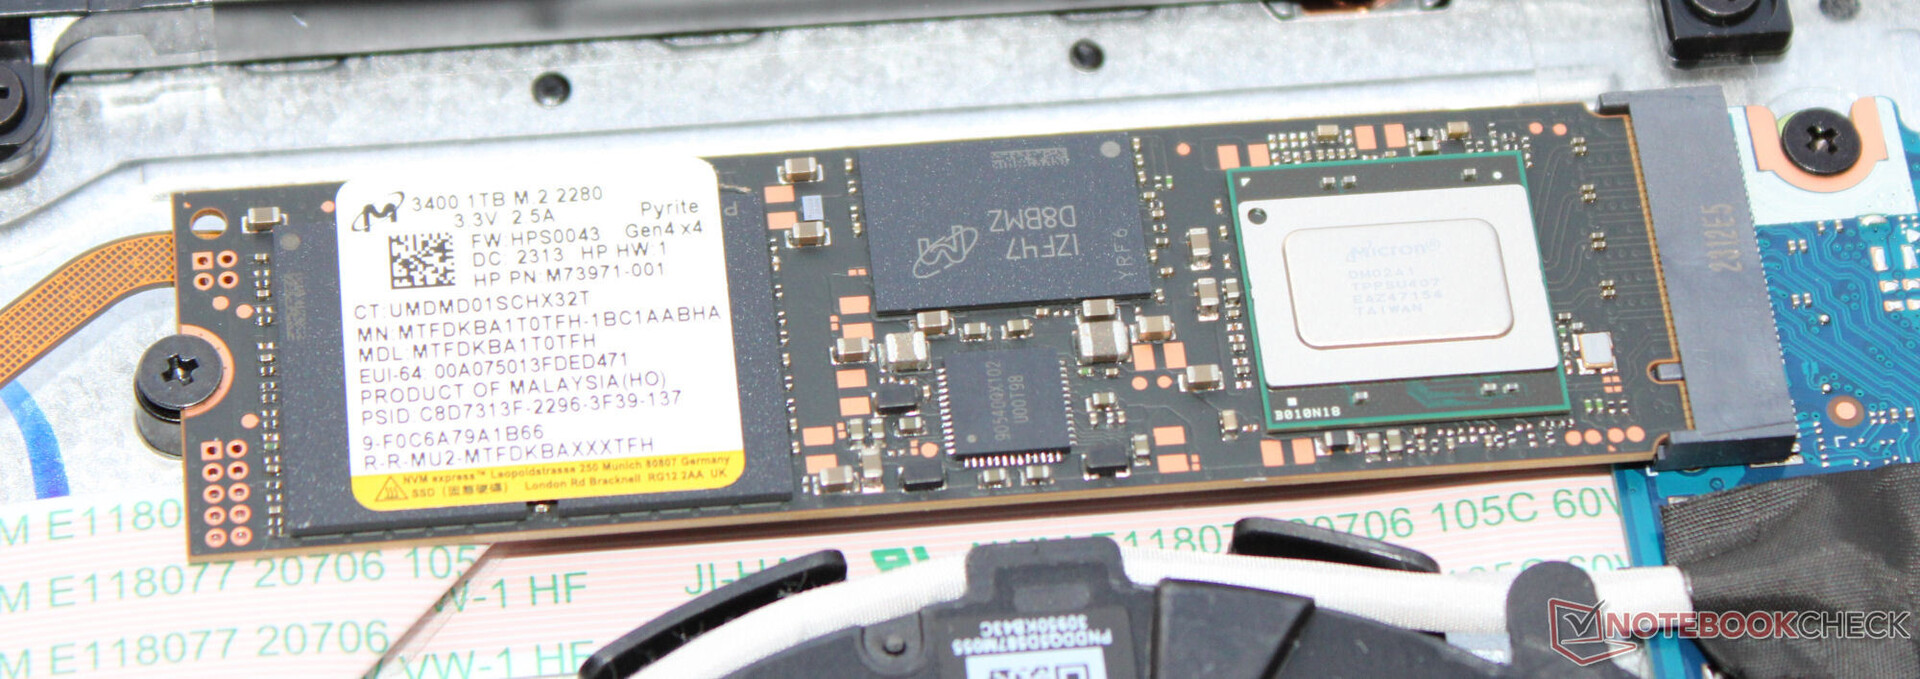
O SSD PCIe 4 do dispositivo (M.2-2280) da Micron tem capacidade de 1 TB e forneceu excelentes taxas de dados durante nosso teste. Uma pena: Depois de um curto período, notamos um estrangulamento térmico. O laptop tem espaço para um segundo SSD PCIe (somente M.2-2242 ou M.2-2230 com a placa de suporte correspondente).

| Drive Performance rating - Percent | |
| Acer Aspire 5 A515-58GM-76S8 | |
| HP ProBook 450 G10 | |
| Média Micron 3400 1TB MTFDKBA1T0TFH | |
| Schenker VIA 15 Pro M22 | |
| Dell Latitude 3440 | |
| Média da turma Office | |
| Lenovo ThinkPad L15 Gen 4 21H70021GE | |
| Fujitsu LifeBook E5412A E542AMHAAMDE | |
* ... menor é melhor
Reading continuous performance: DiskSpd Read Loop, Queue Depth 8
Placa de vídeo
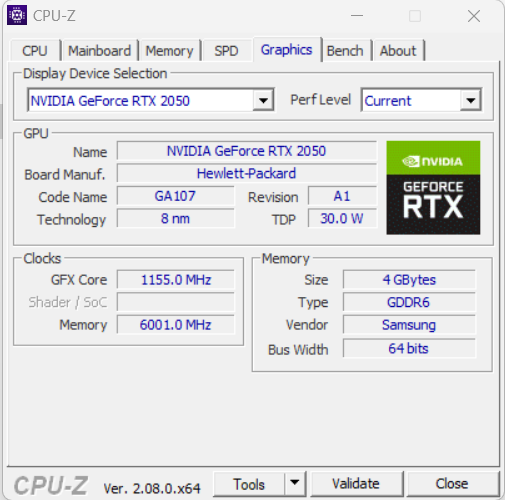
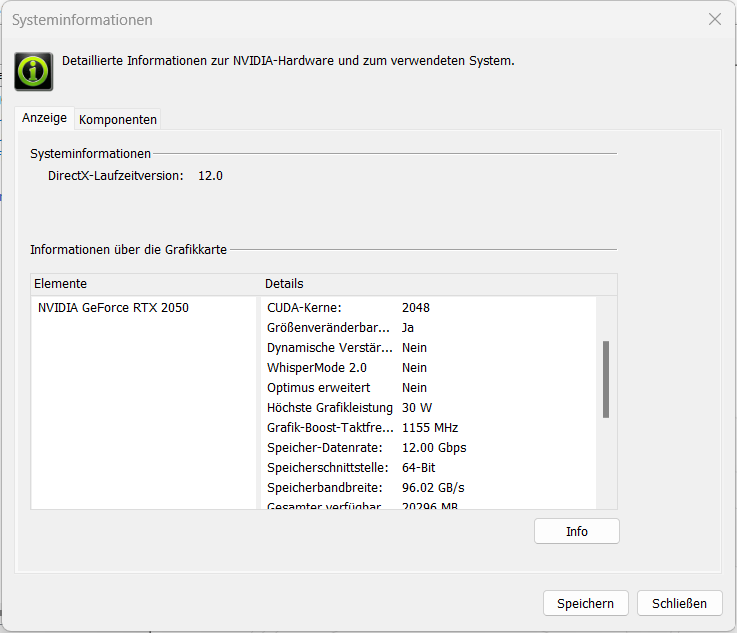
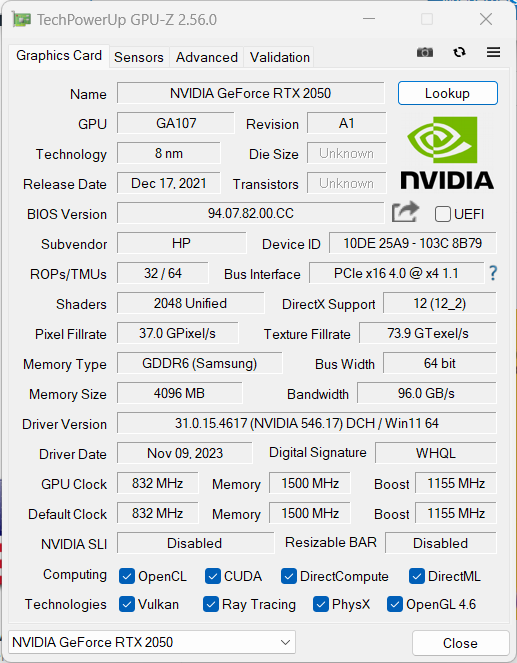
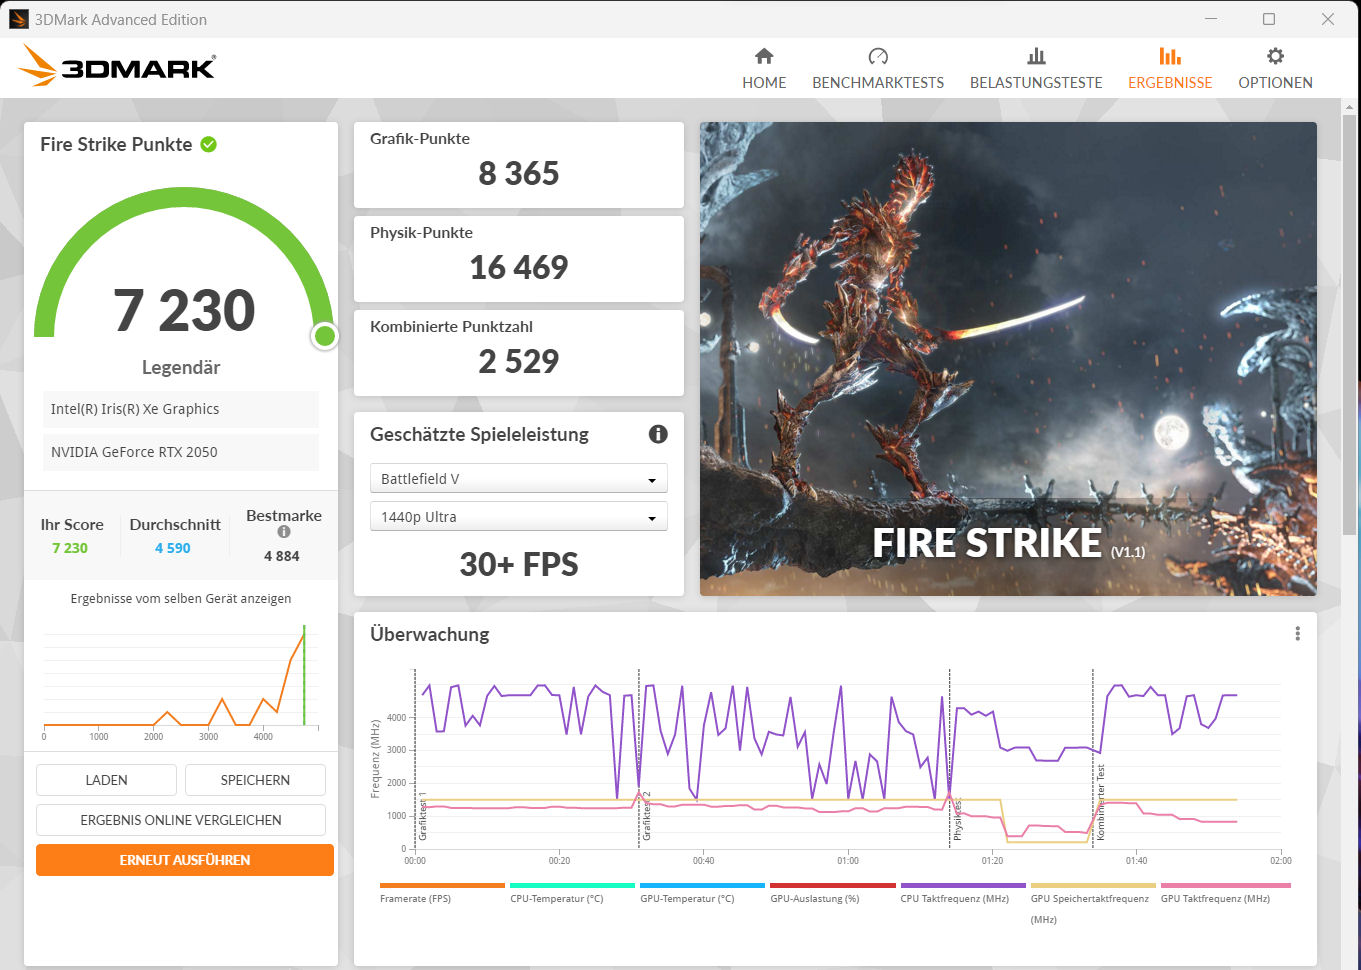
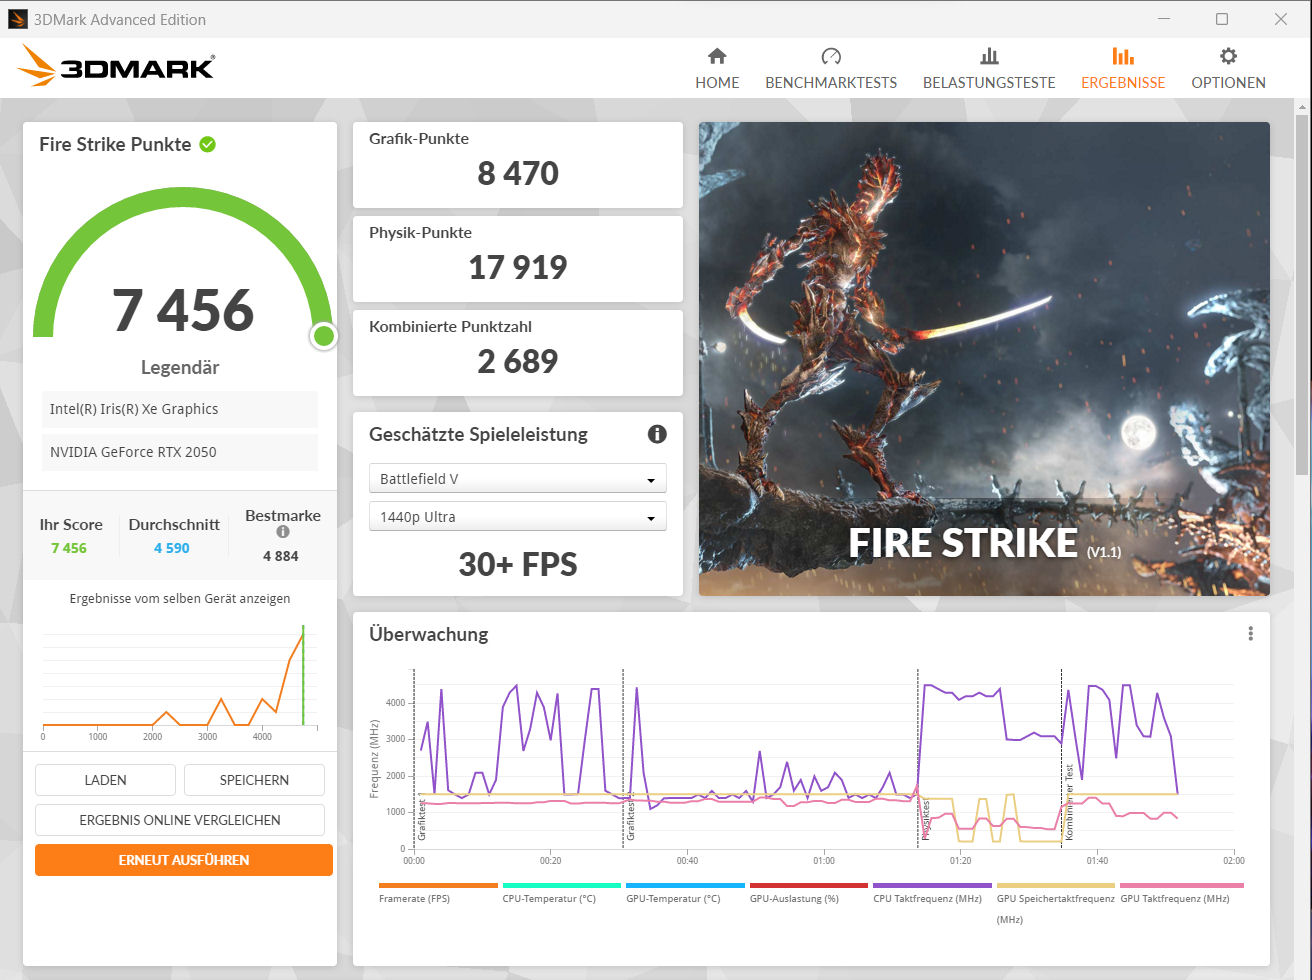
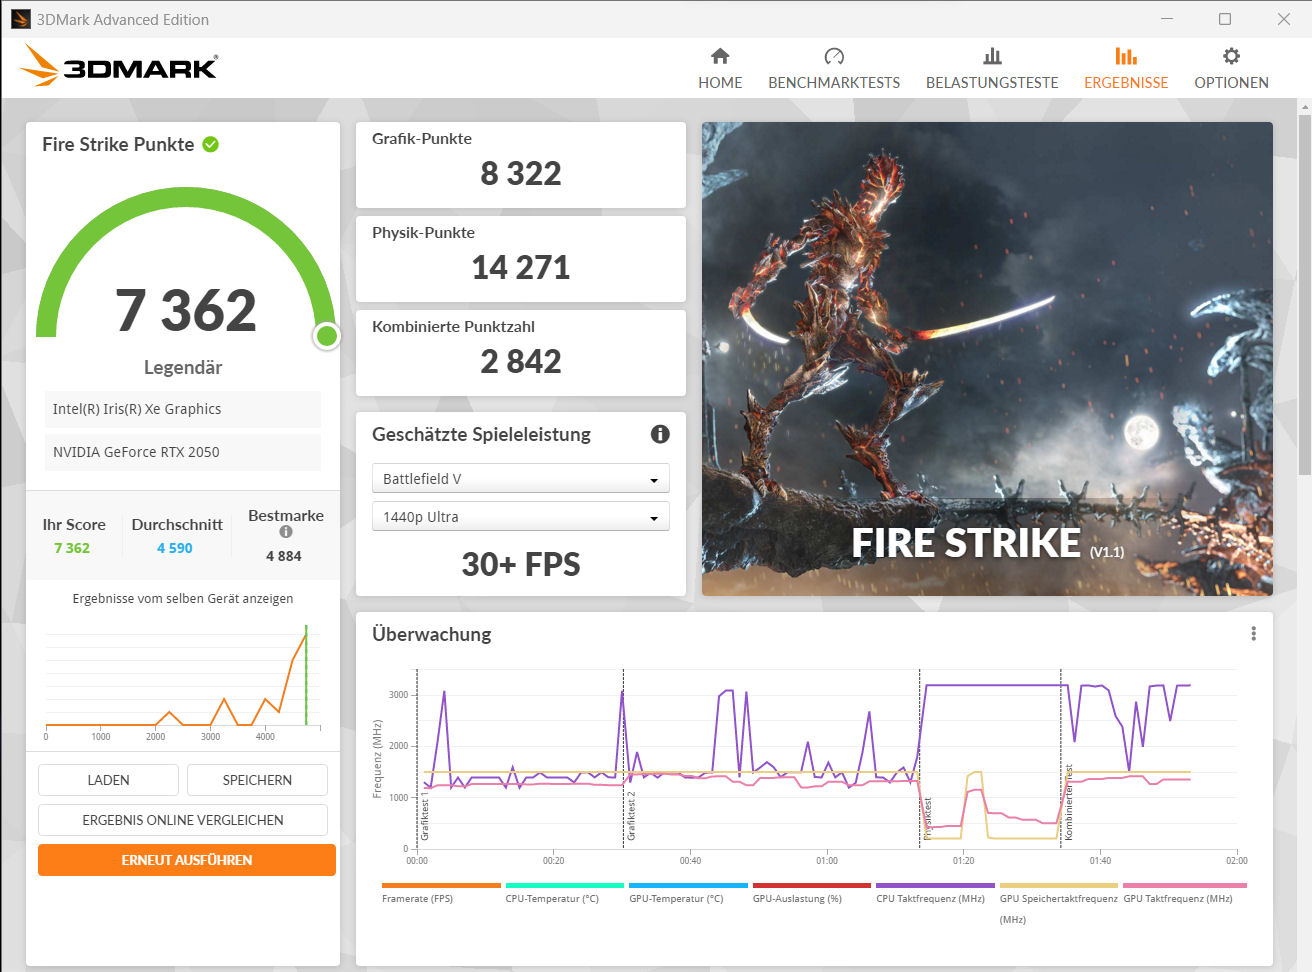
Dentro da atual linha de GPUs RTX da Nvidia, a GeForce RTX 2050 é o modelo mais fraco. A GPU oferece 2.048 shaders, um barramento de 64 bits de largura, RAM GDDR6 rápida (4.096 MB), traçado de raios e DLSS. A HP lhe deu um TGP de 30 watts - um valor na margem inferior do que é possível. Como esperado, seus resultados de benchmark ficaram abaixo da média anterior da RTX-2050.
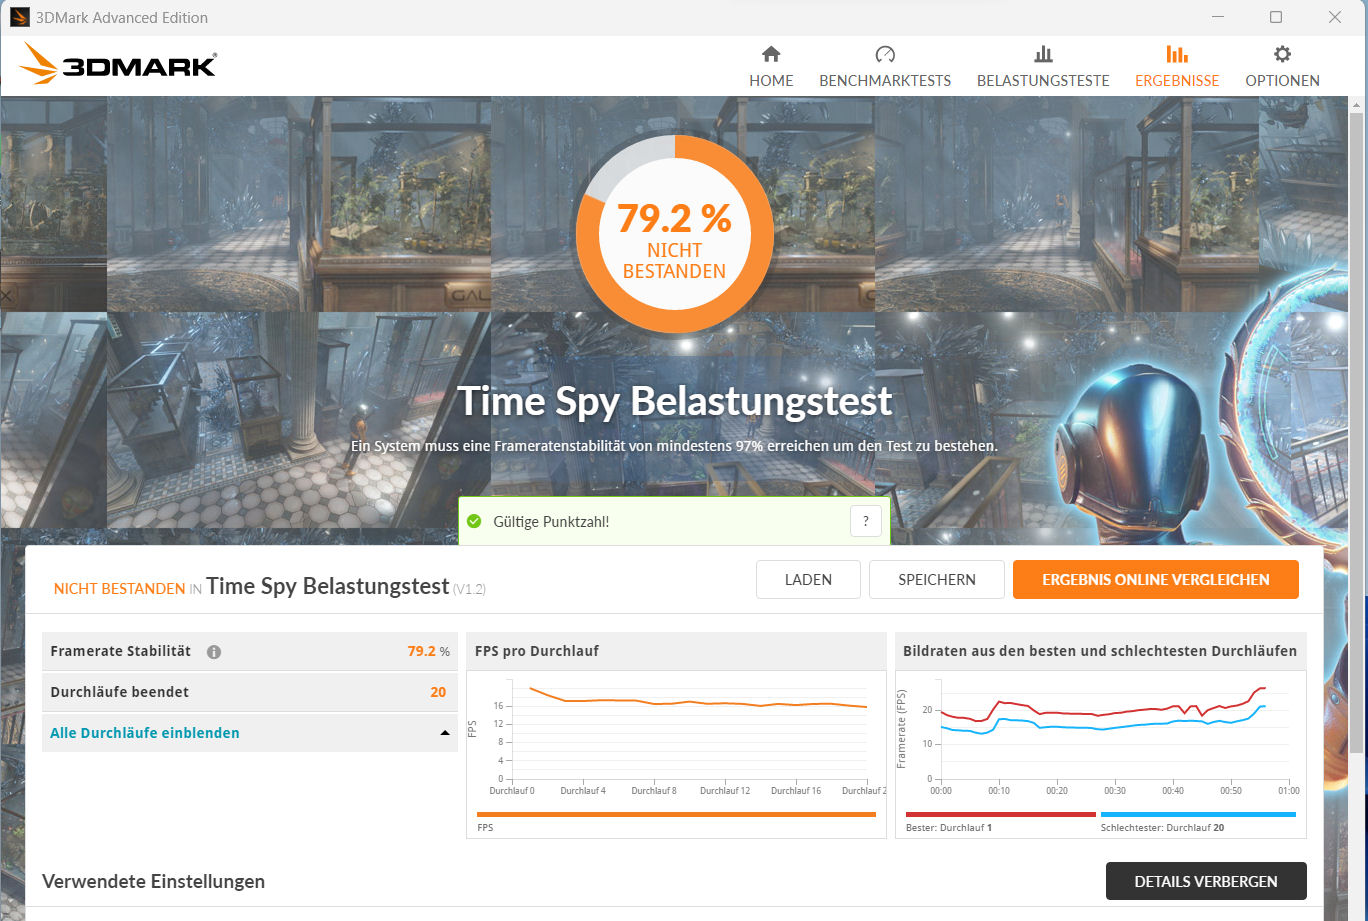
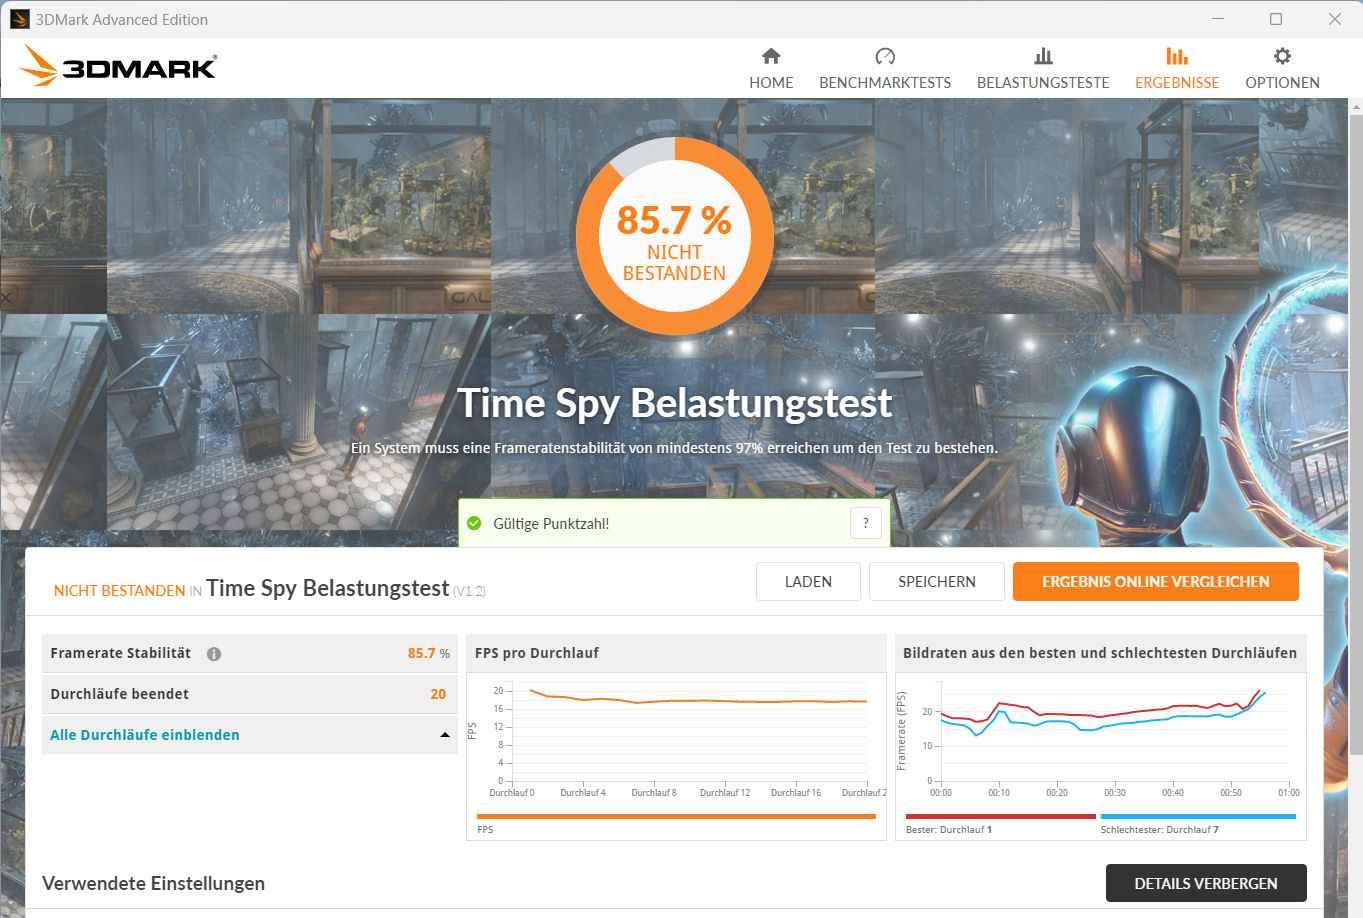
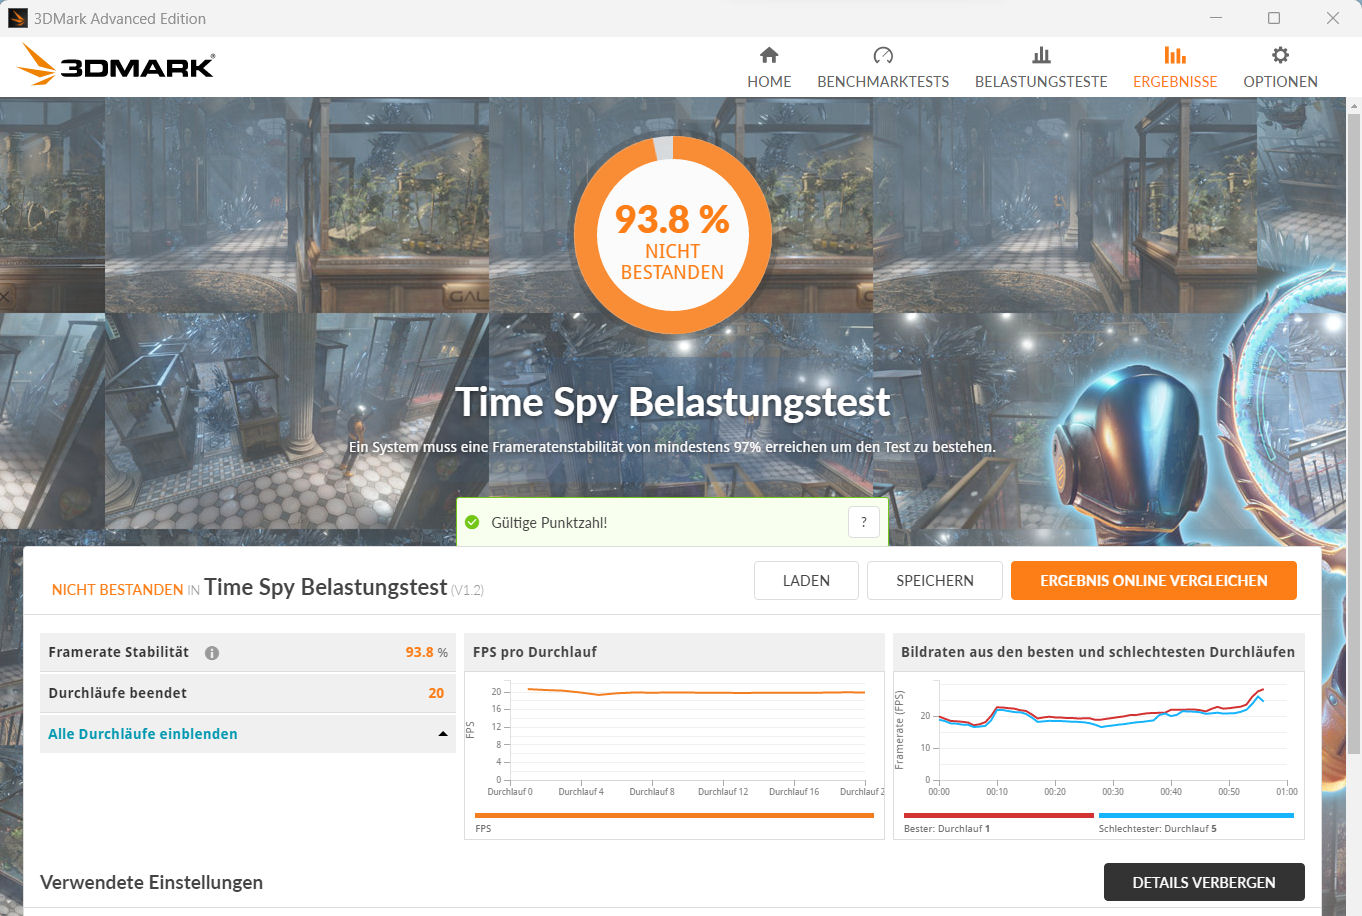
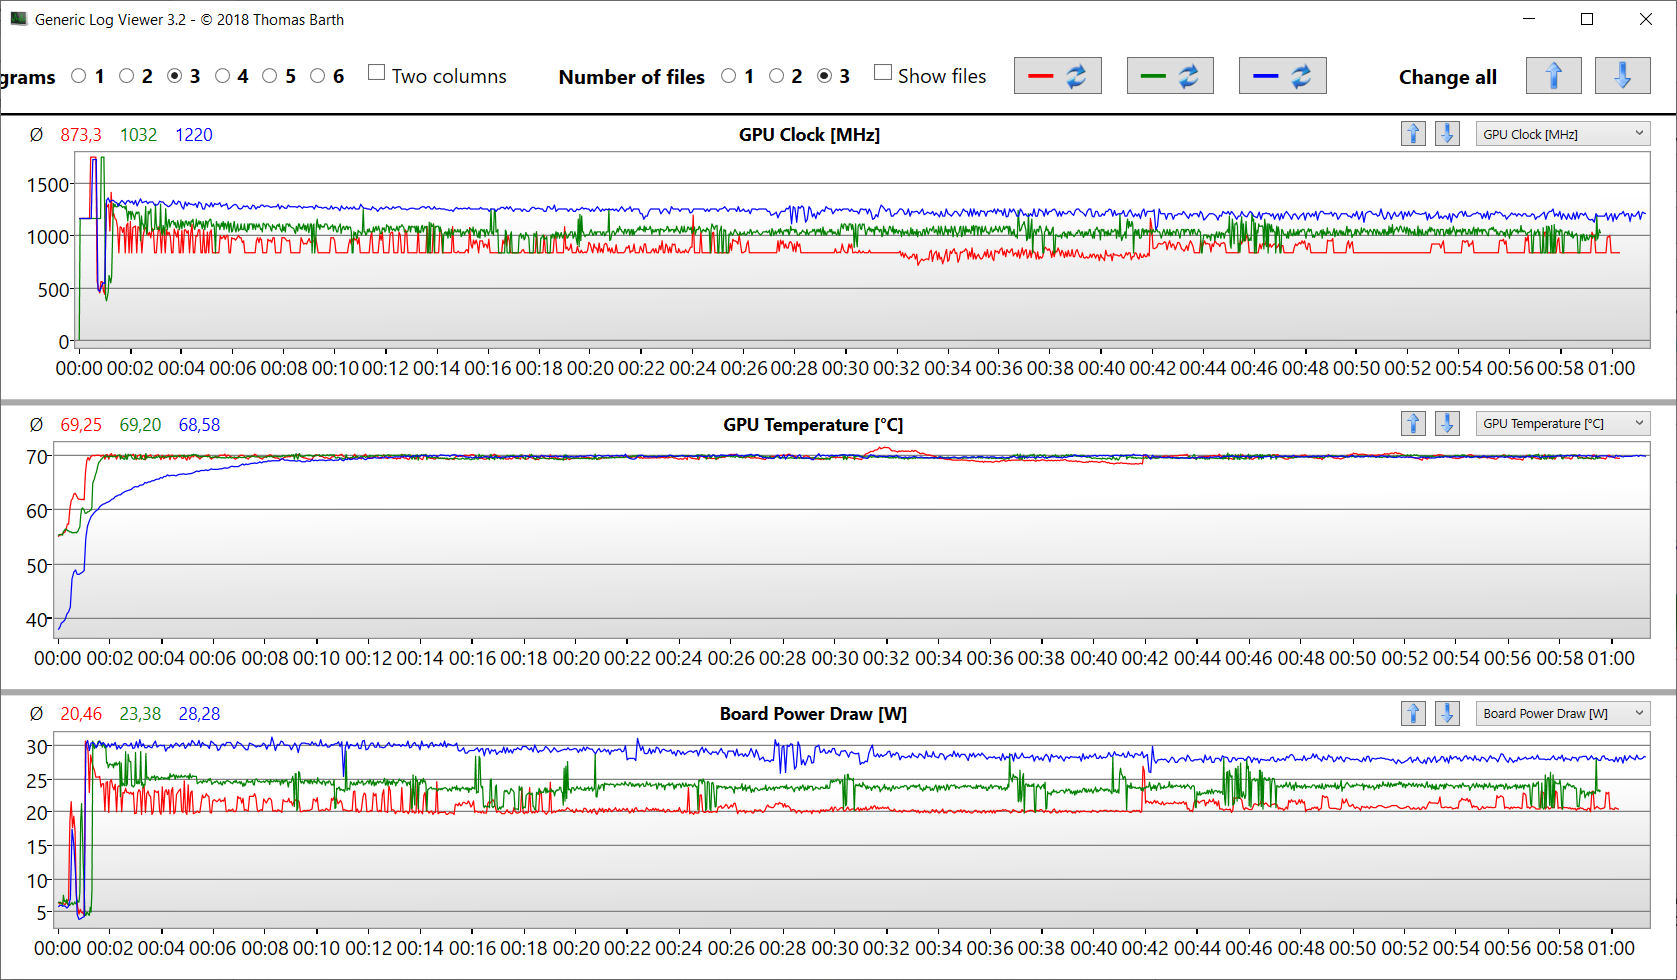
A GPU pode trabalhar com potência total por um curto período de tempo e, a longo prazo, suas taxas de clock diminuem. A extensão depende do perfil de energia selecionado - no entanto, contra as expectativas: "Melhor desempenho" tem o maior efeito, "melhor economia de energia" leva à menor queda. Os dados de registro do Witcher 3 os dados do registro de teste mostram essas diferenças com muita clareza (imagem mais abaixo). O teste de estresse do Time Spy evidencia ainda mais esse comportamento.
Observação: não podemos descartar um erro em nosso dispositivo de teste. Se esse for um problema geral, a HP poderá corrigi-lo com a ajuda de uma futura atualização do BIOS.

| 3DMark Performance rating - Percent | |
| Média NVIDIA GeForce RTX 2050 Mobile | |
| Acer Aspire 5 A515-58GM-76S8 | |
| HP ProBook 450 G10 | |
| Média da turma Office | |
| Schenker VIA 15 Pro M22 -1! | |
| Dell Latitude 3440 -1! | |
| Fujitsu LifeBook E5412A E542AMHAAMDE | |
| Lenovo ThinkPad L15 Gen 4 21H70021GE | |
| 3DMark 11 - 1280x720 Performance GPU | |
| Média NVIDIA GeForce RTX 2050 Mobile (10598 - 15411, n=10) | |
| Acer Aspire 5 A515-58GM-76S8 | |
| HP ProBook 450 G10 | |
| Média da turma Office (2551 - 18313, n=72, últimos 2 anos) | |
| Schenker VIA 15 Pro M22 | |
| Fujitsu LifeBook E5412A E542AMHAAMDE | |
| Dell Latitude 3440 | |
| Lenovo ThinkPad L15 Gen 4 21H70021GE | |
| 3DMark 06 Standard Score | 38036 pontos | |
| 3DMark 11 Performance | 10898 pontos | |
| 3DMark Cloud Gate Standard Score | 25686 pontos | |
| 3DMark Fire Strike Score | 7230 pontos | |
| 3DMark Time Spy Score | 3129 pontos | |
Ajuda | ||
* ... menor é melhor
Desempenho em jogos
O ProBook não pode ser classificado como um laptop para jogos, no entanto, graças à sua GPU GeForce, ele é capaz de executar vários jogos. O senhor deve usar o perfil de energia "melhor economia de energia". Somente assim a GPU funcionará com taxas de clock relativamente constantes e altas.
O hardware permite jogos em FHD usando configurações de baixa a alta. Os jogos atuais geralmente exigem que o senhor diminua as configurações. Para obter taxas de quadros suficientemente altas, o senhor deve escolher as configurações de forma mais conservadora.
| Performance rating - Percent | |
| Média NVIDIA GeForce RTX 2050 Mobile | |
| Acer Aspire 5 A515-58GM-76S8 | |
| HP ProBook 450 G10 | |
| Média da turma Office | |
| Schenker VIA 15 Pro M22 | |
| Fujitsu LifeBook E5412A E542AMHAAMDE | |
| Dell Latitude 3440 | |
| Lenovo ThinkPad L15 Gen 4 21H70021GE | |
| The Witcher 3 - 1920x1080 Ultra Graphics & Postprocessing (HBAO+) | |
| Acer Aspire 5 A515-58GM-76S8 | |
| Média NVIDIA GeForce RTX 2050 Mobile (24.3 - 39.6, n=9) | |
| HP ProBook 450 G10 | |
| Média da turma Office (14.8 - 28.1, n=3, últimos 2 anos) | |
| Schenker VIA 15 Pro M22 | |
| Fujitsu LifeBook E5412A E542AMHAAMDE | |
| Dell Latitude 3440 | |
| Lenovo ThinkPad L15 Gen 4 21H70021GE | |
| GTA V - 1920x1080 Highest AA:4xMSAA + FX AF:16x | |
| Média NVIDIA GeForce RTX 2050 Mobile (35.6 - 55.8, n=10) | |
| Acer Aspire 5 A515-58GM-76S8 | |
| HP ProBook 450 G10 | |
| Média da turma Office (5.77 - 45.3, n=69, últimos 2 anos) | |
| Schenker VIA 15 Pro M22 | |
| Fujitsu LifeBook E5412A E542AMHAAMDE | |
| Lenovo ThinkPad L15 Gen 4 21H70021GE | |
| Dell Latitude 3440 | |
| Final Fantasy XV Benchmark - 1920x1080 High Quality | |
| Acer Aspire 5 A515-58GM-76S8 | |
| Média NVIDIA GeForce RTX 2050 Mobile (24.8 - 42.9, n=10) | |
| HP ProBook 450 G10 | |
| Média da turma Office (8.09 - 79.5, n=71, últimos 2 anos) | |
| Schenker VIA 15 Pro M22 | |
| Dell Latitude 3440 | |
| Fujitsu LifeBook E5412A E542AMHAAMDE | |
| Lenovo ThinkPad L15 Gen 4 21H70021GE | |
| Strange Brigade - 1920x1080 ultra AA:ultra AF:16 | |
| Média NVIDIA GeForce RTX 2050 Mobile (46.2 - 65.3, n=9) | |
| Acer Aspire 5 A515-58GM-76S8 | |
| HP ProBook 450 G10 | |
| Média da turma Office (12.9 - 142.1, n=53, últimos 2 anos) | |
| Schenker VIA 15 Pro M22 | |
| Fujitsu LifeBook E5412A E542AMHAAMDE | |
| Dell Latitude 3440 | |
| Lenovo ThinkPad L15 Gen 4 21H70021GE | |
| Dota 2 Reborn - 1920x1080 ultra (3/3) best looking | |
| Média NVIDIA GeForce RTX 2050 Mobile (66.1 - 130.1, n=10) | |
| Acer Aspire 5 A515-58GM-76S8 | |
| HP ProBook 450 G10 | |
| Média da turma Office (14.6 - 135, n=77, últimos 2 anos) | |
| Schenker VIA 15 Pro M22 | |
| Dell Latitude 3440 | |
| Fujitsu LifeBook E5412A E542AMHAAMDE | |
| Lenovo ThinkPad L15 Gen 4 21H70021GE | |
| X-Plane 11.11 - 1920x1080 high (fps_test=3) | |
| Média NVIDIA GeForce RTX 2050 Mobile (59.4 - 92.6, n=11) | |
| Acer Aspire 5 A515-58GM-76S8 | |
| HP ProBook 450 G10 | |
| Média da turma Office (12 - 82.4, n=69, últimos 2 anos) | |
| Fujitsu LifeBook E5412A E542AMHAAMDE | |
| Schenker VIA 15 Pro M22 | |
| Dell Latitude 3440 | |
| Lenovo ThinkPad L15 Gen 4 21H70021GE | |
Para testar se as taxas de quadros permanecem estáveis por um longo período, deixamos o jogo The Witcher 3 rodar por cerca de 60 minutos em resolução Full HD e configurações de qualidade máxima. Não movemos o personagem. O perfil "melhor desempenho" resultou em taxas de quadros flutuantes, enquanto o perfil "melhor economia de energia" permitiu taxas de quadros mais alinhadas com nossas expectativas.
Witcher 3 FPS diagram
| baixo | média | alto | ultra | |
|---|---|---|---|---|
| GTA V (2015) | 156.4 | 153.1 | 74 | 35.6 |
| The Witcher 3 (2015) | 142.1 | 84.2 | 46.7 | 24.3 |
| Dota 2 Reborn (2015) | 149.1 | 123.5 | 108.2 | 98.6 |
| Final Fantasy XV Benchmark (2018) | 68.1 | 32.3 | 24.8 | |
| X-Plane 11.11 (2018) | 91 | 80.9 | 69.6 | |
| Far Cry 5 (2018) | 93 | 39 | 35 | 34 |
| Strange Brigade (2018) | 143.1 | 66.5 | 53.7 | 46.2 |
| Cyberpunk 2077 1.6 (2022) | 32.2 | 23.5 | 19.1 | 16.8 |
| F1 23 (2023) | 54.8 | 50.8 | 36.9 | 11.3 |
Emissões - O HP G10 não produz muito ruído e calor
Emissões de ruído
A ventoinha permanece praticamente silenciosa no uso diário e muitas vezes fica completamente parada. Ela fica mais barulhenta sob carga média ou total: níveis de pressão sonora de 41,4 dB(A) foram atingidos em nosso teste. Em suma, esse ruído de fundo é perfeitamente aceitável para um laptop de escritório com uma GPU dedicada.
Barulho
| Ocioso |
| 23.5 / 23.5 / 23.5 dB |
| Carga |
| 38 / 41.4 dB |
 | ||
30 dB silencioso 40 dB(A) audível 50 dB(A) ruidosamente alto |
||
min: | ||
| HP ProBook 450 G10 GeForce RTX 2050 Mobile, i7-1355U, Micron 3400 1TB MTFDKBA1T0TFH | Acer Aspire 5 A515-58GM-76S8 GeForce RTX 2050 Mobile, i7-1355U, Micron 2450 1TB MTFDKBA1T0TFK | Schenker VIA 15 Pro M22 Vega 8, R7 5700U, Samsung SSD 970 EVO Plus 1TB | Lenovo ThinkPad L15 Gen 4 21H70021GE Vega 8, R7 PRO 7730U, SK hynix HFS512GEJ4X113N | Fujitsu LifeBook E5412A E542AMHAAMDE Vega 7, R5 PRO 5675U, WDC PC SN530 SDBQNPZ-512G | Dell Latitude 3440 Iris Xe G7 80EUs, i5-1345U, Samsung PM9A1 MZVL2512HCJQ | |
|---|---|---|---|---|---|---|
| Noise | -10% | -0% | 9% | -0% | -1% | |
| desligado / ambiente * (dB) | 23.5 | 25.04 -7% | 24 -2% | 23.5 -0% | 23.6 -0% | 23.9 -2% |
| Idle Minimum * (dB) | 23.5 | 26.3 -12% | 24 -2% | 23.5 -0% | 23.6 -0% | 24.4 -4% |
| Idle Average * (dB) | 23.5 | 26.3 -12% | 24 -2% | 23.5 -0% | 23.6 -0% | 24.4 -4% |
| Idle Maximum * (dB) | 23.5 | 26.3 -12% | 27.5 -17% | 23.5 -0% | 28.7 -22% | 24.4 -4% |
| Load Average * (dB) | 38 | 32.5 14% | 33.7 11% | 27.5 28% | 36.3 4% | 37.1 2% |
| Witcher 3 ultra * (dB) | 38.2 | 46.7 -22% | 33.7 12% | 32.7 14% | 36.3 5% | 38.2 -0% |
| Load Maximum * (dB) | 41.4 | 49 -18% | 42.4 -2% | 32.7 21% | 36.3 12% | 40.2 3% |
* ... menor é melhor
Temperatura
O laptop não esquenta muito sob carga (teste de estresse, Witcher 3 teste). No uso diário (escritório, Internet), os valores permanecem dentro da zona verde.
(+) A temperatura máxima no lado superior é 39.9 °C / 104 F, em comparação com a média de 34.3 °C / 94 F , variando de 21.2 a 62.5 °C para a classe Office.
(±) A parte inferior aquece até um máximo de 43 °C / 109 F, em comparação com a média de 36.8 °C / 98 F
(+) Em uso inativo, a temperatura média para o lado superior é 23.5 °C / 74 F, em comparação com a média do dispositivo de 29.5 °C / ### class_avg_f### F.
(+) Jogando The Witcher 3, a temperatura média para o lado superior é 31.4 °C / 89 F, em comparação com a média do dispositivo de 29.5 °C / ## #class_avg_f### F.
(+) Os apoios para as mãos e o touchpad são mais frios que a temperatura da pele, com um máximo de 29.1 °C / 84.4 F e, portanto, são frios ao toque.
(±) A temperatura média da área do apoio para as mãos de dispositivos semelhantes foi 27.5 °C / 81.5 F (-1.6 °C / -2.9 F).
| HP ProBook 450 G10 Intel Core i7-1355U, NVIDIA GeForce RTX 2050 Mobile | Acer Aspire 5 A515-58GM-76S8 Intel Core i7-1355U, NVIDIA GeForce RTX 2050 Mobile | Schenker VIA 15 Pro M22 AMD Ryzen 7 5700U, AMD Radeon RX Vega 8 (Ryzen 4000/5000) | Lenovo ThinkPad L15 Gen 4 21H70021GE AMD Ryzen 7 PRO 7730U, AMD Radeon RX Vega 8 (Ryzen 4000/5000) | Fujitsu LifeBook E5412A E542AMHAAMDE AMD Ryzen 5 PRO 5675U, AMD Radeon RX Vega 7 | Dell Latitude 3440 Intel Core i5-1345U, Intel Iris Xe Graphics G7 80EUs | |
|---|---|---|---|---|---|---|
| Heat | 6% | -2% | 10% | -14% | -2% | |
| Maximum Upper Side * (°C) | 39.9 | 35.7 11% | 41.2 -3% | 39.1 2% | 49.5 -24% | 35.2 12% |
| Maximum Bottom * (°C) | 43 | 36.8 14% | 43.5 -1% | 36.1 16% | 50.3 -17% | 41 5% |
| Idle Upper Side * (°C) | 26.4 | 27.9 -6% | 28.4 -8% | 23.1 12% | 29.6 -12% | 29.8 -13% |
| Idle Bottom * (°C) | 29 | 27.9 4% | 28.1 3% | 25.7 11% | 30 -3% | 32 -10% |
* ... menor é melhor
Teste de estresse
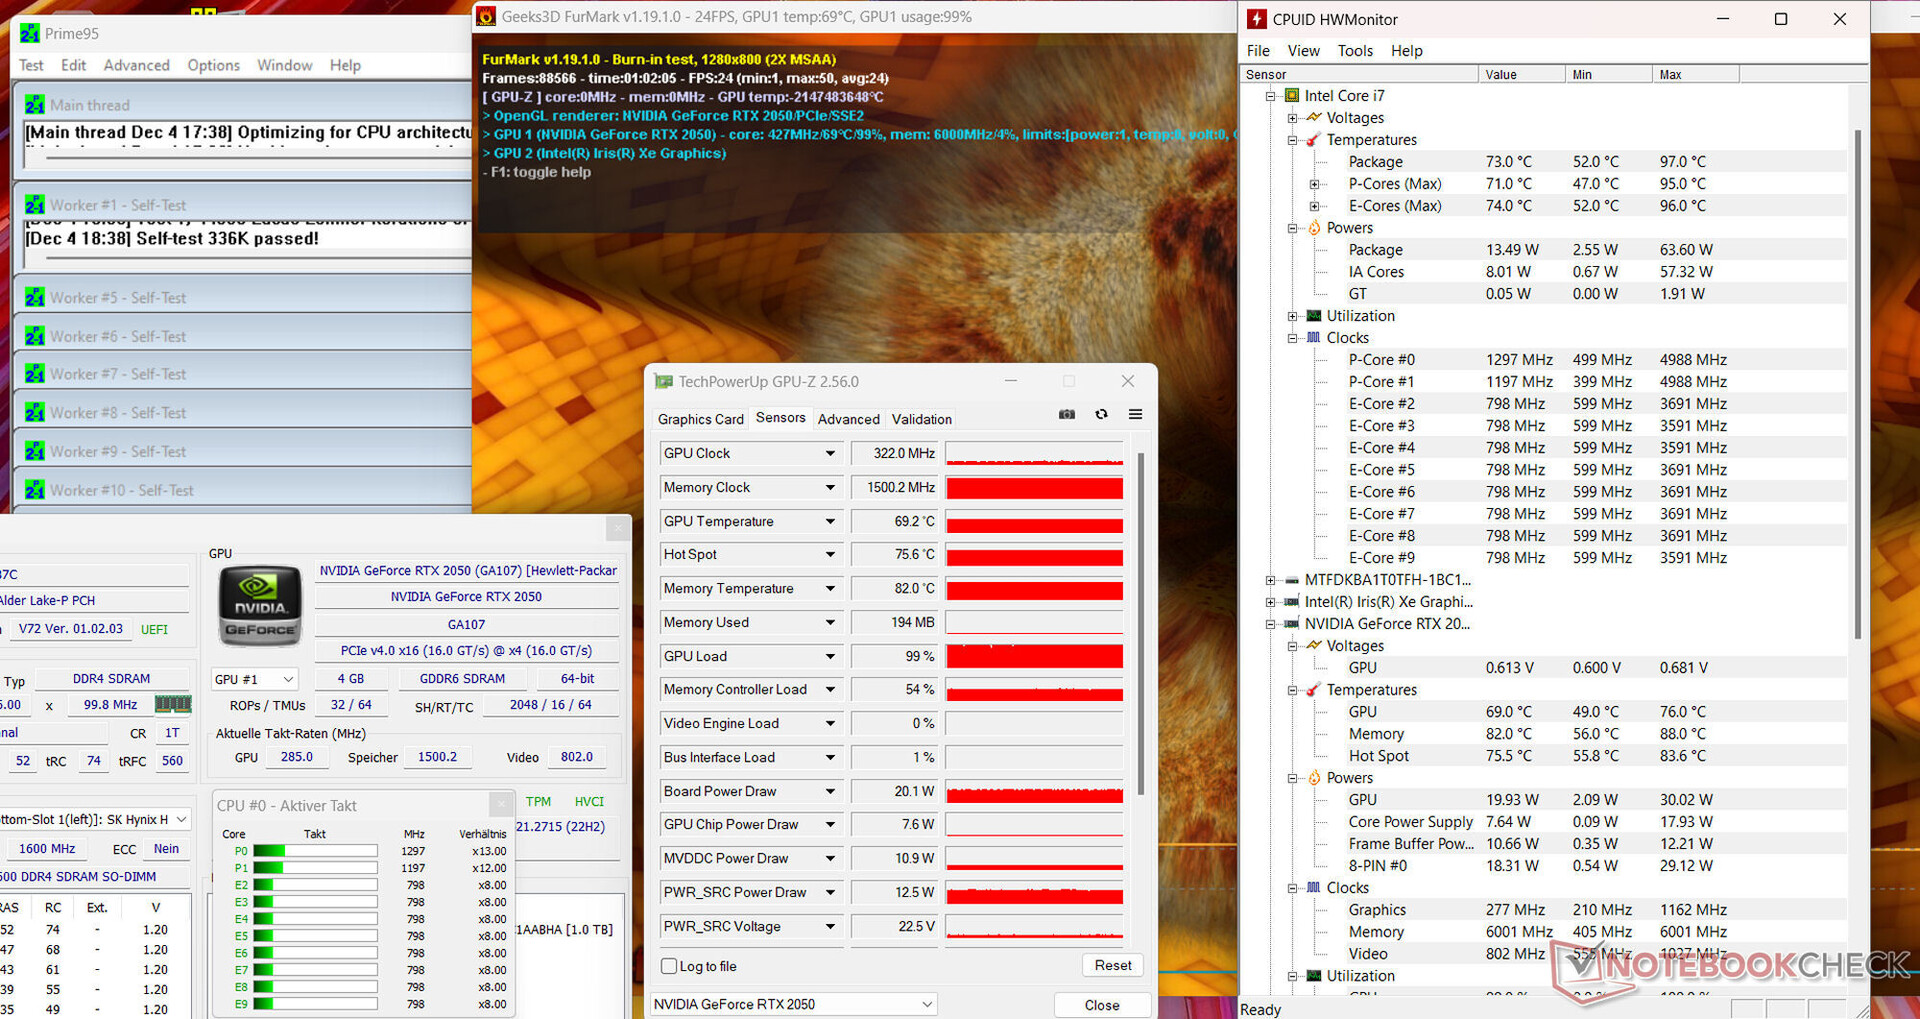
O teste de estresse (Prime95 e Furmark em uso contínuo) simula um cenário extremo para testar a estabilidade do sistema sob carga total. A CPU (P: 2,5 GHz, E: 1,9 GHz) e a GPU (832 MHz) começaram o teste com taxas de clock relativamente baixas.
Alto-falantes
Os alto-falantes estéreo produzem um som decente, mas quase sem graves. Recomendamos o uso de fones de ouvido ou alto-falantes externos para uma experiência sonora mais agradável.
HP ProBook 450 G10 análise de áudio
(±) | o volume do alto-falante é médio, mas bom (###valor### dB)
Graves 100 - 315Hz
(-) | quase nenhum baixo - em média 28.4% menor que a mediana
(±) | a linearidade dos graves é média (10.9% delta para a frequência anterior)
Médios 400 - 2.000 Hz
(+) | médios equilibrados - apenas 2.9% longe da mediana
(+) | médios são lineares (5.8% delta para frequência anterior)
Altos 2 - 16 kHz
(+) | agudos equilibrados - apenas 3.6% longe da mediana
(+) | os máximos são lineares (3.5% delta da frequência anterior)
Geral 100 - 16.000 Hz
(±) | a linearidade do som geral é média (22.2% diferença em relação à mediana)
Comparado com a mesma classe
» 58% de todos os dispositivos testados nesta classe foram melhores, 9% semelhantes, 33% piores
» O melhor teve um delta de 7%, a média foi 21%, o pior foi 53%
Comparado com todos os dispositivos testados
» 65% de todos os dispositivos testados foram melhores, 6% semelhantes, 29% piores
» O melhor teve um delta de 4%, a média foi 23%, o pior foi 134%
Acer Aspire 5 A515-58GM-76S8 análise de áudio
(±) | o volume do alto-falante é médio, mas bom (###valor### dB)
Graves 100 - 315Hz
(-) | quase nenhum baixo - em média 23.8% menor que a mediana
(±) | a linearidade dos graves é média (11.6% delta para a frequência anterior)
Médios 400 - 2.000 Hz
(+) | médios equilibrados - apenas 1.9% longe da mediana
(±) | a linearidade dos médios é média (8.7% delta para frequência anterior)
Altos 2 - 16 kHz
(+) | agudos equilibrados - apenas 3.9% longe da mediana
(+) | os máximos são lineares (5.6% delta da frequência anterior)
Geral 100 - 16.000 Hz
(±) | a linearidade do som geral é média (19.9% diferença em relação à mediana)
Comparado com a mesma classe
» 42% de todos os dispositivos testados nesta classe foram melhores, 9% semelhantes, 49% piores
» O melhor teve um delta de 7%, a média foi 21%, o pior foi 53%
Comparado com todos os dispositivos testados
» 51% de todos os dispositivos testados foram melhores, 7% semelhantes, 42% piores
» O melhor teve um delta de 4%, a média foi 23%, o pior foi 134%
Gerenciamento de energia - O computador HP tem longos tempos de execução
Consumo de energia
Sob carga, o ProBook está satisfeito com uma quantidade muito menor de energia do que o Aspire 5 equipado com a mesma combinação CPU/GPU. Não é de surpreender: No final das contas, o hardware do laptop HP é executado com configurações de desempenho muito mais conservadoras. Como resultado, o 450 G10 não tem problemas com uma fonte de alimentação de 65 watts (Aspire: 90 watts). Embora o teste Witcher 3 embora o teste tenha sido concluído com valores de consumo de energia flutuantes, seu consumo durante o teste primeiro caiu lentamente e, depois, a partir de um certo ponto, despencou.
| desligado | |
| Ocioso | |
| Carga |
|
Key:
min: | |
| HP ProBook 450 G10 i7-1355U, GeForce RTX 2050 Mobile, Micron 3400 1TB MTFDKBA1T0TFH, IPS, 1920x1080, 15.6" | Acer Aspire 5 A515-58GM-76S8 i7-1355U, GeForce RTX 2050 Mobile, Micron 2450 1TB MTFDKBA1T0TFK, IPS, 1920x1080, 15.6" | Schenker VIA 15 Pro M22 R7 5700U, Vega 8, Samsung SSD 970 EVO Plus 1TB, IPS, 2560x1440, 15.6" | Lenovo ThinkPad L15 Gen 4 21H70021GE R7 PRO 7730U, Vega 8, SK hynix HFS512GEJ4X113N, IPS, 1920x1080, 15.6" | Fujitsu LifeBook E5412A E542AMHAAMDE R5 PRO 5675U, Vega 7, WDC PC SN530 SDBQNPZ-512G, IPS, 1920x1080, 14" | Dell Latitude 3440 i5-1345U, Iris Xe G7 80EUs, Samsung PM9A1 MZVL2512HCJQ, IPS, 1920x1080, 14" | Média NVIDIA GeForce RTX 2050 Mobile | Média da turma Office | |
|---|---|---|---|---|---|---|---|---|
| Power Consumption | -10% | -21% | 7% | 17% | 9% | -23% | 7% | |
| Idle Minimum * (Watt) | 4.6 | 4.31 6% | 6.9 -50% | 4.5 2% | 4.1 11% | 3.7 20% | 5.11 ? -11% | 4.26 ? 7% |
| Idle Average * (Watt) | 7.3 | 6.52 11% | 10.9 -49% | 8.5 -16% | 6.6 10% | 6.5 11% | 9.15 ? -25% | 7.31 ? -0% |
| Idle Maximum * (Watt) | 8.4 | 8.037 4% | 11.3 -35% | 10.5 -25% | 7.4 12% | 9.5 -13% | 11.2 ? -33% | 8.55 ? -2% |
| Load Average * (Watt) | 57.3 | 75.2 -31% | 54.2 5% | 35.6 38% | 43.1 25% | 46.9 18% | 70.6 ? -23% | 43.8 ? 24% |
| Witcher 3 ultra * (Watt) | 49.3 | 60.8 -23% | 47.3 4% | 37.4 24% | 42.6 14% | 42.1 15% | ||
| Load Maximum * (Watt) | 69.7 | 89.5 -28% | 69 1% | 57.9 17% | 50.9 27% | 67 4% | 87.4 ? -25% | 64.5 ? 7% |
* ... menor é melhor
Power consumption Witcher 3 / stress test
Power consumption with external monitor
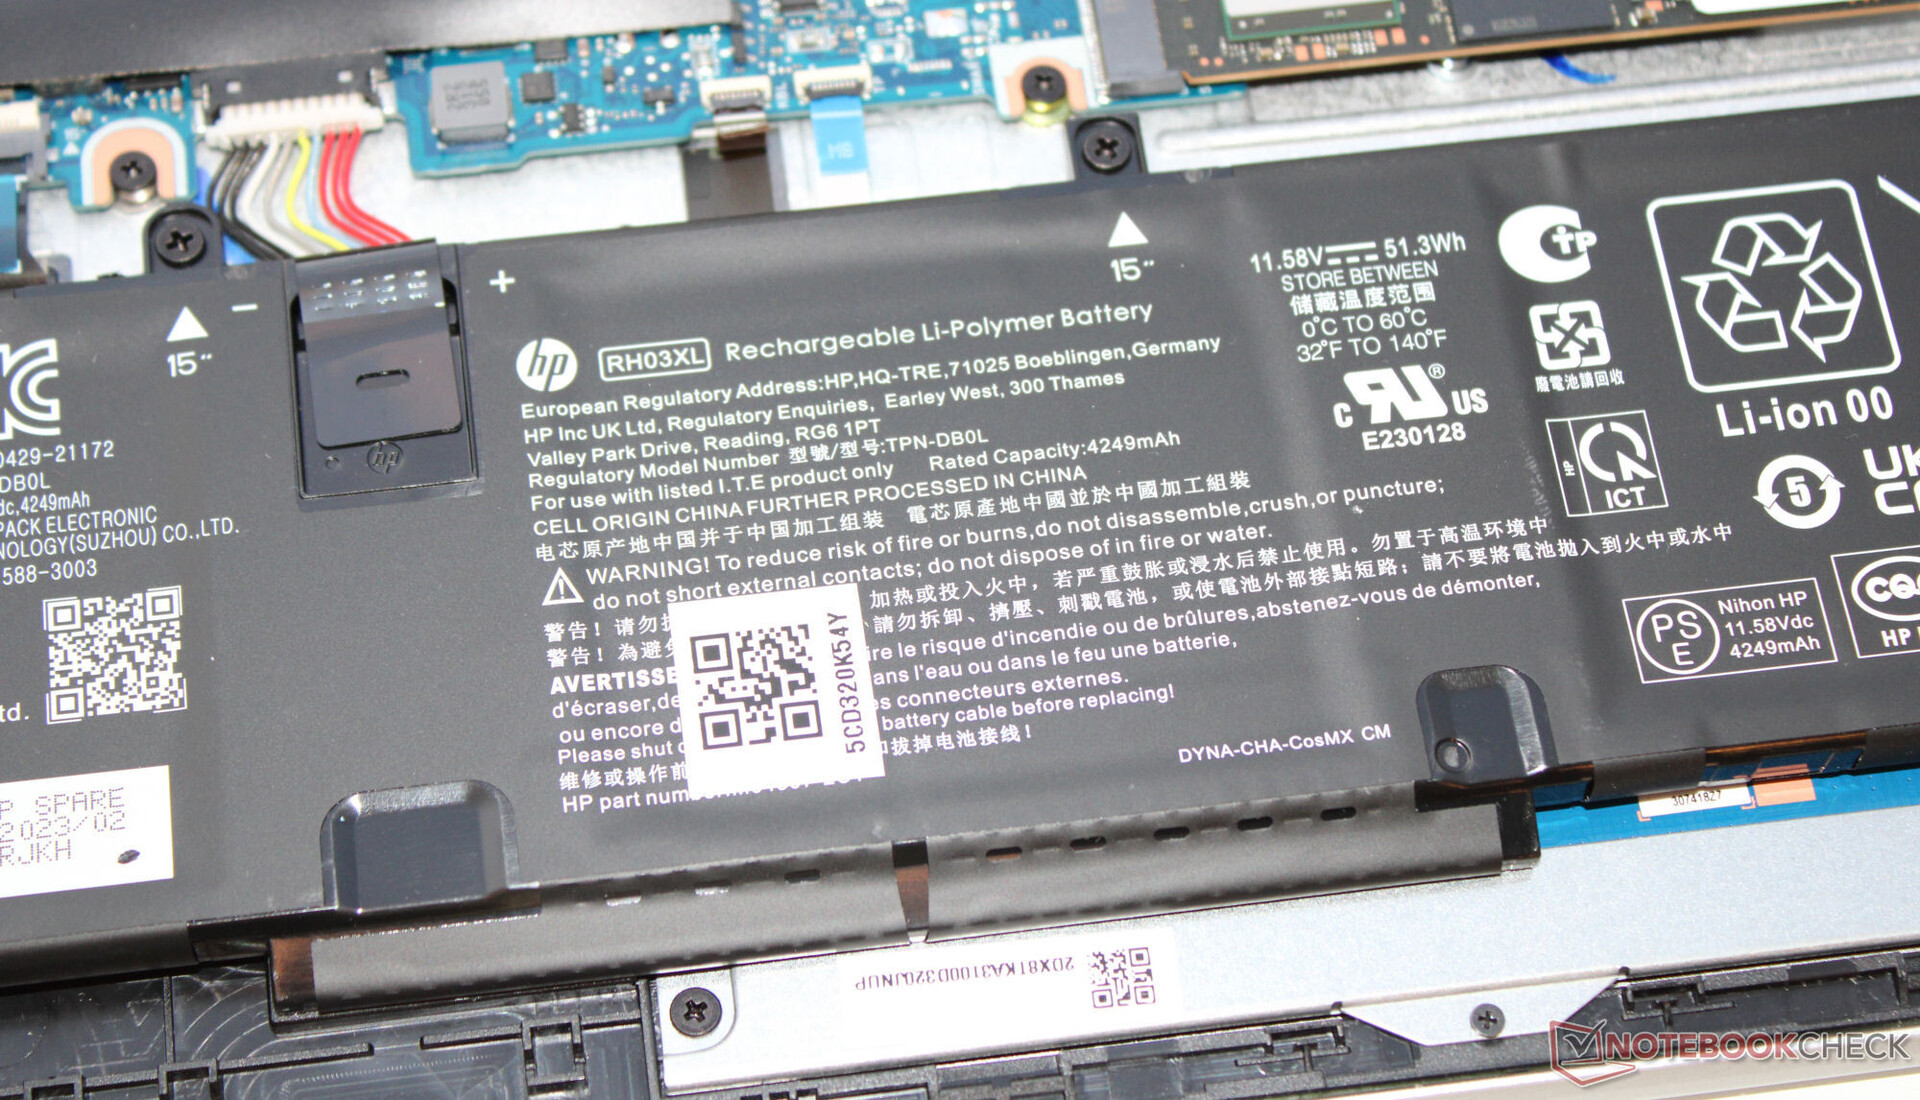
Tempos de execução
De acordo com a folha de dados, a HP forneceu ao ProBook duas opções de bateria (42 Wh, 51 Wh) - nosso dispositivo de teste apresenta o modelo maior. Como resultado, o dispositivo de 15,6 polegadas alcançou tempos de execução práticos de 9:19 h (WiFi; acesso a sites por meio de um script) e 11:25 h (vídeo; curta-metragem Big Buck Bunny (codificação H.264, FHD) - bons valores.
| HP ProBook 450 G10 i7-1355U, GeForce RTX 2050 Mobile, 51.3 Wh | Acer Aspire 5 A515-58GM-76S8 i7-1355U, GeForce RTX 2050 Mobile, 48 Wh | Schenker VIA 15 Pro M22 R7 5700U, Vega 8, 91 Wh | Lenovo ThinkPad L15 Gen 4 21H70021GE R7 PRO 7730U, Vega 8, 57 Wh | Fujitsu LifeBook E5412A E542AMHAAMDE R5 PRO 5675U, Vega 7, 60 Wh | Dell Latitude 3440 i5-1345U, Iris Xe G7 80EUs, 54 Wh | Média da turma Office | |
|---|---|---|---|---|---|---|---|
| Duração da bateria | -26% | 18% | 7% | -24% | -5% | 20% | |
| Reader / Idle (h) | 18.1 | 25.1 39% | 24.5 ? 35% | ||||
| H.264 (h) | 11.4 | 6.6 -42% | 9.5 -17% | 8.2 -28% | 15.5 ? 36% | ||
| WiFi v1.3 (h) | 9.3 | 8.7 -6% | 11 18% | 11.9 28% | 10.4 12% | 8.8 -5% | 13.2 ? 42% |
| Load (h) | 2.8 | 2 -29% | 2.2 -21% | 1.2 -57% | 1.808 ? -35% |
Pro
Contra
Veredicto - O laptop de escritório permite jogos casuais

Os usos para escritório e Internet são dominados pela combinação instalada que consiste em um Core i7-1355U e 32 GB de RAM (canal duplo). Os usos intensivos de GPU, como jogos, se beneficiam da GeForce RTX 2050. No entanto: A GPU absorve picos de carga curtos com potência total, mas precisa ser um pouco mais lenta sob carga prolongada.
Sem experimentos. Semelhante ao seu antecessor, o HP ProBook 450 G10 revelou-se um sólido laptop de escritório para organizações, empresas e usuários particulares.
As emissões de calor e ruído do dispositivo são boas. A portabilidade é garantida graças ao seu peso moderado (aprox. 1,8 kg), à caixa compacta e aos tempos de execução práticos (9 a 11 horas). Duas portas USB-C (USB 3.2 Gen 2) permitem a fácil integração em uma configuração existente no local de trabalho.
A energia é fornecida por meio de uma fonte de alimentação proprietária da HP. Como alternativa, o senhor pode usar um carregador USB-C - ambas as portas USB-C são compatíveis com o Power Delivery (e podem emitir um sinal DisplayPort). Infelizmente, elas são "apenas" portas USB 3.2 Gen 2. O Thunderbolt 4 não pode ser encontrado nos ProBooks da HP. Outro ponto positivo é seu teclado nítido.
A tela FHD instalada (IPS, 15,6 polegadas) só oferece uma cobertura limitada do espaço de cores e não é capaz de atingir o brilho desejado (> 300 cd/m²). Um modelo ProBook com um painel alternativo disponível de 400 nit (FHD), incluindo cobertura sRGB, poderia ser uma solução melhor para muitos usuários.
A faixa de preço do laptop é justa. Os modelos sem uma GPU GeForce já podem ser encontrados por menos de US$1000 e o mesmo pode ser dito do modelo idêntico ProBook 455 G10 series (Ryzen 7000).
Uma alternativa ao 450 G10 poderia ser o Acer Aspire 5 A515-58GM. Ele oferece um pouco mais de desempenho com a mesma combinação de CPU/GPU e também possui uma porta Thunderbolt 4. O Aspire produz um pouco mais de ruído em seu pico do que o laptop da HP e, sob carga, tem uma necessidade maior de energia. O senhor terá que gastar cerca de US$ 1.000 no dispositivo da Acer.
Preço e disponibilidade
A versão do HP ProBook 450 G10 que testamos pode ser encontrada atualmente por US$ 969 na Amazon.
HP ProBook 450 G10
- 12/13/2023 v7 (old)
Sascha Mölck
Transparência
A seleção dos dispositivos a serem analisados é feita pela nossa equipe editorial. A amostra de teste foi fornecida ao autor como empréstimo pelo fabricante ou varejista para fins desta revisão. O credor não teve influência nesta revisão, nem o fabricante recebeu uma cópia desta revisão antes da publicação. Não houve obrigação de publicar esta revisão. Como empresa de mídia independente, a Notebookcheck não está sujeita à autoridade de fabricantes, varejistas ou editores.
É assim que o Notebookcheck está testando
Todos os anos, o Notebookcheck analisa de forma independente centenas de laptops e smartphones usando procedimentos padronizados para garantir que todos os resultados sejam comparáveis. Desenvolvemos continuamente nossos métodos de teste há cerca de 20 anos e definimos padrões da indústria no processo. Em nossos laboratórios de teste, equipamentos de medição de alta qualidade são utilizados por técnicos e editores experientes. Esses testes envolvem um processo de validação em vários estágios. Nosso complexo sistema de classificação é baseado em centenas de medições e benchmarks bem fundamentados, o que mantém a objetividade.Price comparison

