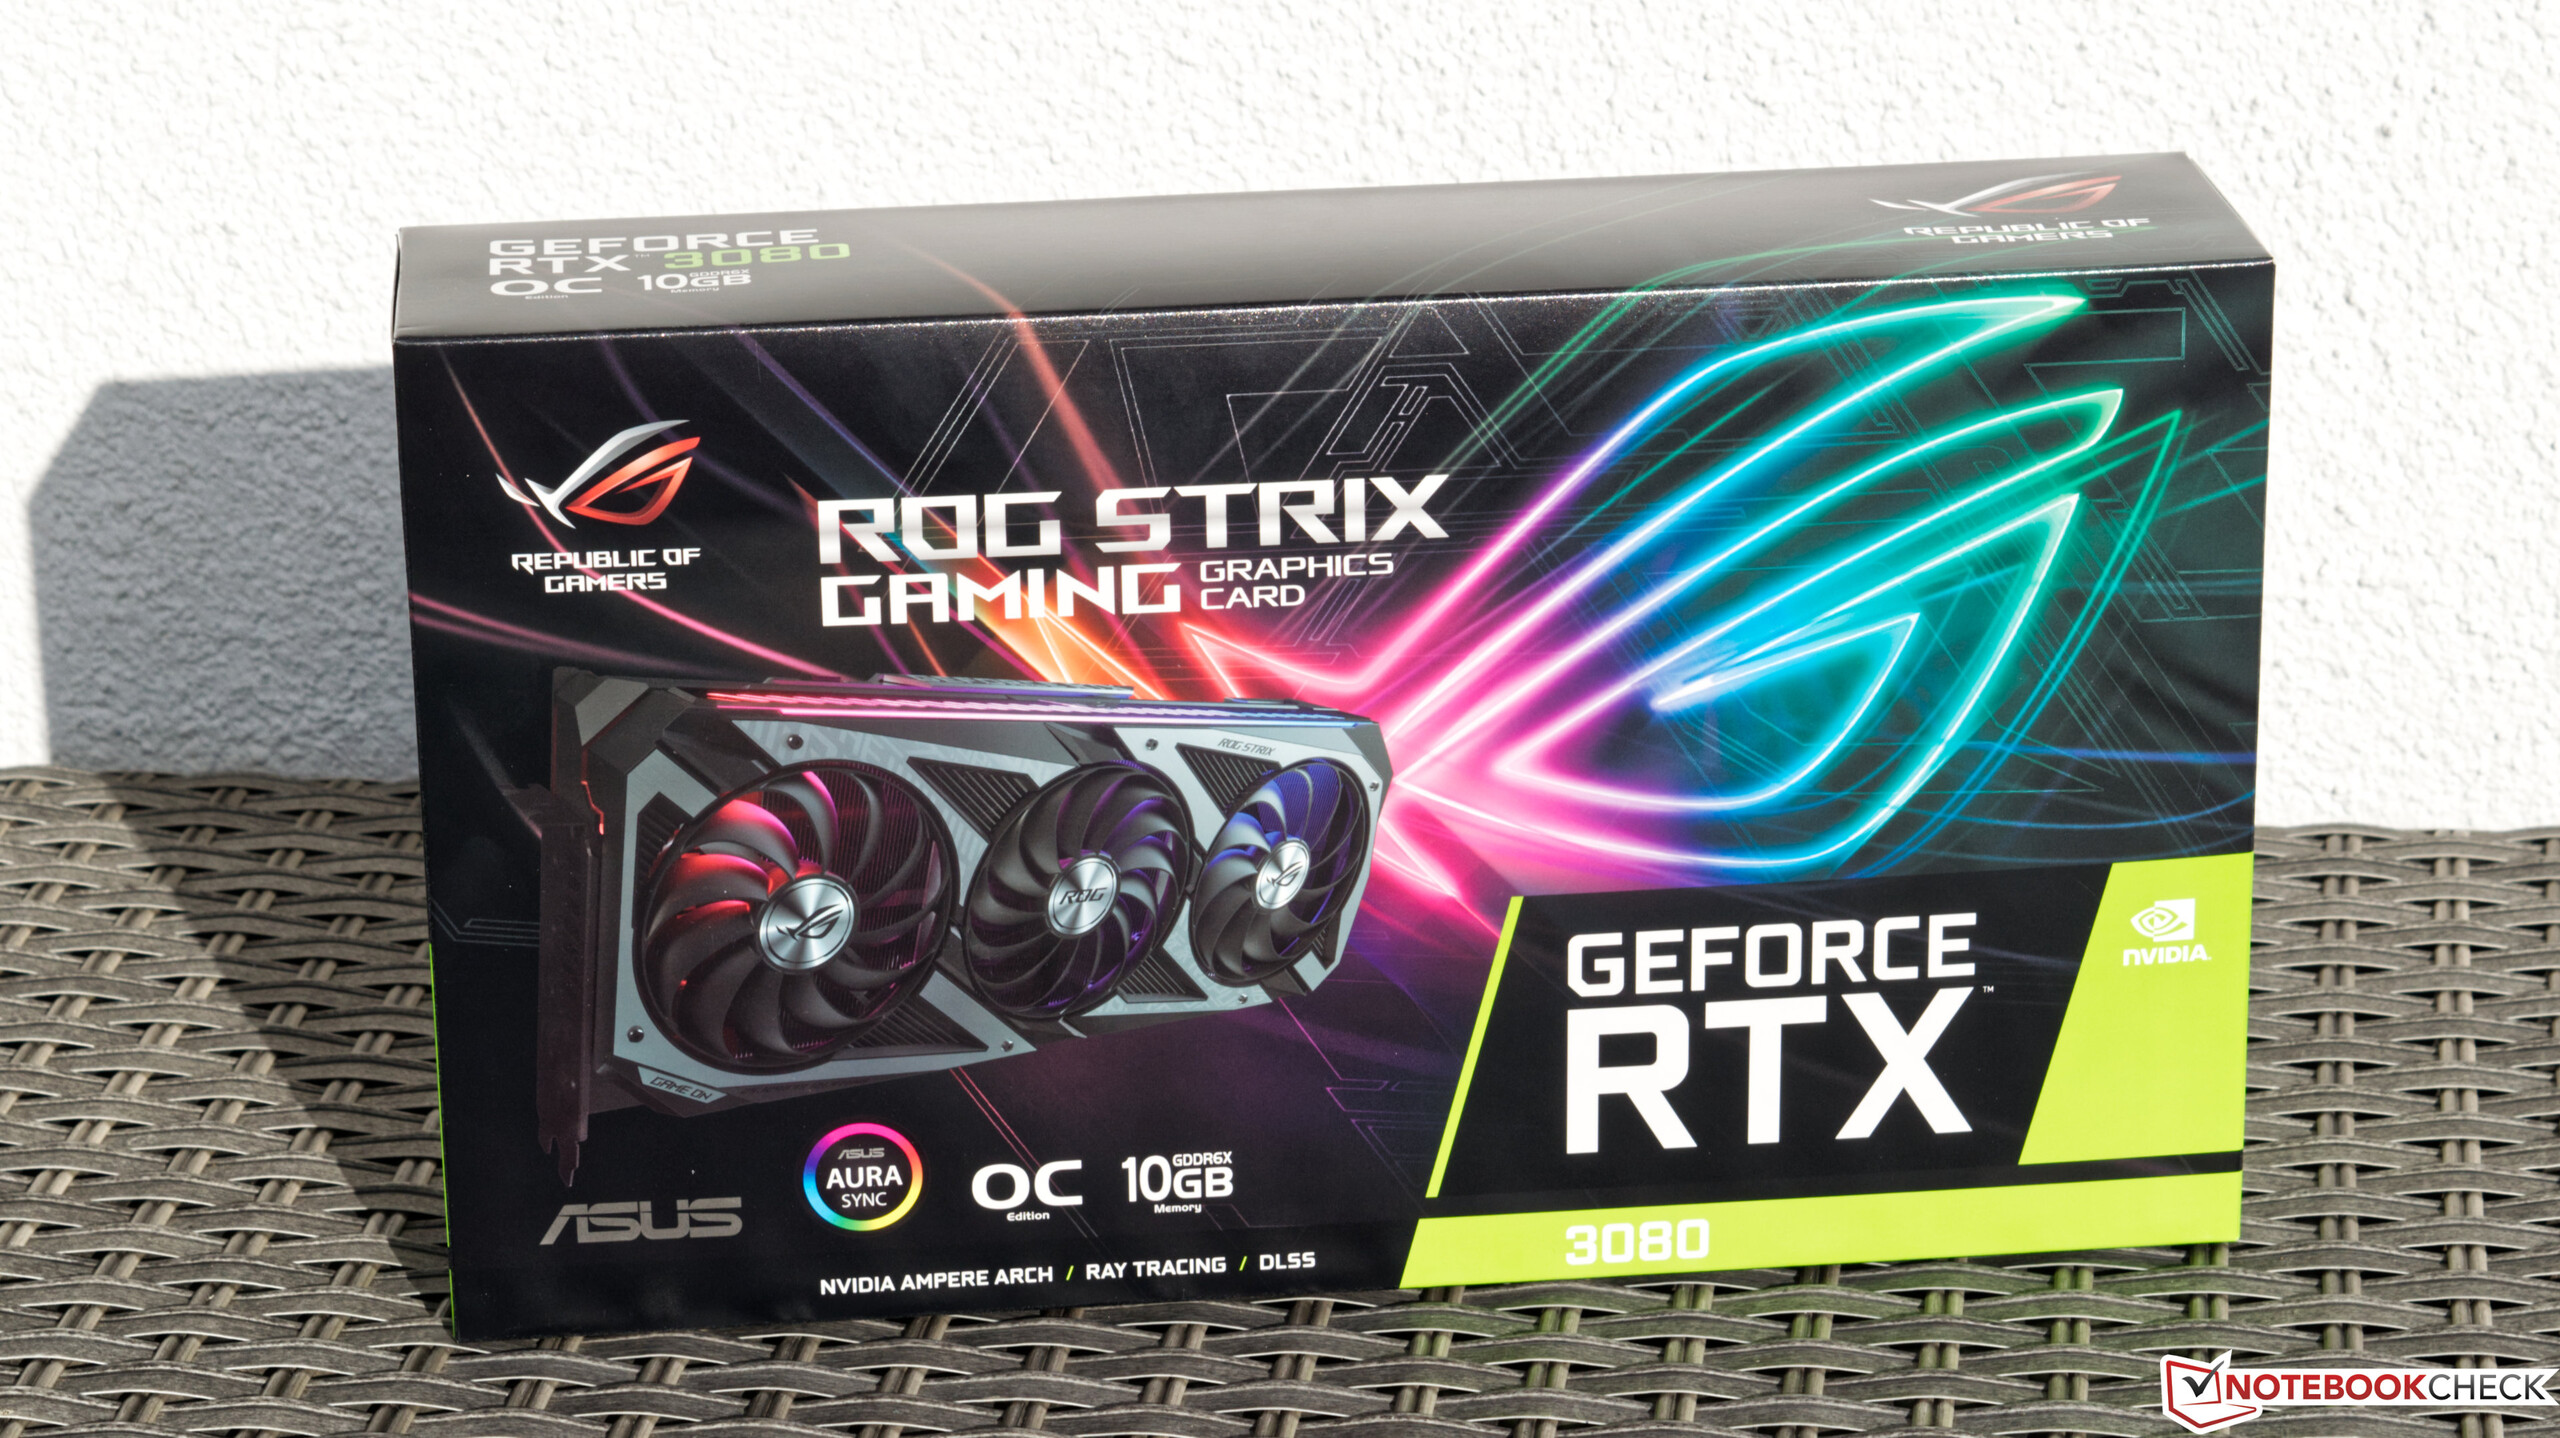
Asus GeForce RTX 3080 ROG Strix Gaming OC desktop GPU em revisão


O segmento de servidores começou a se beneficiar da nova arquitetura Ampere das placas gráficas Nvidia no início de 2020. Cerca de meio ano depois, seguiram-se os modelos de consumo, o que deve trazer uma lufada de ar fresco para o mercado de placas gráficas de mesa. Entretanto, após a introdução da nova série RTX 3000, o desencanto foi muito grande, pois o grande número de pedidos não foi e ainda não pode ser completamente coberto
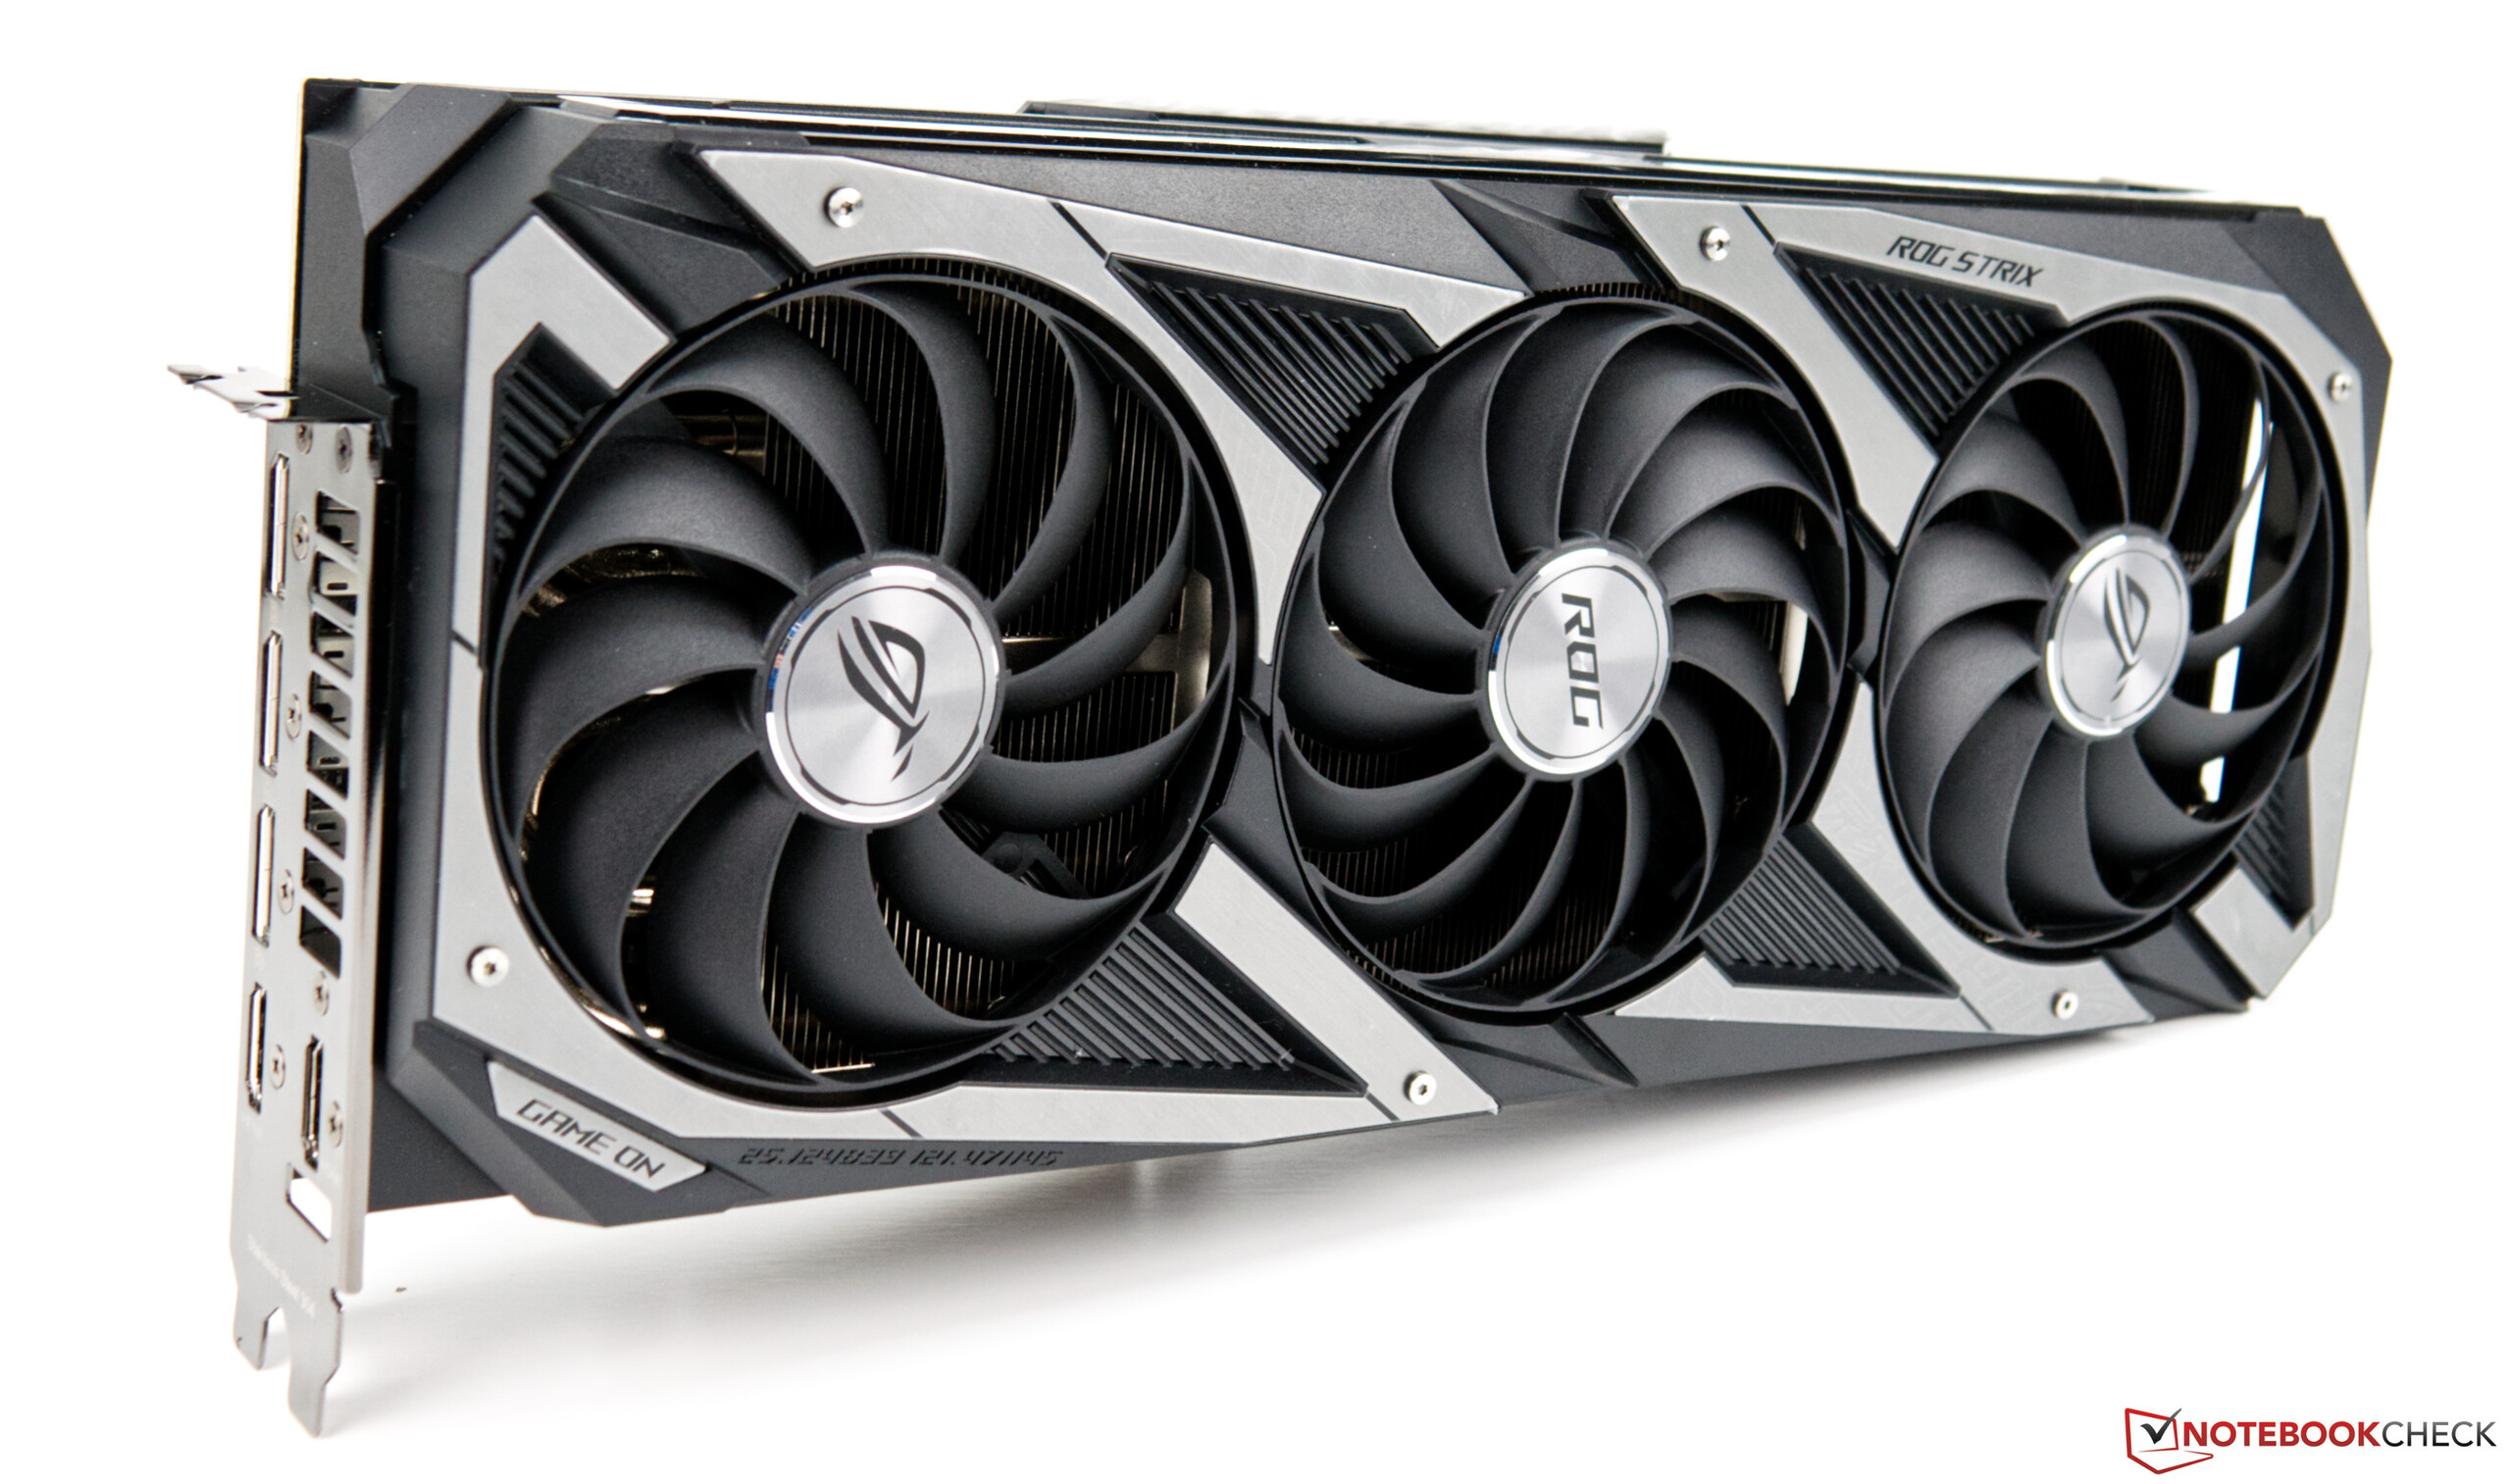
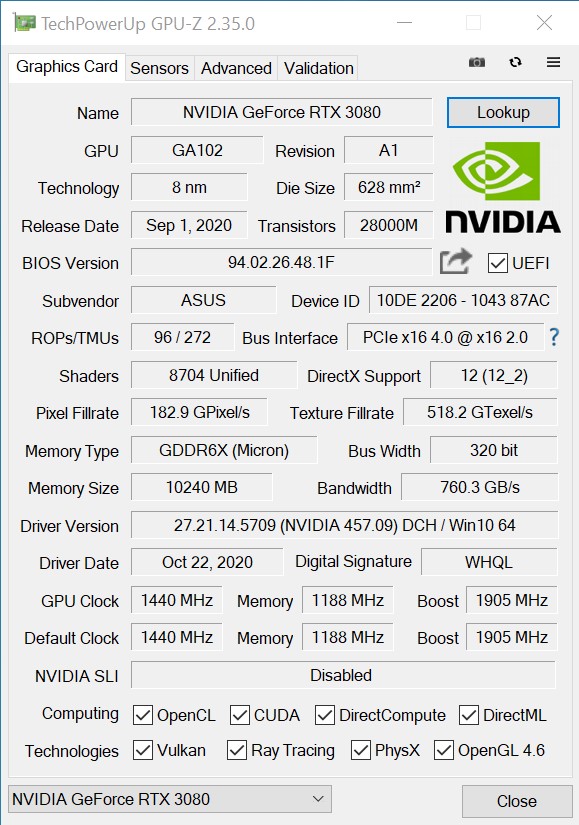
Aqueles que ainda conseguiram assegurar um modelo das novas placas gráficas Nvidia serão recompensados com um desempenho muito bom durante todo o processo; podemos revelar isso com muita antecedência. Para esta revisão, porém, recebemos uma amostra de teste da Asus, que difere significativamente da Edição dos Fundadores. Mas nada mudou em termos da base do chip GA102 Ampere. O mesmo se aplica à VRAM, que é idêntica a 10 GB GDDR6X em todos os modelos RTX 3080. No entanto, a Asus concede à GeForce RTX 3080 ROG Strix Gaming OC um pouco mais de margem de manobra quando se trata de impulsionar - é quase 200 MHz em comparação com a Edição dos Fundadores da Nvidia.
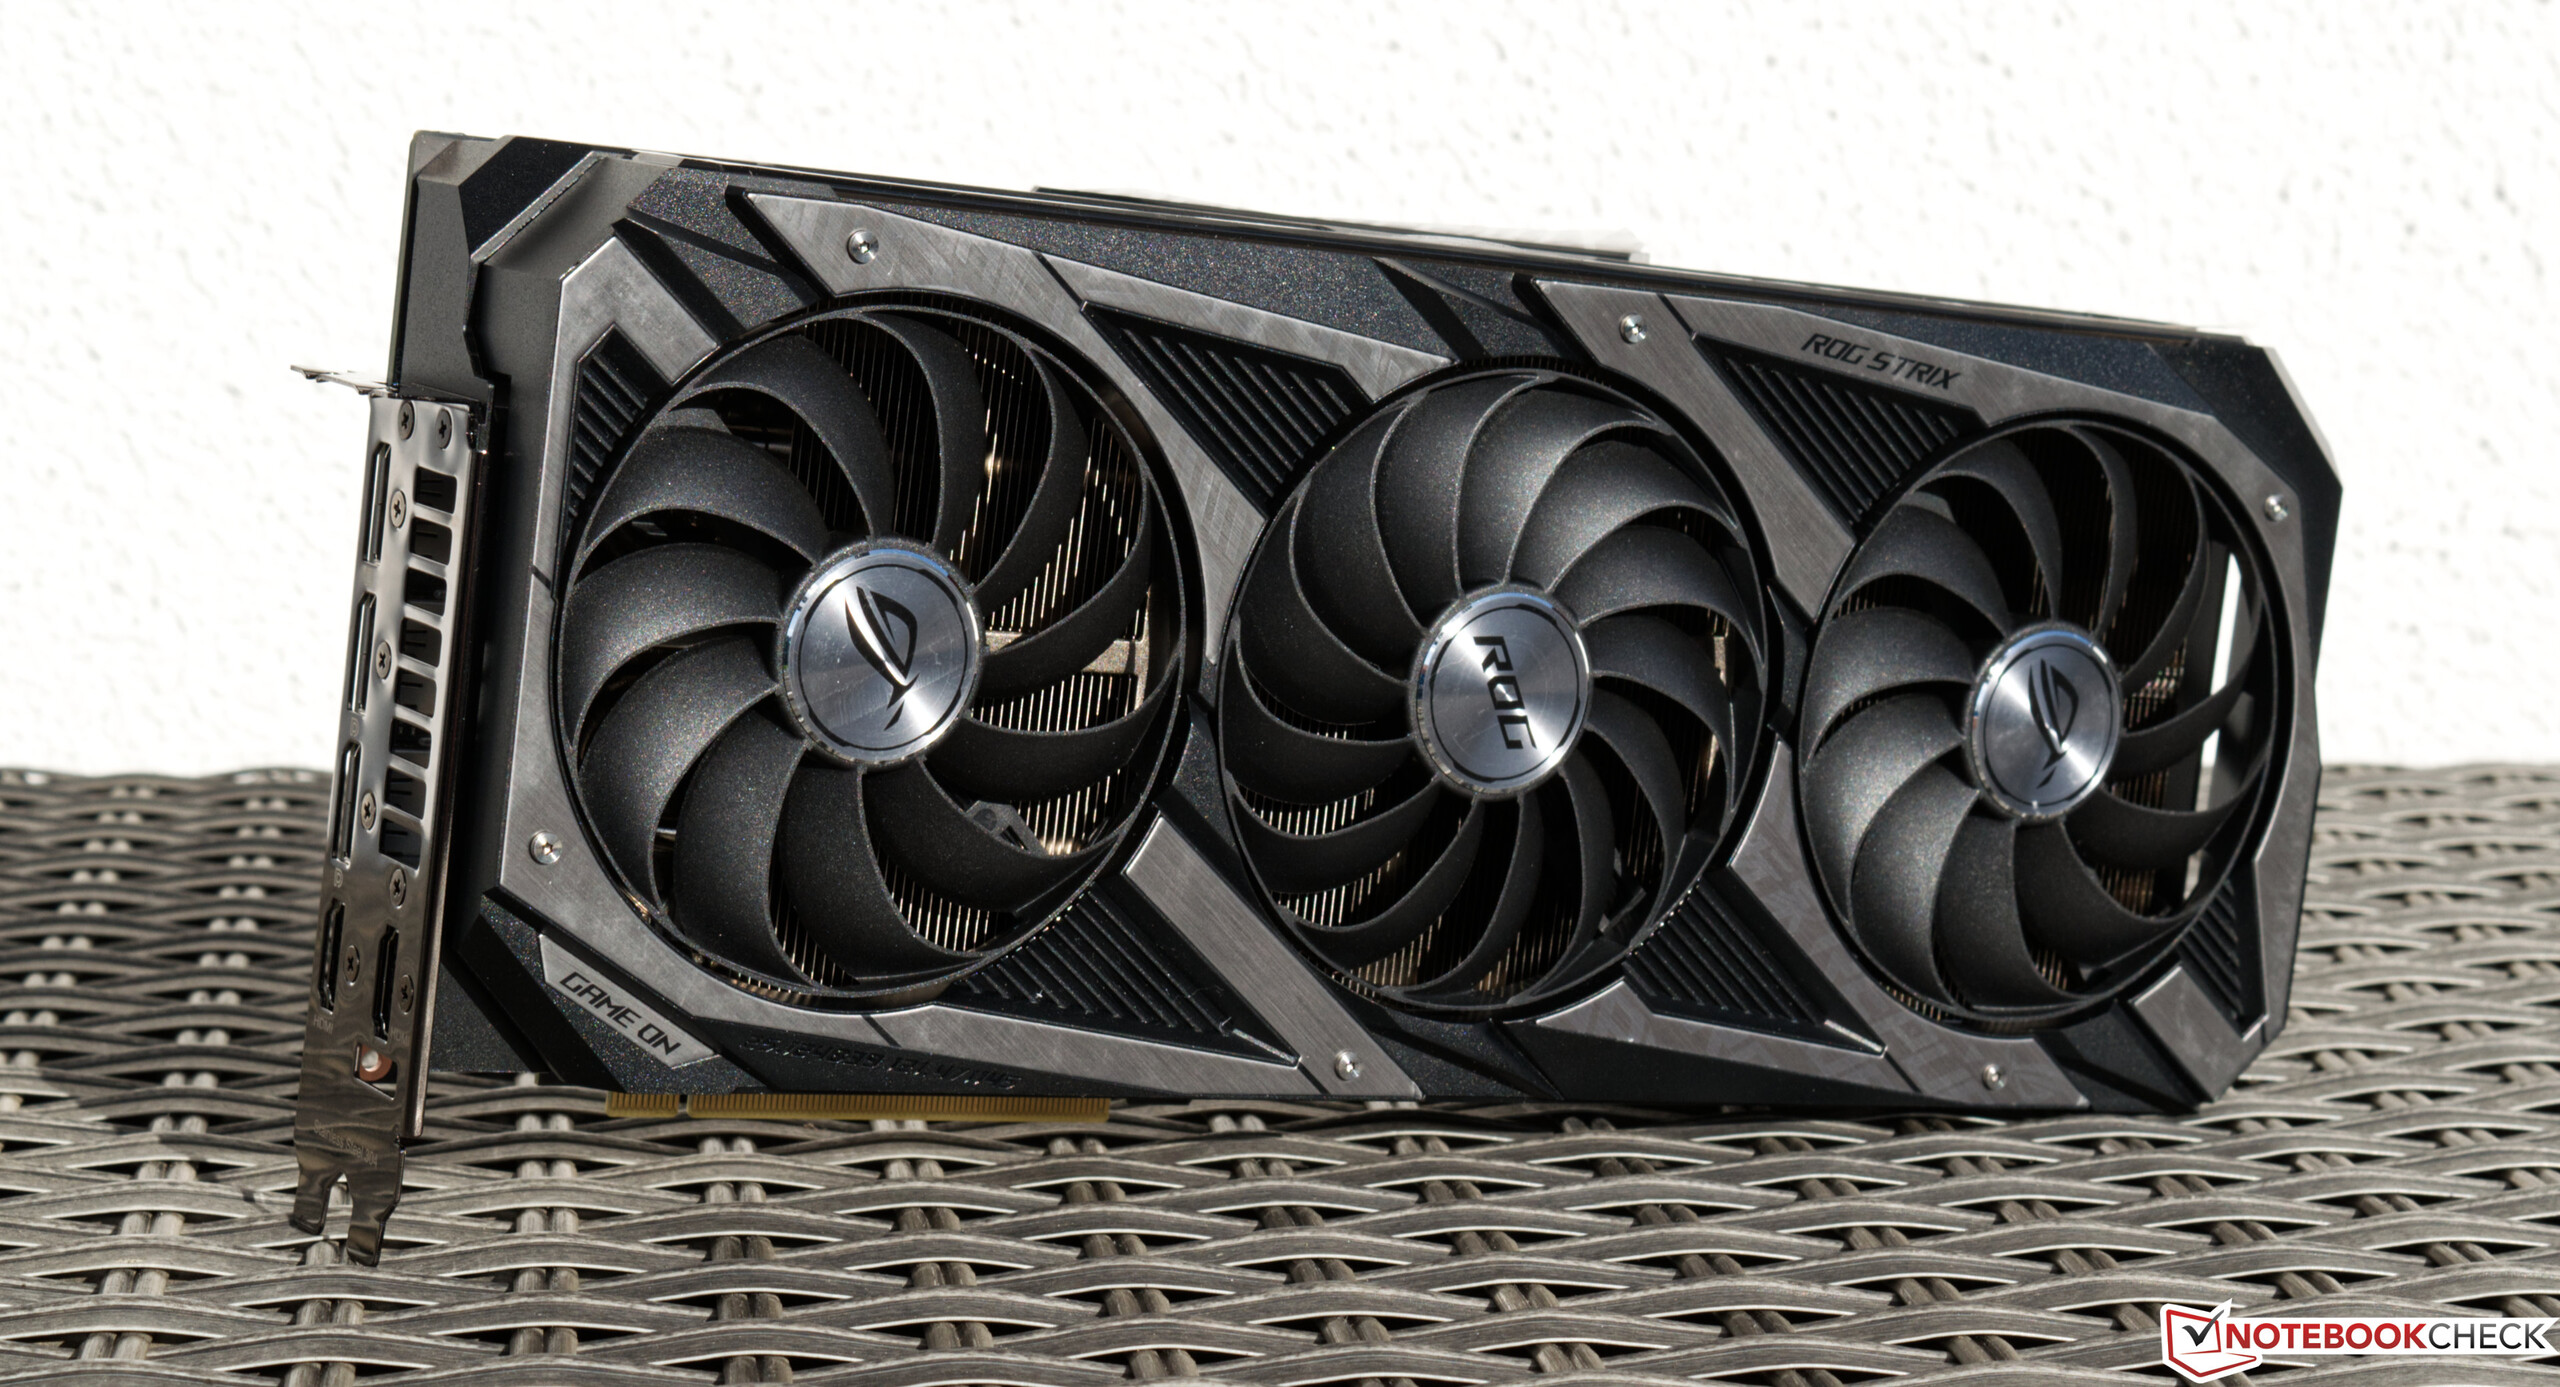
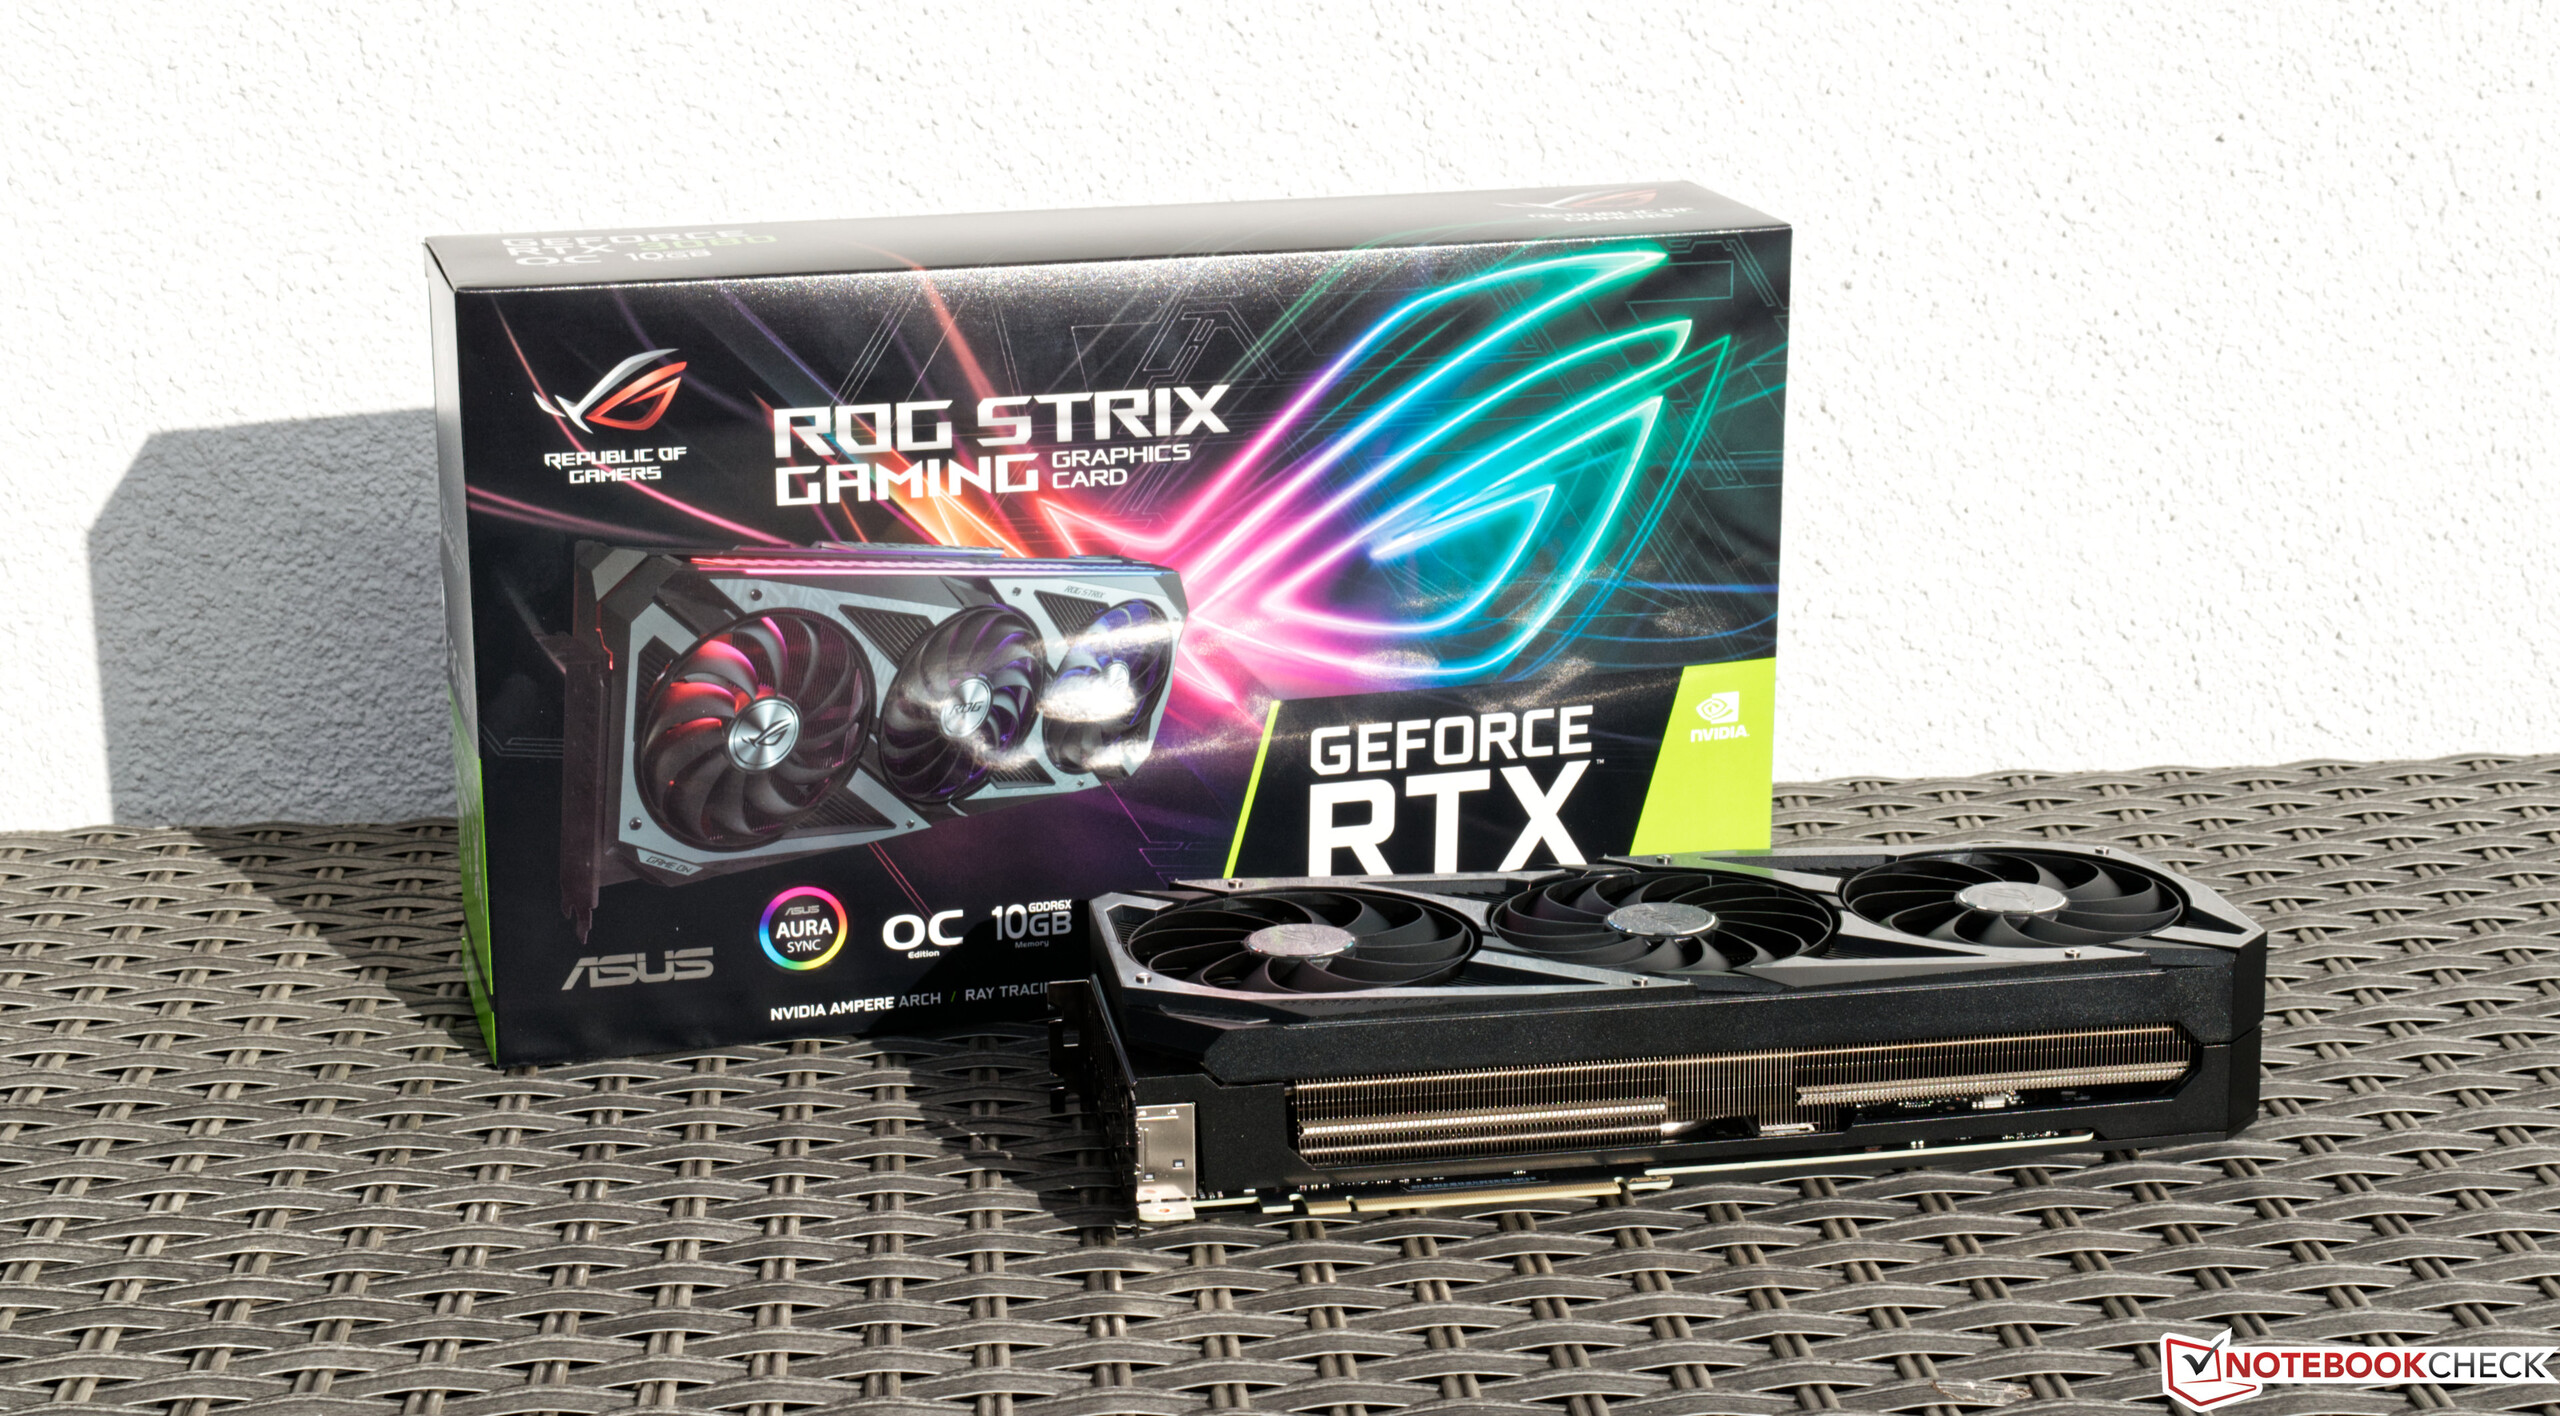
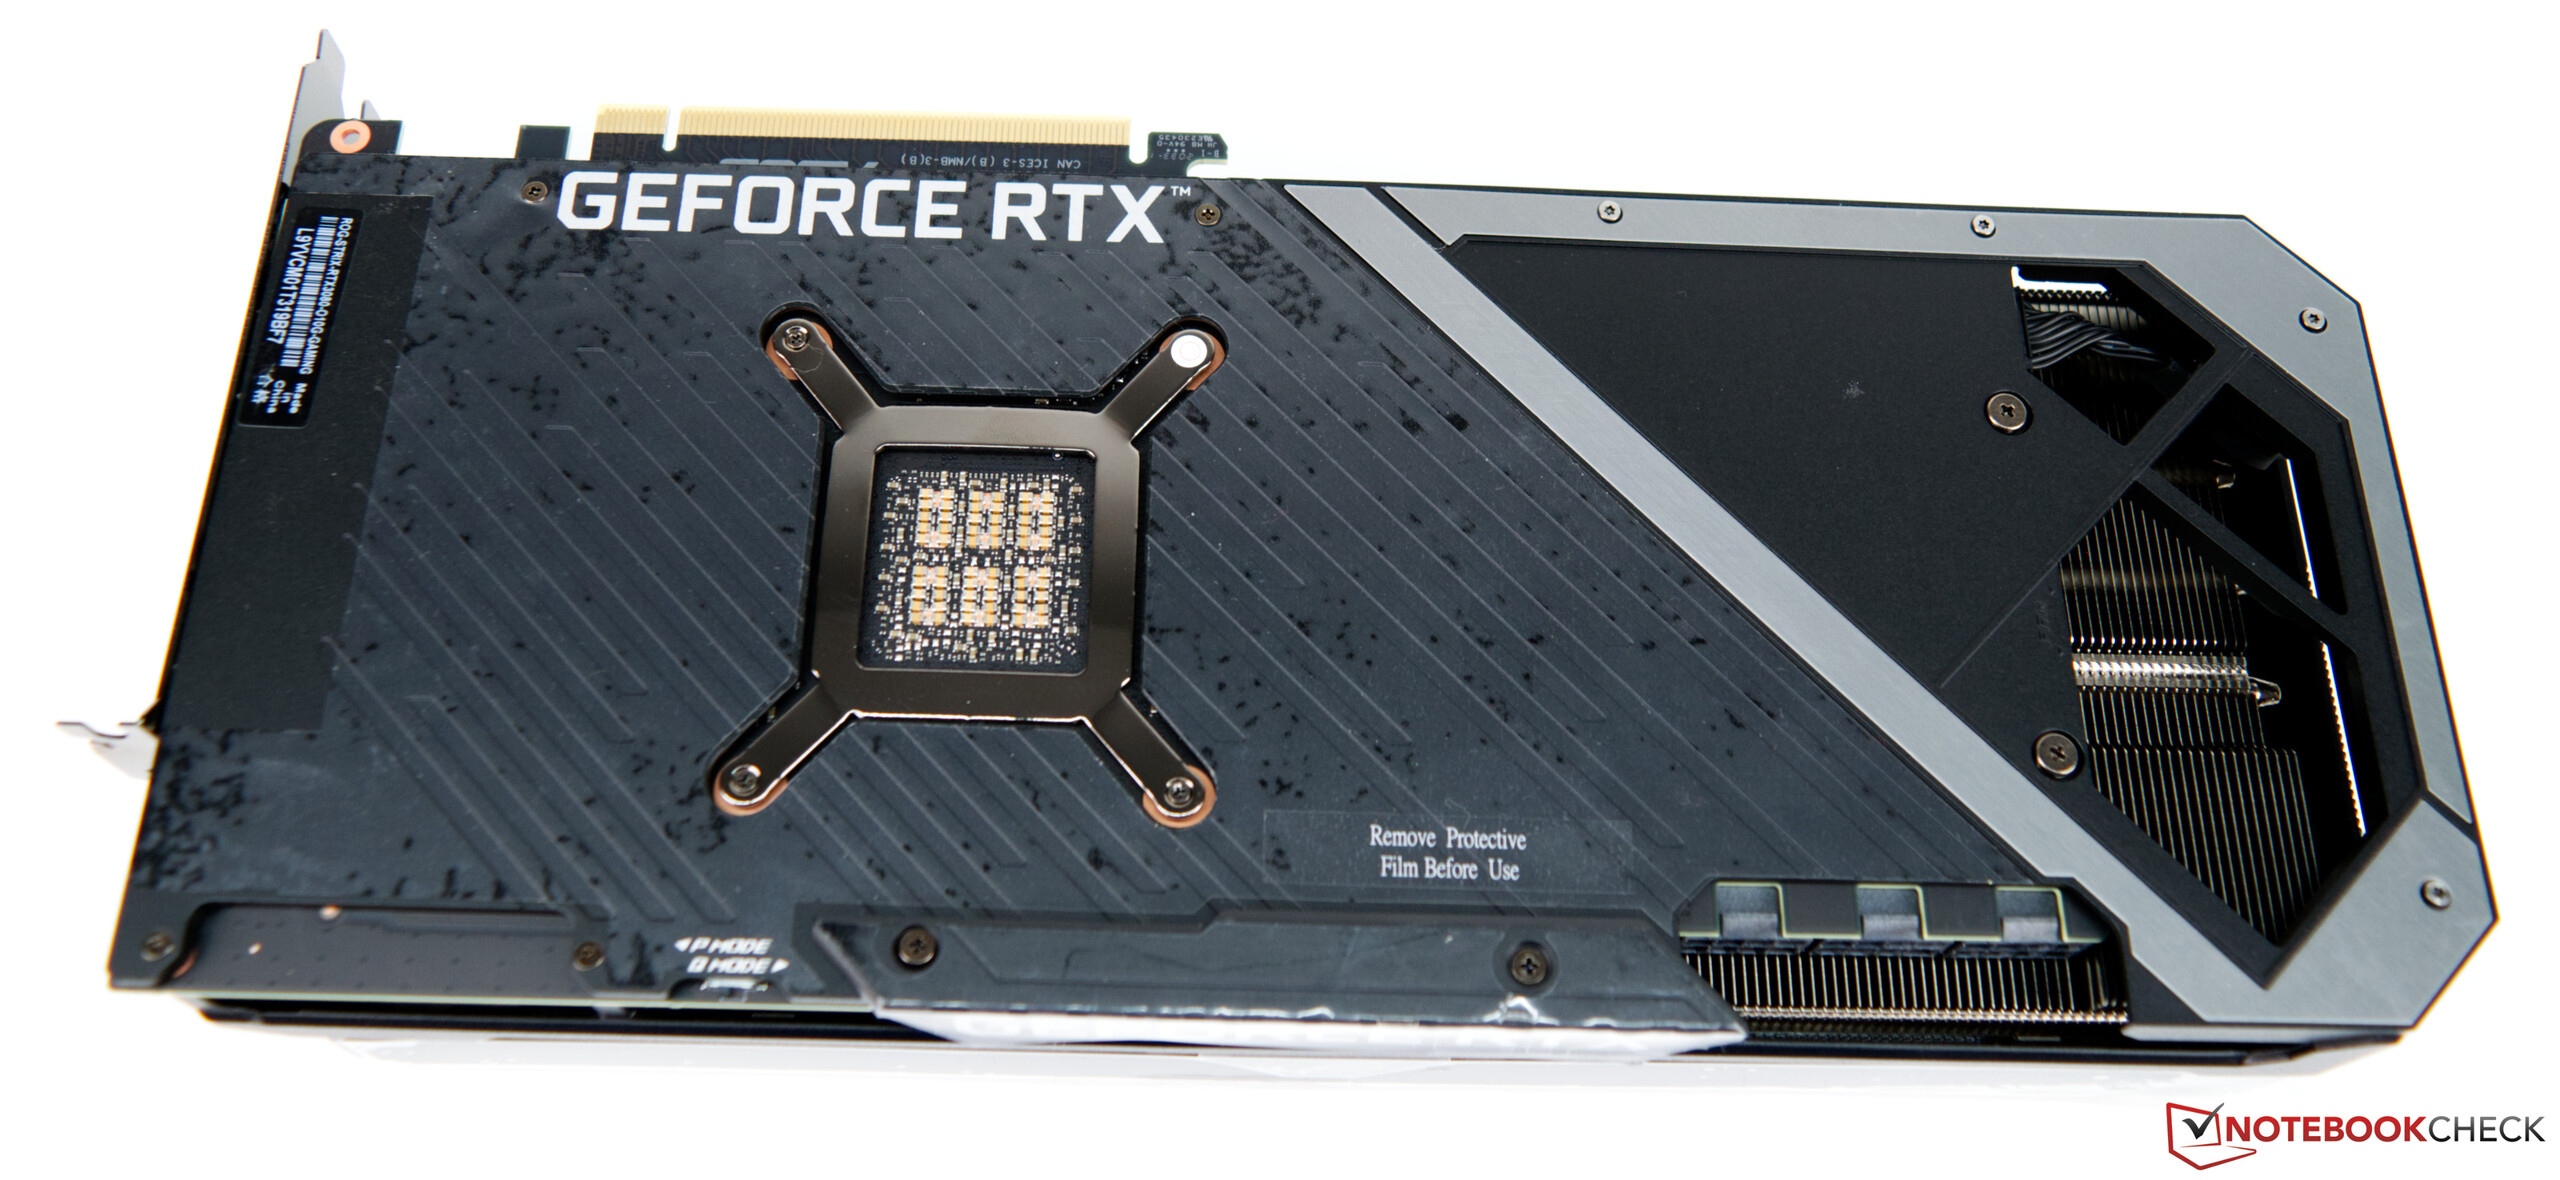
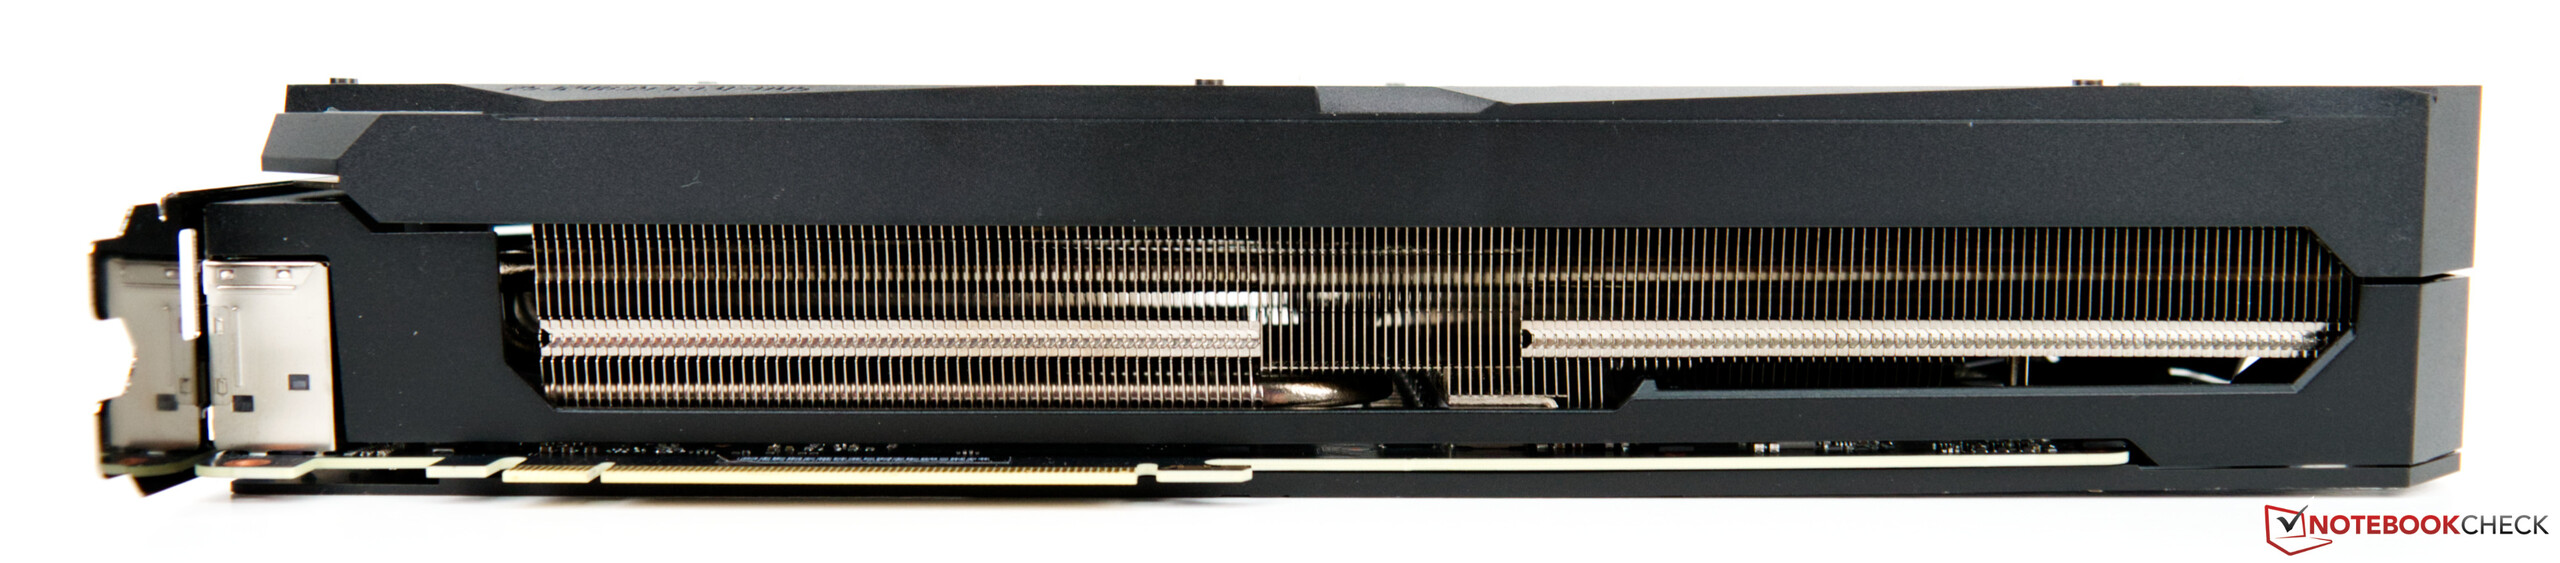
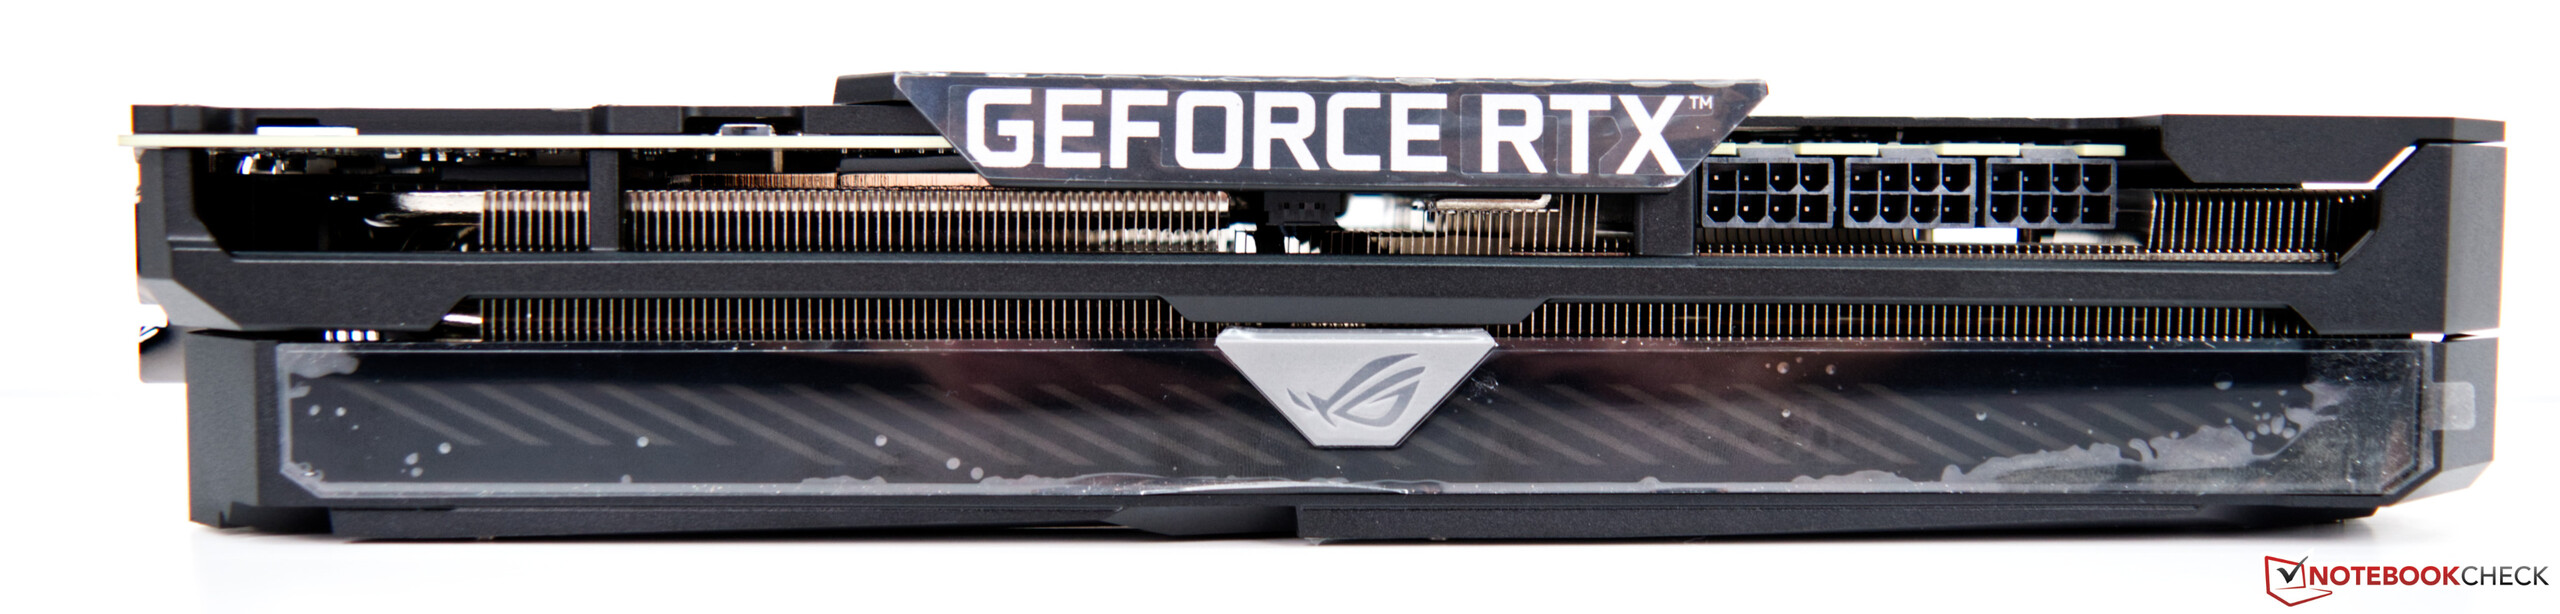
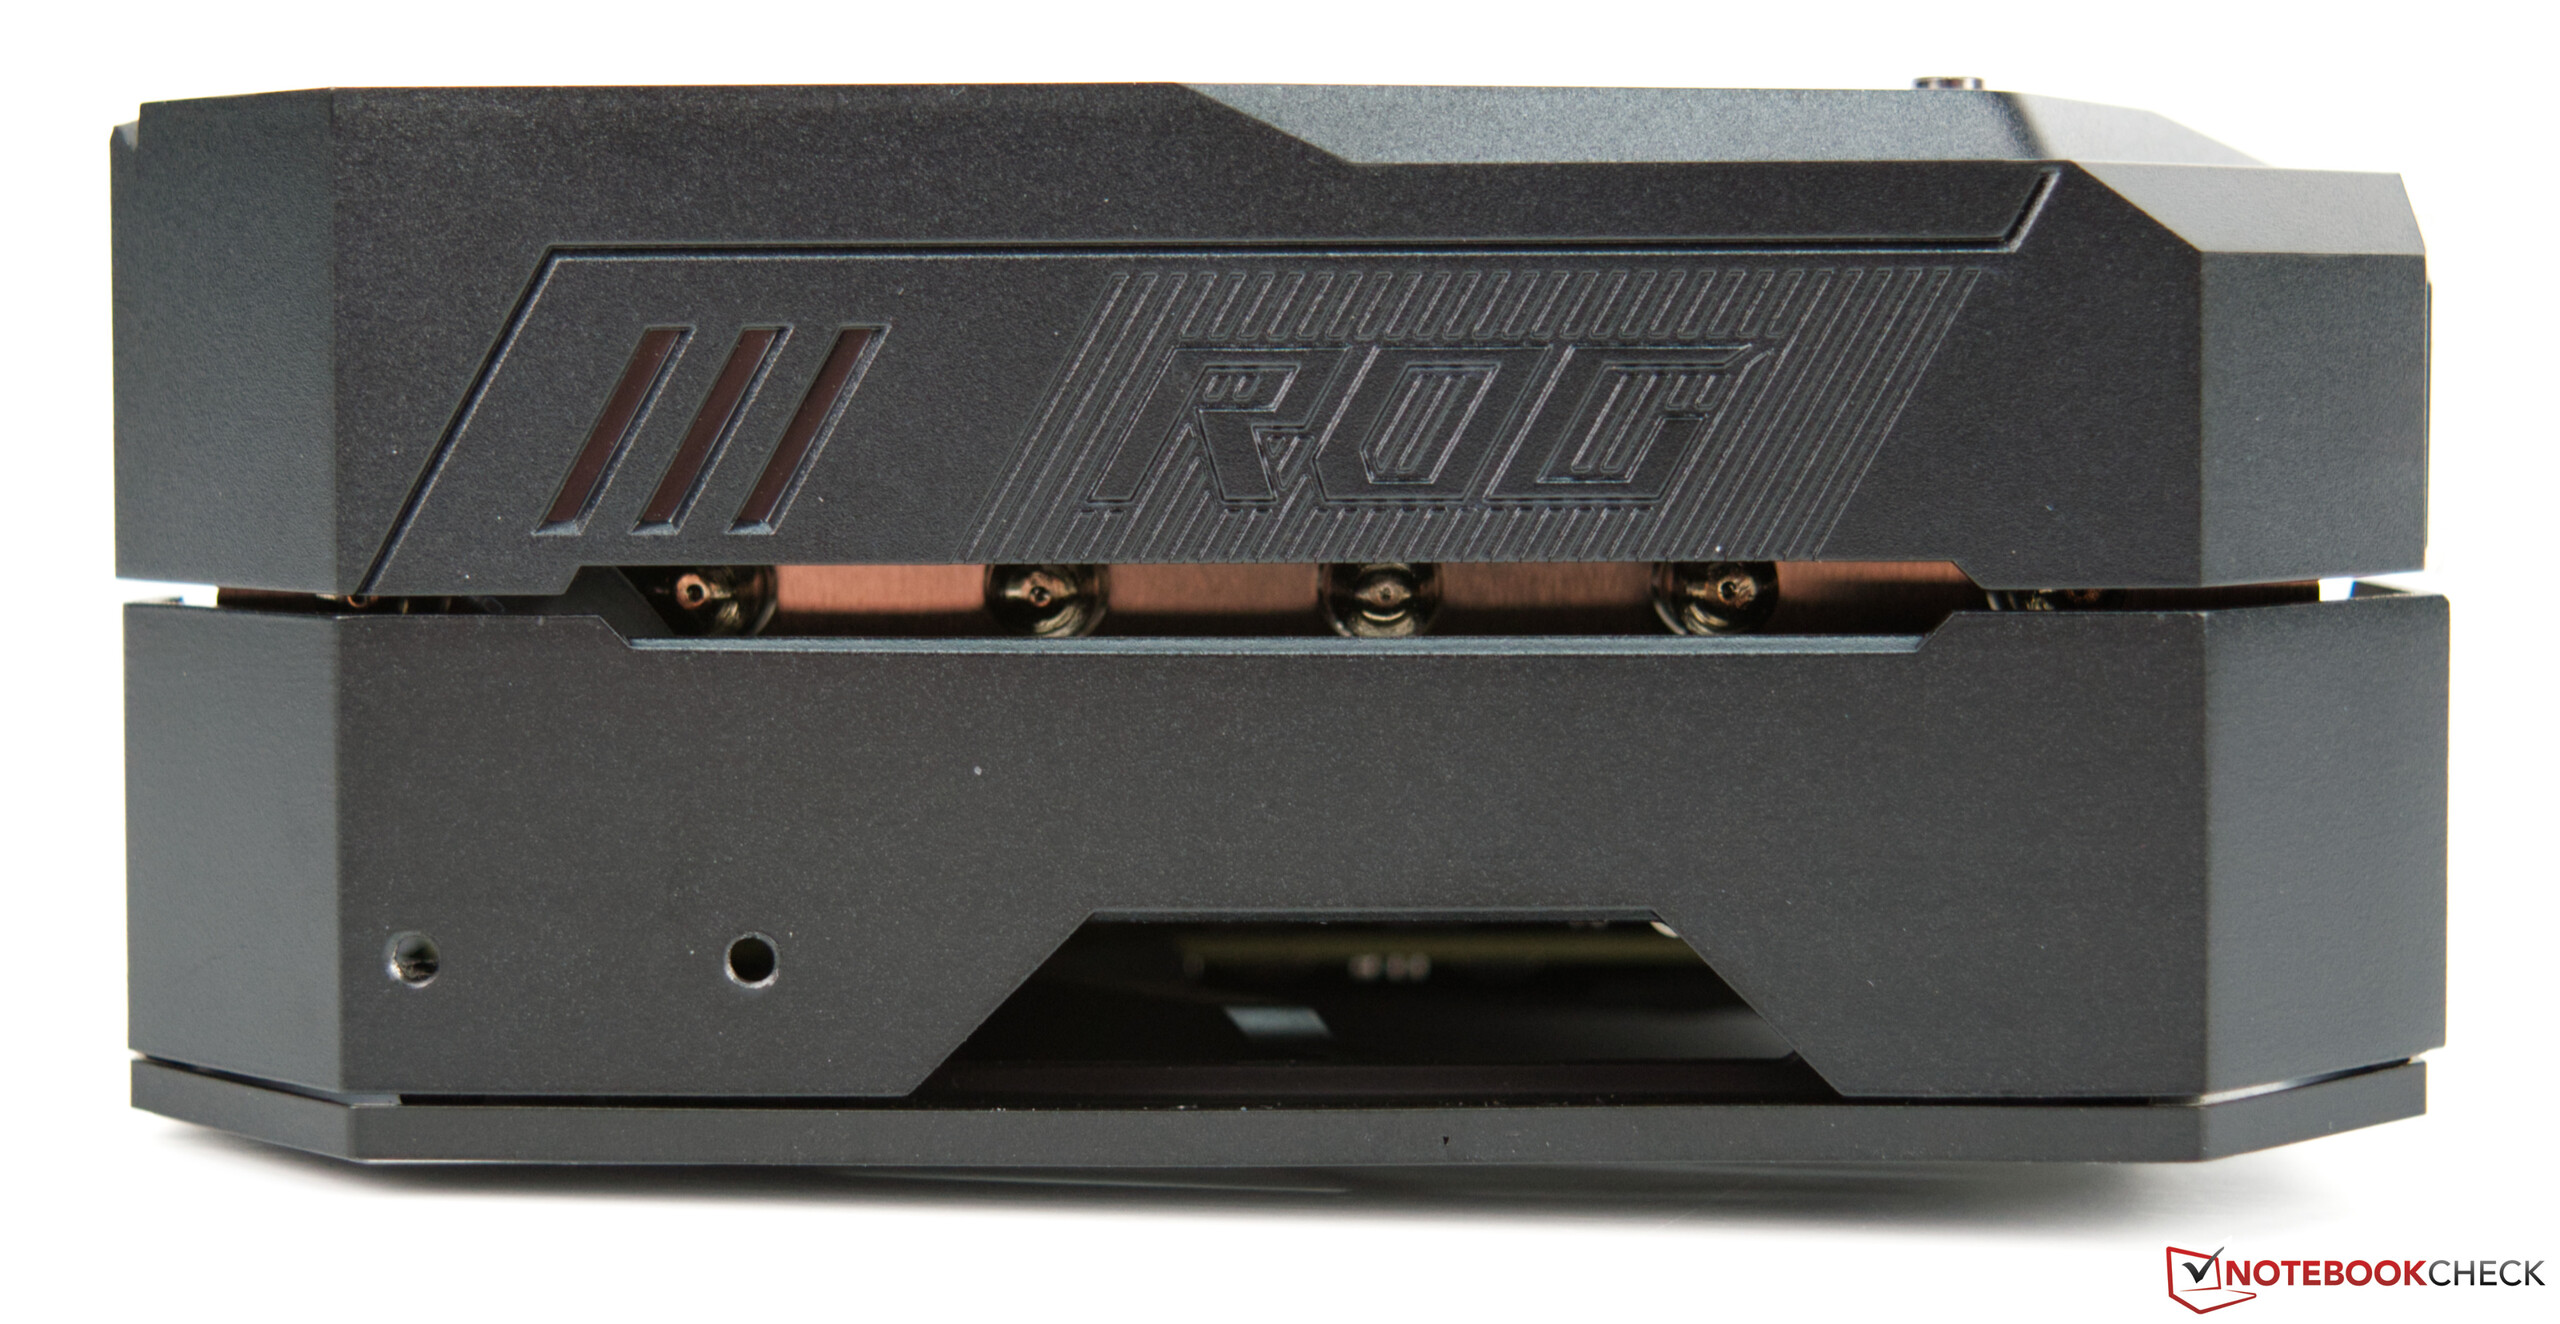
Além disso, a Asus deu a seu modelo RTX 3080 superior um refrigerador de três ranhuras muito potente. No geral, a placa gráfica mede pouco menos de 32 centímetros, o que precisa absolutamente ser considerado ao comprar esta GPU. Nem todos os casos oferecem tanto espaço para tal monstro de uma placa gráfica.
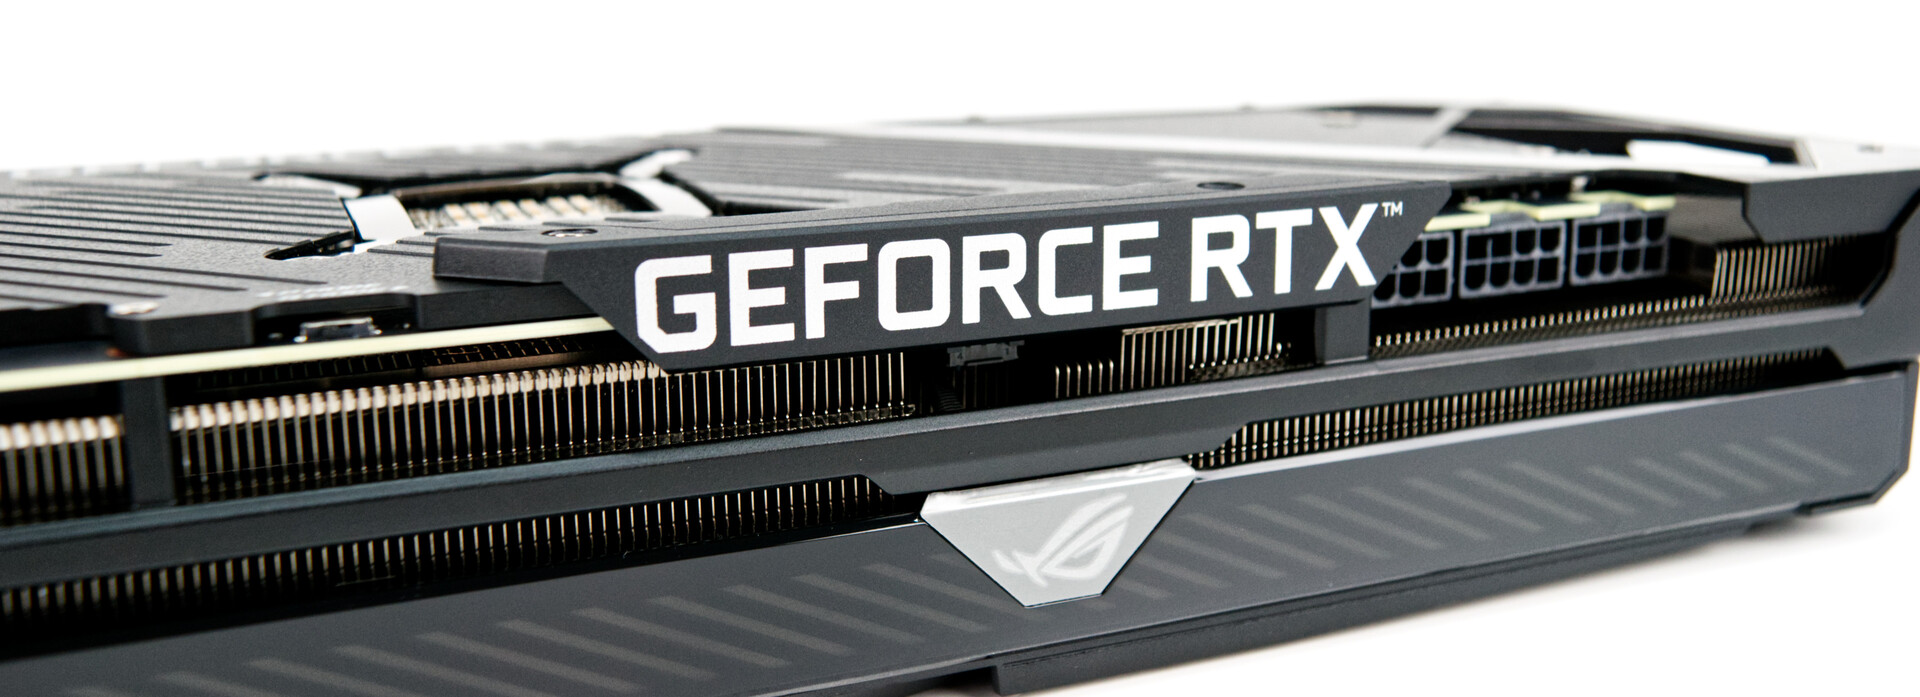
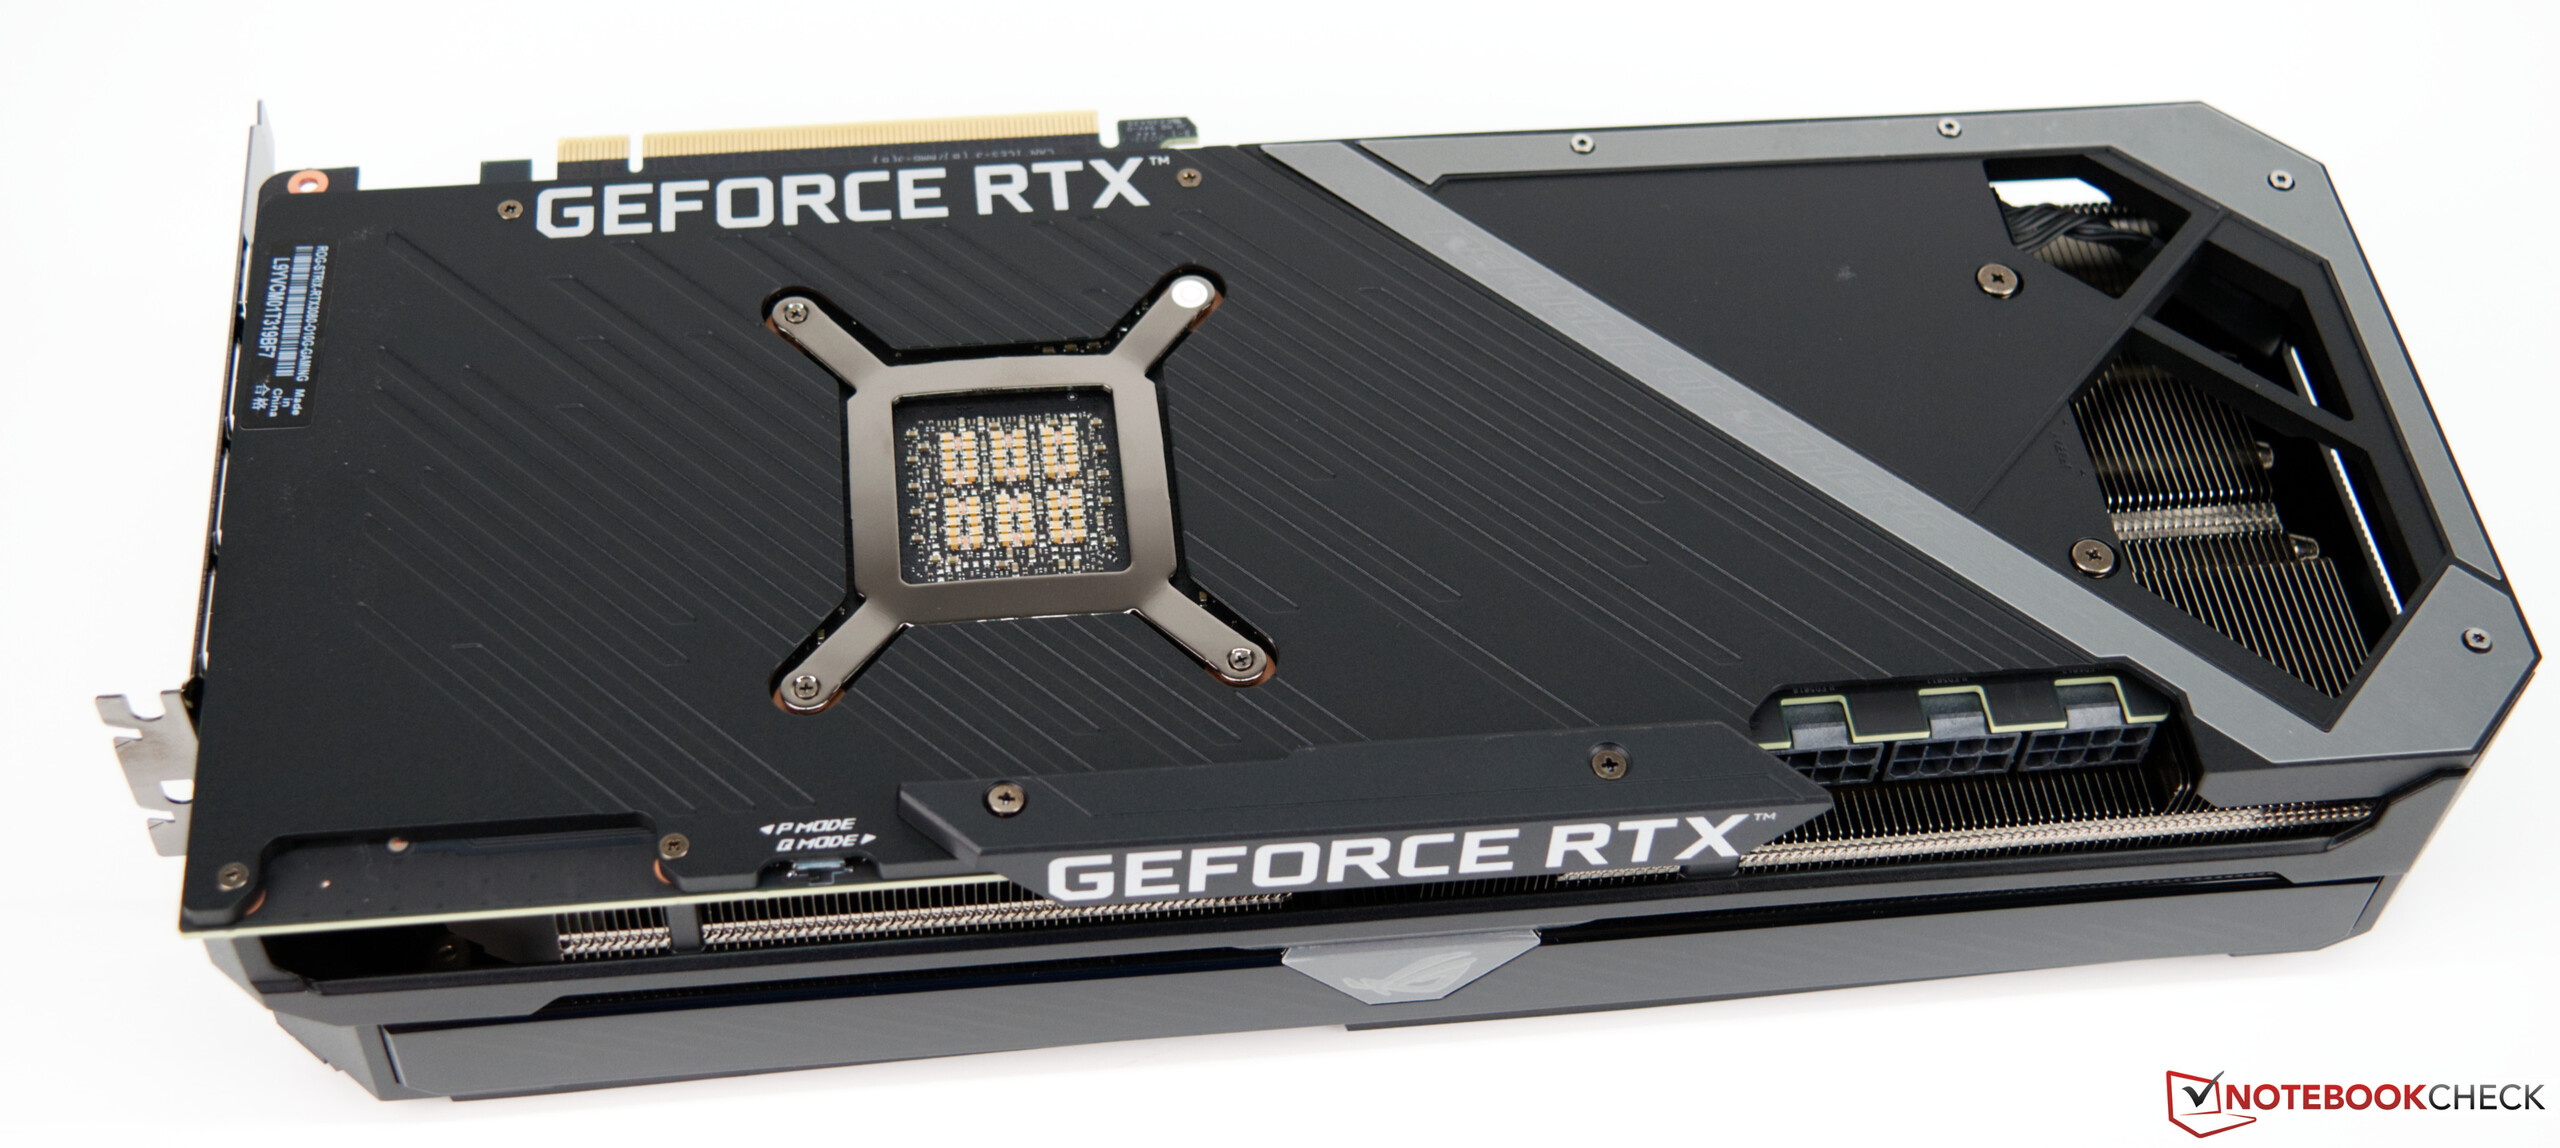
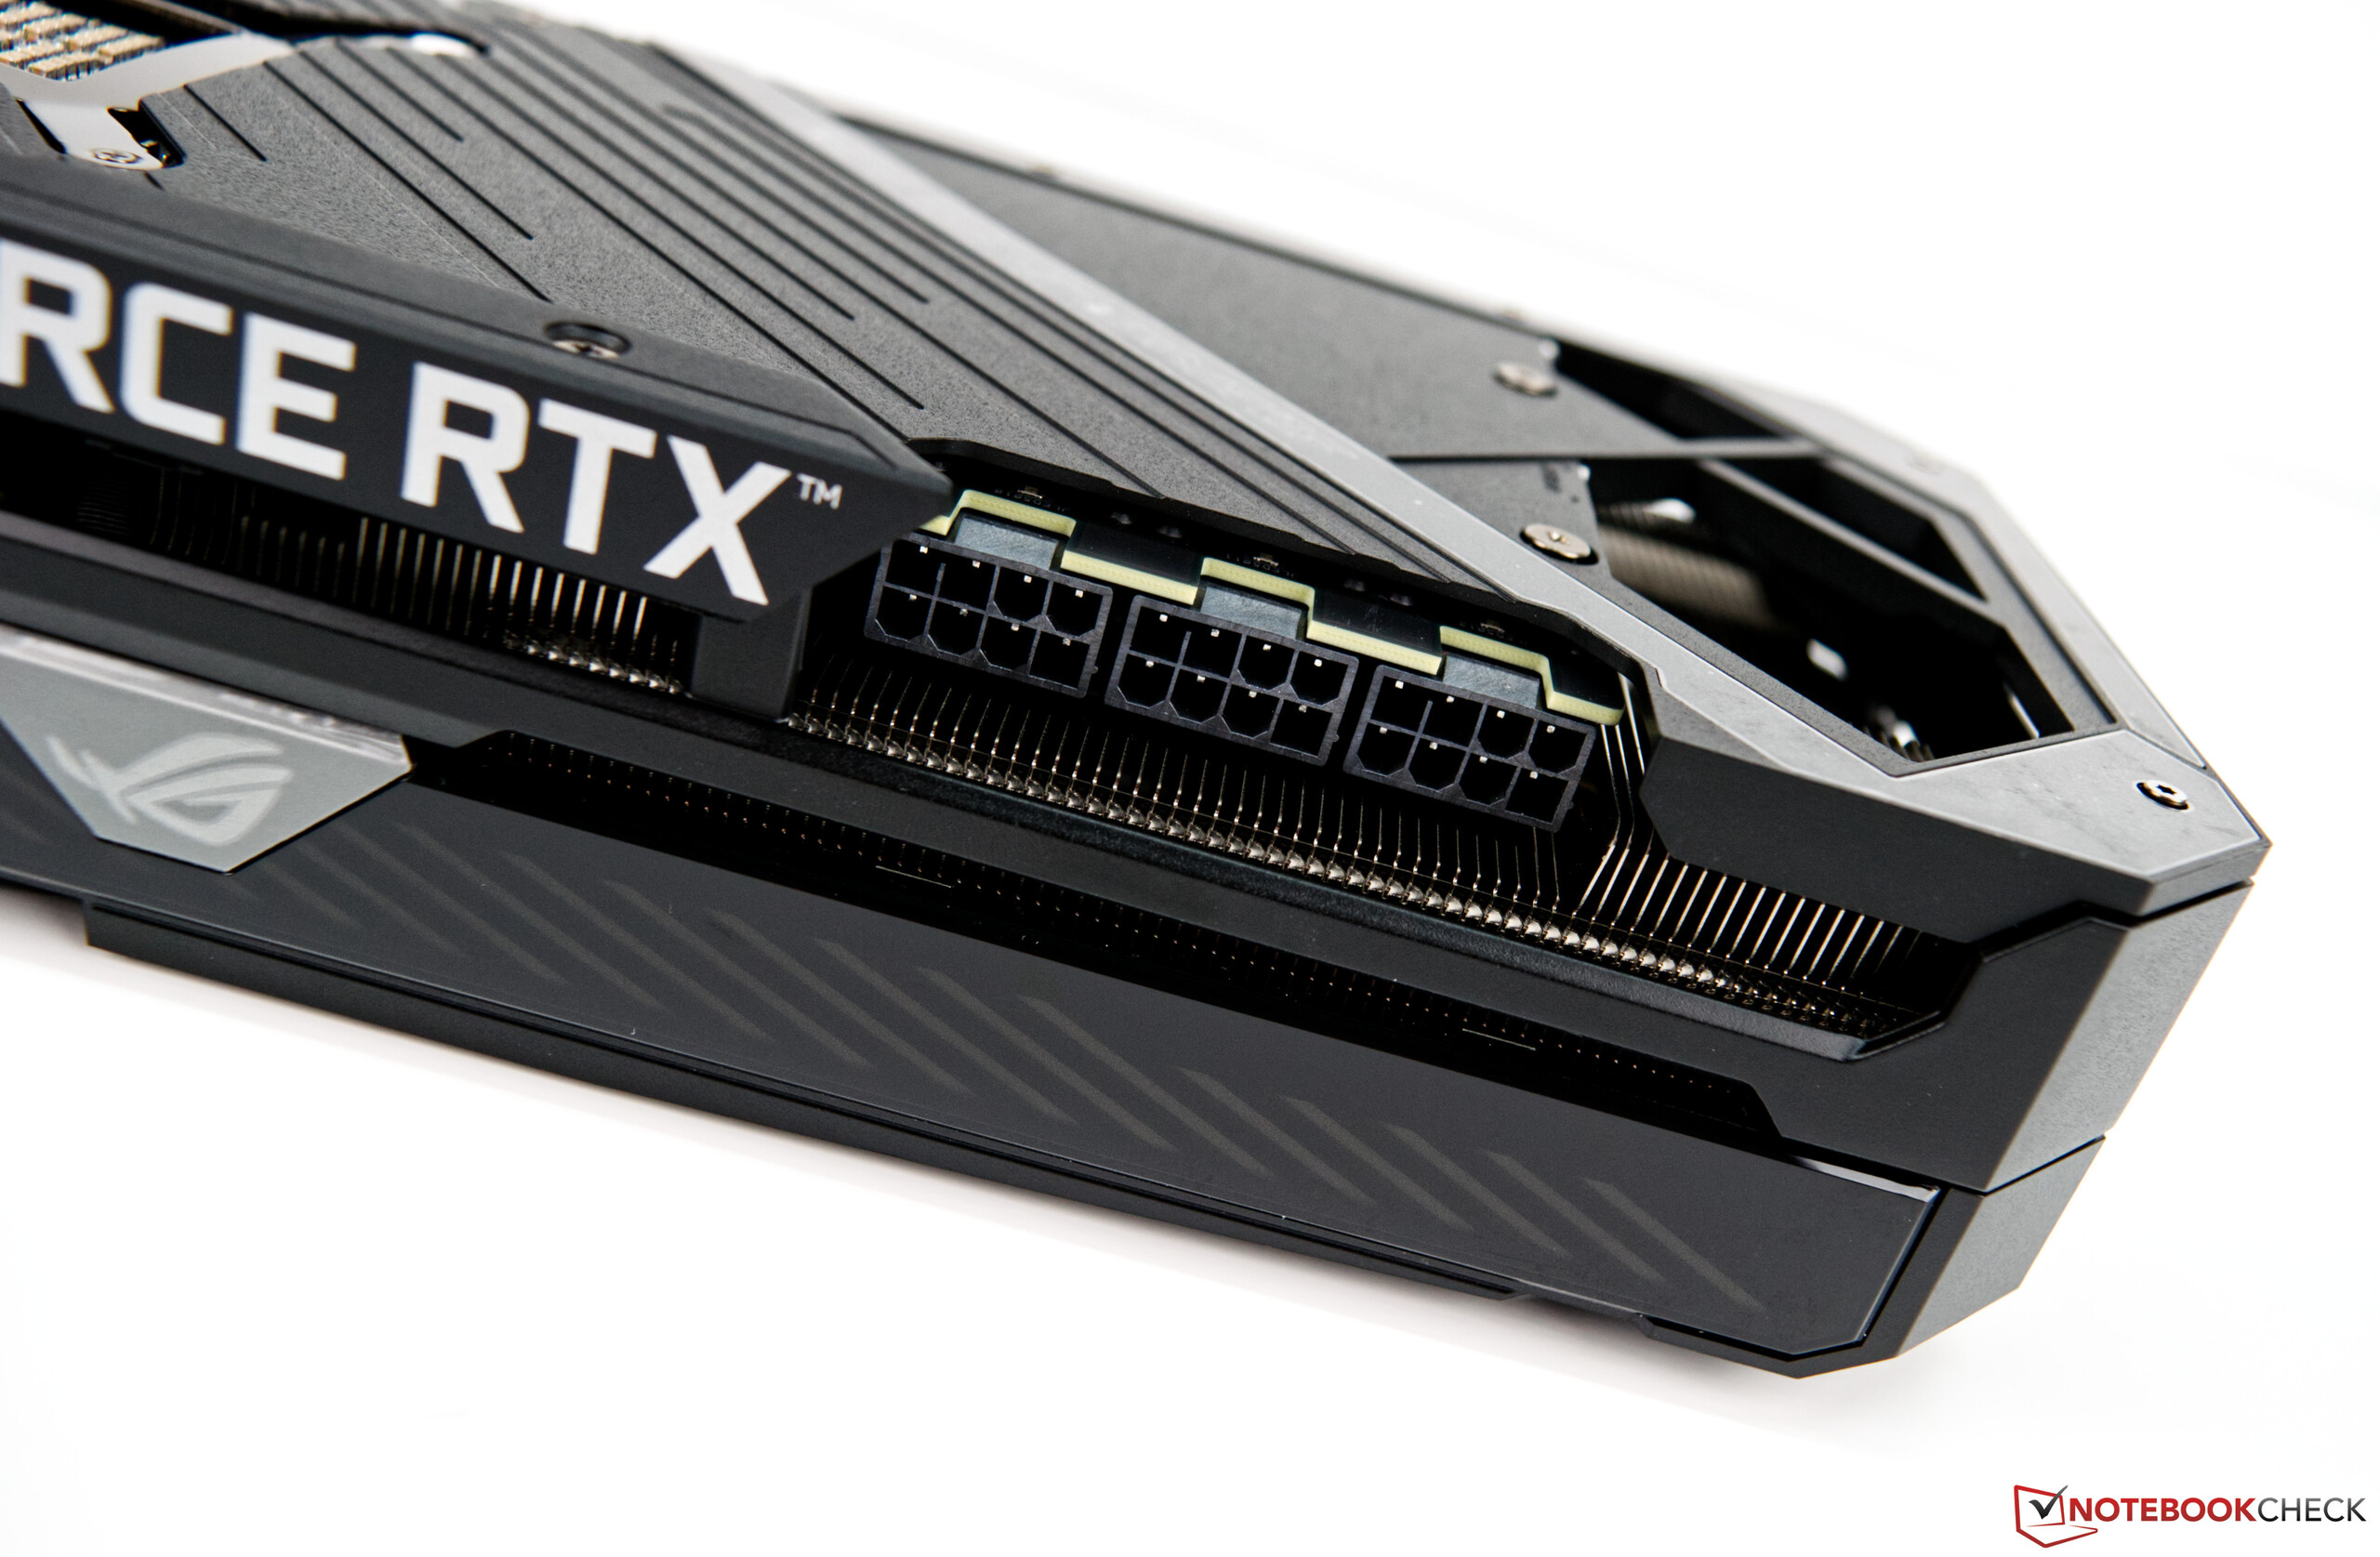
O Asus segue o antigo caminho familiar quando se trata de alimentação de energia e não vai para o conector de 12 pinos que a Nvidia usa com suas placas RTX 3000. A GeForce RTX 3080 ROG Strix Gaming OC requer três conectores de 8 pinos para sua operação. Como resultado, um forte adaptador de energia é inevitável, e o próprio Asus fala de pelo menos 850 watts. Até quatro monitores externos podem ser conectados simultaneamente. Para este fim, a GPU possui HDMI suportando o mais recente padrão (2.1), bem como conexões DisplayPort (1.4a).

O RTX 3080 em comparação com outras GPUs NVIDIA
| Especificação | RTX 3090 | RTX3080 (Asus ROG) | RTX 3080 FE | RTX 3070 FE | Titan RTX | TITAN X Pascal | RTX 2080 Ti | RTX 2080 |
| Chip | GA102 | GA102 | GA102 | GA104 | TU102 | GP102 | TU102 | TU104 |
| Processo FinFET | 8 nm | 8nm | 8 nm | 8 nm | 8 nm | 12 nm | 16 nm | 12 nm |
| CUDA cores | 10,496 | 8,704 | 8,704 | 5,888 | 4,608 | 3,584 | 4,352 | 2,944 |
| Textureunits | 328 | 272 | 272 | 184 | 288 | 224 | 272 | 184 |
| Núcleos Tensores | 328 3ª Gen. | 2723ª Gen. | 272 3ª Gen. | 184 3ª Gen. | 576 2ª Gen. | - | 544 2ª Gen. | 368 2ª Gen. |
| RTCores | 82 | 68 | 68 | 46 | 72 | - | 68 | 46 |
| Relógio base GPU | 1,395 MHz | 1,440 MHz | 1,440 MHz | 1,500 MHz | 1,350 MHz | 1,417 MHz | 1,350 MHz | 1,515 MHz |
| Relógio de impulso GPU | 1,695 MHz | 1,905 MHz | 1,710 MHz | 1,725 MHz | 1,770 MHz | 1,531 MHz | 1,545 MHz | 1,710 MHz |
| Memorybus | 384-bit | 320-bit | 320-bit | 256-bit | 384-bit | 384-bit | 352-bit | 256-bit |
| Largura de banda de memória | 936 GB/s | 760GB/s | 760 GB/s | 448 GB/s | 672 GB/s | 480.4 GB/s | 616 GB/s | 448 GB/s |
| Memória de vídeo | 24 GB GDDR6X | 10GB GDDR6X | 10 GB GDDR6X | 8 GB GDDR6 | 24 GB GDDR6 | 12 GB GDDR5X | 11 GB GDDR6 | 8 GB GDDR6 |
| Consumo de energia elétrica350 W | 320W | 320 W | 220 W | 280 W | 250 W | 250 W | 215 W |
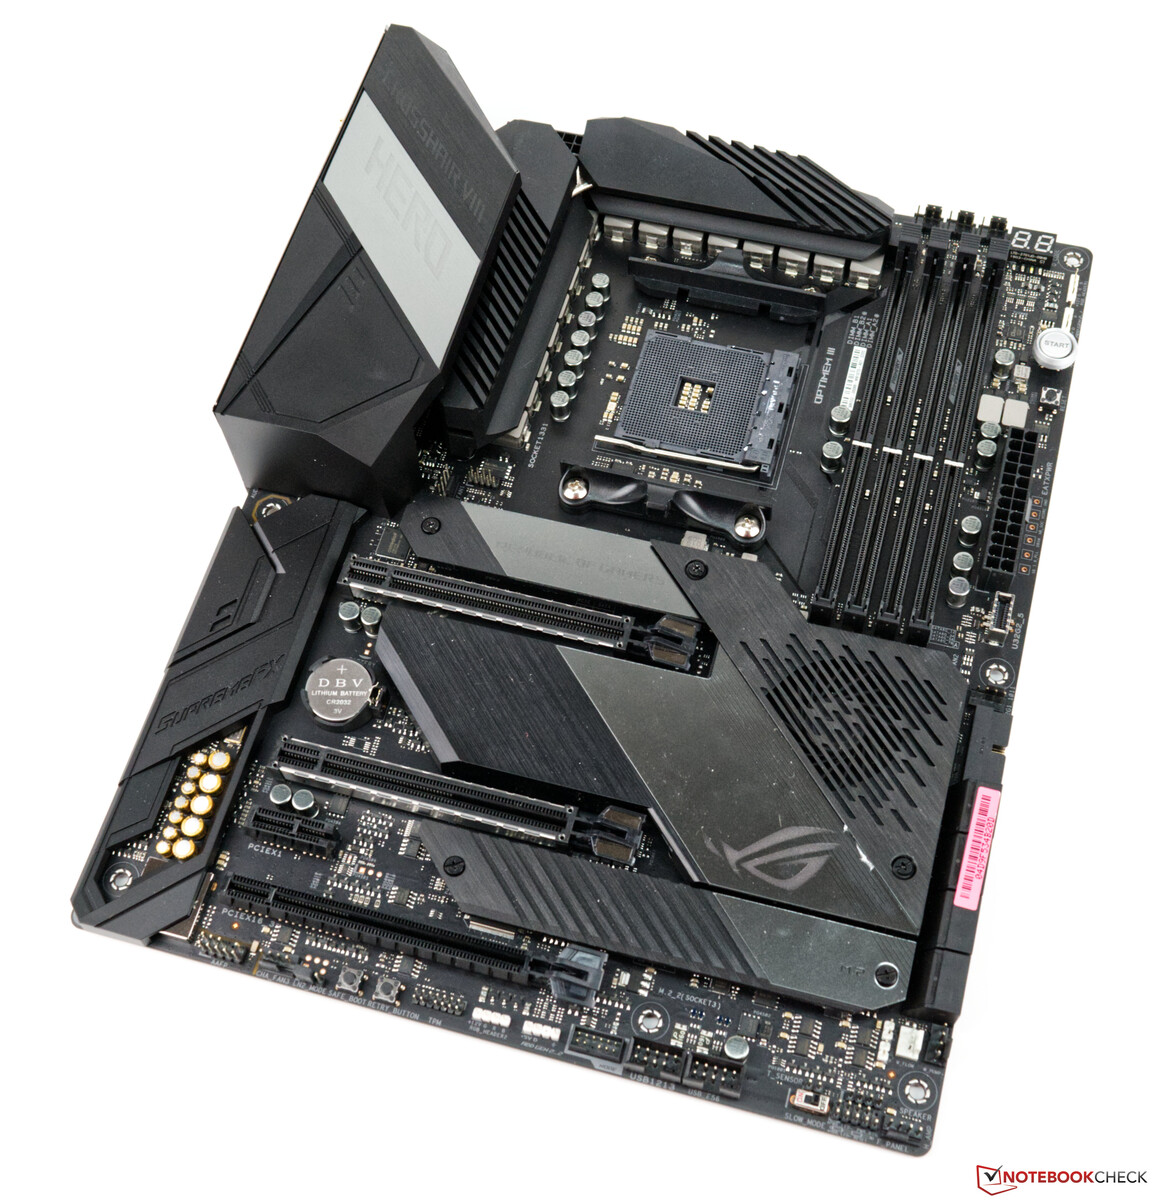
Nosso sistema de teste com o AMD Ryzen 9 3900X como base
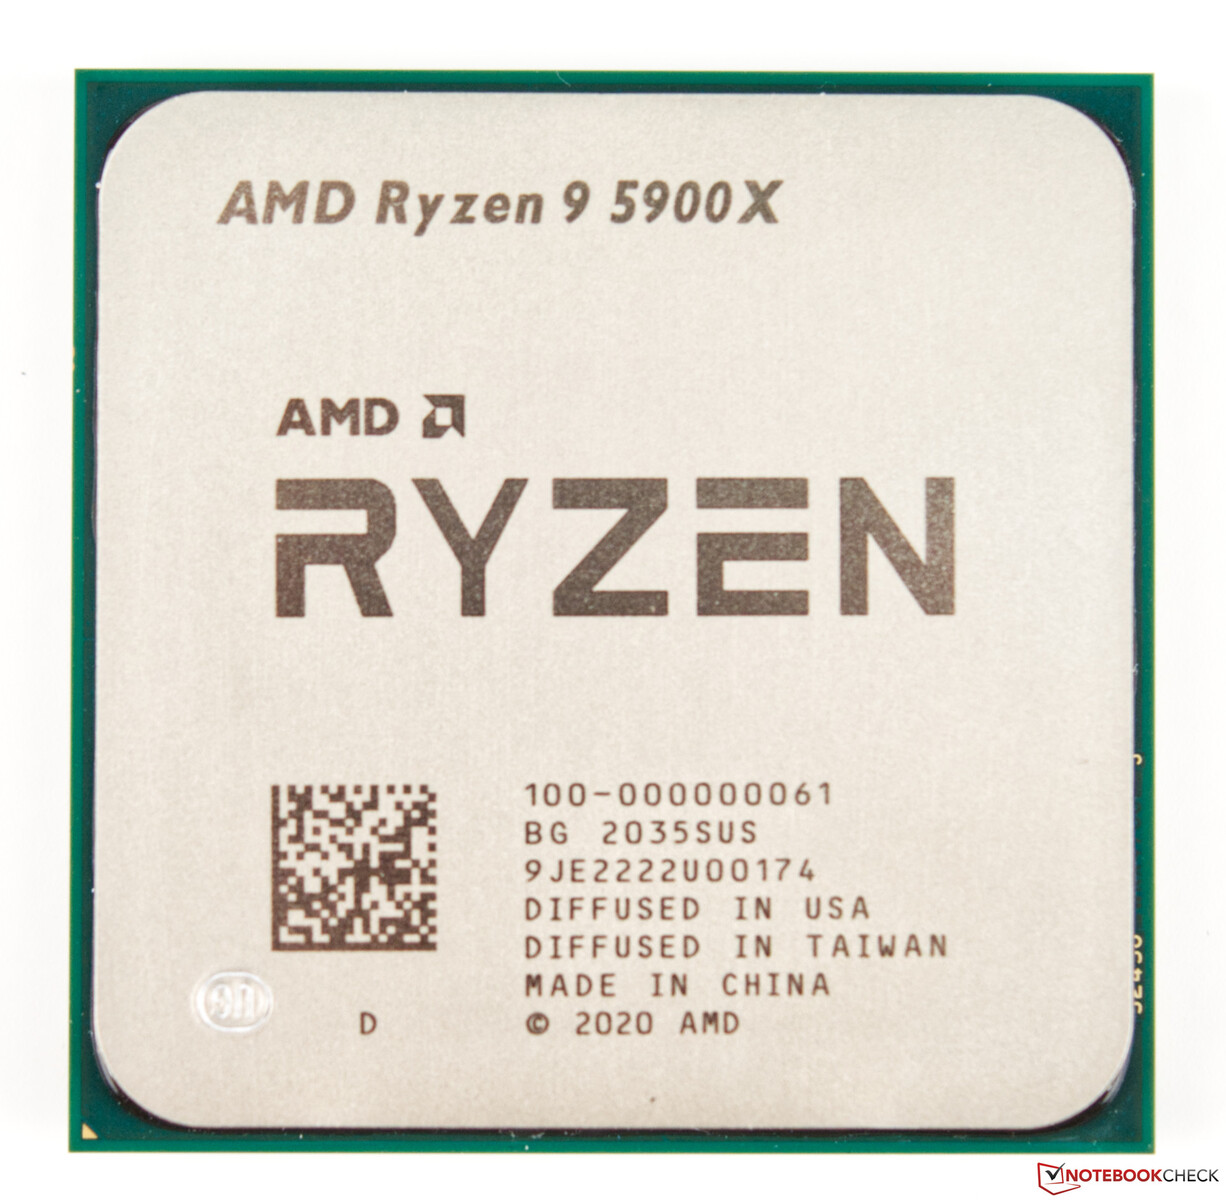
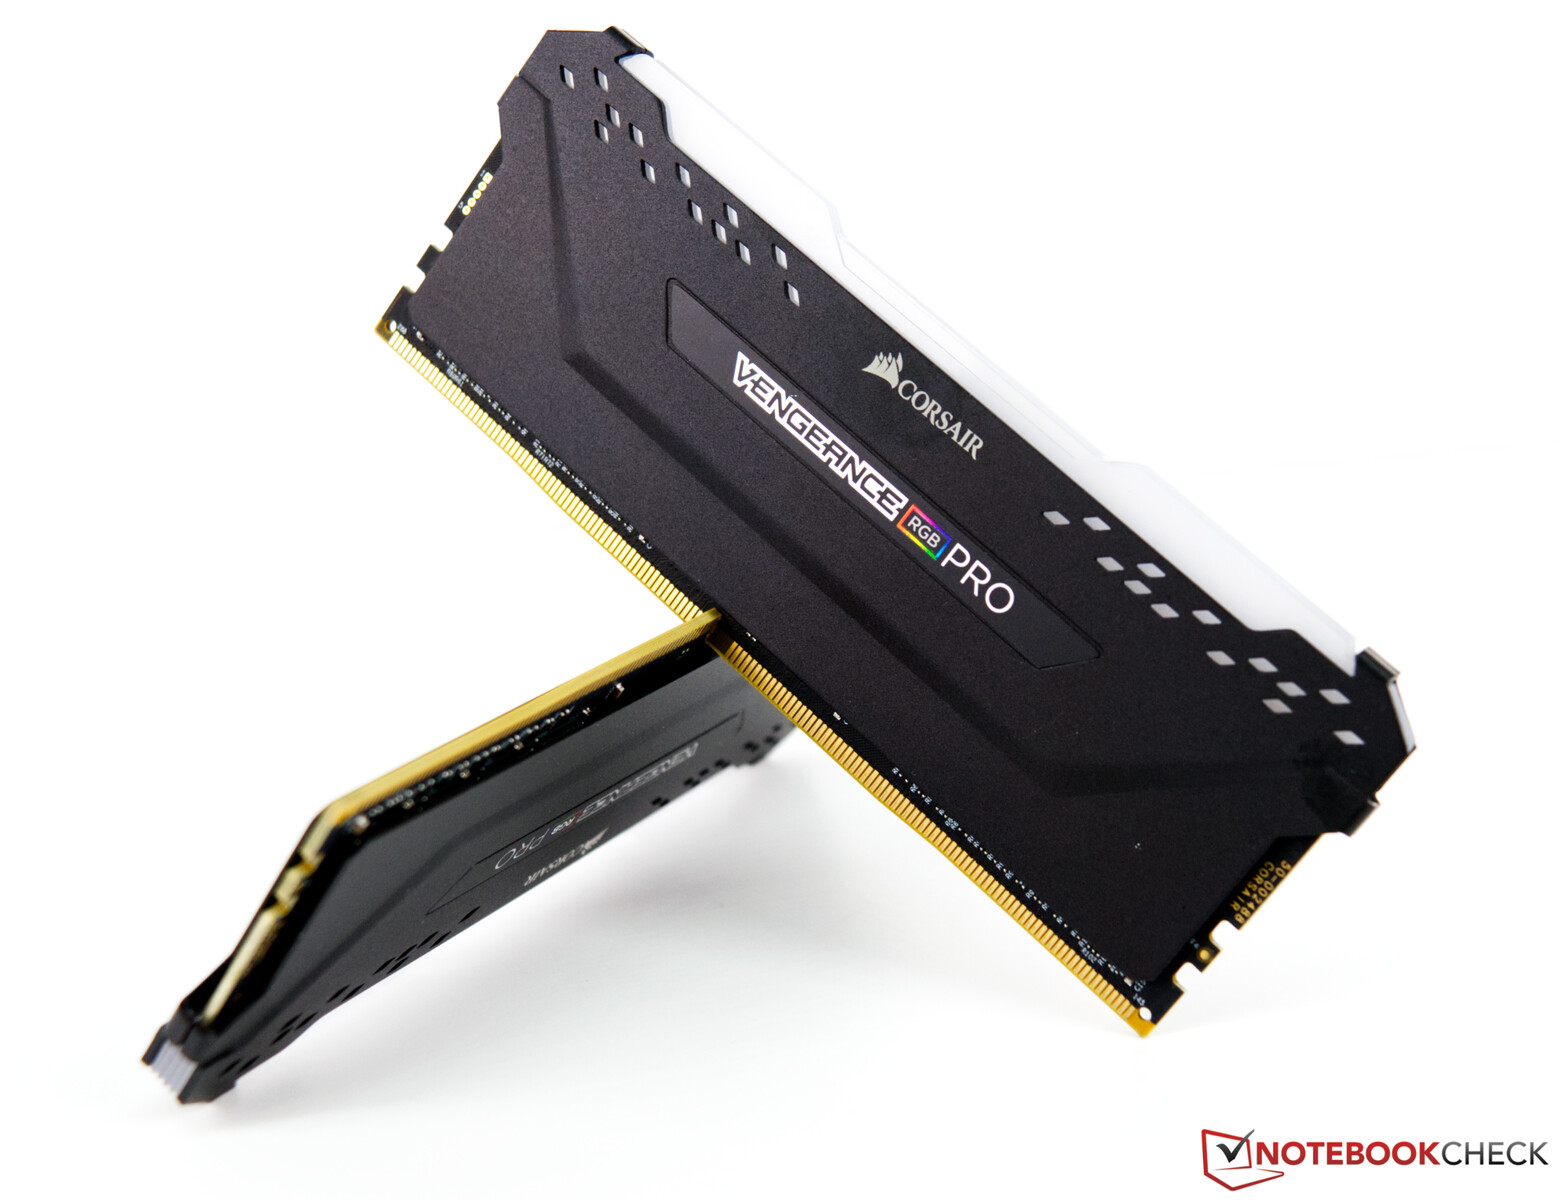
Uma plataforma AMD atual baseada no Asus X570 ROG Crosshair VIII serve como nosso sistema de teste. A CPU(AMD Ryzen 9 5900X) oferece bom desempenho da CPU, e usamos um AIO(Alphacool Eisbaer 280cmm) para o resfriamento. Os 32 GB de RAM vêm de Corsair e relógios a 4.000 MHz. Como monitor, usamos o Acer Predator XB321HK. Ele não nos limita devido a sua capacidade de UHD. Neste ponto, gostaríamos de agradecer à AMD por fornecer a plataforma de teste, bem como à Corsair pelo kit de RAM
Para os próximos benchmarks e testes, usamos o seguinte sistema
- Corsair Carbide Air 540 ATX Cube
- AMD Ryzen 9 5900X
- Asus GeForce RTX 3080 ROG Strix Gaming OC (motoristaNvidia457.09)
- Asus X570 ROG Crosshair VIII (BIOS 2402, configurações padrão, XMP 1 para DDR4 4000)
- Unidade de fornecimento de energia Corsair RM1000X de 1000 watts
- Corsair Vengeance RGB Pro DDR4 4000 2x 16 GB RAMkit
- Corsair MP600 2 TB M.2 PCIe 4.0 SSD
- Crucial MX500 2 TB (para jogos)
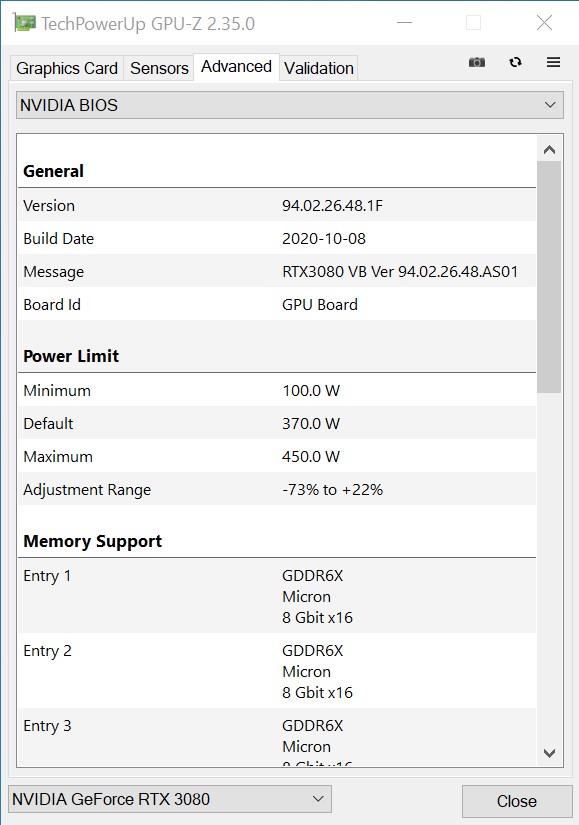
As velocidades do relógio da Asus GeForce RTX 3080 ROG Strix Gaming OC
A 1.440 MHz, a velocidade básica do relógio da Asus GeForce RTX 3080 ROG Strix Gaming OC permaneceu inalterada em comparação com o modelo de referência. Entretanto, o Asus toma um caminho diferente quando se trata da velocidade do relógio de impulso e permite que seu modelo alcance uma velocidade consideravelmente maior a até 1.905 MHz. Esta taxa de relógio também pode ser mantida sem problemas sob carga e normalmente é até mesmo excedida. Além disso, o Asus também permite uma meta de potência mais alta de até 21%. Como resultado, a GeForce RTX 3080 ROG Strix Gaming OC pode até ser rodada de forma estável a mais de 2 GHz. Em termos de VRAM, há agora o GDDR6X ao invés do GDDR6, que era usado anteriormente, embora 10 GB devam ser suficientes agora em comparação com o RTX 2080 Ti. No momento, apenas oGeForce RTX 3090 da atual série Ampere oferece mais memória gráfica.
Padrões de referência sintéticos
Nos benchmarks sintéticos, a Asus GeForce RTX 3080 ROG Strix Gaming OC já começa a mostrar seu potencial de forma bastante clara. Somente oGeForce RTX 3090 oferece mais desempenho; já o revisamos na configuração de nosso parceiro Zotac. Em comparação com a GeForce RTX 2080 Ti, nossa amostra de teste pode se destacar com uma vantagem de cerca de 30%. O significativamente mais caroNvidia Titan RTX só consegue ocupar o terceiro lugar em nossa comparação e não consegue acompanhar a GeForce RTX 3080.
Em contraste com a edição dos fundadores, o Asus tem uma melhor estrutura de resfriamento na GeForce RTX 3080 ROG Strix Gaming OC, o que resulta em uma leve vantagem de desempenho em relação ao modelo de referência.
| 3DMark | |
| 1920x1080 Fire Strike Graphics | |
| GeForce RTX 3090 | |
| Asus GeForce RTX 3080 ROG Strix Gaming OC | |
| Titan RTX | |
| GeForce RTX 2080 Ti (Desktop) | |
| GeForce RTX 2080 (Desktop) | |
| Radeon VII | |
| GeForce RTX 2080 Super (Desktop) | |
| Radeon RX 5700 XT (Desktop) | |
| GeForce RTX 2070 Super (Desktop) | |
| GeForce RTX 2070 (Desktop) | |
| Radeon RX 5700 (Desktop) | |
| RX Vega 64 | |
| GeForce RTX 2060 Super (Desktop) | |
| GeForce RTX 2060 (Desktop) | |
| Fire Strike Extreme Graphics | |
| GeForce RTX 3090 | |
| Asus GeForce RTX 3080 ROG Strix Gaming OC | |
| Titan RTX | |
| GeForce RTX 2080 Ti (Desktop) | |
| Radeon VII | |
| GeForce RTX 2080 (Desktop) | |
| GeForce RTX 2080 Super (Desktop) | |
| Radeon RX 5700 XT (Desktop) | |
| GeForce RTX 2070 Super (Desktop) | |
| GeForce RTX 2070 (Desktop) | |
| Radeon RX 5700 (Desktop) | |
| RX Vega 64 | |
| GeForce RTX 2060 Super (Desktop) | |
| GeForce RTX 2060 (Desktop) | |
| 3840x2160 Fire Strike Ultra Graphics | |
| GeForce RTX 3090 | |
| Asus GeForce RTX 3080 ROG Strix Gaming OC | |
| Titan RTX | |
| GeForce RTX 2080 Ti (Desktop) | |
| Radeon VII | |
| GeForce RTX 2080 (Desktop) | |
| GeForce RTX 2080 Super (Desktop) | |
| Radeon RX 5700 XT (Desktop) | |
| GeForce RTX 2070 Super (Desktop) | |
| GeForce RTX 2070 (Desktop) | |
| RX Vega 64 | |
| Radeon RX 5700 (Desktop) | |
| GeForce RTX 2060 Super (Desktop) | |
| GeForce RTX 2060 (Desktop) | |
| 2560x1440 Time Spy Graphics | |
| GeForce RTX 3090 | |
| Asus GeForce RTX 3080 ROG Strix Gaming OC | |
| Titan RTX | |
| GeForce RTX 2080 Ti (Desktop) | |
| GeForce RTX 2080 Super (Desktop) | |
| GeForce RTX 2080 (Desktop) | |
| GeForce RTX 2070 Super (Desktop) | |
| GeForce RTX 2070 (Desktop) | |
| Radeon VII | |
| GeForce RTX 2060 Super (Desktop) | |
| Radeon RX 5700 XT (Desktop) | |
| GeForce RTX 2060 (Desktop) | |
| Radeon RX 5700 (Desktop) | |
| RX Vega 64 | |
| Unigine Superposition | |
| 1280x720 720p Low | |
| Titan RTX | |
| Asus GeForce RTX 3080 ROG Strix Gaming OC | |
| 1920x1080 1080p High | |
| GeForce RTX 3090 | |
| Asus GeForce RTX 3080 ROG Strix Gaming OC | |
| Titan RTX | |
| 1920x1080 1080p Extreme | |
| GeForce RTX 3090 | |
| Asus GeForce RTX 3080 ROG Strix Gaming OC | |
| Titan RTX | |
| 3840x2160 4k Optimized | |
| GeForce RTX 3090 | |
| Asus GeForce RTX 3080 ROG Strix Gaming OC | |
| Titan RTX | |
| 7680x4320 8k Optimized | |
| GeForce RTX 3090 | |
| Asus GeForce RTX 3080 ROG Strix Gaming OC | |
| Titan RTX | |
| Unigine Heaven 4.0 | |
| Extreme Preset OpenGL | |
| Asus GeForce RTX 3080 ROG Strix Gaming OC | |
| Titan RTX | |
| GeForce RTX 2080 Ti (Desktop) | |
| GeForce RTX 2080 Super (Desktop) | |
| GeForce RTX 2080 (Desktop) | |
| GeForce RTX 2070 Super (Desktop) | |
| GeForce RTX 2070 (Desktop) | |
| GeForce RTX 2060 Super (Desktop) | |
| GeForce RTX 2060 (Desktop) | |
| Radeon RX 5700 XT (Desktop) | |
| Radeon VII | |
| Radeon RX 5700 (Desktop) | |
| Extreme Preset DX11 | |
| GeForce RTX 3090 | |
| Titan RTX | |
| Asus GeForce RTX 3080 ROG Strix Gaming OC | |
| GeForce RTX 2080 Ti (Desktop) | |
| GeForce RTX 2080 (Desktop) | |
| GeForce RTX 2080 Super (Desktop) | |
| GeForce RTX 2070 Super (Desktop) | |
| GeForce RTX 2070 (Desktop) | |
| GeForce RTX 2060 Super (Desktop) | |
| Radeon VII | |
| Radeon RX 5700 XT (Desktop) | |
| GeForce RTX 2060 (Desktop) | |
| Radeon RX 5700 (Desktop) | |
| Unigine Valley 1.0 | |
| 1920x1080 Extreme HD DirectX AA:x8 | |
| GeForce RTX 3090 | |
| Titan RTX | |
| Asus GeForce RTX 3080 ROG Strix Gaming OC | |
| GeForce RTX 2080 Ti (Desktop) | |
| GeForce RTX 2080 Super (Desktop) | |
| GeForce RTX 2080 (Desktop) | |
| GeForce RTX 2070 Super (Desktop) | |
| GeForce RTX 2070 (Desktop) | |
| Radeon VII | |
| GeForce RTX 2060 Super (Desktop) | |
| Radeon RX 5700 XT (Desktop) | |
| Radeon RX 5700 (Desktop) | |
| GeForce RTX 2060 (Desktop) | |
| 1920x1080 Extreme HD Preset OpenGL AA:x8 | |
| Asus GeForce RTX 3080 ROG Strix Gaming OC | |
| Titan RTX | |
| GeForce RTX 2080 Ti (Desktop) | |
| GeForce RTX 2080 Super (Desktop) | |
| GeForce RTX 2080 (Desktop) | |
| GeForce RTX 2070 Super (Desktop) | |
| GeForce RTX 2070 (Desktop) | |
| GeForce RTX 2060 Super (Desktop) | |
| Radeon RX 5700 XT (Desktop) | |
| GeForce RTX 2060 (Desktop) | |
| Radeon RX 5700 (Desktop) | |
| Radeon VII | |
| SiSoft Sandra 2016 | |
| GP Financial Analysis (FP High/Double Precision) | |
| Radeon VII | |
| Asus GeForce RTX 3080 ROG Strix Gaming OC | |
| GeForce RTX 2080 Ti (Desktop) | |
| GeForce RTX 2080 (Desktop) | |
| GeForce RTX 2080 Super (Desktop) | |
| GeForce RTX 2070 Super (Desktop) | |
| GeForce RTX 2070 (Desktop) | |
| GeForce RTX 2060 Super (Desktop) | |
| GeForce RTX 2060 (Desktop) | |
| Radeon RX 5700 XT (Desktop) | |
| Radeon RX 5700 (Desktop) | |
| GP Cryptography (Higher Security AES256+SHA2-512) | |
| Asus GeForce RTX 3080 ROG Strix Gaming OC | |
| GeForce RTX 2080 Ti (Desktop) | |
| GeForce RTX 2080 (Desktop) | |
| Radeon VII | |
| GeForce RTX 2080 Super (Desktop) | |
| GeForce RTX 2070 Super (Desktop) | |
| GeForce RTX 2070 (Desktop) | |
| GeForce RTX 2060 Super (Desktop) | |
| GeForce RTX 2060 (Desktop) | |
| Image Processing | |
| Asus GeForce RTX 3080 ROG Strix Gaming OC | |
| Radeon VII | |
| GeForce RTX 2080 Ti (Desktop) | |
| GeForce RTX 2080 Super (Desktop) | |
| GeForce RTX 2080 (Desktop) | |
| GeForce RTX 2070 Super (Desktop) | |
| GeForce RTX 2070 (Desktop) | |
| GeForce RTX 2060 Super (Desktop) | |
| Radeon RX 5700 XT (Desktop) | |
| GeForce RTX 2060 (Desktop) | |
| Radeon RX 5700 (Desktop) | |
| 3DMark 05 Standard | 46192 pontos | |
| 3DMark 06 Standard Score | 44255 pontos | |
| 3DMark Vantage P Result | 93066 pontos | |
| 3DMark 11 Performance | 32211 pontos | |
| 3DMark Ice Storm Standard Score | 238949 pontos | |
| 3DMark Cloud Gate Standard Score | 75364 pontos | |
| 3DMark Fire Strike Score | 33440 pontos | |
| 3DMark Fire Strike Extreme Score | 20455 pontos | |
| 3DMark Time Spy Score | 15712 pontos | |
Ajuda | ||
Benchmarks de jogo
Os testes de jogo realizados revelam que a GeForce RTX 3080 é mais adequada para altas resoluções. Quase todos os jogos que testamos poderiam ser jogados a 2160p sem qualquer problema. Entretanto, existem jogos específicos, como o Flight Simulator 2020, onde até mesmo a GeForce RTX 3080 atinge seus limites. A nova placa gráfica mostra a maior vantagem quando vai além de 1080p. Se você não jogar em altas resoluções, a compra de um RTX 3080 atualmente não vale a pena.
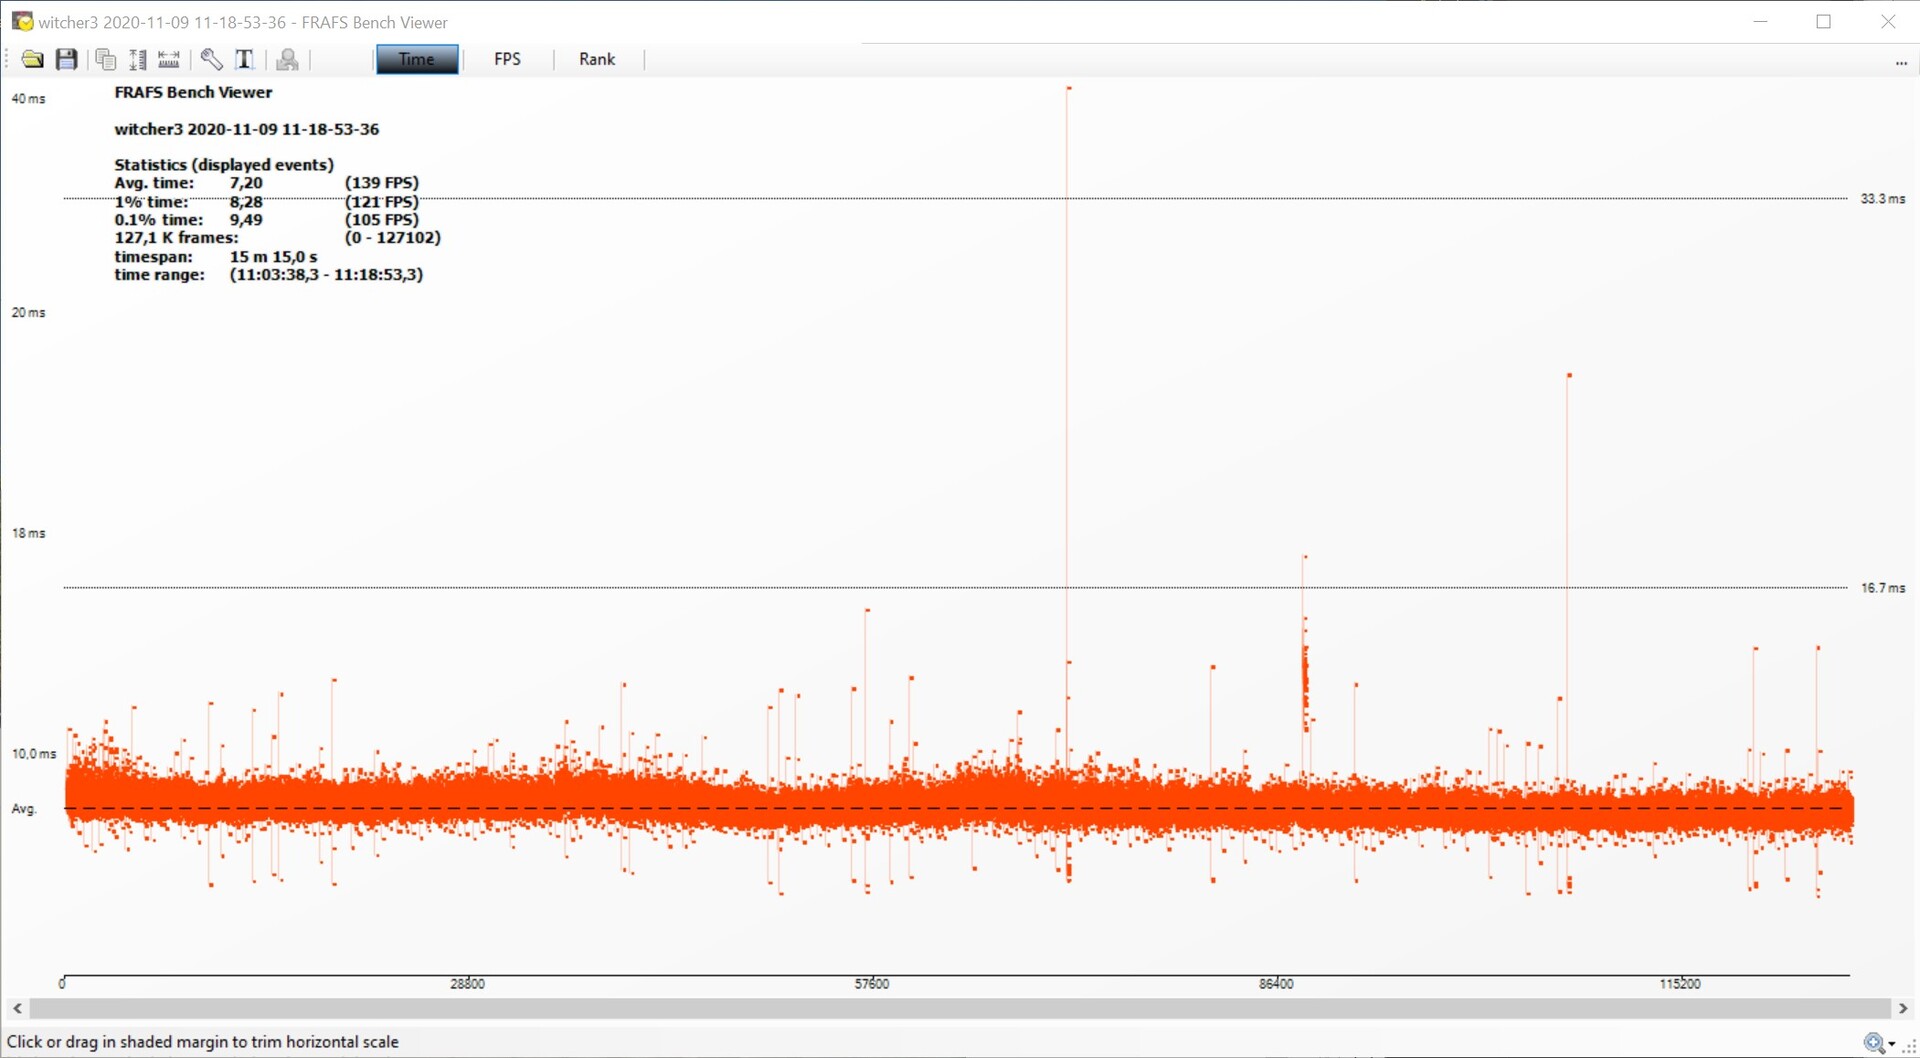
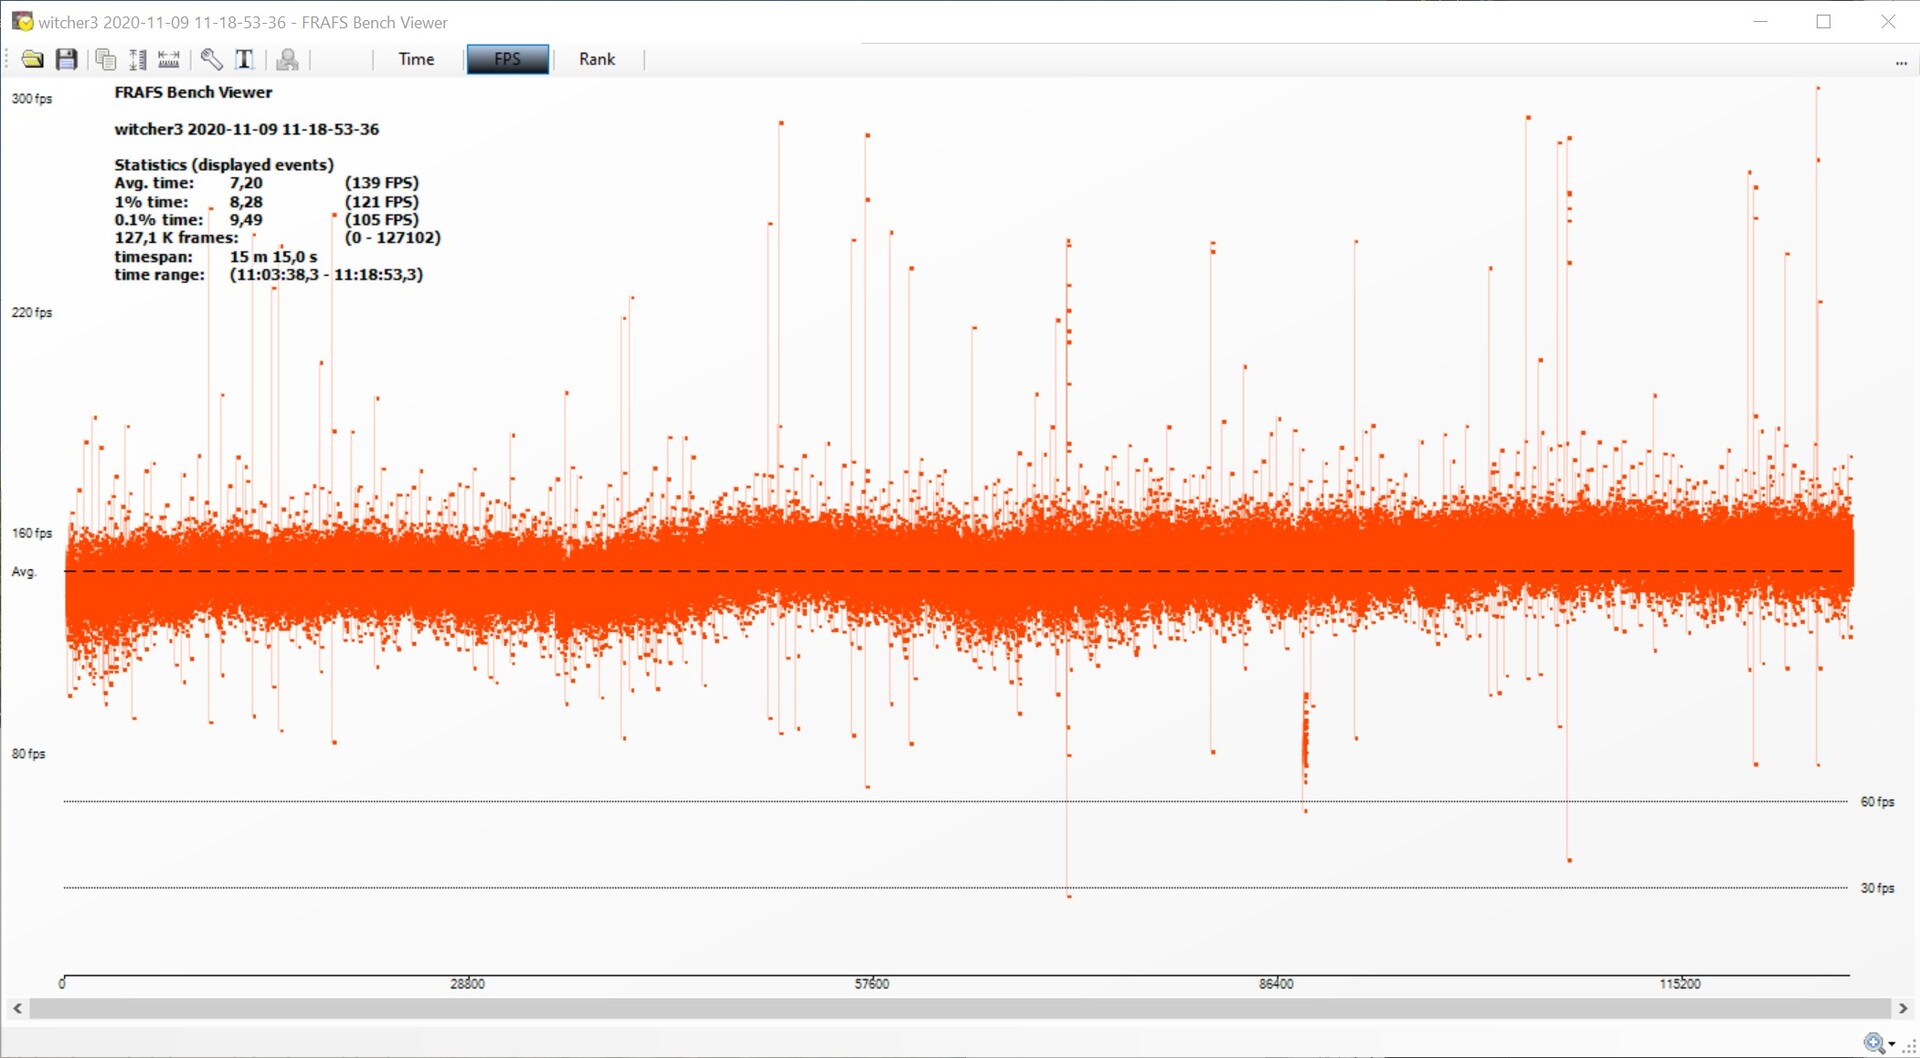
Mas o jogo suave é garantido com a Asus GeForce RTX 3080 ROG Strix Gaming OC. Examinamos a progressão de quadros e também os tempos de quadros no jogo O Witcher 3
(Ultra preset) e não encontramos nenhuma irregularidade digna de nota. Documentamos aberturas individuais. Entretanto, com 139 FPS, o jogo é definitivamente garantido.The Witcher 3 frame progression - Ultra preset
| Far Cry New Dawn - 3840x2160 Ultra Preset | |
| GeForce RTX 3090 | |
| Asus GeForce RTX 3080 ROG Strix Gaming OC | |
| Titan RTX | |
| Titan RTX | |
| GeForce RTX 2080 Ti (Desktop) | |
| GeForce RTX 2080 Super (Desktop) | |
| GeForce RTX 2080 (Desktop) | |
| Radeon VII | |
| GeForce RTX 2070 Super (Desktop) | |
| Radeon RX 5700 XT (Desktop) | |
| GeForce RTX 2070 (Desktop) | |
| Radeon RX 5700 (Desktop) | |
| GeForce RTX 2060 Super (Desktop) | |
| RX Vega 64 | |
| GeForce RTX 2060 (Desktop) | |
| Far Cry 5 - 3840x2160 Ultra Preset AA:T | |
| GeForce RTX 3090 | |
| Asus GeForce RTX 3080 ROG Strix Gaming OC | |
| Titan RTX | |
| Titan RTX | |
| GeForce RTX 2080 Ti (Desktop) | |
| GeForce RTX 2080 Super (Desktop) | |
| GeForce RTX 2080 (Desktop) | |
| Radeon VII | |
| GeForce RTX 2070 Super (Desktop) | |
| Radeon RX 5700 XT (Desktop) | |
| GeForce RTX 2070 (Desktop) | |
| GeForce RTX 2060 Super (Desktop) | |
| Radeon RX 5700 (Desktop) | |
| RX Vega 64 | |
| GeForce RTX 2060 (Desktop) | |
| F1 2020 - 3840x2160 Ultra High Preset AA:T AF:16x | |
| GeForce RTX 3090 | |
| Asus GeForce RTX 3080 ROG Strix Gaming OC | |
| Titan RTX | |
| Borderlands 3 - 3840x2160 Badass Overall Quality (DX11) | |
| GeForce RTX 3090 | |
| Asus GeForce RTX 3080 ROG Strix Gaming OC | |
| Titan RTX | |
| Titan RTX | |
| GeForce RTX 2080 Ti (Desktop) | |
| Metro Exodus - 3840x2160 Ultra Quality AF:16x | |
| GeForce RTX 3090 | |
| Asus GeForce RTX 3080 ROG Strix Gaming OC | |
| Titan RTX | |
| Titan RTX | |
| GeForce RTX 2080 Ti (Desktop) | |
| RX Vega 64 | |
| GeForce RTX 2080 Super (Desktop) | |
| GeForce RTX 2080 (Desktop) | |
| Radeon VII | |
| GeForce RTX 2070 Super (Desktop) | |
| GeForce RTX 2070 (Desktop) | |
| GeForce RTX 2060 Super (Desktop) | |
| Radeon RX 5700 XT (Desktop) | |
| Radeon RX 5700 (Desktop) | |
| GeForce RTX 2060 (Desktop) | |
| Red Dead Redemption 2 - 3840x2160 Maximum Settings | |
| GeForce RTX 3090 | |
| Asus GeForce RTX 3080 ROG Strix Gaming OC | |
| Titan RTX | |
| Rise of the Tomb Raider - 3840x2160 High Preset AA:FX AF:4x | |
| Asus GeForce RTX 3080 ROG Strix Gaming OC | |
| GeForce RTX 2080 Ti (Desktop) | |
| GeForce RTX 2080 Super (Desktop) | |
| GeForce RTX 2080 (Desktop) | |
| GeForce RTX 2070 Super (Desktop) | |
| GeForce RTX 2070 (Desktop) | |
| Radeon VII | |
| GeForce RTX 2060 Super (Desktop) | |
| RX Vega 64 | |
| GeForce RTX 2060 (Desktop) | |
| Shadow of the Tomb Raider - 3840x2160 Highest Preset AA:T | |
| GeForce RTX 3090 | |
| Asus GeForce RTX 3080 ROG Strix Gaming OC | |
| Titan RTX | |
| Titan RTX | |
| GeForce RTX 2080 Ti (Desktop) | |
| GeForce RTX 2080 Super (Desktop) | |
| GeForce RTX 2080 (Desktop) | |
| Radeon VII | |
| GeForce RTX 2070 Super (Desktop) | |
| GeForce RTX 2070 (Desktop) | |
| Radeon RX 5700 XT (Desktop) | |
| GeForce RTX 2060 Super (Desktop) | |
| Radeon RX 5700 (Desktop) | |
| GeForce RTX 2060 (Desktop) | |
| RX Vega 64 | |
| baixo | média | alto | ultra | QHD | 4K | |
|---|---|---|---|---|---|---|
| GTA V (2015) | 187 | 187 | 184 | 130 | 122 | 136 |
| The Witcher 3 (2015) | 427 | 375 | 286 | 152 | 115 | |
| Dota 2 Reborn (2015) | 216.6 | 197.1 | 184.4 | 168.7 | 159.1 | |
| Rise of the Tomb Raider (2016) | 327 | 231 | 217 | 217 | 107 | |
| Final Fantasy XV Benchmark (2018) | 228 | 205 | 156 | 124 | 76.1 | |
| X-Plane 11.11 (2018) | 165 | 153 | 123 | 105 | ||
| Far Cry 5 (2018) | 184 | 162 | 155 | 145 | 137 | 95 |
| Strange Brigade (2018) | 567 | 416 | 336 | 289 | 220 | 135 |
| Shadow of the Tomb Raider (2018) | 227 | 206 | 198 | 185 | 147 | 83.9 |
| Battlefield V (2018) | 192 | 178 | 163 | 152 | 132 | 94.2 |
| Apex Legends (2019) | 144 | 144 | 144 | 144 | 144 | 143 |
| Far Cry New Dawn (2019) | 150 | 132 | 127 | 115 | 110 | 89 |
| Metro Exodus (2019) | 212 | 155 | 143 | 111 | 92.2 | 64.1 |
| The Division 2 (2019) | 240 | 197 | 168 | 140 | 107 | 65 |
| Anno 1800 (2019) | 142 | 139 | 99.3 | 54.1 | 52.5 | 46.3 |
| Rage 2 (2019) | 294 | 209 | 182 | 180 | 134 | 72.1 |
| Control (2019) | 240 | 196 | 155 | 106 | 56.2 | |
| Borderlands 3 (2019) | 165 | 143 | 129 | 128 | 103 | 61.5 |
| Star Wars Jedi Fallen Order (2019) | 134 | 132 | 133 | 132 | 92.9 | |
| Red Dead Redemption 2 (2019) | 167 | 154 | 135 | 96 | 81 | 56 |
| Hunt Showdown (2020) | 236 | 173 | 172 | 155 | 95.8 | |
| Doom Eternal (2020) | 283 | 277 | 270 | 268 | 248 | 153 |
| F1 2020 (2020) | 367 | 255 | 239 | 185 | 155 | 118 |
| Horizon Zero Dawn (2020) | 164 | 151 | 147 | 141 | 133 | 95 |
| Flight Simulator 2020 (2020) | 115 | 97.4 | 79.9 | 62.8 | 55.6 | 37.3 |
| Serious Sam 4 (2020) | 182.5 | 148.6 | 138.1 | 135.2 | 124.8 | 117 |
| Mafia Definitive Edition (2020) | 199 | 184 | 169 | 137 | 78.2 | |
| Star Wars Squadrons (2020) | 586 | 433 | 379 | 358 | 266 | 169 |
| FIFA 21 (2020) | 306 | 312 | 293 | 295 | 295 | 284 |
| Watch Dogs Legion (2020) | 147 | 146 | 125 | 103 | 81.6 | 54.1 |
| Dirt 5 (2020) | 176 | 121 | 111 | 111 | 69.1 | 55.3 |
Calcule o desempenho
Na LuxMark e ComputeMark, a Asus GeForce RTX 3080 ROG Strix Gaming OC pontua significativamente melhor do que os modelos de comparação mais antigos. Os testes SPECviewperf são destinados principalmente a estações de trabalho. Aqui, os modelos Quadro e FirePro geralmente oferecem mais desempenho devido às otimizações do driver. O Nvidia Titan RTX tem uma posição especial aqui, já que é idêntico em construção ao RTX 6000 da série Quadro. Em geral, oferece o melhor desempenho aqui, embora as novas placas gráficas Ampere ofereçam melhores valores em disciplinas individuais.
| LuxMark v2.0 64Bit | |
| Room GPUs-only | |
| Zotac Gaming GeForce RTX 3090 Trinity | |
| ASUS GeForce RTX 3080 ROG STRIX OC GAMING | |
| Nvidia Titan RTX | |
| MSI RTX 2080 Ti Gaming X Trio | |
| KFA2 GeForce RTX 2080 Ti EX | |
| AMD Radeon VII | |
| MSI RTX 2080 Gaming X Trio | |
| Nvidia GeForce RTX 2080 Super | |
| Nvidia GeForce RTX 2070 Super | |
| MSI RTX 2070 Gaming Z 8G | |
| Nvidia GeForce RTX 2060 Super | |
| MSI RTX 2060 Gaming Z 6G | |
| AMD Radeon RX 5700 XT | |
| AMD Radeon RX 5700 | |
| Sala GPUs-only | |
| Zotac Gaming GeForce RTX 3090 Trinity | |
| ASUS GeForce RTX 3080 ROG STRIX OC GAMING | |
| Nvidia Titan RTX | |
| MSI RTX 2080 Ti Gaming X Trio | |
| KFA2 GeForce RTX 2080 Ti EX | |
| MSI RTX 2080 Gaming X Trio | |
| Nvidia GeForce RTX 2080 Super | |
| Nvidia GeForce RTX 2070 Super | |
| MSI RTX 2070 Gaming Z 8G | |
| Nvidia GeForce RTX 2060 Super | |
| AMD Radeon VII | |
| AMD Radeon RX 5700 XT | |
| MSI RTX 2060 Gaming Z 6G | |
| AMD Radeon RX 5700 | |
| ComputeMark v2.1 | |
| 1024x600 Normal, QJuliaRayTrace | |
| Zotac Gaming GeForce RTX 3090 Trinity | |
| ASUS GeForce RTX 3080 ROG STRIX OC GAMING | |
| MSI RTX 2080 Ti Gaming X Trio | |
| Nvidia Titan RTX | |
| KFA2 GeForce RTX 2080 Ti EX | |
| MSI RTX 2080 Gaming X Trio | |
| Nvidia GeForce RTX 2080 Super | |
| Nvidia GeForce RTX 2070 Super | |
| AMD Radeon VII | |
| AMD Radeon RX 5700 XT | |
| MSI RTX 2070 Gaming Z 8G | |
| Nvidia GeForce RTX 2060 Super | |
| MSI RTX 2060 Gaming Z 6G | |
| AMD Radeon RX 5700 | |
| 1024x600 Normal, Mandel Scalar | |
| Zotac Gaming GeForce RTX 3090 Trinity | |
| ASUS GeForce RTX 3080 ROG STRIX OC GAMING | |
| AMD Radeon VII | |
| MSI RTX 2080 Ti Gaming X Trio | |
| Nvidia Titan RTX | |
| KFA2 GeForce RTX 2080 Ti EX | |
| AMD Radeon RX 5700 XT | |
| MSI RTX 2080 Gaming X Trio | |
| Nvidia GeForce RTX 2080 Super | |
| AMD Radeon RX 5700 | |
| Nvidia GeForce RTX 2070 Super | |
| MSI RTX 2070 Gaming Z 8G | |
| Nvidia GeForce RTX 2060 Super | |
| MSI RTX 2060 Gaming Z 6G | |
| 1024x600 Normal, Mandel Vector | |
| Zotac Gaming GeForce RTX 3090 Trinity | |
| ASUS GeForce RTX 3080 ROG STRIX OC GAMING | |
| MSI RTX 2080 Ti Gaming X Trio | |
| Nvidia Titan RTX | |
| AMD Radeon VII | |
| KFA2 GeForce RTX 2080 Ti EX | |
| AMD Radeon RX 5700 XT | |
| MSI RTX 2080 Gaming X Trio | |
| Nvidia GeForce RTX 2080 Super | |
| AMD Radeon RX 5700 | |
| Nvidia GeForce RTX 2070 Super | |
| MSI RTX 2070 Gaming Z 8G | |
| Nvidia GeForce RTX 2060 Super | |
| MSI RTX 2060 Gaming Z 6G | |
| 1024x600 Normal, Fluid 2DTexArr | |
| Zotac Gaming GeForce RTX 3090 Trinity | |
| ASUS GeForce RTX 3080 ROG STRIX OC GAMING | |
| Nvidia Titan RTX | |
| MSI RTX 2080 Ti Gaming X Trio | |
| KFA2 GeForce RTX 2080 Ti EX | |
| Nvidia GeForce RTX 2080 Super | |
| MSI RTX 2080 Gaming X Trio | |
| Nvidia GeForce RTX 2070 Super | |
| AMD Radeon VII | |
| MSI RTX 2070 Gaming Z 8G | |
| Nvidia GeForce RTX 2060 Super | |
| AMD Radeon RX 5700 XT | |
| AMD Radeon RX 5700 | |
| MSI RTX 2060 Gaming Z 6G | |
| 1024x600 Normal, Fluid 3DTex | |
| Zotac Gaming GeForce RTX 3090 Trinity | |
| ASUS GeForce RTX 3080 ROG STRIX OC GAMING | |
| Nvidia Titan RTX | |
| MSI RTX 2080 Ti Gaming X Trio | |
| AMD Radeon VII | |
| KFA2 GeForce RTX 2080 Ti EX | |
| Nvidia GeForce RTX 2080 Super | |
| MSI RTX 2080 Gaming X Trio | |
| Nvidia GeForce RTX 2070 Super | |
| MSI RTX 2070 Gaming Z 8G | |
| AMD Radeon RX 5700 XT | |
| AMD Radeon RX 5700 | |
| Nvidia GeForce RTX 2060 Super | |
| MSI RTX 2060 Gaming Z 6G | |
| 1024x600 Normal, Score | |
| Zotac Gaming GeForce RTX 3090 Trinity | |
| ASUS GeForce RTX 3080 ROG STRIX OC GAMING | |
| MSI RTX 2080 Ti Gaming X Trio | |
| Nvidia Titan RTX | |
| KFA2 GeForce RTX 2080 Ti EX | |
| AMD Radeon VII | |
| Nvidia GeForce RTX 2080 Super | |
| MSI RTX 2080 Gaming X Trio | |
| AMD Radeon RX 5700 XT | |
| Nvidia GeForce RTX 2070 Super | |
| MSI RTX 2070 Gaming Z 8G | |
| AMD Radeon RX 5700 | |
| Nvidia GeForce RTX 2060 Super | |
| MSI RTX 2060 Gaming Z 6G | |
| SPECviewperf 13 | |
| Solidworks (sw-04) | |
| Nvidia Titan RTX | |
| AMD Radeon RX 5700 XT | |
| MSI RTX 2080 Ti Gaming X Trio | |
| KFA2 GeForce RTX 2080 Ti EX | |
| Zotac Gaming GeForce RTX 3090 Trinity | |
| AMD Radeon RX 5700 | |
| MSI RTX 2080 Gaming X Trio | |
| Nvidia GeForce RTX 2080 Super | |
| AMD Radeon VII | |
| Nvidia GeForce RTX 2070 Super | |
| ASUS GeForce RTX 3080 ROG STRIX OC GAMING | |
| MSI RTX 2070 Gaming Z 8G | |
| MSI RTX 2060 Gaming Z 6G | |
| Nvidia GeForce RTX 2060 Super | |
| Siemens NX (snx-03) | |
| Nvidia Titan RTX | |
| AMD Radeon RX 5700 XT | |
| AMD Radeon RX 5700 | |
| AMD Radeon VII | |
| Zotac Gaming GeForce RTX 3090 Trinity | |
| ASUS GeForce RTX 3080 ROG STRIX OC GAMING | |
| MSI RTX 2080 Ti Gaming X Trio | |
| KFA2 GeForce RTX 2080 Ti EX | |
| Nvidia GeForce RTX 2080 Super | |
| MSI RTX 2080 Gaming X Trio | |
| Nvidia GeForce RTX 2070 Super | |
| MSI RTX 2070 Gaming Z 8G | |
| Nvidia GeForce RTX 2060 Super | |
| MSI RTX 2060 Gaming Z 6G | |
| Showcase (showcase-02) | |
| Zotac Gaming GeForce RTX 3090 Trinity | |
| Nvidia Titan RTX | |
| KFA2 GeForce RTX 2080 Ti EX | |
| MSI RTX 2080 Ti Gaming X Trio | |
| Nvidia GeForce RTX 2080 Super | |
| AMD Radeon RX 5700 XT | |
| Nvidia GeForce RTX 2070 Super | |
| AMD Radeon RX 5700 | |
| Nvidia GeForce RTX 2060 Super | |
| MSI RTX 2060 Gaming Z 6G | |
| Medical (medical-02) | |
| Zotac Gaming GeForce RTX 3090 Trinity | |
| ASUS GeForce RTX 3080 ROG STRIX OC GAMING | |
| Nvidia Titan RTX | |
| MSI RTX 2080 Ti Gaming X Trio | |
| AMD Radeon RX 5700 XT | |
| KFA2 GeForce RTX 2080 Ti EX | |
| AMD Radeon VII | |
| Nvidia GeForce RTX 2080 Super | |
| MSI RTX 2080 Gaming X Trio | |
| AMD Radeon RX 5700 | |
| Nvidia GeForce RTX 2070 Super | |
| MSI RTX 2070 Gaming Z 8G | |
| Nvidia GeForce RTX 2060 Super | |
| MSI RTX 2060 Gaming Z 6G | |
| Maya (maya-05) | |
| Zotac Gaming GeForce RTX 3090 Trinity | |
| MSI RTX 2080 Ti Gaming X Trio | |
| KFA2 GeForce RTX 2080 Ti EX | |
| Nvidia Titan RTX | |
| ASUS GeForce RTX 3080 ROG STRIX OC GAMING | |
| Nvidia GeForce RTX 2080 Super | |
| Nvidia GeForce RTX 2070 Super | |
| MSI RTX 2070 Gaming Z 8G | |
| Nvidia GeForce RTX 2060 Super | |
| MSI RTX 2060 Gaming Z 6G | |
| AMD Radeon RX 5700 XT | |
| AMD Radeon VII | |
| AMD Radeon RX 5700 | |
| Energy (energy-02) | |
| Nvidia Titan RTX | |
| Zotac Gaming GeForce RTX 3090 Trinity | |
| ASUS GeForce RTX 3080 ROG STRIX OC GAMING | |
| AMD Radeon VII | |
| MSI RTX 2080 Ti Gaming X Trio | |
| KFA2 GeForce RTX 2080 Ti EX | |
| AMD Radeon RX 5700 XT | |
| AMD Radeon RX 5700 | |
| Nvidia GeForce RTX 2080 Super | |
| Nvidia GeForce RTX 2070 Super | |
| MSI RTX 2070 Gaming Z 8G | |
| Nvidia GeForce RTX 2060 Super | |
| MSI RTX 2060 Gaming Z 6G | |
| Creo (creo-02) | |
| Zotac Gaming GeForce RTX 3090 Trinity | |
| Nvidia Titan RTX | |
| MSI RTX 2080 Ti Gaming X Trio | |
| KFA2 GeForce RTX 2080 Ti EX | |
| ASUS GeForce RTX 3080 ROG STRIX OC GAMING | |
| MSI RTX 2080 Gaming X Trio | |
| Nvidia GeForce RTX 2080 Super | |
| MSI RTX 2070 Gaming Z 8G | |
| Nvidia GeForce RTX 2060 Super | |
| Nvidia GeForce RTX 2070 Super | |
| MSI RTX 2060 Gaming Z 6G | |
| AMD Radeon RX 5700 XT | |
| AMD Radeon RX 5700 | |
| AMD Radeon VII | |
| Catia (catia-05) | |
| Nvidia Titan RTX | |
| AMD Radeon RX 5700 XT | |
| AMD Radeon VII | |
| AMD Radeon RX 5700 | |
| Zotac Gaming GeForce RTX 3090 Trinity | |
| ASUS GeForce RTX 3080 ROG STRIX OC GAMING | |
| MSI RTX 2080 Ti Gaming X Trio | |
| KFA2 GeForce RTX 2080 Ti EX | |
| Nvidia GeForce RTX 2080 Super | |
| Nvidia GeForce RTX 2070 Super | |
| MSI RTX 2070 Gaming Z 8G | |
| Nvidia GeForce RTX 2060 Super | |
| MSI RTX 2060 Gaming Z 6G | |
| 3ds Max (3dsmax-06) | |
| Zotac Gaming GeForce RTX 3090 Trinity | |
| MSI RTX 2080 Ti Gaming X Trio | |
| KFA2 GeForce RTX 2080 Ti EX | |
| Nvidia Titan RTX | |
| ASUS GeForce RTX 3080 ROG STRIX OC GAMING | |
| Nvidia GeForce RTX 2080 Super | |
| Nvidia GeForce RTX 2070 Super | |
| MSI RTX 2070 Gaming Z 8G | |
| Nvidia GeForce RTX 2060 Super | |
| MSI RTX 2060 Gaming Z 6G | |
| AMD Radeon RX 5700 XT | |
| AMD Radeon VII | |
| AMD Radeon RX 5700 | |
| SPECviewperf 12 | |
| 1900x1060 Solidworks (sw-03) | |
| Nvidia Titan RTX | |
| AMD Radeon RX 5700 XT | |
| MSI RTX 2080 Ti Gaming X Trio | |
| AMD Radeon RX 5700 | |
| KFA2 GeForce RTX 2080 Ti EX | |
| Zotac Gaming GeForce RTX 3090 Trinity | |
| AMD Radeon VII | |
| ASUS GeForce RTX 3080 ROG STRIX OC GAMING | |
| Nvidia GeForce RTX 2080 Super | |
| MSI RTX 2080 Gaming X Trio | |
| Nvidia GeForce RTX 2070 Super | |
| MSI RTX 2070 Gaming Z 8G | |
| Nvidia GeForce RTX 2060 Super | |
| MSI RTX 2060 Gaming Z 6G | |
| 1900x1060 Siemens NX (snx-02) | |
| Nvidia Titan RTX | |
| AMD Radeon RX 5700 XT | |
| AMD Radeon RX 5700 | |
| AMD Radeon VII | |
| ASUS GeForce RTX 3080 ROG STRIX OC GAMING | |
| Zotac Gaming GeForce RTX 3090 Trinity | |
| MSI RTX 2080 Ti Gaming X Trio | |
| Nvidia GeForce RTX 2080 Super | |
| KFA2 GeForce RTX 2080 Ti EX | |
| MSI RTX 2080 Gaming X Trio | |
| Nvidia GeForce RTX 2070 Super | |
| MSI RTX 2070 Gaming Z 8G | |
| Nvidia GeForce RTX 2060 Super | |
| MSI RTX 2060 Gaming Z 6G | |
| 1900x1060 Showcase (showcase-01) | |
| Zotac Gaming GeForce RTX 3090 Trinity | |
| ASUS GeForce RTX 3080 ROG STRIX OC GAMING | |
| Nvidia Titan RTX | |
| MSI RTX 2080 Ti Gaming X Trio | |
| KFA2 GeForce RTX 2080 Ti EX | |
| Nvidia GeForce RTX 2080 Super | |
| AMD Radeon RX 5700 XT | |
| Nvidia GeForce RTX 2070 Super | |
| AMD Radeon RX 5700 | |
| Nvidia GeForce RTX 2060 Super | |
| MSI RTX 2060 Gaming Z 6G | |
| 1900x1060 Medical (medical-01) | |
| Nvidia Titan RTX | |
| Zotac Gaming GeForce RTX 3090 Trinity | |
| AMD Radeon VII | |
| MSI RTX 2080 Ti Gaming X Trio | |
| ASUS GeForce RTX 3080 ROG STRIX OC GAMING | |
| KFA2 GeForce RTX 2080 Ti EX | |
| AMD Radeon RX 5700 XT | |
| Nvidia GeForce RTX 2080 Super | |
| MSI RTX 2080 Gaming X Trio | |
| Nvidia GeForce RTX 2070 Super | |
| AMD Radeon RX 5700 | |
| MSI RTX 2070 Gaming Z 8G | |
| Nvidia GeForce RTX 2060 Super | |
| MSI RTX 2060 Gaming Z 6G | |
| 1900x1060 Maya (maya-04) | |
| ASUS GeForce RTX 3080 ROG STRIX OC GAMING | |
| MSI RTX 2080 Ti Gaming X Trio | |
| KFA2 GeForce RTX 2080 Ti EX | |
| Zotac Gaming GeForce RTX 3090 Trinity | |
| MSI RTX 2080 Gaming X Trio | |
| Nvidia GeForce RTX 2060 Super | |
| MSI RTX 2070 Gaming Z 8G | |
| Nvidia GeForce RTX 2080 Super | |
| Nvidia Titan RTX | |
| MSI RTX 2060 Gaming Z 6G | |
| Nvidia GeForce RTX 2070 Super | |
| AMD Radeon VII | |
| AMD Radeon RX 5700 XT | |
| AMD Radeon RX 5700 | |
| 1900x1060 Energy (energy-01) | |
| Nvidia Titan RTX | |
| Zotac Gaming GeForce RTX 3090 Trinity | |
| ASUS GeForce RTX 3080 ROG STRIX OC GAMING | |
| MSI RTX 2080 Ti Gaming X Trio | |
| AMD Radeon VII | |
| KFA2 GeForce RTX 2080 Ti EX | |
| Nvidia GeForce RTX 2080 Super | |
| AMD Radeon RX 5700 XT | |
| MSI RTX 2080 Gaming X Trio | |
| Nvidia GeForce RTX 2070 Super | |
| AMD Radeon RX 5700 | |
| MSI RTX 2070 Gaming Z 8G | |
| Nvidia GeForce RTX 2060 Super | |
| MSI RTX 2060 Gaming Z 6G | |
| 1900x1060 Creo (creo-01) | |
| Nvidia Titan RTX | |
| ASUS GeForce RTX 3080 ROG STRIX OC GAMING | |
| Zotac Gaming GeForce RTX 3090 Trinity | |
| AMD Radeon RX 5700 XT | |
| MSI RTX 2080 Ti Gaming X Trio | |
| KFA2 GeForce RTX 2080 Ti EX | |
| AMD Radeon RX 5700 | |
| AMD Radeon VII | |
| Nvidia GeForce RTX 2080 Super | |
| MSI RTX 2080 Gaming X Trio | |
| Nvidia GeForce RTX 2070 Super | |
| MSI RTX 2070 Gaming Z 8G | |
| MSI RTX 2060 Gaming Z 6G | |
| Nvidia GeForce RTX 2060 Super | |
| 1900x1060 Catia (catia-04) | |
| Nvidia Titan RTX | |
| AMD Radeon VII | |
| AMD Radeon RX 5700 XT | |
| AMD Radeon RX 5700 | |
| Zotac Gaming GeForce RTX 3090 Trinity | |
| ASUS GeForce RTX 3080 ROG STRIX OC GAMING | |
| MSI RTX 2080 Ti Gaming X Trio | |
| KFA2 GeForce RTX 2080 Ti EX | |
| MSI RTX 2080 Gaming X Trio | |
| Nvidia GeForce RTX 2080 Super | |
| Nvidia GeForce RTX 2070 Super | |
| MSI RTX 2070 Gaming Z 8G | |
| Nvidia GeForce RTX 2060 Super | |
| MSI RTX 2060 Gaming Z 6G | |
| 1900x1060 3ds Max (3dsmax-05) | |
| Zotac Gaming GeForce RTX 3090 Trinity | |
| ASUS GeForce RTX 3080 ROG STRIX OC GAMING | |
| MSI RTX 2080 Ti Gaming X Trio | |
| Nvidia Titan RTX | |
| KFA2 GeForce RTX 2080 Ti EX | |
| MSI RTX 2080 Gaming X Trio | |
| Nvidia GeForce RTX 2080 Super | |
| Nvidia GeForce RTX 2070 Super | |
| MSI RTX 2070 Gaming Z 8G | |
| Nvidia GeForce RTX 2060 Super | |
| MSI RTX 2060 Gaming Z 6G | |
| AMD Radeon RX 5700 XT | |
| AMD Radeon VII | |
| AMD Radeon RX 5700 | |
Emissões da Asus GeForce RTX 3080 ROG Strix Gaming OC
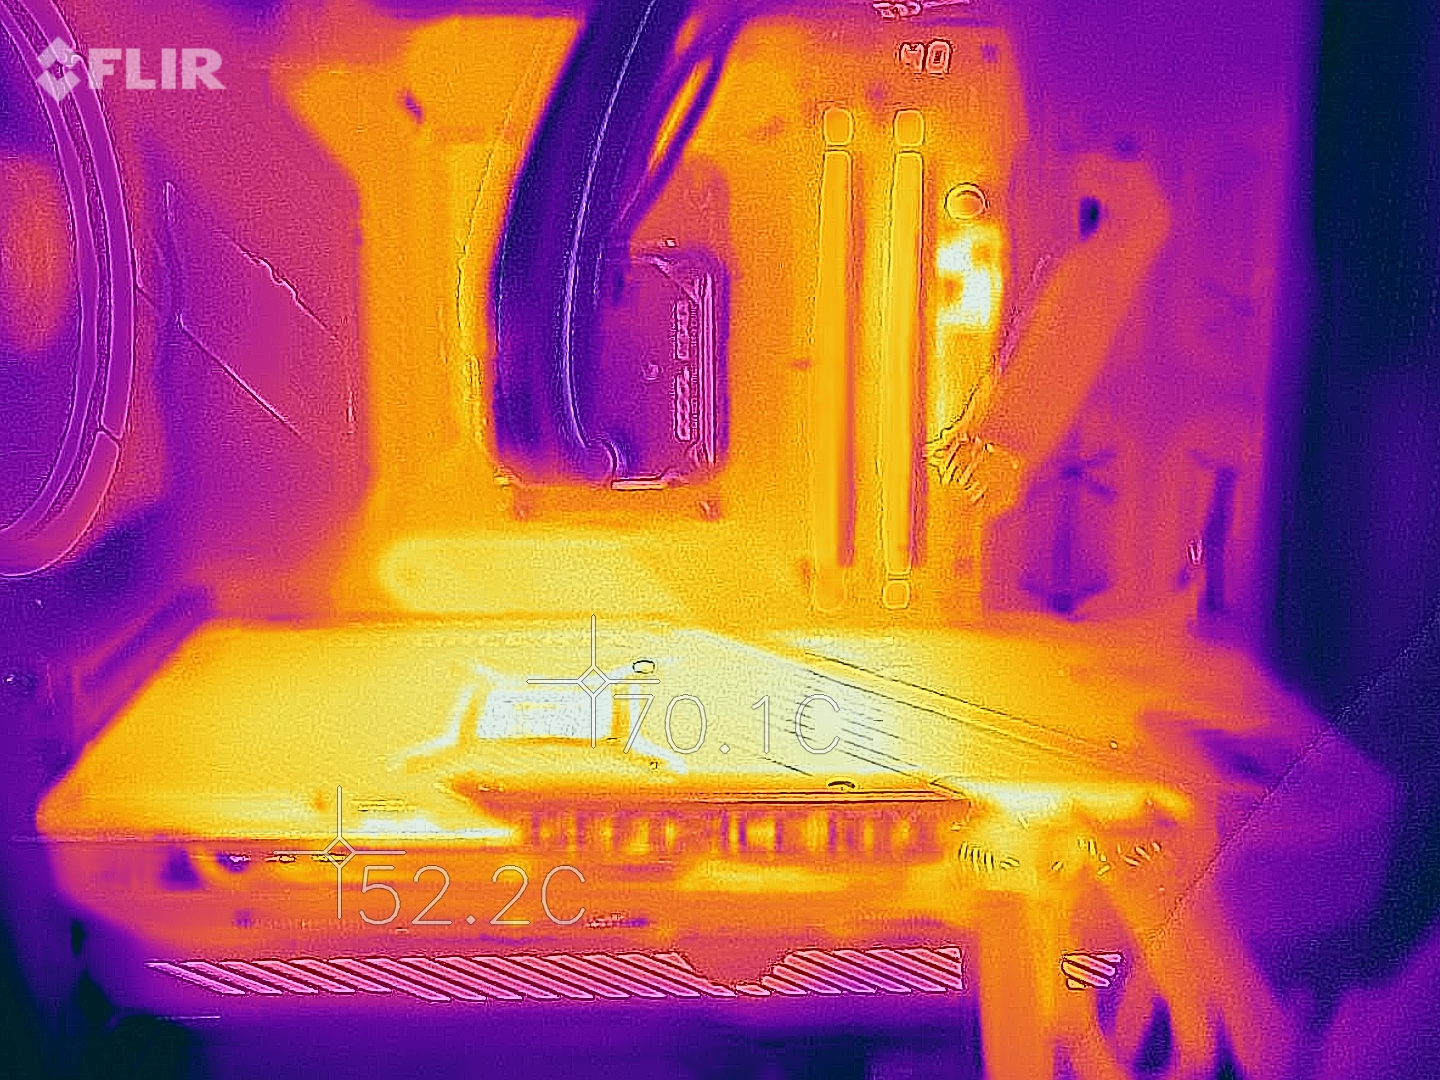
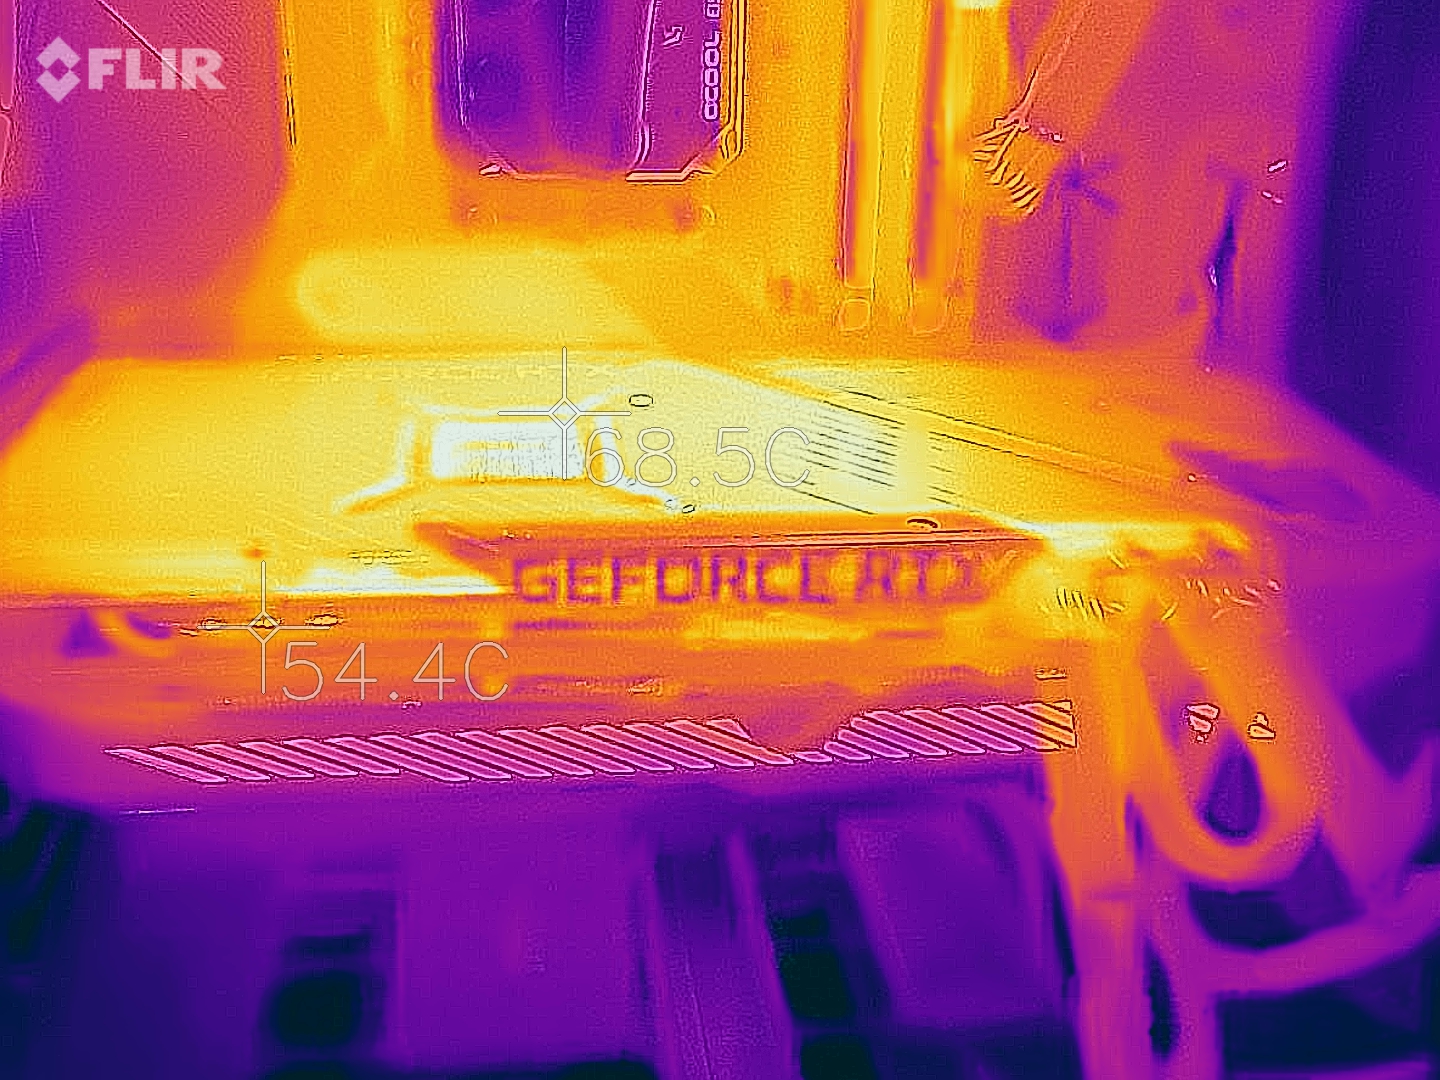
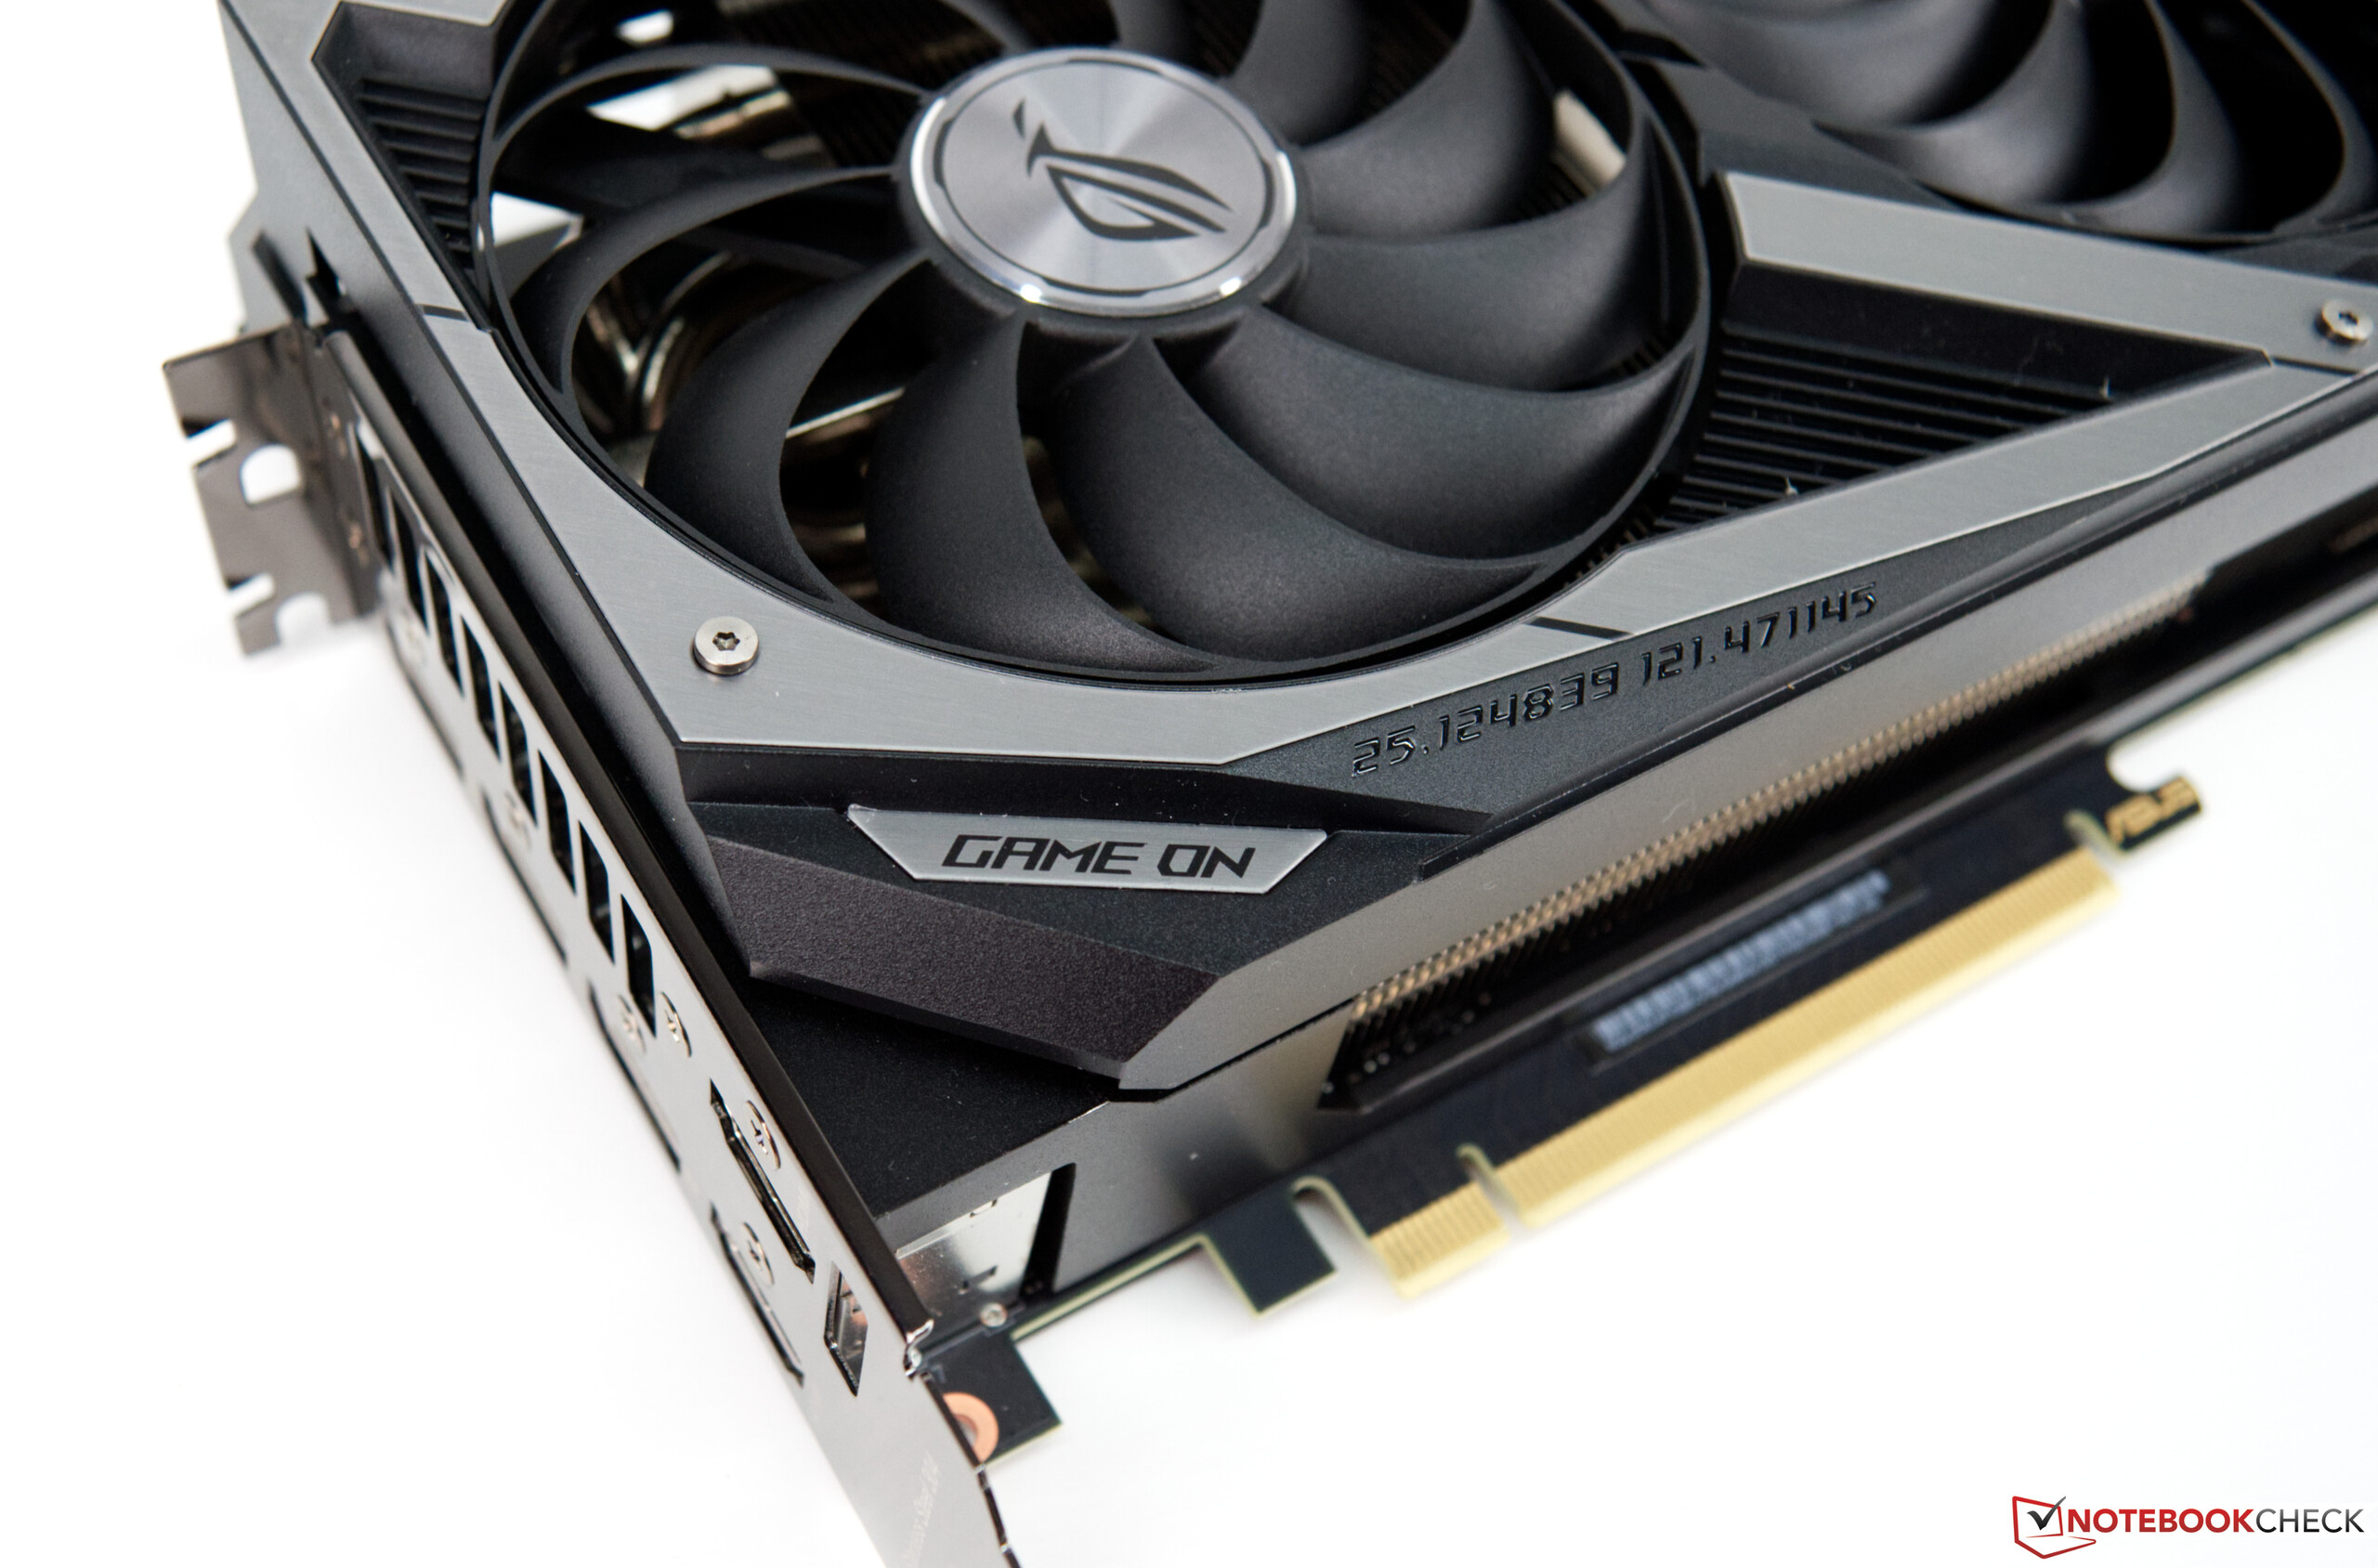
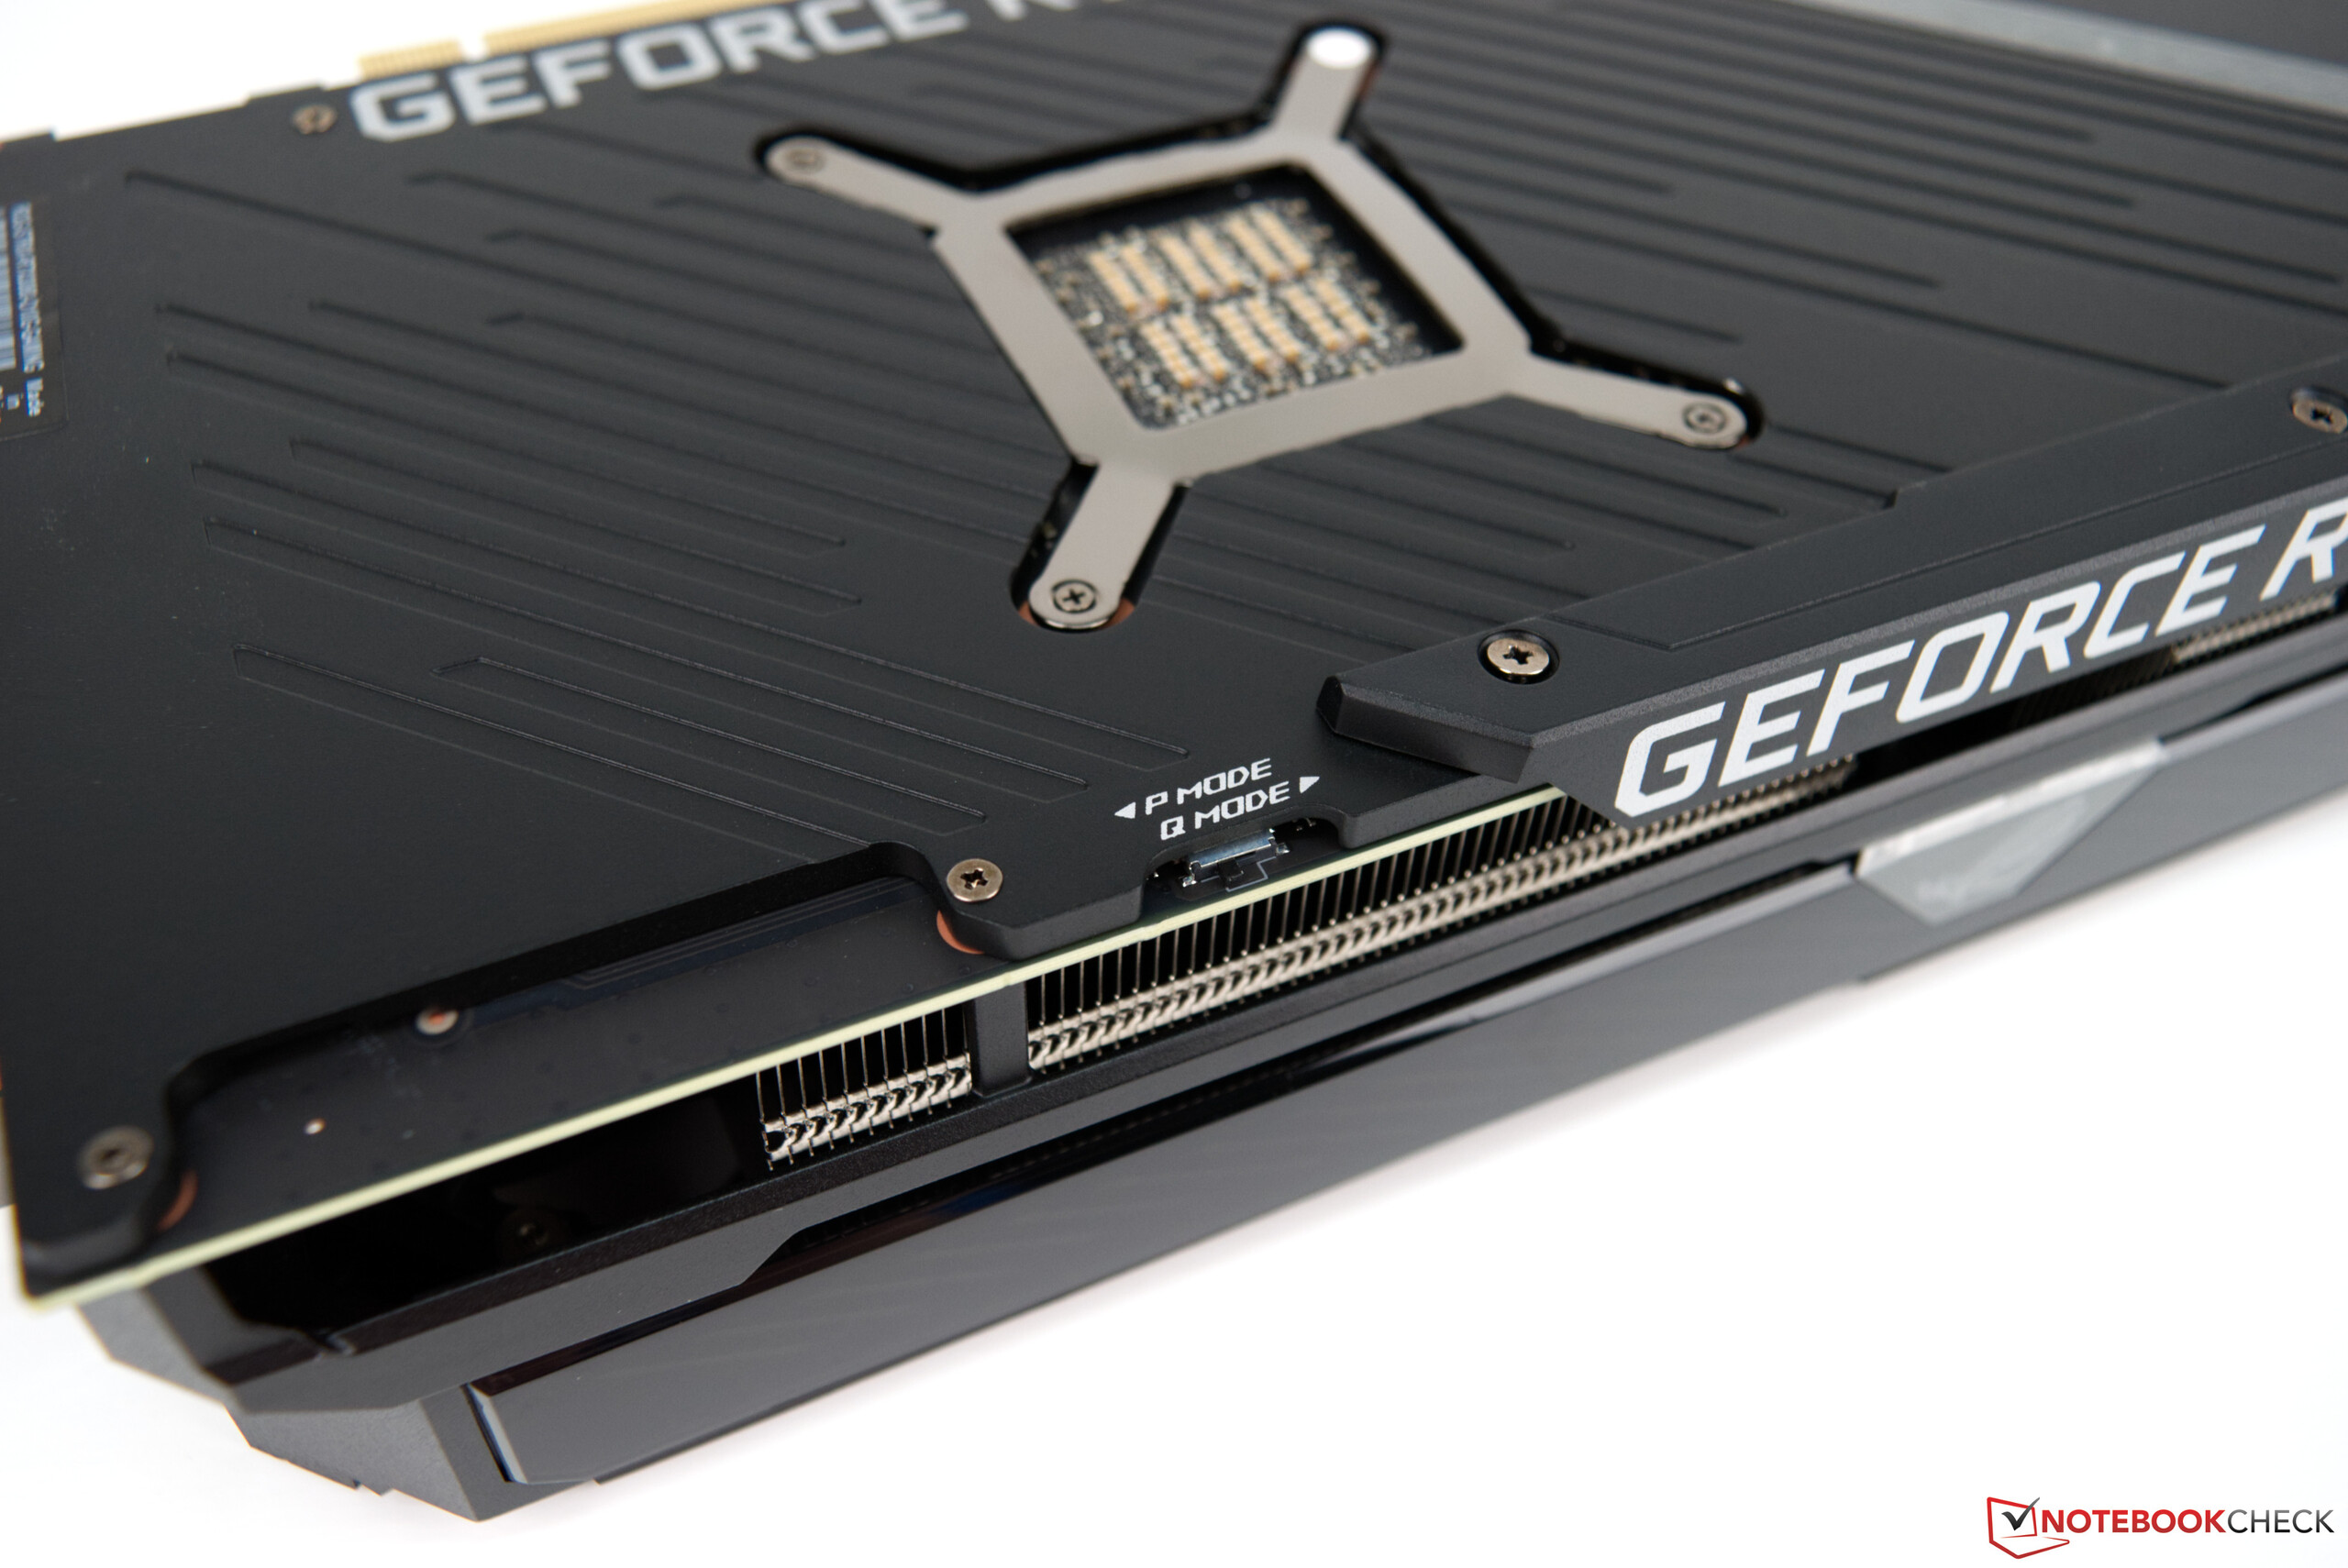
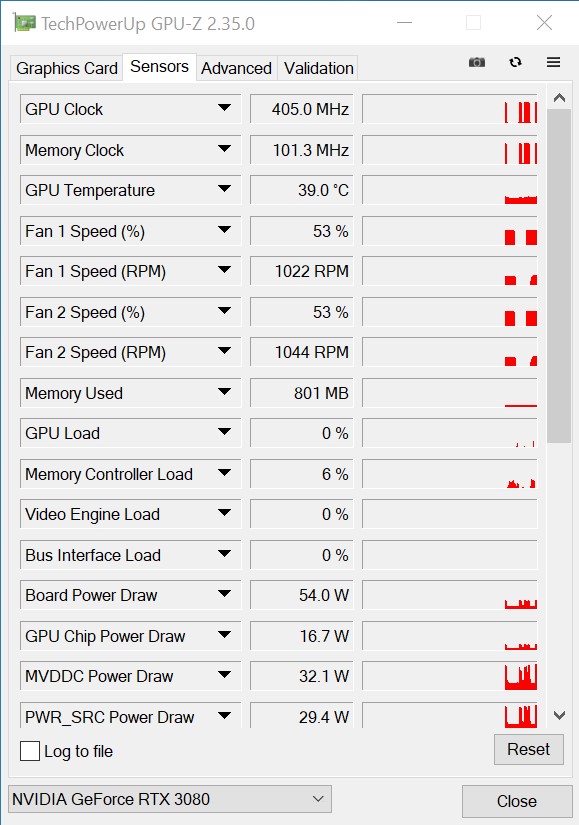
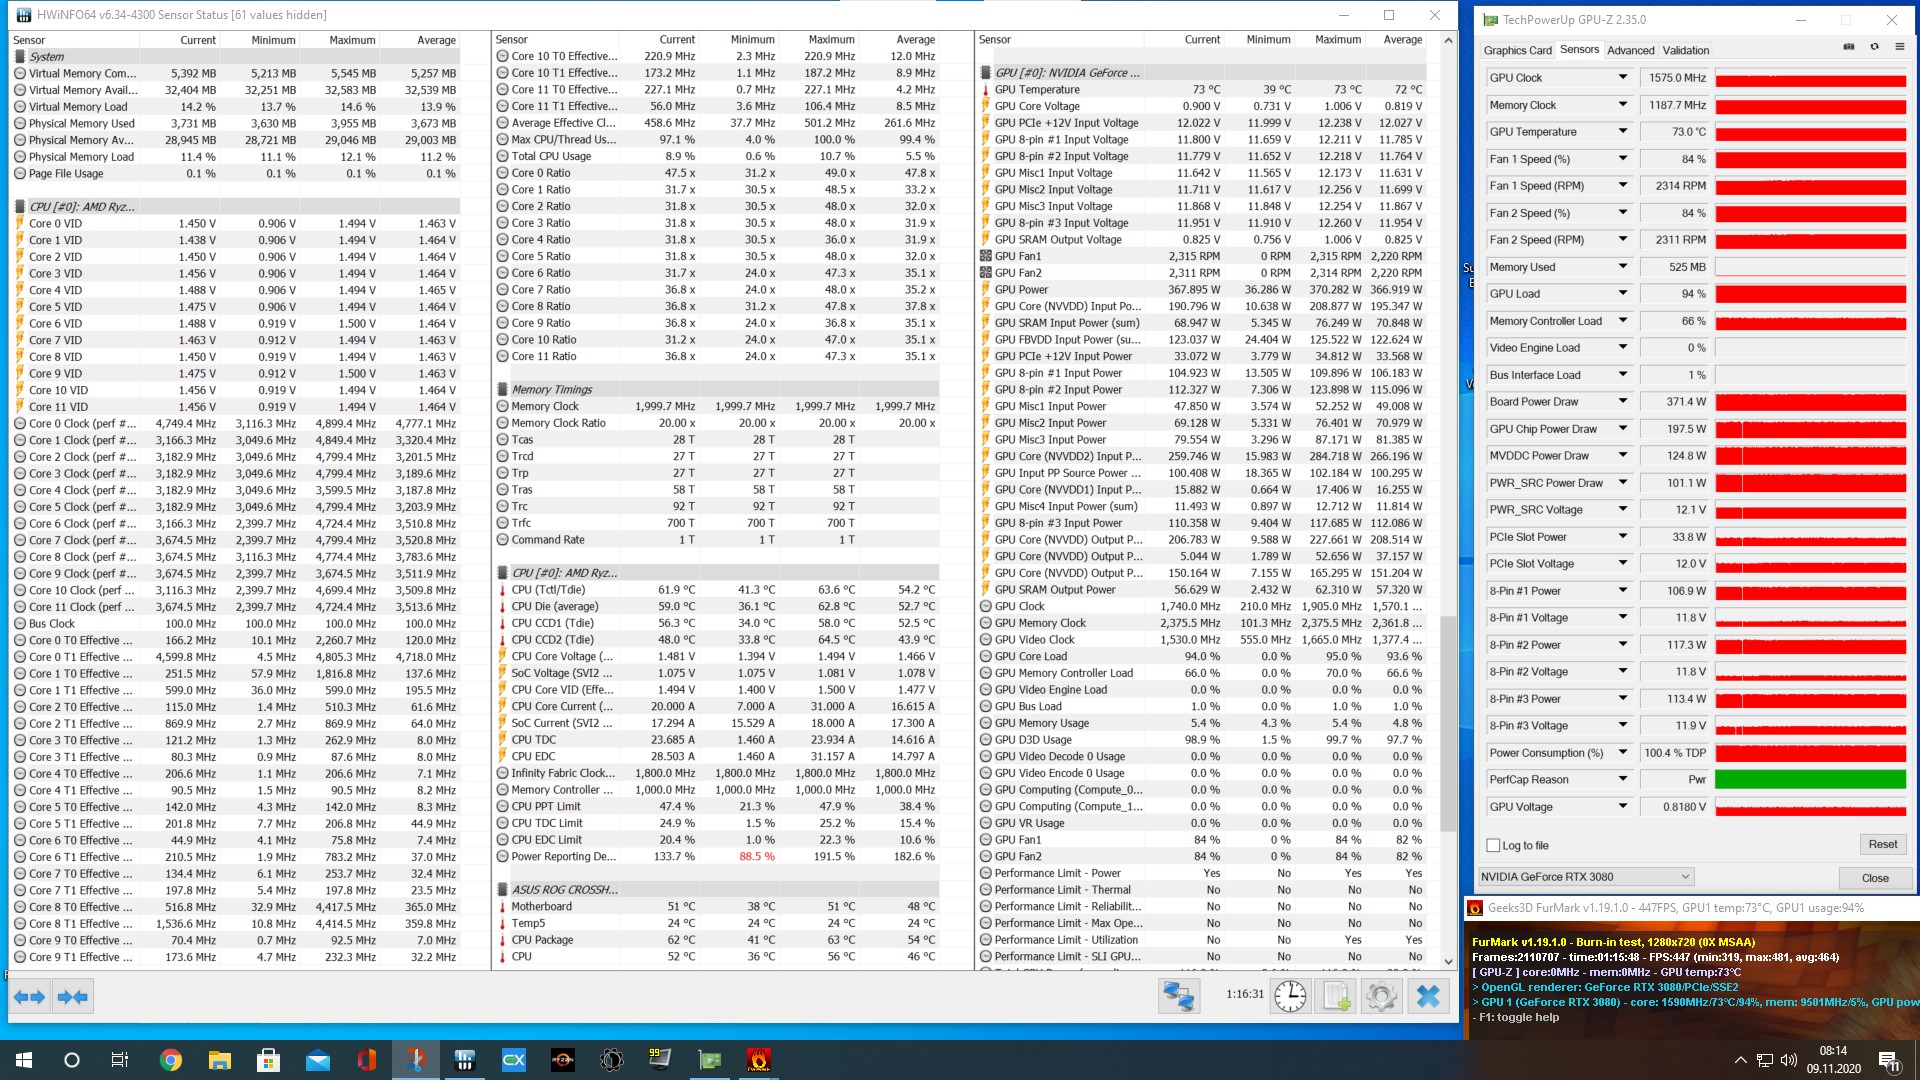
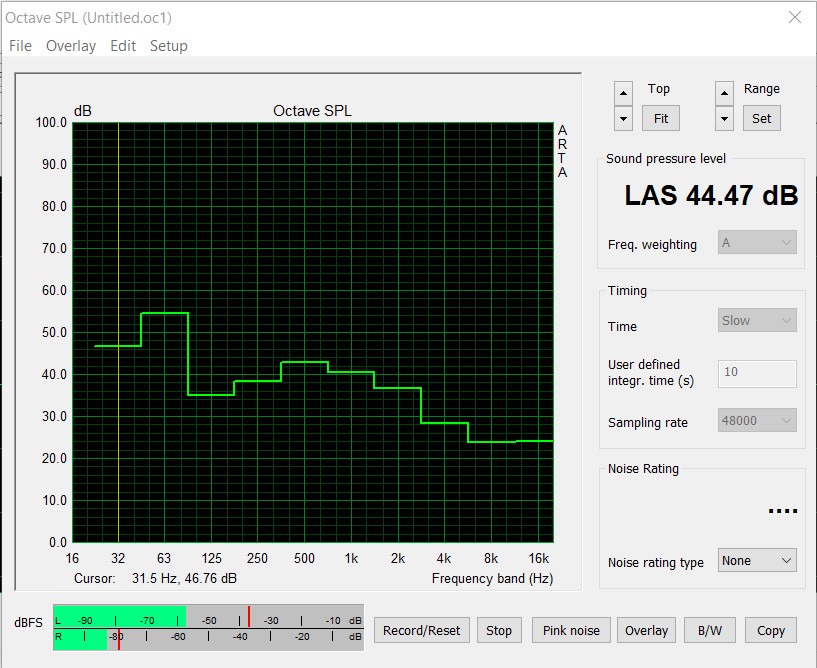
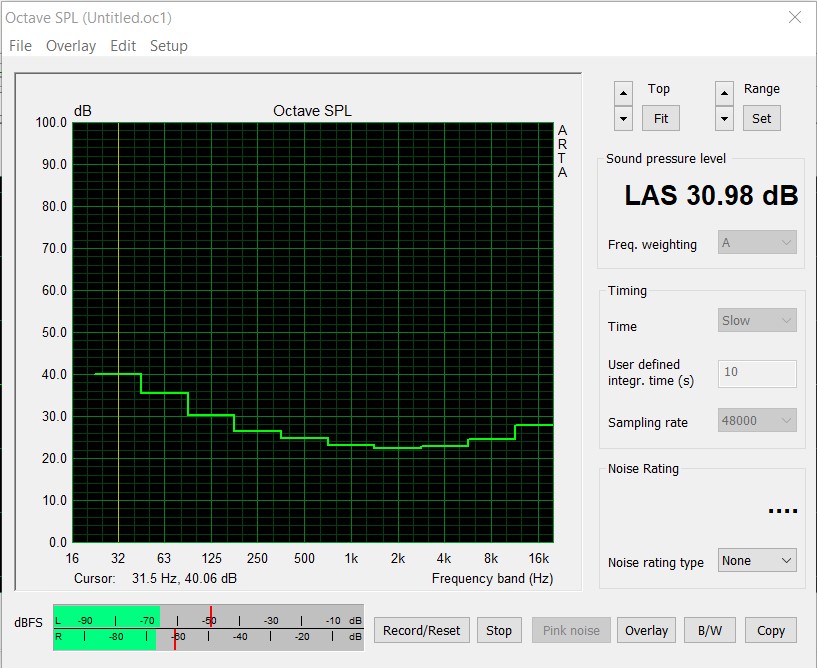
A Asus GeForce RTX 3080 ROG Strix Gaming OC não é de forma alguma uma placa gráfica que economiza energia. Mas com um TDP de 320 watts, está no mesmo nível da edição dos fundadores. O refrigerador extremamente saliente é ventilado por três ventiladores axiais, e isto foi compensado com boas temperaturas no teste. Vale mencionar que o ventilador do meio gira na direção oposta aos dois laterais. No teste de esforço com a caixa fechada, a placa gráfica aqueceu até 73 °C (~163 °F), o que definitivamente pode ser considerado como um resultado muito bom. Além disso, o nível de ruído não é muito alto, mesmo quando os ventiladores giram a umas boas 2.300 rotações por minuto. Com nosso sistema de medição, fomos capazes de detectar cerca de 44 dB(A). Em uso ocioso, a placa gráfica é completamente silenciosa devido ao modo de parada dos ventiladores. O lamento da bobina baixa ocorre de tempos em tempos, assim que as taxas de quadros nos menus excedem 1.000. Em geral, a questão não está tão presente na Asus GeForce RTX 3080 ROG Strix Gaming OC quanto em outras placas gráficas que já testamos.
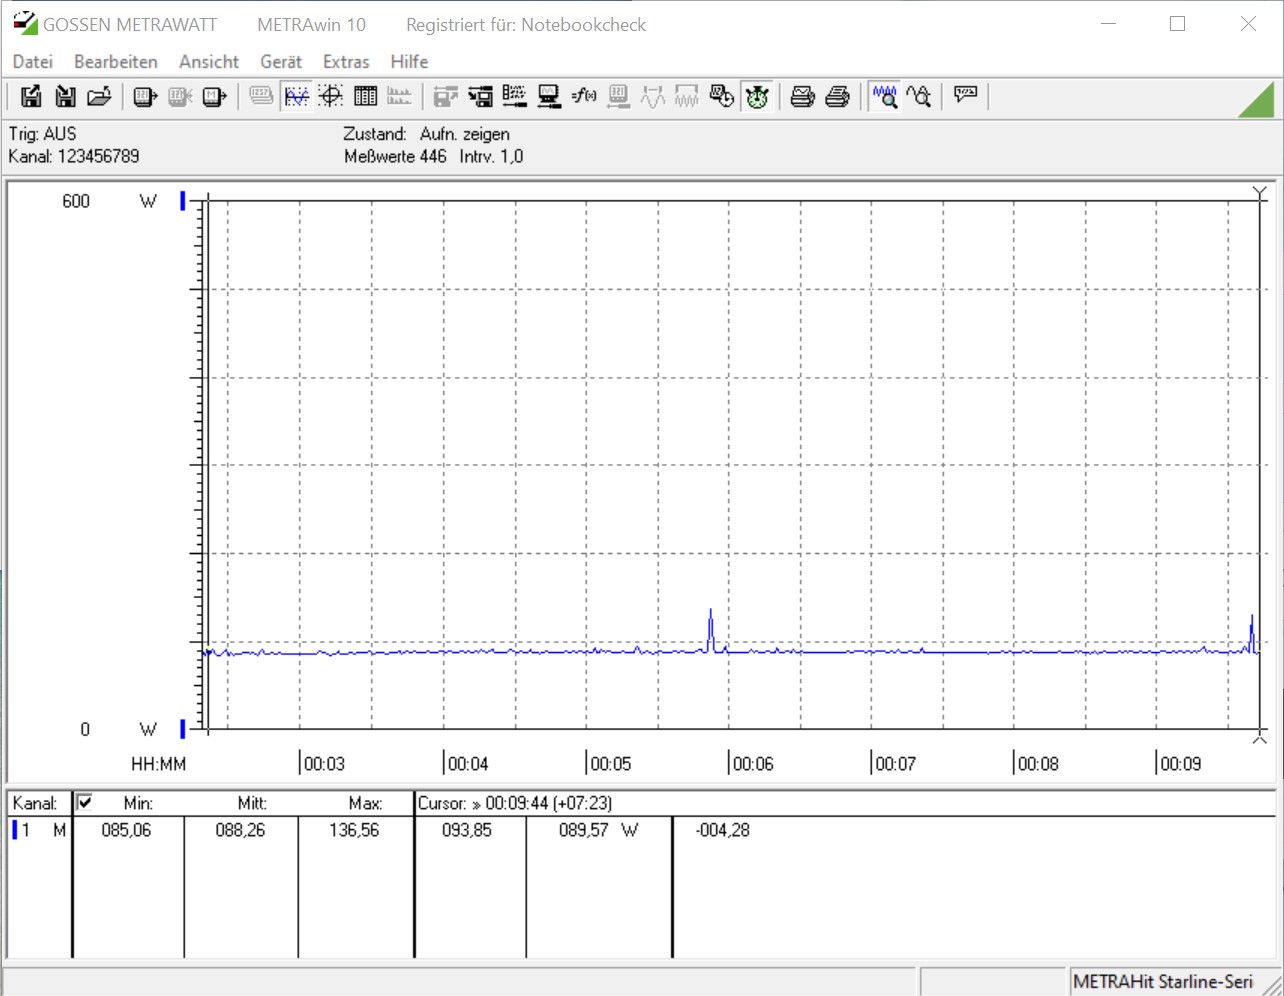
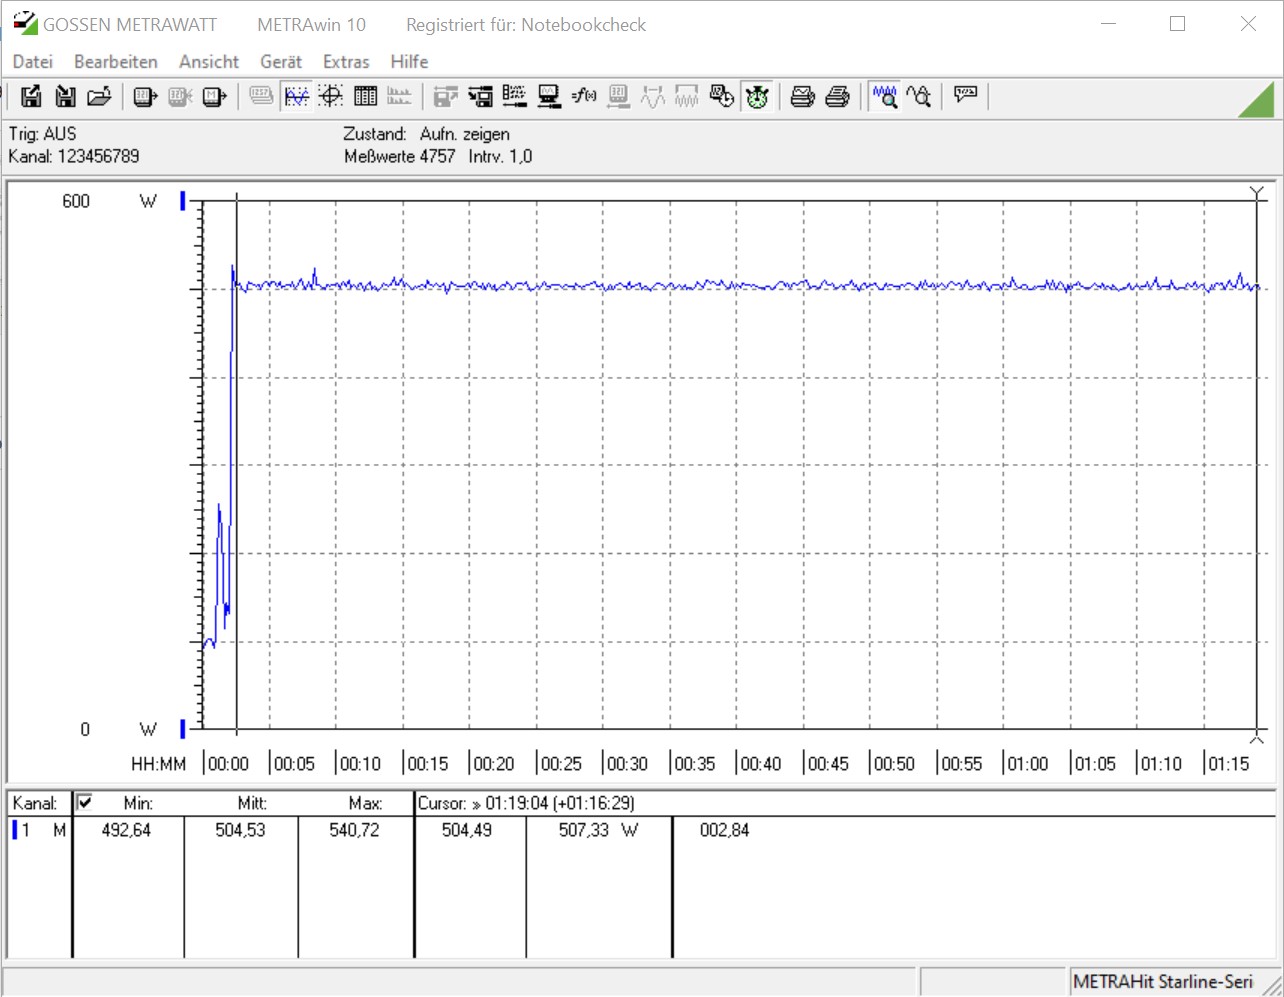
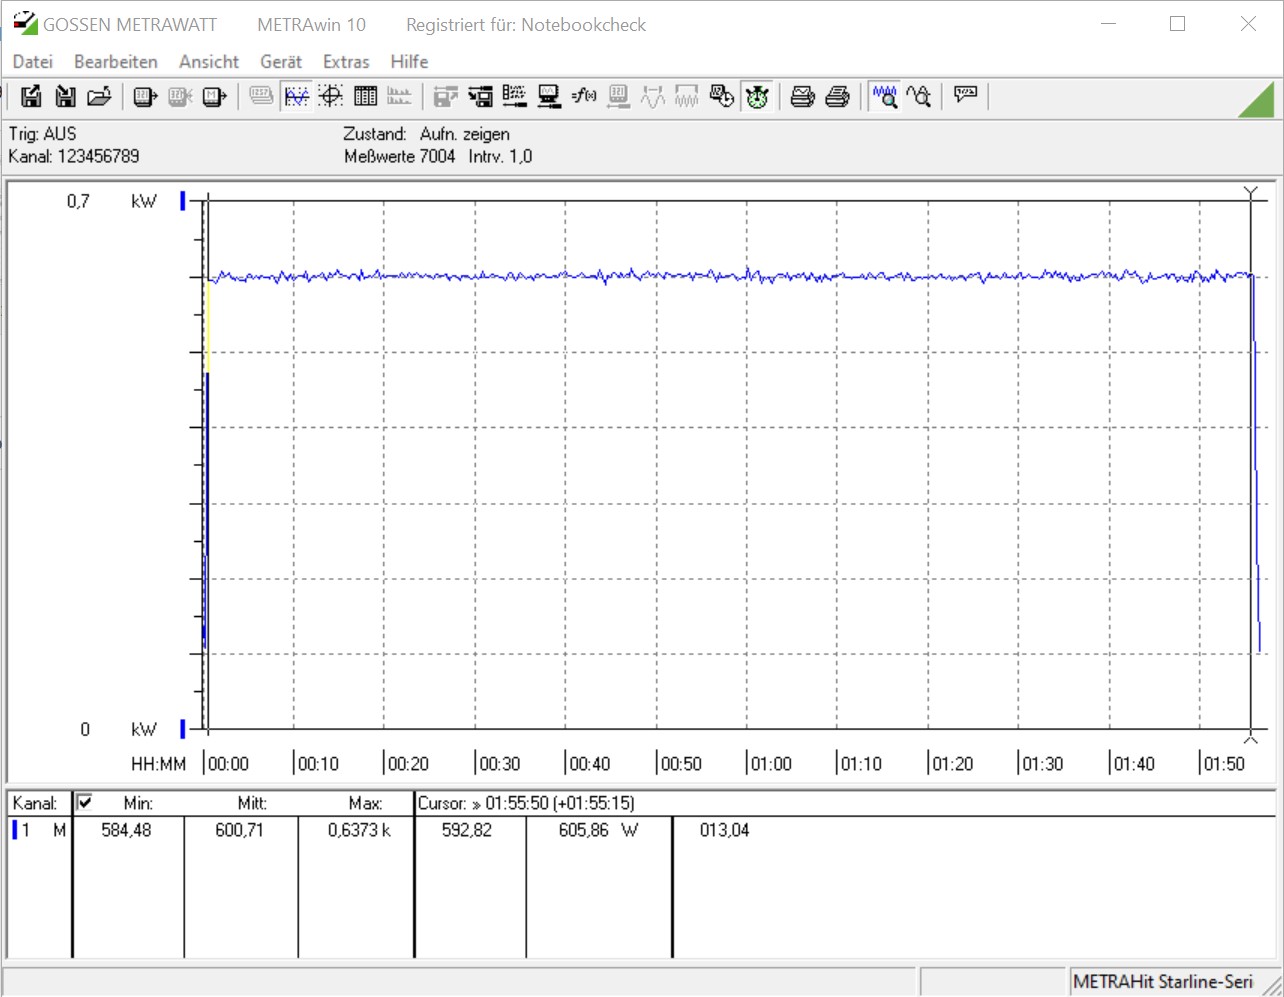
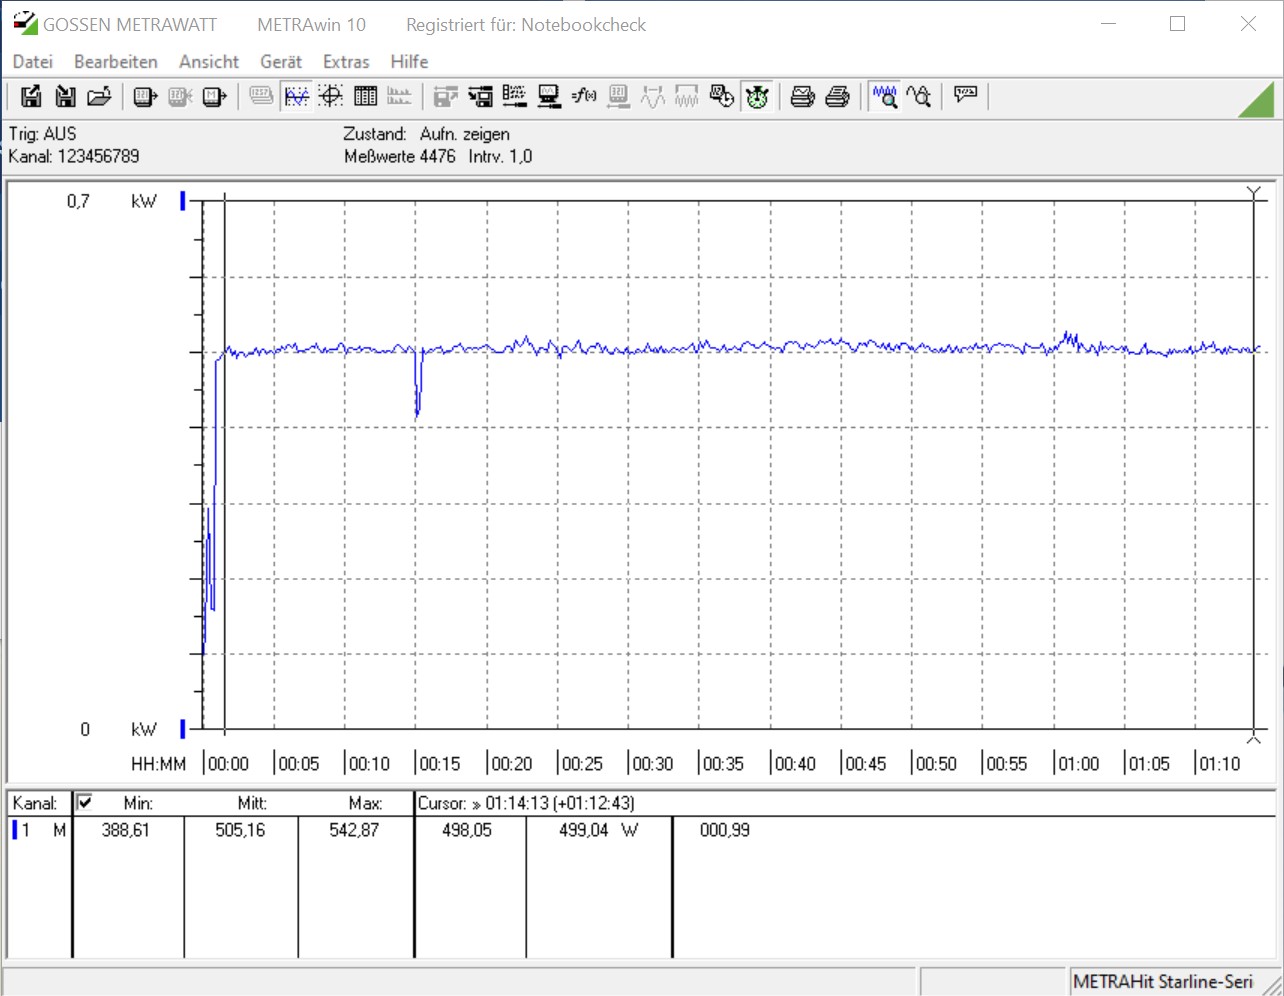
A GeForce RTX 3080 está bastante sedenta de energia em termos de consumo de energia. Só de olhar para a placa gráfica rapidamente revela que aqui é necessária uma unidade de fornecimento de energia forte, já que a Asus GeForce RTX 3080 ROG Strix Gaming OC requer três conexões de energia de 8 pinos. Com cerca de 505 watts, medimos valores quase idênticos para todo o sistema sob carga, tanto no teste de estresse quanto no teste de jogo. Se agora aumentarmos a meta de potência para 121%, nosso dispositivo de medição mostra pouco mais de 600 watts no teste de estresse. Consequentemente, não é surpreendente que o Asus especifique uma recomendação de fornecimento de energia de pelo menos 850 watts.
| Power Consumption | |
| 1920x1080 The Witcher 3 ultra (external Monitor) | |
| ASUS GeForce RTX 3080 ROG STRIX OC GAMING (Idle: 88.3 W) | |
| KFA2 GeForce RTX 2080 Ti EX (Idle: 100.5 W) | |
| AMD Radeon RX Vega 64 (Idle: 74.3 W) | |
| MSI RTX 2080 Gaming X Trio (Idle: 87.78 W) | |
| Nvidia GeForce RTX 2080 Super (Idle: 78.87 W) | |
| AMD Radeon RX 5700 XT (Idle: 69.8 W) | |
| Nvidia GeForce RTX 2070 Super (96.8 fps, Idle: 80.5 W) | |
| MSI RTX 2070 Gaming Z 8G (Idle: 73.3 W) | |
| AMD Radeon VII (Idle: 81.39 W) | |
| Nvidia GeForce RTX 2060 Super (82.7 fps, Idle: 77.12 W) | |
| AMD Radeon RX 5700 (84.2 fps, Idle: 64.5 W) | |
| MSI RTX 2060 Gaming Z 6G (Idle: 74.66 W) | |
| 1280x720 FurMark 1.19 GPU Stress Test (external Monitor) | |
| ASUS GeForce RTX 3080 ROG STRIX OC GAMING (Idle: 88.3 W) | |
| AMD Radeon VII (Idle: 81.39 W) | |
| MSI RTX 2080 Gaming X Trio | |
| KFA2 GeForce RTX 2080 Ti EX (Idle: 100.5 W) | |
| Nvidia GeForce RTX 2080 Super (Idle: 78.87 W) | |
| MSI RTX 2070 Gaming Z 8G (Idle: 73.3 W) | |
| AMD Radeon RX 5700 XT (239 fps, Idle: 69.8 W) | |
| Nvidia GeForce RTX 2070 Super (283 fps, Idle: 80.5 W) | |
| MSI RTX 2060 Gaming Z 6G (Idle: 74.66 W) | |
| Nvidia GeForce RTX 2060 Super (237 fps, Idle: 77.12 W) | |
| AMD Radeon RX 5700 (207 fps, Idle: 64.5 W) | |
* ... menor é melhor
Pro
Contra
Veredicto - Rápido e silencioso sob carga

Com a GeForce RTX 3080 ROG Strix Gaming OC, a Asus sem dúvida tem uma placa gráfica muito rápida no mercado. Todos os jogos mais recentes podem ser jogados sem problemas com ela. Mas esta placa gráfica só começa a se sentir bem quando vai além de uma resolução nativa de 1080p. A atual geração Ampere pode se distinguir claramente da Turing aqui. Se você adicionar DLSS ou Ray Tracing no topo, a vantagem da arquitetura mais nova se torna ainda maior. Entretanto, os usuários devem viver com desvantagens em comparação com um RTX 2080 Ti em termos de VRAM, pois com 10 GB no RTX 3080, este é menor do que no 2080 Ti (11 GB). A longo prazo, porém, isso pode se tornar a queda do RTX 3080, porque a AMD já anunciou seus três modelos top da série 6000 e usa consistentemente 16 GB de VRAM aqui. O moinho de rumores da Nvidia está zumbindo, e um RTX3080 Ti com mais shaders e 20 GB de VRAM já deveria estar em funcionamento.
Mas de que adianta uma placa gráfica rápida se ela não está disponível para compra? A Nvidia e, portanto, seus parceiros de placa também, já desperdiçaram muito potencial aqui, porque a demanda ainda não pode ser atendida. De acordo com relatórios internos, espera-se que esta situação continue em 2021.
A Asus GeForce RTX 3080 ROG Strix Gaming OC é uma das placas gráficas RTX 3080 mais rápidas que também vem com bom resfriamento. A unidade de resfriamento bem pensada é convincente, e com a discreta iluminação RGB, também há algo para se banquetear.
Aqueles que já conseguiram colocar as mãos em um modelo RTX 3080 serão recompensados com uma boa quantidade de potência gráfica. Mas isto também resulta em um alto consumo de energia, que deve ser considerado ao comprar. A escolha correta da unidade de fornecimento de energia é importante aqui para não sofrer com as feias quedas do sistema sob carga. A Asus recomenda pelo menos uma fonte de alimentação de 850 watts para nossa amostra de teste.
A Asus GeForce RTX 3080 ROG Strix Gaming OC tem atualmente um preço de 999 euros (~$1.185). Isso é 300 Euros (~$356) a mais do que o MSRP da Edição Founders; mas as pequenas quantidades impulsionam os preços extremamente altos, de modo que mesmo a Edição Founders é parcialmente oferecida a mais de 1.000 Euros (~$1.186). Nosso conselho é, portanto, esperar e ver o que a concorrência faz, para que você não se arrependa de sua decisão de compra mais tarde.
Todas as referências e valores de teste para o RTX 3080 podem ser encontrados nosite da placa gráfica para a GeForce RTX 3080 (atualizada regularmente).

