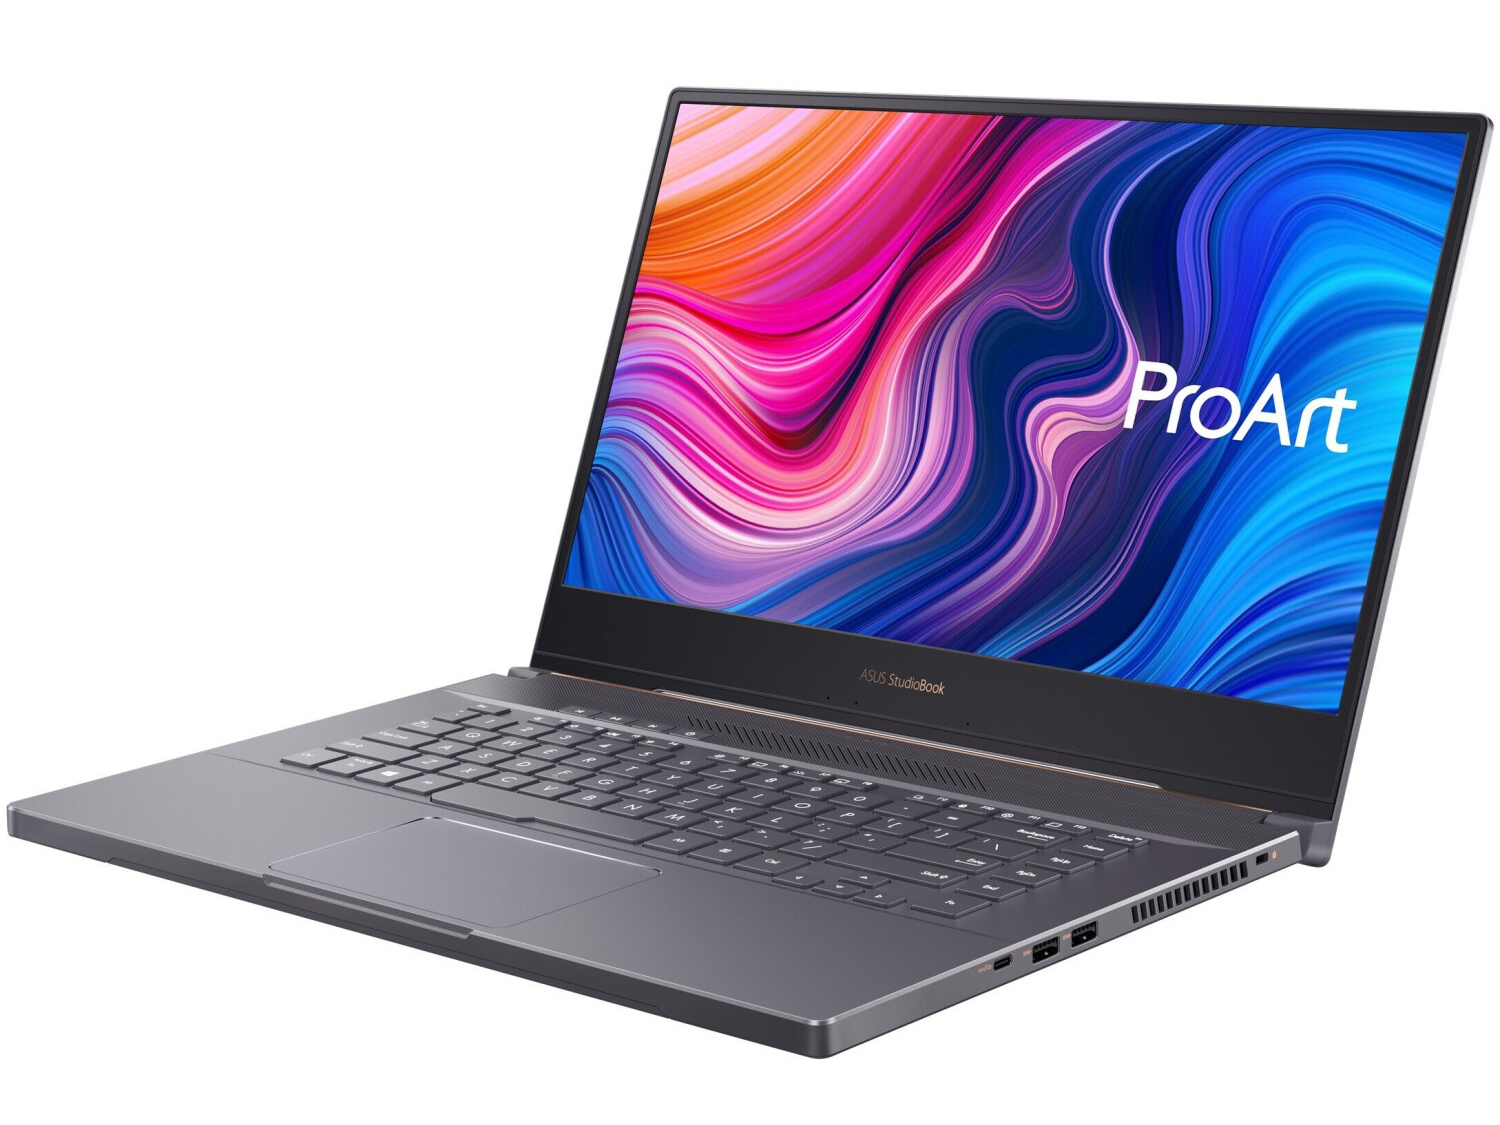
Asus ProArt StudioBook Pro 15 W500G5T Revisão: Poderosa estação de trabalho com pontos fracos

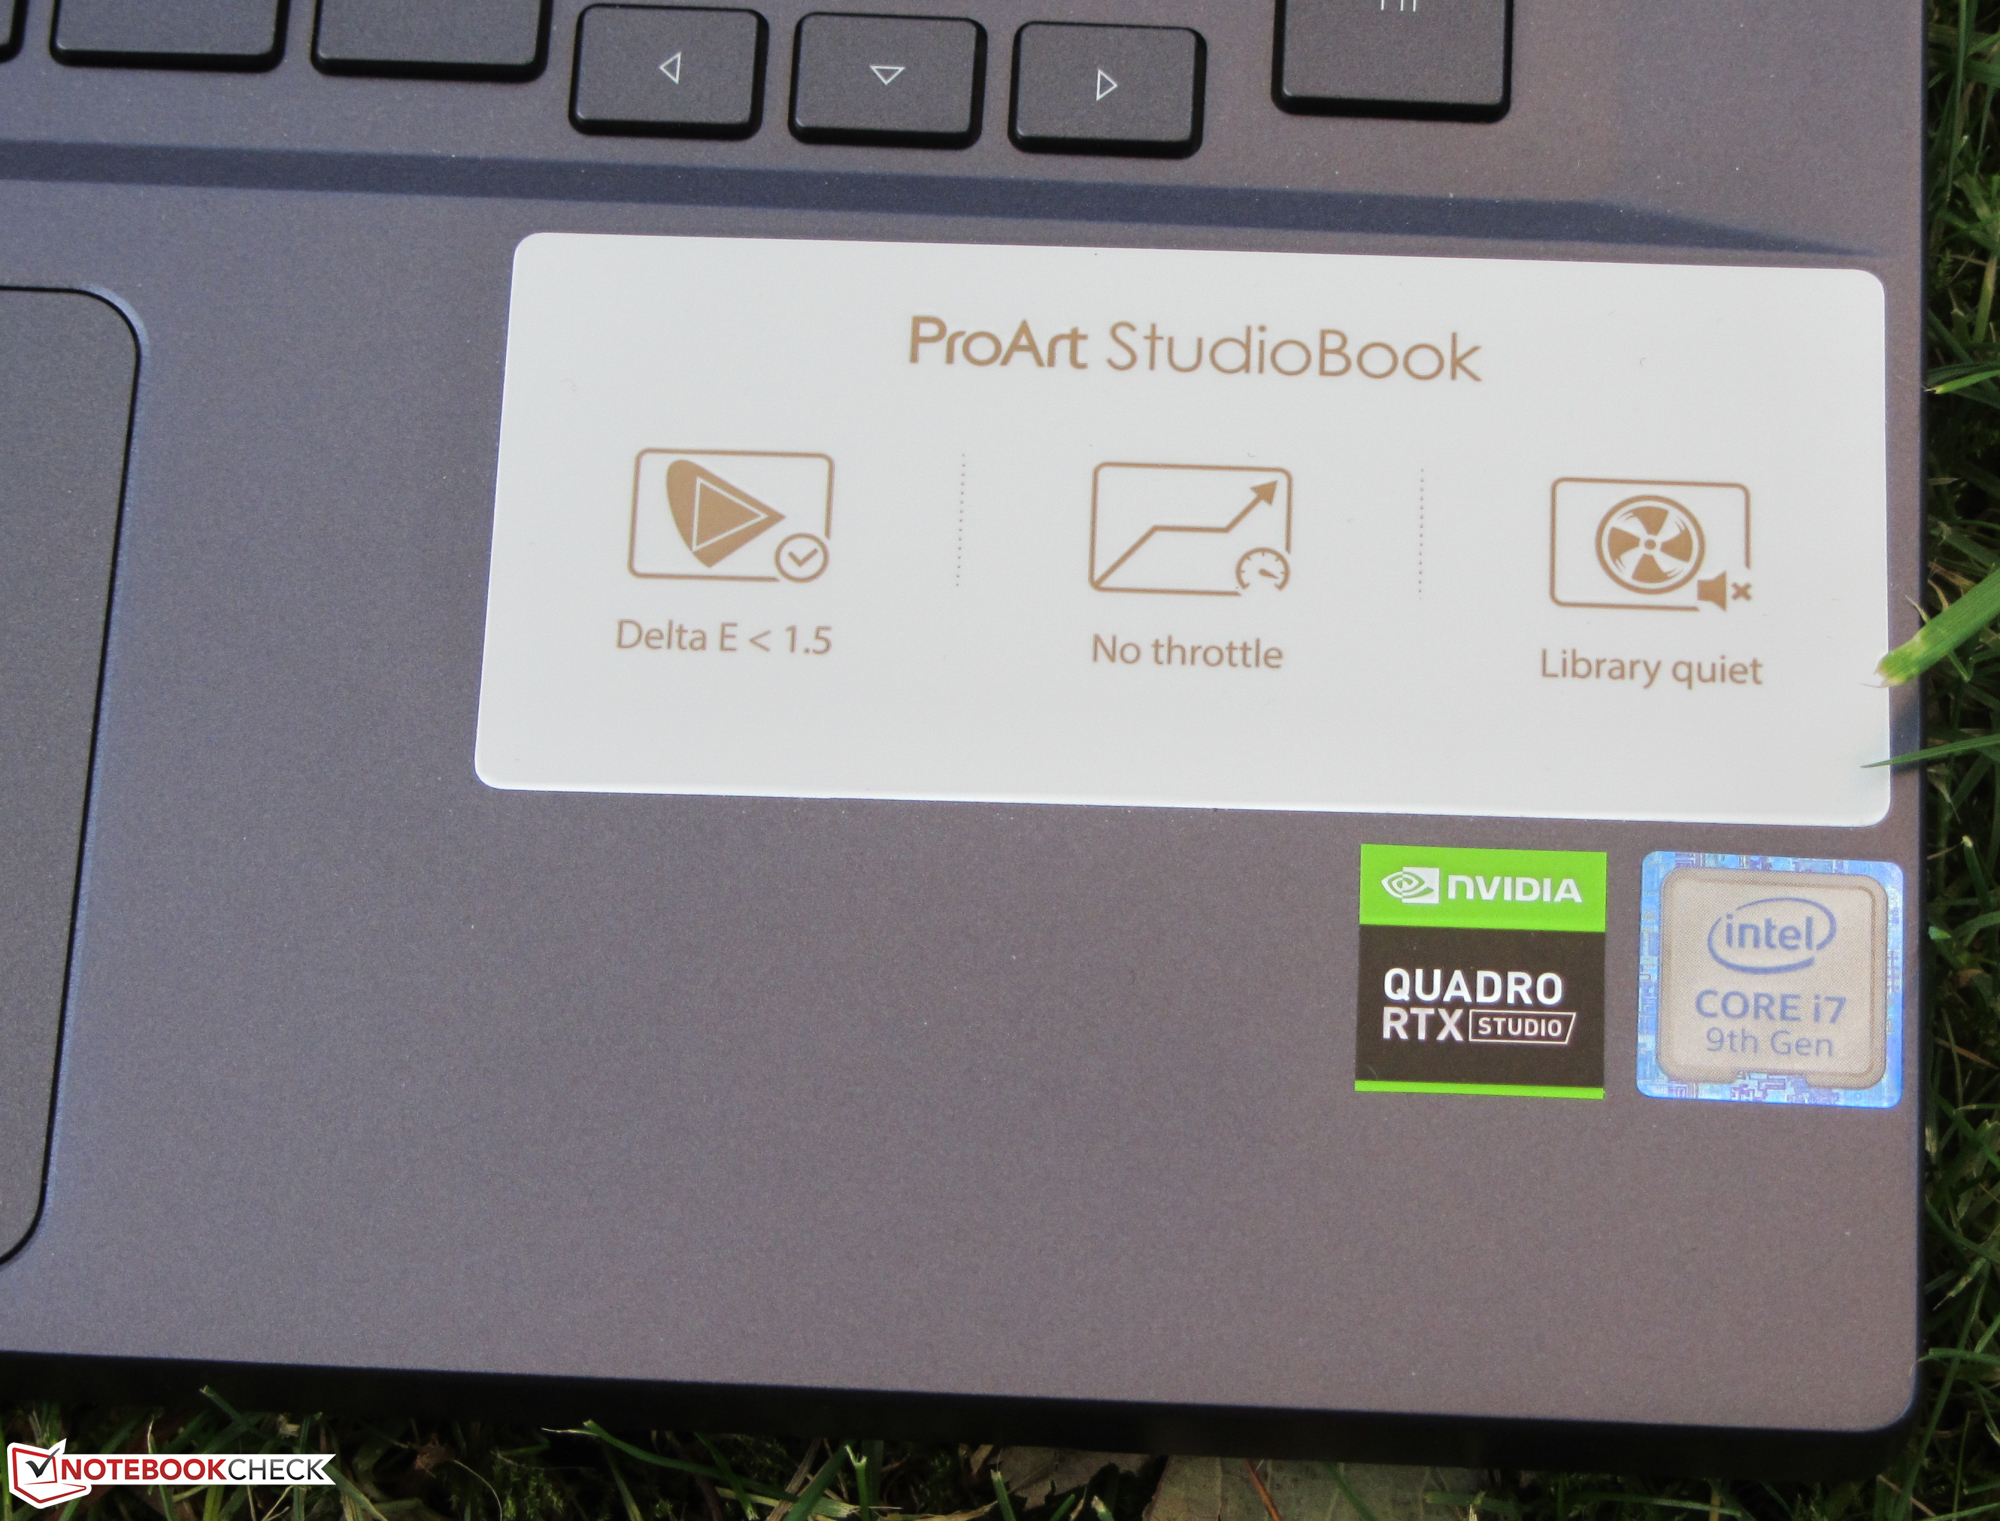
O Asus ProArt StudioBook Pro 15 é uma estação de trabalho de 15,6 polegadas, que é alimentada pelo Core i7-9750H e pelo Quadro RTX 5000 Max-Q. Os dispositivos concorrentes incluem: o Razer Blade 15 Studio Edition 2020, o Dell Precision 7550 e o MSI WS66 10TMT.
Avaliação | Data | Modelo | Peso | Altura | Size | Resolução | Preço |
|---|---|---|---|---|---|---|---|
| 83.1 % v7 (old) | 11/2020 | Asus ProArt StudioBook Pro 15 W500G5T i7-9750H, Quadro RTX 5000 Max-Q | 2 kg | 18.9 mm | 15.60" | 3840x2160 | |
| 83.4 % v7 (old) | 09/2020 | MSI WS66 10TMT-207US i9-10980HK, Quadro RTX 5000 Max-Q | 2.3 kg | 19.8 mm | 15.60" | 1920x1080 | |
| 87.8 % v7 (old) | 08/2020 | Dell Precision 7550 W-10885M, Quadro RTX 5000 Max-Q | 2.8 kg | 27.36 mm | 15.60" | 3840x2160 | |
| 87 % v7 (old) | 08/2020 | Razer Blade 15 Studio Edition 2020 i7-10875H, Quadro RTX 5000 Max-Q | 2.2 kg | 13.98 mm | 15.60" | 3840x2160 |
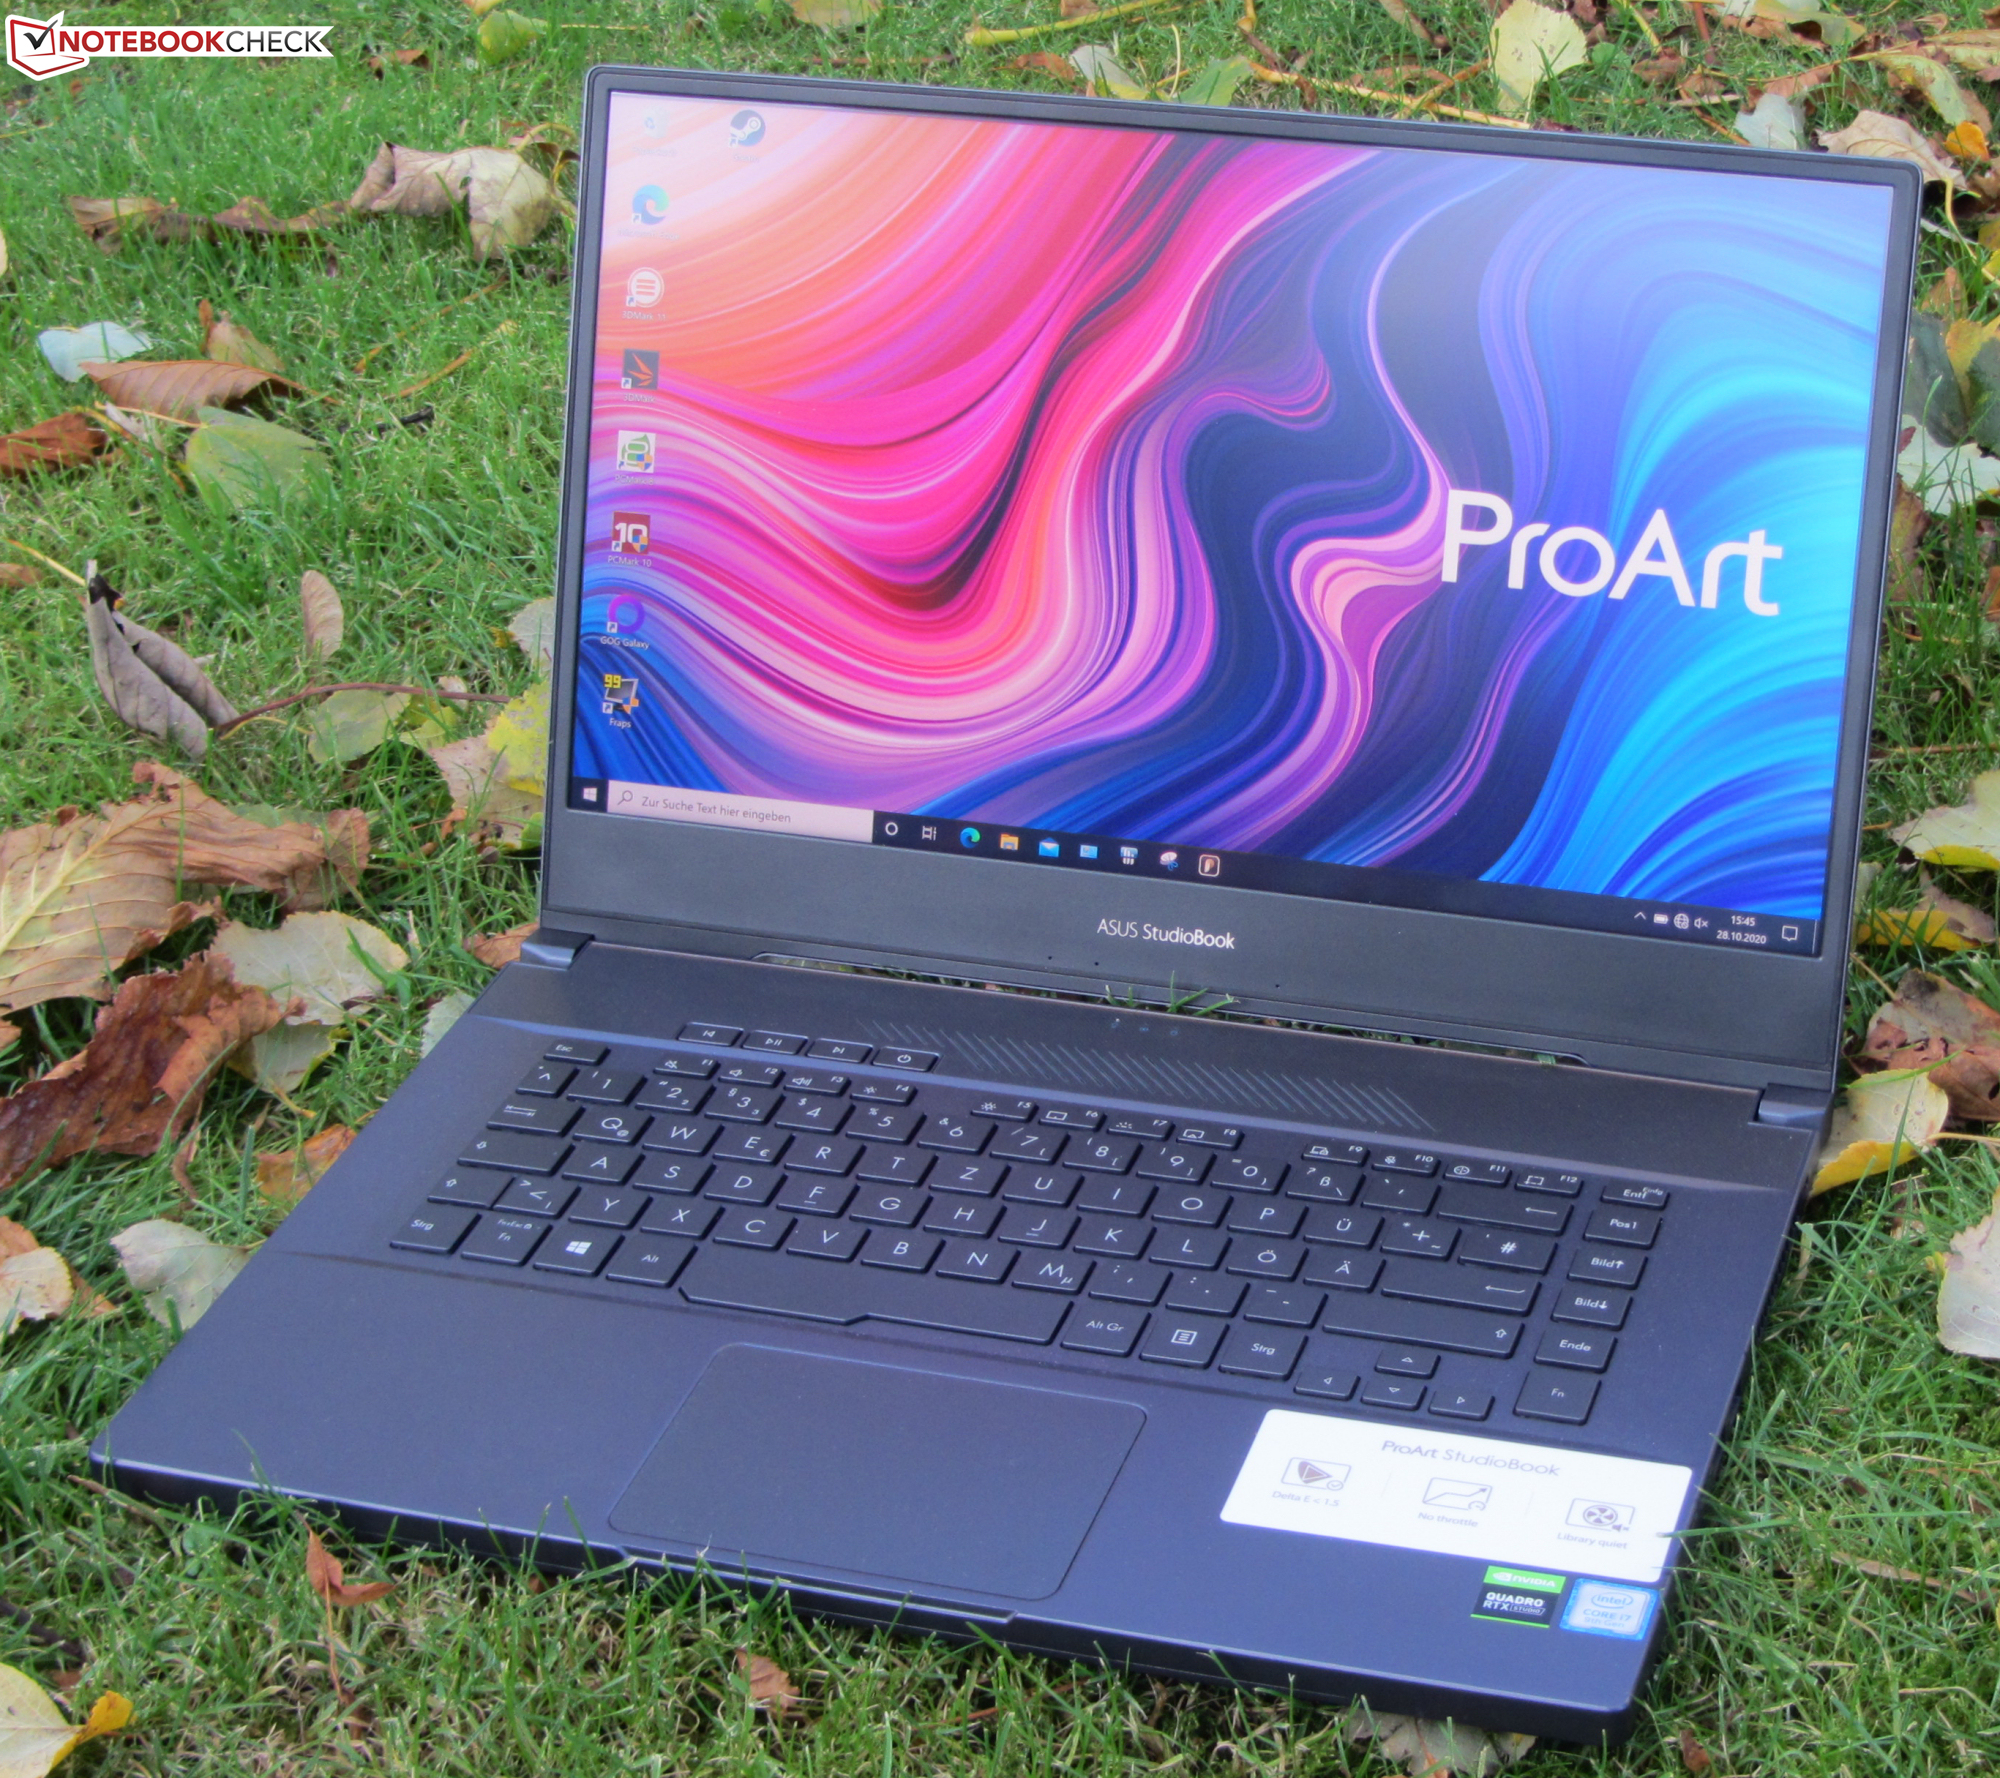
Case & Connectivity - Sem Thunderbolt 3 para o W500G5T
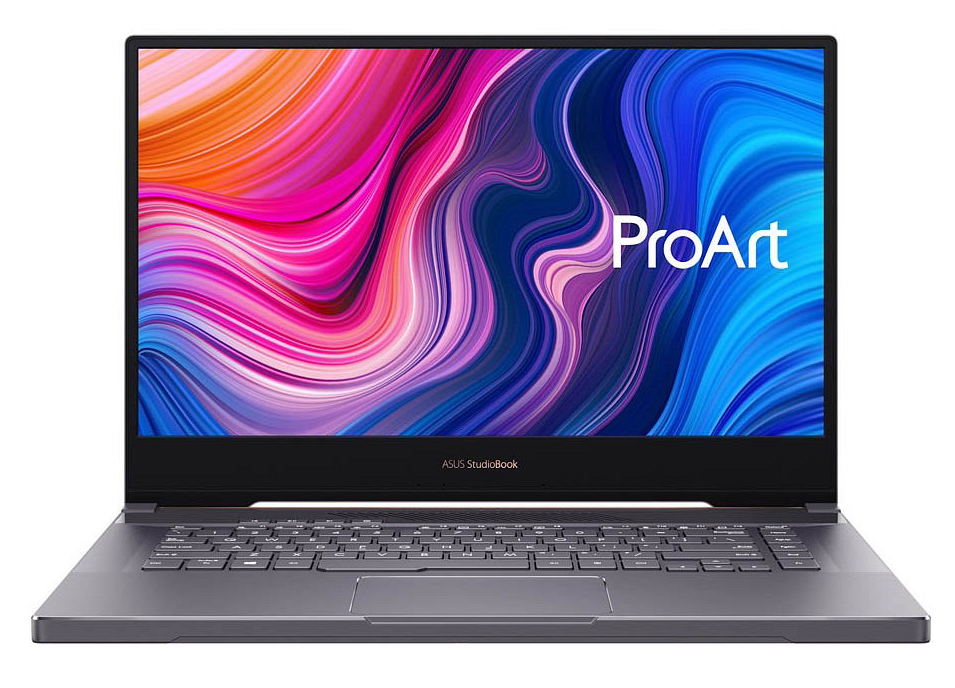
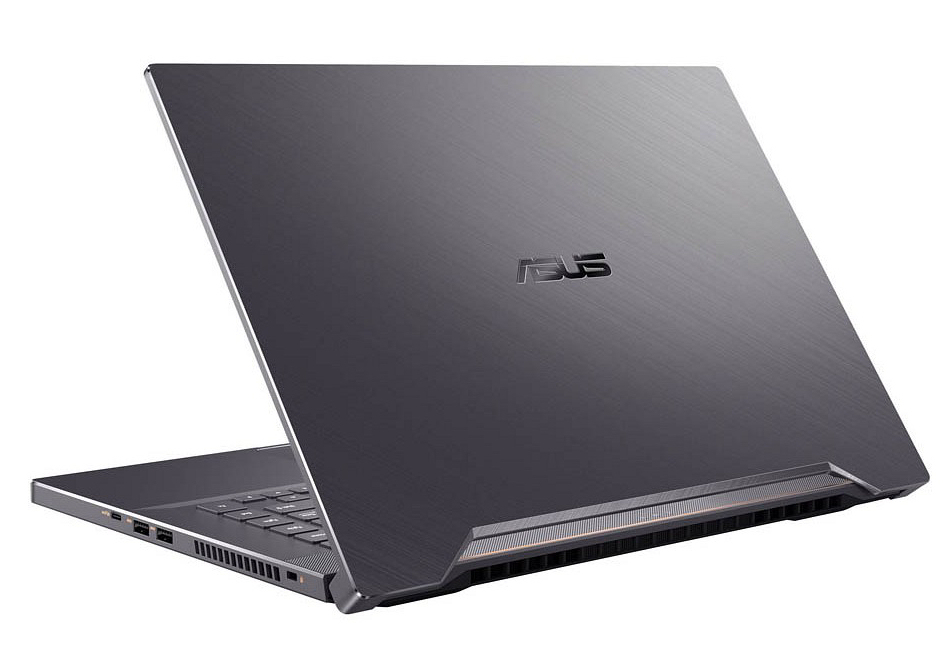
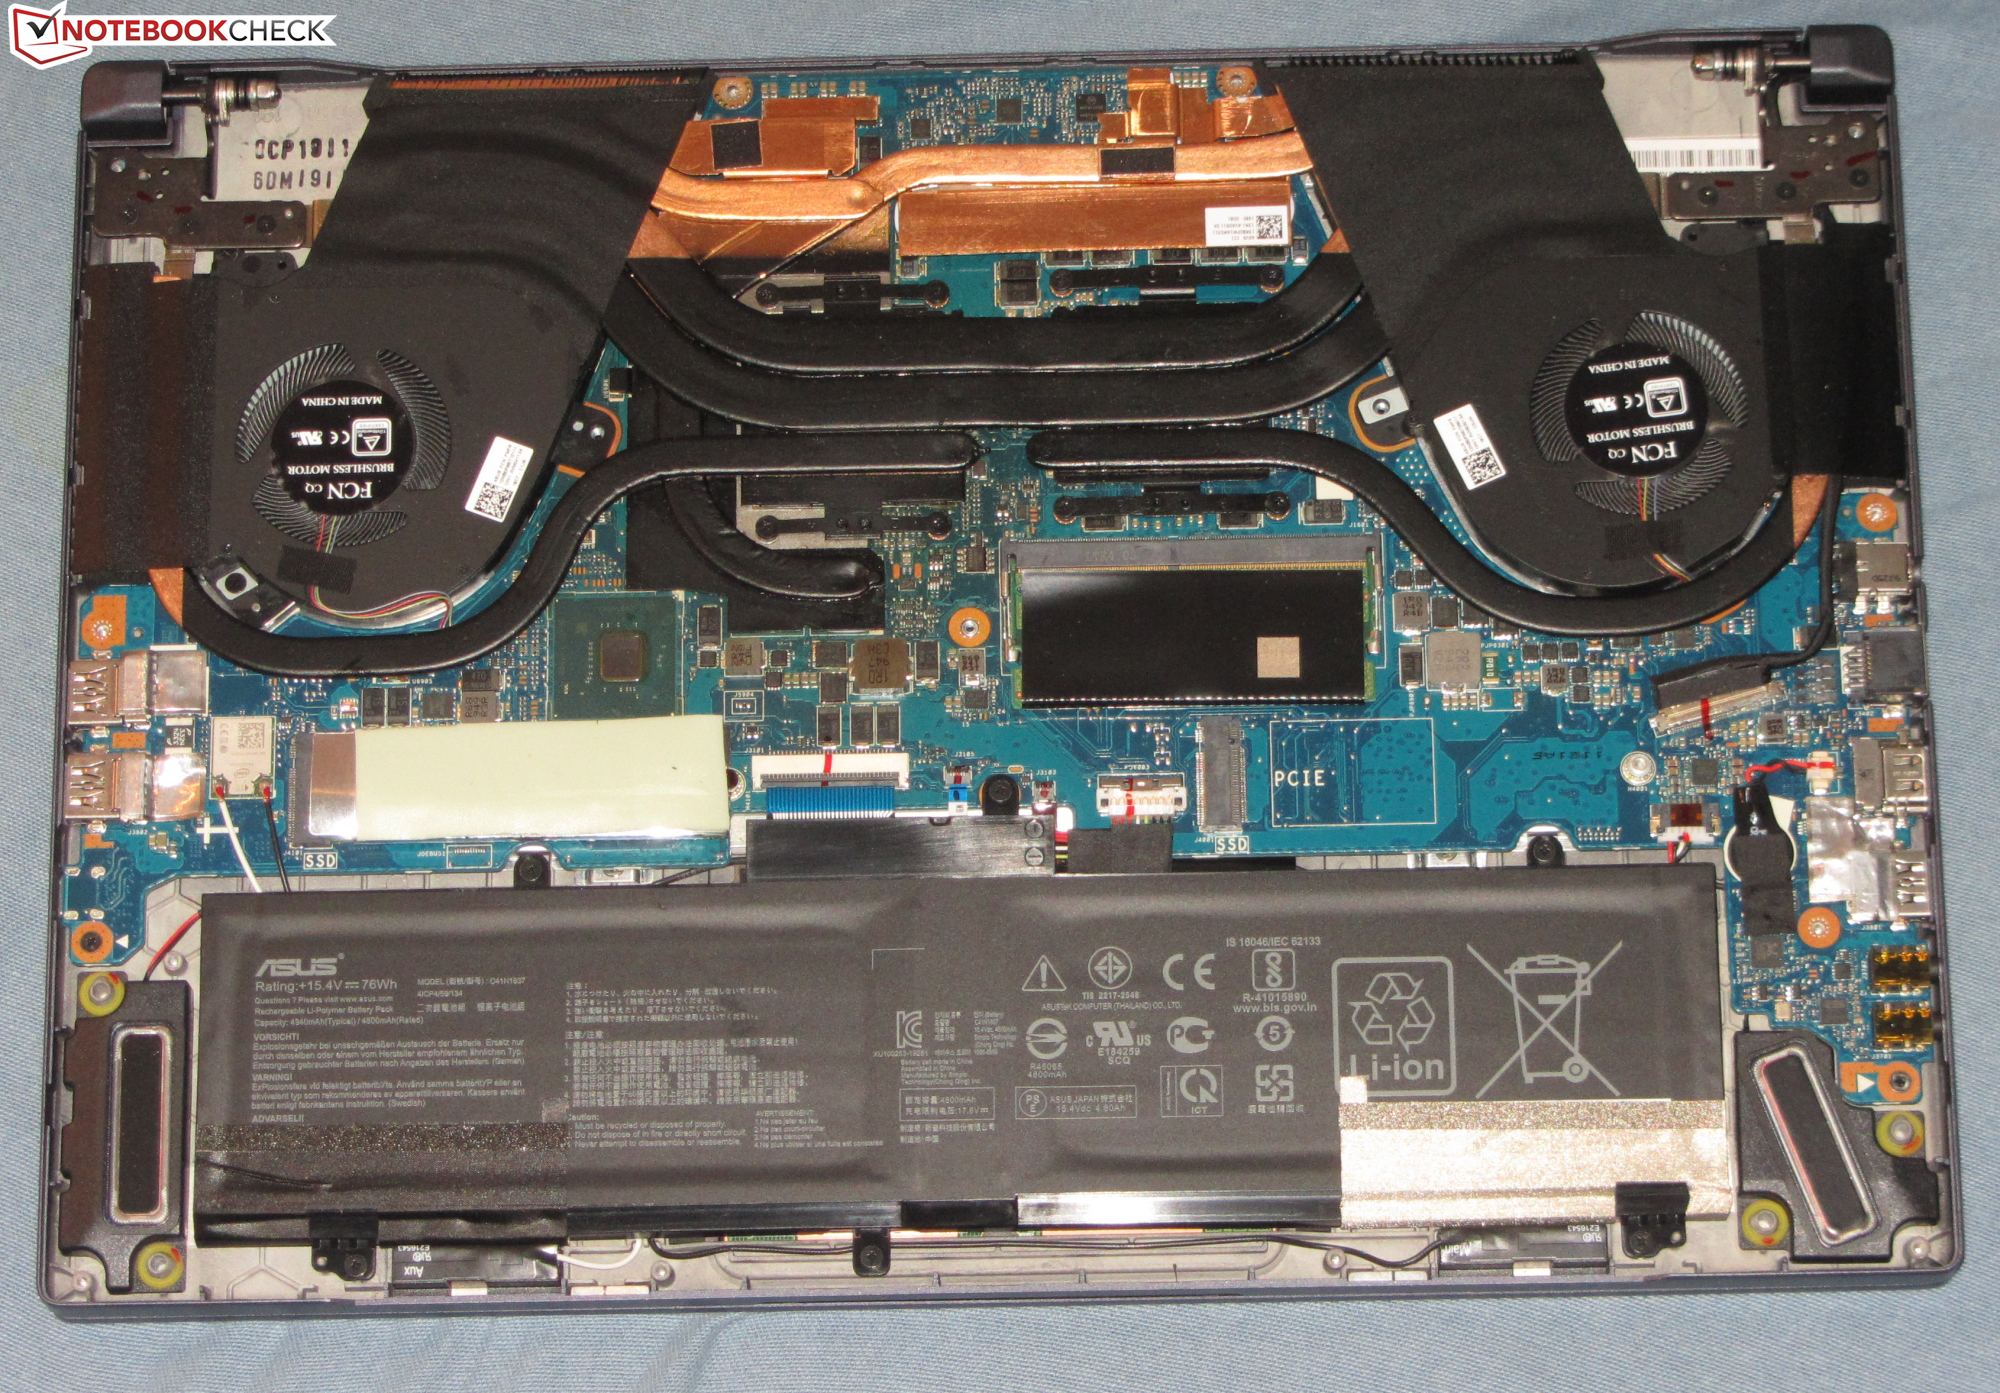
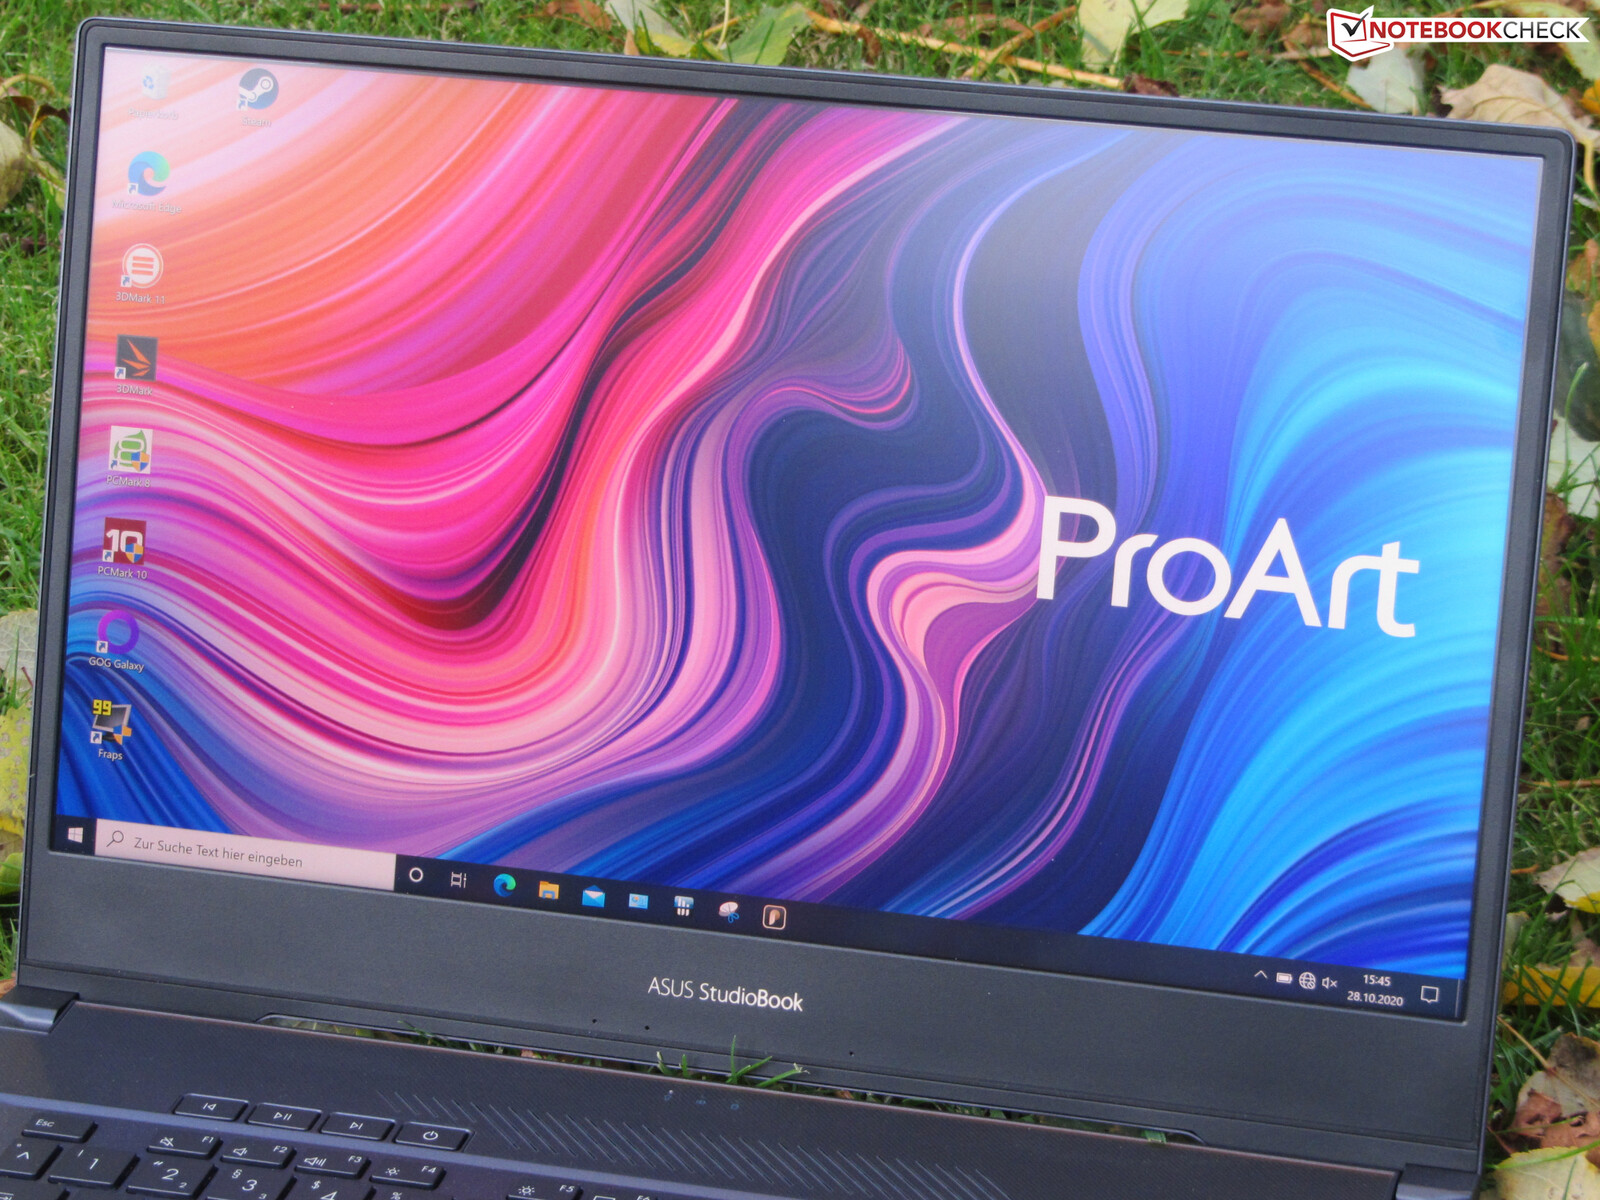
A caixa metálica do Asus StudioBook parece muito superior e vem no esquema de cores conhecido como Star Grey
. Não há lacunas ou frestas em nenhum lugar. Tanto a tampa do display quanto o chassi são muito rígidos. A bateria é embutida. Para chegar aos componentes internos, os usuários terão que remover a tampa inferior
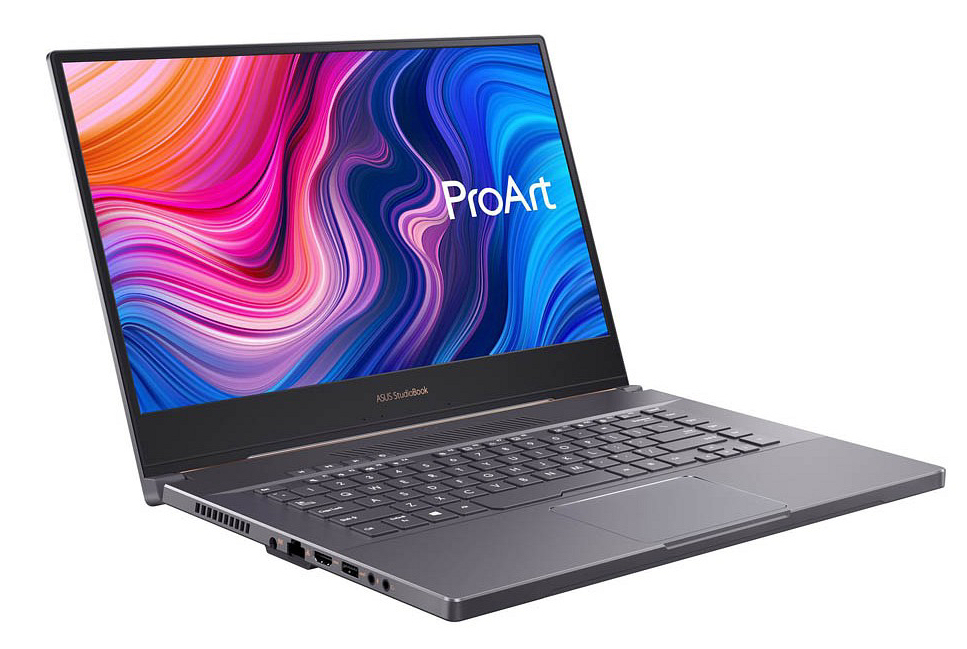
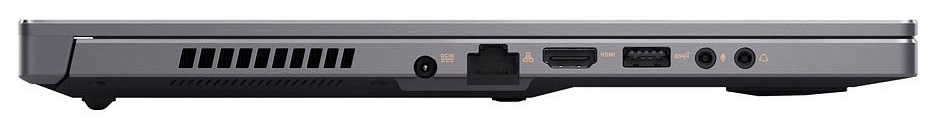
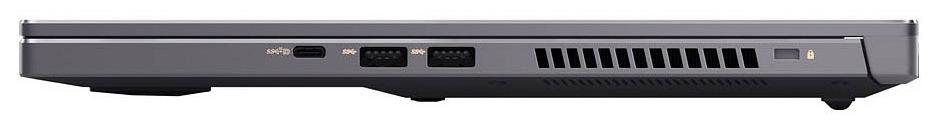
A estação de trabalho tem três portas USB Tipo A (2x USB 3.2 Gen 1, 1x USB 3.2 Gen 2) e uma porta USB Tipo C (USB 3.2 Gen 2). A porta USB-C pode emitir um sinal DisplayPort (com um adaptador que é vendido separadamente). Junto com a porta HDMI, nosso dispositivo de revisão oferece duas saídas de vídeo. Não há leitor de cartão SD
O StudioBook suporta os seguintes padrões IEEE: 802.11a, b, g, n, ac e ax. Ele também vem com um módulo Bluetooth 5.0. As velocidades de transferência de dados que medimos sob as condições ideais (nenhum outro dispositivo com Wi-Fi nas proximidades, uma curta distância entre o notebook e o PC servidor; Router: Netgear Nighthawk AX12) são muito bons

Anschlussausstattung
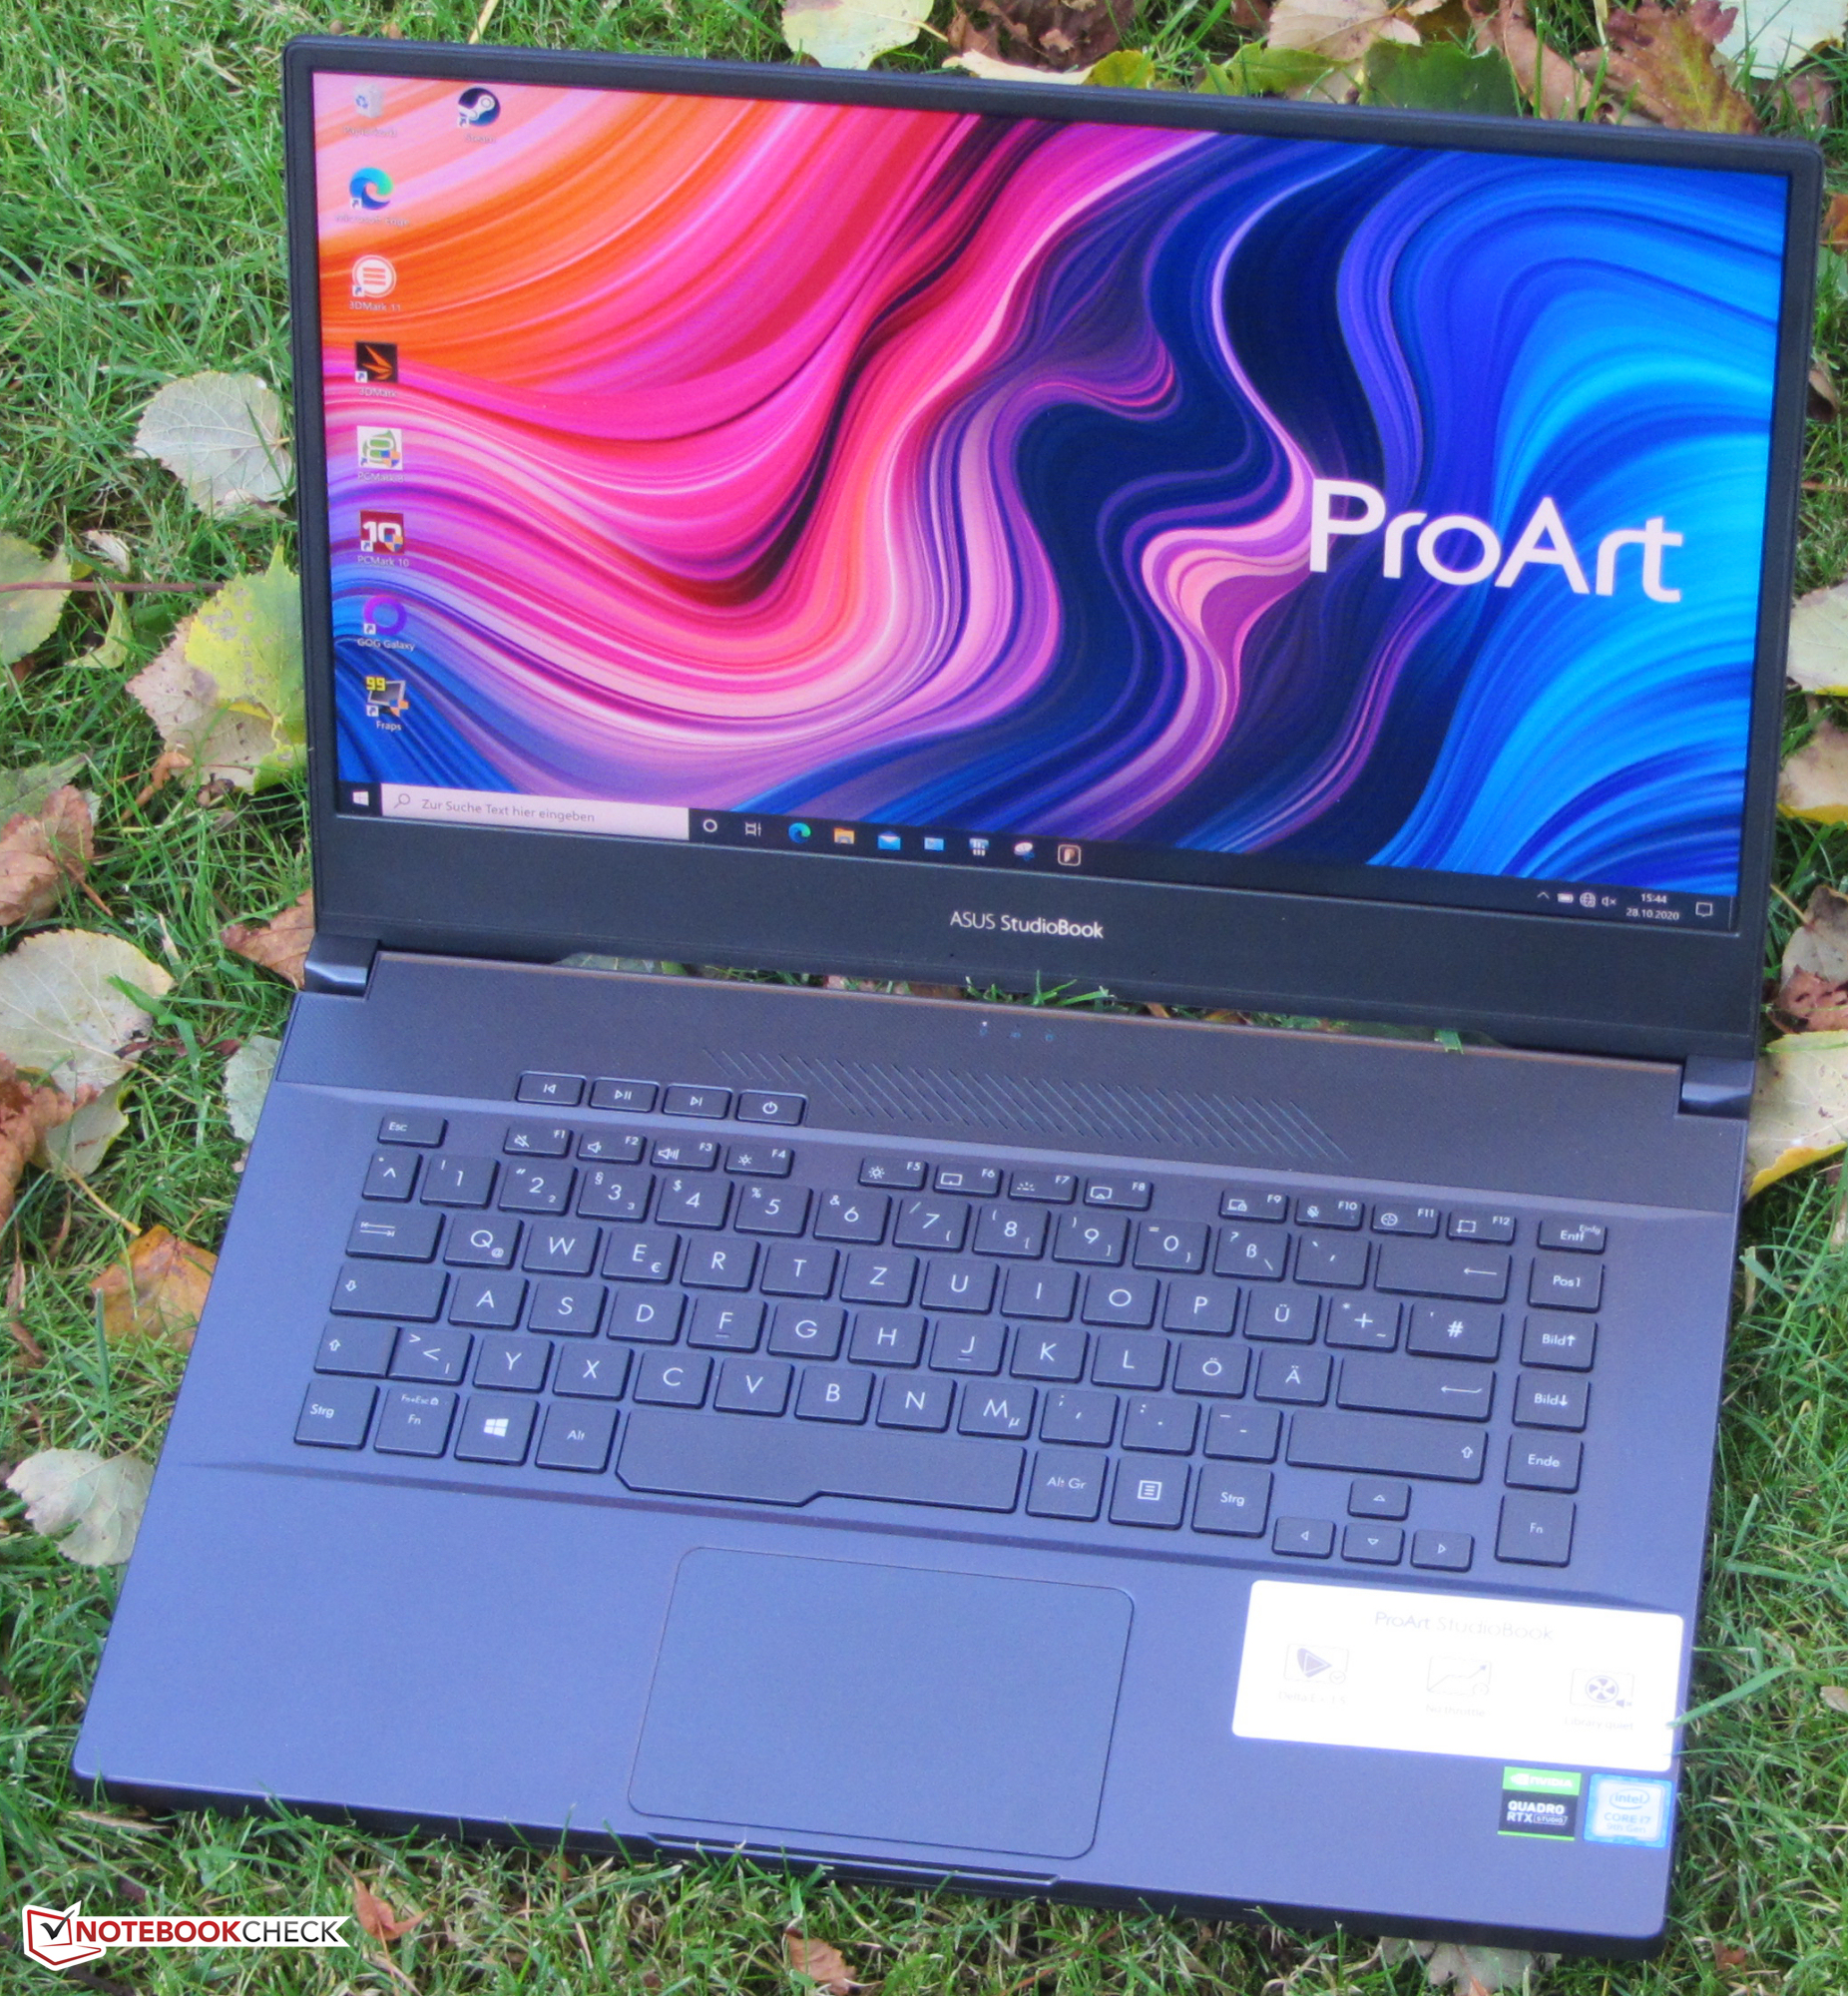
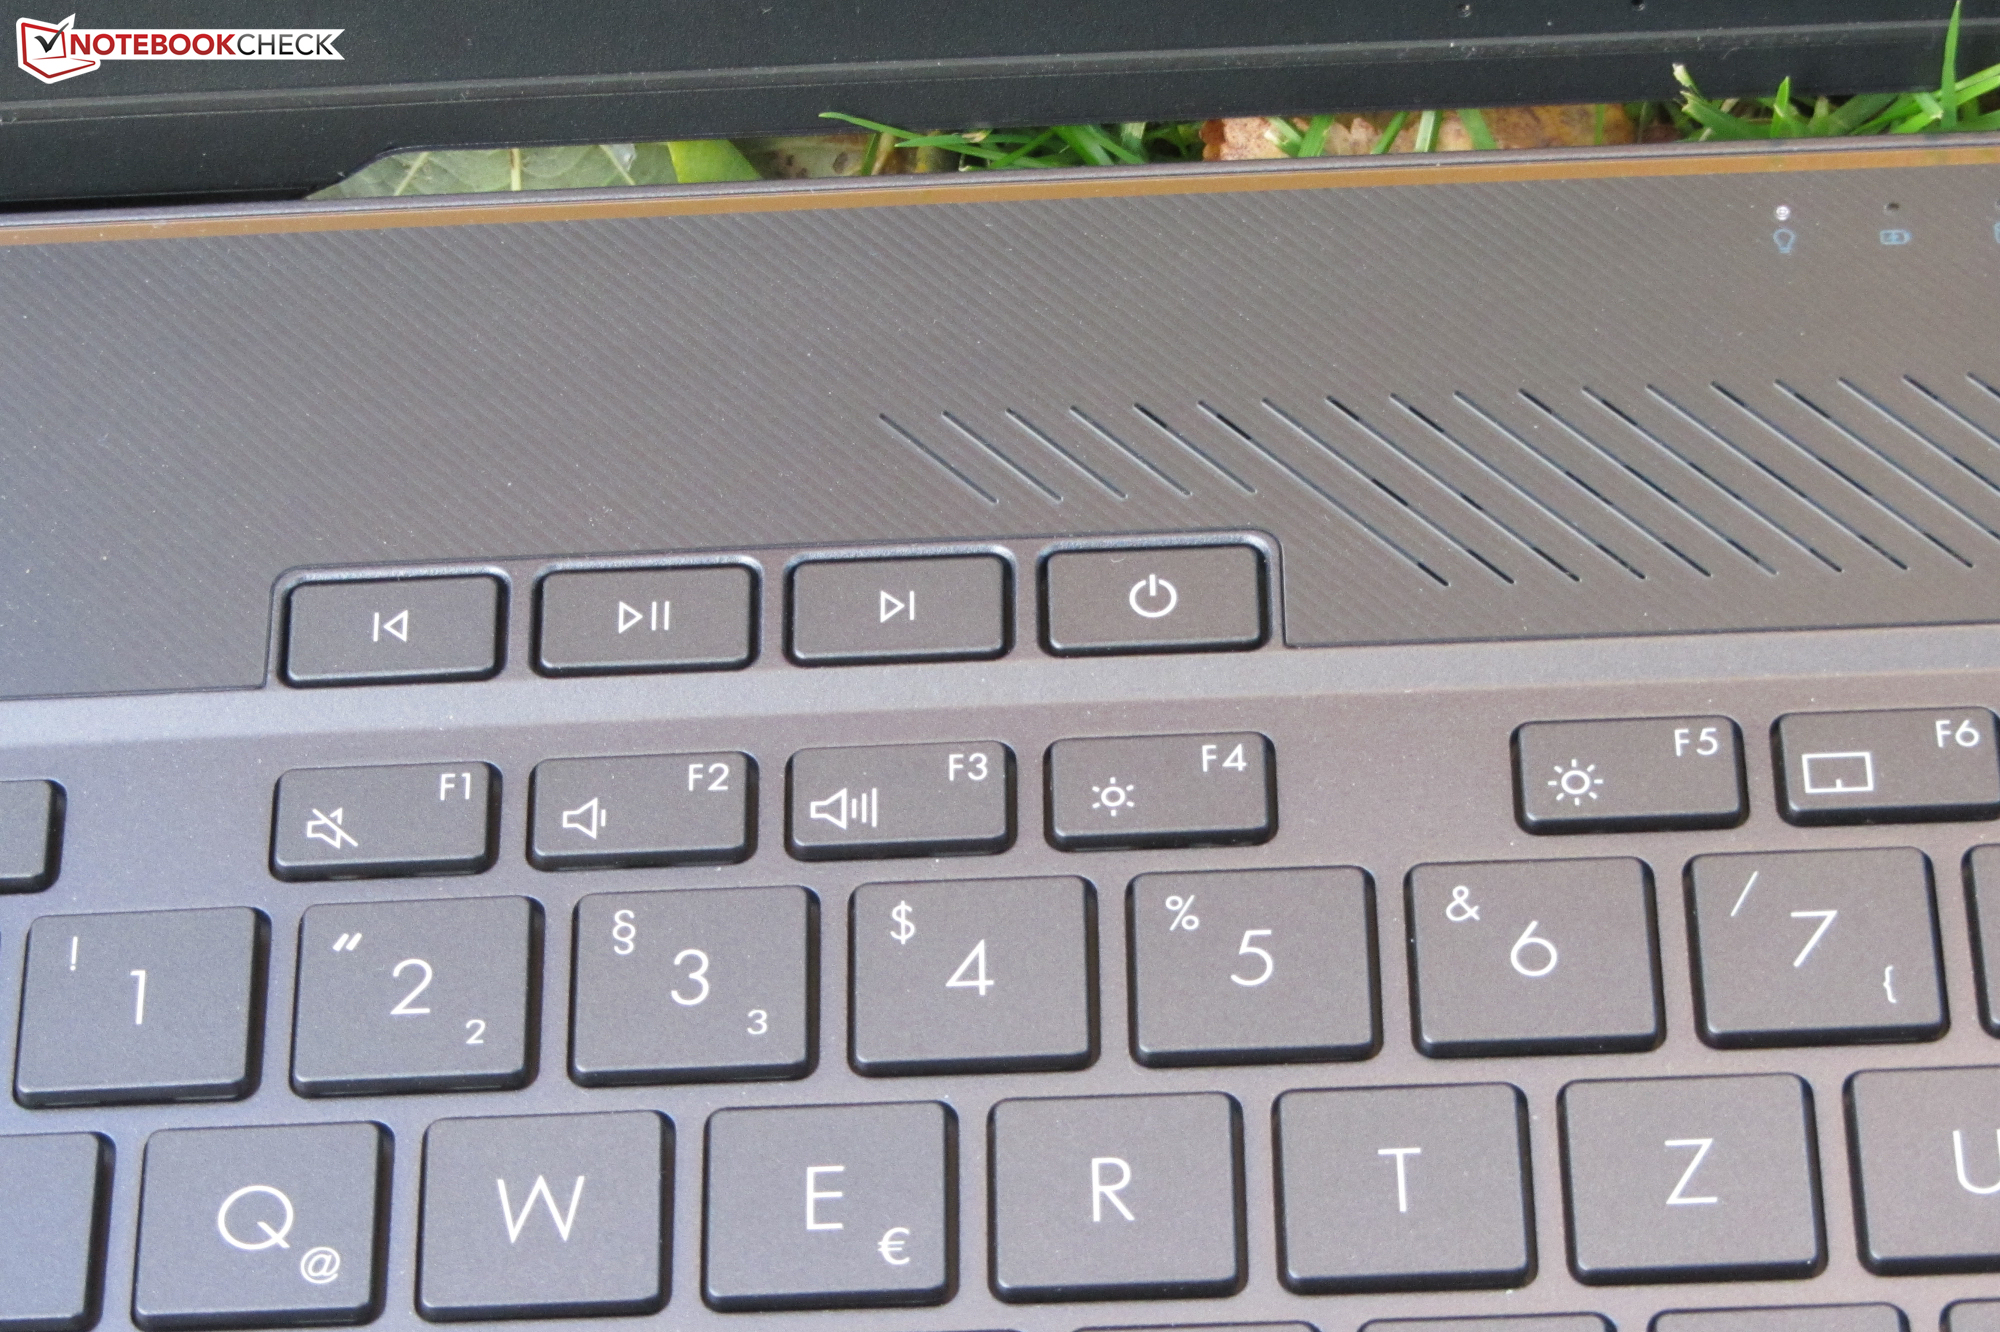
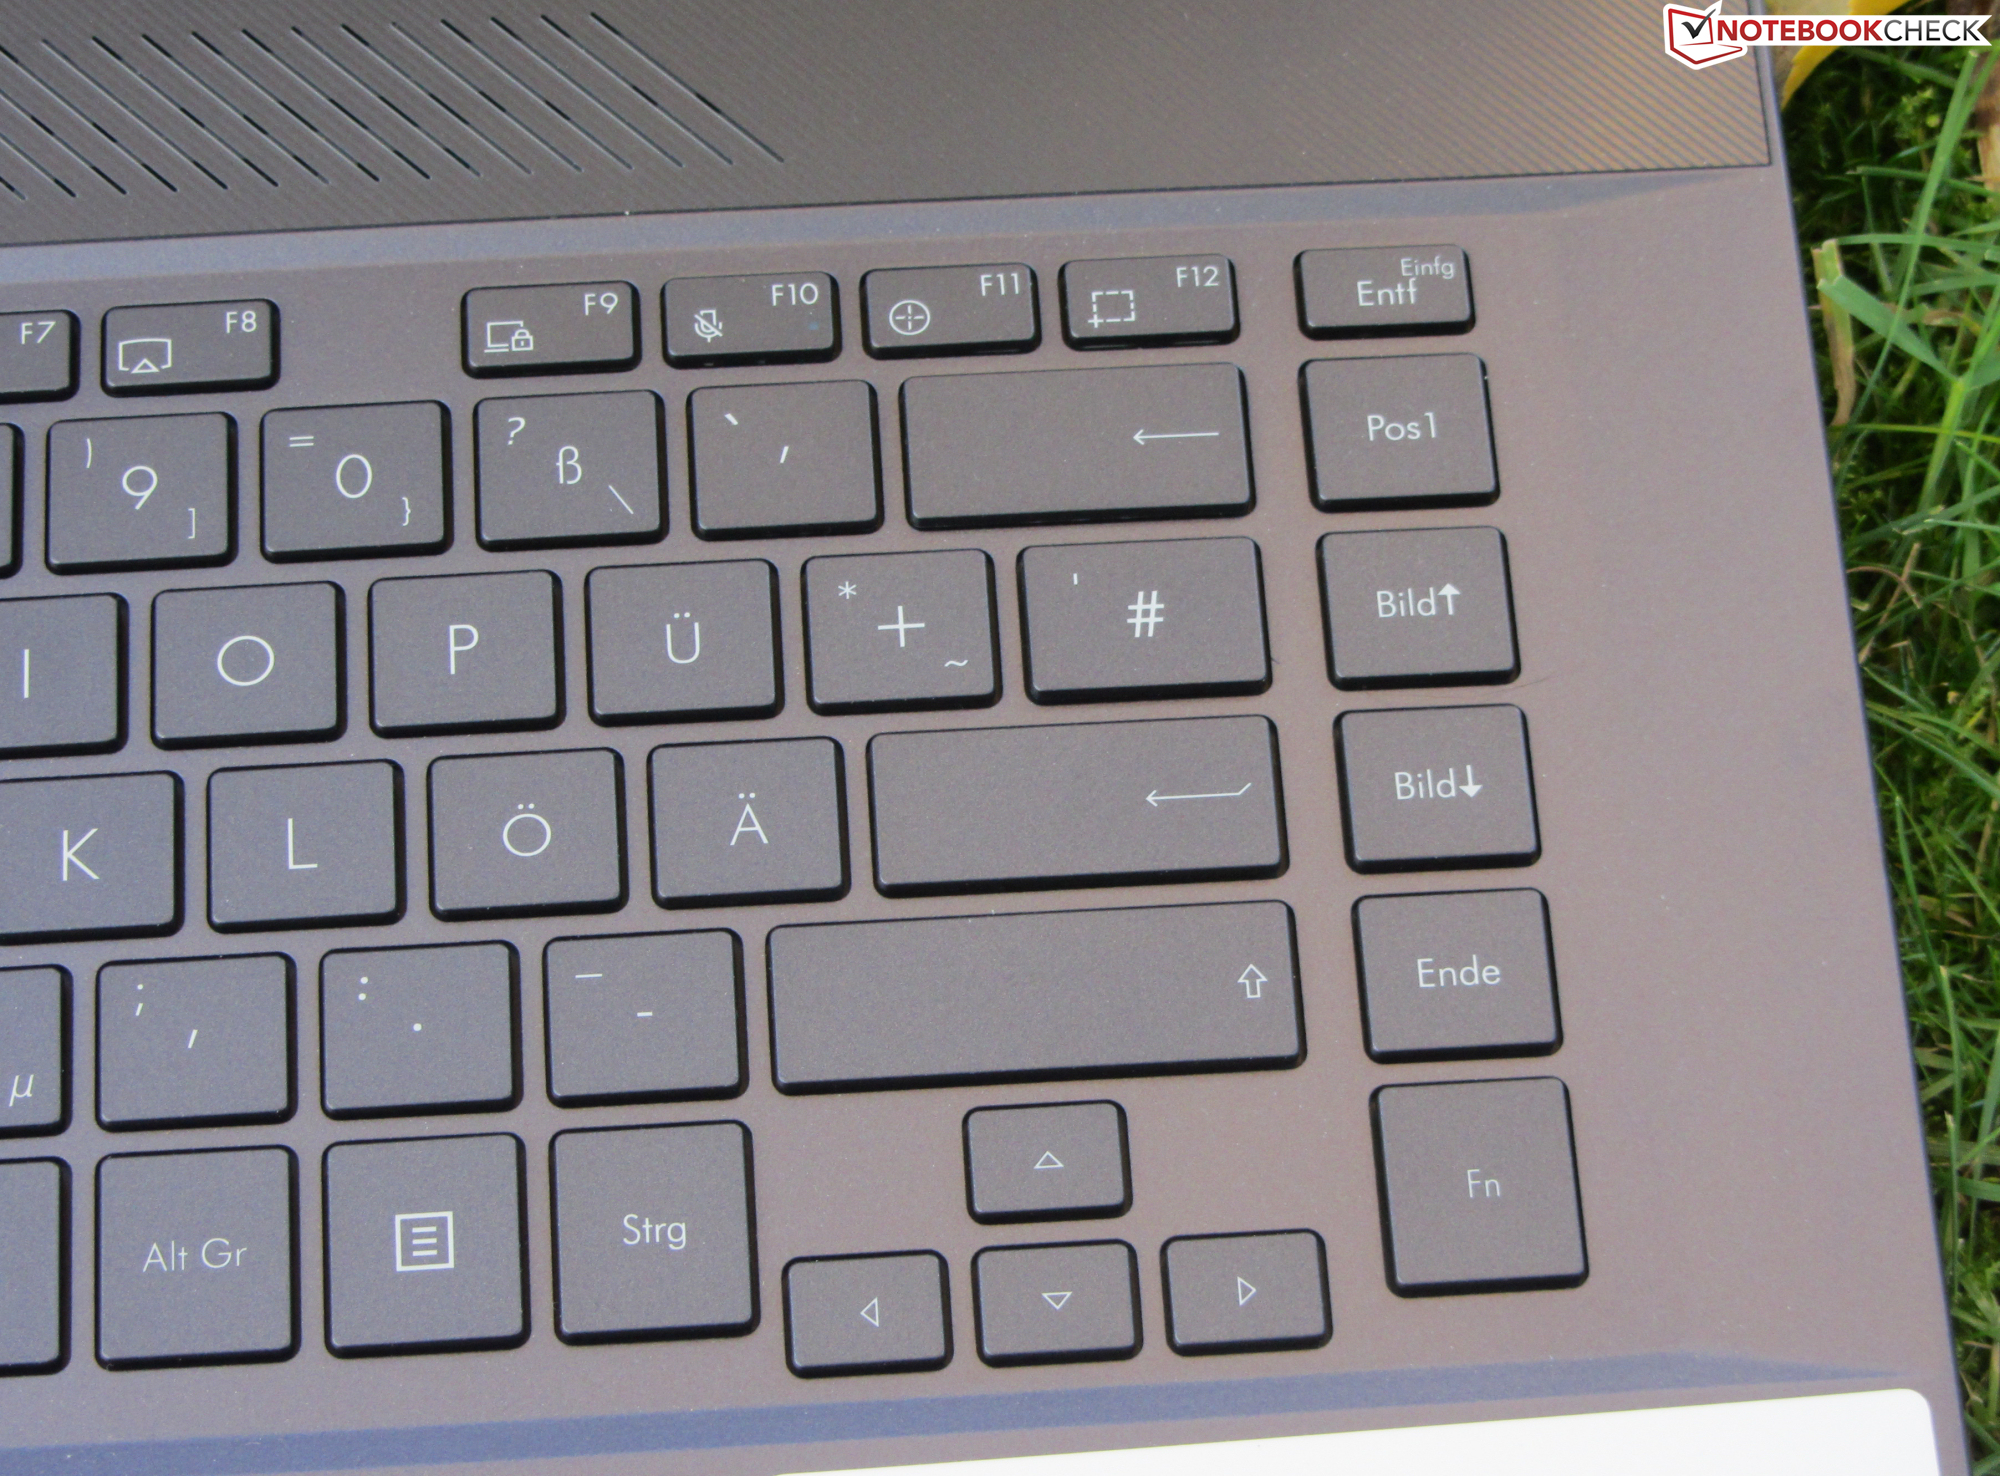
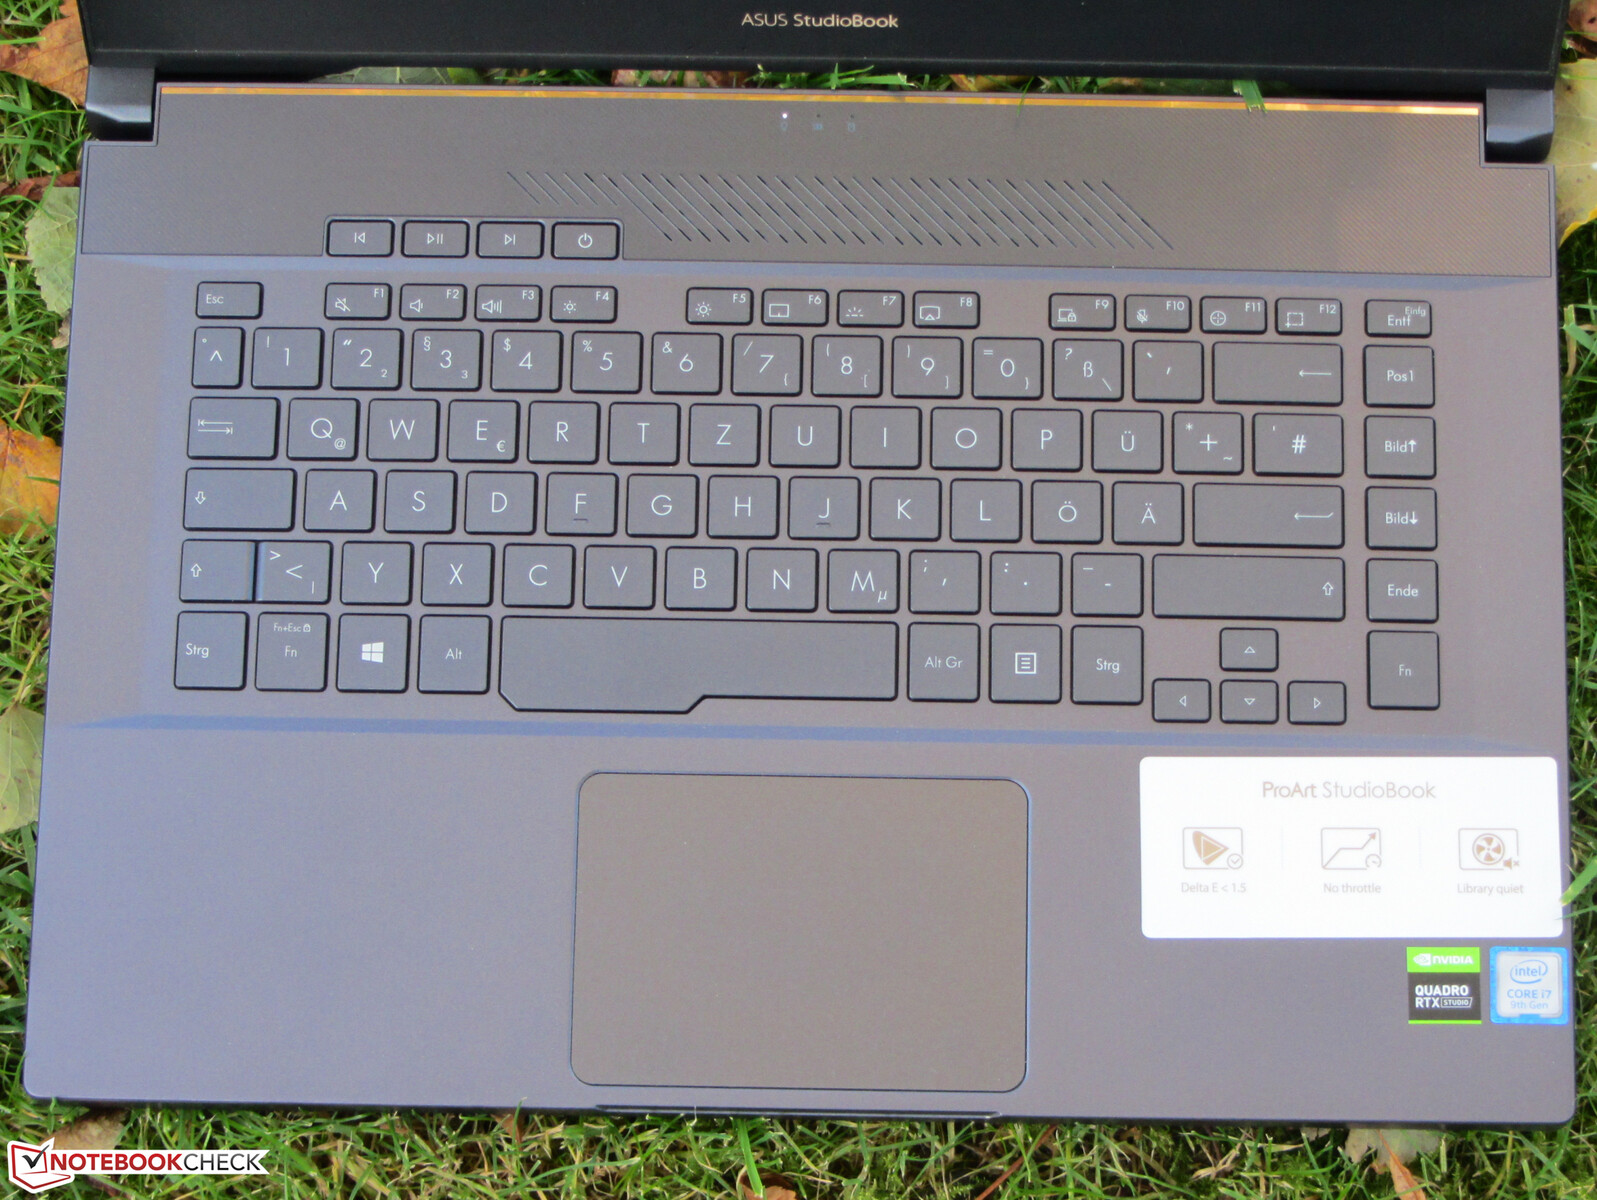
Dispositivos de entrada - O StudioBook oferece uma luz de fundo de teclado
O Asus StudioBook vem com um teclado no estilo de um veículo, que oferece uma curta distância de viagem. Os teclados têm uma superfície lisa. Ao digitar, o teclado apresenta alguma flexibilidade. No geral, o StudioBook tem um bom teclado. O Clickpad multi-toque (10,5x7,3 cm - 4,1x2,9 in) oferece espaço suficiente para gestos. A superfície lisa facilita o deslizamento dos dedos. O tapete tem um ponto de acionamento claro e uma distância de viagem curta
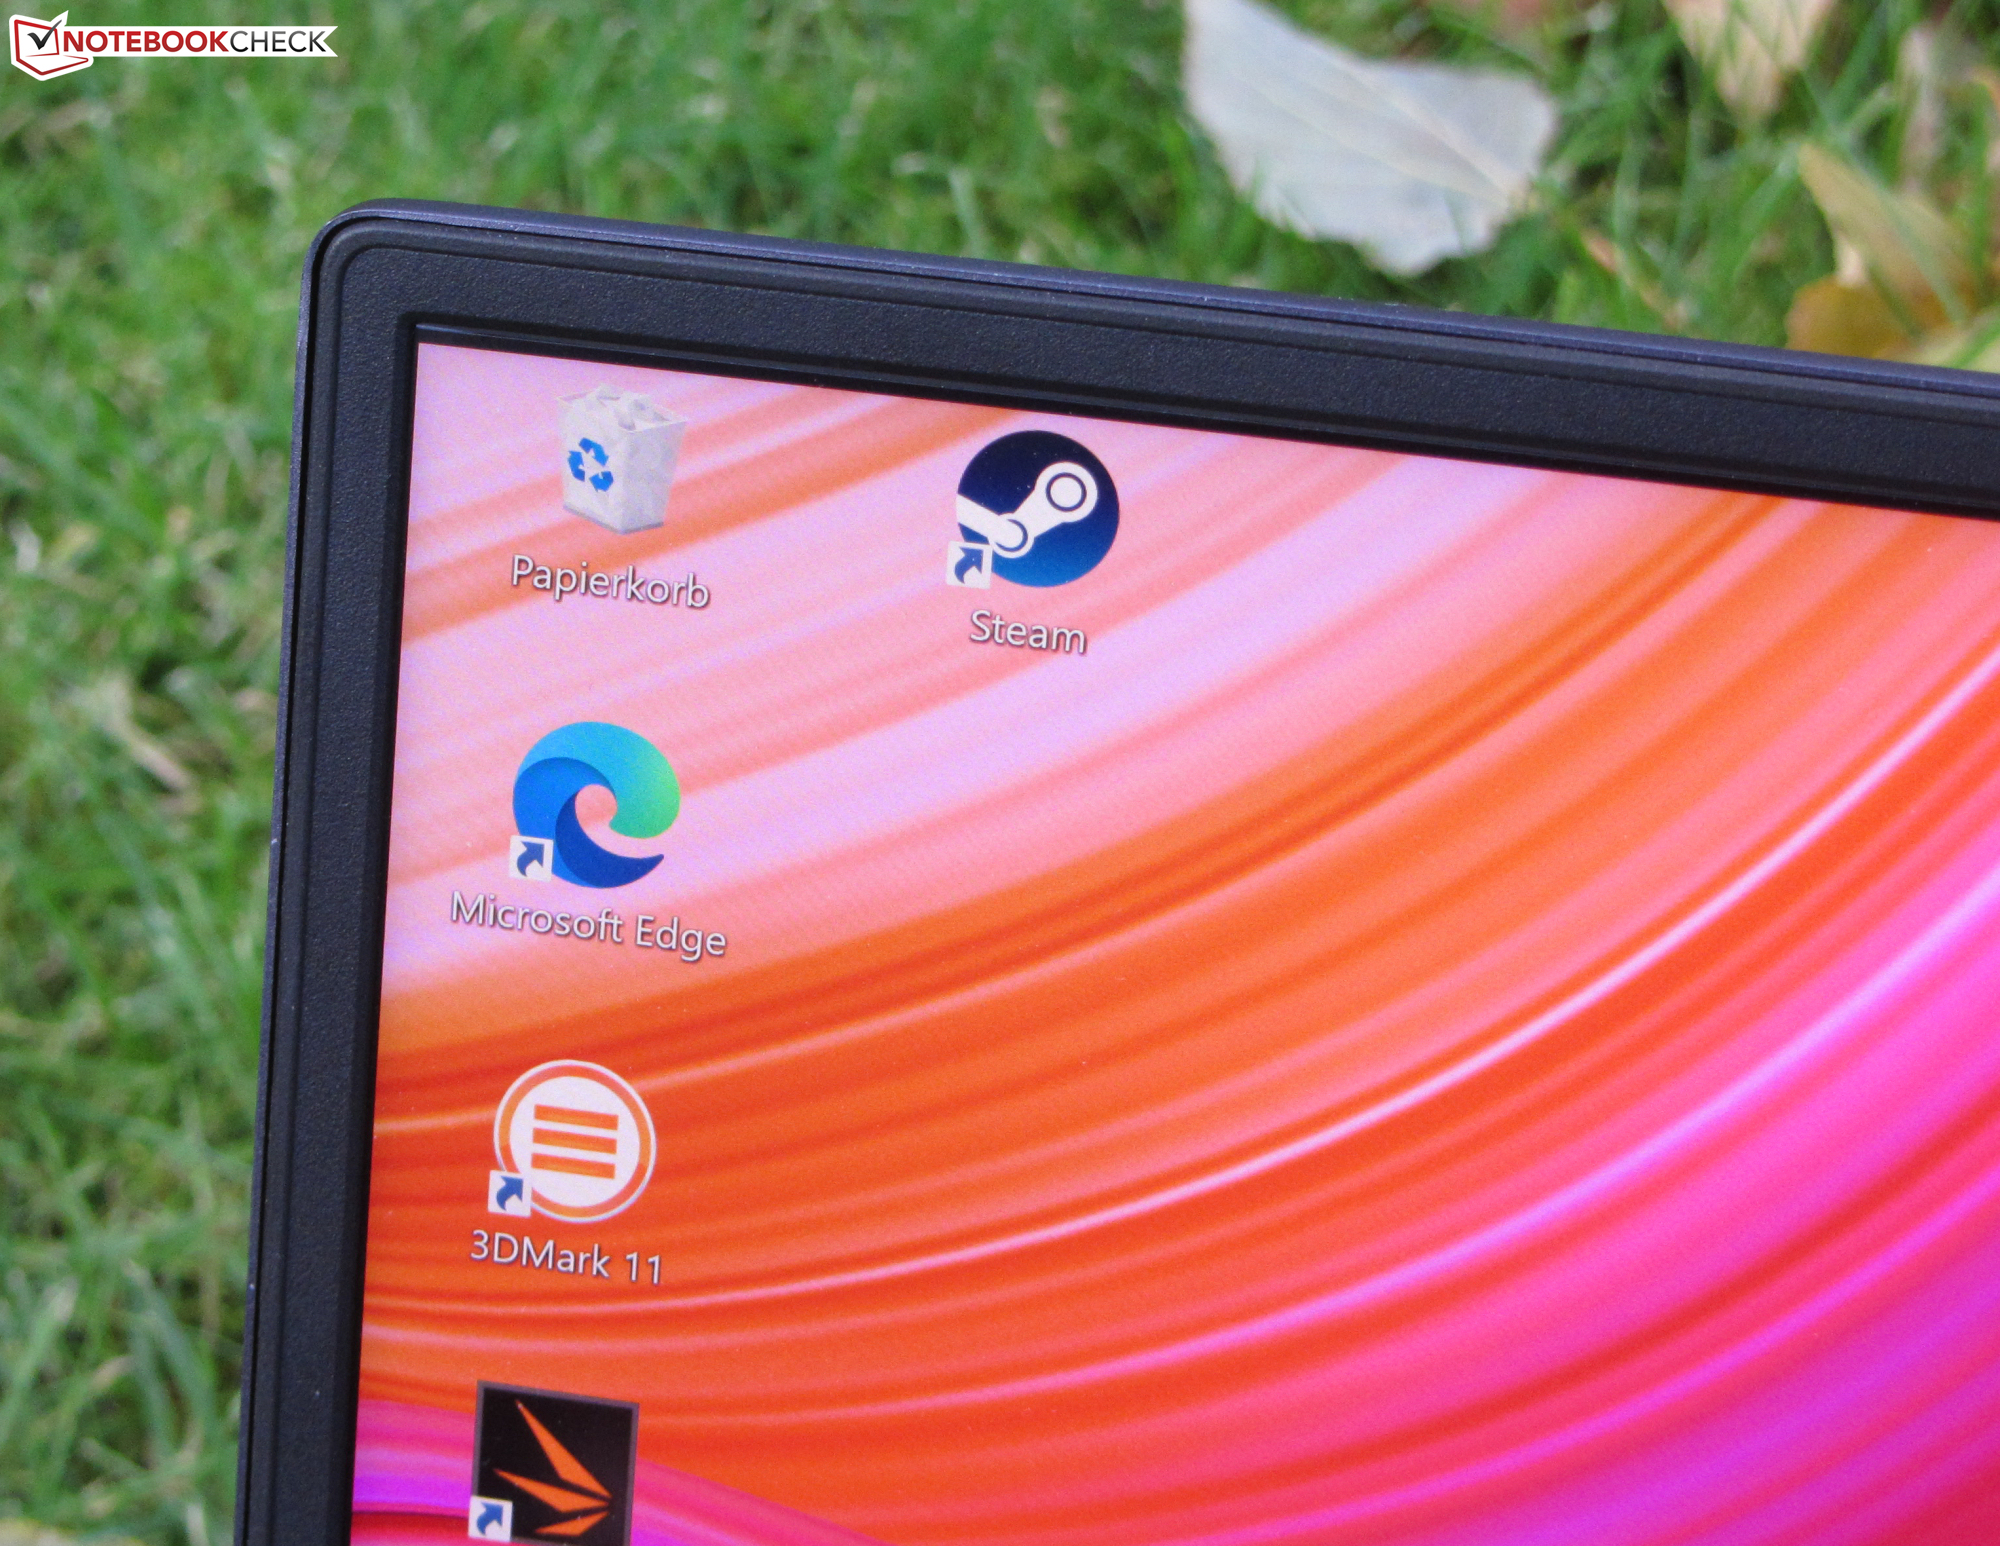
Display - Painel IPS 4K

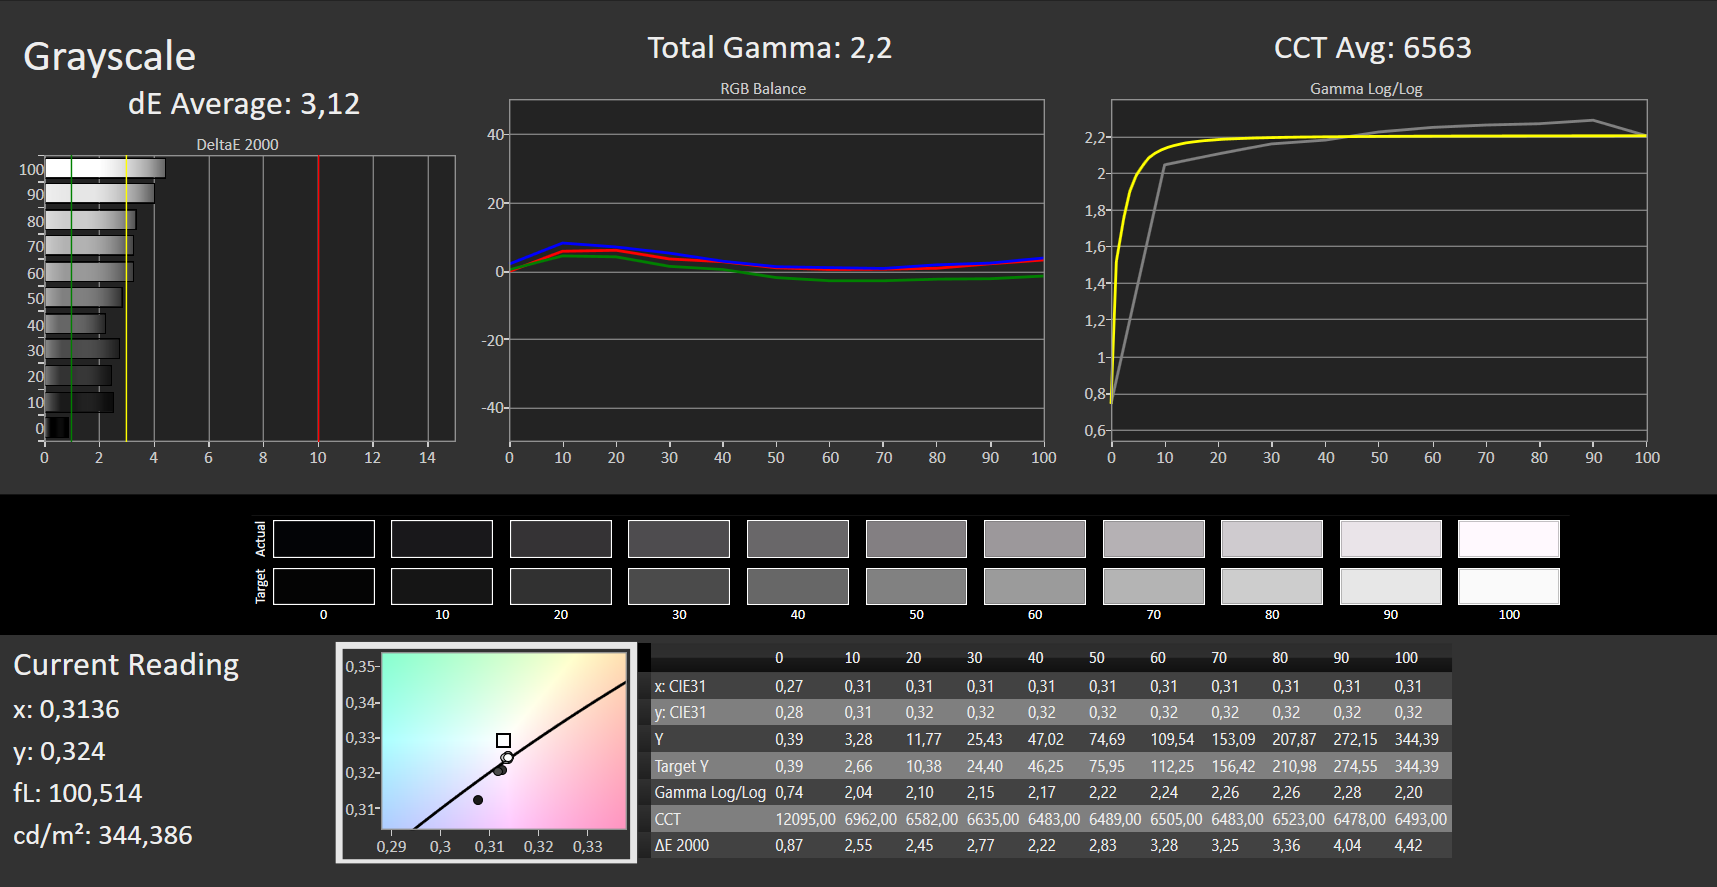
A tela de 15,6 polegadas do StudioBook opera com uma resolução nativa de 3840x2160 pixels. A tela oferece uma relação de contraste de 930:1. Nós vemos uma relação de contraste acima de 1000:1 como boa. A luminosidade da tela de 334,8 cd/m² é bastante boa. Os tempos de resposta do painel 60-Hz poderiam ter sido mais rápidos. Positivo: O display não sofre com a cintilação do PWM
| |||||||||||||||||||||||||
iluminação: 93 %
iluminação com acumulador: 337 cd/m²
Contraste: 930:1 (Preto: 0.37 cd/m²)
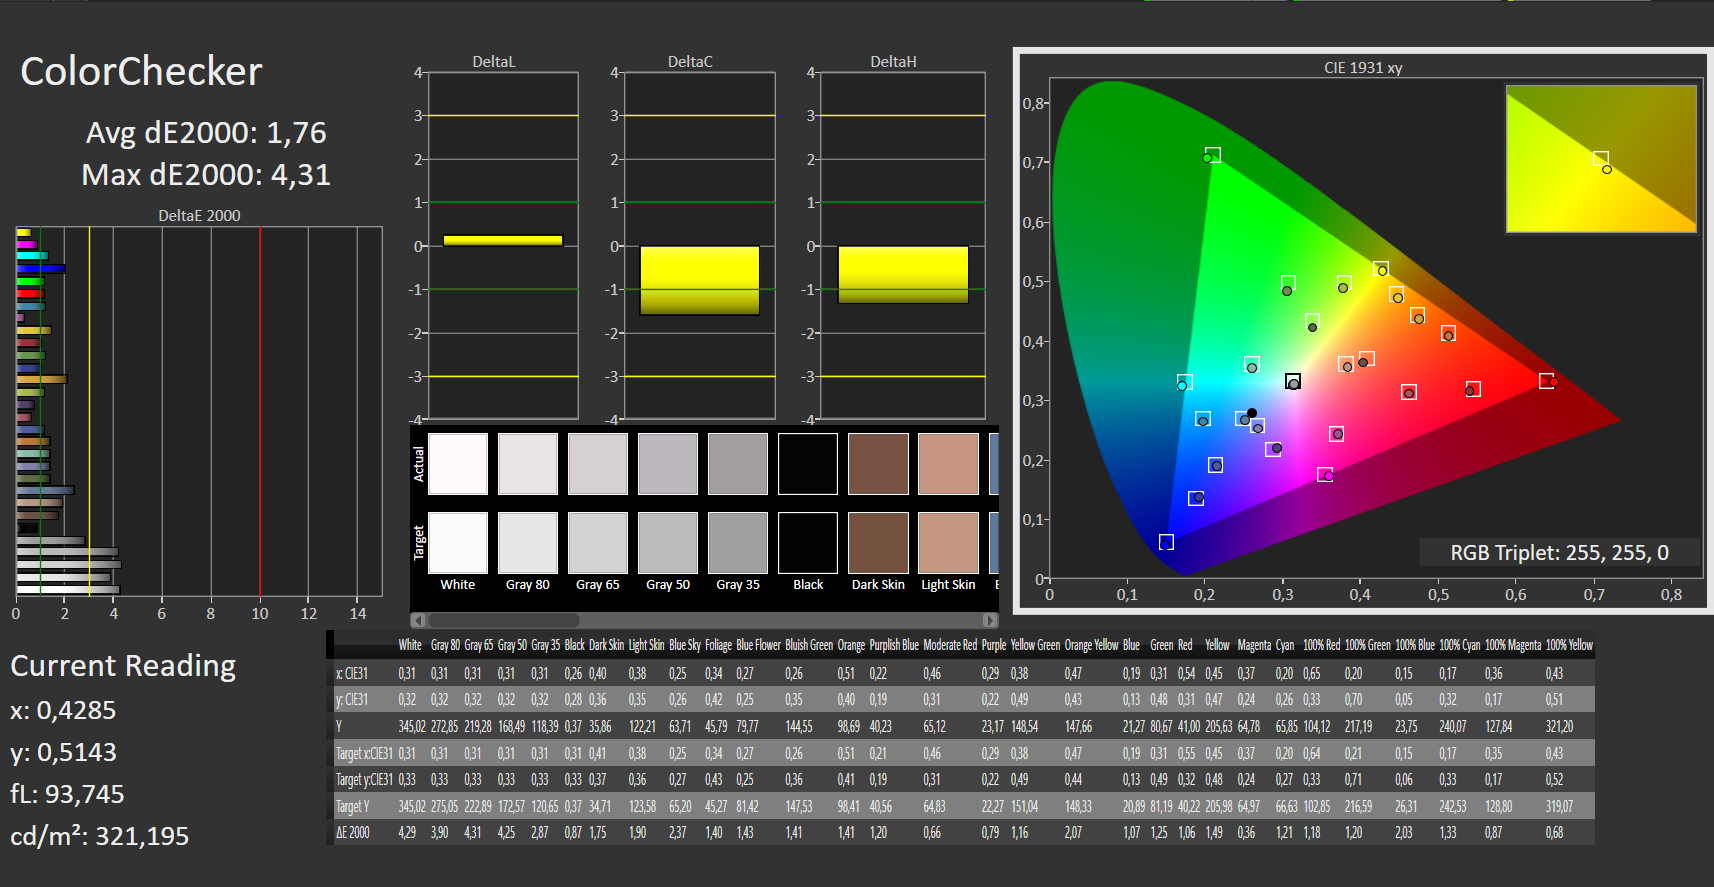
ΔE ColorChecker Calman: 1.76 | ∀{0.5-29.43 Ø4.72}
ΔE Greyscale Calman: 3.12 | ∀{0.09-98 Ø4.97}
98% sRGB (Argyll 1.6.3 3D)
85% AdobeRGB 1998 (Argyll 1.6.3 3D)
95% AdobeRGB 1998 (Argyll 3D)
97.6% sRGB (Argyll 3D)
82.1% Display P3 (Argyll 3D)
Gamma: 2.2
CCT: 6563 K
| Asus ProArt StudioBook Pro 15 W500G5T AU Optronics B156ZAN03.1, IPS, 3840x2160, 15.6" | MSI WS66 10TMT-207US AU Optronics B156HAB03.0, IPS, 1920x1080, 15.6" | Dell Precision 7550 AU Optronics B156ZAN, IPS, 3840x2160, 15.6" | Razer Blade 15 Studio Edition 2020 Samsung SDCA029, OLED, 3840x2160, 15.6" | |
|---|---|---|---|---|
| Display | -23% | 1% | 9% | |
| Display P3 Coverage (%) | 82.1 | 62.8 -24% | 82.1 0% | 99.9 22% |
| sRGB Coverage (%) | 97.6 | 86.9 -11% | 99.6 2% | 100 2% |
| AdobeRGB 1998 Coverage (%) | 95 | 63.6 -33% | 96.8 2% | 97.3 2% |
| Response Times | 21% | 8% | 91% | |
| Response Time Grey 50% / Grey 80% * (ms) | 58 ? | 44.8 ? 23% | 51.2 ? 12% | 4 ? 93% |
| Response Time Black / White * (ms) | 35 ? | 28.8 ? 18% | 34 ? 3% | 4 ? 89% |
| PWM Frequency (Hz) | ||||
| Screen | -25% | -33% | 192% | |
| Brightness middle (cd/m²) | 344 | 374.5 9% | 473.5 38% | 380 10% |
| Brightness (cd/m²) | 335 | 363 8% | 461 38% | 388 16% |
| Brightness Distribution (%) | 93 | 91 -2% | 90 -3% | 93 0% |
| Black Level * (cd/m²) | 0.37 | 0.42 -14% | 0.55 -49% | 0.018 95% |
| Contrast (:1) | 930 | 892 -4% | 861 -7% | 21111 2170% |
| Colorchecker dE 2000 * | 1.76 | 4.05 -130% | 4.8 -173% | 5.47 -211% |
| Colorchecker dE 2000 max. * | 4.31 | 8.17 -90% | 8.73 -103% | 8.19 -90% |
| Greyscale dE 2000 * | 3.12 | 2.6 17% | 5.6 -79% | 5.3 -70% |
| Gamma | 2.2 100% | 2.21 100% | 2.34 94% | 2.15 102% |
| CCT | 6563 99% | 7027 93% | 7549 86% | 6128 106% |
| Color Space (Percent of AdobeRGB 1998) (%) | 85 | 56.4 -34% | 86.4 2% | 86 1% |
| Color Space (Percent of sRGB) (%) | 98 | 86.3 -12% | 99.7 2% | 100 2% |
| Colorchecker dE 2000 calibrated * | 4.36 | 3.08 | 3.04 | |
| Média Total (Programa/Configurações) | -9% /
-19% | -8% /
-21% | 97% /
142% |
* ... menor é melhor
Exibir tempos de resposta
| ↔ Tempo de resposta preto para branco | ||
|---|---|---|
| 35 ms ... ascensão ↗ e queda ↘ combinadas | ↗ 20 ms ascensão | 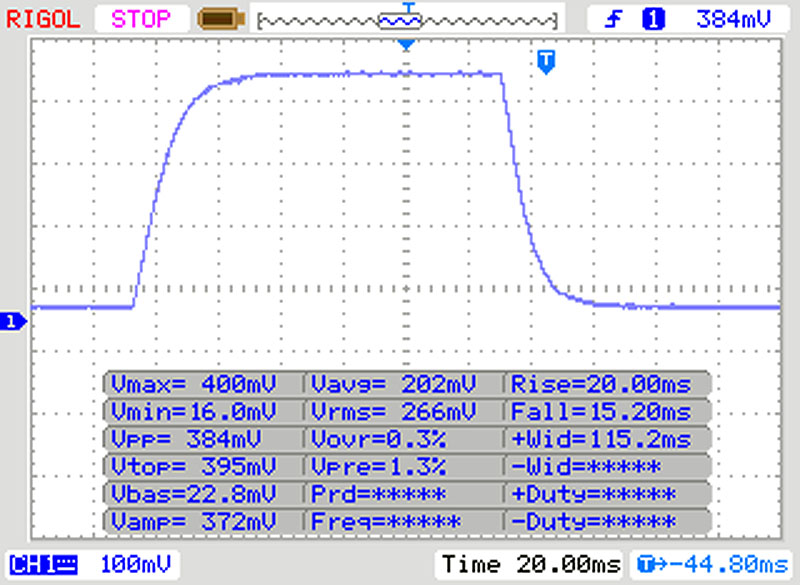 |
| ↘ 15 ms queda | ||
| A tela mostra taxas de resposta lentas em nossos testes e será insatisfatória para os jogadores. Em comparação, todos os dispositivos testados variam de 0.1 (mínimo) a 240 (máximo) ms. » 92 % de todos os dispositivos são melhores. Isso significa que o tempo de resposta medido é pior que a média de todos os dispositivos testados (19.9 ms). | ||
| ↔ Tempo de resposta 50% cinza a 80% cinza | ||
| 58 ms ... ascensão ↗ e queda ↘ combinadas | ↗ 27 ms ascensão | 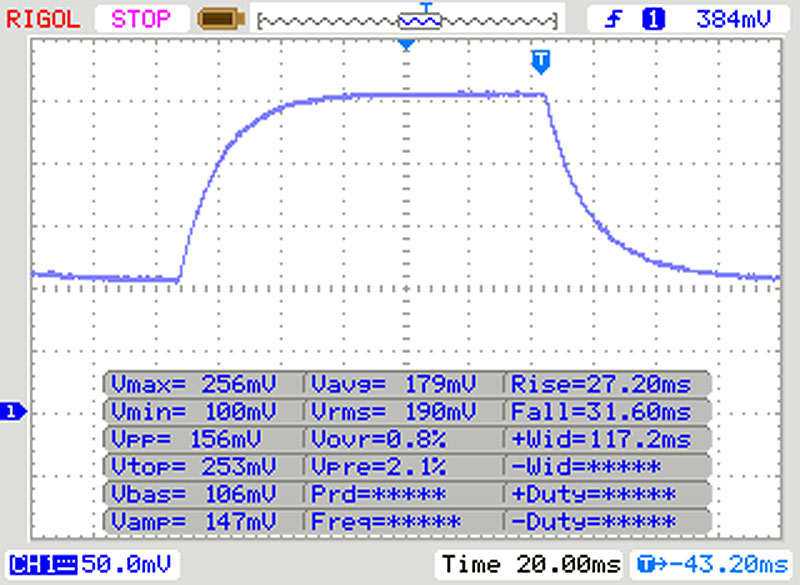 |
| ↘ 31 ms queda | ||
| A tela mostra taxas de resposta lentas em nossos testes e será insatisfatória para os jogadores. Em comparação, todos os dispositivos testados variam de 0.165 (mínimo) a 636 (máximo) ms. » 94 % de todos os dispositivos são melhores. Isso significa que o tempo de resposta medido é pior que a média de todos os dispositivos testados (31.1 ms). | ||
Cintilação da tela / PWM (modulação por largura de pulso)
| Tela tremeluzindo / PWM não detectado | 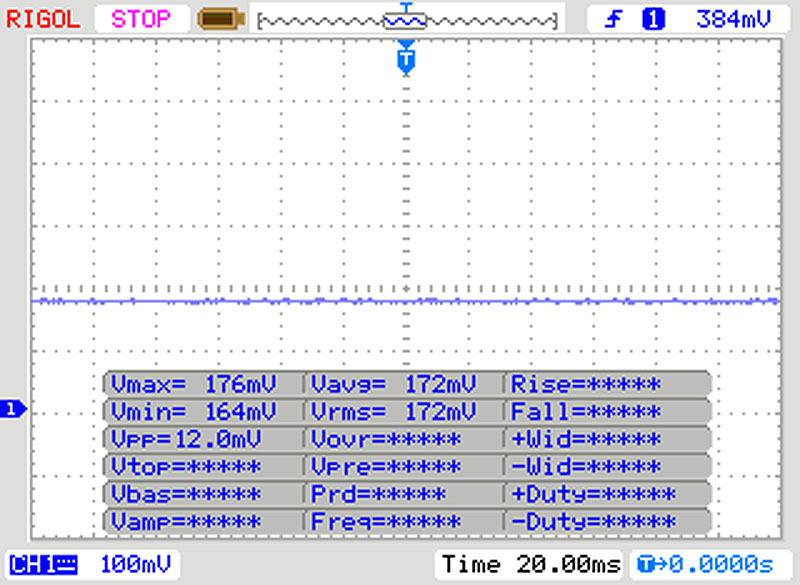 | ||
[pwm_comparison] Em comparação: 52 % de todos os dispositivos testados não usam PWM para escurecer a tela. Se PWM foi detectado, uma média de 7784 (mínimo: 5 - máximo: 343500) Hz foi medida. | |||
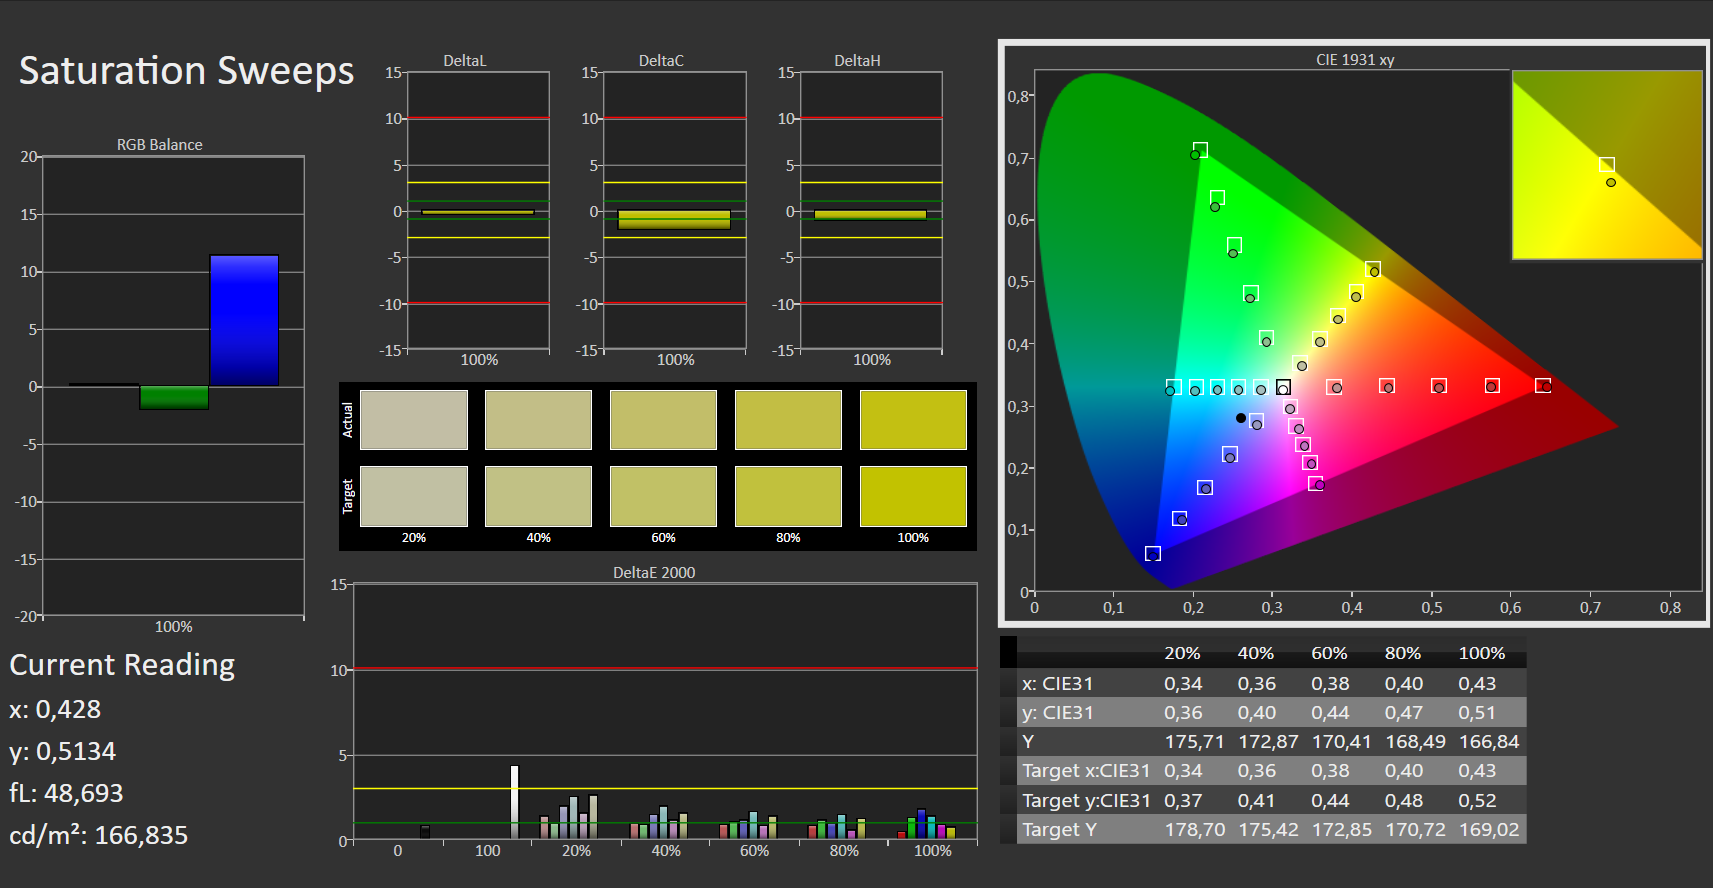
Logo de saída da caixa, o display certificado Pantone oferece uma reprodução de cores muito boa. O desvio de cor do DeltaE 2000 é de 1,8 (DeltaE menos de 3 é o valor ideal). O mostrador não sofre de um molde azulado. A tela se sai muito bem quando se trata de cobertura de espaço colorido. O painel cobre 98% do sRGB e 85% do AdobeRGB
O painel IPS do W500G5T oferece ângulos de visão muito estáveis. É por isso que o conteúdo da tela pode ser lido a partir de qualquer posição. No exterior, o dispositivo só pode ser usado quando o sol não brilha muito
Desempenho - Poderoso o suficiente para todas as aplicações
O Asus ProArt StudioBook Pro 15 W500G5T é uma estação de trabalho fina e compacta com uma tela de 15,6 polegadas. Ele pode lidar com todas as aplicações atuais. Nosso dispositivo de revisão de varejo por cerca de 5000 Euros (~$5908) e representa a configuração mais cara
Configurações do sistema
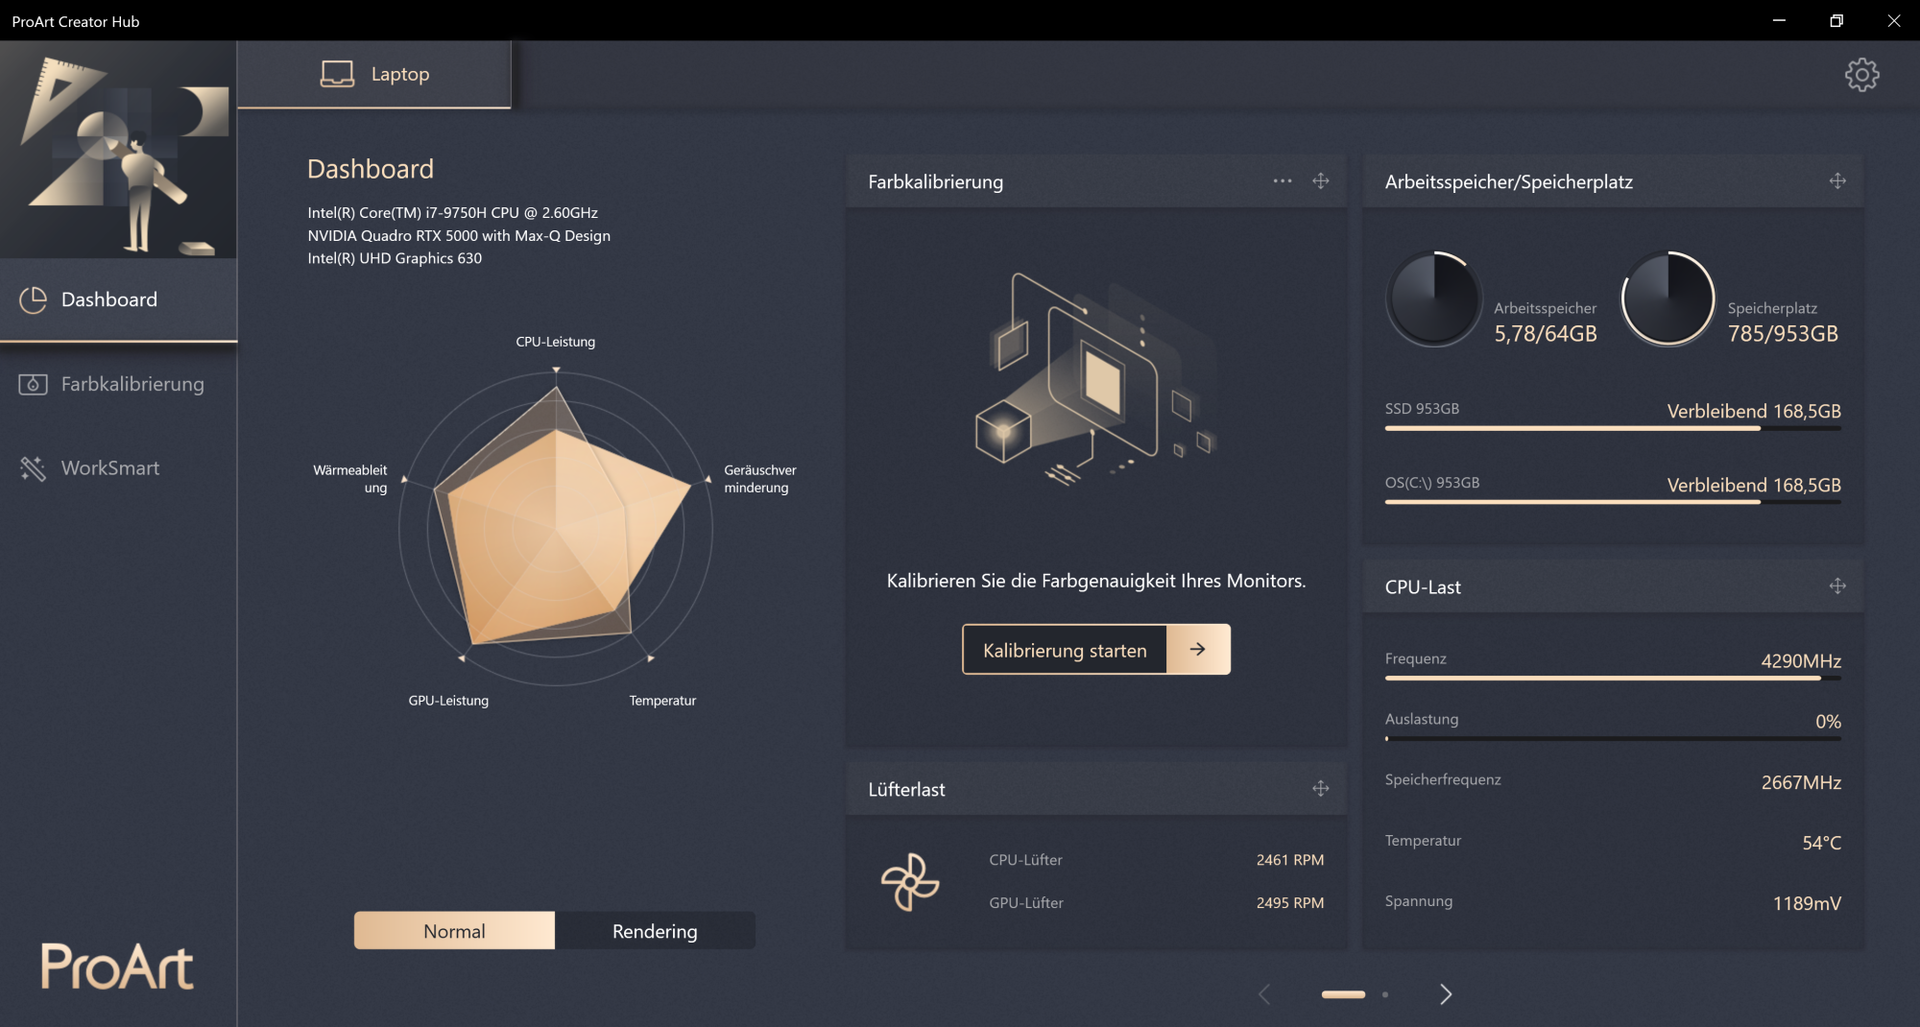
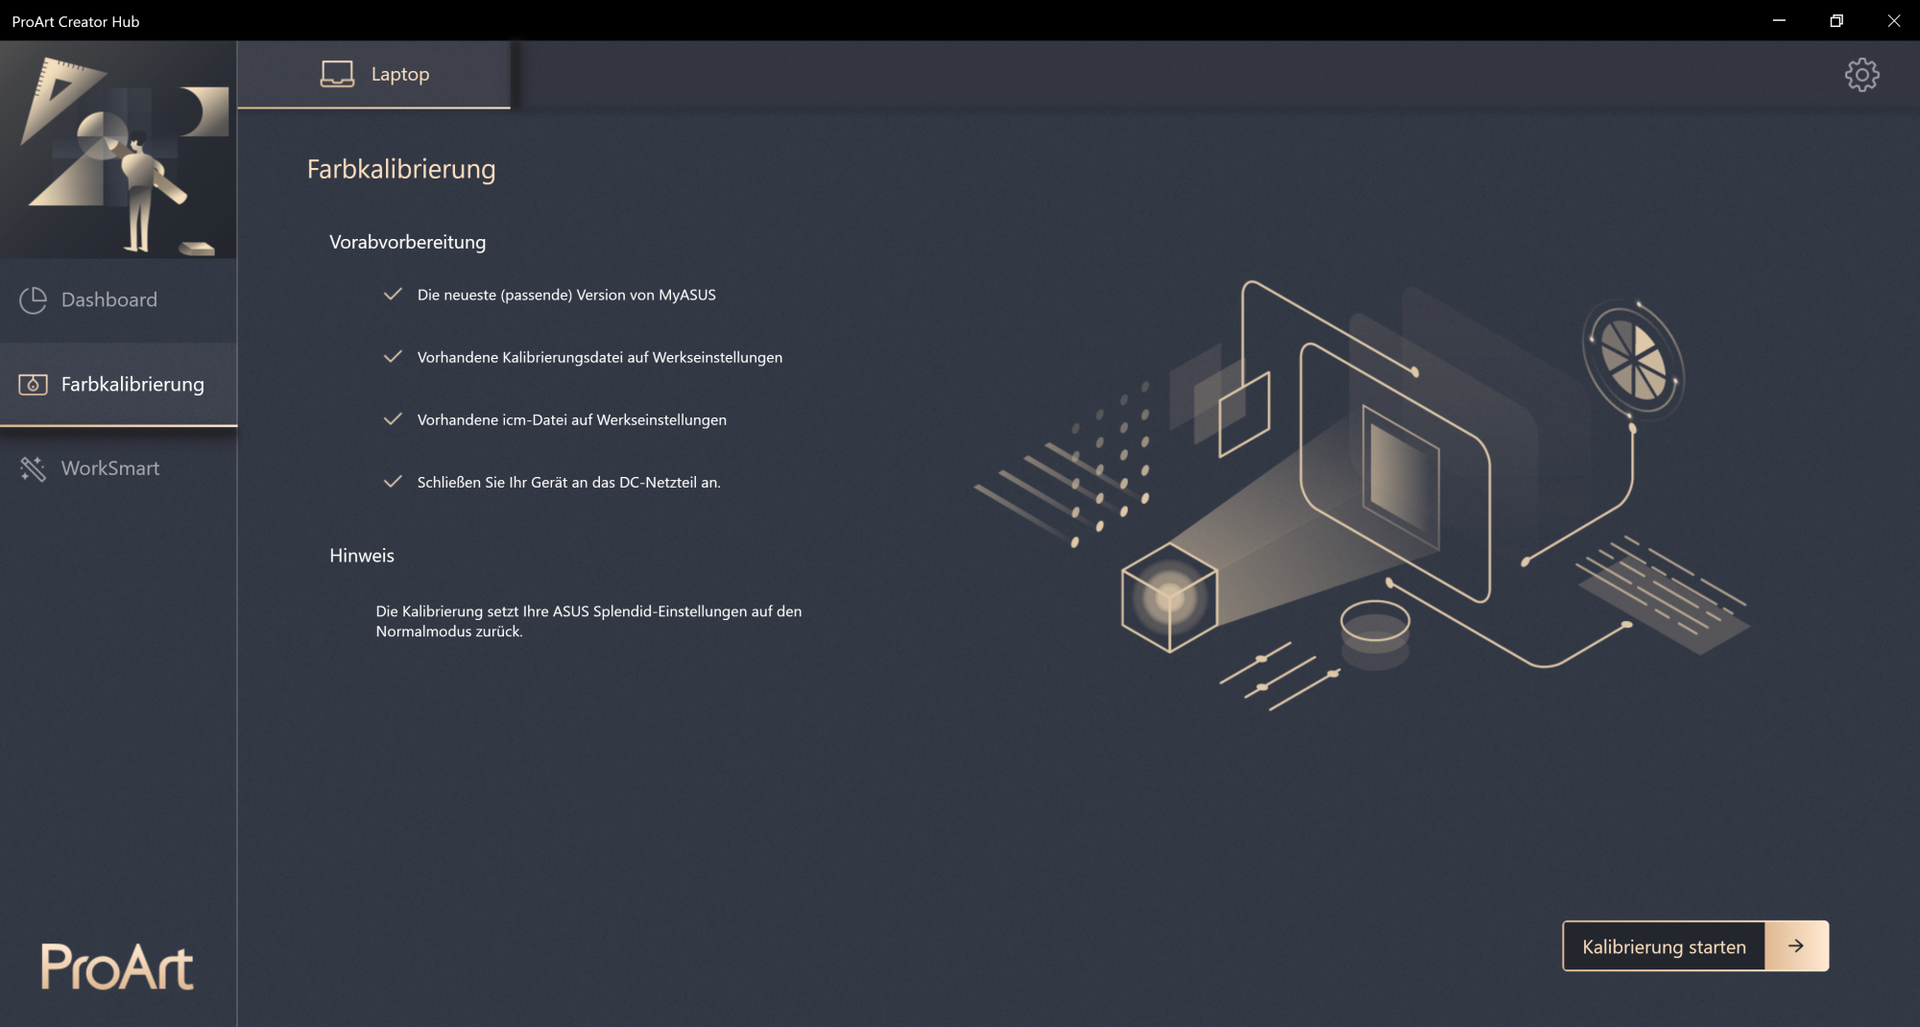
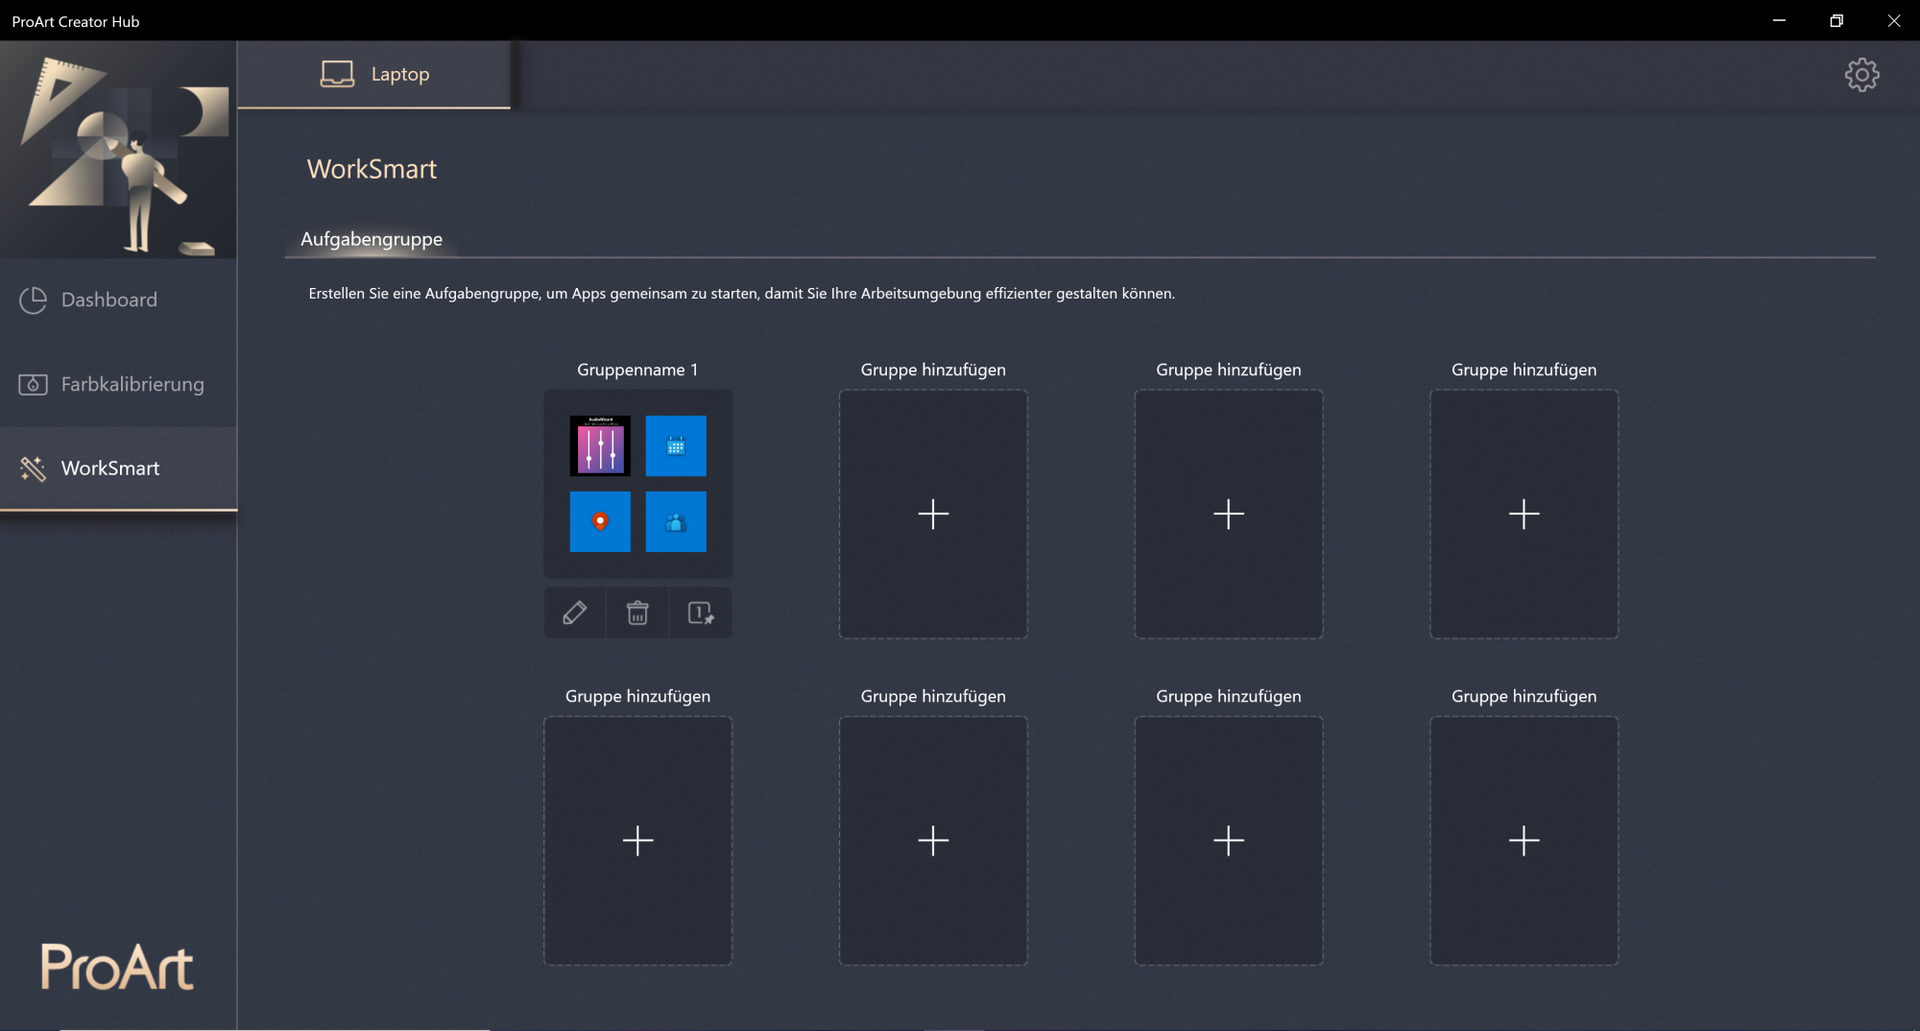
A concessionária ProArt Creator Hub
oferece dois planos de energia. Conduzimos a maioria de nossos benchmarks usando o plano de energia Normal
. Entretanto, realizamos alguns benchmarks com o plano de energia Rendering
também. Os usuários podem alternar entre os dois planos de energia pressionando F11
ou no ProArt Creator Hub
. Entretanto, ele não é pré-instalado, mas pode ser facilmente baixado do Microsoft Store.
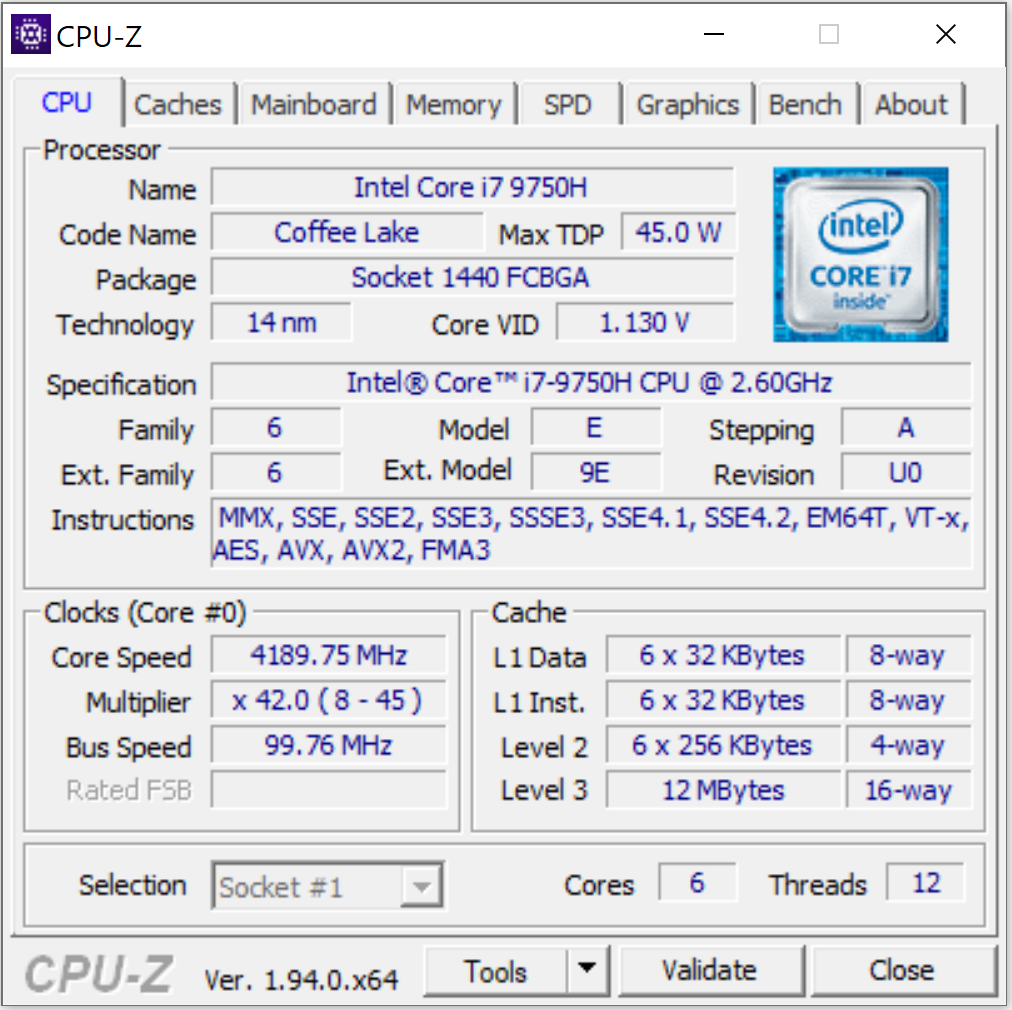
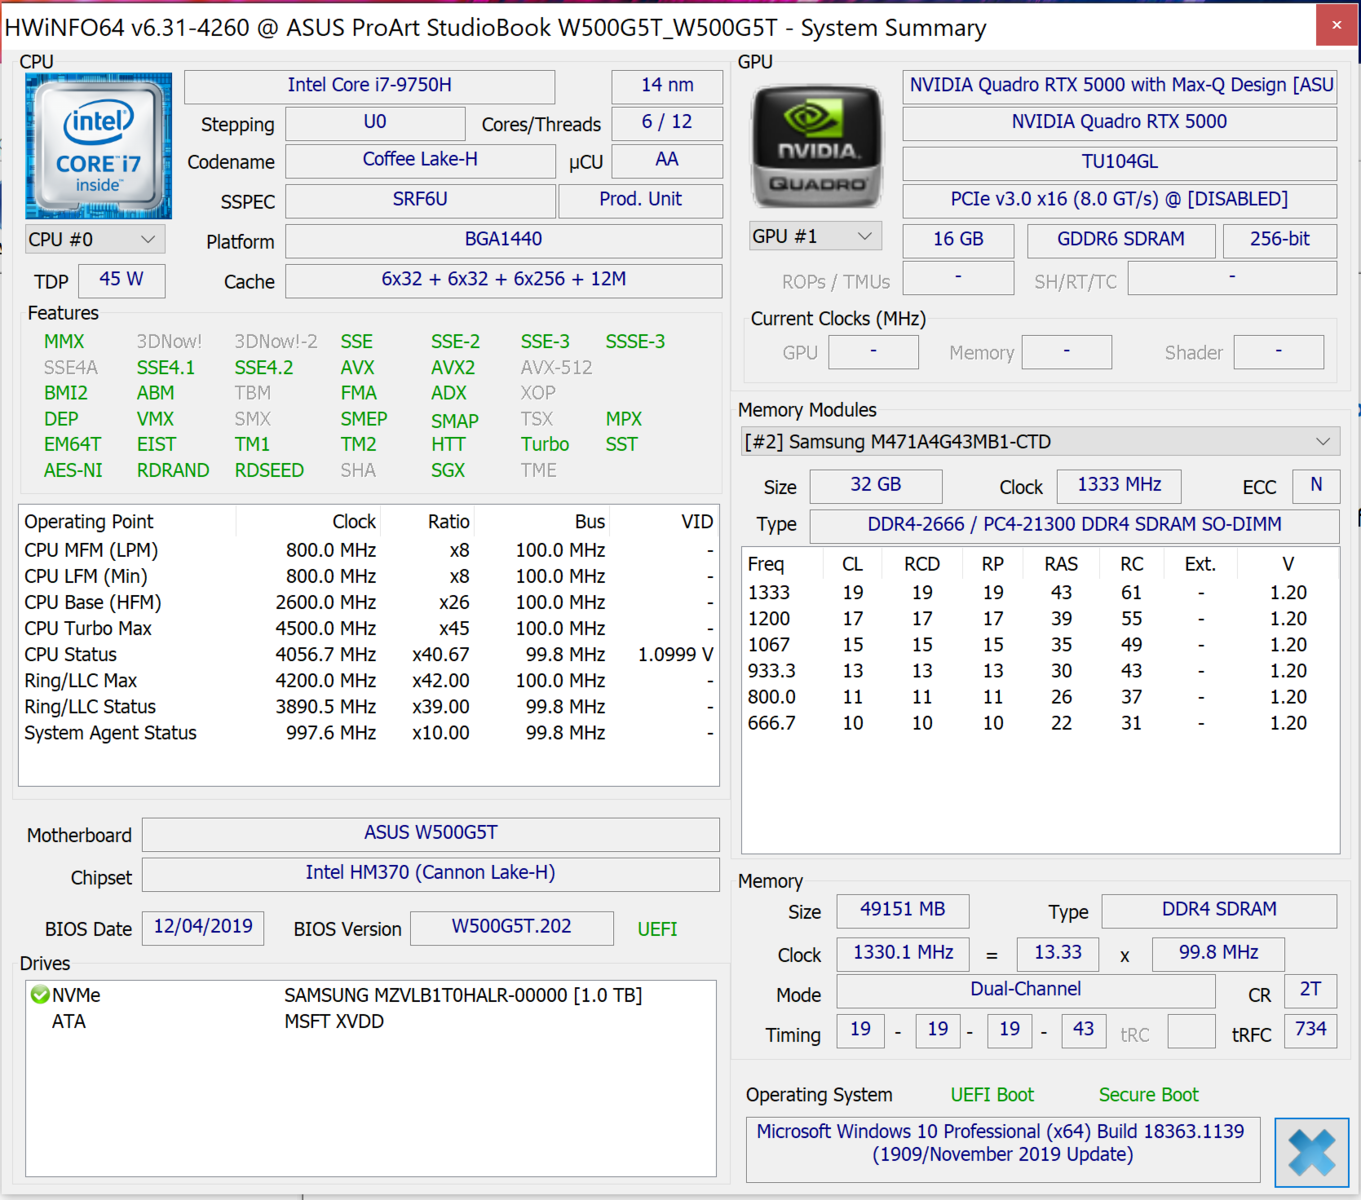
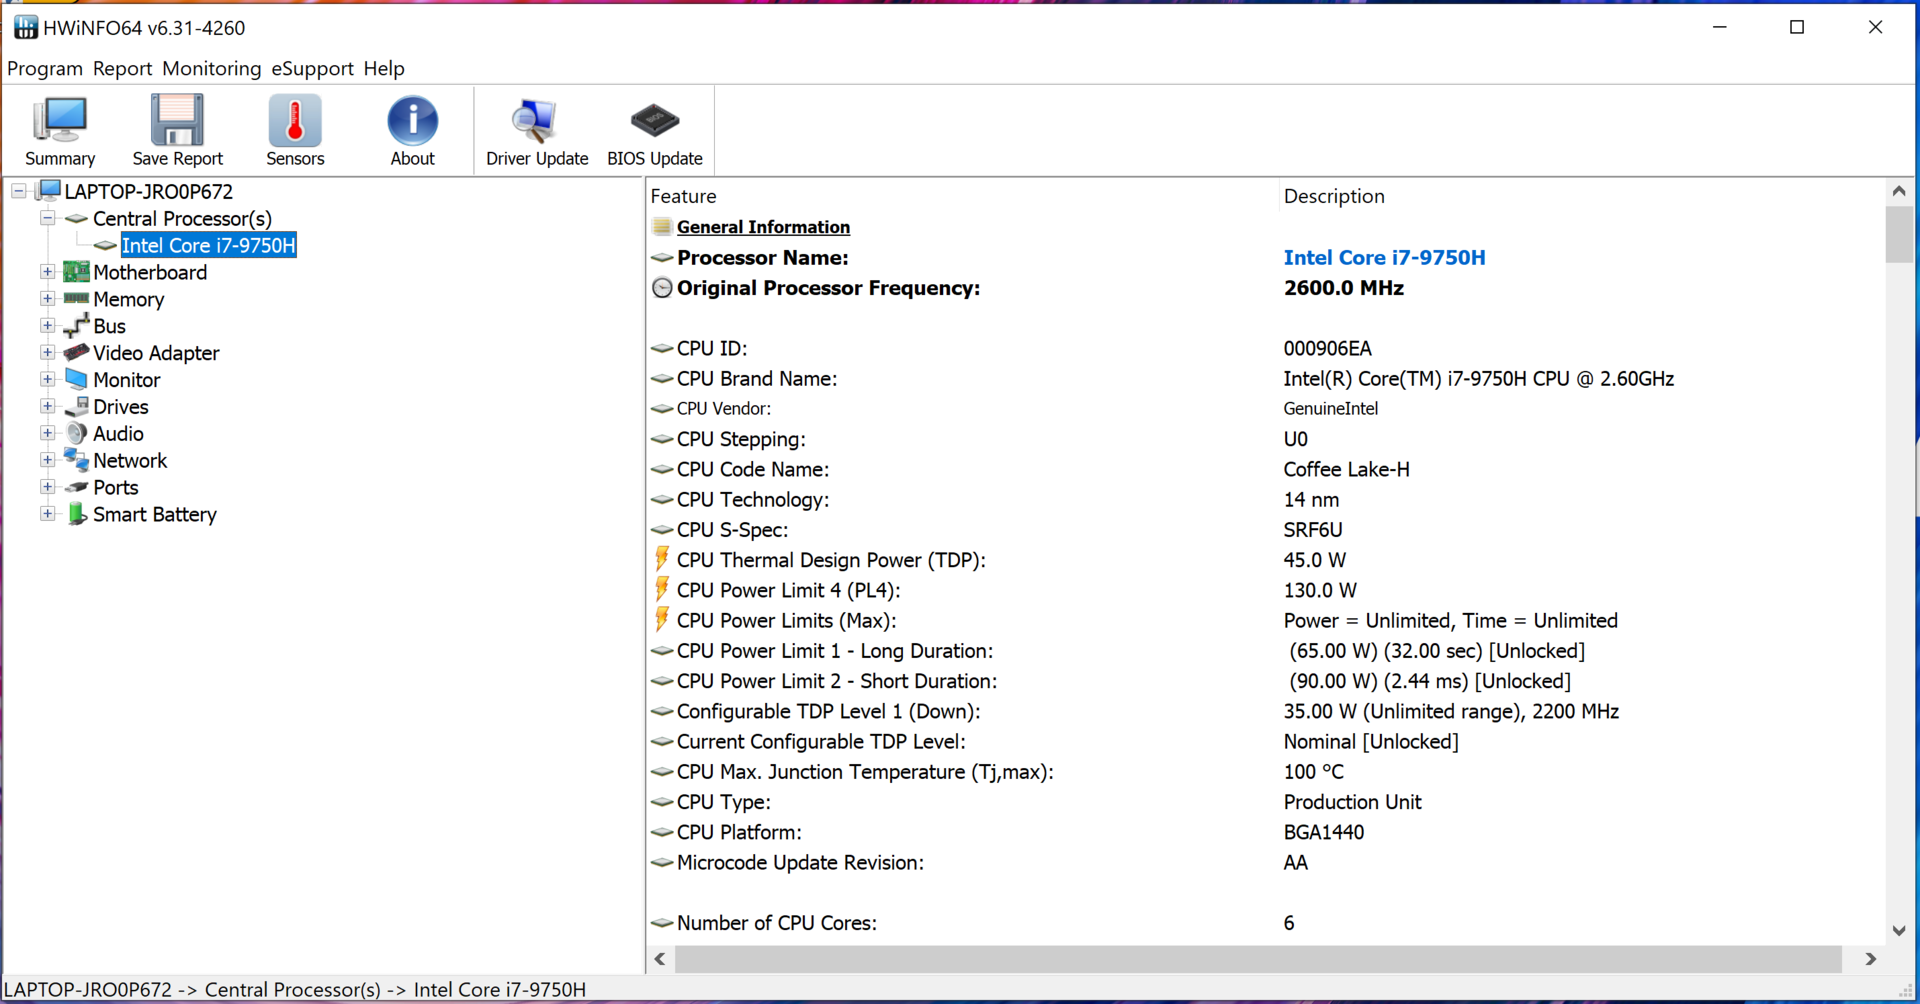
Processador
O StudioBook vem com o Core i7-9750H, que é uma CPU hexa-core baseada na arquitetura Coffee Lake Refresh. O processador tem uma taxa de relógio base de 2,6 GHz. Graças à tecnologia Turbo Boost da Intel, a taxa de clock pode ser aumentada até 4 GHz para todos os seis núcleos e até 4,5 GHz para um único núcleo. O chip Intel suporta Hyper-threading, o que significa que cada núcleo pode processar dois fios ao mesmo tempo
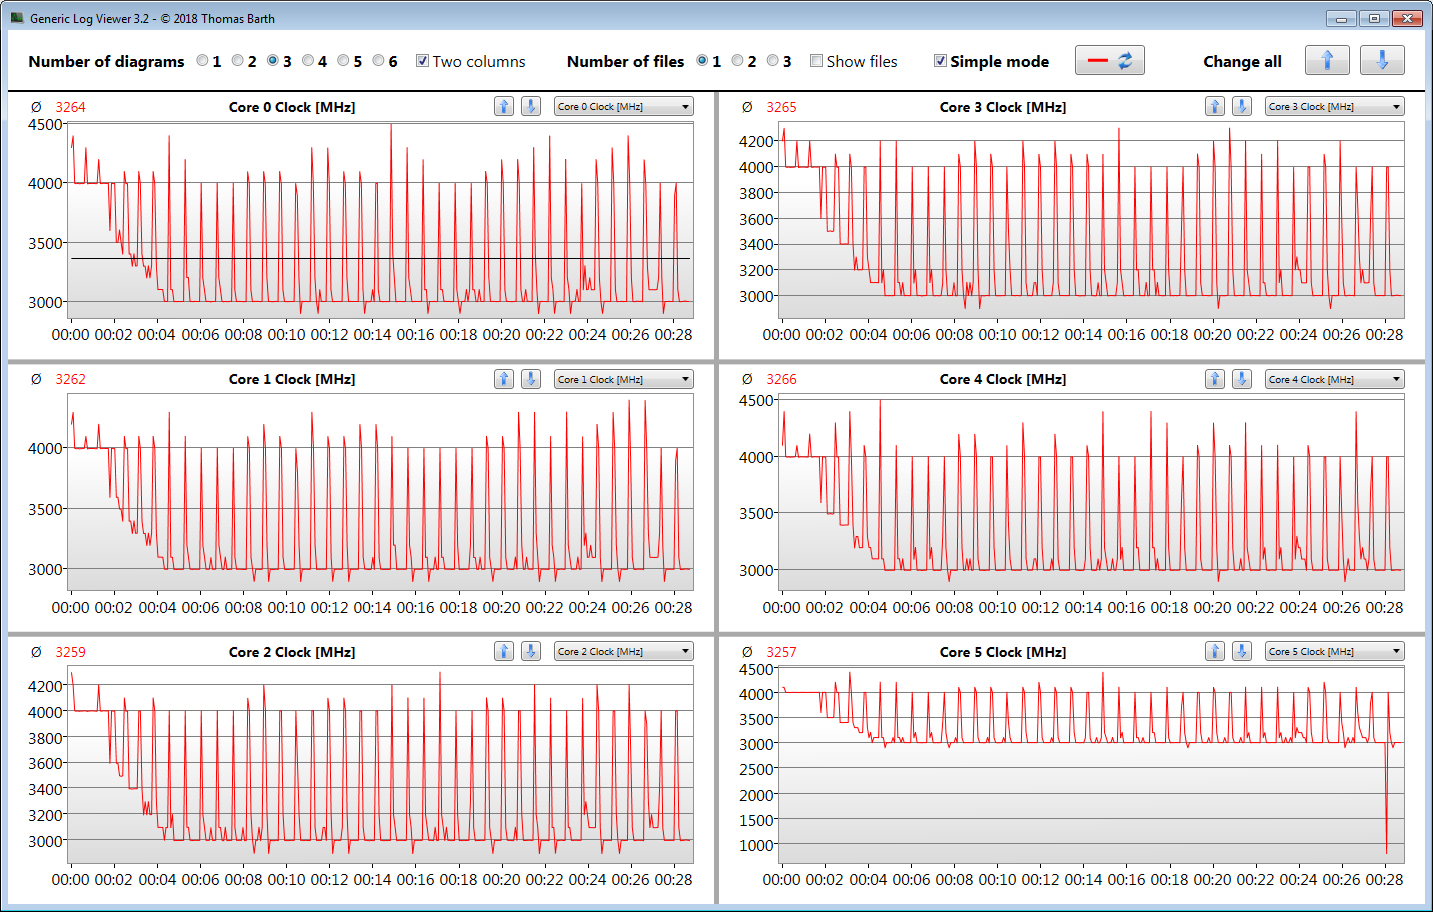
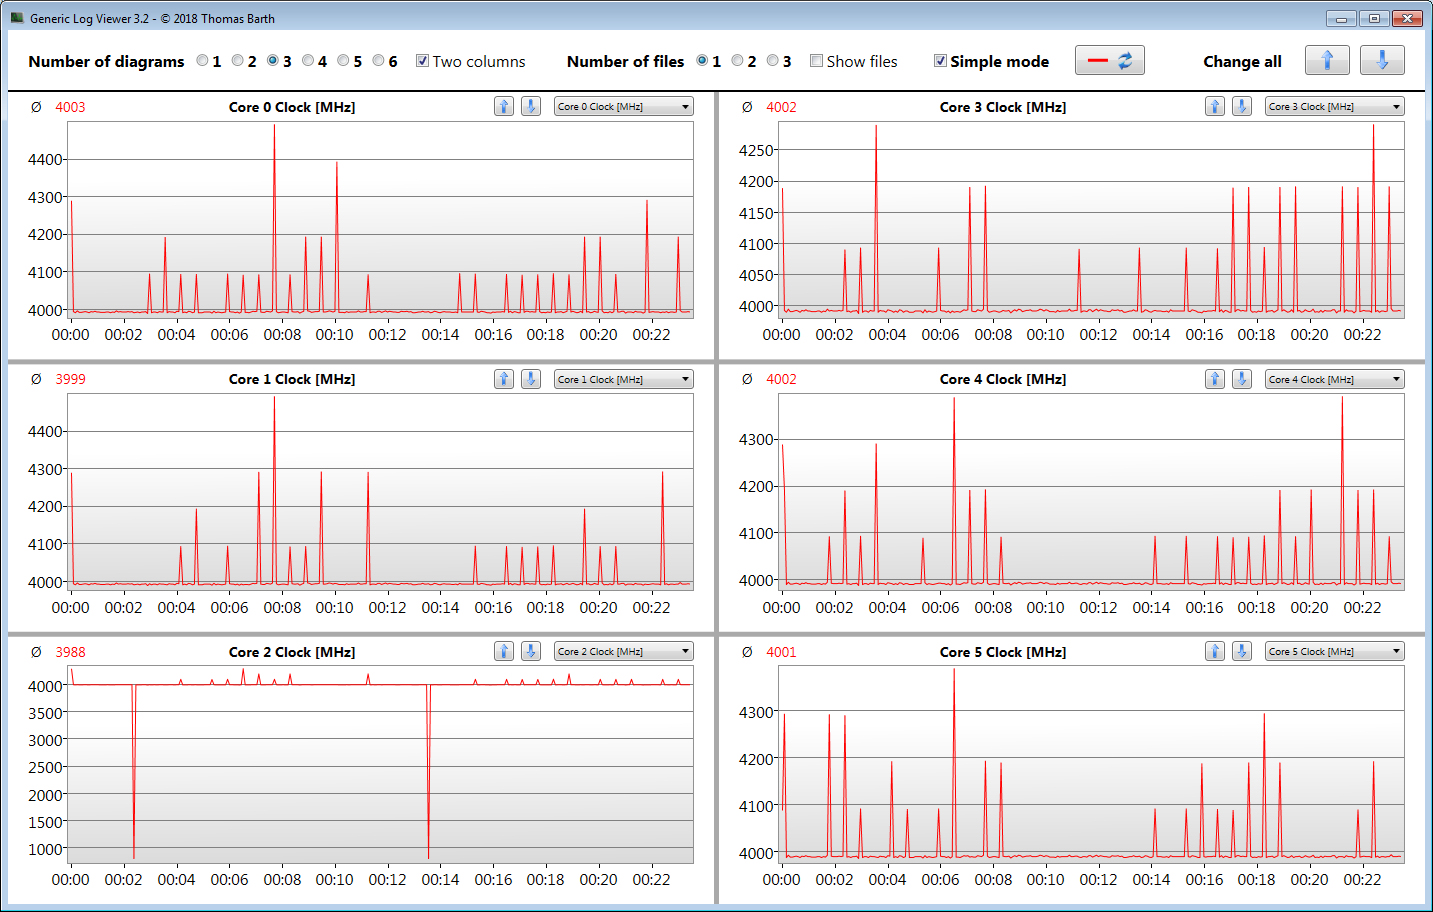
Na seção multi-core do benchmark Cinebench R15, a CPU funciona a 4 GHz quando conectada. Quando funcionando com bateria, a freqüência da CPU flutua entre 800 MHz e 4 GHz. As taxas de relógio flutuam entre 4 e 4,5 GHz no benchmark de um só núcleo
Verificamos se o Turbo boost pode ser usado durante um longo período de tempo, executando o benchmark Cinebench multi-core em um loop contínuo por 30 minutos. A tecnologia de turboalimentação é utilizada em nível médio. No modo Rendering
, que você pode ativar no ProArt Creator Hub
, a CPU é capaz de manter velocidades de relógio mais altas.
| Cinebench R15 | |
| CPU Single 64Bit | |
| Média da turma Workstation (191.4 - 328, n=25, últimos 2 anos) | |
| MSI WS66 10TMT-207US | |
| Dell Precision 7550 | |
| Razer Blade 15 Studio Edition 2020 | |
| Asus ProArt StudioBook Pro 15 W500G5T | |
| Asus ProArt StudioBook Pro 15 W500G5T (Rendering) | |
| Média Intel Core i7-9750H (170 - 194, n=82) | |
| CPU Multi 64Bit | |
| Média da turma Workstation (2489 - 5810, n=25, últimos 2 anos) | |
| MSI WS66 10TMT-207US | |
| Dell Precision 7550 | |
| Asus ProArt StudioBook Pro 15 W500G5T (Rendering) | |
| Asus ProArt StudioBook Pro 15 W500G5T | |
| Média Intel Core i7-9750H (952 - 1306, n=85) | |
| Razer Blade 15 Studio Edition 2020 | |
| Blender - v2.79 BMW27 CPU | |
| Asus ProArt StudioBook Pro 15 W500G5T | |
| Média Intel Core i7-9750H (342 - 495, n=21) | |
| Razer Blade 15 Studio Edition 2020 | |
| Asus ProArt StudioBook Pro 15 W500G5T (Rendering) | |
| Dell Precision 7550 | |
| MSI WS66 10TMT-207US | |
| Média da turma Workstation (91 - 261, n=25, últimos 2 anos) | |
| 7-Zip 18.03 | |
| 7z b 4 -mmt1 | |
| Média da turma Workstation (5126 - 6960, n=25, últimos 2 anos) | |
| Dell Precision 7550 | |
| MSI WS66 10TMT-207US | |
| Razer Blade 15 Studio Edition 2020 | |
| Asus ProArt StudioBook Pro 15 W500G5T | |
| Média Intel Core i7-9750H (4580 - 5090, n=21) | |
| Asus ProArt StudioBook Pro 15 W500G5T (Rendering) | |
| 7z b 4 | |
| Média da turma Workstation (54741 - 116969, n=25, últimos 2 anos) | |
| MSI WS66 10TMT-207US | |
| Dell Precision 7550 | |
| Razer Blade 15 Studio Edition 2020 | |
| Asus ProArt StudioBook Pro 15 W500G5T (Rendering) | |
| Asus ProArt StudioBook Pro 15 W500G5T | |
| Média Intel Core i7-9750H (28512 - 35174, n=21) | |
| HWBOT x265 Benchmark v2.2 - 4k Preset | |
| Média da turma Workstation (14.4 - 40.5, n=25, últimos 2 anos) | |
| Dell Precision 7550 | |
| MSI WS66 10TMT-207US | |
| Asus ProArt StudioBook Pro 15 W500G5T (Rendering) | |
| Razer Blade 15 Studio Edition 2020 | |
| Média Intel Core i7-9750H (7.1 - 10.7, n=21) | |
| Asus ProArt StudioBook Pro 15 W500G5T | |
| LibreOffice - 20 Documents To PDF | |
| Asus ProArt StudioBook Pro 15 W500G5T (Rendering) | |
| Asus ProArt StudioBook Pro 15 W500G5T | |
| Média Intel Core i7-9750H (54.5 - 64.7, n=9) | |
| Média da turma Workstation (37.1 - 74.7, n=25, últimos 2 anos) | |
| Razer Blade 15 Studio Edition 2020 | |
| Dell Precision 7550 | |
| MSI WS66 10TMT-207US | |
| R Benchmark 2.5 - Overall mean | |
| Asus ProArt StudioBook Pro 15 W500G5T (Rendering) | |
| Asus ProArt StudioBook Pro 15 W500G5T | |
| Média Intel Core i7-9750H (0.608 - 0.695, n=14) | |
| Razer Blade 15 Studio Edition 2020 | |
| MSI WS66 10TMT-207US | |
| Dell Precision 7550 | |
| Média da turma Workstation (0.3825 - 0.603, n=25, últimos 2 anos) | |
* ... menor é melhor
Desempenho do sistema
O StudioBook se sente muito responsivo. Ele oferece potência computacional suficiente para todas as aplicações atuais. Os bons resultados nos benchmarks da PCMark confirmam esta impressão

| PCMark 8 Home Score Accelerated v2 | 3524 pontos | |
| PCMark 8 Creative Score Accelerated v2 | 3985 pontos | |
| PCMark 8 Work Score Accelerated v2 | 4436 pontos | |
| PCMark 10 Score | 4877 pontos | |
Ajuda | ||
Latências DPC
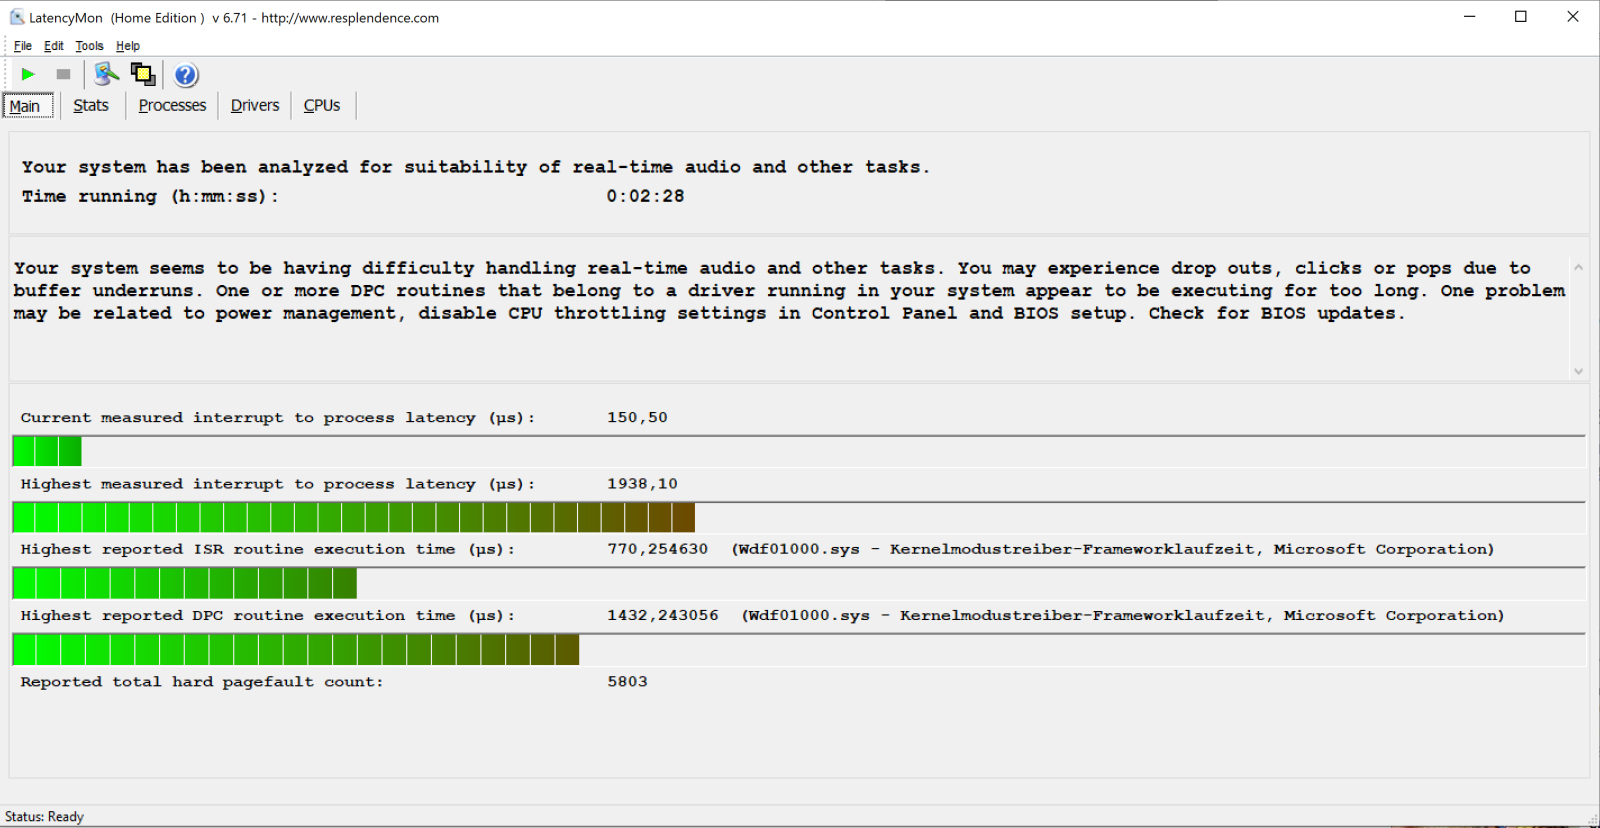
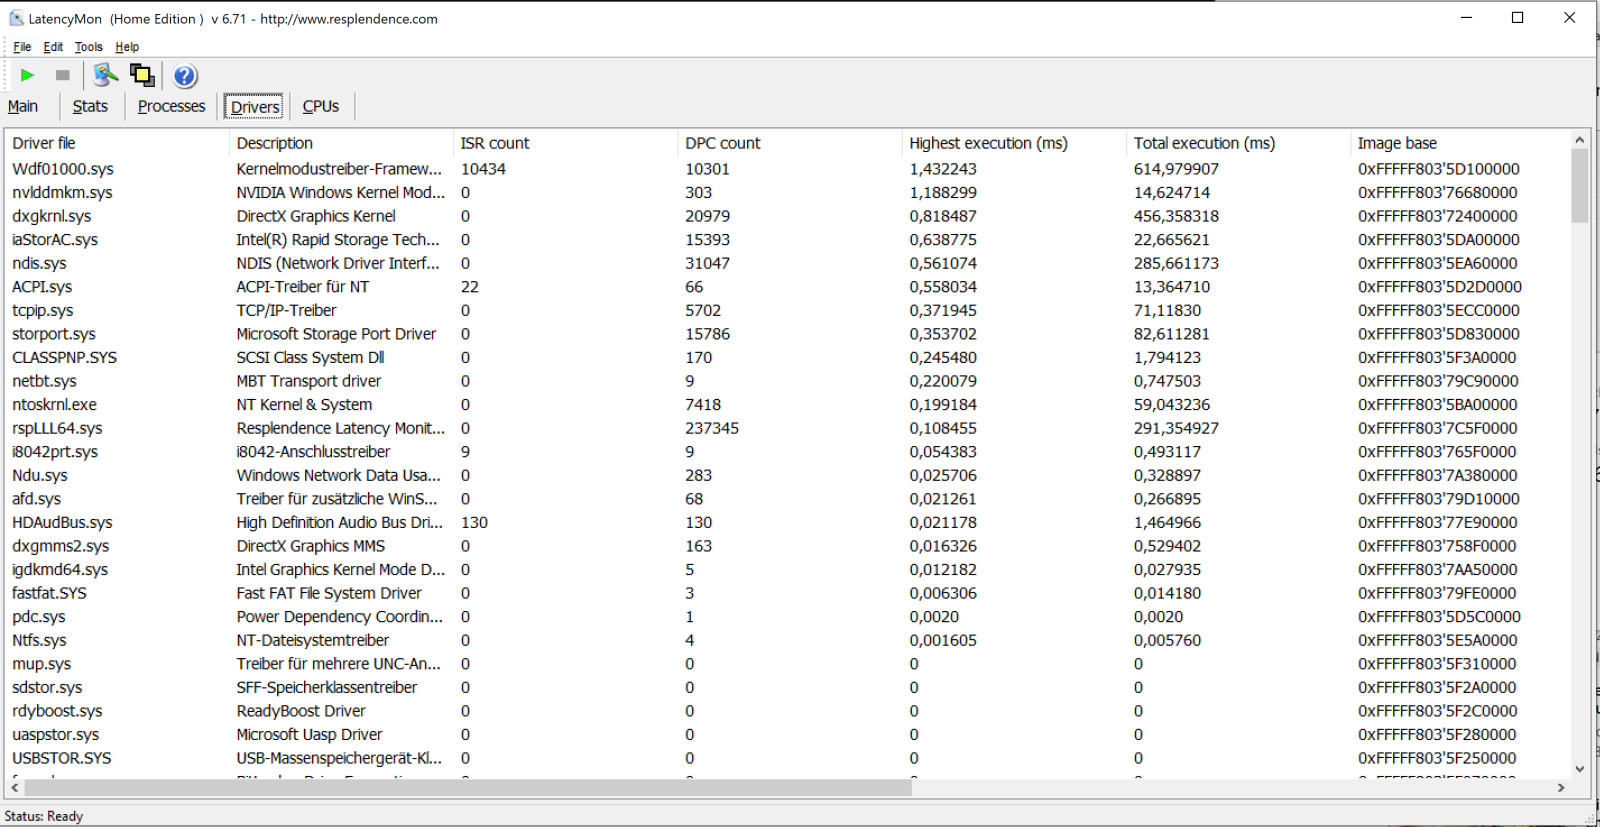
| DPC Latencies / LatencyMon - interrupt to process latency (max), Web, Youtube, Prime95 | |
| Asus ProArt StudioBook Pro 15 W500G5T | |
* ... menor é melhor
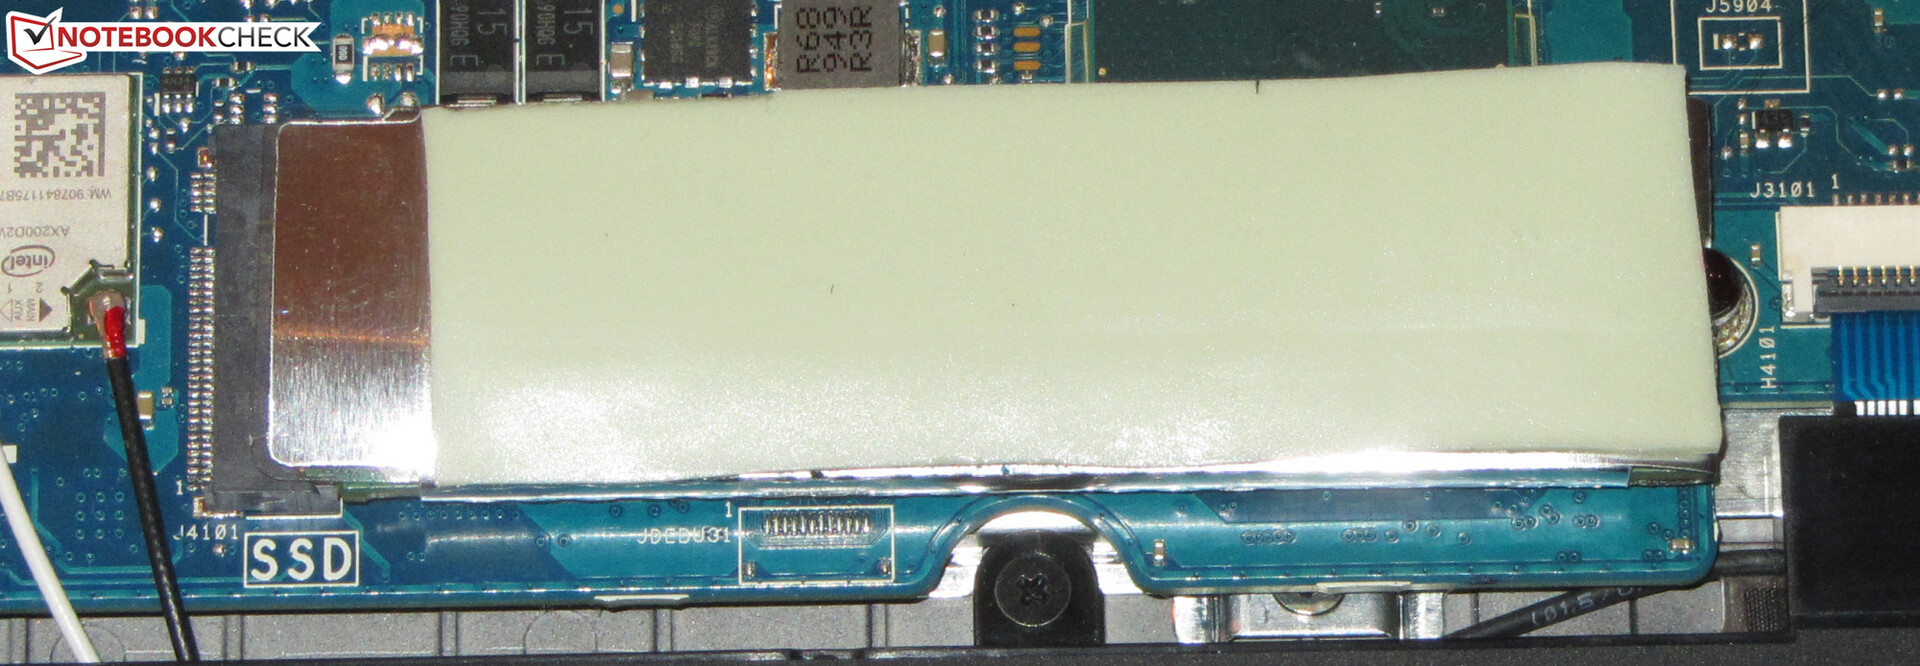
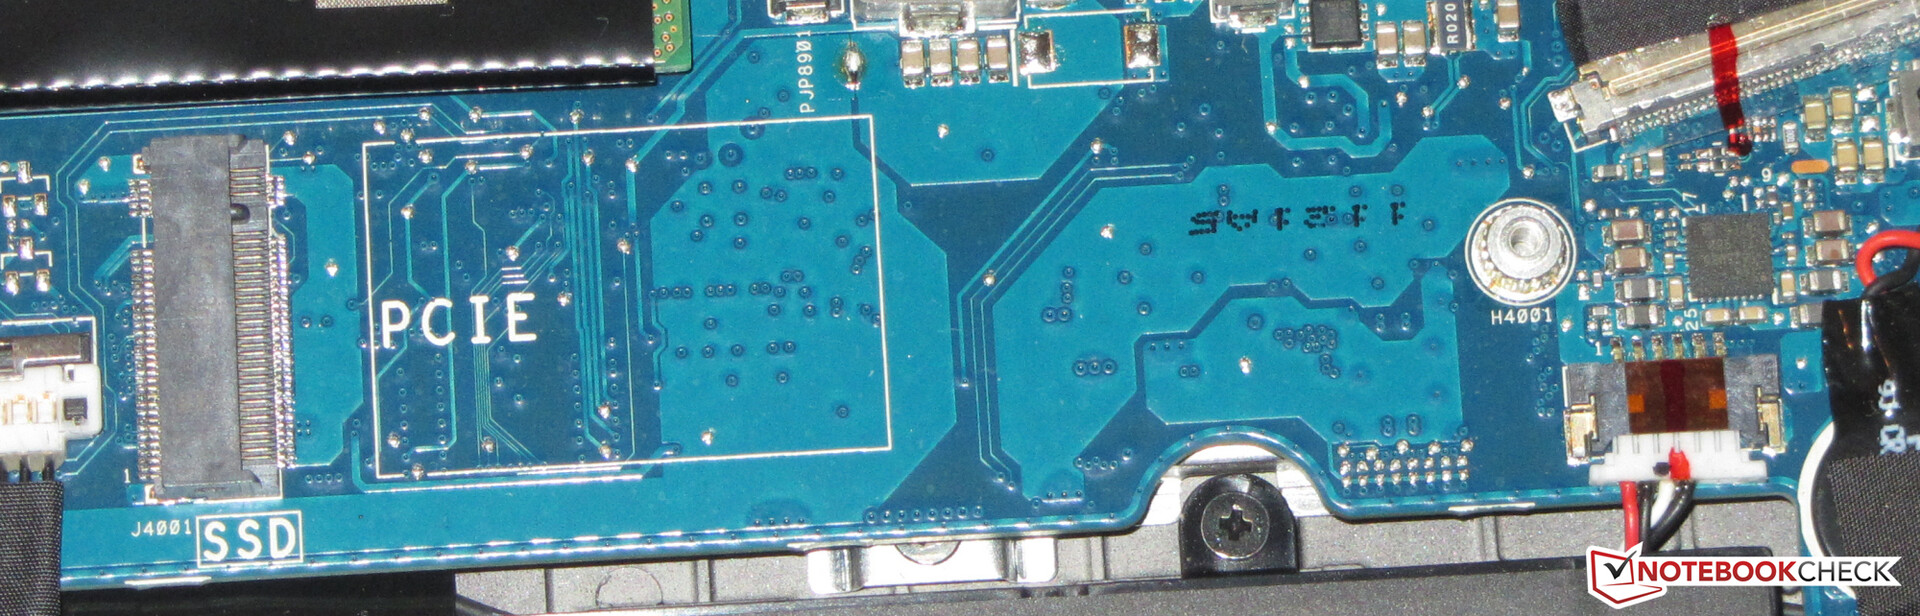
Dispositivos de armazenamento
Asus utiliza um SSD NVMe da Samsung. O SSD vem no fator de forma M.2-2280 e tem uma capacidade de 1 TB. Um SSD NVMe adicional pode ser instalado. O RAID 0 é suportado

| Asus ProArt StudioBook Pro 15 W500G5T Samsung SSD PM981 MZVLB1T0HALR | MSI WS66 10TMT-207US WDC PC SN730 SDBPNTY-1T00 | Dell Precision 7550 SK Hynix PC601A NVMe 1TB | Razer Blade 15 Studio Edition 2020 Samsung PM981a MZVLB1T0HBLR | Média Samsung SSD PM981 MZVLB1T0HALR | Média da turma Workstation | |
|---|---|---|---|---|---|---|
| CrystalDiskMark 5.2 / 6 | 3% | -13% | -2% | -14% | 65% | |
| Write 4K (MB/s) | 1107 | 185.8 -83% | 121 -89% | 132.9 -88% | 165.7 ? -85% | 168.1 ? -85% |
| Read 4K (MB/s) | 43.38 | 47.21 9% | 42.16 -3% | 46.73 8% | 44.6 ? 3% | 69.6 ? 60% |
| Write Seq (MB/s) | 2387 | 2874 20% | 2150 -10% | 2214 -7% | 1982 ? -17% | 3868 ? 62% |
| Read Seq (MB/s) | 2431 | 1786 -27% | 1755 -28% | 2018 -17% | 1764 ? -27% | 4279 ? 76% |
| Write 4K Q32T1 (MB/s) | 340.7 | 466.8 37% | 395.3 16% | 478.9 41% | 395 ? 16% | 495 ? 45% |
| Read 4K Q32T1 (MB/s) | 397.8 | 563 42% | 381.8 -4% | 540 36% | 434 ? 9% | 604 ? 52% |
| Write Seq Q32T1 (MB/s) | 2390 | 3091 29% | 2730 14% | 2975 24% | 2351 ? -2% | 6486 ? 171% |
| Read Seq Q32T1 (MB/s) | 3502 | 3395 -3% | 3468 -1% | 3195 -9% | 3234 ? -8% | 8420 ? 140% |
| AS SSD | 8% | -30% | -12% | -9% | 46% | |
| Seq Read (MB/s) | 2702 | 2321 -14% | 2028 -25% | 1982 -27% | 1993 ? -26% | 6044 ? 124% |
| Seq Write (MB/s) | 2348 | 2620 12% | 1193 -49% | 2252 -4% | 2036 ? -13% | 4240 ? 81% |
| 4K Read (MB/s) | 37.59 | 48.57 29% | 42.31 13% | 47.13 25% | 46.4 ? 23% | 65.4 ? 74% |
| 4K Write (MB/s) | 107.1 | 165.1 54% | 105.5 -1% | 88.2 -18% | 109.7 ? 2% | 187.6 ? 75% |
| 4K-64 Read (MB/s) | 1491 | 1712 15% | 1128 -24% | 1481 -1% | 1502 ? 1% | 1383 ? -7% |
| 4K-64 Write (MB/s) | 1794 | 2174 21% | 1537 -14% | 1842 3% | 1625 ? -9% | 3005 ? 68% |
| Access Time Read * (ms) | 0.046 | 0.057 -24% | 0.069 -50% | 0.087 -89% | 0.05158 ? -12% | 0.05364 ? -17% |
| Access Time Write * (ms) | 0.034 | 0.068 -100% | 0.106 -212% | 0.04 -18% | 0.05581 ? -64% | 0.04396 ? -29% |
| Score Read (Points) | 1798 | 1993 11% | 1373 -24% | 1726 -4% | 1747 ? -3% | 2050 ? 14% |
| Score Write (Points) | 2136 | 2601 22% | 1762 -18% | 2155 1% | 1942 ? -9% | 3617 ? 69% |
| Score Total (Points) | 4835 | 5630 16% | 3801 -21% | 4781 -1% | 4588 ? -5% | 6638 ? 37% |
| Copy ISO MB/s (MB/s) | 2302 | 2589 12% | 1768 -23% | 1982 -14% | 2280 ? -1% | 3191 ? 39% |
| Copy Program MB/s (MB/s) | 564 | 791 40% | 627 11% | 501 -11% | 558 ? -1% | 915 ? 62% |
| Copy Game MB/s (MB/s) | 1336 | 1625 22% | 1477 11% | 1140 -15% | 1302 ? -3% | 2097 ? 57% |
| Média Total (Programa/Configurações) | 6% /
6% | -22% /
-24% | -7% /
-8% | -12% /
-11% | 56% /
53% |
* ... menor é melhor
Continuous read speed: DiskSpd Read Loop, Queue Depth 8
Placa Gráfica
O Quadro RTX 5000 Max-Q é a versão profissional da GeForce RTX 2080 Max-Q. Ela apresenta 16.384 GB de VRAM. Os resultados do 3DMark estão em um nível normal para este tipo de GPU. Não observamos um aumento de desempenho no modo Rendering
. O gráfico UHD 630 integrado no Core i7-9750H está habilitado e a tecnologia Optimus da NVIDIA é utilizada
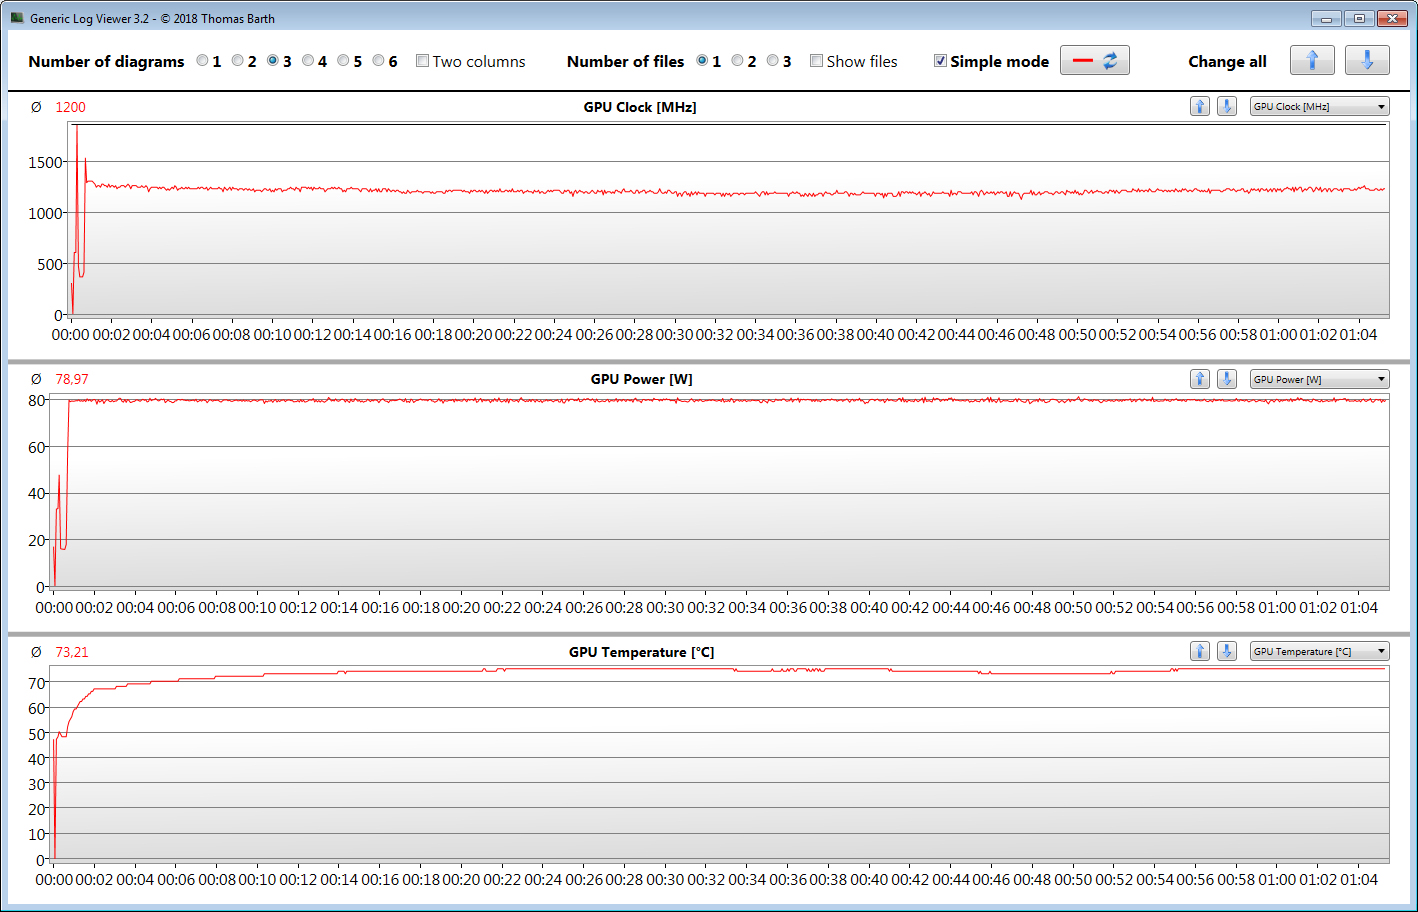
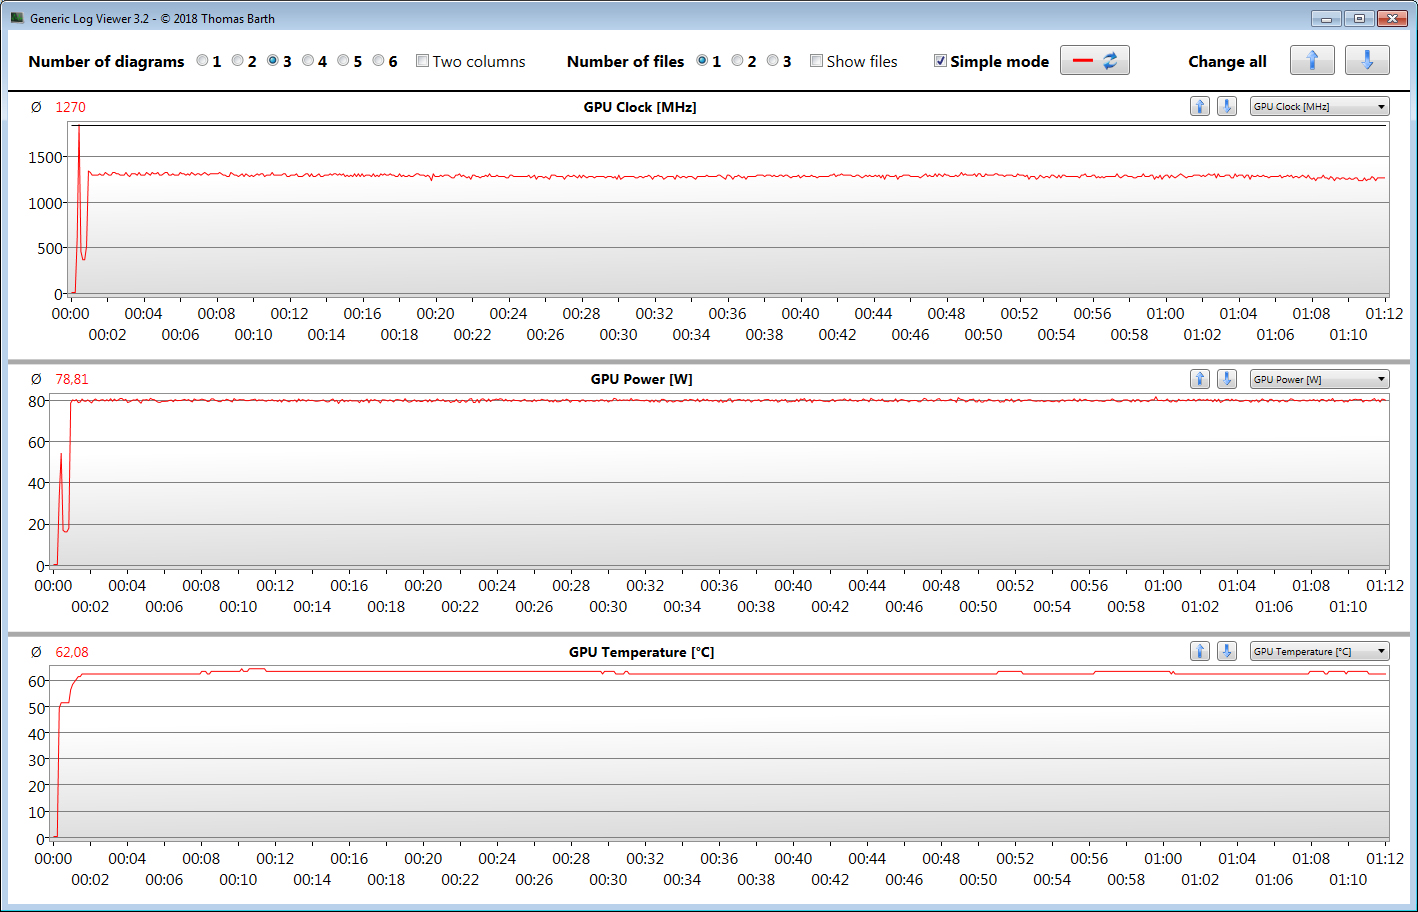
Nvidia especifica um relógio de base de 600 MHz e um relógio de impulso de 1350 MHz para esta GPU. Relógios mais altos são possíveis desde que a GPU não atinja um limite térmico ou de potência. O relógio máximo é de 1849 MHz. Na referência com o Witcher 3
vimos as velocidades médias do relógio de 1200 MHz e 1270 MHz (em modo Rendering
)
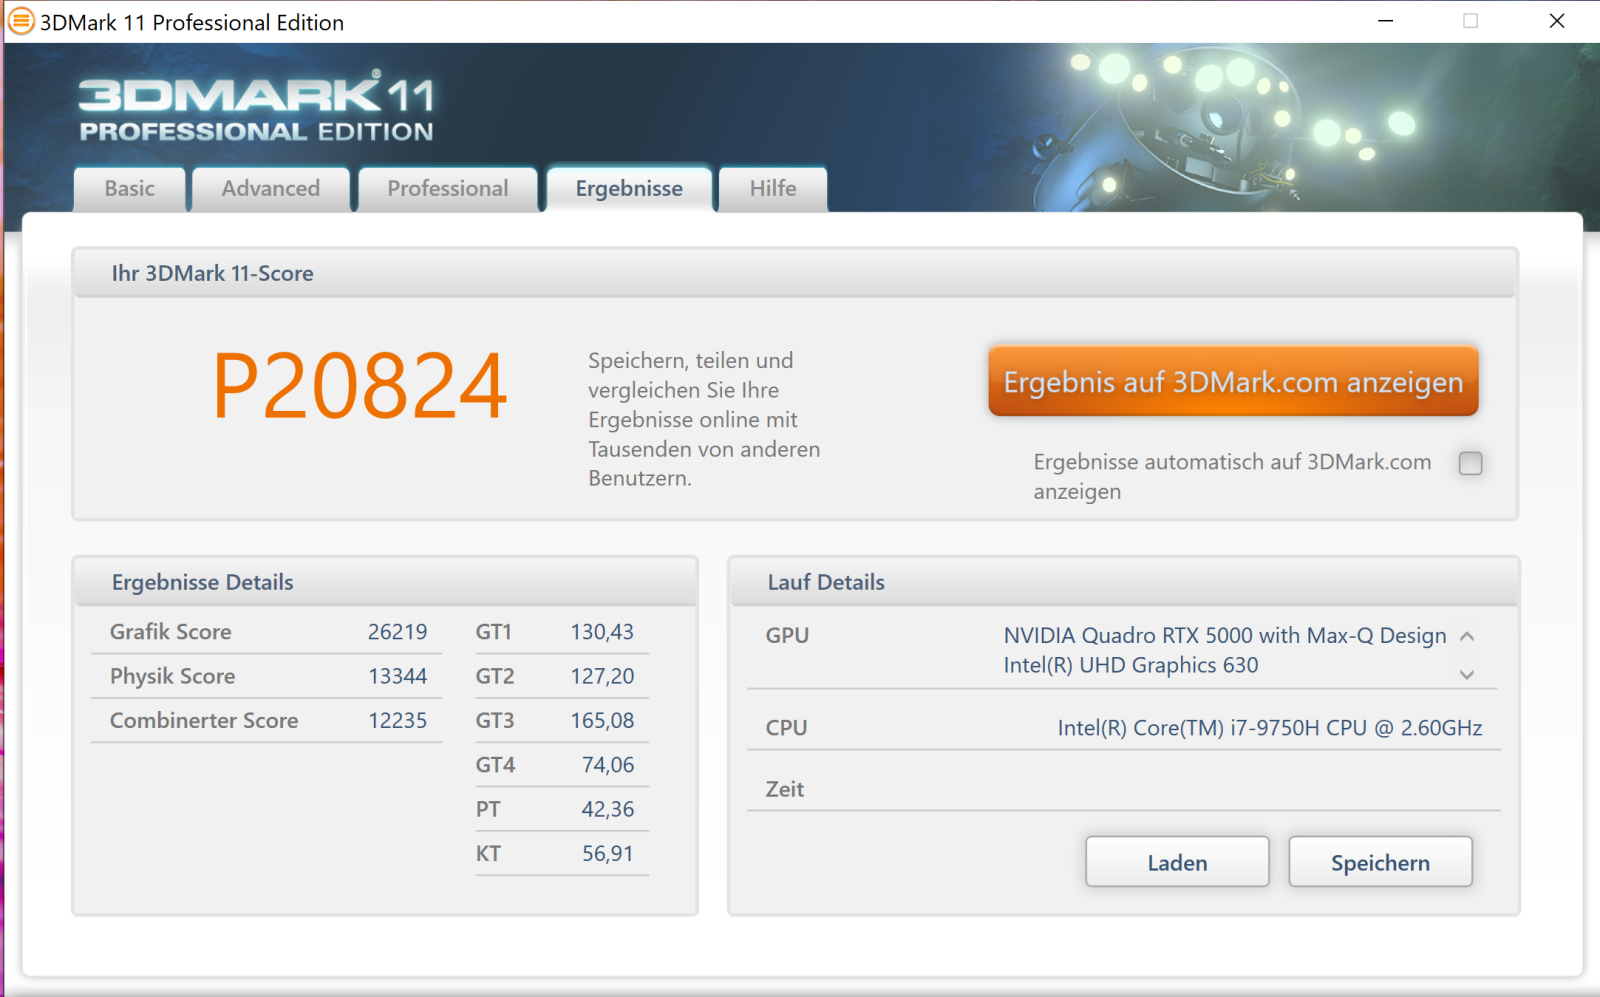


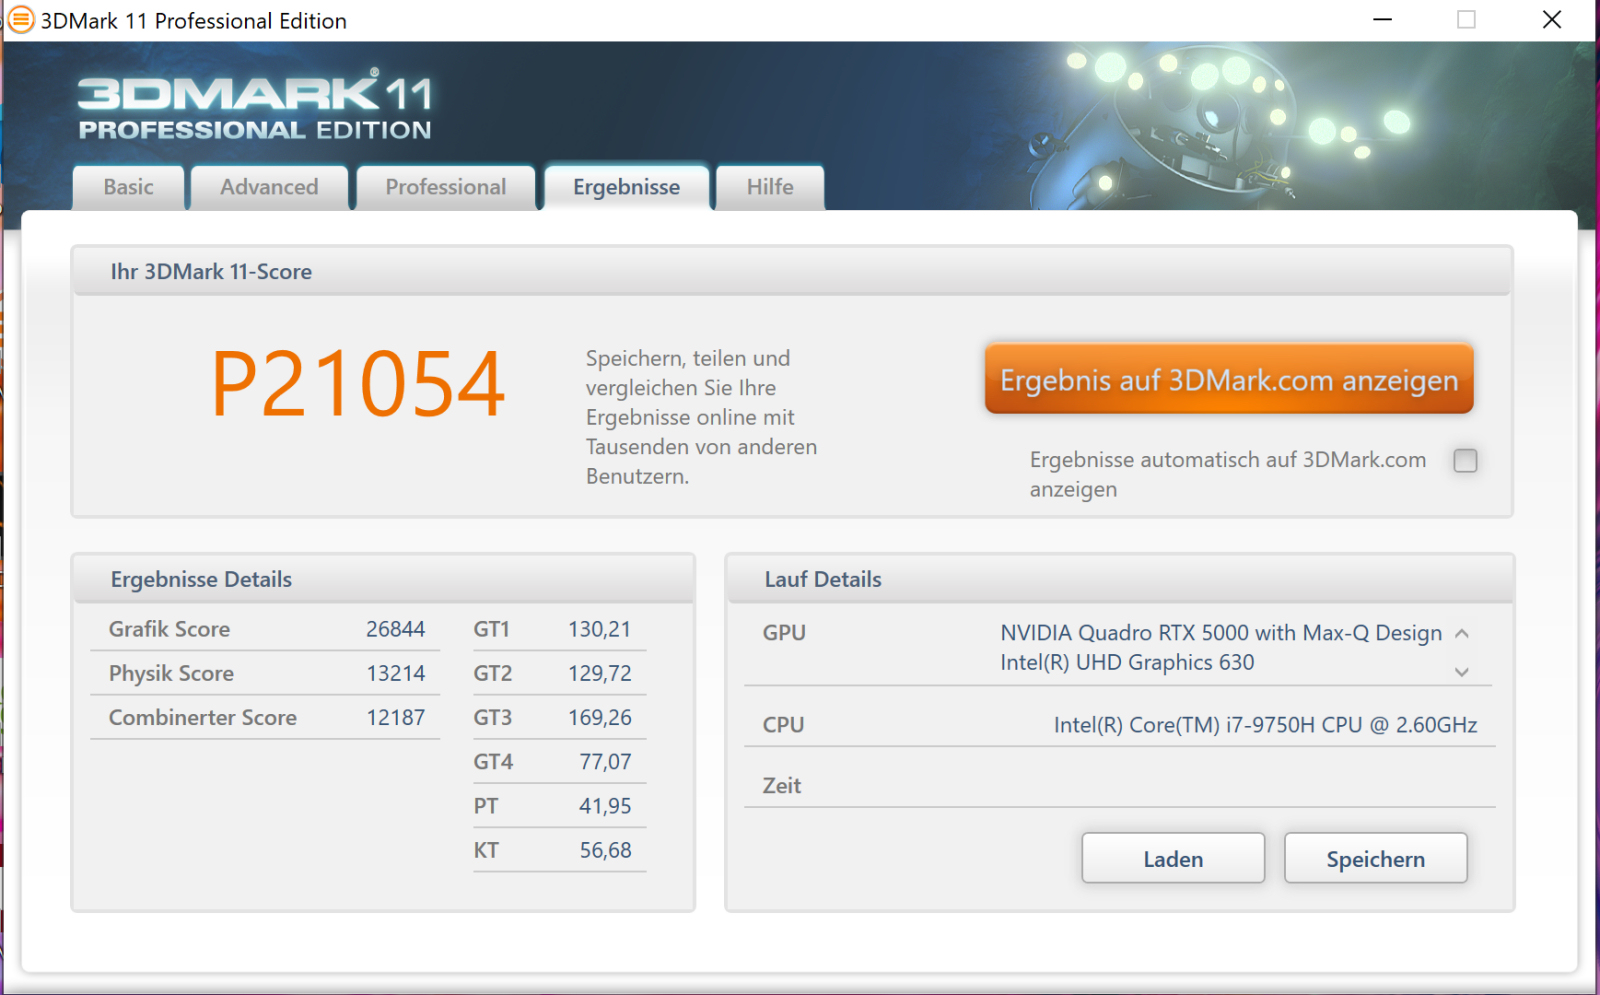
| 3DMark 11 Performance | 20824 pontos | |
| 3DMark Cloud Gate Standard Score | 29456 pontos | |
| 3DMark Fire Strike Score | 16986 pontos | |
| 3DMark Time Spy Score | 6972 pontos | |
Ajuda | ||
| 3DMark 11 - 1280x720 Performance GPU | |
| Média da turma Workstation (10888 - 69594, n=25, últimos 2 anos) | |
| Razer Blade 15 Studio Edition 2020 | |
| MSI WS66 10TMT-207US | |
| Média NVIDIA Quadro RTX 5000 Max-Q (24156 - 28524, n=9) | |
| Asus ProArt StudioBook Pro 15 W500G5T (Rendering) | |
| Dell Precision 7550 | |
| Asus ProArt StudioBook Pro 15 W500G5T | |
| 3DMark | |
| 1920x1080 Fire Strike Graphics | |
| Média da turma Workstation (7578 - 52560, n=25, últimos 2 anos) | |
| MSI WS66 10TMT-207US | |
| Razer Blade 15 Studio Edition 2020 | |
| Média NVIDIA Quadro RTX 5000 Max-Q (18247 - 21115, n=10) | |
| Asus ProArt StudioBook Pro 15 W500G5T | |
| Asus ProArt StudioBook Pro 15 W500G5T (Rendering) | |
| Dell Precision 7550 | |
| 1280x720 Cloud Gate Standard Graphics | |
| MSI WS66 10TMT-207US | |
| Média da turma Workstation (46927 - 152418, n=15, últimos 2 anos) | |
| Média NVIDIA Quadro RTX 5000 Max-Q (50993 - 126073, n=7) | |
| Razer Blade 15 Studio Edition 2020 | |
| Asus ProArt StudioBook Pro 15 W500G5T | |
| Dell Precision 7550 | |
| 2560x1440 Time Spy Graphics | |
| Média da turma Workstation (2725 - 24806, n=25, últimos 2 anos) | |
| MSI WS66 10TMT-207US | |
| Razer Blade 15 Studio Edition 2020 | |
| Média NVIDIA Quadro RTX 5000 Max-Q (6999 - 7977, n=10) | |
| Dell Precision 7550 | |
| Asus ProArt StudioBook Pro 15 W500G5T (Rendering) | |
| Asus ProArt StudioBook Pro 15 W500G5T | |
Desempenho nos jogos
O laptop Asus pode rodar todos os jogos atuais sem problemas. Ele pode normalmente alcançar taxas de quadros jogáveis a 1080p nas configurações mais altas. A GPU luta para lidar com resoluções acima de 1080p. Para alcançar taxas de quadros jogáveis a 4K, os usuários terão que baixar as configurações de gráficos
Embora não haja diferença entre o modo Normal
e o modo Rendering
no benchmark 3DMark, o modo Rendering
proporciona um ligeiro aumento na performance quando se joga. Neste modo, a GPU é capaz de alcançar relógios um pouco mais altos no teste de esforço de jogo com o Witcher 3
| The Witcher 3 - 1920x1080 Ultra Graphics & Postprocessing (HBAO+) | |
| Asus ProArt StudioBook Pro 15 W500G5T (Rendering) | |
| Asus ProArt StudioBook Pro 15 W500G5T | |
| Razer Blade 15 Studio Edition 2020 | |
| Média NVIDIA Quadro RTX 5000 Max-Q (71 - 88.5, n=10) | |
| MSI WS66 10TMT-207US | |
| Dell Precision 7550 | |
| Média da turma Workstation (26.3 - 91.7, n=3, últimos 2 anos) | |
| Death Stranding - 1920x1080 Very High Preset | |
| Razer Blade 15 Studio Edition 2020 | |
| Média NVIDIA Quadro RTX 5000 Max-Q (97.4 - 101.5, n=2) | |
| Asus ProArt StudioBook Pro 15 W500G5T | |
| Horizon Zero Dawn - 1920x1080 Ultimate Quality | |
| Asus ProArt StudioBook Pro 15 W500G5T (rendering) | |
| Média NVIDIA Quadro RTX 5000 Max-Q (86 - 89, n=2) | |
| Asus ProArt StudioBook Pro 15 W500G5T | |
| Doom Eternal - 1920x1080 Ultra Preset | |
| Asus ProArt StudioBook Pro 15 W500G5T (Rendering) | |
| Média NVIDIA Quadro RTX 5000 Max-Q (137.8 - 145.3, n=3) | |
| Razer Blade 15 Studio Edition 2020 | |
| Asus ProArt StudioBook Pro 15 W500G5T | |
Usamos o videogame conhecido como O Witcher 3
para verificar se as taxas de quadros podem ser mantidas consistentemente durante um período de tempo prolongado. Para isso, executamos o jogo nas configurações mais altas a 1080p por uma hora. Durante toda a execução do jogo, o personagem controlado pelo jogador simplesmente fica parado. Não há quedas na taxa de quadros a serem relatadas
| baixo | média | alto | ultra | QHD | 4K | |
|---|---|---|---|---|---|---|
| The Witcher 3 (2015) | 281.8 | 225.5 | 145.3 | 84.6 | 50.4 | |
| Dota 2 Reborn (2015) | 140.8 | 128.7 | 120.1 | 114.9 | ||
| X-Plane 11.11 (2018) | 100 | 88 | 72.9 | |||
| Red Dead Redemption 2 (2019) | 107.5 | 89.1 | 63.9 | 41.3 | 32.9 | 25.2 |
| Hunt Showdown (2020) | 158.2 | 106.2 | 94 | 52.5 | 26.7 | |
| Doom Eternal (2020) | 213.8 | 159.9 | 142.3 | 137.8 | 103.2 | 54.5 |
| Gears Tactics (2020) | 226.8 | 151 | 110.2 | 84.6 | 54.3 | 27.6 |
| F1 2020 (2020) | 219 | 158 | 135 | 108 | 83 | 47 |
| Death Stranding (2020) | 100.1 | 100.5 | 97.3 | 97.4 | 70 | 39 |
| Horizon Zero Dawn (2020) | 120 | 103 | 93 | 86 | 69 | 42 |
| Flight Simulator 2020 (2020) | 58.3 | 49 | 44 | 34.3 | 26.9 | 16.1 |
| Serious Sam 4 (2020) | 106 | 84.7 | 79.8 | 69.6 | 57.5 | 34.9 |
| Mafia Definitive Edition (2020) | 113.6 | 90.3 | 82.9 | 56.7 | 30.2 | |
| Star Wars Squadrons (2020) | 296 | 225.7 | 203.3 | 185.3 | 125.9 | 70.4 |
| FIFA 21 (2020) | 208.3 | 188.7 | 181.6 | 170 | 143 | 84.4 |
| Watch Dogs Legion (2020) | 90 | 85 | 75 | 51 | 37 | 21 |
Emissions & Energy Management - The StudioBook gets warm and loud
Ruído do sistema
Quando ociosos, os ventiladores muitas vezes ficam completamente parados, o que leva a uma operação silenciosa. Sob carga, os ventiladores ganham velocidade. Medimos 47 dB(A) sob carga média e 46,9 dB(A) durante o teste de esforço. No modo Rendering
, os ventiladores giram mais rápido
Barulho
| Ocioso |
| 27.9 / 27.9 / 27.9 dB |
| Carga |
| 47 / 46.9 dB |
 | ||
30 dB silencioso 40 dB(A) audível 50 dB(A) ruidosamente alto |
||
min: | ||
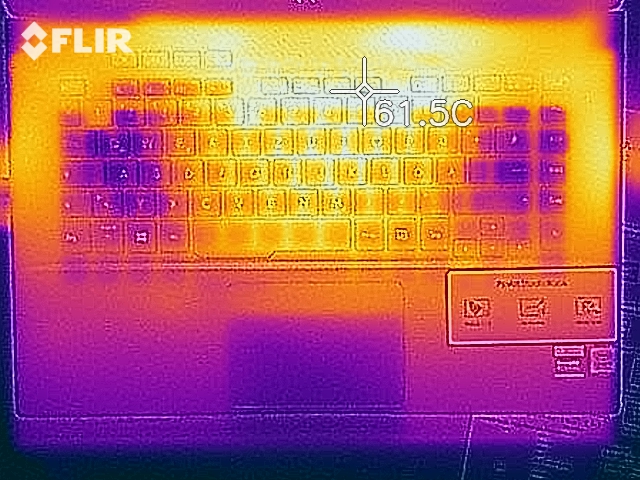
Temperatura
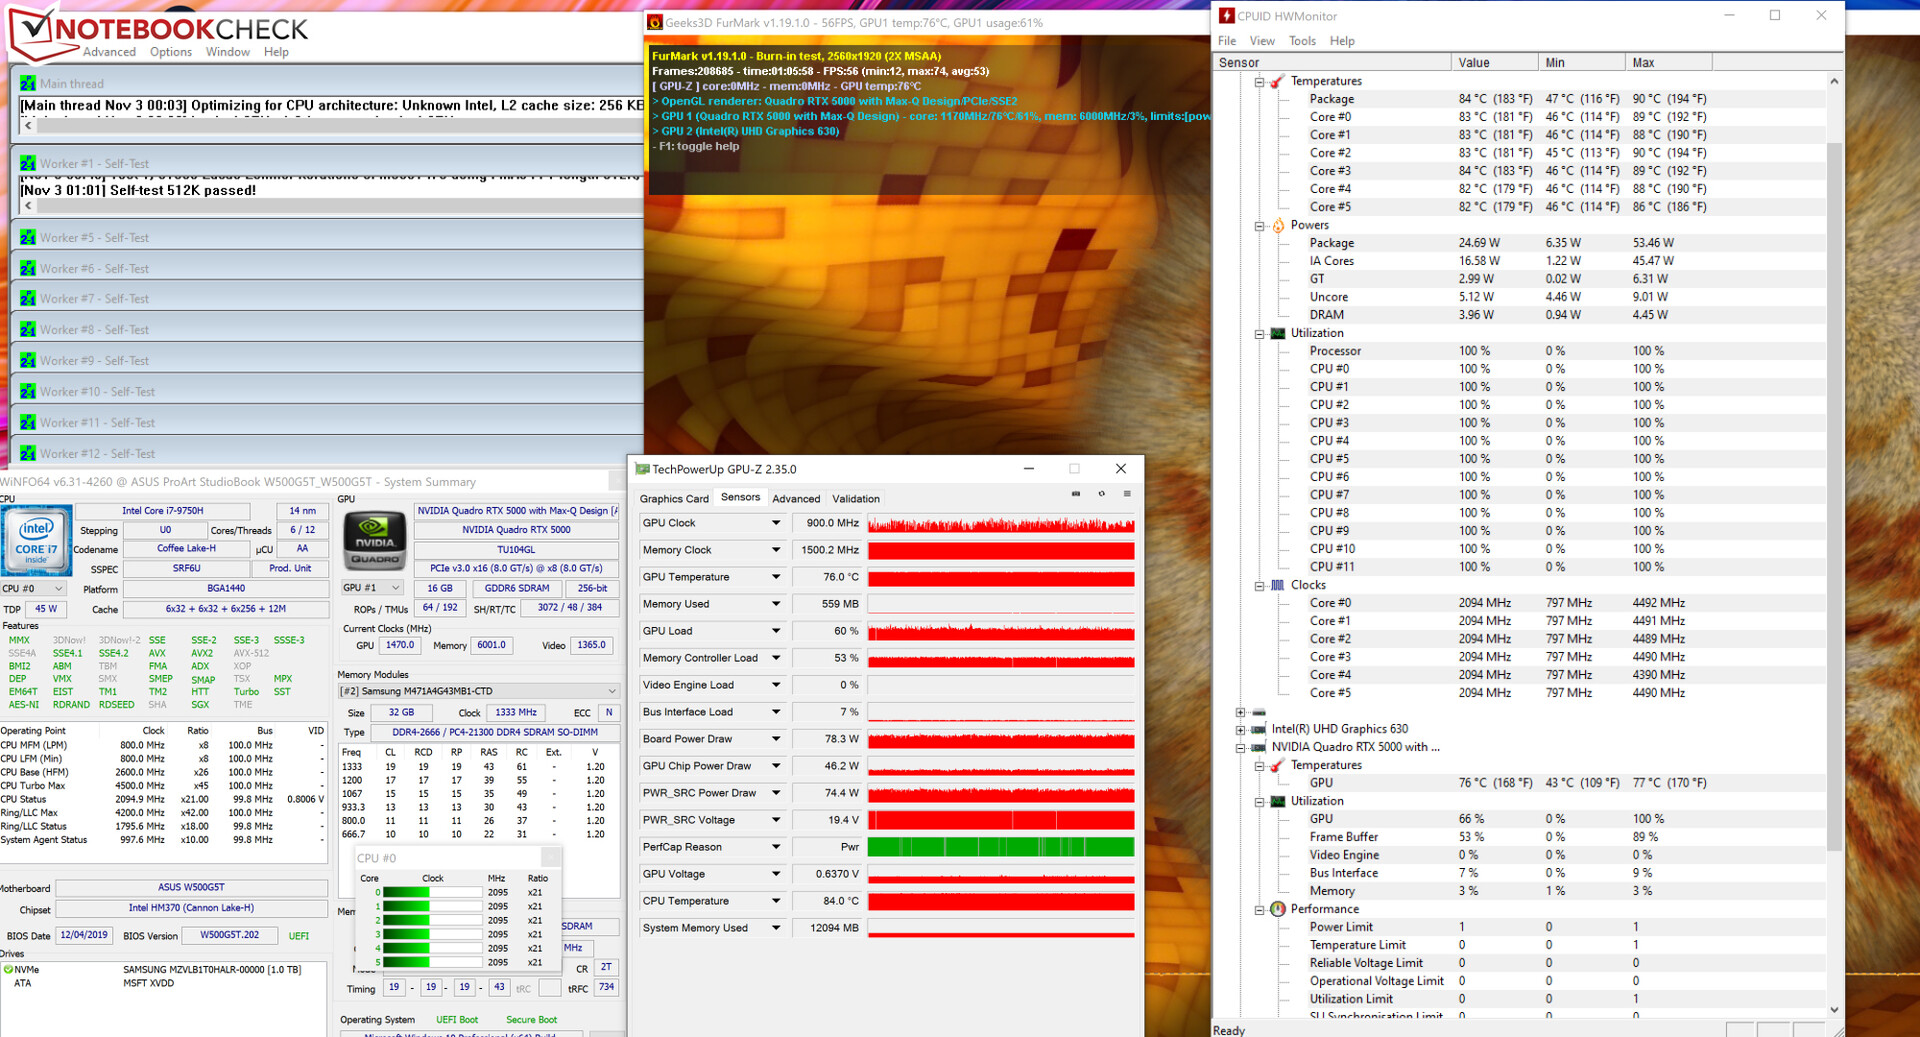
Em nosso teste de estresse (Prime95 e FurMark funcionando continuamente por pelo menos uma hora), os relógios da CPU flutuaram entre 3,5 e 4 GHz e os relógios GPU flutuaram entre 800 e 1700 MHz no primeiro minuto. Posteriormente, a CPU funcionava a 2,1 GHz e a GPU a 900 MHz. Com a energia da bateria, a freqüência da CPU era de 900 MHz e a freqüência da GPU de 300 MHz. O teste de estresse é um cenário extremo, o que é muito improvável que ocorra na vida real. Nós o usamos para testar a estabilidade do sistema sob carga total
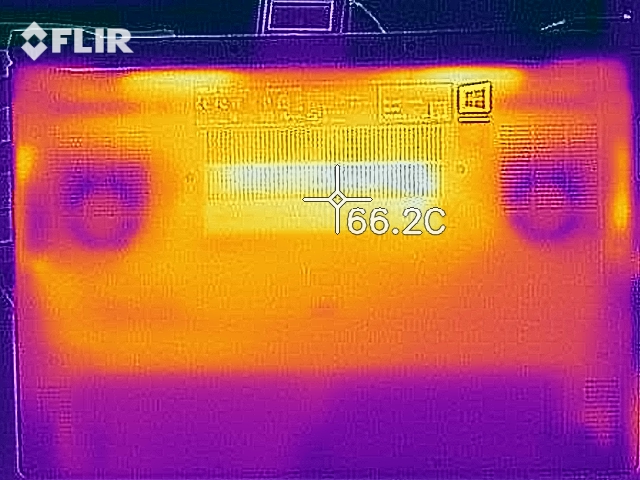
O W500G5T fica consideravelmente quente. Durante nosso teste de estresse, a marca de 50 graus Celsius (122 °F) foi excedida em um ponto de medição. É por isso que não podemos recomendar o uso do notebook Asus na volta. No uso diário, as temperaturas permanecem sempre razoáveis.
(-) A temperatura máxima no lado superior é 61.5 °C / 143 F, em comparação com a média de 38.2 °C / 101 F , variando de 22.2 a 69.8 °C para a classe Workstation.
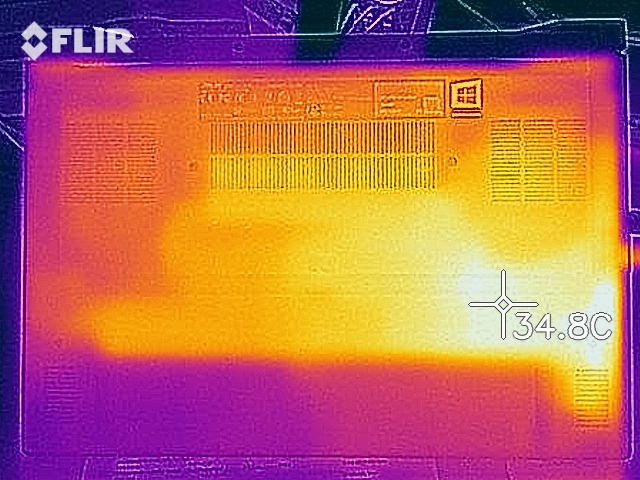
(-) A parte inferior aquece até um máximo de 66.2 °C / 151 F, em comparação com a média de 41.1 °C / 106 F
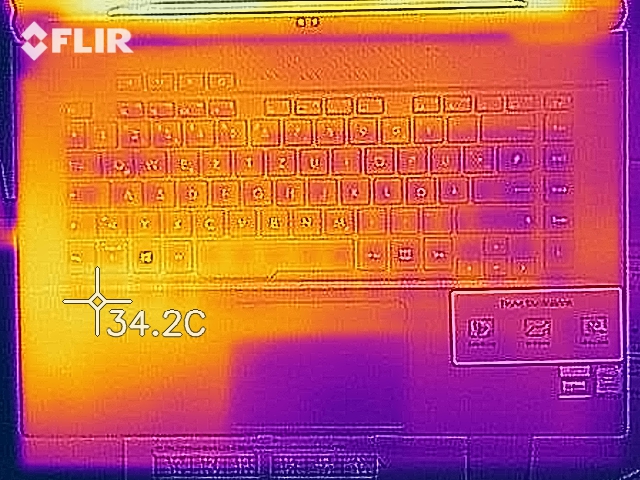
(+) Em uso inativo, a temperatura média para o lado superior é 25.7 °C / 78 F, em comparação com a média do dispositivo de 32 °C / ### class_avg_f### F.
(+) Os apoios para as mãos e o touchpad estão atingindo a temperatura máxima da pele (34.2 °C / 93.6 F) e, portanto, não estão quentes.
(-) A temperatura média da área do apoio para as mãos de dispositivos semelhantes foi 27.8 °C / 82 F (-6.4 °C / -11.6 F).
Oradores
Os alto-falantes estéreo produzem um som agradável. Entretanto, o volume máximo é relativamente baixo
Asus ProArt StudioBook Pro 15 W500G5T análise de áudio
(-) | alto-falantes não muito altos (###valor### dB)
Graves 100 - 315Hz
(±) | graves reduzidos - em média 9.5% menor que a mediana
(±) | a linearidade dos graves é média (14.9% delta para a frequência anterior)
Médios 400 - 2.000 Hz
(+) | médios equilibrados - apenas 3% longe da mediana
(+) | médios são lineares (5.1% delta para frequência anterior)
Altos 2 - 16 kHz
(±) | máximos mais altos - em média 6.3% maior que a mediana
(+) | os máximos são lineares (6.8% delta da frequência anterior)
Geral 100 - 16.000 Hz
(±) | a linearidade do som geral é média (15% diferença em relação à mediana)
Comparado com a mesma classe
» 33% de todos os dispositivos testados nesta classe foram melhores, 6% semelhantes, 61% piores
» O melhor teve um delta de 7%, a média foi 17%, o pior foi 35%
Comparado com todos os dispositivos testados
» 21% de todos os dispositivos testados foram melhores, 4% semelhantes, 75% piores
» O melhor teve um delta de 4%, a média foi 24%, o pior foi 134%
Consumo de energia
Não há anomalias quando se trata de consumo de energia. O sistema consome 20,6 watts quando ocioso. Durante o teste de estresse, o consumo de energia atingiu o pico de 178 watts. A potência nominal do adaptador AC é de 230 watts
| desligado | |
| Ocioso | |
| Carga |
|
Key:
min: | |
Vida útil da bateria
Nosso teste Wi-Fi praticamente orientado simula cargas que são consistentes com a navegação na web. O plano de energia "equilibrado" é selecionado, as funções de economia de energia são desligadas e o brilho do visor é ajustado para 150 cd/m². Nosso dispositivo de revisão atinge um tempo de funcionamento da bateria de 4 h 41 m.
Pro
Contra
Veredicto
O StudioBook é uma estação de trabalho, com a qual o Asus está indo atrás dos criadores de conteúdo. Ele também se sai bem como um caderno de jogos. O Core i7-9750H e o Quadro RTX 5000 Max-Q proporcionam desempenho suficiente para todos os cenários de uso. Entretanto, o W500G5T tem apenas uma CPU "hexa-core". Muitos concorrentes apresentam processadores octa-core, e é por isso que o StudioBook tem um desempenho consideravelmente pior em aplicações intensivas de CPU.
O StudioBook da Asus é uma estação de trabalho bem redonda. No entanto, suas fraquezas não podem ser negligenciadas, dado seu preço de 5000-Euro (~$5908).
Nosso dispositivo de revisão apresenta 32 GB de RAM (16 GB de bastão SODIMM + 16 GB de memória onboard; a RAM roda em modo de canal duplo). A estação de trabalho Asus suporta até 48 GB de RAM. Muitos concorrentes suportam até 64 GB de RAM. A capacidade de armazenamento (1 TB, NVMe SSD) pode ser expandida com a instalação de um drive NVMe adicional. O RAID 0 é suportado.
A tela IPS 4K marca algum ponto importante com sua superfície fosca, bom brilho, ângulos de visão estáveis e - graças a uma certificação Pantone - ótima reprodução de cores. A cobertura do espaço de cores também está em um bom nível. Entretanto, a relação de contraste deveria ter sido maior, dada a etiqueta de preço. A vida útil da bateria não é muito impressionante. O teclado retroiluminado é bom o suficiente para o uso diário.
O Asus StudioBook não possui uma porta Thunderbolt 3. Há apenas uma porta USB 3.2 Gen 2 Type-C, que pode emitir um sinal DP. É por isso que uma GPU externa não pode ser conectada à estação de trabalho. A bateria do StudioBook não pode ser carregada através da porta USB-C.
Embora o StudioBook custe 5000 Euros (~$5908), ele tem alguns pontos fracos (tela com baixa taxa de contraste, RAM soldada, sem porta Thunderbolt 3, sem fornecimento de energia USB), o que um dispositivo tão caro não deveria ter. A Blade 15 Studio Edition oferece mais por este tipo de dinheiro. Aqueles que gostam do StudioBook de qualquer forma, mas não precisam da GPU Quadro, devem dar uma olhada em um modelo StudioBook com uma placa gráfica GeForce RTX.
Asus ProArt StudioBook Pro 15 W500G5T
- 11/09/2020 v7 (old)
Sascha Mölck
Price comparison
