Breve Análise do Workstation móvel Dell Precision 7550: A antítese para o Precision 5550
Avaliação | Data | Modelo | Peso | Altura | Size | Resolução | Preço |
|---|---|---|---|---|---|---|---|
| 87.8 % v7 (old) | 08/2020 | Dell Precision 7550 W-10885M, Quadro RTX 5000 Max-Q | 2.8 kg | 27.36 mm | 15.60" | 3840x2160 | |
v (old) | Dell Precision 7540 i9-9980HK, Quadro RTX 3000 (Laptop) | 2.8 kg | 25 mm | 15.60" | 3840x2160 | ||
| 86.3 % v7 (old) | 08/2020 | Dell Precision 5550 P91F i7-10875H, Quadro T2000 Max-Q | 2 kg | 18 mm | 15.60" | 3840x2400 | |
| 82.1 % v7 (old) | 03/2020 | Acer ConceptD 3 Pro CN315-71P-73W1 i7-9750H, Quadro T1000 (Laptop) | 2.4 kg | 23.4 mm | 15.60" | 1920x1080 | |
| 89.8 % v7 (old) | 11/2019 | Lenovo ThinkPad P53-20QN000YGE i7-9850H, Quadro RTX 5000 Max-Q | 2.7 kg | 29.4 mm | 15.60" | 1920x1080 | |
| 84.4 % v7 (old) | 11/2018 | HP ZBook Studio G5-4QH10EA i7-8750H, Quadro P1000 | 2.1 kg | 18.9 mm | 15.60" | 3840x2160 |
| SD Card Reader | |
| average JPG Copy Test (av. of 3 runs) | |
| Dell Precision 5550 P91F (Toshiba Exceria Pro SDXC 64 GB UHS-II) | |
| Dell Precision 7540 (Toshiba Exceria Pro SDXC 64 GB UHS-II) | |
| Dell Precision 7550 (Toshiba Exceria Pro SDXC 64 GB UHS-II) | |
| Lenovo ThinkPad P53-20QN000YGE (Toshiba Exceria Pro SDXC 64 GB UHS-II) | |
| HP ZBook Studio G5-4QH10EA (Toshiba Exceria Pro SDXC 64 GB UHS-II) | |
| maximum AS SSD Seq Read Test (1GB) | |
| HP ZBook Studio G5-4QH10EA (Toshiba Exceria Pro SDXC 64 GB UHS-II) | |
| Lenovo ThinkPad P53-20QN000YGE (Toshiba Exceria Pro SDXC 64 GB UHS-II) | |
| Dell Precision 5550 P91F (Toshiba Exceria Pro SDXC 64 GB UHS-II) | |
| Dell Precision 7550 (Toshiba Exceria Pro SDXC 64 GB UHS-II) | |
| Dell Precision 7540 (Toshiba Exceria Pro SDXC 64 GB UHS-II) | |
| Networking | |
| iperf3 transmit AX12 | |
| Dell Precision 7540 | |
| Dell Precision 5550 P91F | |
| Dell Precision 7550 | |
| Acer ConceptD 9 Pro | |
| Acer ConceptD 3 Pro CN315-71P-73W1 | |
| iperf3 receive AX12 | |
| Dell Precision 7540 | |
| Dell Precision 5550 P91F | |
| Dell Precision 7550 | |
| Acer ConceptD 9 Pro | |
| Acer ConceptD 3 Pro CN315-71P-73W1 | |


| |||||||||||||||||||||||||
iluminação: 90 %
iluminação com acumulador: 473.5 cd/m²
Contraste: 861:1 (Preto: 0.55 cd/m²)
ΔE ColorChecker Calman: 4.8 | ∀{0.5-29.43 Ø4.71}
calibrated: 3.08
ΔE Greyscale Calman: 5.6 | ∀{0.09-98 Ø4.96}
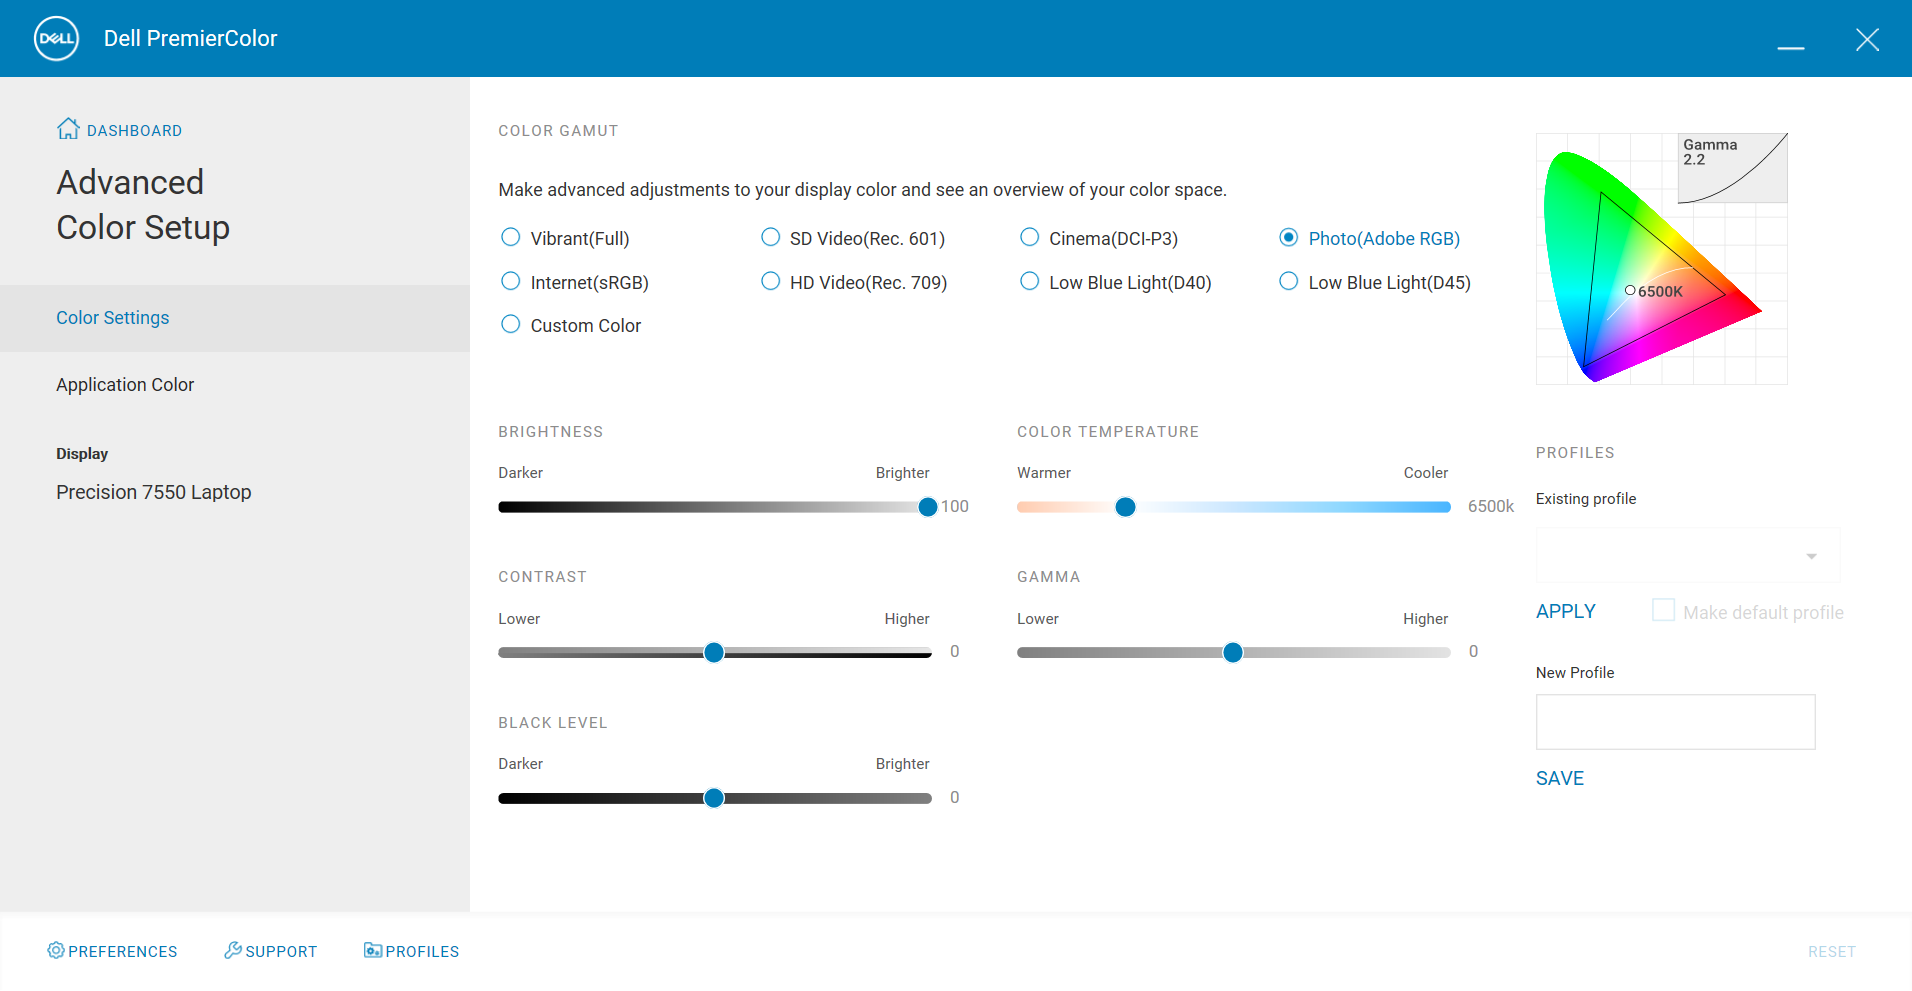
99.7% sRGB (Argyll 1.6.3 3D)
86.4% AdobeRGB 1998 (Argyll 1.6.3 3D)
96.8% AdobeRGB 1998 (Argyll 3D)
99.6% sRGB (Argyll 3D)
82.1% Display P3 (Argyll 3D)
Gamma: 2.34
CCT: 7549 K
| Dell Precision 7550 AU Optronics B156ZAN, IPS, 15.6", 3840x2160 | Dell Precision 7540 AUO41EB, , 15.6", 3840x2160 | Dell Precision 5550 P91F Sharp LQ156R1, IPS, 15.6", 3840x2400 | Acer ConceptD 3 Pro CN315-71P-73W1 Chi Mei N156HCE-EN2, IPS, 15.6", 1920x1080 | Lenovo ThinkPad P53-20QN000YGE N156HCE-GN1, IPS, 15.6", 1920x1080 | HP ZBook Studio G5-4QH10EA AUO30EB, IPS LED, 15.6", 3840x2160 | |
|---|---|---|---|---|---|---|
| Display | 3% | 4% | 3% | -21% | -16% | |
| Display P3 Coverage (%) | 82.1 | 87.1 6% | 89.9 10% | 97.9 19% | 63.2 -23% | 68.2 -17% |
| sRGB Coverage (%) | 99.6 | 100 0% | 100 0% | 99.9 0% | 92.9 -7% | 96.2 -3% |
| AdobeRGB 1998 Coverage (%) | 96.8 | 99.8 3% | 99.9 3% | 87.2 -10% | 64.3 -34% | 68.8 -29% |
| Response Times | -7% | 5% | 36% | 26% | -8% | |
| Response Time Grey 50% / Grey 80% * (ms) | 51.2 ? | 61.6 ? -20% | 46 ? 10% | 33 ? 36% | 38.4 ? 25% | 60.8 ? -19% |
| Response Time Black / White * (ms) | 34 ? | 32 ? 6% | 34 ? -0% | 22 ? 35% | 25.2 ? 26% | 32.8 ? 4% |
| PWM Frequency (Hz) | 26040 ? | |||||
| Screen | 23% | 1% | 17% | 24% | 12% | |
| Brightness middle (cd/m²) | 473.5 | 491 4% | 469.8 -1% | 343 -28% | 510 8% | 417 -12% |
| Brightness (cd/m²) | 461 | 477 3% | 464 1% | 309 -33% | 468 2% | 412 -11% |
| Brightness Distribution (%) | 90 | 92 2% | 85 -6% | 85 -6% | 89 -1% | 85 -6% |
| Black Level * (cd/m²) | 0.55 | 0.37 33% | 0.42 24% | 0.22 60% | 0.36 35% | 0.29 47% |
| Contrast (:1) | 861 | 1327 54% | 1119 30% | 1559 81% | 1417 65% | 1438 67% |
| Colorchecker dE 2000 * | 4.8 | 2.9 40% | 5.16 -8% | 3.73 22% | 2.3 52% | 4.4 8% |
| Colorchecker dE 2000 max. * | 8.73 | 5.8 34% | 9.33 -7% | 6.51 25% | 5.5 37% | 6.7 23% |
| Colorchecker dE 2000 calibrated * | 3.08 | 1.2 61% | 3.75 -22% | 1.43 54% | 1.2 61% | 1.9 38% |
| Greyscale dE 2000 * | 5.6 | 4.4 21% | 5.5 2% | 4.24 24% | 3.2 43% | 5 11% |
| Gamma | 2.34 94% | 2.03 108% | 2 110% | 2.2 100% | 2.34 94% | 2.28 96% |
| CCT | 7549 86% | 6655 98% | 6198 105% | 6329 103% | 7036 92% | 7575 86% |
| Color Space (Percent of AdobeRGB 1998) (%) | 86.4 | 88.2 2% | 89.2 3% | 78 -10% | 59.4 -31% | 62.3 -28% |
| Color Space (Percent of sRGB) (%) | 99.7 | 99.9 0% | 100 0% | 100 0% | 93.1 -7% | 96 -4% |
| Média Total (Programa/Configurações) | 6% /
16% | 3% /
2% | 19% /
17% | 10% /
16% | -4% /
4% |
* ... menor é melhor
Exibir tempos de resposta
| ↔ Tempo de resposta preto para branco | ||
|---|---|---|
| 34 ms ... ascensão ↗ e queda ↘ combinadas | ↗ 20 ms ascensão | 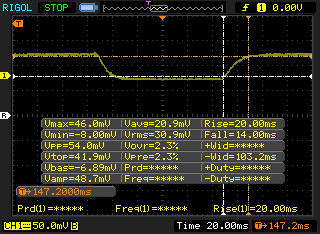 |
| ↘ 14 ms queda | ||
| A tela mostra taxas de resposta lentas em nossos testes e será insatisfatória para os jogadores. Em comparação, todos os dispositivos testados variam de 0.1 (mínimo) a 240 (máximo) ms. » 91 % de todos os dispositivos são melhores. Isso significa que o tempo de resposta medido é pior que a média de todos os dispositivos testados (19.8 ms). | ||
| ↔ Tempo de resposta 50% cinza a 80% cinza | ||
| 51.2 ms ... ascensão ↗ e queda ↘ combinadas | ↗ 24.4 ms ascensão | 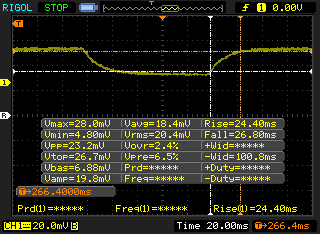 |
| ↘ 26.8 ms queda | ||
| A tela mostra taxas de resposta lentas em nossos testes e será insatisfatória para os jogadores. Em comparação, todos os dispositivos testados variam de 0.165 (mínimo) a 636 (máximo) ms. » 88 % de todos os dispositivos são melhores. Isso significa que o tempo de resposta medido é pior que a média de todos os dispositivos testados (31 ms). | ||
Cintilação da tela / PWM (modulação por largura de pulso)
| Tela tremeluzindo / PWM não detectado | 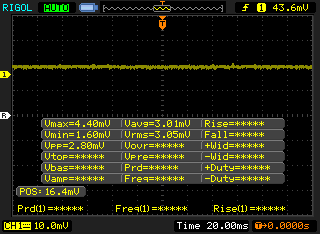 | ||
[pwm_comparison] Em comparação: 52 % de todos os dispositivos testados não usam PWM para escurecer a tela. Se PWM foi detectado, uma média de 7757 (mínimo: 5 - máximo: 343500) Hz foi medida. | |||


Cinebench R15: CPU Multi 64Bit | CPU Single 64Bit
Blender: v2.79 BMW27 CPU
7-Zip 18.03: 7z b 4 -mmt1 | 7z b 4
Geekbench 5.5: Single-Core | Multi-Core
HWBOT x265 Benchmark v2.2: 4k Preset
LibreOffice : 20 Documents To PDF
R Benchmark 2.5: Overall mean
| Cinebench R20 / CPU (Multi Core) | |
| AMD Radeon RX Vega 64 | |
| Intel Core i9-10900K | |
| Alienware m17 R2 P41E | |
| Dell Precision 7550 | |
| Asus ROG Strix Scar 15 G532LWS | |
| MSI GE65 Raider 9SF-049US | |
| Dell Precision 5550 P91F | |
| Alienware m15 R3 P87F | |
| Acer ConceptD 3 Pro CN315-71P-73W1 | |
| Cinebench R20 / CPU (Single Core) | |
| Intel Core i9-10900K | |
| AMD Radeon RX Vega 64 | |
| Dell Precision 5550 P91F | |
| Asus ROG Strix Scar 15 G532LWS | |
| Dell Precision 7550 | |
| Alienware m15 R3 P87F | |
| Alienware m17 R2 P41E | |
| MSI GE65 Raider 9SF-049US | |
| Acer ConceptD 3 Pro CN315-71P-73W1 | |
| Cinebench R15 / CPU Multi 64Bit | |
| AMD Radeon RX Vega 64 | |
| Intel Core i9-10900K | |
| Alienware m17 R2 P41E | |
| Asus ROG Strix Scar 15 G532LWS | |
| Dell Precision 7550 | |
| MSI GE65 Raider 9SF-049US | |
| Dell Precision 5550 P91F | |
| Alienware m15 R3 P87F | |
| Acer ConceptD 3 Pro CN315-71P-73W1 | |
| Cinebench R15 / CPU Single 64Bit | |
| Intel Core i9-10900K | |
| Asus ROG Strix Scar 15 G532LWS | |
| AMD Radeon RX Vega 64 | |
| Dell Precision 7550 | |
| Dell Precision 5550 P91F | |
| Alienware m15 R3 P87F | |
| MSI GE65 Raider 9SF-049US | |
| Alienware m17 R2 P41E | |
| Acer ConceptD 3 Pro CN315-71P-73W1 | |
| Blender / v2.79 BMW27 CPU | |
| Acer ConceptD 3 Pro CN315-71P-73W1 | |
| Dell Precision 5550 P91F | |
| Alienware m15 R3 P87F | |
| Dell Precision 7550 | |
| Asus ROG Strix Scar 15 G532LWS | |
| Intel Core i9-10900K | |
| AMD Radeon RX Vega 64 | |
| 7-Zip 18.03 / 7z b 4 -mmt1 | |
| Intel Core i9-10900K | |
| AMD Radeon RX Vega 64 | |
| Asus ROG Strix Scar 15 G532LWS | |
| Dell Precision 7550 | |
| Dell Precision 5550 P91F | |
| Acer ConceptD 3 Pro CN315-71P-73W1 | |
| Alienware m15 R3 P87F | |
| 7-Zip 18.03 / 7z b 4 | |
| AMD Radeon RX Vega 64 | |
| Intel Core i9-10900K | |
| Dell Precision 7550 | |
| Asus ROG Strix Scar 15 G532LWS | |
| Dell Precision 5550 P91F | |
| Alienware m15 R3 P87F | |
| Acer ConceptD 3 Pro CN315-71P-73W1 | |
| Geekbench 5.5 / Single-Core | |
| Intel Core i9-10900K | |
| Asus ROG Strix Scar 15 G532LWS | |
| Dell Precision 7550 | |
| Dell Precision 5550 P91F | |
| Alienware m15 R3 P87F | |
| AMD Radeon RX Vega 64 | |
| Acer ConceptD 3 Pro CN315-71P-73W1 | |
| Geekbench 5.5 / Multi-Core | |
| Intel Core i9-10900K | |
| AMD Radeon RX Vega 64 | |
| Asus ROG Strix Scar 15 G532LWS | |
| Dell Precision 5550 P91F | |
| Dell Precision 7550 | |
| Alienware m15 R3 P87F | |
| Acer ConceptD 3 Pro CN315-71P-73W1 | |
| HWBOT x265 Benchmark v2.2 / 4k Preset | |
| Intel Core i9-10900K | |
| AMD Radeon RX Vega 64 | |
| Dell Precision 7550 | |
| Asus ROG Strix Scar 15 G532LWS | |
| Alienware m15 R3 P87F | |
| Dell Precision 5550 P91F | |
| Acer ConceptD 3 Pro CN315-71P-73W1 | |
| LibreOffice / 20 Documents To PDF | |
| Intel Core i9-10900K | |
| Alienware m15 R3 P87F | |
| AMD Radeon RX Vega 64 | |
| Acer ConceptD 3 Pro CN315-71P-73W1 | |
| Asus ROG Strix Scar 15 G532LWS | |
| Dell Precision 7550 | |
| Dell Precision 5550 P91F | |
| R Benchmark 2.5 / Overall mean | |
| Alienware m15 R3 P87F | |
| Acer ConceptD 3 Pro CN315-71P-73W1 | |
| Dell Precision 5550 P91F | |
| Dell Precision 7550 | |
| Asus ROG Strix Scar 15 G532LWS | |
| AMD Radeon RX Vega 64 | |
| Intel Core i9-10900K | |
* ... menor é melhor
| PCMark 10 | |
| Score | |
| Dell Precision 7540 | |
| Dell Precision 7550 | |
| Lenovo ThinkPad P53-20QN000YGE | |
| Dell Precision 5550 P91F | |
| Acer ConceptD 3 Pro CN315-71P-73W1 | |
| HP ZBook Studio G5-4QH10EA | |
| Essentials | |
| Dell Precision 5550 P91F | |
| Dell Precision 7550 | |
| Lenovo ThinkPad P53-20QN000YGE | |
| Dell Precision 7540 | |
| Acer ConceptD 3 Pro CN315-71P-73W1 | |
| HP ZBook Studio G5-4QH10EA | |
| Productivity | |
| Dell Precision 7540 | |
| Dell Precision 7550 | |
| Dell Precision 5550 P91F | |
| Lenovo ThinkPad P53-20QN000YGE | |
| Acer ConceptD 3 Pro CN315-71P-73W1 | |
| HP ZBook Studio G5-4QH10EA | |
| Digital Content Creation | |
| Dell Precision 7540 | |
| Dell Precision 7550 | |
| Lenovo ThinkPad P53-20QN000YGE | |
| Dell Precision 5550 P91F | |
| HP ZBook Studio G5-4QH10EA | |
| Acer ConceptD 3 Pro CN315-71P-73W1 | |
| PCMark 8 | |
| Home Score Accelerated v2 | |
| Dell Precision 7540 | |
| Acer ConceptD 3 Pro CN315-71P-73W1 | |
| Dell Precision 7550 | |
| Dell Precision 5550 P91F | |
| HP ZBook Studio G5-4QH10EA | |
| Work Score Accelerated v2 | |
| Acer ConceptD 3 Pro CN315-71P-73W1 | |
| Dell Precision 7550 | |
| Dell Precision 7540 | |
| Dell Precision 5550 P91F | |
| HP ZBook Studio G5-4QH10EA | |
| PCMark 8 Home Score Accelerated v2 | 3781 pontos | |
| PCMark 8 Work Score Accelerated v2 | 4726 pontos | |
| PCMark 10 Score | 5904 pontos | |
Ajuda | ||
| DPC Latencies / LatencyMon - interrupt to process latency (max), Web, Youtube, Prime95 | |
| Dell Precision 7550 | |
| Asus ROG Strix Scar 15 G532LWS | |
| Alienware m15 R3 P87F | |
| MSI GE66 Raider 10SFS | |
| Acer ConceptD 3 Pro CN315-71P-73W1 | |
| Acer ConceptD 9 Pro | |
| Razer Blade 15 Studio Edition 2020 | |
| Dell Precision 5550 P91F | |
* ... menor é melhor
| Dell Precision 7550 SK Hynix PC601A NVMe 1TB | Dell Precision 5550 P91F SK Hynix PC601A NVMe 1TB | Acer ConceptD 3 Pro CN315-71P-73W1 WDC PC SN720 SDAPNTW-512G | Lenovo ThinkPad P53-20QN000YGE Samsung PM981a MZVLB1T0HBLR | HP ZBook Studio G5-4QH10EA Samsung SSD PM981 MZVLB512HAJQ | |
|---|---|---|---|---|---|
| AS SSD | -52% | 8% | 51% | 13% | |
| Seq Read (MB/s) | 2028 | 2039 1% | 2973 47% | 2655 31% | 2379 17% |
| Seq Write (MB/s) | 1193 | 1376 15% | 2429 104% | 2454 106% | 1780 49% |
| 4K Read (MB/s) | 42.31 | 44.11 4% | 24.7 -42% | 59.1 40% | 51 21% |
| 4K Write (MB/s) | 105.5 | 113.3 7% | 115.3 9% | 138.1 31% | 109.5 4% |
| 4K-64 Read (MB/s) | 1128 | 1094 -3% | 1243 10% | 2009 78% | 1184 5% |
| 4K-64 Write (MB/s) | 1537 | 1630 6% | 835 -46% | 1907 24% | 1725 12% |
| Access Time Read * (ms) | 0.069 | 0.059 14% | 0.054 22% | 0.057 17% | |
| Access Time Write * (ms) | 0.106 | 0.99 -834% | 0.034 68% | 0.028 74% | 0.034 68% |
| Score Read (Points) | 1373 | 1342 -2% | 1565 14% | 2333 70% | 1472 7% |
| Score Write (Points) | 1762 | 1881 7% | 1193 -32% | 2291 30% | 2013 14% |
| Score Total (Points) | 3801 | 3883 2% | 3525 -7% | 5810 53% | 4217 11% |
| Copy ISO MB/s (MB/s) | 1768 | 2489 41% | 2136 21% | 1989 13% | |
| Copy Program MB/s (MB/s) | 627 | 682 9% | 489.6 -22% | 457 -27% | |
| Copy Game MB/s (MB/s) | 1477 | 1515 3% | 1163 -21% | 1121 -24% | |
| CrystalDiskMark 5.2 / 6 | -1% | -4% | 9% | -20% | |
| Write 4K (MB/s) | 121 | 122.6 1% | 113.2 -6% | 147 21% | 102.7 -15% |
| Read 4K (MB/s) | 42.16 | 42.4 1% | 31.1 -26% | 48.3 15% | 38.32 -9% |
| Write Seq (MB/s) | 2150 | 2167 1% | 2540 18% | 1402 -35% | 1417 -34% |
| Read Seq (MB/s) | 1755 | 1747 0% | 2005 14% | 1503 -14% | 1289 -27% |
| Write 4K Q32T1 (MB/s) | 395.3 | 388.8 -2% | 331.4 -16% | 475.2 20% | 278.9 -29% |
| Read 4K Q32T1 (MB/s) | 381.8 | 367.3 -4% | 368.3 -4% | 581 52% | 348.8 -9% |
| Write Seq Q32T1 (MB/s) | 2730 | 2629 -4% | 2535 -7% | 2936 8% | 1895 -31% |
| Read Seq Q32T1 (MB/s) | 3468 | 3460 0% | 3427 -1% | 3539 2% | 3352 -3% |
| Write 4K Q8T8 (MB/s) | 1575 | ||||
| Read 4K Q8T8 (MB/s) | 1607 | ||||
| Média Total (Programa/Configurações) | -27% /
-34% | 2% /
4% | 30% /
33% | -4% /
1% |
* ... menor é melhor

Disk Throttling: DiskSpd Read Loop, Queue Depth 8
| 3DMark 06 Standard Score | 42280 pontos | |
| 3DMark 11 Performance | 21922 pontos | |
| 3DMark Cloud Gate Standard Score | 34476 pontos | |
| 3DMark Fire Strike Score | 16641 pontos | |
| 3DMark Time Spy Score | 7579 pontos | |
Ajuda | ||
| baixo | média | alto | ultra | QHD | 4K | |
|---|---|---|---|---|---|---|
| The Witcher 3 (2015) | 299 | 249.4 | 139.1 | 77.3 | 52.5 | |
| Dota 2 Reborn (2015) | 156 | 142 | 117 | 111 | 98.7 | |
| Final Fantasy XV Benchmark (2018) | 154 | 99.7 | 77.3 | 56 | 32.8 | |
| X-Plane 11.11 (2018) | 118 | 102 | 85.7 | 48.8 |
| Dell Precision 7550 Quadro RTX 5000 Max-Q, W-10885M, SK Hynix PC601A NVMe 1TB | Dell Precision 7540 Quadro RTX 3000 (Laptop), i9-9980HK, SK hynix PC400 512 GB | Dell Precision 5550 P91F Quadro T2000 Max-Q, i7-10875H, SK Hynix PC601A NVMe 1TB | Acer ConceptD 3 Pro CN315-71P-73W1 Quadro T1000 (Laptop), i7-9750H, WDC PC SN720 SDAPNTW-512G | Lenovo ThinkPad P53-20QN000YGE Quadro RTX 5000 Max-Q, i7-9850H, Samsung PM981a MZVLB1T0HBLR | HP ZBook Studio G5-4QH10EA Quadro P1000, i7-8750H, Samsung SSD PM981 MZVLB512HAJQ | |
|---|---|---|---|---|---|---|
| Noise | 3% | 6% | -1% | 8% | 4% | |
| desligado / ambiente * (dB) | 25.8 | 28.7 -11% | 26.2 -2% | 31.2 -21% | 28.3 -10% | 28.6 -11% |
| Idle Minimum * (dB) | 25.8 | 28.8 -12% | 26.2 -2% | 31.2 -21% | 28.3 -10% | 28.6 -11% |
| Idle Average * (dB) | 25.8 | 28.7 -11% | 26.2 -2% | 31.2 -21% | 28.3 -10% | 28.6 -11% |
| Idle Maximum * (dB) | 25.9 | 29.1 -12% | 26.2 -1% | 31.5 -22% | 28.3 -9% | 30 -16% |
| Load Average * (dB) | 51.2 | 37.1 28% | 39.2 23% | 38.4 25% | 29.8 42% | 38.1 26% |
| Witcher 3 ultra * (dB) | 51.9 | 41.2 21% | 39 25% | 36.9 29% | 38.3 26% | 35 33% |
| Load Maximum * (dB) | 51.9 | 41.2 21% | 50.6 3% | 41.2 21% | 38.3 26% | 42.5 18% |
* ... menor é melhor
Barulho
| Ocioso |
| 25.8 / 25.8 / 25.9 dB |
| Carga |
| 51.2 / 51.9 dB |
 | ||
30 dB silencioso 40 dB(A) audível 50 dB(A) ruidosamente alto |
||
min: | ||
(-) A temperatura máxima no lado superior é 49 °C / 120 F, em comparação com a média de 38.2 °C / 101 F , variando de 22.2 a 69.8 °C para a classe Workstation.
(-) A parte inferior aquece até um máximo de 51 °C / 124 F, em comparação com a média de 41.1 °C / 106 F
(+) Em uso inativo, a temperatura média para o lado superior é 26.7 °C / 80 F, em comparação com a média do dispositivo de 32 °C / ### class_avg_f### F.
(±) Jogando The Witcher 3, a temperatura média para o lado superior é 37.8 °C / 100 F, em comparação com a média do dispositivo de 32 °C / ## #class_avg_f### F.
(+) Os apoios para as mãos e o touchpad são mais frios que a temperatura da pele, com um máximo de 31 °C / 87.8 F e, portanto, são frios ao toque.
(-) A temperatura média da área do apoio para as mãos de dispositivos semelhantes foi 27.8 °C / 82 F (-3.2 °C / -5.8 F).
Dell Precision 7550 análise de áudio
(+) | os alto-falantes podem tocar relativamente alto (###valor### dB)
Graves 100 - 315Hz
(±) | graves reduzidos - em média 11.5% menor que a mediana
(±) | a linearidade dos graves é média (11.6% delta para a frequência anterior)
Médios 400 - 2.000 Hz
(±) | médios mais altos - em média 5.7% maior que a mediana
(+) | médios são lineares (4.5% delta para frequência anterior)
Altos 2 - 16 kHz
(+) | agudos equilibrados - apenas 3.2% longe da mediana
(+) | os máximos são lineares (5.4% delta da frequência anterior)
Geral 100 - 16.000 Hz
(+) | o som geral é linear (12.6% diferença em relação à mediana)
Comparado com a mesma classe
» 21% de todos os dispositivos testados nesta classe foram melhores, 4% semelhantes, 75% piores
» O melhor teve um delta de 7%, a média foi 17%, o pior foi 35%
Comparado com todos os dispositivos testados
» 11% de todos os dispositivos testados foram melhores, 3% semelhantes, 86% piores
» O melhor teve um delta de 4%, a média foi 23%, o pior foi 134%
Apple MacBook 12 (Early 2016) 1.1 GHz análise de áudio
(+) | os alto-falantes podem tocar relativamente alto (###valor### dB)
Graves 100 - 315Hz
(±) | graves reduzidos - em média 11.3% menor que a mediana
(±) | a linearidade dos graves é média (14.2% delta para a frequência anterior)
Médios 400 - 2.000 Hz
(+) | médios equilibrados - apenas 2.4% longe da mediana
(+) | médios são lineares (5.5% delta para frequência anterior)
Altos 2 - 16 kHz
(+) | agudos equilibrados - apenas 2% longe da mediana
(+) | os máximos são lineares (4.5% delta da frequência anterior)
Geral 100 - 16.000 Hz
(+) | o som geral é linear (10.2% diferença em relação à mediana)
Comparado com a mesma classe
» 7% de todos os dispositivos testados nesta classe foram melhores, 2% semelhantes, 90% piores
» O melhor teve um delta de 5%, a média foi 18%, o pior foi 53%
Comparado com todos os dispositivos testados
» 5% de todos os dispositivos testados foram melhores, 1% semelhantes, 94% piores
» O melhor teve um delta de 4%, a média foi 23%, o pior foi 134%
| desligado | |
| Ocioso | |
| Carga |
|
Key:
min: | |
| Dell Precision 7550 W-10885M, Quadro RTX 5000 Max-Q, SK Hynix PC601A NVMe 1TB, IPS, 3840x2160, 15.6" | Dell Precision 7540 i9-9980HK, Quadro RTX 3000 (Laptop), SK hynix PC400 512 GB, , 3840x2160, 15.6" | Dell Precision 5550 P91F i7-10875H, Quadro T2000 Max-Q, SK Hynix PC601A NVMe 1TB, IPS, 3840x2400, 15.6" | Acer ConceptD 3 Pro CN315-71P-73W1 i7-9750H, Quadro T1000 (Laptop), WDC PC SN720 SDAPNTW-512G, IPS, 1920x1080, 15.6" | Lenovo ThinkPad P53-20QN000YGE i7-9850H, Quadro RTX 5000 Max-Q, Samsung PM981a MZVLB1T0HBLR, IPS, 1920x1080, 15.6" | HP ZBook Studio G5-4QH10EA i7-8750H, Quadro P1000, Samsung SSD PM981 MZVLB512HAJQ, IPS LED, 3840x2160, 15.6" | Acer ConceptD 9 Pro i9-9980HK, Quadro RTX 5000 (Laptop), WDC PC SN720 SDAQNTW-1T00, IPS, 3840x2160, 17.3" | |
|---|---|---|---|---|---|---|---|
| Power Consumption | 11% | 31% | 53% | 17% | 38% | -42% | |
| Idle Minimum * (Watt) | 8.2 | 8.4 -2% | 5.6 32% | 2.9 65% | 7.9 4% | 6.8 17% | 18.8 -129% |
| Idle Average * (Watt) | 16.8 | 15.4 8% | 11.2 33% | 5.5 67% | 11.8 30% | 11.3 33% | 25 -49% |
| Idle Maximum * (Watt) | 24.4 | 17.4 29% | 18.4 25% | 10.6 57% | 14.9 39% | 14.3 41% | 30 -23% |
| Load Average * (Watt) | 131 | 126 4% | 114 13% | 86 34% | 96 27% | 78 40% | 116 11% |
| Witcher 3 ultra * (Watt) | 156.6 | 143 9% | 76.7 51% | 83 47% | 149 5% | 64 59% | 221 -41% |
| Load Maximum * (Watt) | 201.8 | 170 16% | 134.2 33% | 100.7 50% | 207.8 -3% | 126 38% | 241 -19% |
* ... menor é melhor
| Dell Precision 7550 W-10885M, Quadro RTX 5000 Max-Q, 95 Wh | Dell Precision 7540 i9-9980HK, Quadro RTX 3000 (Laptop), Wh | Dell Precision 5550 P91F i7-10875H, Quadro T2000 Max-Q, 86 Wh | Acer ConceptD 3 Pro CN315-71P-73W1 i7-9750H, Quadro T1000 (Laptop), 58.7 Wh | Lenovo ThinkPad P53-20QN000YGE i7-9850H, Quadro RTX 5000 Max-Q, 90 Wh | HP ZBook Studio G5-4QH10EA i7-8750H, Quadro P1000, 97 Wh | |
|---|---|---|---|---|---|---|
| Duração da bateria | -19% | 48% | -9% | 63% | 62% | |
| Reader / Idle (h) | 11.1 | 22.6 104% | 17.3 56% | |||
| WiFi v1.3 (h) | 8.9 | 7.2 -19% | 9 1% | 8.1 -9% | 11.1 25% | 9.7 9% |
| Load (h) | 1 | 1.4 40% | 2 100% | 2.2 120% |
Pro
Contra
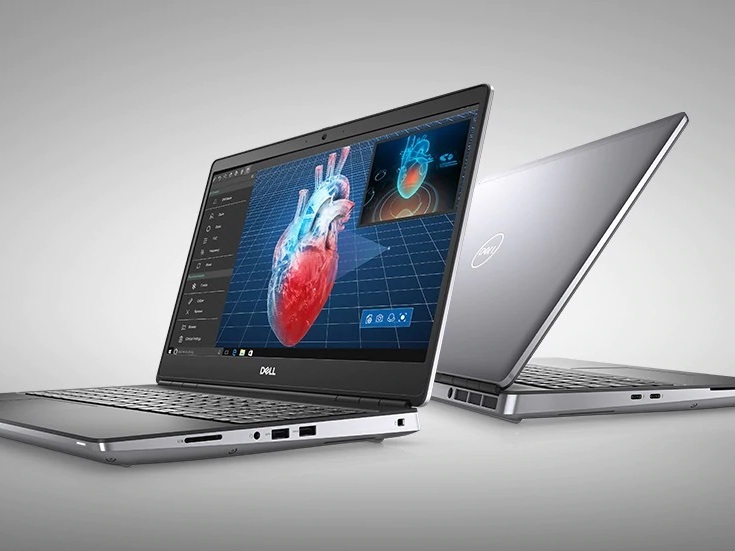
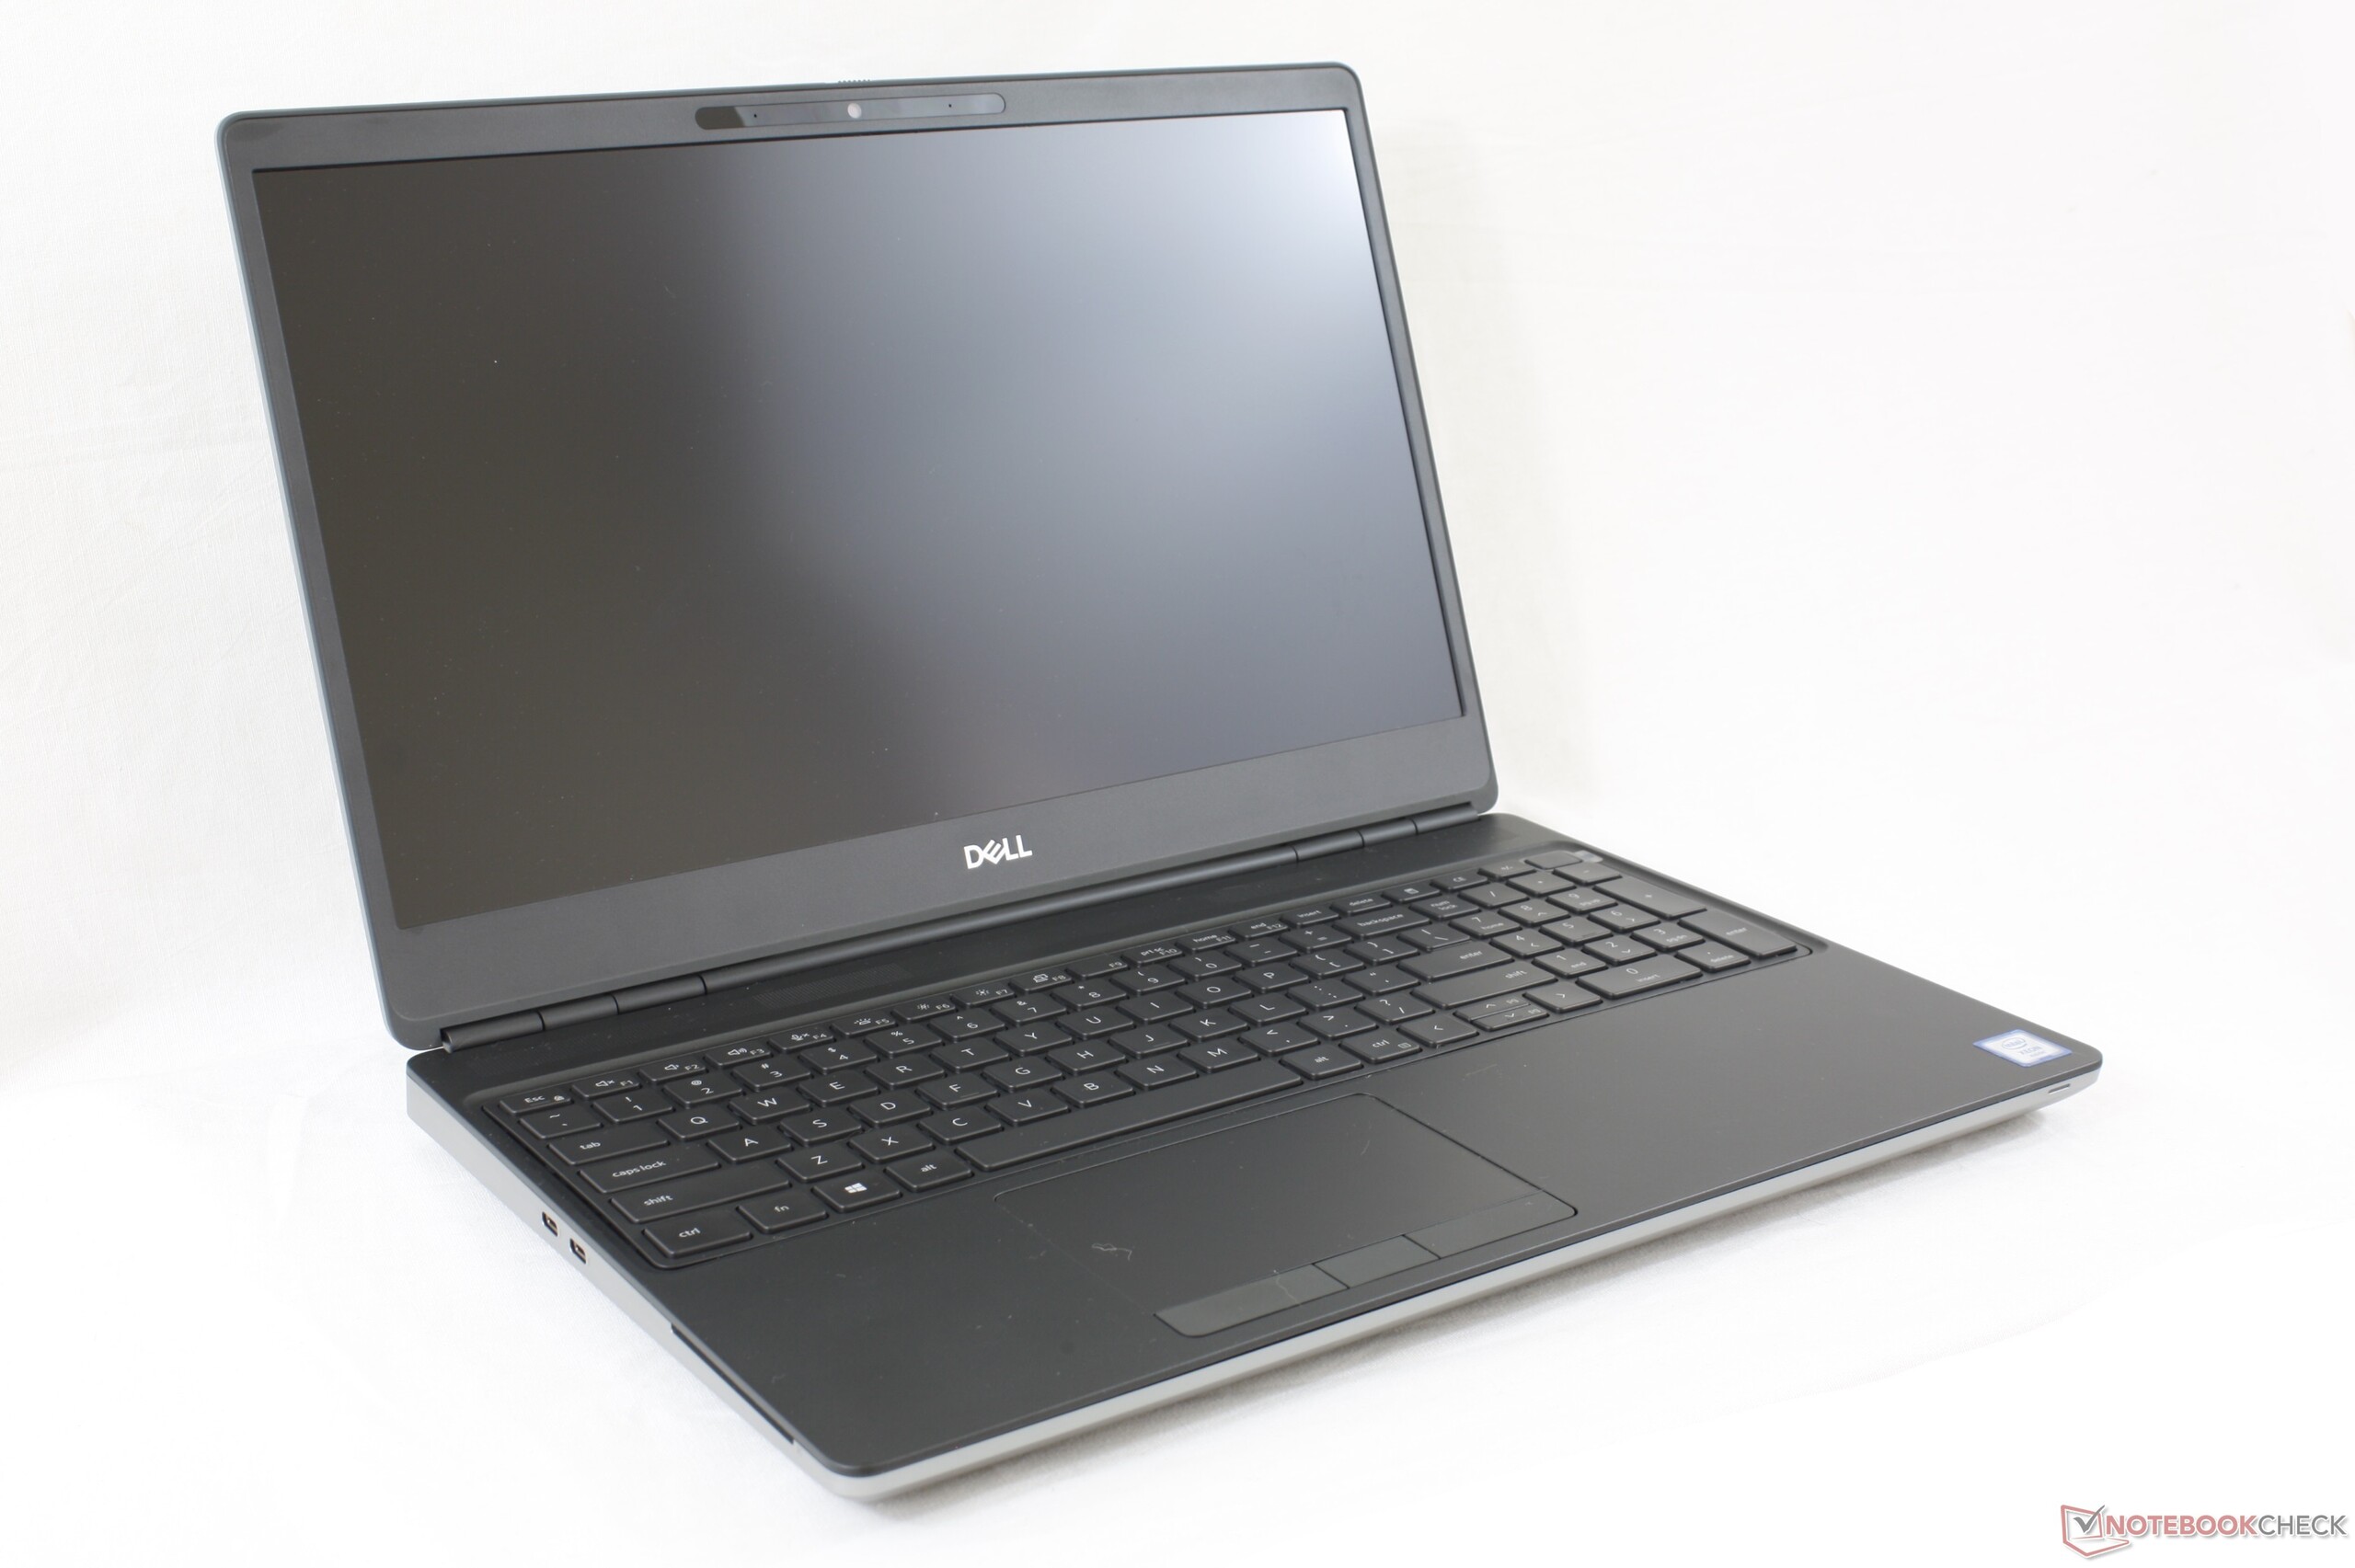
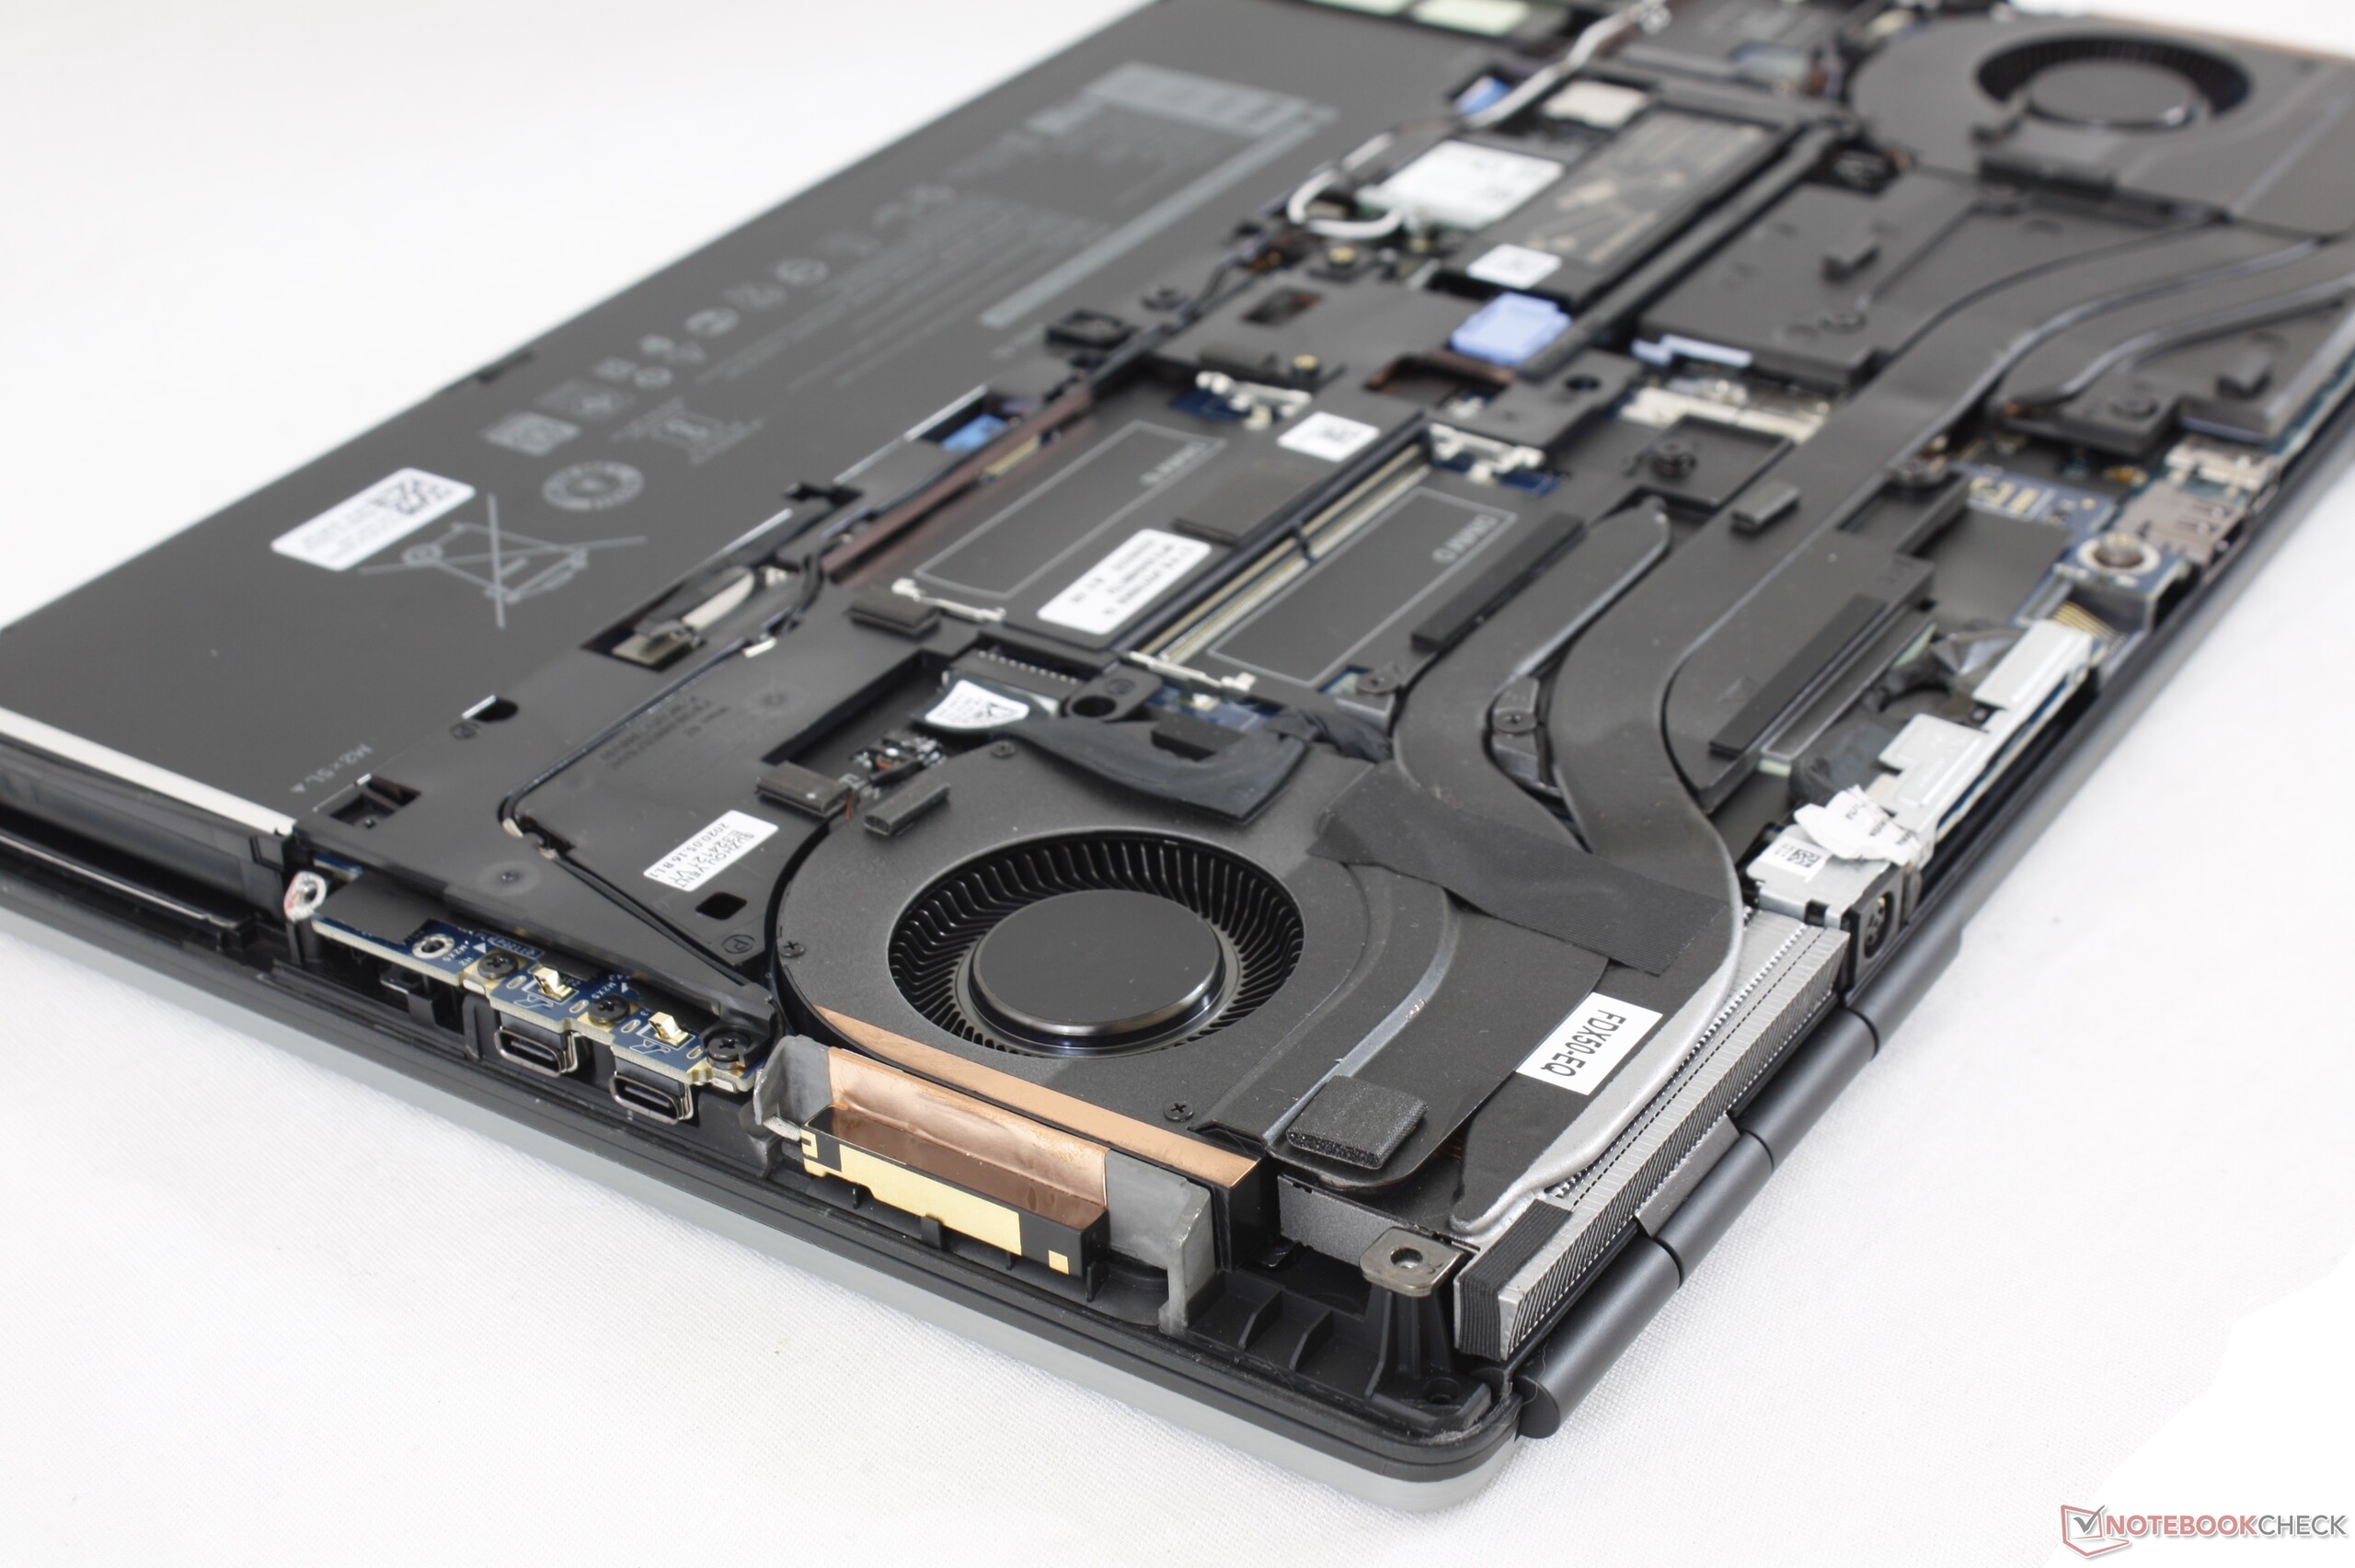
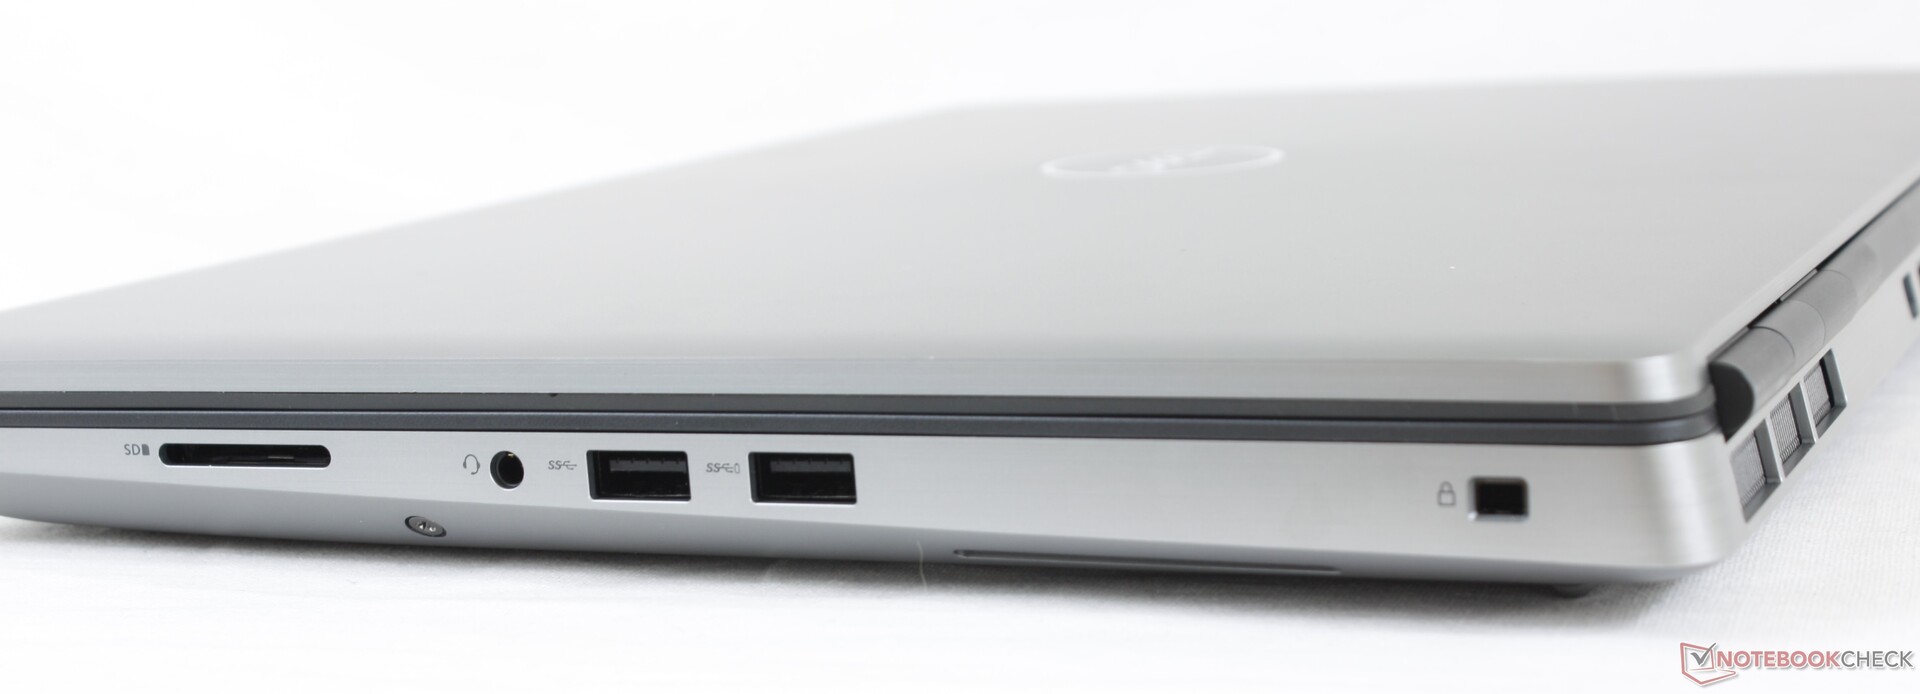
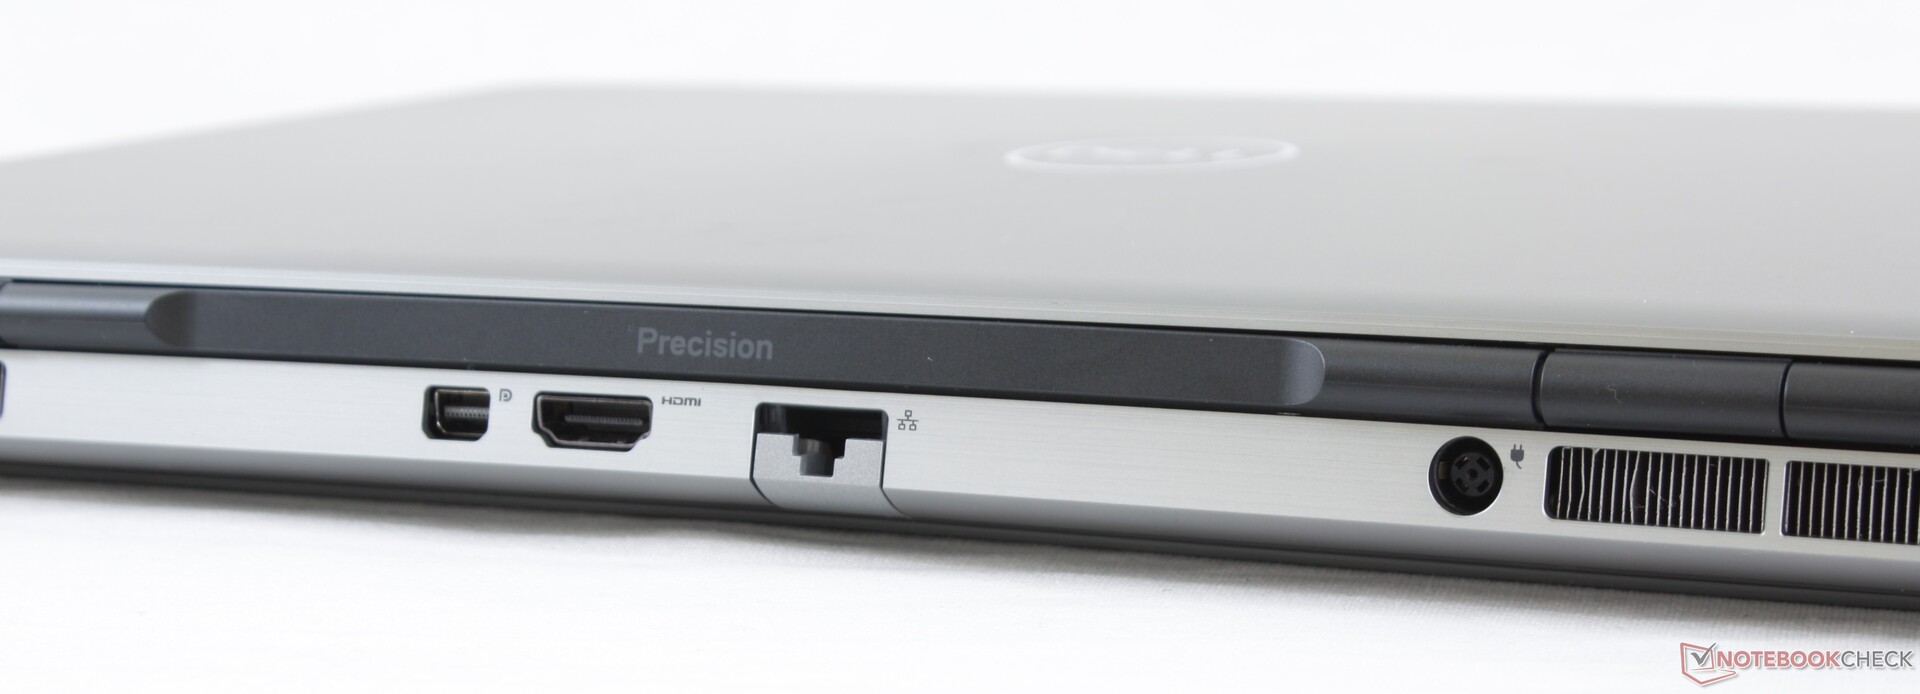
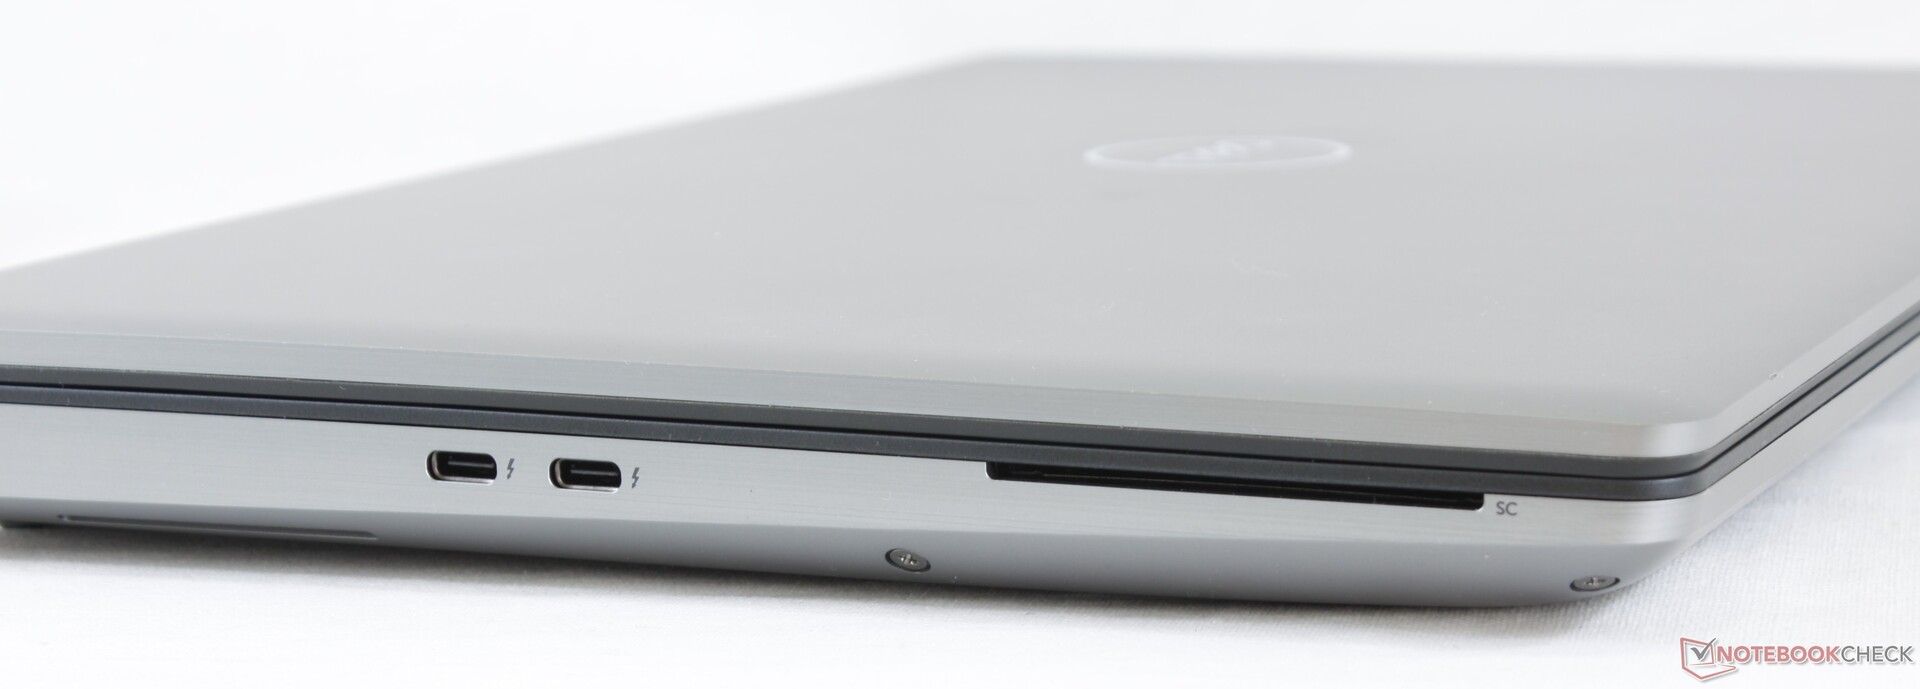
Ao contrário de muitos workstations mais recentes hoje em dia, o Precision 7550 não tem medo de ser grande e volumoso para oferecer mais recursos e hardware que os usuários exigentes esperam. Você não vai encontrar apenas opções auxiliares úteis como WAN, leitor de cartão inteligente, 4 slots SODIMM, botões dedicados do mouse, teclas numéricas de tamanho normal ou compartimentos de armazenamento M.2 triplo em wrokstations ultrafinos como o Precision 5550, MSI WS66, Razer Blade 15 Studio, or the Asus StudioBook Pro 15. Para alguns usuários, esses extras podem valer a pena o ganho em volume.
A principal desvantagem do sistema é que ele utiliza GPUs Quadro Max-Q em vez das variantes de potência plena não Max-Q, apesar do perfil de chassi grosso e pesado. Sistemas concorrentes como o Acer ConceptD 9 Pro provam que a potência total da RTX Quadro 5000 pode oferecer desempenho pelo menos 30 por cento mais rápido do que a Quadro RTX 5000 Max-Q em nosso Dell. Suspeitamos que não há nenhuma opção Quadro RTX 5000 de potência plena aqui porque o adaptador de CA de 180 W seria um fator limitante. Assim, o desempenho gráfico é quase igual ao do já mencionado MSI WS66, Razer Blade 15 Studio ou Asus, que são significativamente mais compactos do que o Precision 7550.
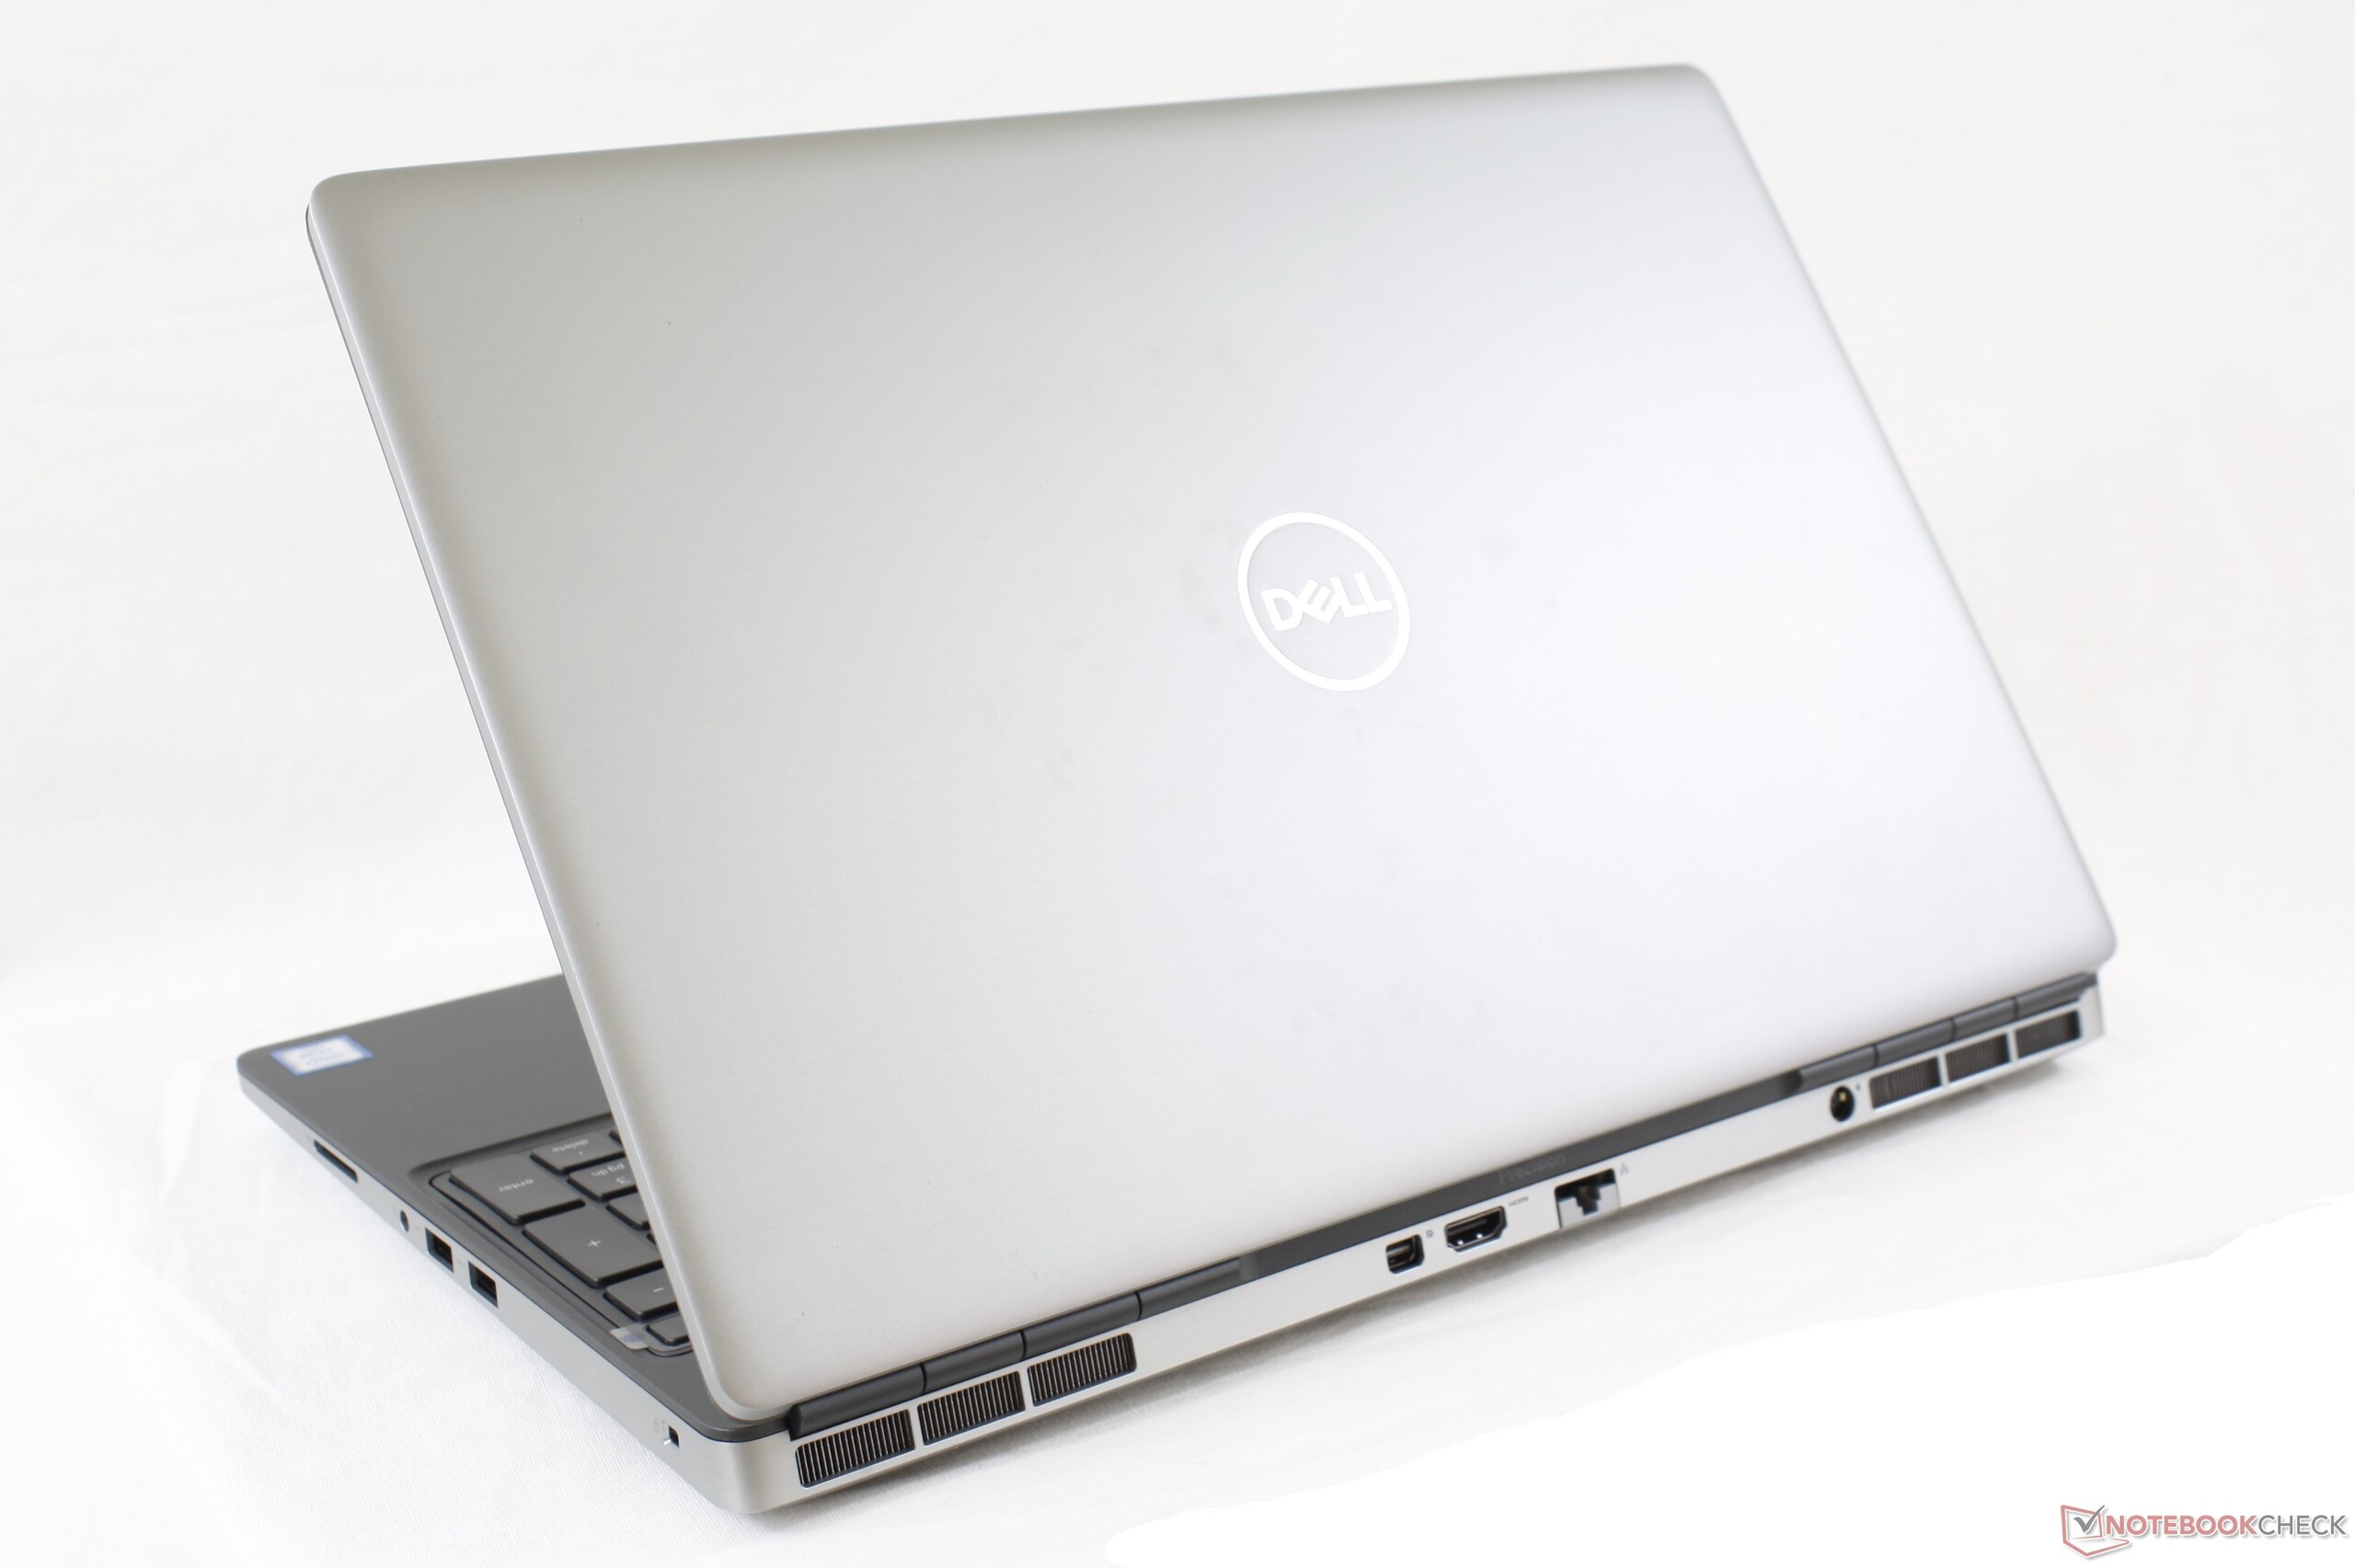
O substancial Precision 7550 é um workstation atraente se você valoriza seus recursos de hardware opcionais e capacidade de expansão. Caso contrário, você pode obter essencialmente o mesmo desempenho bruto de workstations Nvidia Studio mais recentes que são uma fração do tamanho e peso.
Dell Precision 7550
- 08/28/2020 v7 (old)
Allen Ngo
Price comparison
