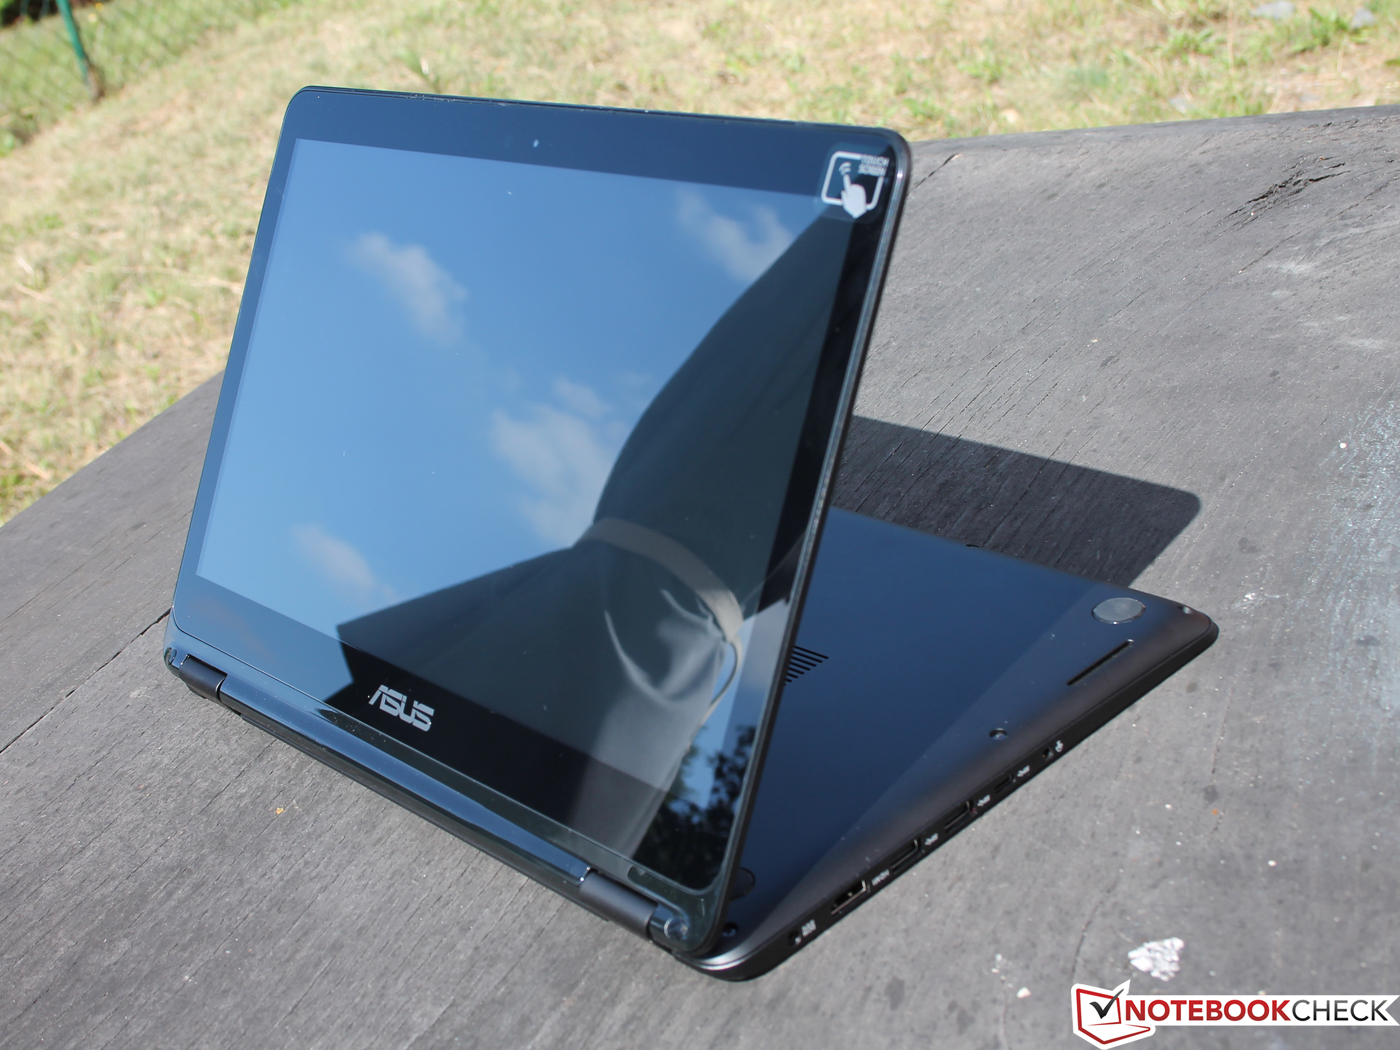
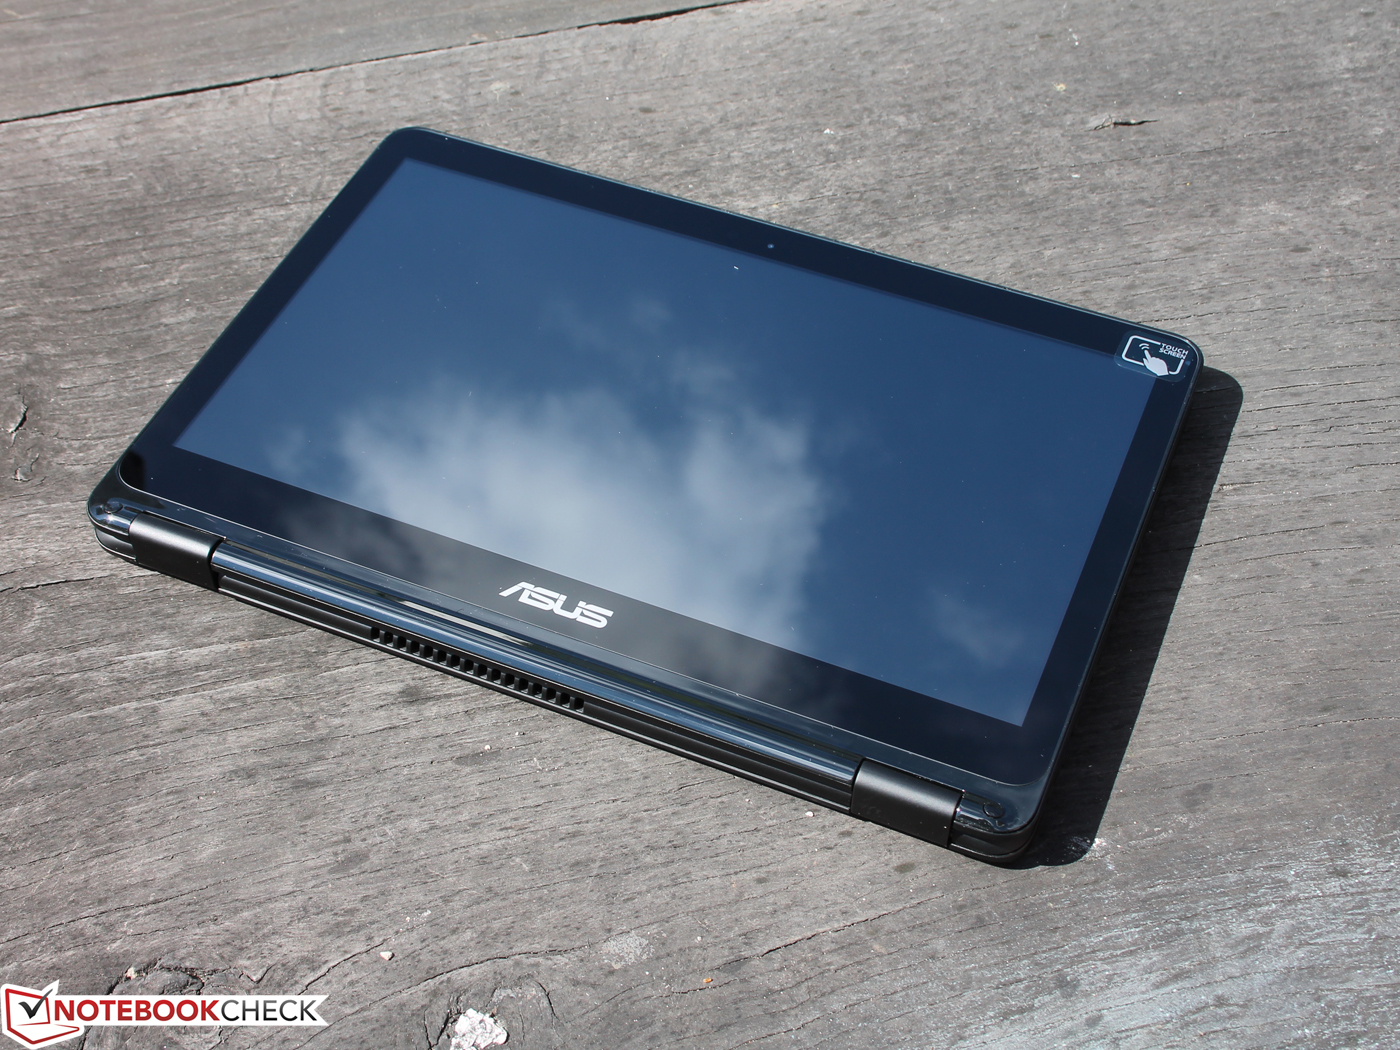
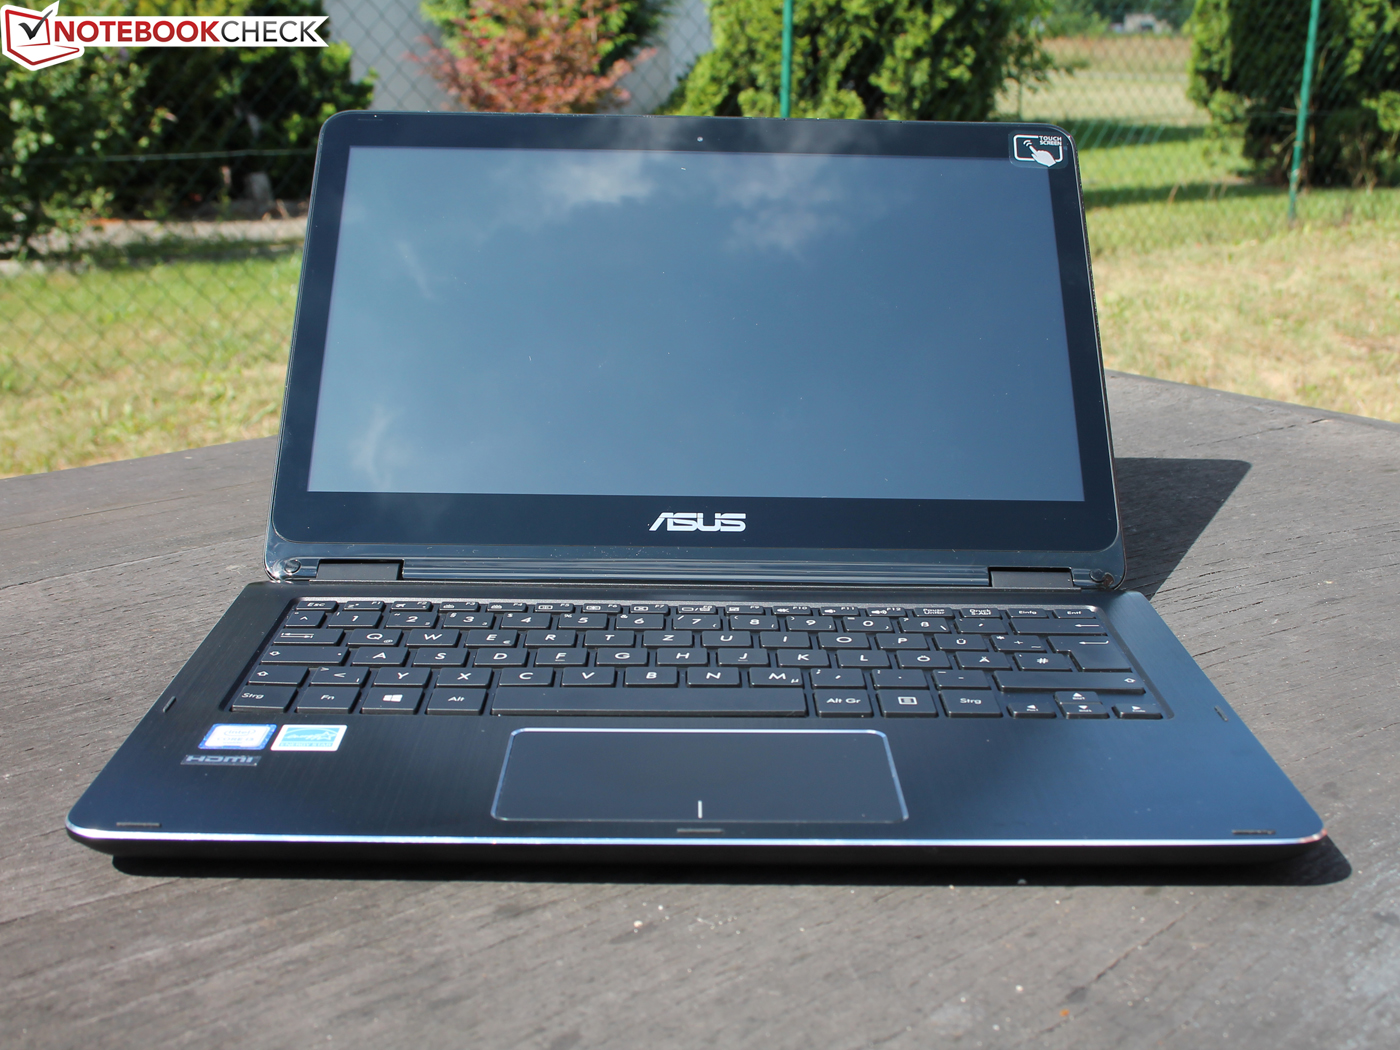
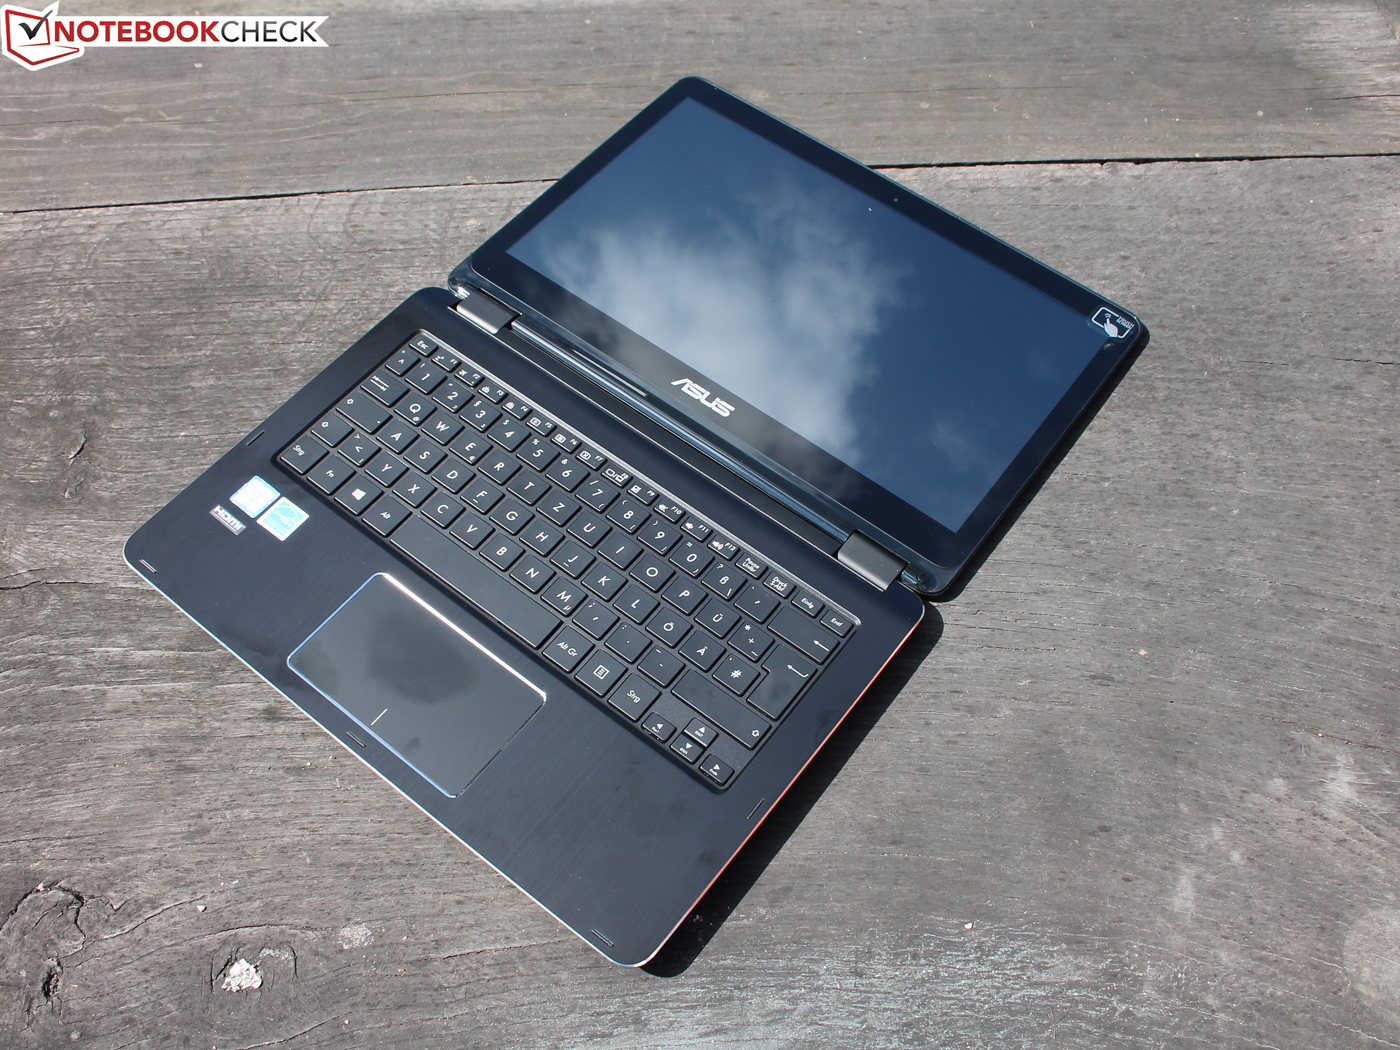
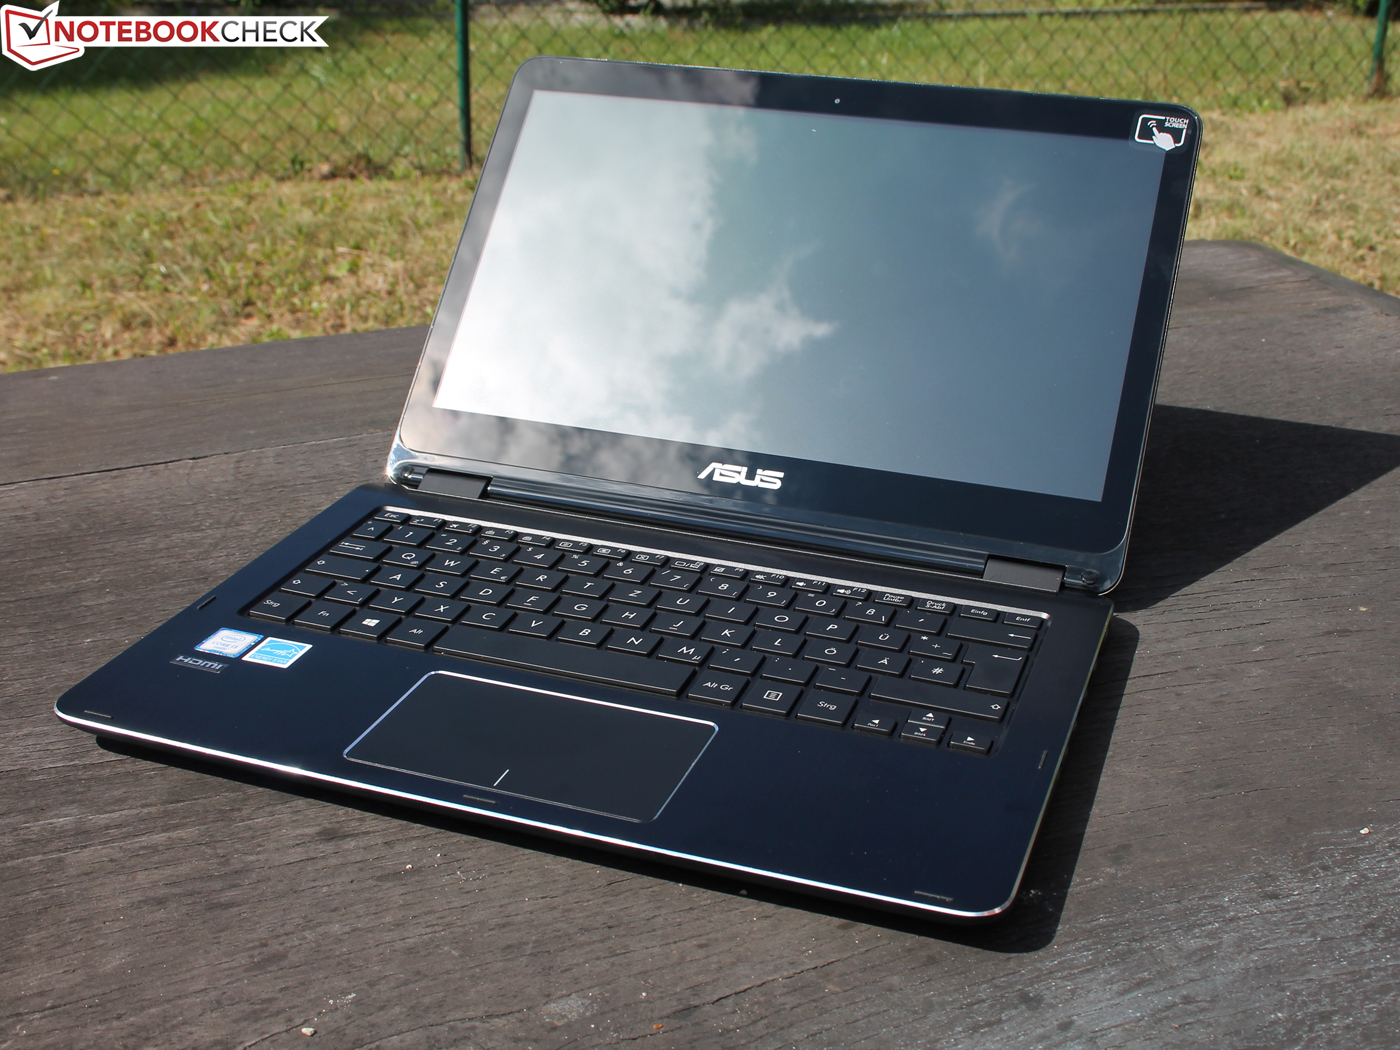
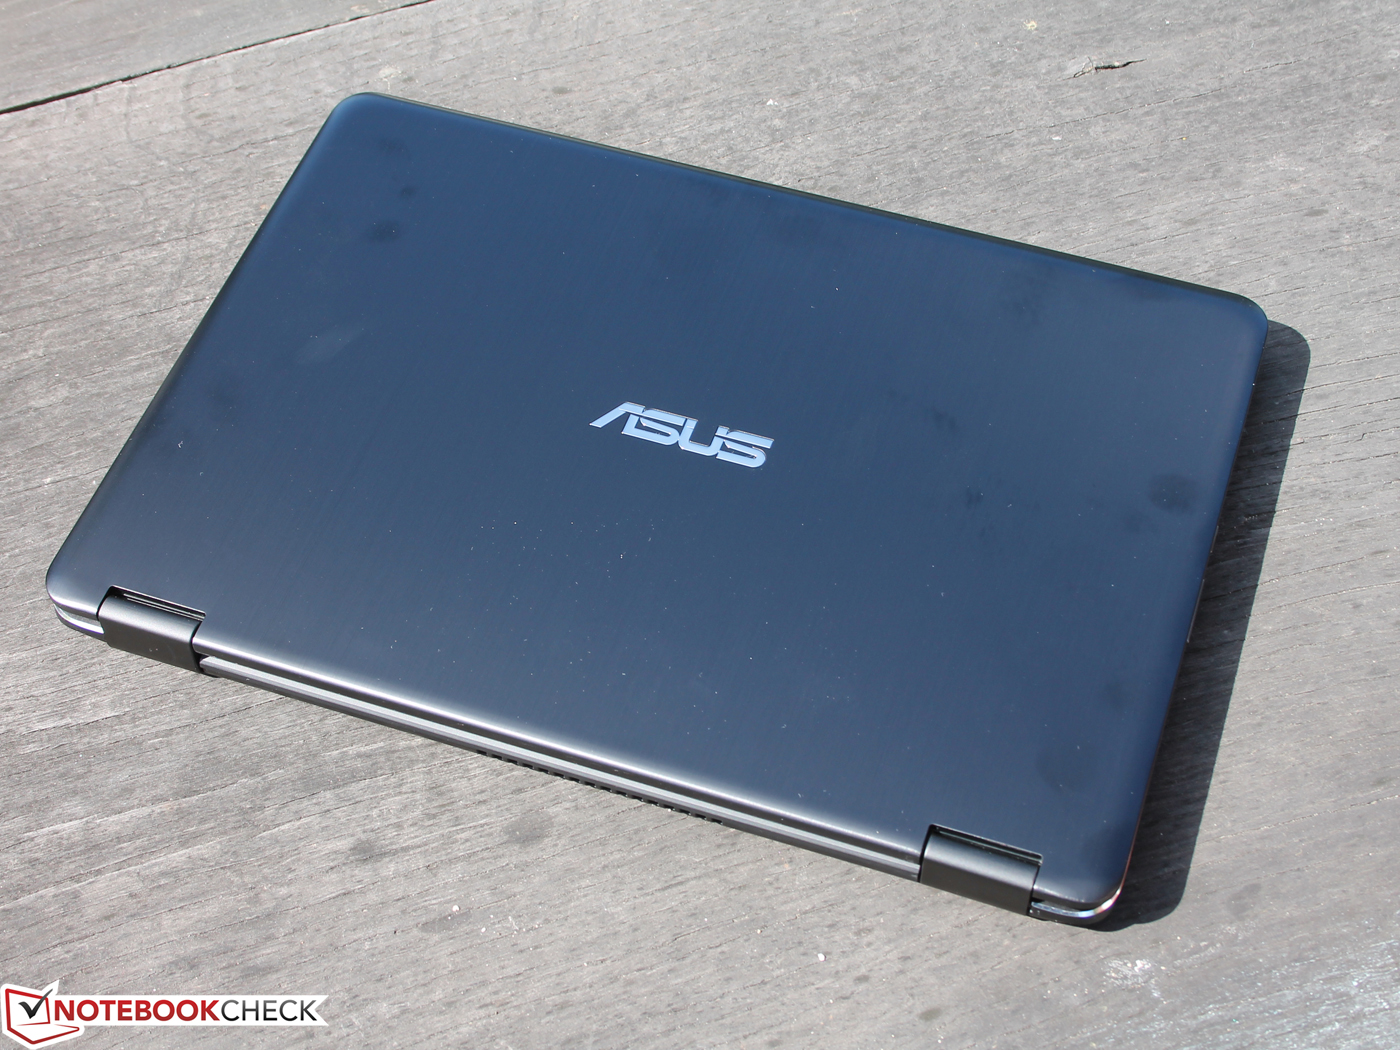
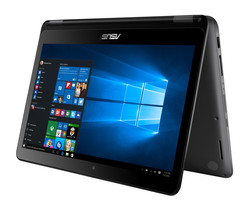
Breve Análise do Conversível Asus VivoBook Flip TP301UA-DW006T
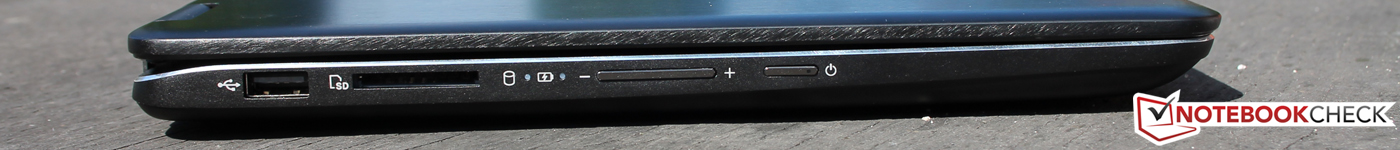
| SD Card Reader | |
| average JPG Copy Test (av. of 3 runs) | |
| Asus VivoBook Flip TP301UA-DW006T | |
| Asus Zenbook UX360CA-FC060T | |
| Dell Inspiron 13 5368 | |
| Acer Aspire R13 R7-372T-746N | |
| maximum AS SSD Seq Read Test (1GB) | |
| Asus VivoBook Flip TP301UA-DW006T | |
| Asus Zenbook UX360CA-FC060T | |
| Acer Aspire R13 R7-372T-746N | |
| Dell Inspiron 13 5368 | |
| Networking | |
| iperf Server (receive) TCP 1 m | |
| HP Spectre x2 12-a001ng | |
| Asus VivoBook Flip TP301UA-DW006T (Seb) | |
| Dell Inspiron 13 5368 (Seb) | |
| iperf Client (transmit) TCP 1 m | |
| Asus VivoBook Flip TP301UA-DW006T (Seb) | |
| HP Spectre x2 12-a001ng | |
| Dell Inspiron 13 5368 (Seb) | |
| |||||||||||||||||||||||||
iluminação: 90 %
iluminação com acumulador: 166 cd/m²
Contraste: 377:1 (Preto: 0.44 cd/m²)
ΔE ColorChecker Calman: 4.07 | ∀{0.5-29.43 Ø4.73}
ΔE Greyscale Calman: 3.99 | ∀{0.09-98 Ø4.97}
63% sRGB (Argyll 1.6.3 3D)
40% AdobeRGB 1998 (Argyll 1.6.3 3D)
43.02% AdobeRGB 1998 (Argyll 3D)
62.6% sRGB (Argyll 3D)
41.63% Display P3 (Argyll 3D)
Gamma: 2.49
CCT: 7491 K
| Asus VivoBook Flip TP301UA-DW006T BOE HB133WX1-402, , 1920x1080, 13.3" | Dell Inspiron 13 5368 AUO B133HAB, , 1920x1080, 13.3" | Acer Aspire R13 R7-372T-746N Sharp LQ133T1JW02, , 2560x1440, 13.3" | HP Spectre x360 13-4104ng LG Philips LGD0000, , 2560x1440, 13.3" | Asus Zenbook UX360CA-FC060T AUO B133HAN02.7, , 1920x1080, 13.3" | |
|---|---|---|---|---|---|
| Display | -7% | 63% | 55% | 53% | |
| Display P3 Coverage (%) | 41.63 | 38.88 -7% | 69.6 67% | 66.8 60% | 65.1 56% |
| sRGB Coverage (%) | 62.6 | 57.7 -8% | 98 57% | 92.8 48% | 93 49% |
| AdobeRGB 1998 Coverage (%) | 43.02 | 40.17 -7% | 70.7 64% | 67.3 56% | 66.5 55% |
| Response Times | -130% | -114% | -37% | -60% | |
| Response Time Grey 50% / Grey 80% * (ms) | 38 ? | 44 ? -16% | 36 ? 5% | 24 ? 37% | 29 ? 24% |
| Response Time Black / White * (ms) | 9 ? | 31 ? -244% | 30 ? -233% | 19 ? -111% | 22 ? -144% |
| PWM Frequency (Hz) | 50 ? | 1000 ? | 192 ? | ||
| Screen | 21% | 72% | 49% | 35% | |
| Brightness middle (cd/m²) | 166 | 240 45% | 320 93% | 324 95% | 302 82% |
| Brightness (cd/m²) | 165 | 229 39% | 308 87% | 324 96% | 298 81% |
| Brightness Distribution (%) | 90 | 92 2% | 91 1% | 90 0% | 90 0% |
| Black Level * (cd/m²) | 0.44 | 0.24 45% | 0.17 61% | 0.34 23% | 0.21 52% |
| Contrast (:1) | 377 | 1000 165% | 1882 399% | 953 153% | 1438 281% |
| Colorchecker dE 2000 * | 4.07 | 4.75 -17% | 3.18 22% | 4.36 -7% | 6.33 -56% |
| Colorchecker dE 2000 max. * | 6.38 | 9.09 -42% | 9.91 -55% | 11.89 -86% | |
| Greyscale dE 2000 * | 3.99 | 4.3 -8% | 4.13 -4% | 4.62 -16% | 8.13 -104% |
| Gamma | 2.49 88% | 2.5 88% | 2.03 108% | 2.18 101% | 2.52 87% |
| CCT | 7491 87% | 5893 110% | 6752 96% | 6857 95% | 6811 95% |
| Color Space (Percent of AdobeRGB 1998) (%) | 40 | 36.79 -8% | 65 63% | 60 50% | 60 50% |
| Color Space (Percent of sRGB) (%) | 63 | 57.39 -9% | 98 56% | 93 48% | 93 48% |
| Média Total (Programa/Configurações) | -39% /
-5% | 7% /
46% | 22% /
38% | 9% /
26% |
* ... menor é melhor
Exibir tempos de resposta
| ↔ Tempo de resposta preto para branco | ||
|---|---|---|
| 9 ms ... ascensão ↗ e queda ↘ combinadas | ↗ 4 ms ascensão | 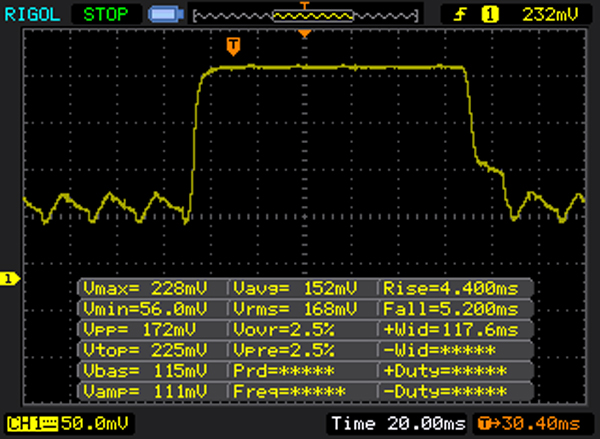 |
| ↘ 5 ms queda | ||
| A tela mostra taxas de resposta rápidas em nossos testes e deve ser adequada para jogos. Em comparação, todos os dispositivos testados variam de 0.1 (mínimo) a 240 (máximo) ms. » 25 % de todos os dispositivos são melhores. Isso significa que o tempo de resposta medido é melhor que a média de todos os dispositivos testados (19.9 ms). | ||
| ↔ Tempo de resposta 50% cinza a 80% cinza | ||
| 38 ms ... ascensão ↗ e queda ↘ combinadas | ↗ 19 ms ascensão | 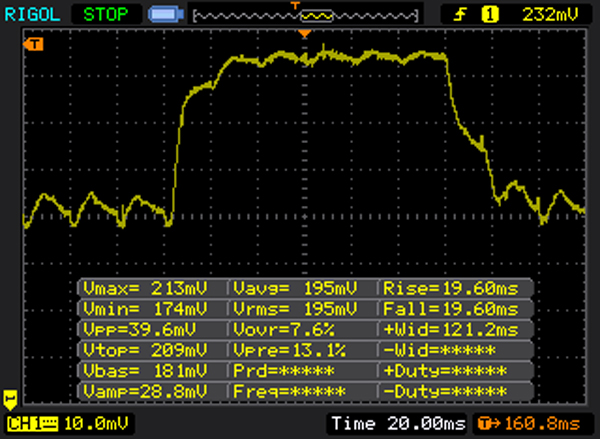 |
| ↘ 19 ms queda | ||
| A tela mostra taxas de resposta lentas em nossos testes e será insatisfatória para os jogadores. Em comparação, todos os dispositivos testados variam de 0.165 (mínimo) a 636 (máximo) ms. » 55 % de todos os dispositivos são melhores. Isso significa que o tempo de resposta medido é pior que a média de todos os dispositivos testados (31.1 ms). | ||
Cintilação da tela / PWM (modulação por largura de pulso)
| Tela tremeluzindo/PWM detectado | 50 Hz | ≤ 90 % configuração de brilho | 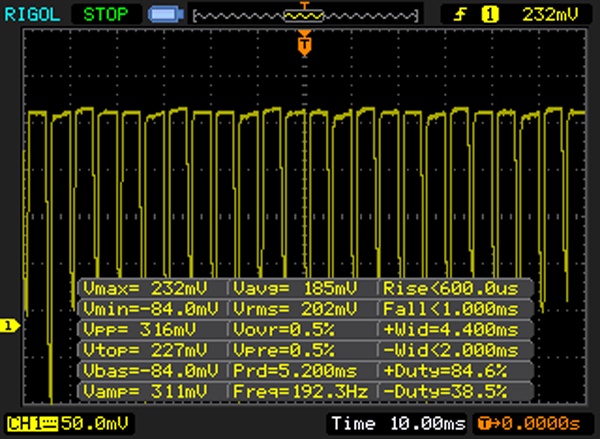 |
A luz de fundo da tela pisca em 50 Hz (pior caso, por exemplo, utilizando PWM) Cintilação detectada em uma configuração de brilho de 90 % e abaixo. Não deve haver cintilação ou PWM acima desta configuração de brilho. A frequência de 50 Hz é muito baixa, portanto a oscilação pode causar fadiga ocular e dores de cabeça após uso prolongado. [pwm_comparison] Em comparação: 52 % de todos os dispositivos testados não usam PWM para escurecer a tela. Se PWM foi detectado, uma média de 7798 (mínimo: 5 - máximo: 343500) Hz foi medida. | |||

| Cinebench R15 | |
| CPU Single 64Bit | |
| Dell Inspiron 13 5368 | |
| HP Spectre x360 13-4104ng | |
| Acer Aspire R13 R7-372T-746N | |
| Asus VivoBook Flip TP301UA-DW006T | |
| Asus Zenbook UX360CA-FC060T | |
| CPU Multi 64Bit | |
| Acer Aspire R13 R7-372T-746N | |
| Dell Inspiron 13 5368 | |
| HP Spectre x360 13-4104ng | |
| Asus VivoBook Flip TP301UA-DW006T | |
| Asus Zenbook UX360CA-FC060T | |
| PCMark 8 | |
| Home Score Accelerated v2 | |
| Dell Inspiron 13 5368 | |
| Acer Aspire R13 R7-372T-746N | |
| Asus VivoBook Flip TP301UA-DW006T | |
| Asus Zenbook UX360CA-FC060T | |
| Work Score Accelerated v2 | |
| Dell Inspiron 13 5368 | |
| Asus VivoBook Flip TP301UA-DW006T | |
| Acer Aspire R13 R7-372T-746N | |
| Asus Zenbook UX360CA-FC060T | |
| PCMark 8 Home Score Accelerated v2 | 2960 pontos | |
| PCMark 8 Work Score Accelerated v2 | 4121 pontos | |
Ajuda | ||
| Asus VivoBook Flip TP301UA-DW006T Samsung CM871 MZ7LF128HCHP | Dell Inspiron 13 5368 Toshiba THNSNK256GCS8 | Acer Aspire R13 R7-372T-746N Lite-On CV1-8B256 | HP Spectre x360 13-4104ng Samsung SSD PM851 256 GB MZNTE256HMHP | Asus Zenbook UX360CA-FC060T Lite-On CV1-8B128 | |
|---|---|---|---|---|---|
| CrystalDiskMark 3.0 | 610% | 761% | 389% | 406% | |
| Read Seq (MB/s) | 396 | 479 21% | 507 28% | 491.8 24% 491.8 24% | 497 26% |
| Write Seq (MB/s) | 133.5 | 270.1 102% | 354.4 165% | 264.5 98% 264.5 98% | 182.9 37% |
| Read 512 (MB/s) | 259.5 | 428.3 65% | 355.3 37% | 396.2 53% 396.2 53% | 353 36% |
| Write 512 (MB/s) | 23.86 | 267.9 1023% | 353.9 1383% | 264.5 1009% 264.5 1009% | 144.1 504% |
| Read 4k (MB/s) | 5.783 | 23.77 311% | 32.66 465% | 30.88 434% 30.88 434% | 31.89 451% |
| Write 4k (MB/s) | 8.507 | 81.4 857% | 81.6 859% | 75.6 789% 75.6 789% | 62 629% |
| Read 4k QD32 (MB/s) | 97.5 | 333.6 242% | 277.6 185% | 31.85 -67% 31.85 -67% | 207.7 113% |
| Write 4k QD32 (MB/s) | 8.515 | 200.9 2259% | 261.2 2968% | 73.9 768% 73.9 768% | 131.8 1448% |

| 3DMark 11 - 1280x720 Performance GPU | |
| Dell Inspiron 13 5368 | |
| Acer Aspire R13 R7-372T-746N | |
| HP Spectre x360 13-4104ng | |
| HP Spectre x360 13-4104ng | |
| Asus VivoBook Flip TP301UA-DW006T | |
| Asus Zenbook UX360CA-FC060T | |
| 3DMark | |
| 1280x720 Cloud Gate Standard Graphics | |
| Dell Inspiron 13 5368 | |
| Acer Aspire R13 R7-372T-746N | |
| HP Spectre x360 13-4104ng | |
| HP Spectre x360 13-4104ng | |
| Asus Zenbook UX360CA-FC060T | |
| Asus VivoBook Flip TP301UA-DW006T | |
| 1920x1080 Fire Strike Graphics | |
| Acer Aspire R13 R7-372T-746N | |
| HP Spectre x360 13-4104ng | |
| HP Spectre x360 13-4104ng | |
| 3DMark 11 Performance | 1141 pontos | |
| 3DMark Cloud Gate Standard Score | 3915 pontos | |
Ajuda | ||
| Rise of the Tomb Raider - 1024x768 Lowest Preset | |
| Dell Inspiron 13 5368 | |
| Asus VivoBook Flip TP301UA-DW006T | |
| Asus Zenbook UX360CA-FC060T | |
| BioShock Infinite - 1366x768 Medium Preset | |
| Dell Inspiron 13 5368 | |
| Acer Aspire R13 R7-372T-746N | |
| HP Spectre x360 13-4104ng | |
| Asus VivoBook Flip TP301UA-DW006T | |
| Asus Zenbook UX360CA-FC060T | |
| Thief - 1024x768 Very Low Preset | |
| Dell Inspiron 13 5368 | |
| Asus VivoBook Flip TP301UA-DW006T | |
| baixo | média | alto | ultra | |
|---|---|---|---|---|
| BioShock Infinite (2013) | 43 | 24.3 | 18.4 | |
| Thief (2014) | 13.3 | 8.6 | ||
| Rise of the Tomb Raider (2016) | 14 | 9 |
Barulho
| Ocioso |
| 31.3 / 31.3 / 32.9 dB |
| Carga |
| 35 / 34.9 dB |
 | ||
30 dB silencioso 40 dB(A) audível 50 dB(A) ruidosamente alto |
||
min: | ||
(+) A temperatura máxima no lado superior é 30.6 °C / 87 F, em comparação com a média de 35.4 °C / 96 F , variando de 19.6 a 60 °C para a classe Convertible.
(+) A parte inferior aquece até um máximo de 33.3 °C / 92 F, em comparação com a média de 36.9 °C / 98 F
(+) Em uso inativo, a temperatura média para o lado superior é 24.8 °C / 77 F, em comparação com a média do dispositivo de 30.3 °C / ### class_avg_f### F.
(+) Os apoios para as mãos e o touchpad são mais frios que a temperatura da pele, com um máximo de 27.2 °C / 81 F e, portanto, são frios ao toque.
(±) A temperatura média da área do apoio para as mãos de dispositivos semelhantes foi 28 °C / 82.4 F (+0.8 °C / 1.4 F).
Asus VivoBook Flip TP301UA-DW006T análise de áudio
(±) | o volume do alto-falante é médio, mas bom (###valor### dB)
Graves 100 - 315Hz
(-) | quase nenhum baixo - em média 15.8% menor que a mediana
(±) | a linearidade dos graves é média (11.8% delta para a frequência anterior)
Médios 400 - 2.000 Hz
(±) | médios mais altos - em média 6.9% maior que a mediana
(±) | a linearidade dos médios é média (8.5% delta para frequência anterior)
Altos 2 - 16 kHz
(±) | máximos mais altos - em média 8.6% maior que a mediana
(+) | os máximos são lineares (5.3% delta da frequência anterior)
Geral 100 - 16.000 Hz
(±) | a linearidade do som geral é média (24.7% diferença em relação à mediana)
Comparado com a mesma classe
» 74% de todos os dispositivos testados nesta classe foram melhores, 7% semelhantes, 19% piores
» O melhor teve um delta de 6%, a média foi 20%, o pior foi 57%
Comparado com todos os dispositivos testados
» 75% de todos os dispositivos testados foram melhores, 5% semelhantes, 20% piores
» O melhor teve um delta de 4%, a média foi 24%, o pior foi 134%
Acer Aspire R13 R7-372T-746N análise de áudio
(±) | o volume do alto-falante é médio, mas bom (###valor### dB)
Analysis not possible as minimum curve is missing or too high
| desligado | |
| Ocioso | |
| Carga |
|
Key:
min: | |
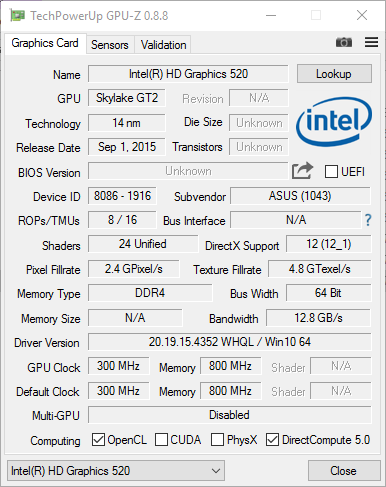
| Asus VivoBook Flip TP301UA-DW006T 6100U, HD Graphics 520, Samsung CM871 MZ7LF128HCHP, TN, 1920x1080, 13.3" | Dell Inspiron 13 5368 6500U, HD Graphics 520, Toshiba THNSNK256GCS8, IPS, 1920x1080, 13.3" | Acer Aspire R13 R7-372T-746N 6500U, HD Graphics 520, Lite-On CV1-8B256, IPS, 2560x1440, 13.3" | HP Spectre x360 13-4104ng 6200U, HD Graphics 520, Samsung SSD PM851 256 GB MZNTE256HMHP, IPS, 2560x1440, 13.3" | Asus Zenbook UX360CA-FC060T 6Y30, HD Graphics 515, Lite-On CV1-8B128, IPS with 72% NTSC, 1920x1080, 13.3" | |
|---|---|---|---|---|---|
| Power Consumption | -22% | -67% | -25% | -2% | |
| Idle Minimum * (Watt) | 2.95 | 4.4 -49% | 6.2 -110% | 3.9 -32% | 3.4 -15% |
| Idle Average * (Watt) | 5.6 | 6.1 -9% | 8 -43% | 7.4 -32% | 7 -25% |
| Idle Maximum * (Watt) | 7.7 | 6.8 12% | 11.6 -51% | 9.2 -19% | 7.6 1% |
| Load Average * (Watt) | 22.6 | 29 -28% | 40 -77% | 28.1 -24% | 19 16% |
| Load Maximum * (Watt) | 23.5 | 31.9 -36% | 36.6 -56% | 27.6 -17% | 20.1 14% |
* ... menor é melhor
| Asus VivoBook Flip TP301UA-DW006T 6100U, HD Graphics 520, 55 Wh | Dell Inspiron 13 5368 6500U, HD Graphics 520, 42 Wh | Acer Aspire R13 R7-372T-746N 6500U, HD Graphics 520, 49 Wh | HP Spectre x360 13-4104ng 6200U, HD Graphics 520, 56 Wh | Asus Zenbook UX360CA-FC060T 6Y30, HD Graphics 515, 54 Wh | |
|---|---|---|---|---|---|
| Duração da bateria | -40% | -23% | 73% | 13% | |
| Reader / Idle (h) | 21 | 11.2 -47% | 11.2 -47% | 17.1 -19% | |
| WiFi v1.3 (h) | 4.8 | 4 -17% | 6.4 33% | 8.3 73% | 6.4 33% |
| Load (h) | 3.2 | 1.4 -56% | 1.4 -56% | 4 25% | |
| H.264 (h) | 6.6 |
Pro
Contra
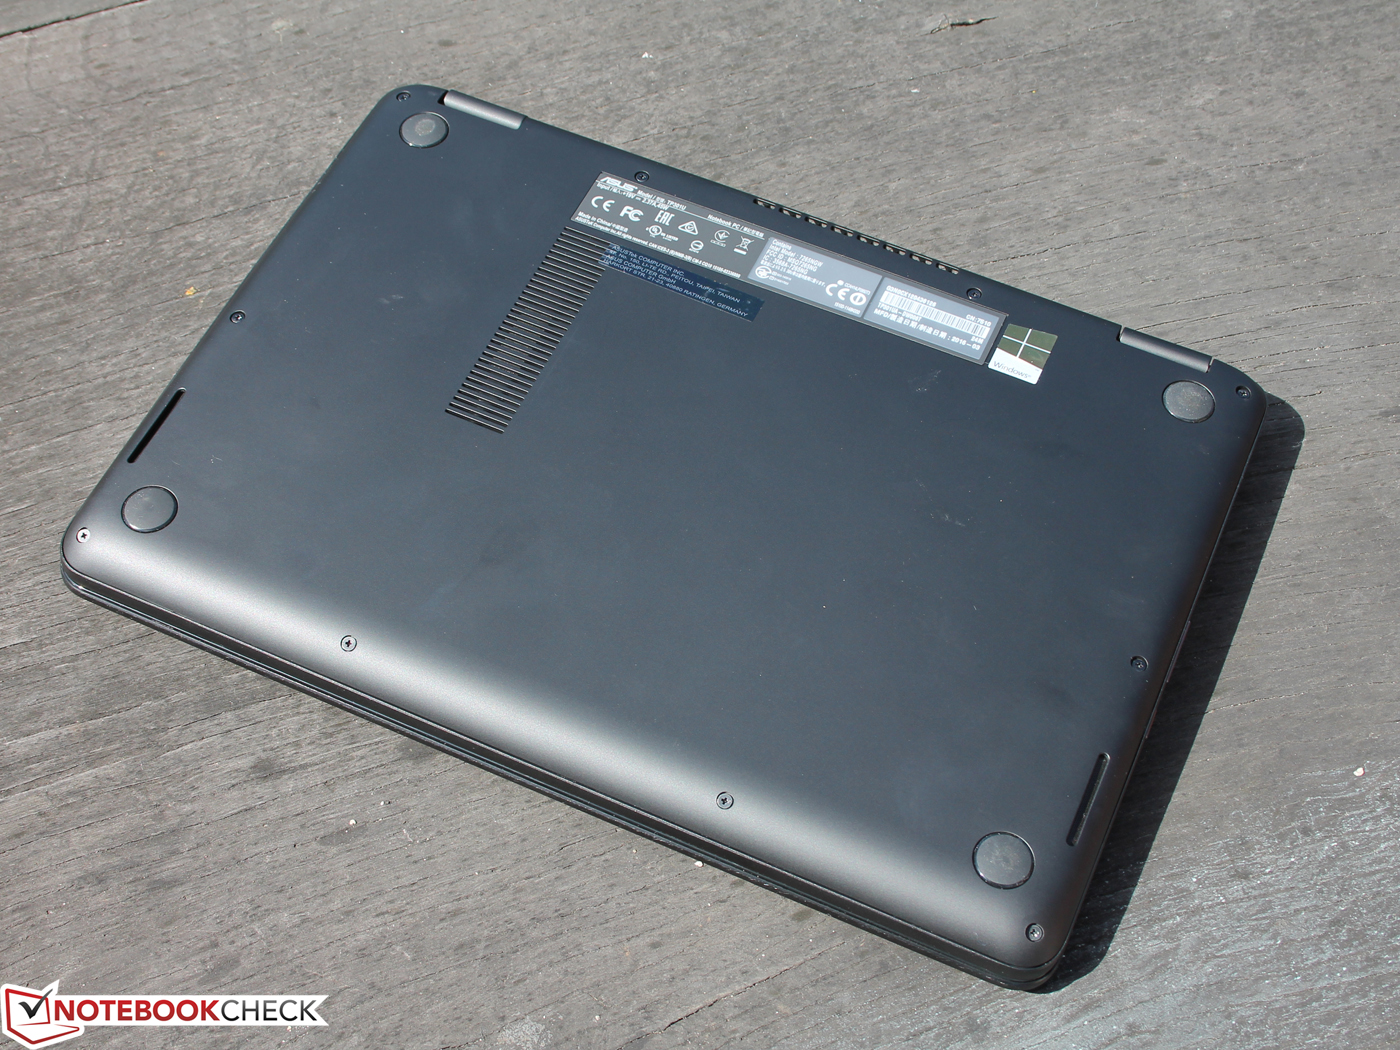
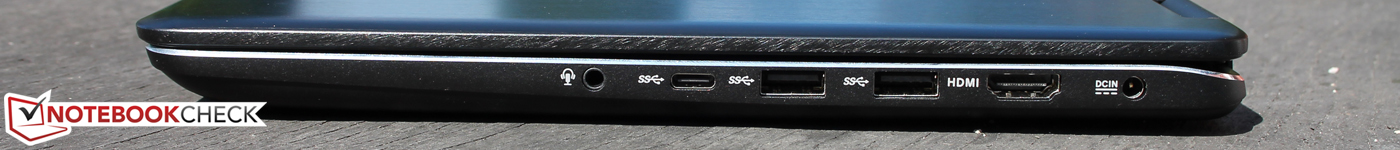
A Asus faz um bom trabalho em muitos aspectos, mas também comete alguns erros graves. O VivoBook Flip TP301UA-DW006T poderia ter sido um conversível interessante, principalmente na faixa de preços mais baixa. 650 Euros (~$725) por uma sólida carcaça de alumínio, resolução Full HD, suficientes interfaces, manutenção simples, desempenho do portátil com SSD, e boas durações, parecem ser atraentes à primeira vista.
No entanto, a Asus incorpora que, em parte, se devem à configuração de gama baixa. O maior ponto fraco é o painel HD baseado na tecnologia TN - ângulos de visão instáveis, são simplesmente inapropriados em um tablet. O teclado levemente esponjoso e as dobradiças não apropriadamente firmes, pioram as coisas. Por este motivo, não podemos recomendar o modelo de teste, mas podemos recomendar os modelos IPS com a mesma resolução. Eles custam, pelo menos 999 Euros (~$1115) mas não sofrem de ângulo de visão fracos. O cargo extra também inclui uma GeForce 920M e SSD de 256 GB. O lento SSD SATA provavelmente também seja instalado na versão mais cara, mas deve ser de maior capacidade.
Os compradores que desejam muitas interfaces devem optar pelo Acer Aspire R13 R7-372T e, se for assim, aceitam as dimensões maiores. O Aspire R13 R7-372T, Spectre x360 13-4104ng, e Zenbook UX360CA têm duas vantagens sobre o VivoBook Flip: Os SSDs M.2 com taxas de dados mais velozes e telas IPS superiores. O Spectre x360 13-4104ng oferece uma carcaça de alta qualidade, sei isso for important. Aqui também encontramos a maior resolução, assim como no Aspire R13 R7.
Asus VivoBook Flip TP301UA-DW006T
- 08/30/2016 v5.1 (old)
Sebastian Jentsch