Breve Análise do Conversível Dell Inspiron 17-7786 (i7-8565U, 16 GB, 17 polegadas Touch, MX 150)
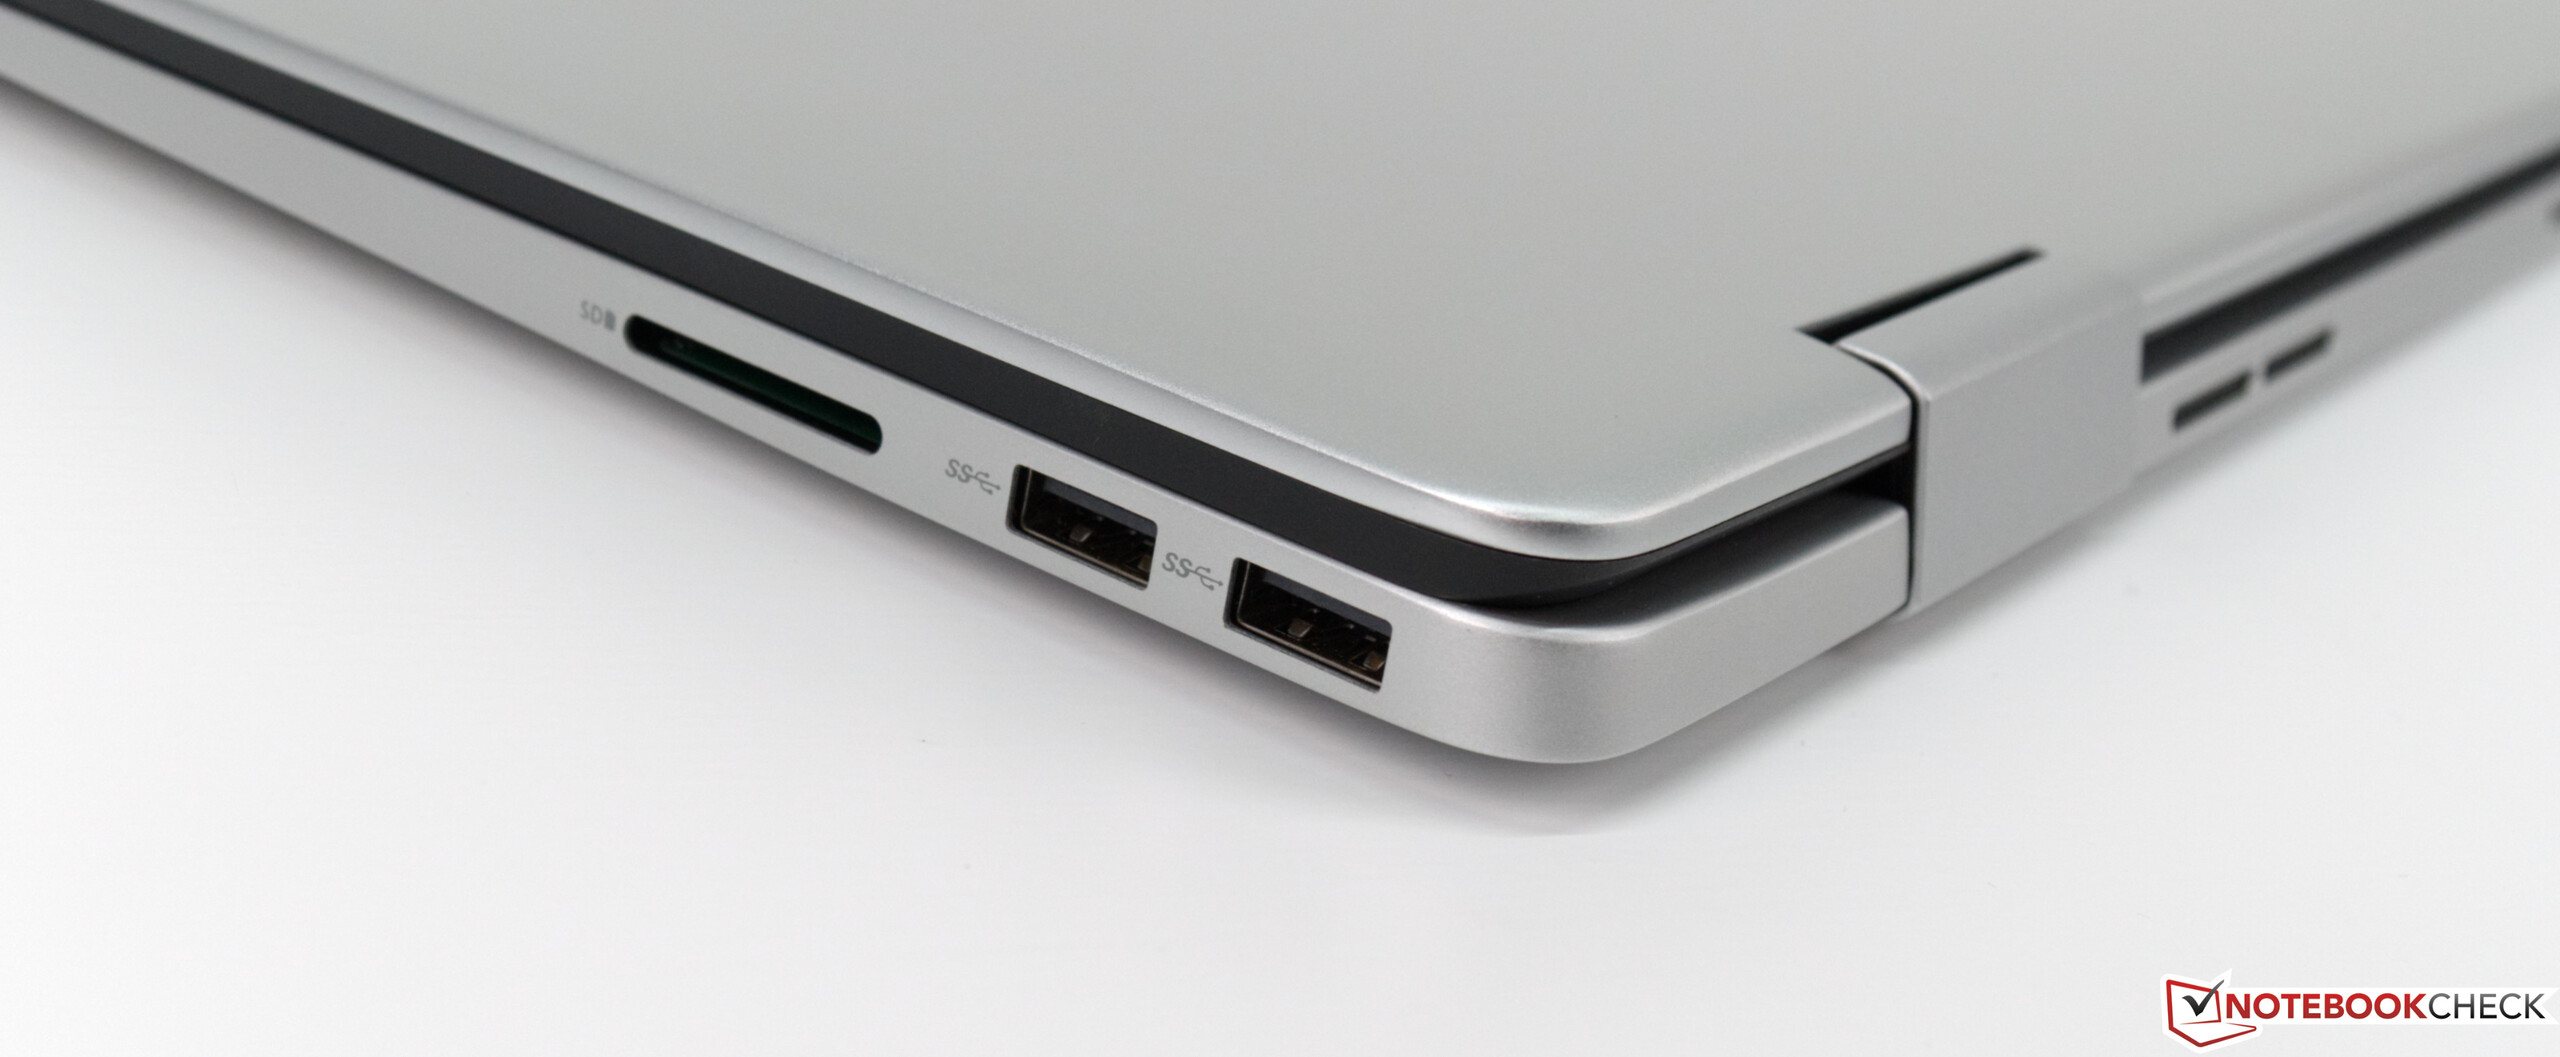
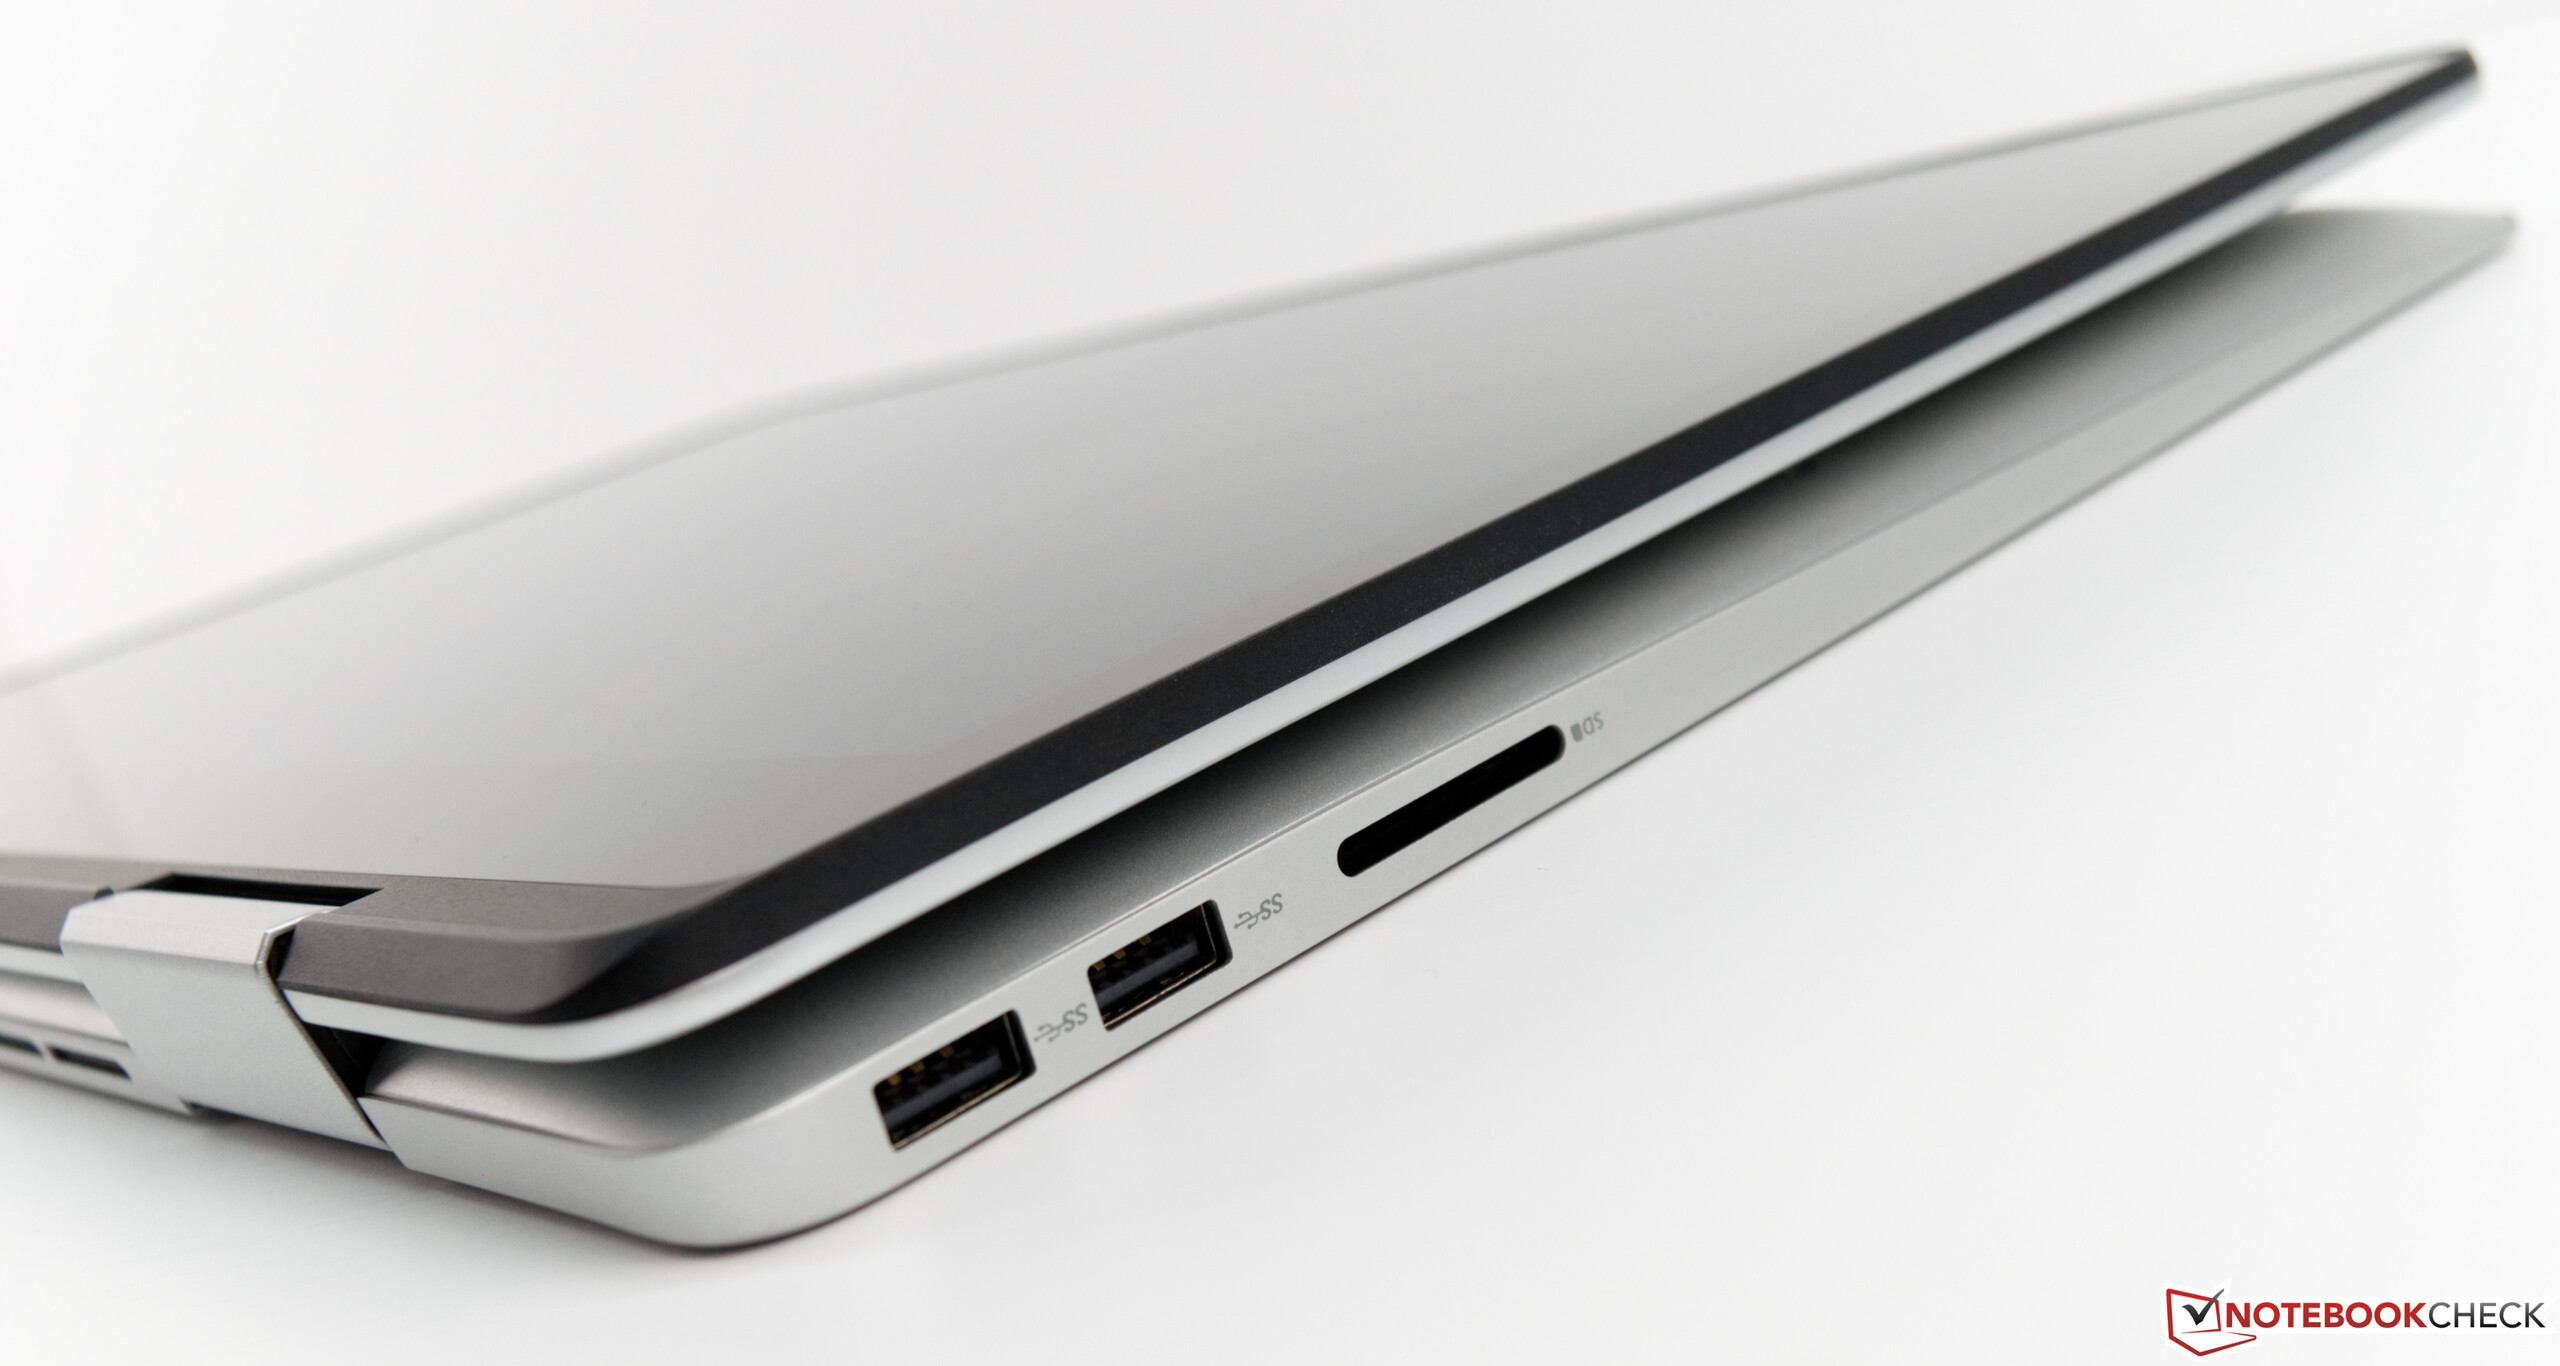
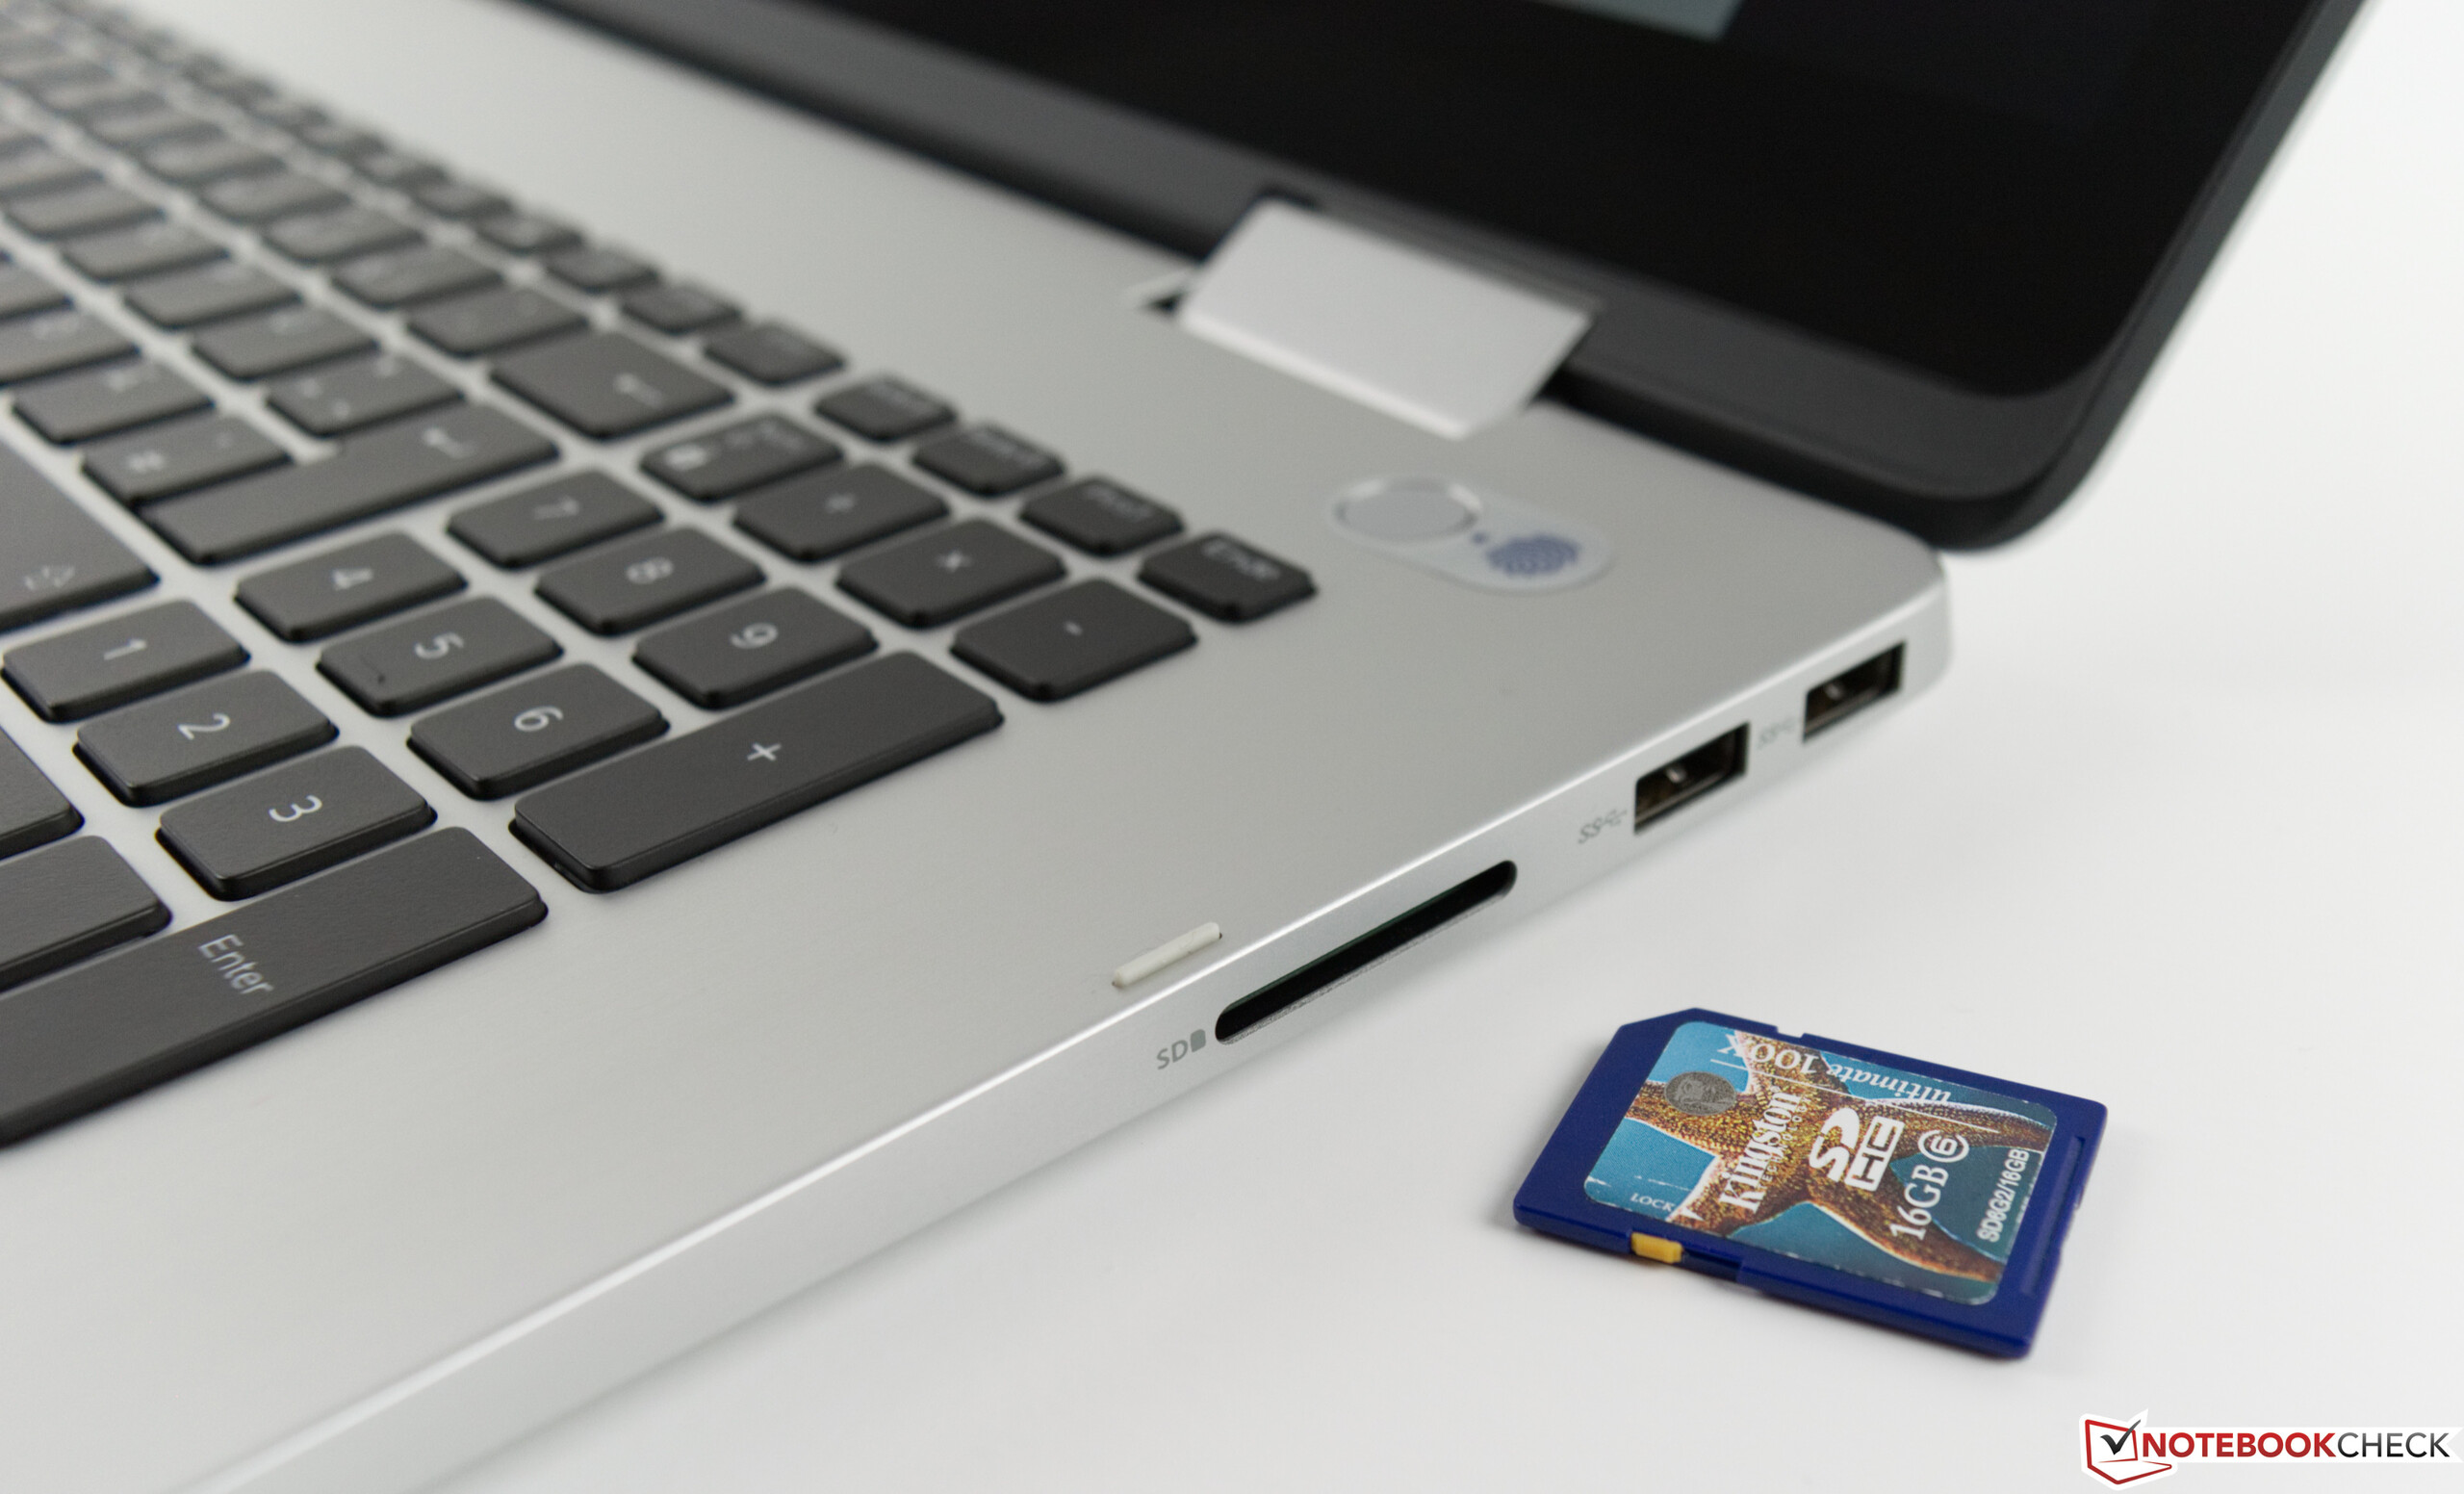
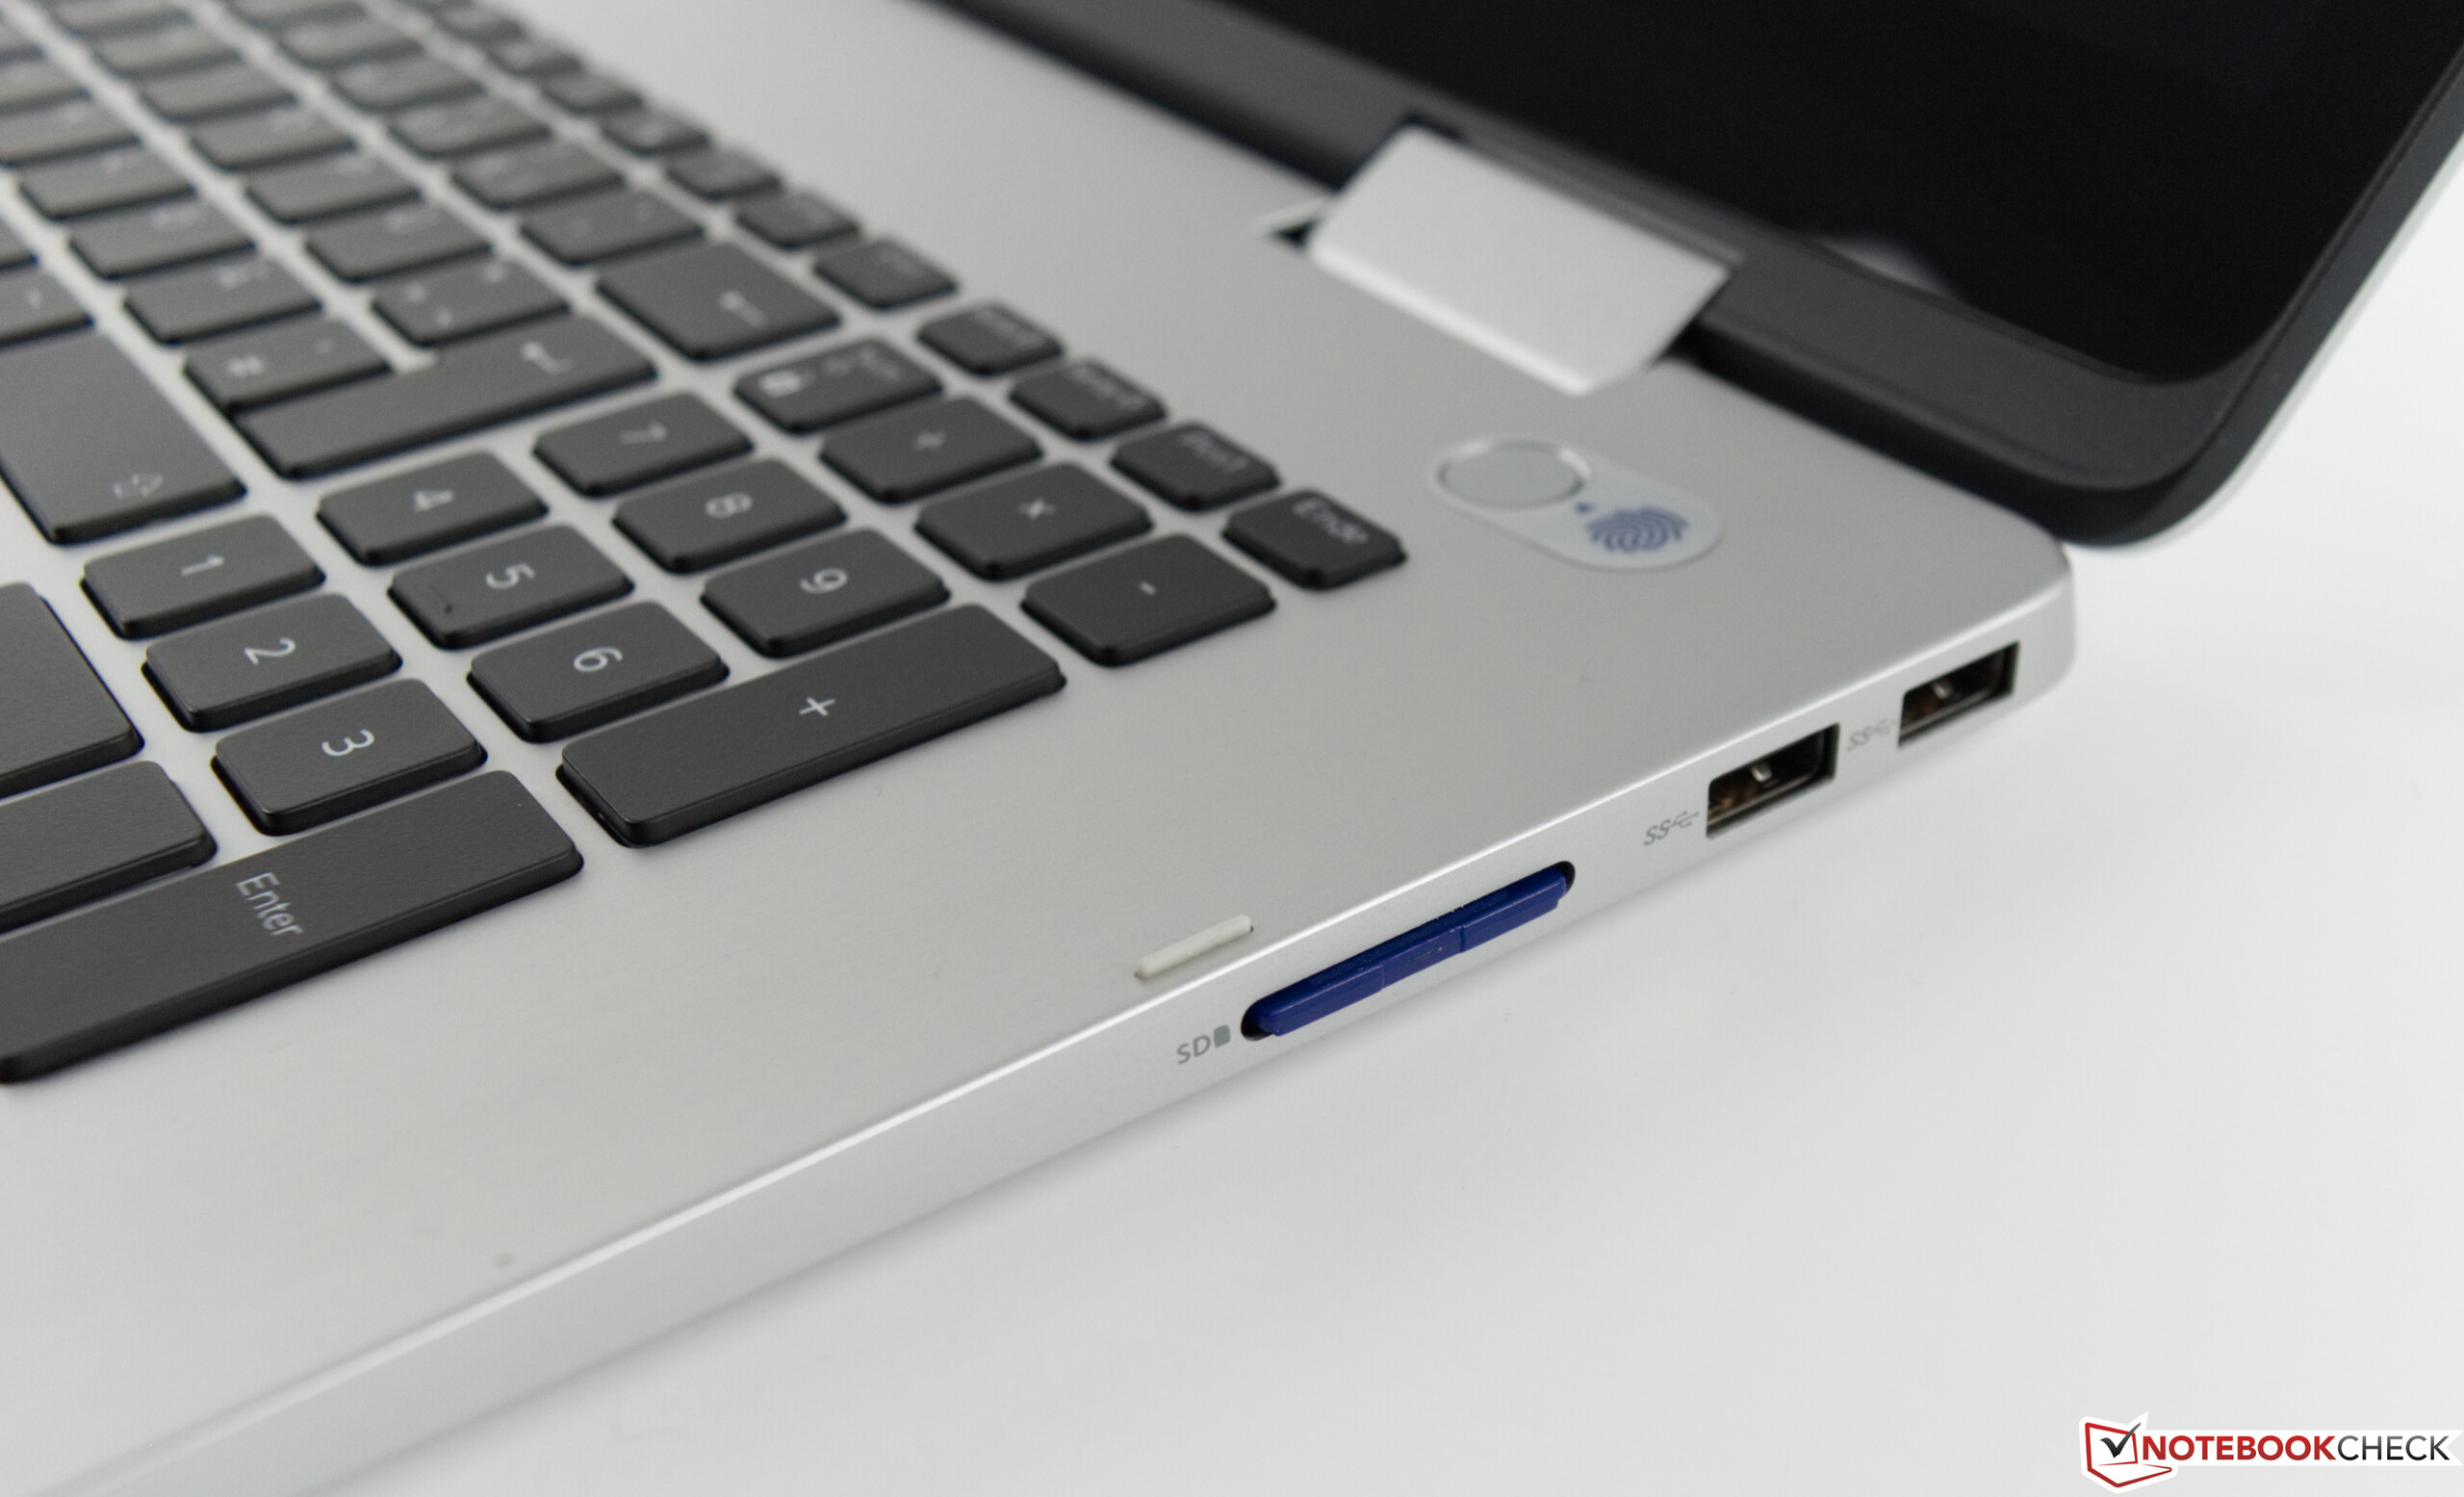
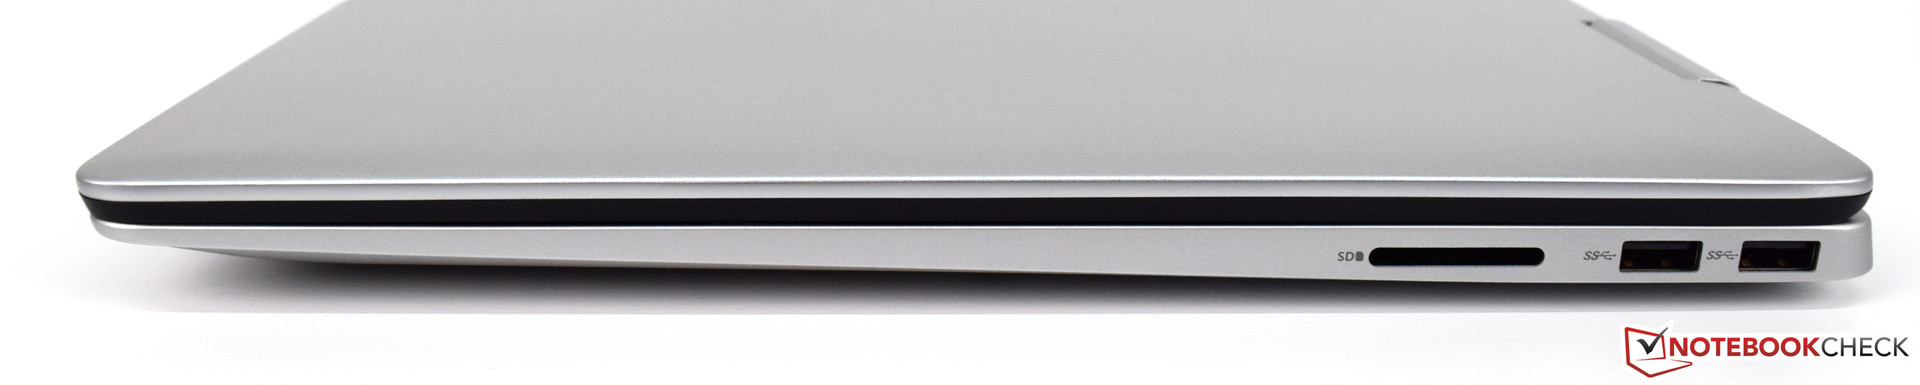

| SD Card Reader | |
| average JPG Copy Test (av. of 3 runs) | |
| Média da turma Multimedia (23 - 531, n=37, últimos 2 anos) | |
| Acer Aspire 5 A517-51G-80L (Toshiba Exceria Pro SDXC 64 GB UHS-II) | |
| HP Envy 17-ae143ng (Toshiba Exceria Pro SDXC 64 GB UHS-II) | |
| Asus VivoBook Pro 17 N705UD-EH76 (Toshiba Exceria Pro SDXC 64 GB UHS-II) | |
| Dell Inspiron 17-7773-0043 (Toshiba Exceria Pro SDXC 64 GB UHS-II) | |
| Dell Inspiron 17-7786 (Toshiba Exceria Pro SDXC 64 GB UHS-II) | |
| Dell Inspiron 17 7778 | |
| maximum AS SSD Seq Read Test (1GB) | |
| Média da turma Multimedia (37.3 - 1455, n=36, últimos 2 anos) | |
| Acer Aspire 5 A517-51G-80L (Toshiba Exceria Pro SDXC 64 GB UHS-II) | |
| HP Envy 17-ae143ng (Toshiba Exceria Pro SDXC 64 GB UHS-II) | |
| Asus VivoBook Pro 17 N705UD-EH76 (Toshiba Exceria Pro SDXC 64 GB UHS-II) | |
| Dell Inspiron 17-7786 (Toshiba Exceria Pro SDXC 64 GB UHS-II) | |
| Dell Inspiron 17-7773-0043 (Toshiba Exceria Pro SDXC 64 GB UHS-II) | |
| Dell Inspiron 17 7778 | |
| Networking | |
| iperf3 transmit AX12 | |
| HP Envy 17-ae143ng | |
| Dell Inspiron 17-7786 | |
| Asus VivoBook Pro 17 N705UD-EH76 | |
| Dell Inspiron 17-7773-0043 | |
| Acer Aspire 5 A517-51G-80L | |
| iperf3 receive AX12 | |
| Asus VivoBook Pro 17 N705UD-EH76 | |
| Dell Inspiron 17-7786 | |
| HP Envy 17-ae143ng | |
| Acer Aspire 5 A517-51G-80L | |
| Dell Inspiron 17-7773-0043 | |
| |||||||||||||||||||||||||
iluminação: 82 %
iluminação com acumulador: 320 cd/m²
Contraste: 927:1 (Preto: 0.37 cd/m²)
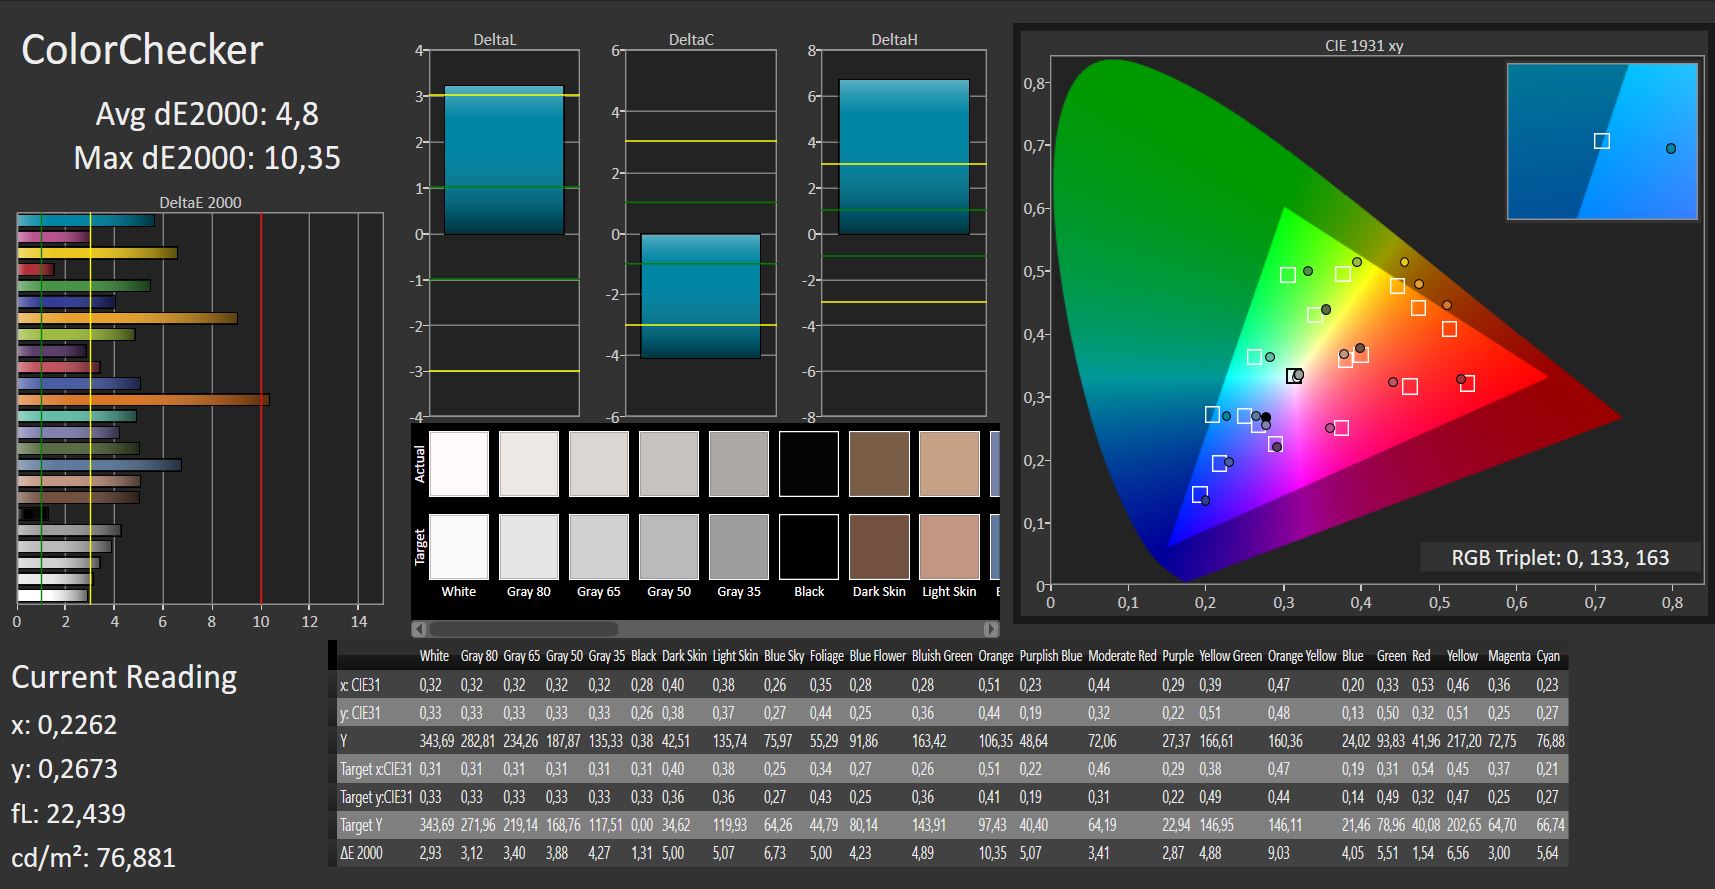
ΔE ColorChecker Calman: 4.8 | ∀{0.5-29.43 Ø4.71}
ΔE Greyscale Calman: 3.51 | ∀{0.09-98 Ø4.96}
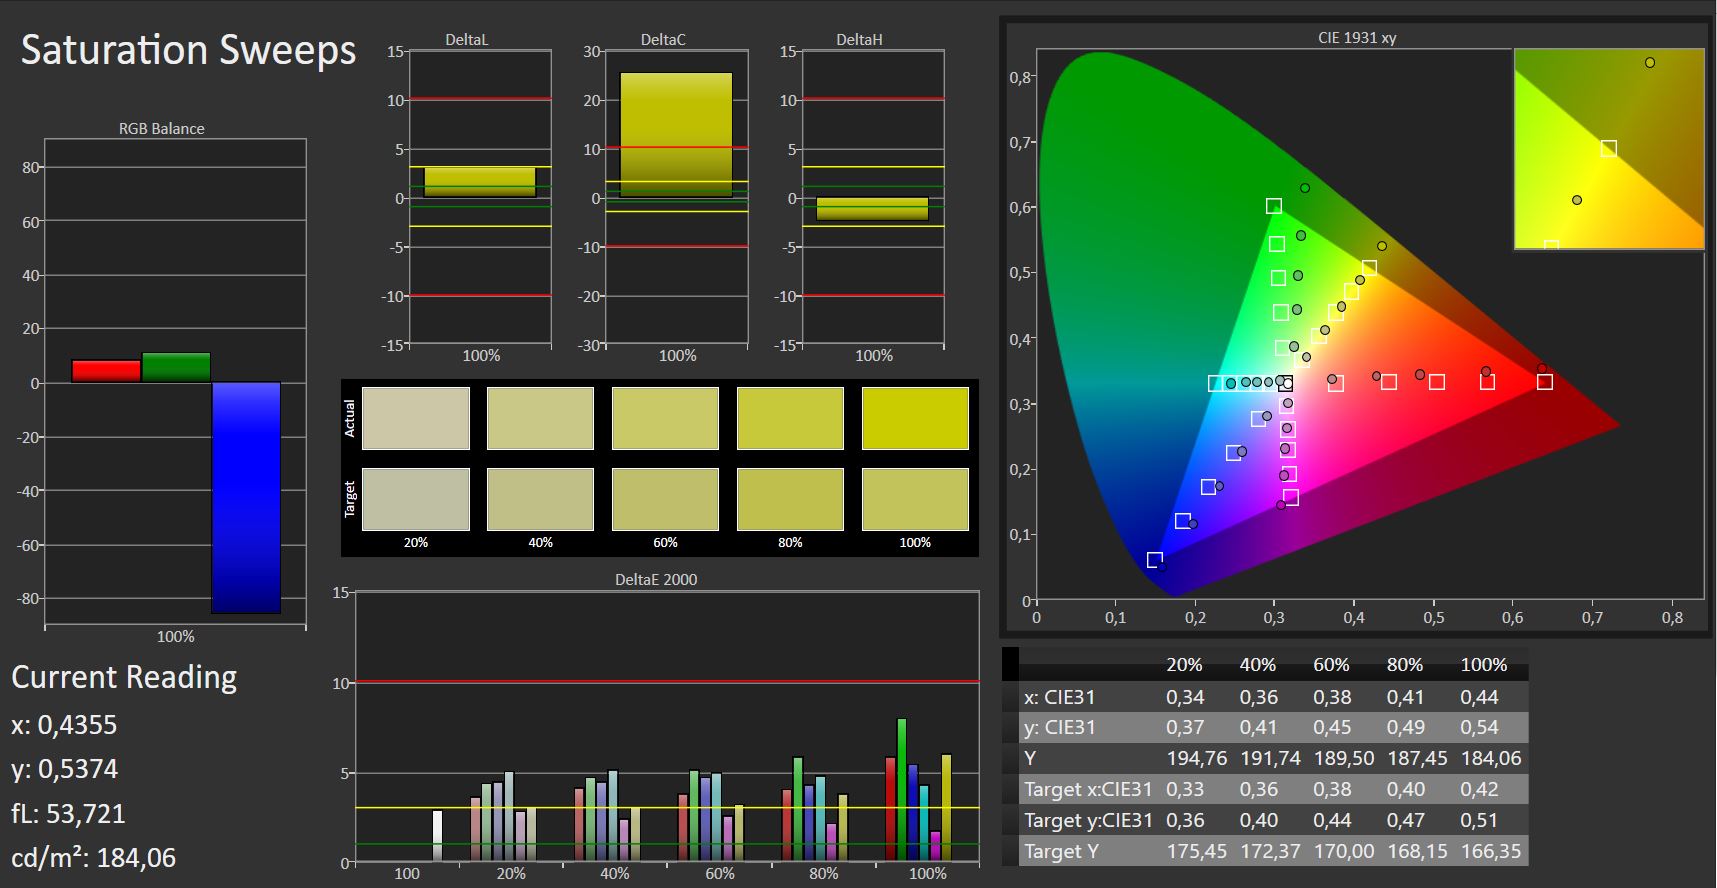
81% sRGB (Argyll 1.6.3 3D)
54% AdobeRGB 1998 (Argyll 1.6.3 3D)
59.7% AdobeRGB 1998 (Argyll 3D)
81.6% sRGB (Argyll 3D)
64.8% Display P3 (Argyll 3D)
Gamma: 2.19
CCT: 6188 K
| Dell Inspiron 17-7786 LG Philips, 173W4F, IPS, 1920x1080, 17.3" | Dell Inspiron 17-7773-0043 Chi Mei CMN1738, IPS, 1920x1080, 17.3" | Dell Inspiron 17 7778 LG Philips LGD 0513 / 173WF4, IPS, 1920x1080, 17.3" | HP Envy 17-ae143ng AU Optronics B173HW01 V0, IPS, 1920x1080, 17.3" | Acer Aspire 5 A517-51G-80L LG Display, LP173WF4-SPF5, aSi TFT, IPS, 1920x1080, 17.3" | Asus VivoBook Pro 17 N705UD-EH76 LP173WF4-SPF5, IPS, 1920x1080, 17.3" | |
|---|---|---|---|---|---|---|
| Display | 10% | 5% | 5% | 3% | 6% | |
| Display P3 Coverage (%) | 64.8 | 67.4 4% | 67.4 4% | 63.9 -1% | 66.3 2% | 67.9 5% |
| sRGB Coverage (%) | 81.6 | 91.9 13% | 86.3 6% | 88 8% | 84.2 3% | 86.8 6% |
| AdobeRGB 1998 Coverage (%) | 59.7 | 67.2 13% | 63.1 6% | 64.3 8% | 61.6 3% | 63.5 6% |
| Response Times | -5% | 12% | 18% | -12% | 17% | |
| Response Time Grey 50% / Grey 80% * (ms) | 38 ? | 40 ? -5% | 36 ? 5% | 33 ? 13% | 41 ? -8% | 30.8 ? 19% |
| Response Time Black / White * (ms) | 27 ? | 28 ? -4% | 22 ? 19% | 21 ? 22% | 31 ? -15% | 23.2 ? 14% |
| PWM Frequency (Hz) | 1000 ? | 122000 ? | 119000 ? | |||
| Screen | 5% | -13% | 3% | 16% | 0% | |
| Brightness middle (cd/m²) | 343 | 323 -6% | 327 -5% | 352 3% | 397 16% | 376.2 10% |
| Brightness (cd/m²) | 313 | 290 -7% | 314 0% | 330 5% | 364 16% | 355 13% |
| Brightness Distribution (%) | 82 | 77 -6% | 87 6% | 88 7% | 84 2% | 89 9% |
| Black Level * (cd/m²) | 0.37 | 0.21 43% | 0.3 19% | 0.31 16% | 0.29 22% | 0.42 -14% |
| Contrast (:1) | 927 | 1538 66% | 1090 18% | 1135 22% | 1369 48% | 896 -3% |
| Colorchecker dE 2000 * | 4.8 | 4.88 -2% | 6.75 -41% | 4.34 10% | 3.88 19% | 4.21 12% |
| Colorchecker dE 2000 max. * | 10.35 | 8.86 14% | 11.82 -14% | 8.69 16% | 8.22 21% | 8.31 20% |
| Greyscale dE 2000 * | 3.51 | 6.21 -77% | 7.91 -125% | 5.66 -61% | 3.1 12% | 5.5 -57% |
| Gamma | 2.19 100% | 2.36 93% | 2.31 95% | 2.29 96% | 2.59 85% | 2.335 94% |
| CCT | 6188 105% | 6620 98% | 7642 85% | 6326 103% | 6570 99% | 7056 92% |
| Color Space (Percent of AdobeRGB 1998) (%) | 54 | 60 11% | 57 6% | 57 6% | 55 2% | 57 6% |
| Color Space (Percent of sRGB) (%) | 81 | 92 14% | 86 6% | 88 9% | 84 4% | 87 7% |
| Colorchecker dE 2000 calibrated * | 3.95 | |||||
| Média Total (Programa/Configurações) | 3% /
5% | 1% /
-6% | 9% /
6% | 2% /
10% | 8% /
4% |
* ... menor é melhor

Exibir tempos de resposta
| ↔ Tempo de resposta preto para branco | ||
|---|---|---|
| 27 ms ... ascensão ↗ e queda ↘ combinadas | ↗ 16 ms ascensão | 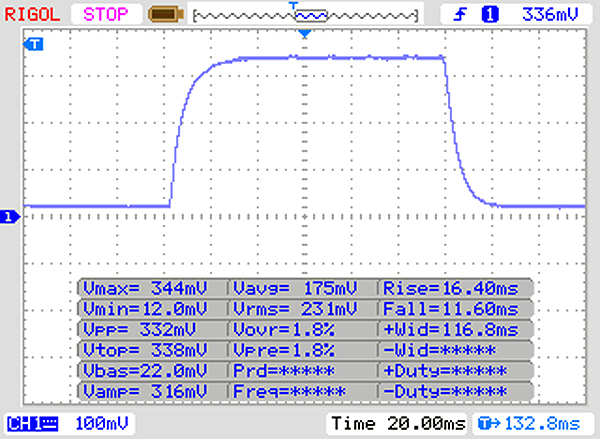 |
| ↘ 11 ms queda | ||
| A tela mostra taxas de resposta relativamente lentas em nossos testes e pode ser muito lenta para os jogadores. Em comparação, todos os dispositivos testados variam de 0.1 (mínimo) a 240 (máximo) ms. » 67 % de todos os dispositivos são melhores. Isso significa que o tempo de resposta medido é pior que a média de todos os dispositivos testados (19.8 ms). | ||
| ↔ Tempo de resposta 50% cinza a 80% cinza | ||
| 38 ms ... ascensão ↗ e queda ↘ combinadas | ↗ 19 ms ascensão | 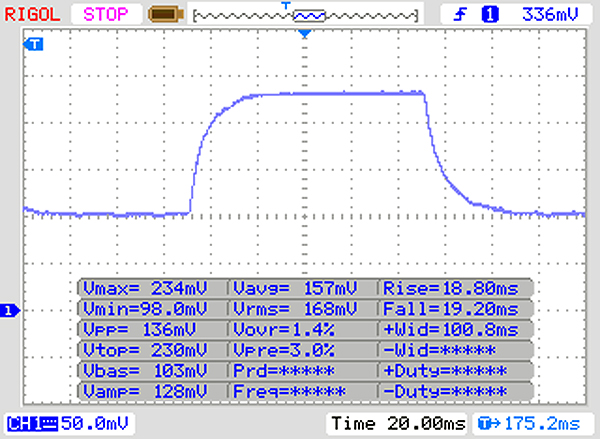 |
| ↘ 19 ms queda | ||
| A tela mostra taxas de resposta lentas em nossos testes e será insatisfatória para os jogadores. Em comparação, todos os dispositivos testados variam de 0.165 (mínimo) a 636 (máximo) ms. » 55 % de todos os dispositivos são melhores. Isso significa que o tempo de resposta medido é pior que a média de todos os dispositivos testados (31 ms). | ||
Cintilação da tela / PWM (modulação por largura de pulso)
| Tela tremeluzindo / PWM não detectado | 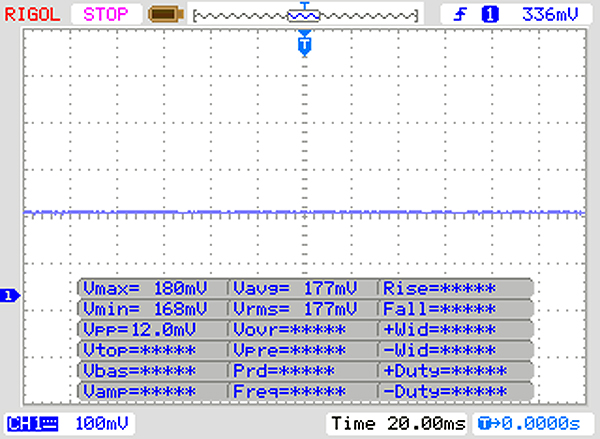 | ||
[pwm_comparison] Em comparação: 52 % de todos os dispositivos testados não usam PWM para escurecer a tela. Se PWM foi detectado, uma média de 7754 (mínimo: 5 - máximo: 343500) Hz foi medida. | |||
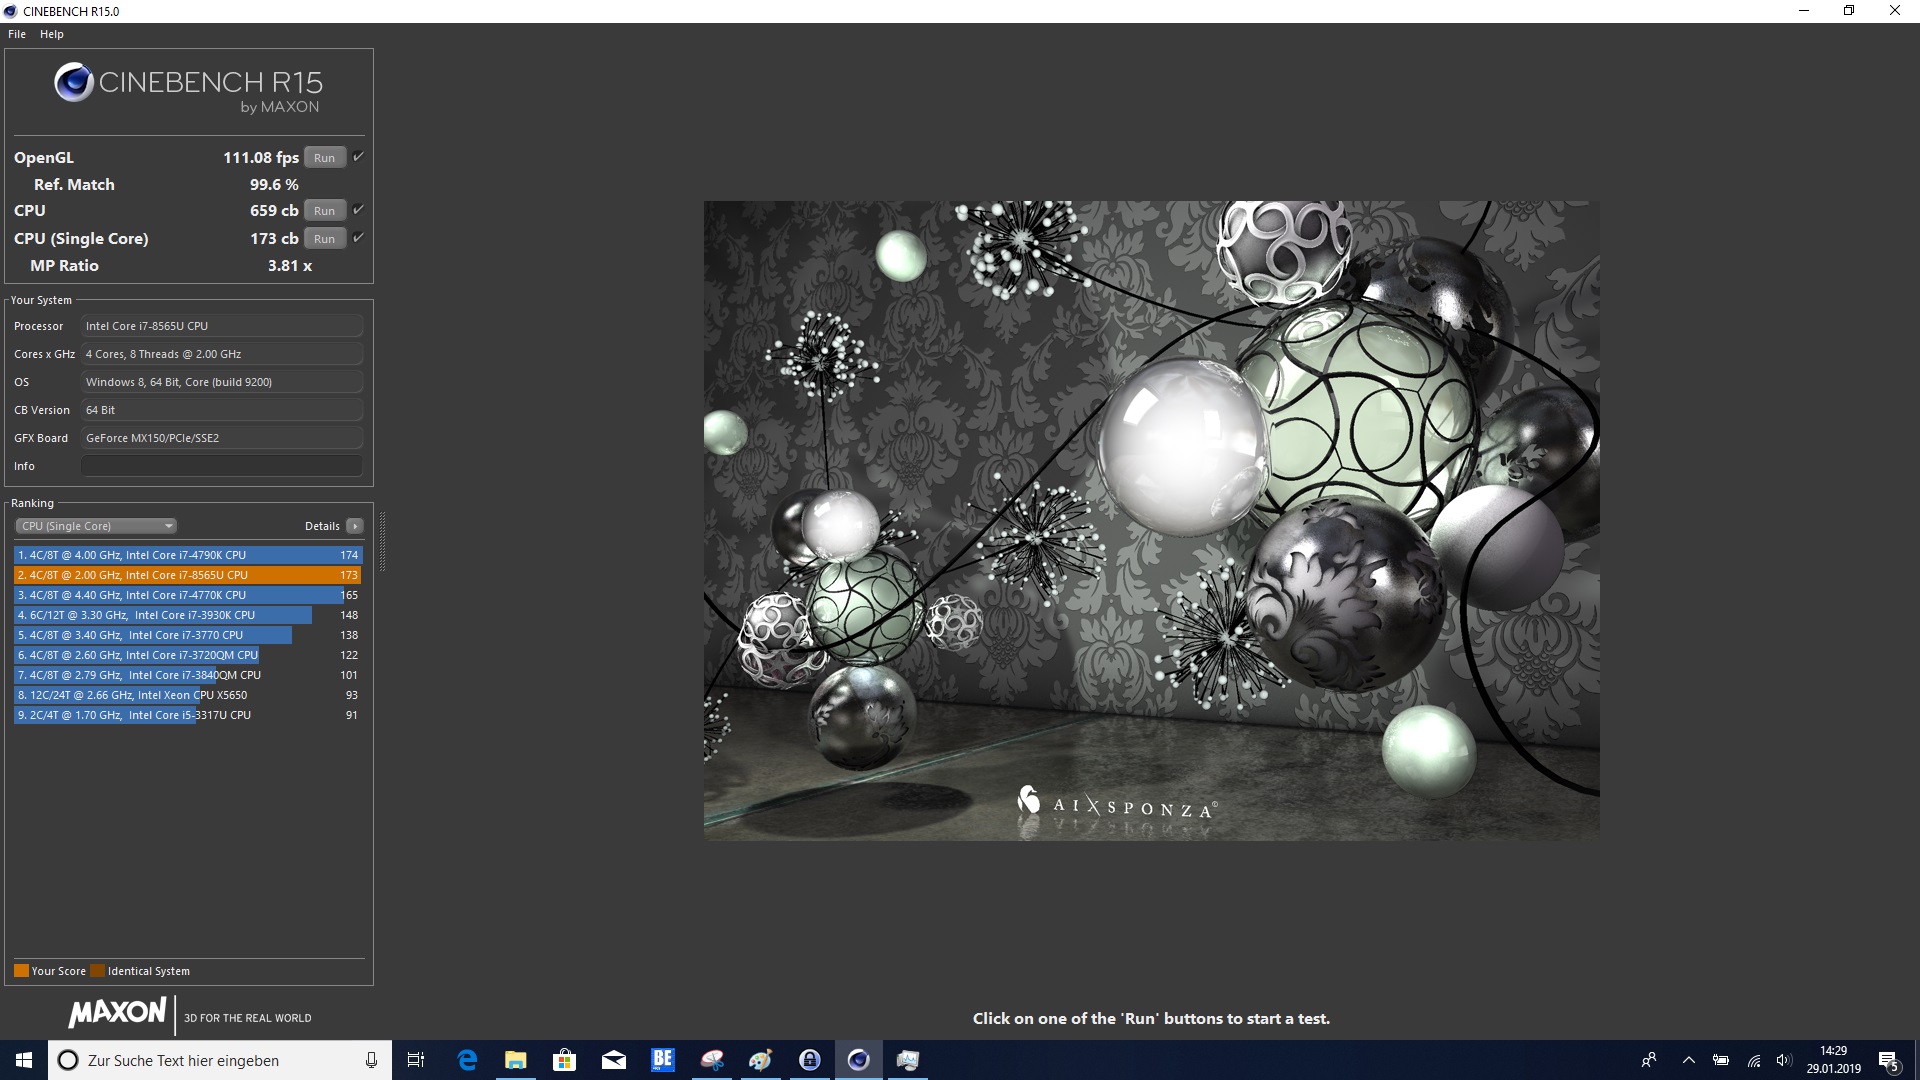
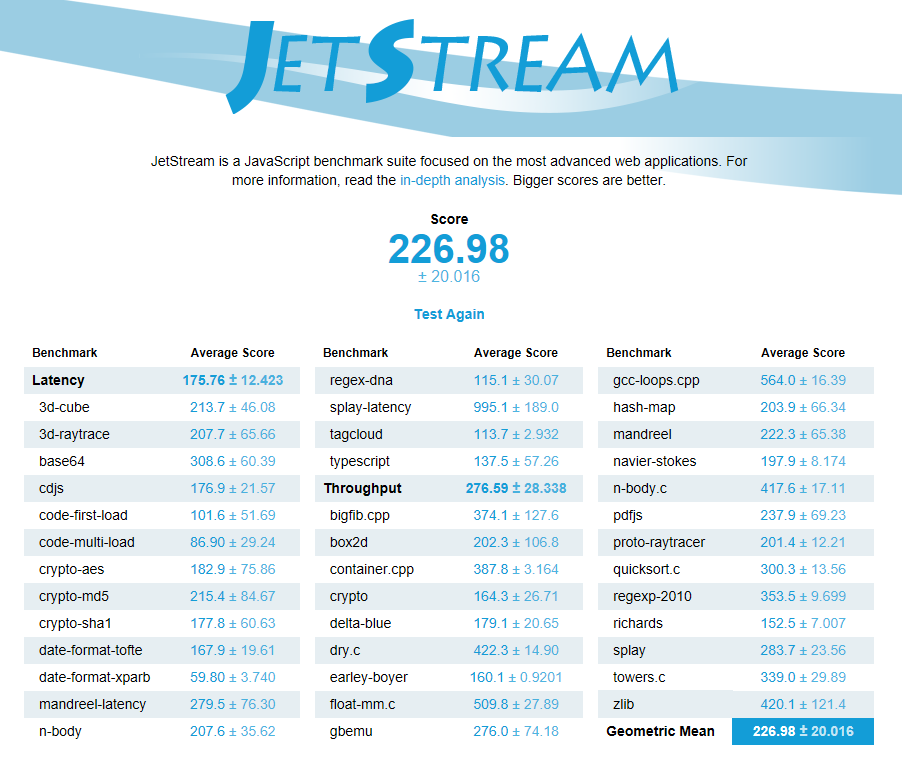
| JetStream 1.1 - 1.1 Total | |
| Média da turma Multimedia (n=1últimos 2 anos) | |
| Acer Aspire 5 A517-51G-80L | |
| Asus VivoBook Pro 17 N705UD-EH76 | |
| Dell Inspiron 17-7773-0043 | |
| Média Intel Core i7-8565U (107.6 - 277, n=37) | |
| Dell Inspiron 17-7786 | |
| HP Envy 17-ae143ng | |
| Blender - v2.79 BMW27 CPU | |
| Dell Inspiron 17-7786 | |
| Média Intel Core i7-8565U (687 - 1175, n=22) | |
| Média da turma Multimedia (100 - 557, n=58, últimos 2 anos) | |
| HWBOT x265 Benchmark v2.2 - 4k Preset | |
| Média da turma Multimedia (5.26 - 36.1, n=56, últimos 2 anos) | |
| Dell Inspiron 17-7786 | |
| Média Intel Core i7-8565U (3.24 - 5.5, n=22) | |
* ... menor é melhor
| PCMark 8 | |
| Home Score Accelerated v2 | |
| Média da turma Multimedia (n=1últimos 2 anos) | |
| Asus VivoBook Pro 17 N705UD-EH76 | |
| Dell Inspiron 17-7786 | |
| Acer Aspire 5 A517-51G-80L | |
| Dell Inspiron 17-7773-0043 | |
| Dell Inspiron 17 7778 | |
| Média Intel Core i7-8565U, NVIDIA GeForce MX150 (3141 - 4092, n=6) | |
| HP Envy 17-ae143ng | |
| Work Score Accelerated v2 | |
| Asus VivoBook Pro 17 N705UD-EH76 | |
| Dell Inspiron 17-7786 | |
| Acer Aspire 5 A517-51G-80L | |
| Dell Inspiron 17-7773-0043 | |
| Média Intel Core i7-8565U, NVIDIA GeForce MX150 (4240 - 5254, n=6) | |
| HP Envy 17-ae143ng | |
| Dell Inspiron 17 7778 | |
| PCMark 8 Home Score Accelerated v2 | 4092 pontos | |
| PCMark 8 Creative Score Accelerated v2 | 5840 pontos | |
| PCMark 8 Work Score Accelerated v2 | 5254 pontos | |
| PCMark 10 Score | 4175 pontos | |
Ajuda | ||
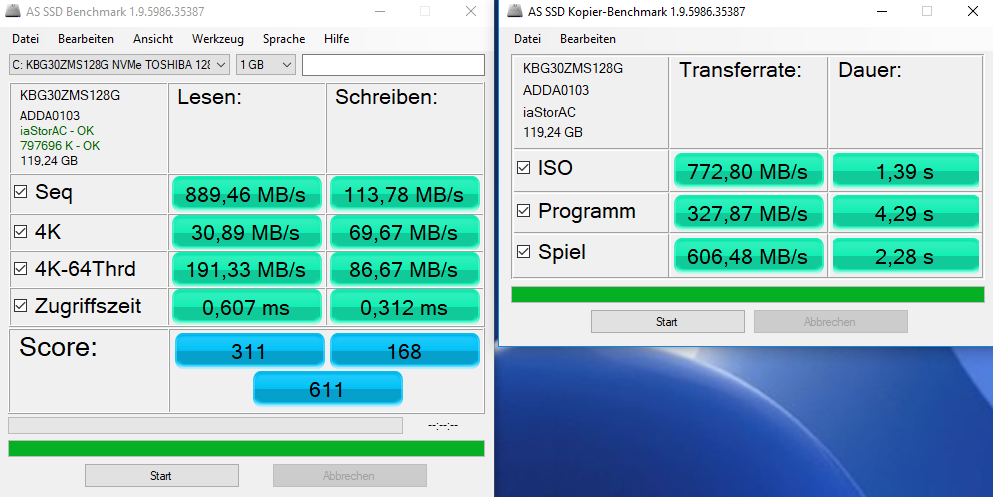
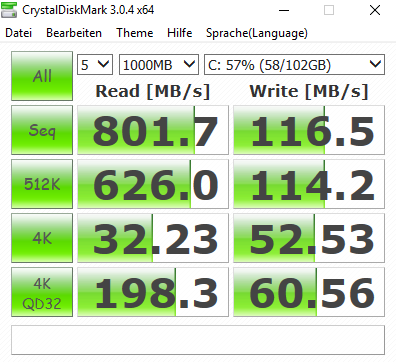
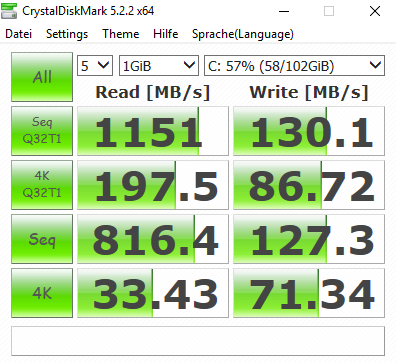
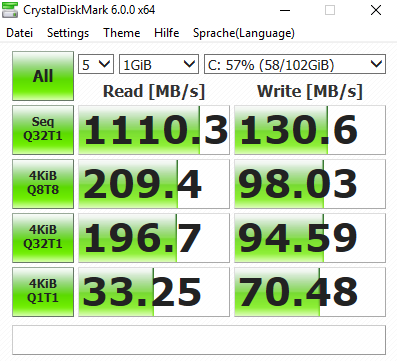
Benchmarks of the SSD
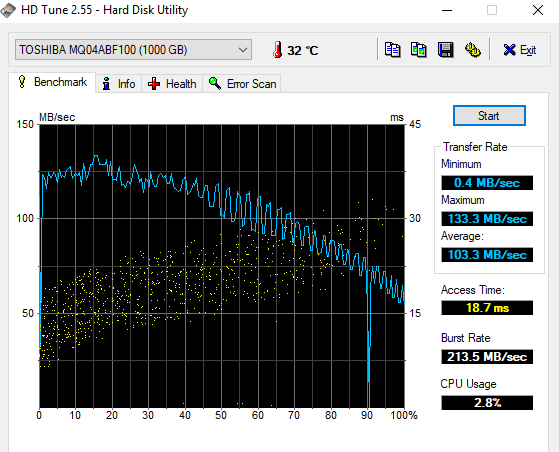
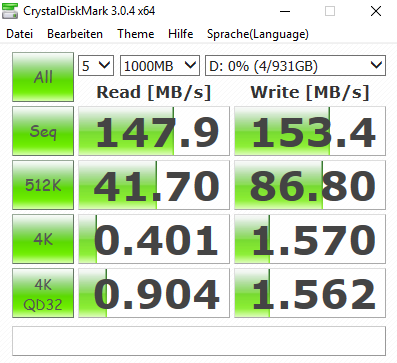
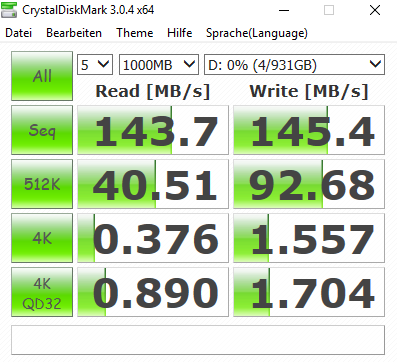
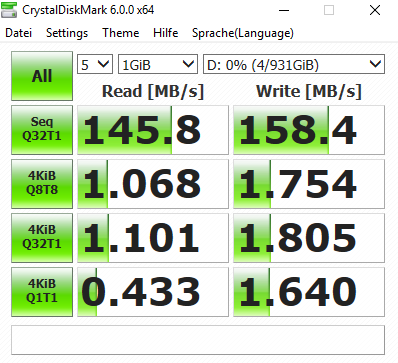
Benchmarks of the HDD
| Dell Inspiron 17-7786 KBG30ZMS128G | Dell Inspiron 17-7773-0043 SanDisk X400 M.2 2280 128GB | Dell Inspiron 17 7778 Liteonit CV3-CE512 | HP Envy 17-ae143ng Liteonit CV3-8D128 | Acer Aspire 5 A517-51G-80L Micron 1100 MTFDDAV256TBN | Asus VivoBook Pro 17 N705UD-EH76 Samsung PM961 NVMe MZVLW512HMJP | |
|---|---|---|---|---|---|---|
| CrystalDiskMark 5.2 / 6 | 52% | 78% | 61% | 344% | ||
| Write 4K (MB/s) | 71.3 | 56.4 -21% | 66.2 -7% | 84.2 18% | 151.3 112% | |
| Read 4K (MB/s) | 33.43 | 28.72 -14% | 33.83 1% | 28.39 -15% | 46.62 39% | |
| Write Seq (MB/s) | 127.3 | 356.3 180% | 449.4 253% | 398.2 213% | 1020 701% | |
| Read Seq (MB/s) | 816 | 490.3 -40% | 468.6 -43% | 472.1 -42% | 935 15% | |
| Write 4K Q32T1 (MB/s) | 94.6 | 276.7 192% | 209.6 122% | 181.6 92% | 452.3 378% | |
| Read 4K Q32T1 (MB/s) | 196.7 | 279.7 42% | 290.8 48% | 247.7 26% | 559 184% | |
| Write Seq Q32T1 (MB/s) | 130.6 | 298.5 129% | 525 302% | 454.3 248% | 1614 1136% | |
| Read Seq Q32T1 (MB/s) | 1110 | 522 -53% | 508 -54% | 533 -52% | 3220 190% | |
| Write 4K Q8T8 (MB/s) | 98 | |||||
| Read 4K Q8T8 (MB/s) | 209.4 | |||||
| AS SSD | 18% | 69% | 23% | 41% | 328% | |
| Seq Read (MB/s) | 889 | 482.2 -46% | 489.8 -45% | 488.5 -45% | 494.2 -44% | 2339 163% |
| Seq Write (MB/s) | 113.8 | 330 190% | 445.8 292% | 476.7 319% | 404.2 255% | 1409 1138% |
| 4K Read (MB/s) | 30.89 | 27.84 -10% | 24.93 -19% | 29.7 -4% | 25.78 -17% | 49.78 61% |
| 4K Write (MB/s) | 69.7 | 54.4 -22% | 55.6 -20% | 54.1 -22% | 71.4 2% | 122.1 75% |
| 4K-64 Read (MB/s) | 191.3 | 355 86% | 282 47% | 258.7 35% | 234.6 23% | 1329 595% |
| 4K-64 Write (MB/s) | 86.7 | 98 13% | 247.1 185% | 116.9 35% | 259.1 199% | 828 855% |
| Access Time Read * (ms) | 0.607 | 0.218 64% | 0.106 83% | 0.161 73% | 0.081 87% | 0.056 91% |
| Access Time Write * (ms) | 0.312 | 0.081 74% | 0.081 74% | 0.069 78% | 0.057 82% | 0.03 90% |
| Score Read (Points) | 311 | 431 39% | 356 14% | 337 8% | 310 0% | 1612 418% |
| Score Write (Points) | 168 | 185 10% | 347 107% | 219 30% | 371 121% | 1091 549% |
| Score Total (Points) | 611 | 838 37% | 891 46% | 739 21% | 844 38% | 3488 471% |
| Copy ISO MB/s (MB/s) | 773 | 410.1 -47% | 255.9 -67% | 300.4 -61% | 1733 124% | |
| Copy Program MB/s (MB/s) | 327.9 | 127.6 -61% | 109.2 -67% | 157.4 -52% | 305.8 -7% | |
| Copy Game MB/s (MB/s) | 606 | 165.5 -73% | 129 -79% | 221.7 -63% | 405.5 -33% | |
| Média Total (Programa/Configurações) | 35% /
30% | 69% /
69% | 51% /
43% | 51% /
48% | 336% /
334% |
* ... menor é melhor

| 3DMark 11 - 1280x720 Performance GPU | |
| Média da turma Multimedia (3749 - 60002, n=55, últimos 2 anos) | |
| Asus VivoBook Pro 17 N705UD-EH76 | |
| Dell Inspiron 17-7786 | |
| HP Envy 17-ae143ng | |
| Acer Aspire 5 A517-51G-80L | |
| Dell Inspiron 17-7773-0043 | |
| Média NVIDIA GeForce MX150 (2796 - 4905, n=47) | |
| Dell Inspiron 17 7778 | |
| 3DMark | |
| 1280x720 Cloud Gate Standard Graphics | |
| Média da turma Multimedia (16765 - 143501, n=32, últimos 2 anos) | |
| Asus VivoBook Pro 17 N705UD-EH76 | |
| Dell Inspiron 17-7786 | |
| HP Envy 17-ae143ng | |
| Dell Inspiron 17-7773-0043 | |
| Média NVIDIA GeForce MX150 (16227 - 22183, n=43) | |
| Acer Aspire 5 A517-51G-80L | |
| Dell Inspiron 17 7778 | |
| 1920x1080 Fire Strike Graphics | |
| Média da turma Multimedia (2328 - 48907, n=58, últimos 2 anos) | |
| Asus VivoBook Pro 17 N705UD-EH76 | |
| HP Envy 17-ae143ng | |
| Dell Inspiron 17-7786 | |
| Acer Aspire 5 A517-51G-80L | |
| Dell Inspiron 17-7773-0043 | |
| Média NVIDIA GeForce MX150 (2323 - 3739, n=44) | |
| Dell Inspiron 17 7778 | |
| 2560x1440 Time Spy Graphics | |
| Média da turma Multimedia (696 - 19403, n=59, últimos 2 anos) | |
| HP Envy 17-ae143ng | |
| Dell Inspiron 17-7786 | |
| Média NVIDIA GeForce MX150 (830 - 1147, n=16) | |
| 3DMark 06 Standard Score | 22583 pontos | |
| 3DMark 11 Performance | 4866 pontos | |
| 3DMark Ice Storm Standard Score | 65934 pontos | |
| 3DMark Cloud Gate Standard Score | 15737 pontos | |
| 3DMark Fire Strike Score | 3253 pontos | |
| 3DMark Fire Strike Extreme Score | 1646 pontos | |
| 3DMark Time Spy Score | 1141 pontos | |
Ajuda | ||
| baixo | média | alto | ultra | |
|---|---|---|---|---|
| BioShock Infinite (2013) | 179.4 | 109.6 | 92.9 | 34.6 |
| Dota 2 Reborn (2015) | 98.4 | 82.9 | 67.1 | 61.3 |
| Rise of the Tomb Raider (2016) | 58.9 | 41.9 | 23 | 19 |
| X-Plane 11.11 (2018) | 47.97 | 40.93 | 36.74 |
Barulho
| Ocioso |
| 30.7 / 30.7 / 30.7 dB |
| HDD |
| 31.1 dB |
| Carga |
| 33.4 / 38.7 dB |
 | ||
30 dB silencioso 40 dB(A) audível 50 dB(A) ruidosamente alto |
||
min: | ||
| Dell Inspiron 17-7786 GeForce MX150, i7-8565U, KBG30ZMS128G | Dell Inspiron 17-7773-0043 GeForce MX150, i5-8550U, SanDisk X400 M.2 2280 128GB | Dell Inspiron 17 7778 GeForce 940MX, 6500U, Liteonit CV3-CE512 | HP Envy 17-ae143ng GeForce MX150, i5-8250U, Liteonit CV3-8D128 | Acer Aspire 5 A517-51G-80L GeForce MX150, i5-8550U, Micron 1100 MTFDDAV256TBN | Asus VivoBook Pro 17 N705UD-EH76 GeForce GTX 1050 Mobile, i5-8550U, Samsung PM961 NVMe MZVLW512HMJP | |
|---|---|---|---|---|---|---|
| Noise | -5% | -10% | -156% | 3% | 1% | |
| desligado / ambiente * (dB) | 30.3 | 30.3 -0% | 32.1 -6% | 304 -903% | 29.4 3% | 28.3 7% |
| Idle Minimum * (dB) | 30.7 | 30.6 -0% | 32.1 -5% | 31.9 -4% | 30.1 2% | 28.3 8% |
| Idle Average * (dB) | 30.7 | 30.6 -0% | 32.1 -5% | 31.9 -4% | 30.1 2% | 29 6% |
| Idle Maximum * (dB) | 30.7 | 32.2 -5% | 34 -11% | 31.9 -4% | 29.7 3% | 29 6% |
| Load Average * (dB) | 33.4 | 40.5 -21% | 40.3 -21% | 39.4 -18% | 34.4 -3% | 36.7 -10% |
| Load Maximum * (dB) | 38.7 | 39.5 -2% | 42.6 -10% | 39.7 -3% | 34.4 11% | 42.8 -11% |
| Witcher 3 ultra * (dB) | 44.7 |
* ... menor é melhor
(±) A temperatura máxima no lado superior é 42.1 °C / 108 F, em comparação com a média de 36.8 °C / 98 F , variando de 21 a 71 °C para a classe Multimedia.
(±) A parte inferior aquece até um máximo de 43 °C / 109 F, em comparação com a média de 39.1 °C / 102 F
(+) Em uso inativo, a temperatura média para o lado superior é 23.1 °C / 74 F, em comparação com a média do dispositivo de 31.3 °C / ### class_avg_f### F.
(+) Os apoios para as mãos e o touchpad são mais frios que a temperatura da pele, com um máximo de 29.4 °C / 84.9 F e, portanto, são frios ao toque.
(±) A temperatura média da área do apoio para as mãos de dispositivos semelhantes foi 28.7 °C / 83.7 F (-0.7 °C / -1.2 F).
| Dell Inspiron 17-7786 GeForce MX150, i7-8565U, KBG30ZMS128G | Dell Inspiron 17-7773-0043 GeForce MX150, i5-8550U, SanDisk X400 M.2 2280 128GB | Dell Inspiron 17 7778 GeForce 940MX, 6500U, Liteonit CV3-CE512 | HP Envy 17-ae143ng GeForce MX150, i5-8250U, Liteonit CV3-8D128 | Acer Aspire 5 A517-51G-80L GeForce MX150, i5-8550U, Micron 1100 MTFDDAV256TBN | Asus VivoBook Pro 17 N705UD-EH76 GeForce GTX 1050 Mobile, i5-8550U, Samsung PM961 NVMe MZVLW512HMJP | |
|---|---|---|---|---|---|---|
| Heat | -13% | -18% | 1% | 3% | -29% | |
| Maximum Upper Side * (°C) | 42.1 | 42.7 -1% | 44.7 -6% | 36 14% | 40.4 4% | 46 -9% |
| Maximum Bottom * (°C) | 43 | 47.2 -10% | 45.5 -6% | 37.6 13% | 37 14% | 56.2 -31% |
| Idle Upper Side * (°C) | 24 | 28.4 -18% | 31 -29% | 26.2 -9% | 25.3 -5% | 28.6 -19% |
| Idle Bottom * (°C) | 24.2 | 29.7 -23% | 31.4 -30% | 27.8 -15% | 24.7 -2% | 37.6 -55% |
* ... menor é melhor
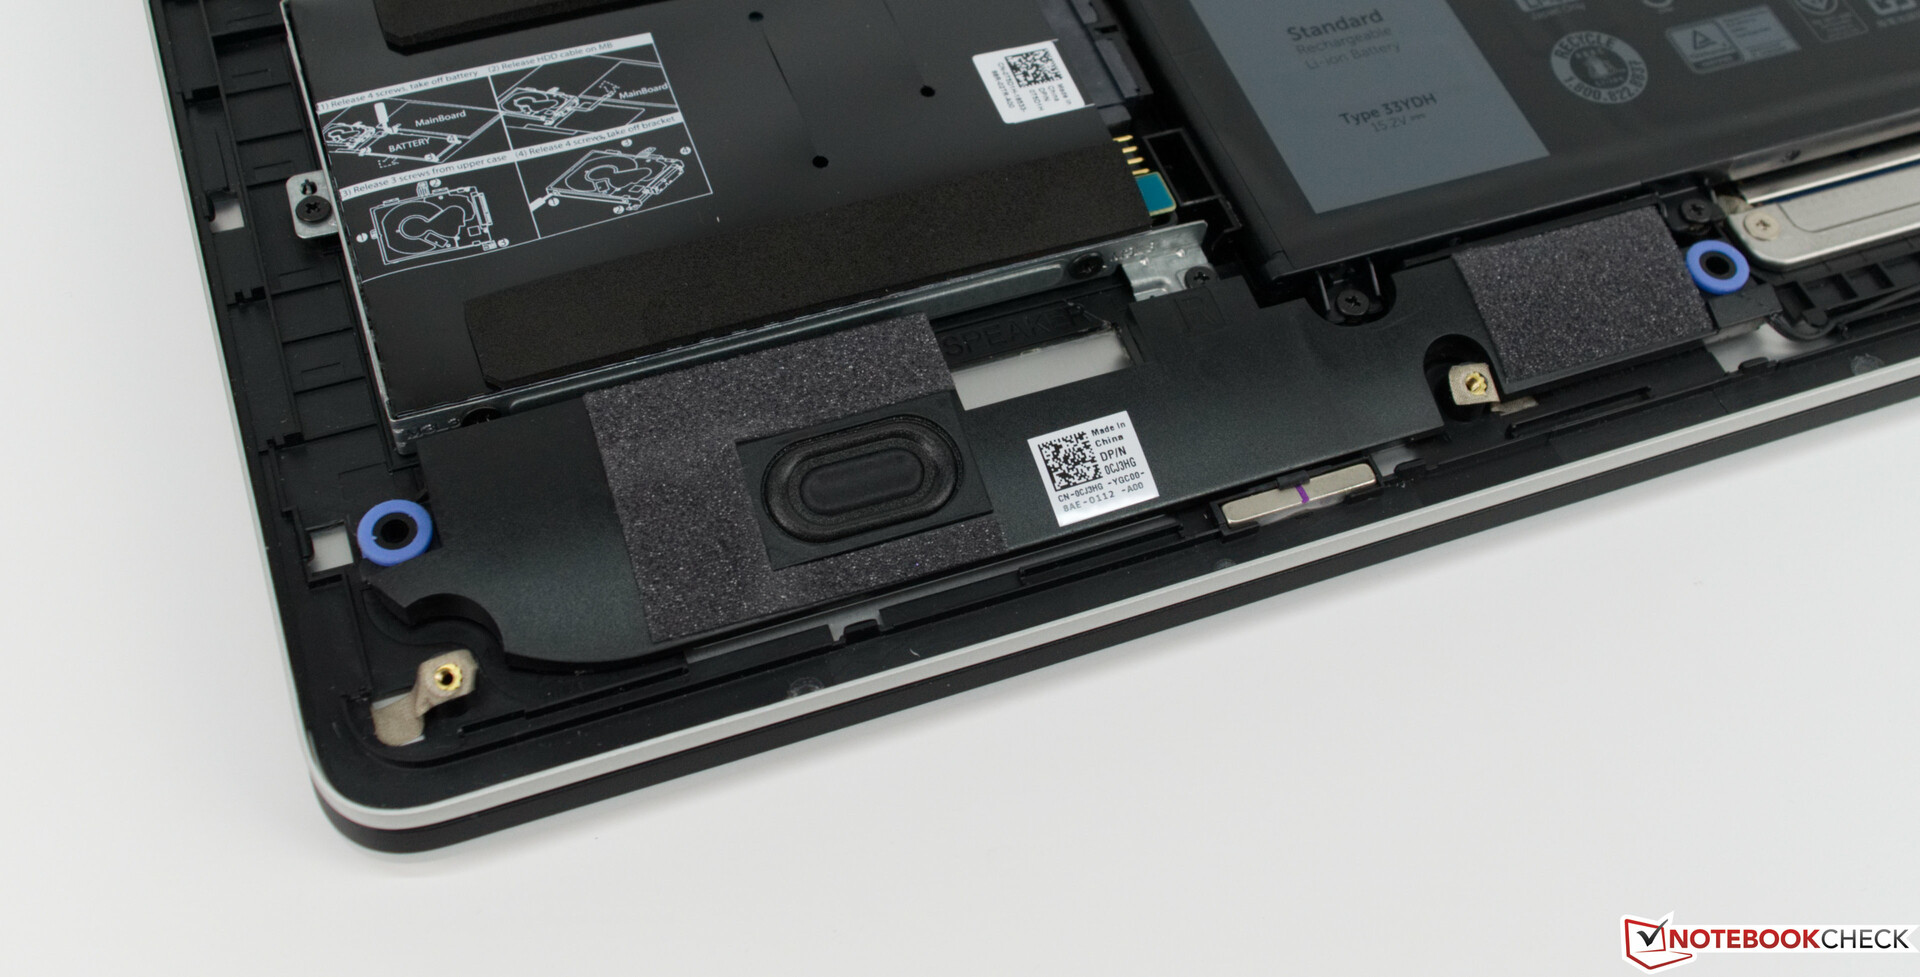
Dell Inspiron 17-7786 análise de áudio
(-) | alto-falantes não muito altos (###valor### dB)
Graves 100 - 315Hz
(-) | quase nenhum baixo - em média 15.5% menor que a mediana
(+) | o baixo é linear (6.4% delta para a frequência anterior)
Médios 400 - 2.000 Hz
(+) | médios equilibrados - apenas 2.9% longe da mediana
(+) | médios são lineares (3.7% delta para frequência anterior)
Altos 2 - 16 kHz
(+) | agudos equilibrados - apenas 3.4% longe da mediana
(+) | os máximos são lineares (4.1% delta da frequência anterior)
Geral 100 - 16.000 Hz
(±) | a linearidade do som geral é média (16.6% diferença em relação à mediana)
Comparado com a mesma classe
» 44% de todos os dispositivos testados nesta classe foram melhores, 7% semelhantes, 50% piores
» O melhor teve um delta de 5%, a média foi 17%, o pior foi 45%
Comparado com todos os dispositivos testados
» 29% de todos os dispositivos testados foram melhores, 6% semelhantes, 65% piores
» O melhor teve um delta de 4%, a média foi 23%, o pior foi 134%
Asus VivoBook Pro 17 N705UD-EH76 análise de áudio
(±) | o volume do alto-falante é médio, mas bom (###valor### dB)
Graves 100 - 315Hz
(±) | graves reduzidos - em média 8.8% menor que a mediana
(±) | a linearidade dos graves é média (14.1% delta para a frequência anterior)
Médios 400 - 2.000 Hz
(+) | médios equilibrados - apenas 1.8% longe da mediana
(+) | médios são lineares (4.1% delta para frequência anterior)
Altos 2 - 16 kHz
(+) | agudos equilibrados - apenas 1.6% longe da mediana
(+) | os máximos são lineares (3% delta da frequência anterior)
Geral 100 - 16.000 Hz
(+) | o som geral é linear (11.7% diferença em relação à mediana)
Comparado com a mesma classe
» 19% de todos os dispositivos testados nesta classe foram melhores, 3% semelhantes, 78% piores
» O melhor teve um delta de 5%, a média foi 17%, o pior foi 45%
Comparado com todos os dispositivos testados
» 8% de todos os dispositivos testados foram melhores, 3% semelhantes, 89% piores
» O melhor teve um delta de 4%, a média foi 23%, o pior foi 134%
| desligado | |
| Ocioso | |
| Carga |
|
Key:
min: | |
| Dell Inspiron 17-7786 i7-8565U, GeForce MX150, KBG30ZMS128G, IPS, 1920x1080, 17.3" | Dell Inspiron 17-7773-0043 i5-8550U, GeForce MX150, SanDisk X400 M.2 2280 128GB, IPS, 1920x1080, 17.3" | Dell Inspiron 17 7778 6500U, GeForce 940MX, Liteonit CV3-CE512, IPS, 1920x1080, 17.3" | HP Envy 17-ae143ng i5-8250U, GeForce MX150, Liteonit CV3-8D128, IPS, 1920x1080, 17.3" | Acer Aspire 5 A517-51G-80L i5-8550U, GeForce MX150, Micron 1100 MTFDDAV256TBN, aSi TFT, IPS, 1920x1080, 17.3" | Asus VivoBook Pro 17 N705UD-EH76 i5-8550U, GeForce GTX 1050 Mobile, Samsung PM961 NVMe MZVLW512HMJP, IPS, 1920x1080, 17.3" | Média NVIDIA GeForce MX150 | Média da turma Multimedia | |
|---|---|---|---|---|---|---|---|---|
| Power Consumption | -11% | -2% | -5% | 2% | -24% | 7% | -27% | |
| Idle Minimum * (Watt) | 4.2 | 5.5 -31% | 5.6 -33% | 4.8 -14% | 4.1 2% | 5.06 -20% | 4.48 ? -7% | 5.66 ? -35% |
| Idle Average * (Watt) | 9.4 | 11.6 -23% | 11.2 -19% | 8.3 12% | 9.3 1% | 10.3 -10% | 7.88 ? 16% | 10.2 ? -9% |
| Idle Maximum * (Watt) | 12.9 | 12.4 4% | 11.9 8% | 10.3 20% | 9.8 24% | 10.7 17% | 9.76 ? 24% | 12.5 ? 3% |
| Load Average * (Watt) | 56 | 65 -16% | 46 18% | 61 -9% | 64 -14% | 83 -48% | 54.7 ? 2% | 65.2 ? -16% |
| Load Maximum * (Watt) | 63.4 | 56 12% | 53 16% | 86 -36% | 66.4 -5% | 99.9 -58% | 63.5 ? -0% | 113.5 ? -79% |
| Witcher 3 ultra * (Watt) | 92.4 |
* ... menor é melhor
| Dell Inspiron 17-7786 i7-8565U, GeForce MX150, 56 Wh | Dell Inspiron 17-7773-0043 i5-8550U, GeForce MX150, 56 Wh | Dell Inspiron 17 7778 6500U, GeForce 940MX, 56 Wh | HP Envy 17-ae143ng i5-8250U, GeForce MX150, 55.8 Wh | Acer Aspire 5 A517-51G-80L i5-8550U, GeForce MX150, 48 Wh | Asus VivoBook Pro 17 N705UD-EH76 i5-8550U, GeForce GTX 1050 Mobile, 42 Wh | Média da turma Multimedia | |
|---|---|---|---|---|---|---|---|
| Duração da bateria | -19% | -18% | -10% | -36% | -58% | 44% | |
| Reader / Idle (h) | 16.6 | 14.7 -11% | 13.5 -19% | 9.3 -44% | 24.9 ? 50% | ||
| H.264 (h) | 7.7 | 6.2 -19% | 5.4 -30% | 17.1 ? 122% | |||
| WiFi v1.3 (h) | 9 | 6.8 -24% | 8.3 -8% | 8.1 -10% | 6.3 -30% | 4.4 -51% | 12.2 ? 36% |
| Load (h) | 2.5 | 2 -20% | 1.8 -28% | 1.5 -40% | 0.9 -64% | 1.664 ? -33% |
Pro
Contra
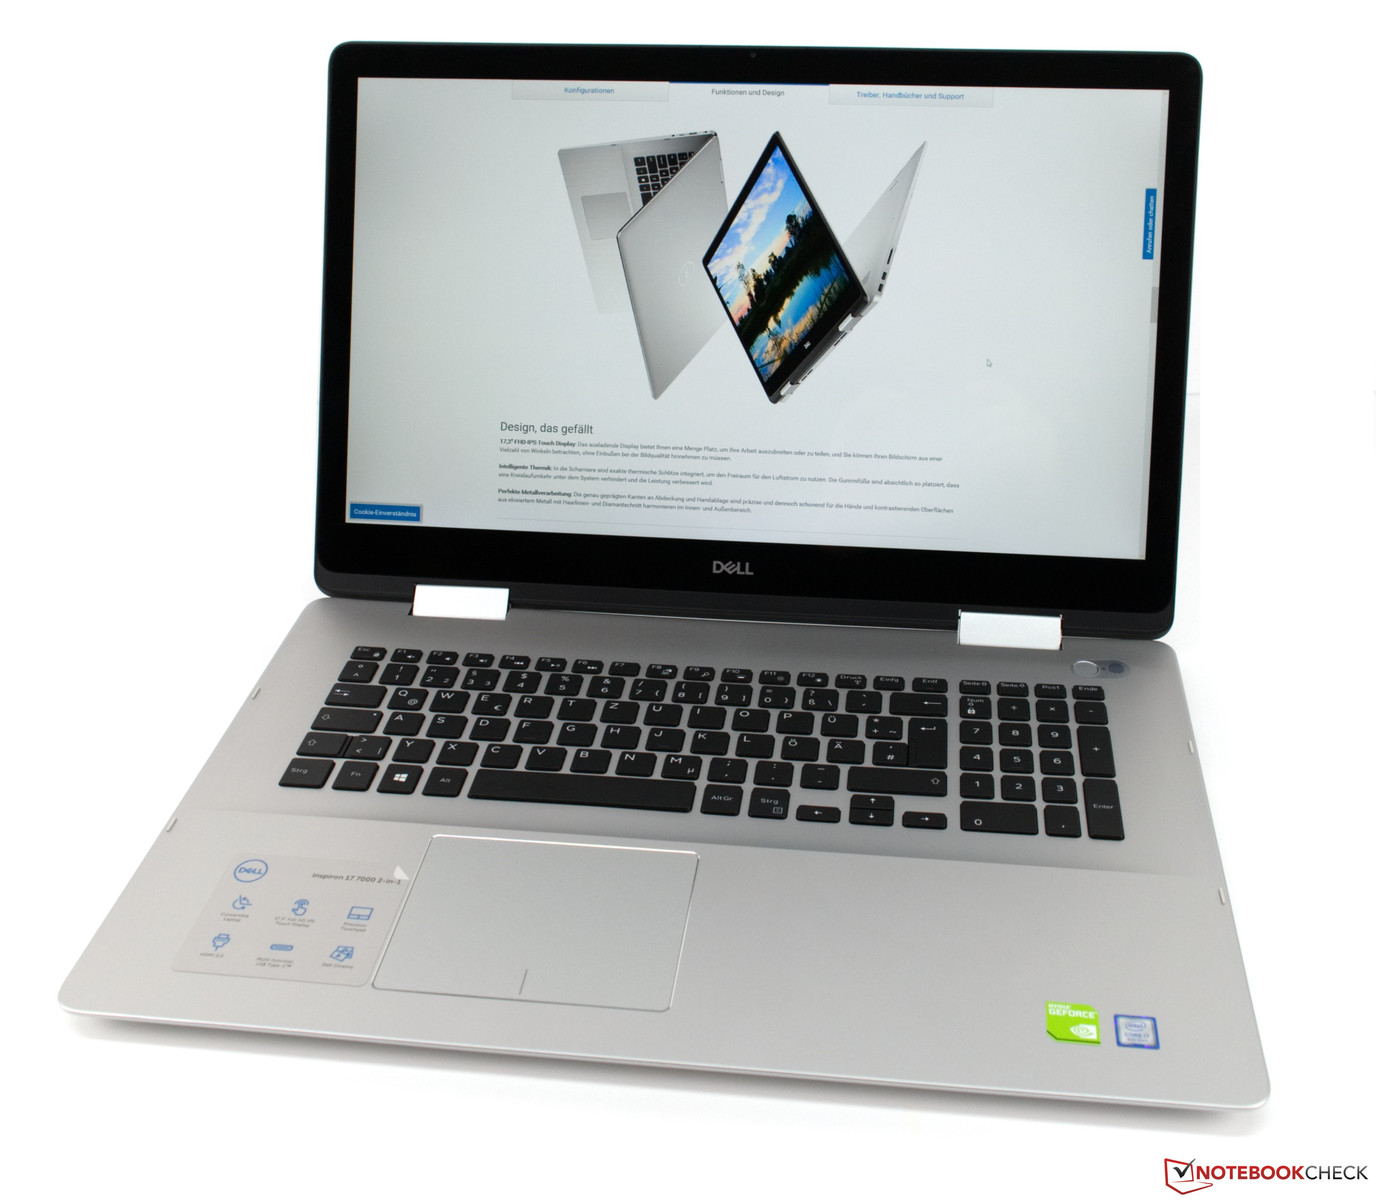
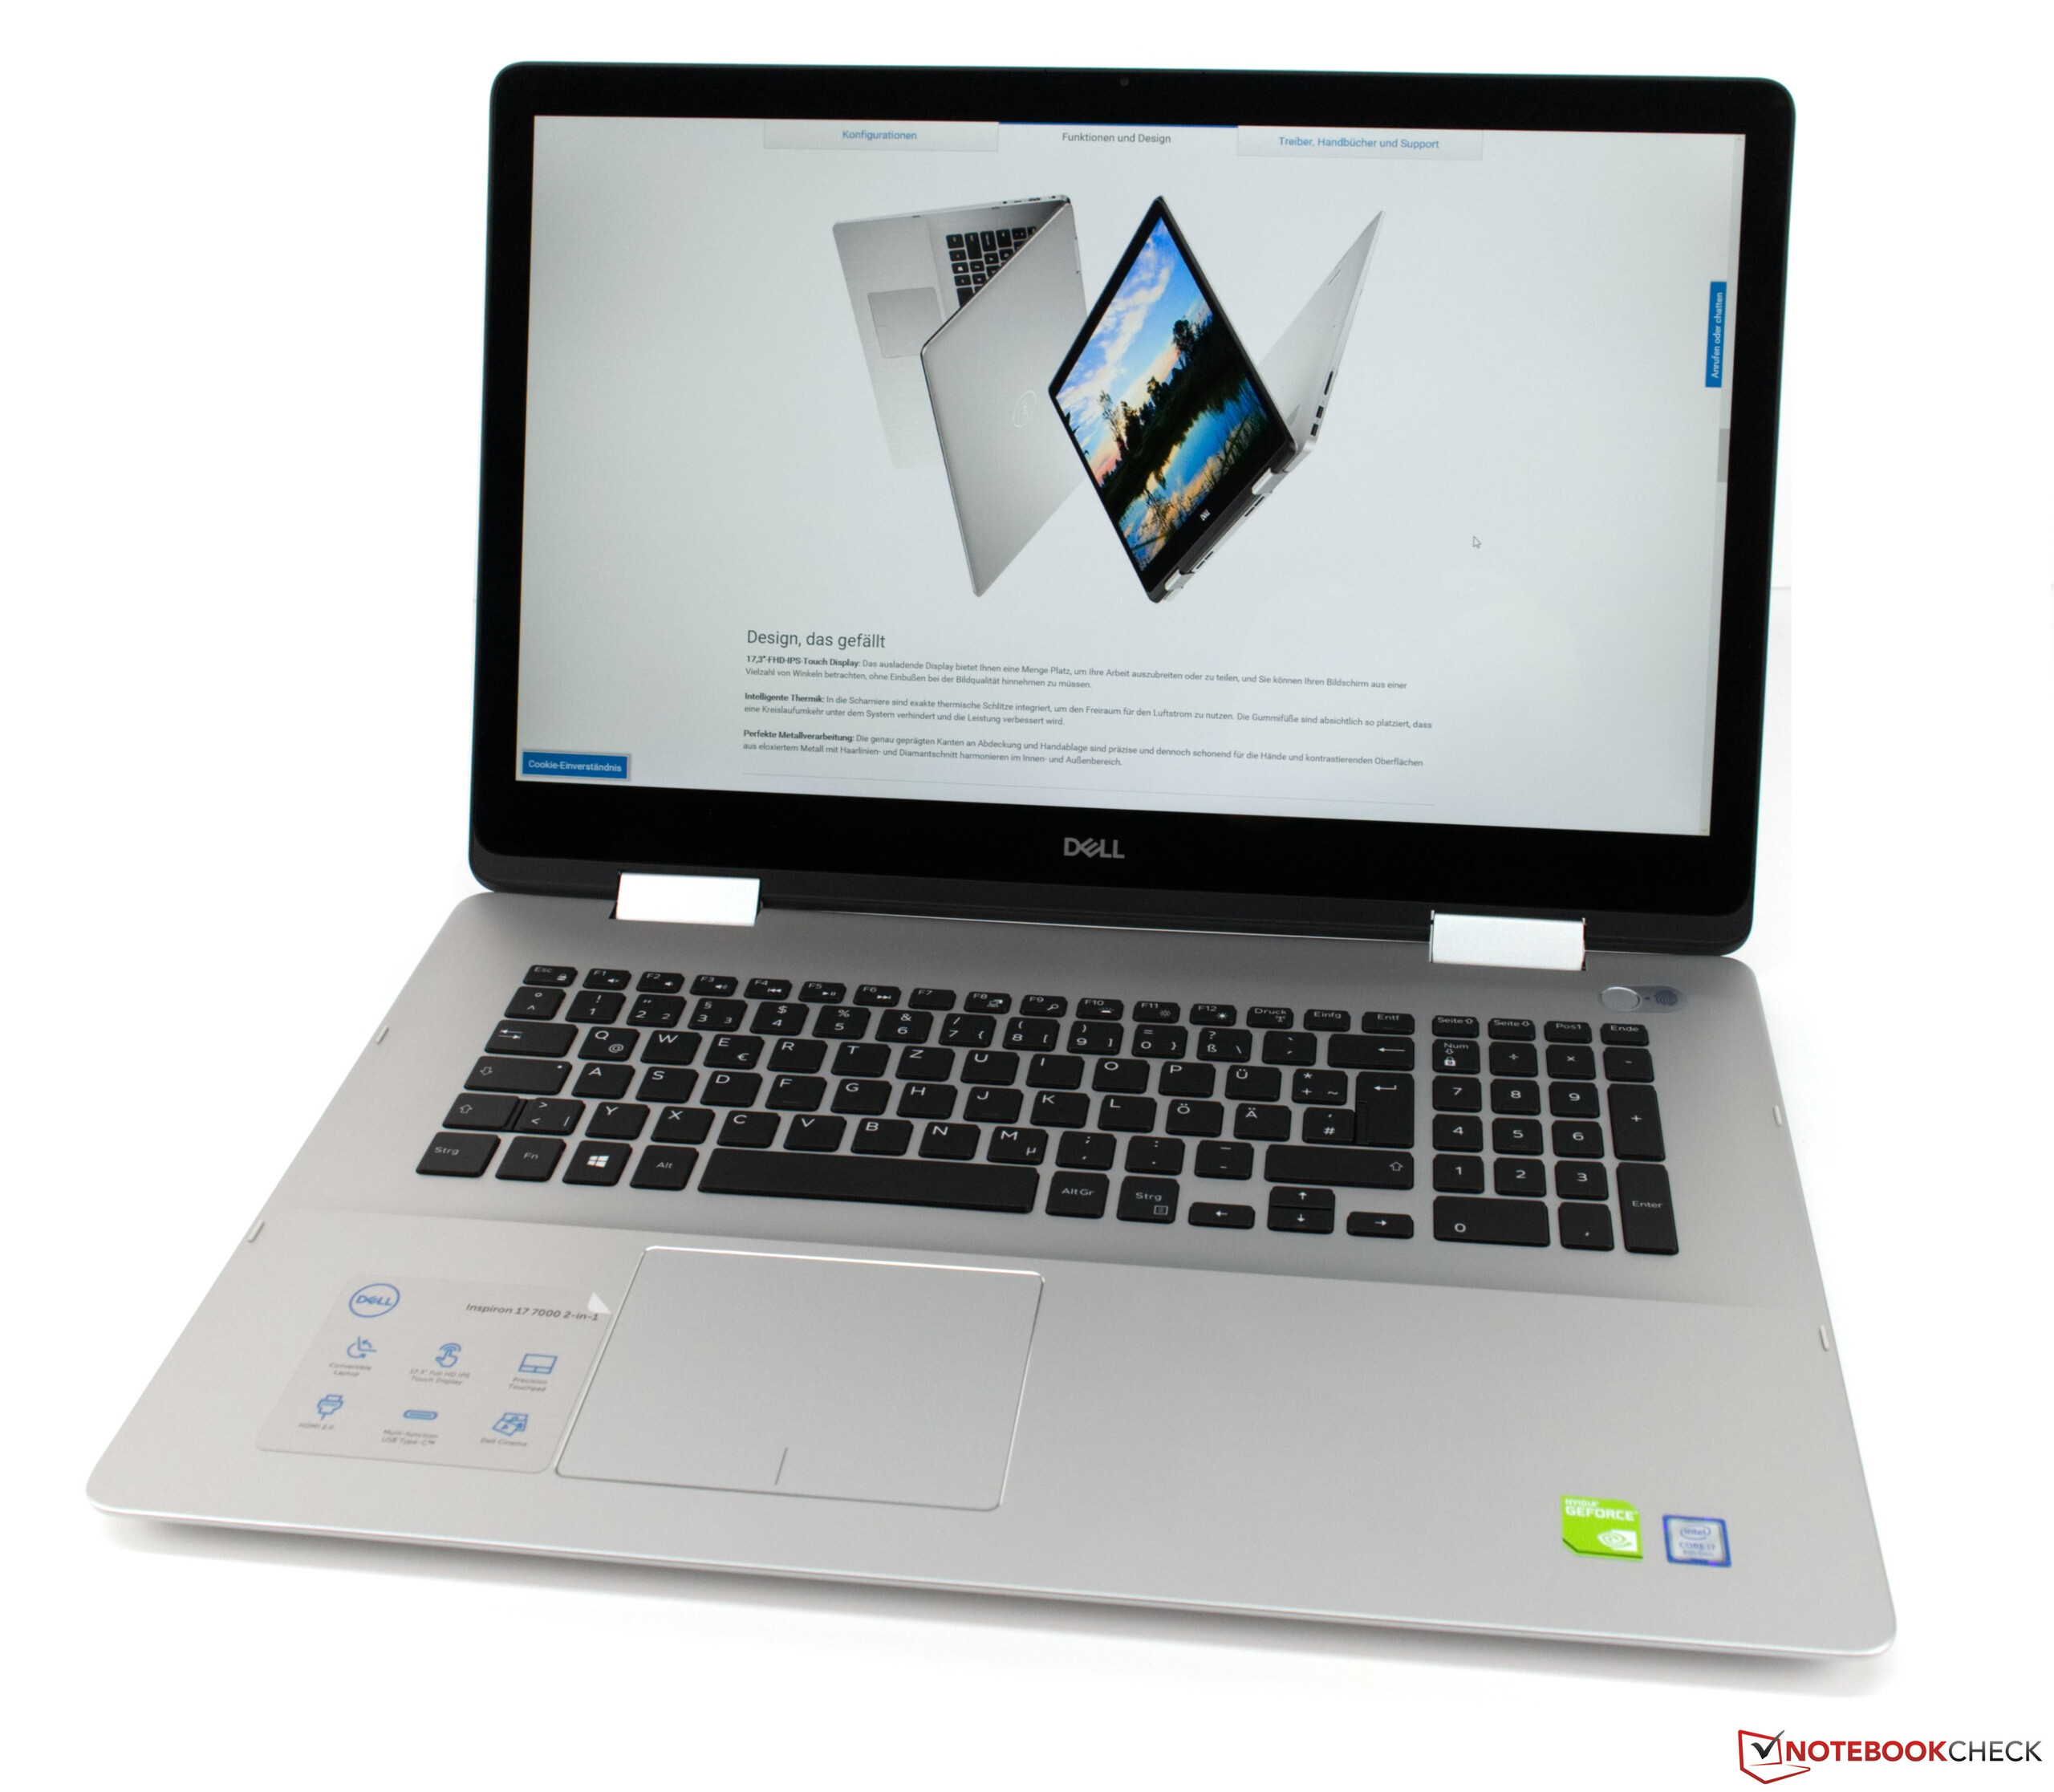
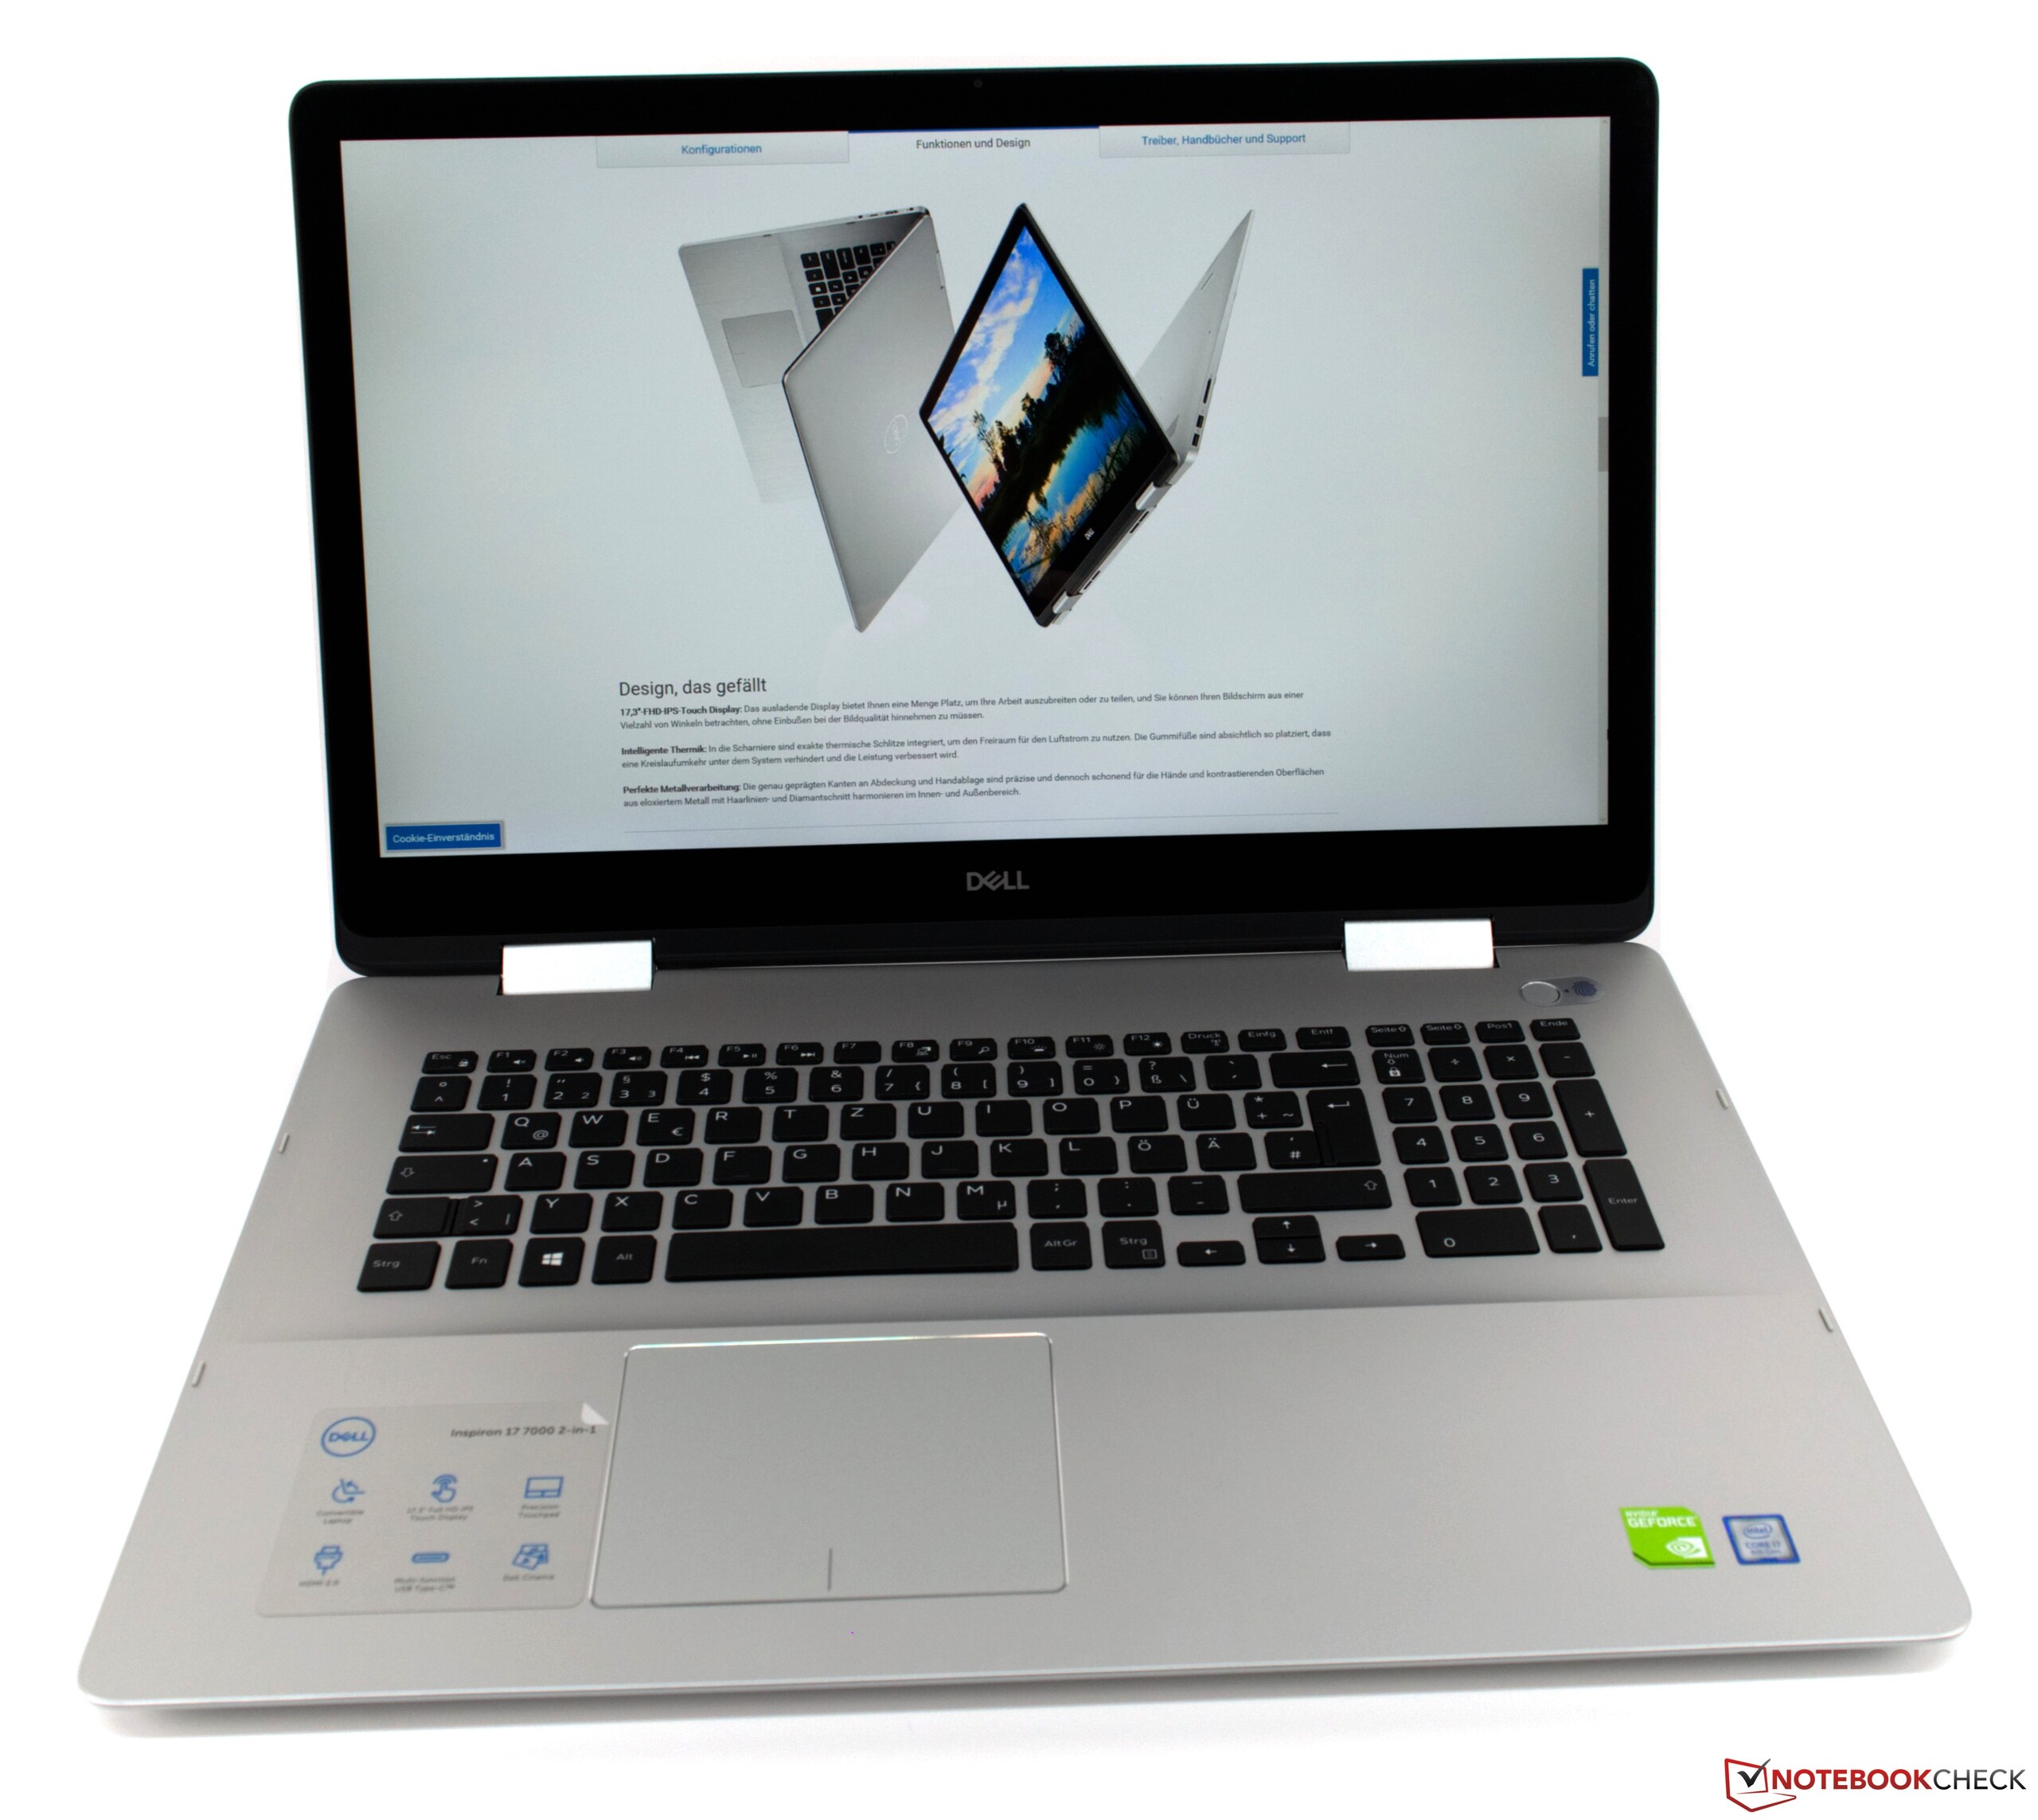
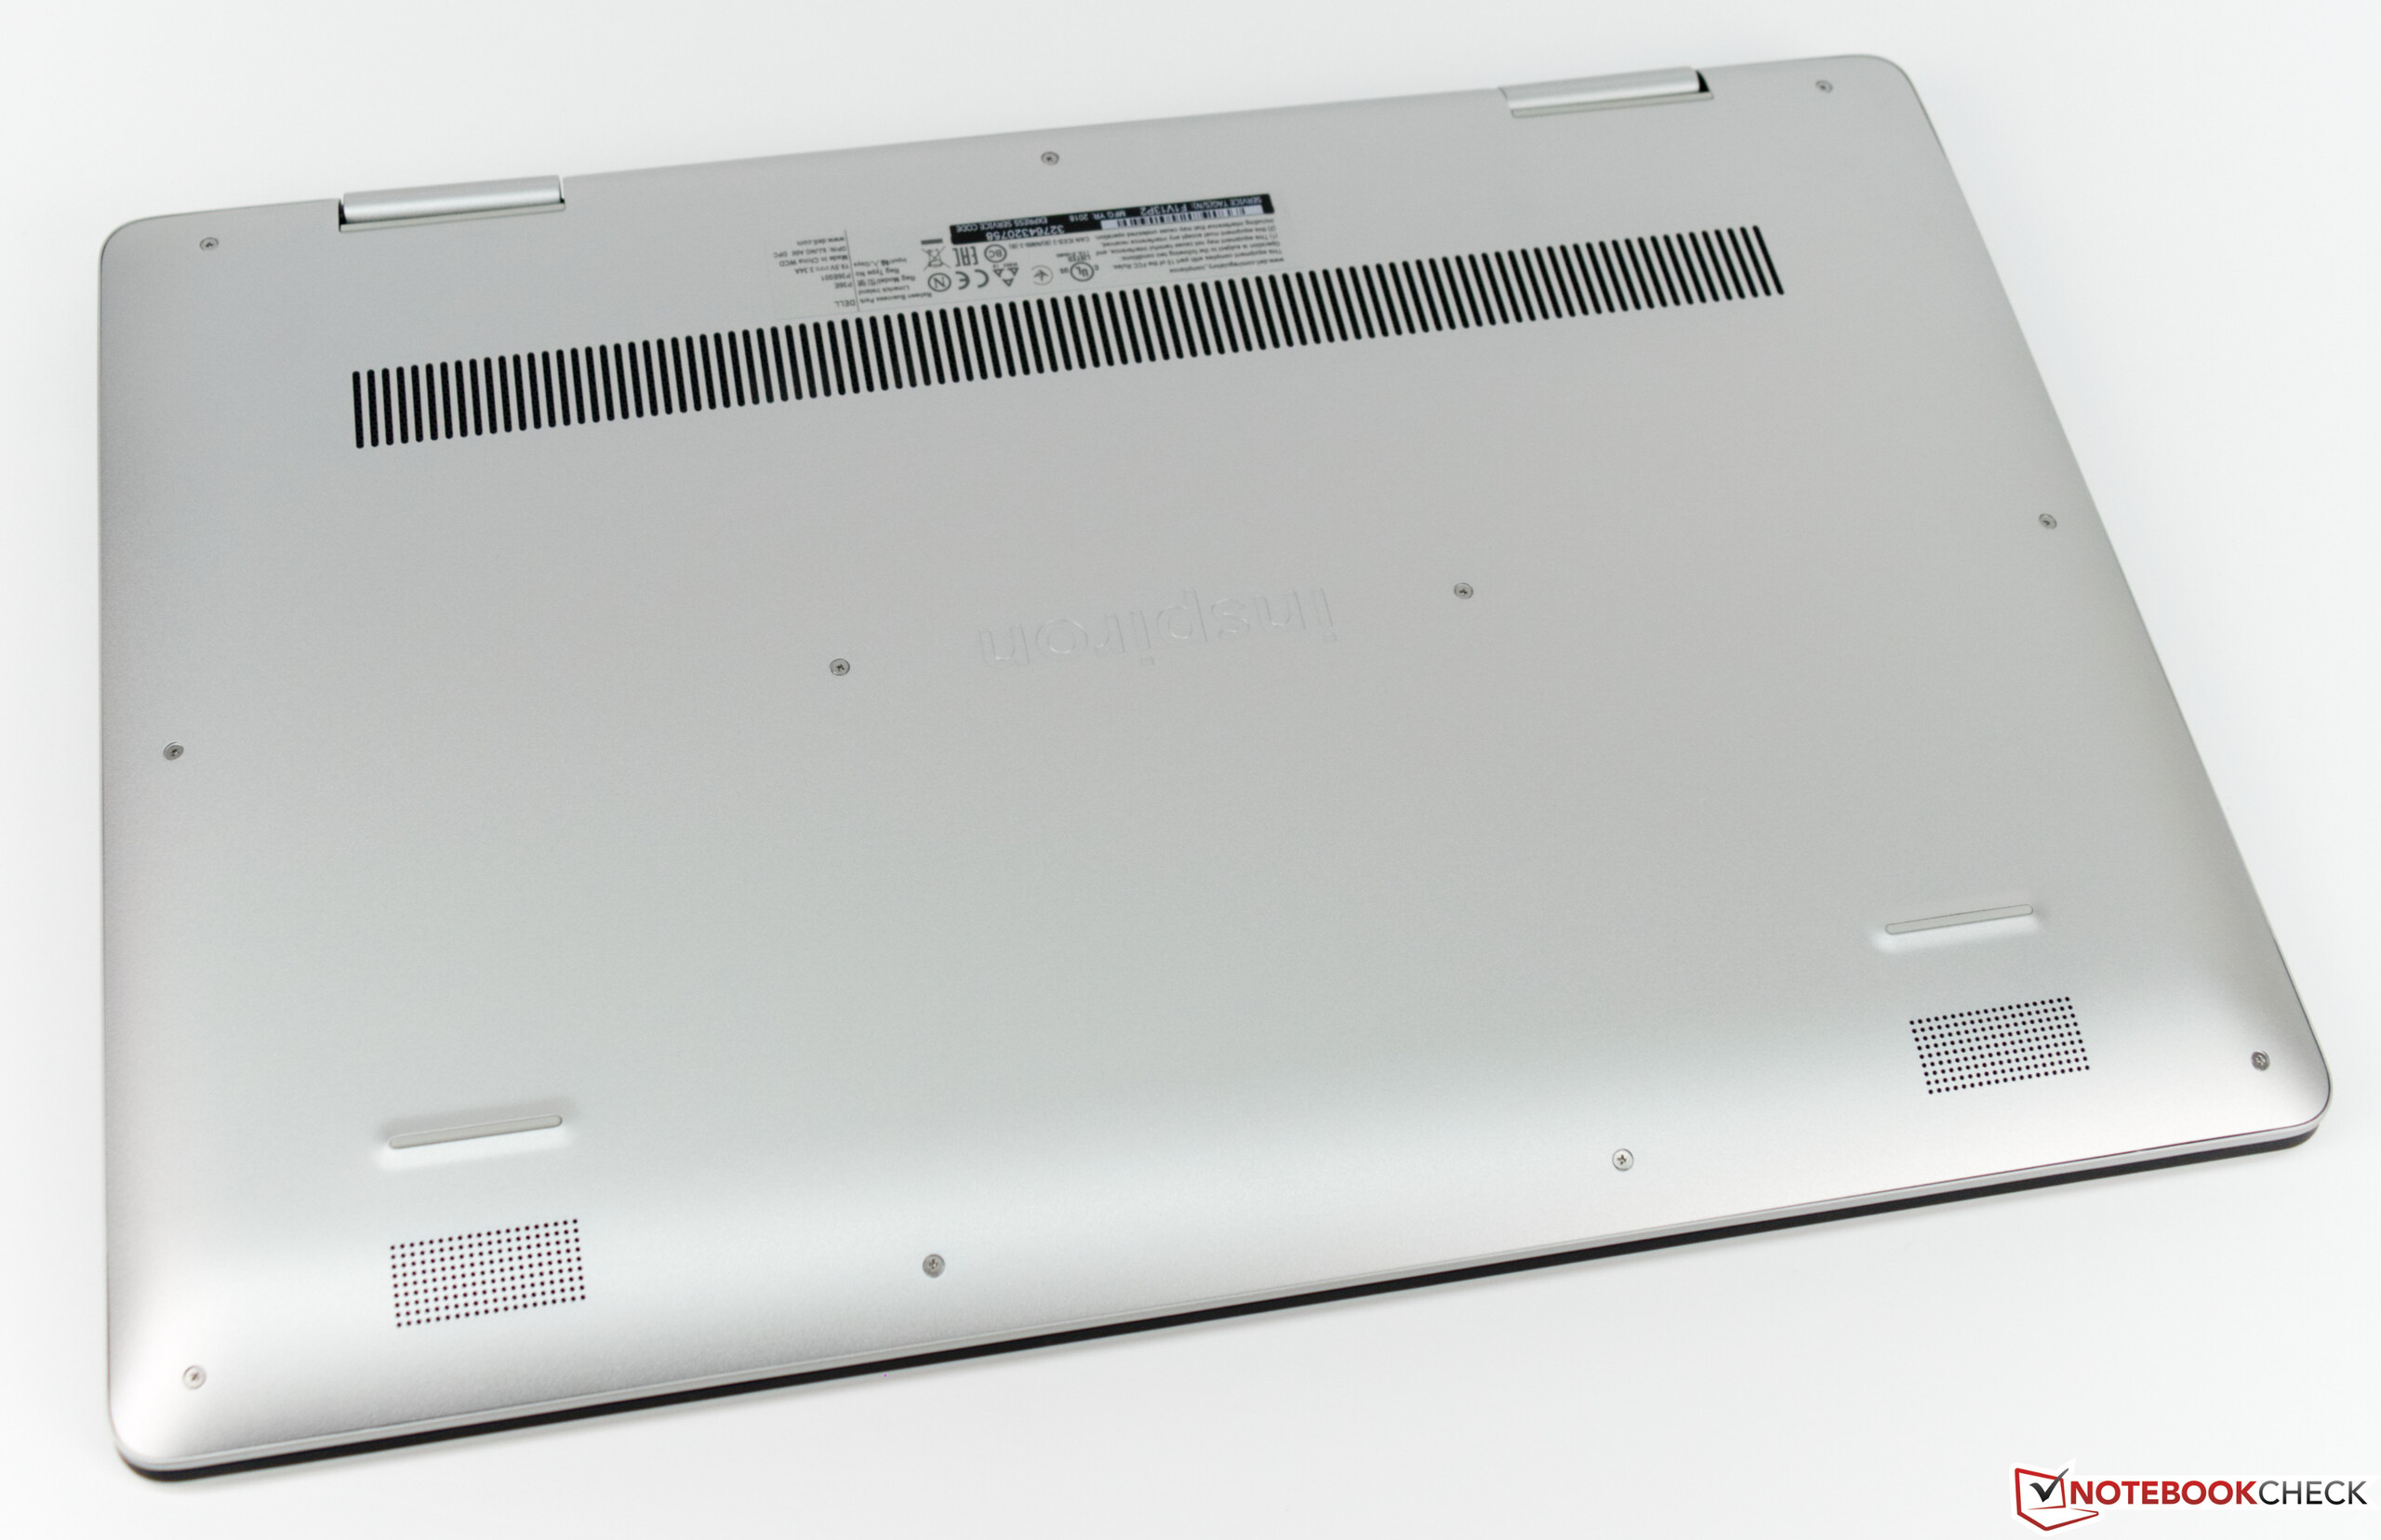
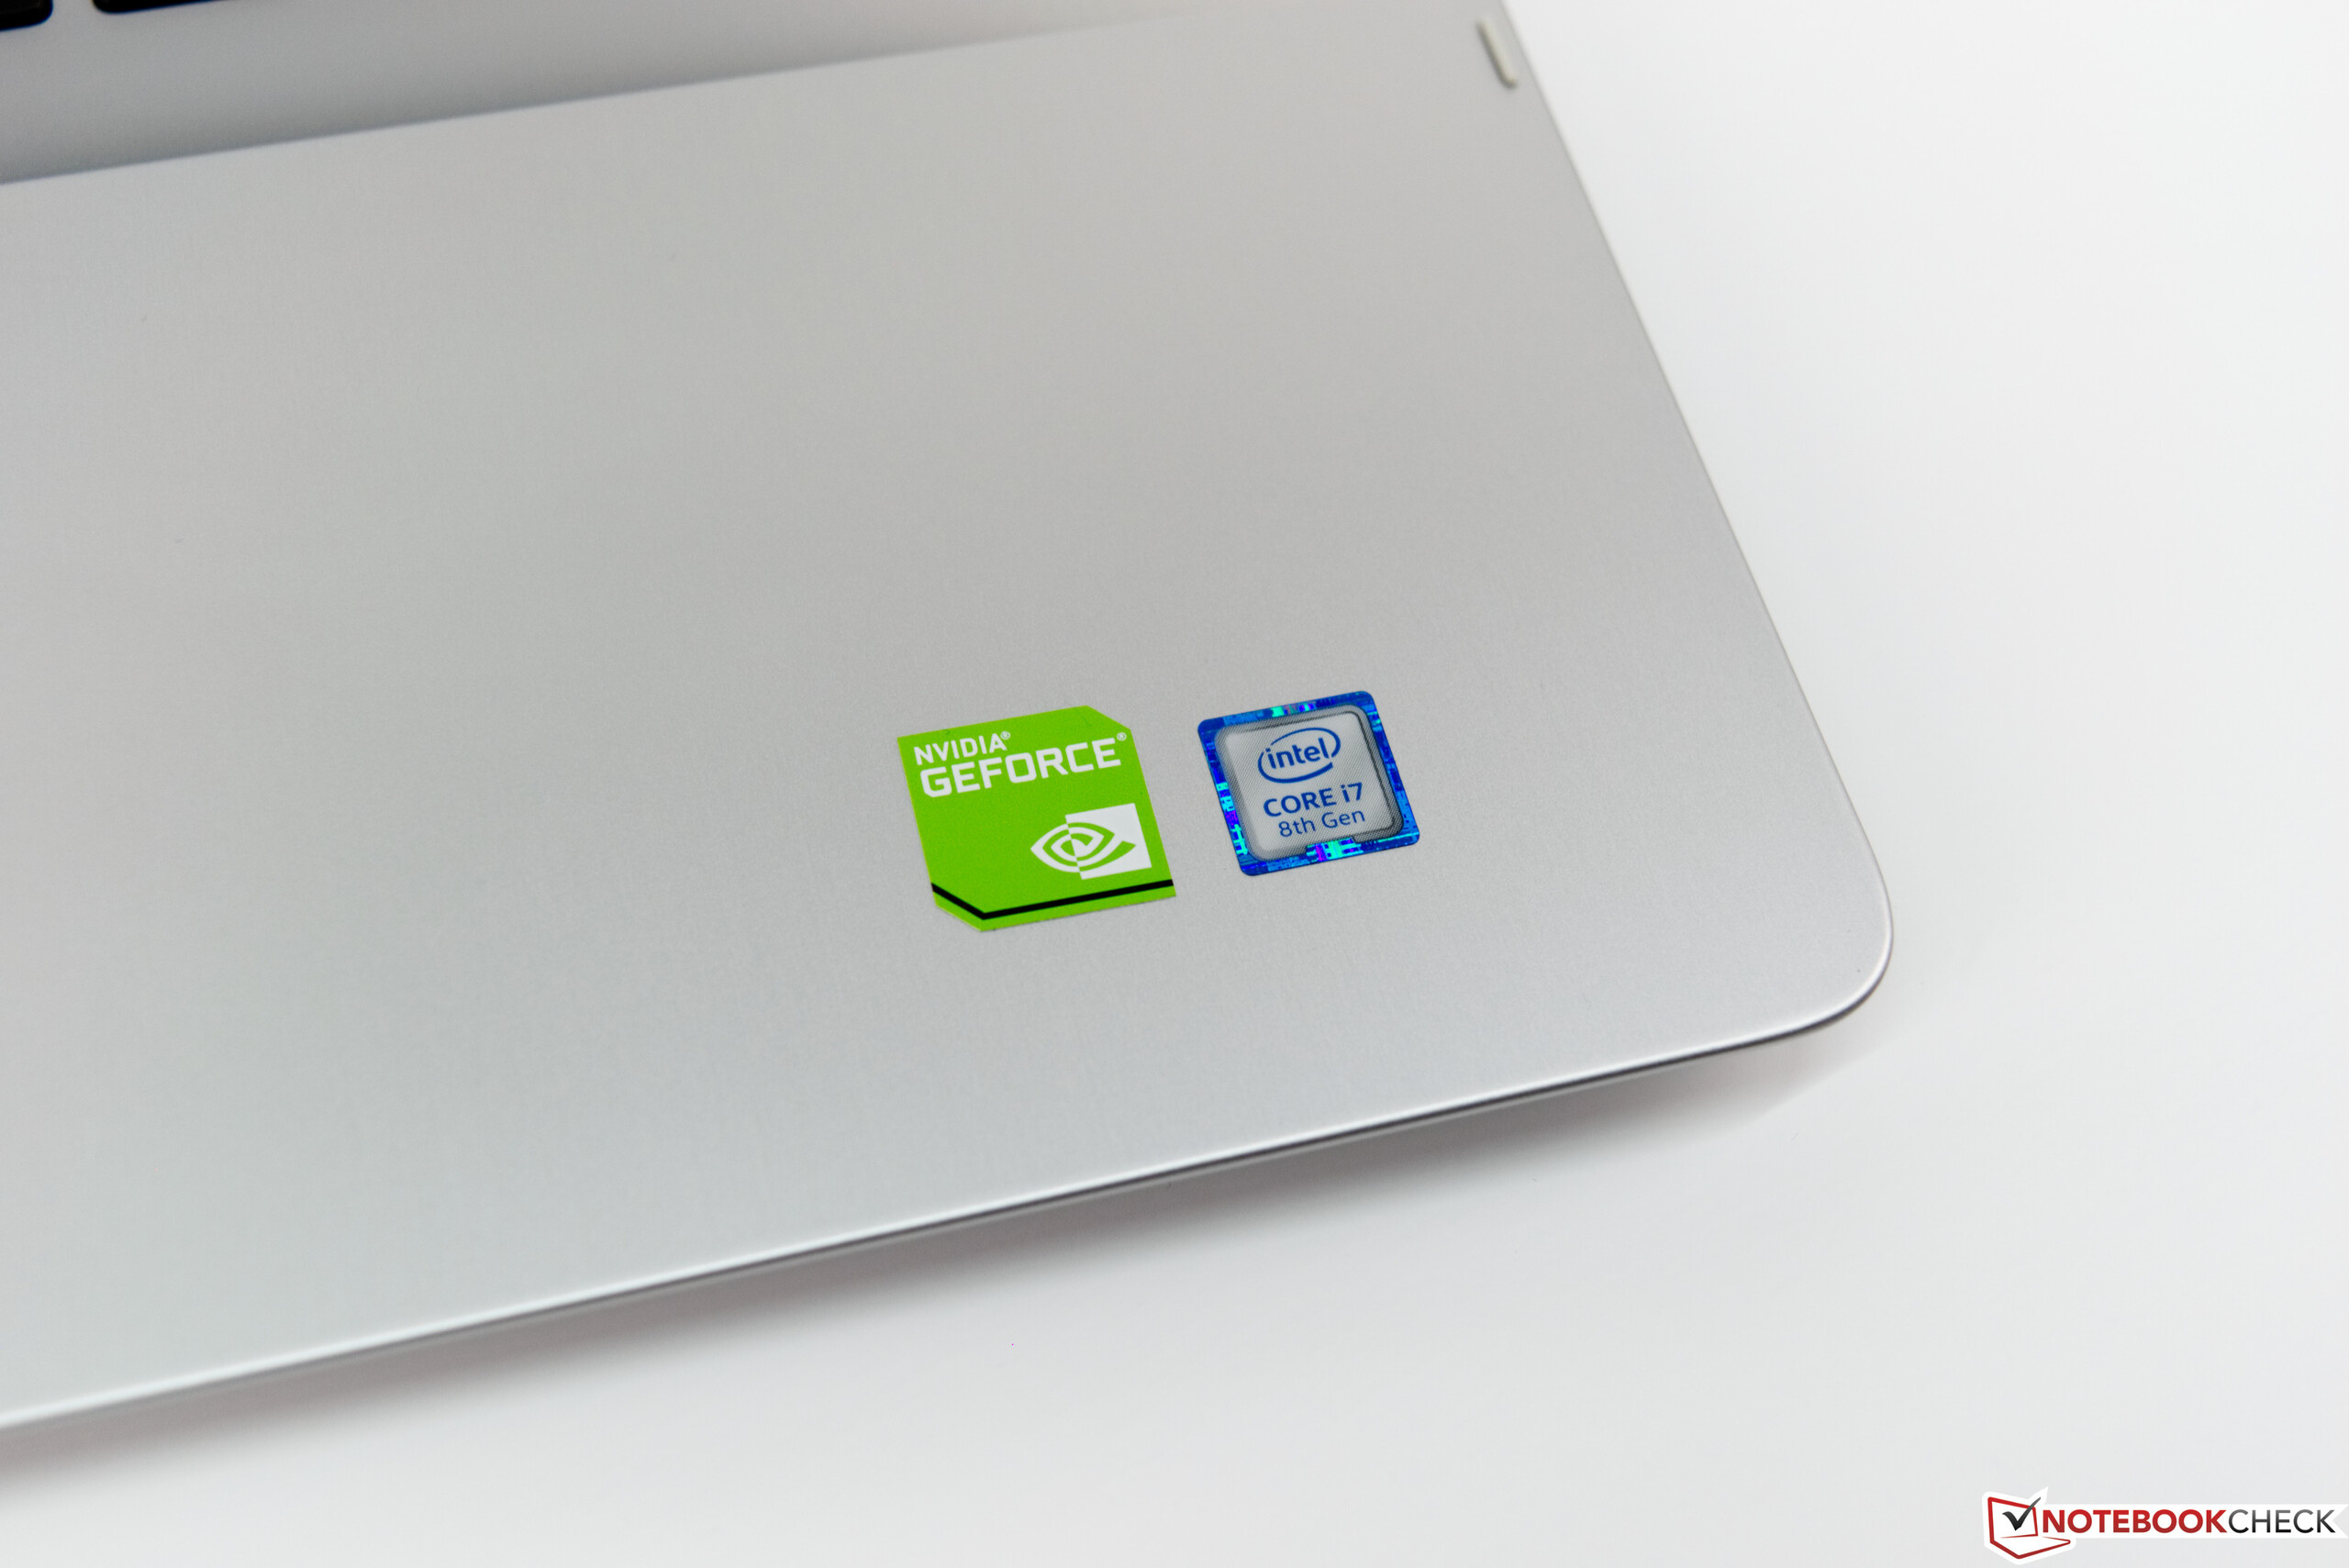
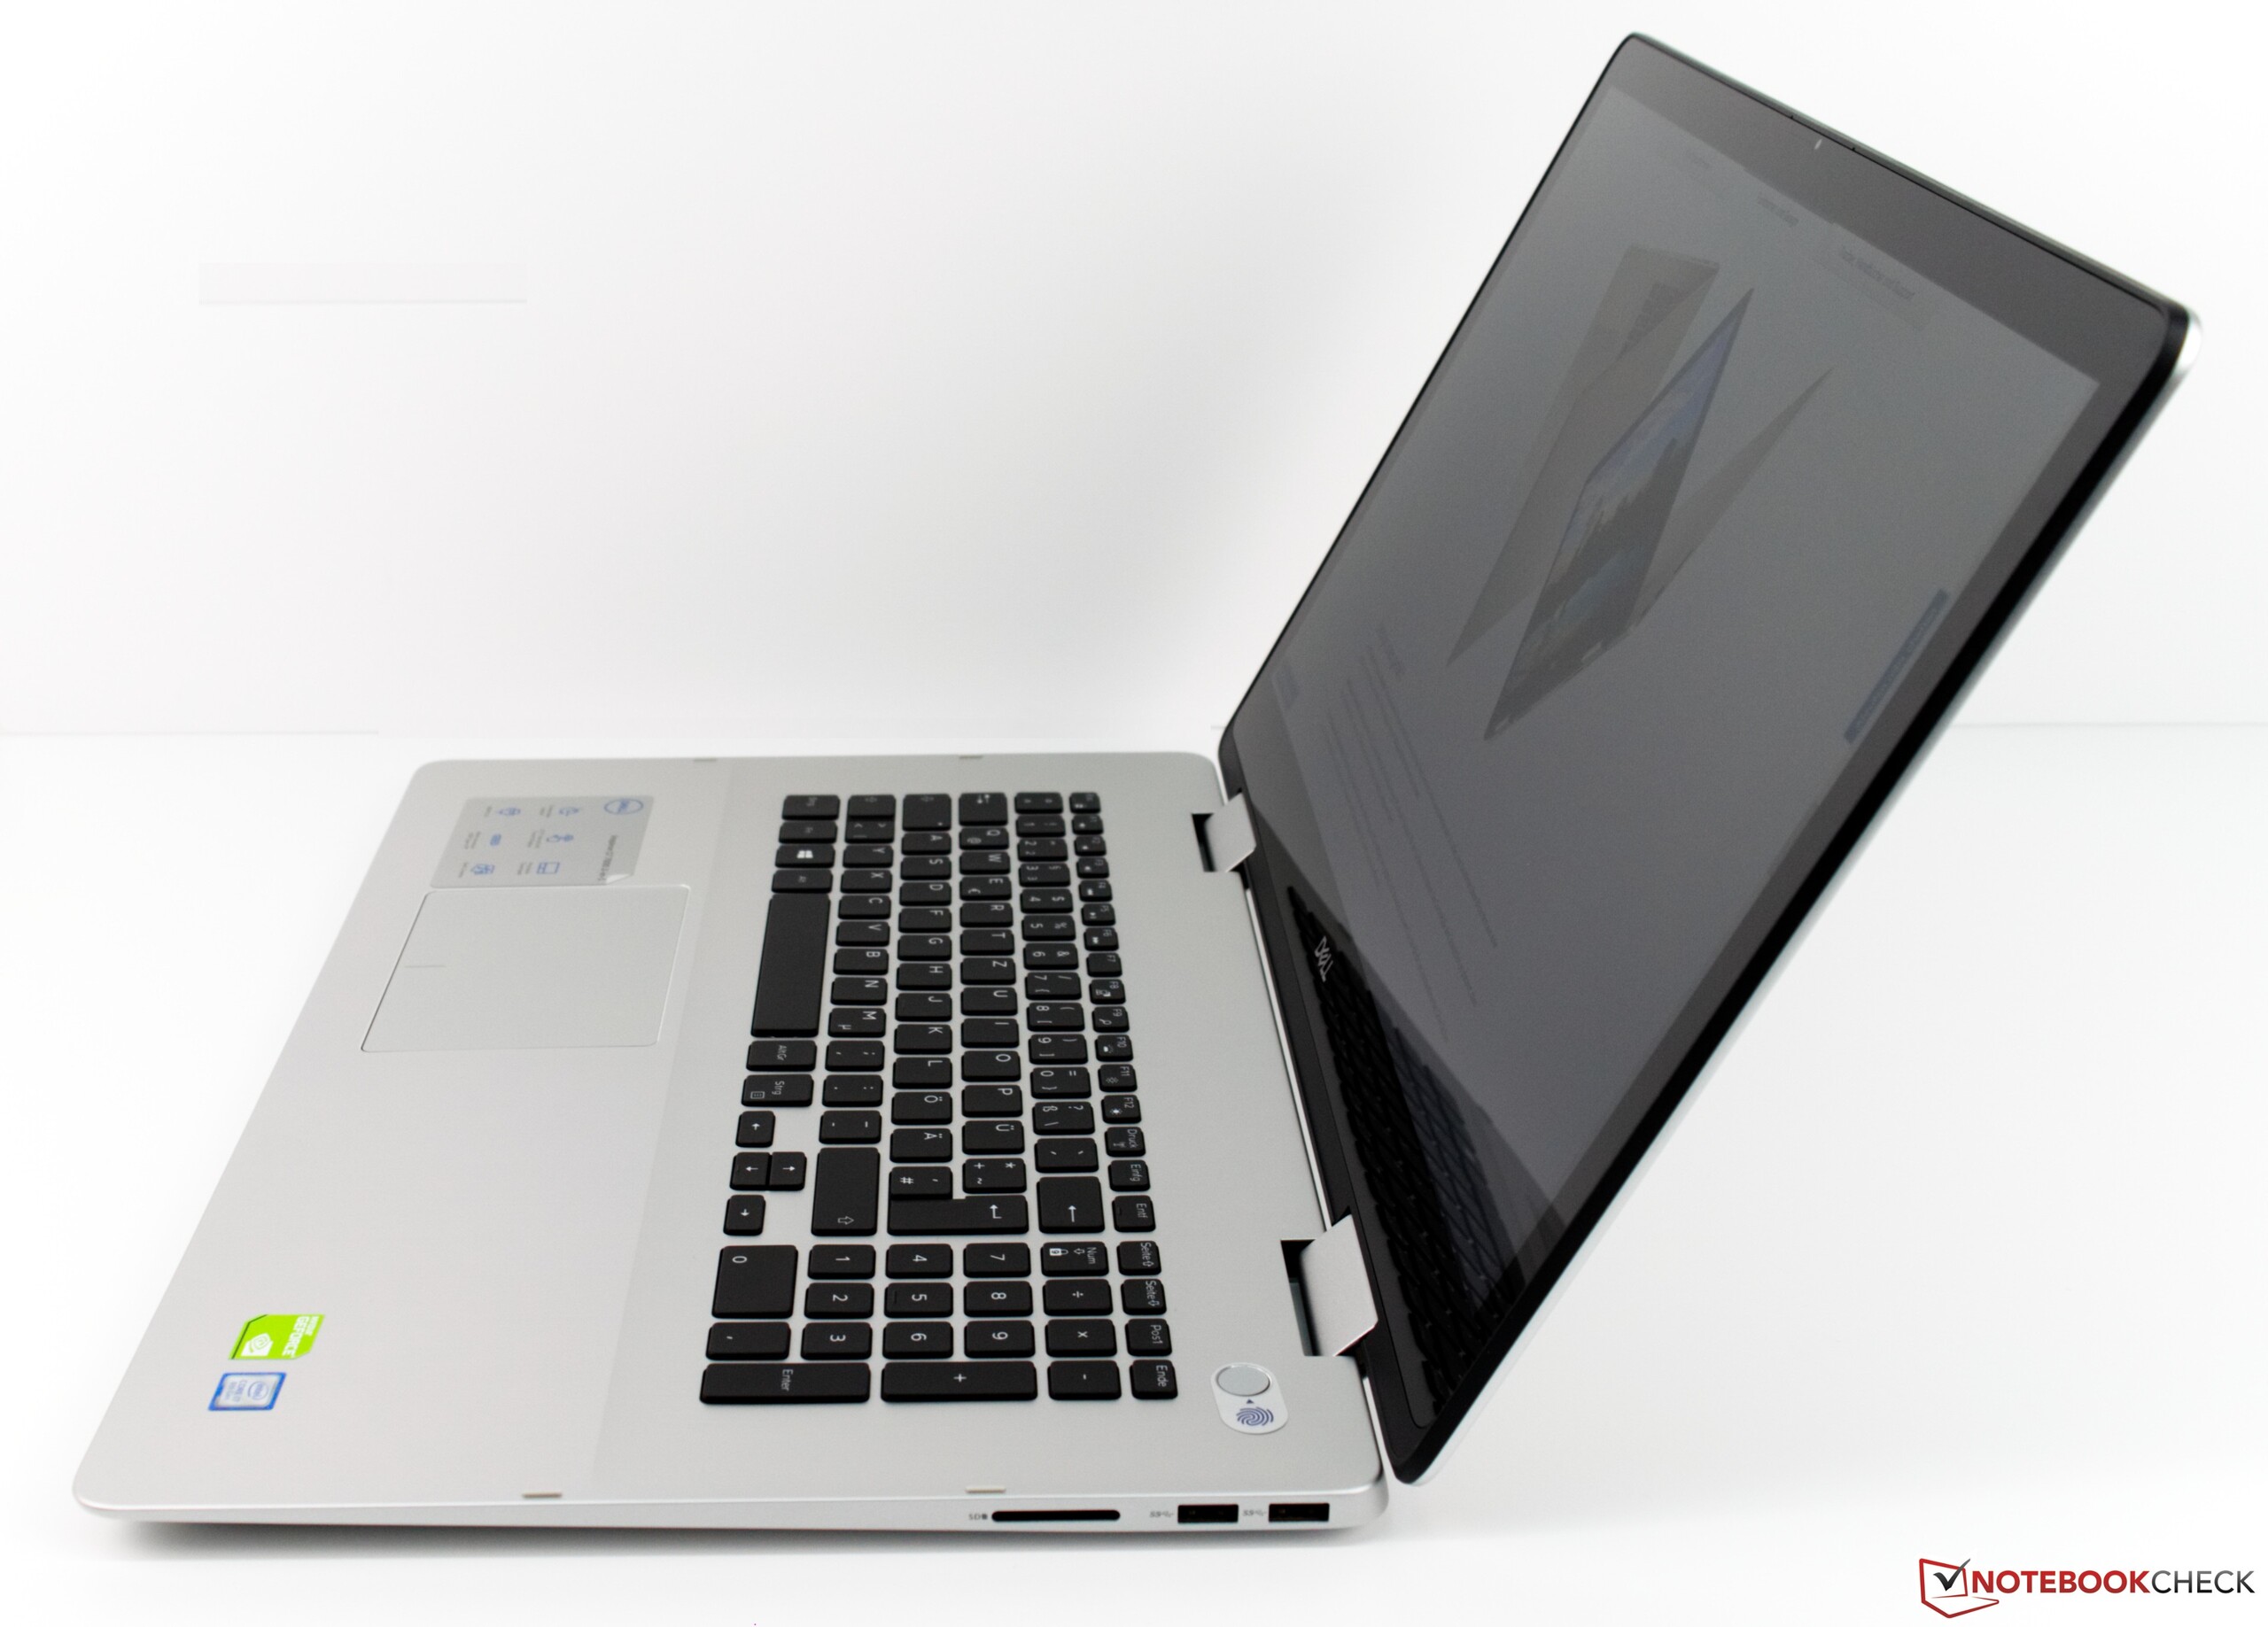
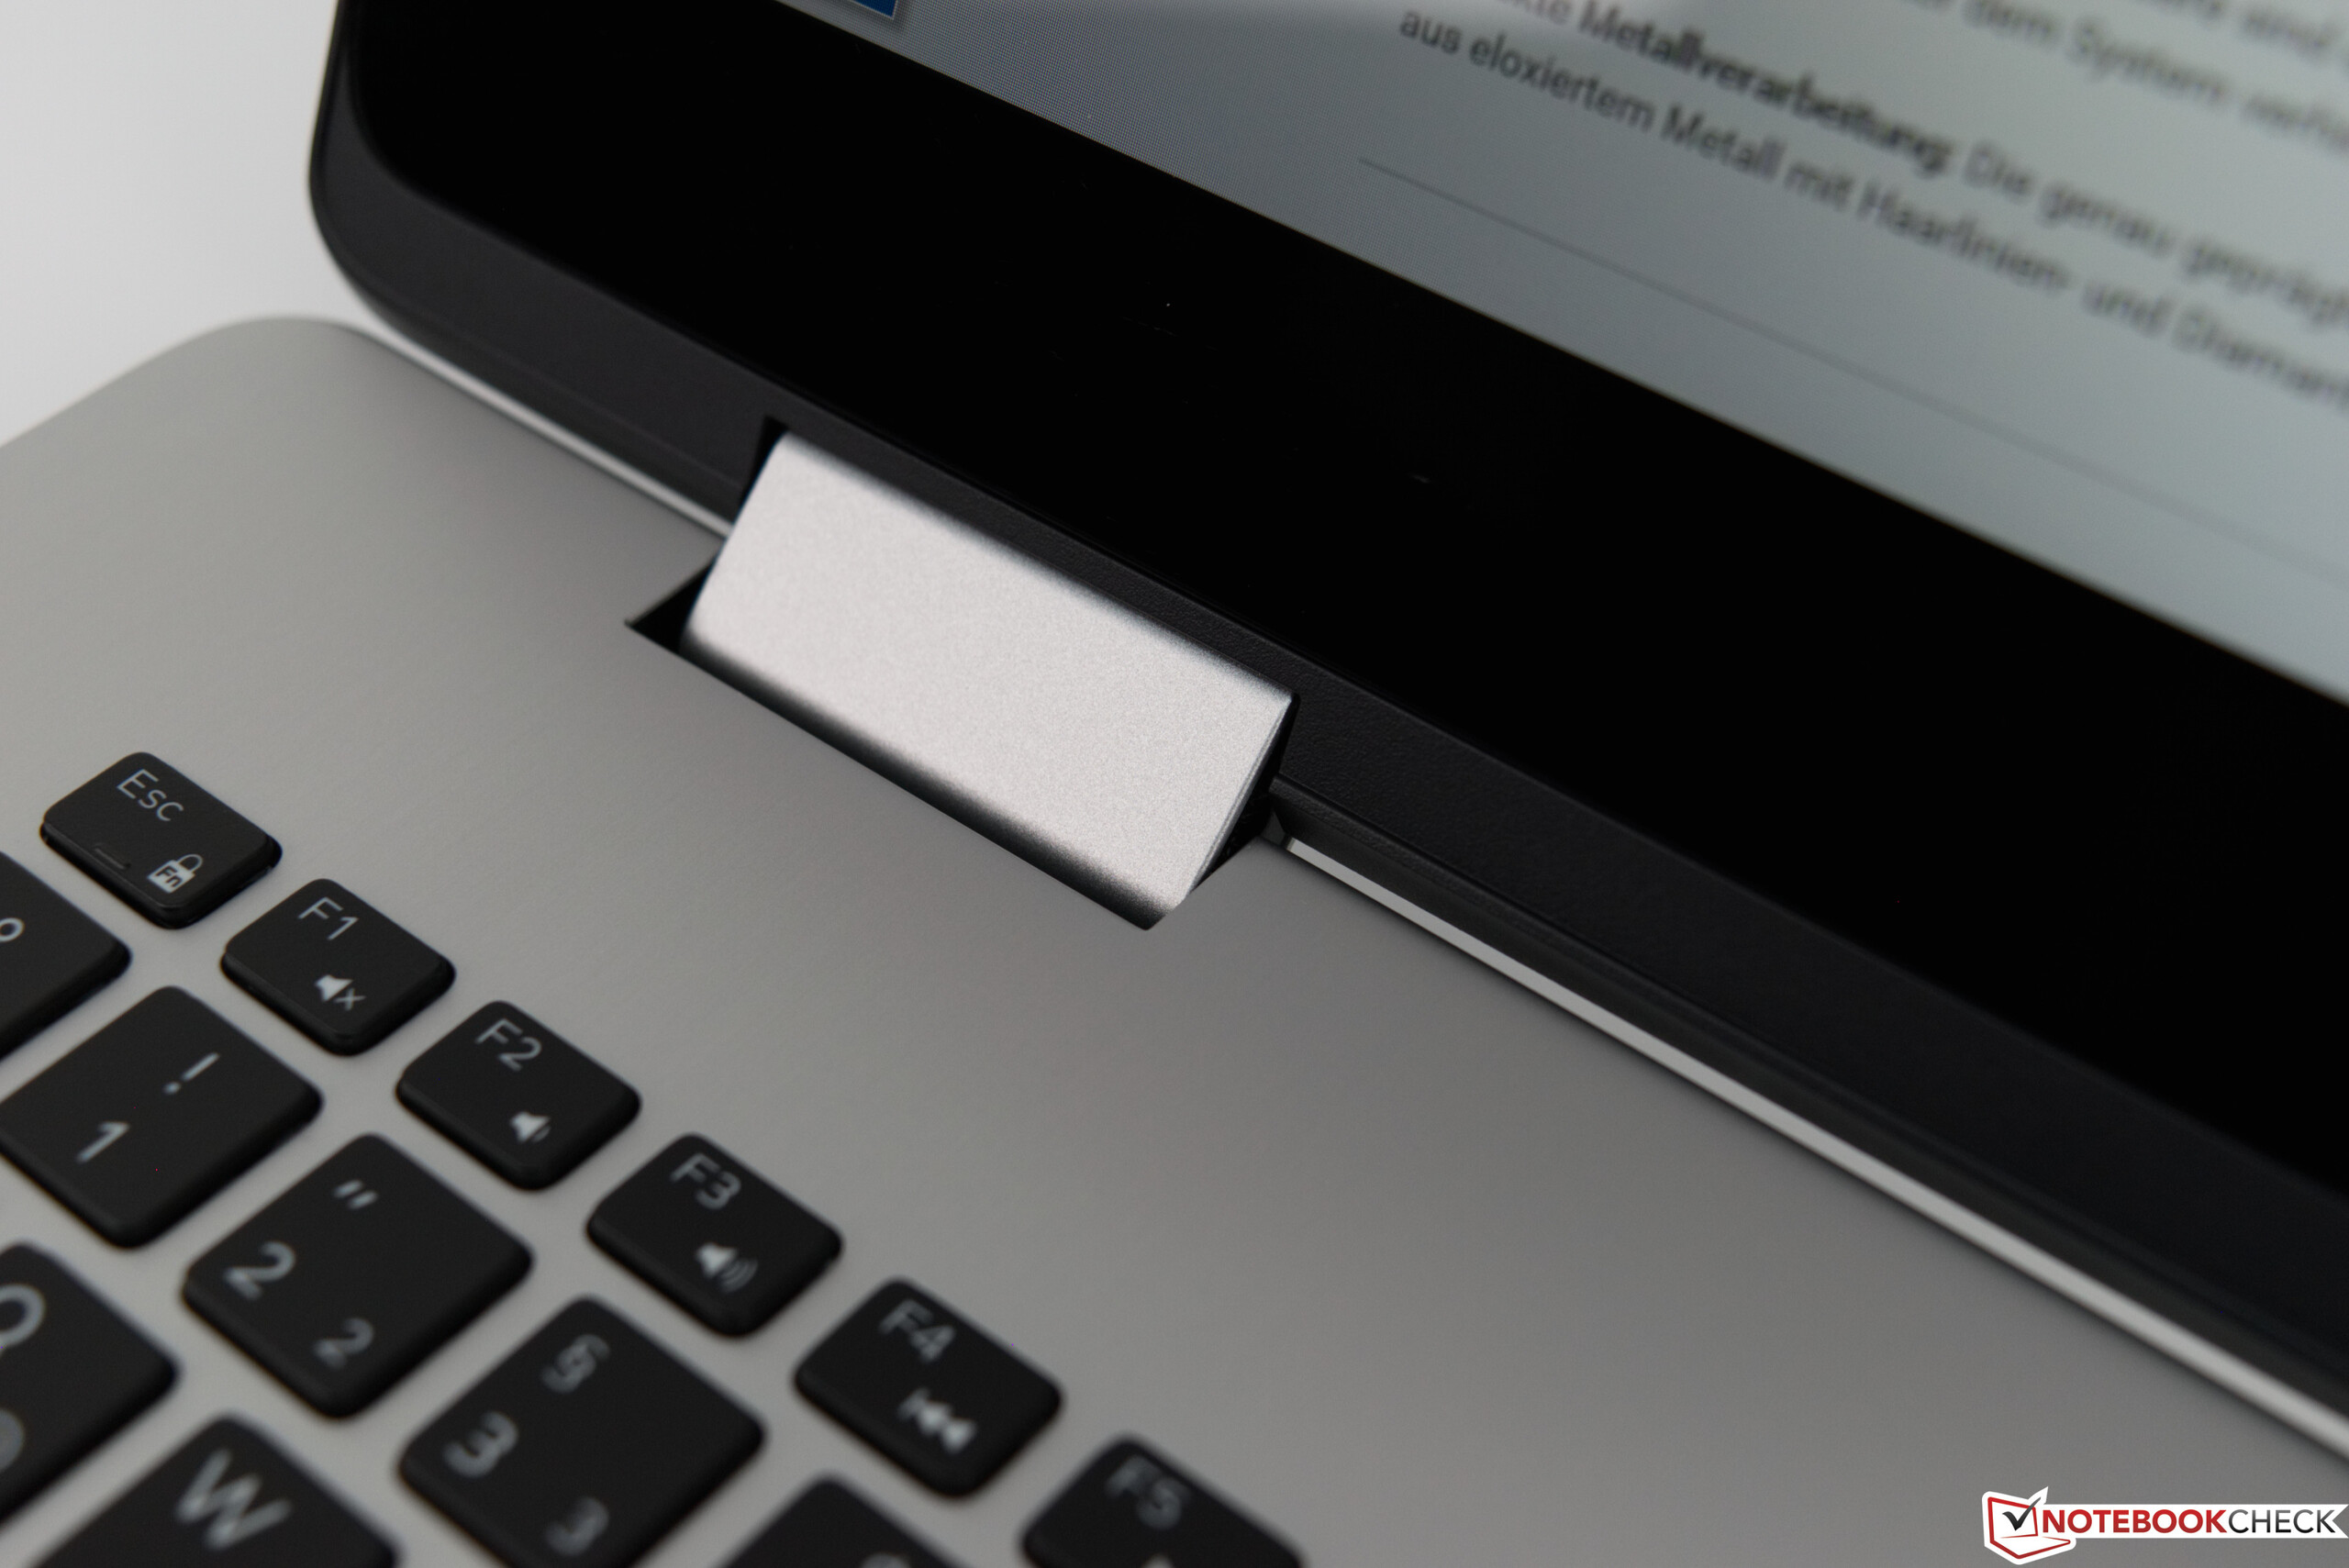
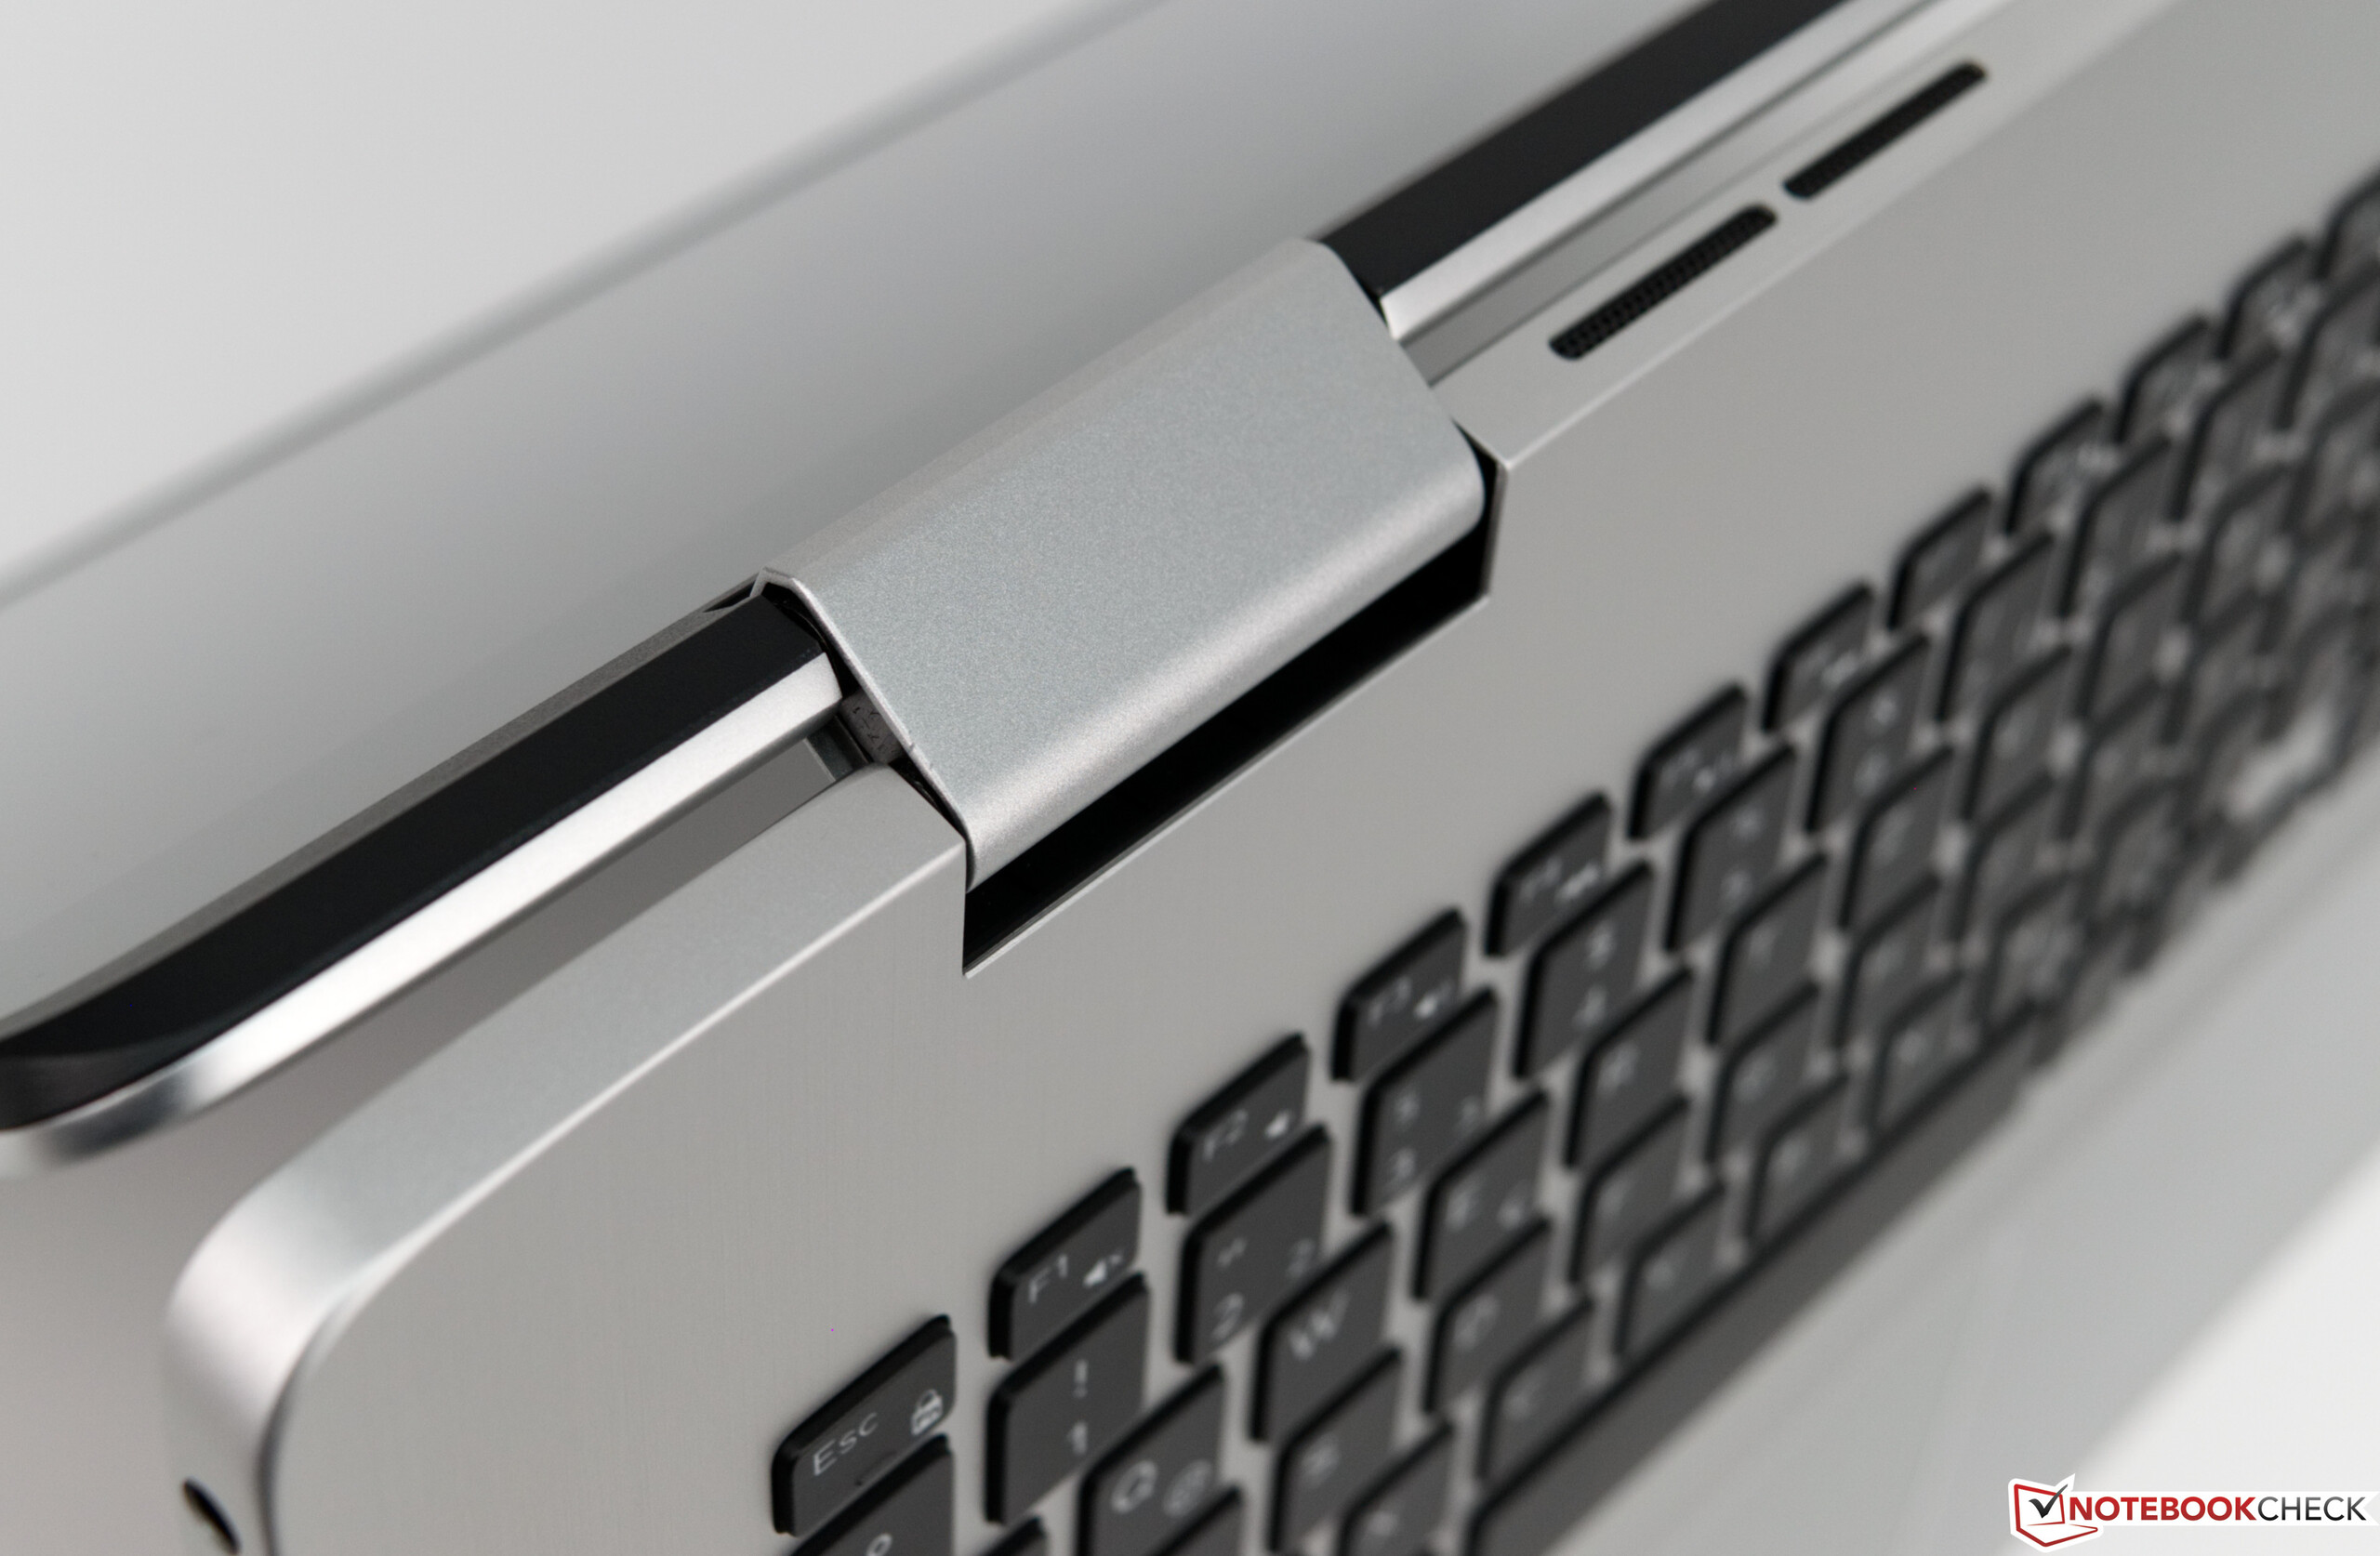
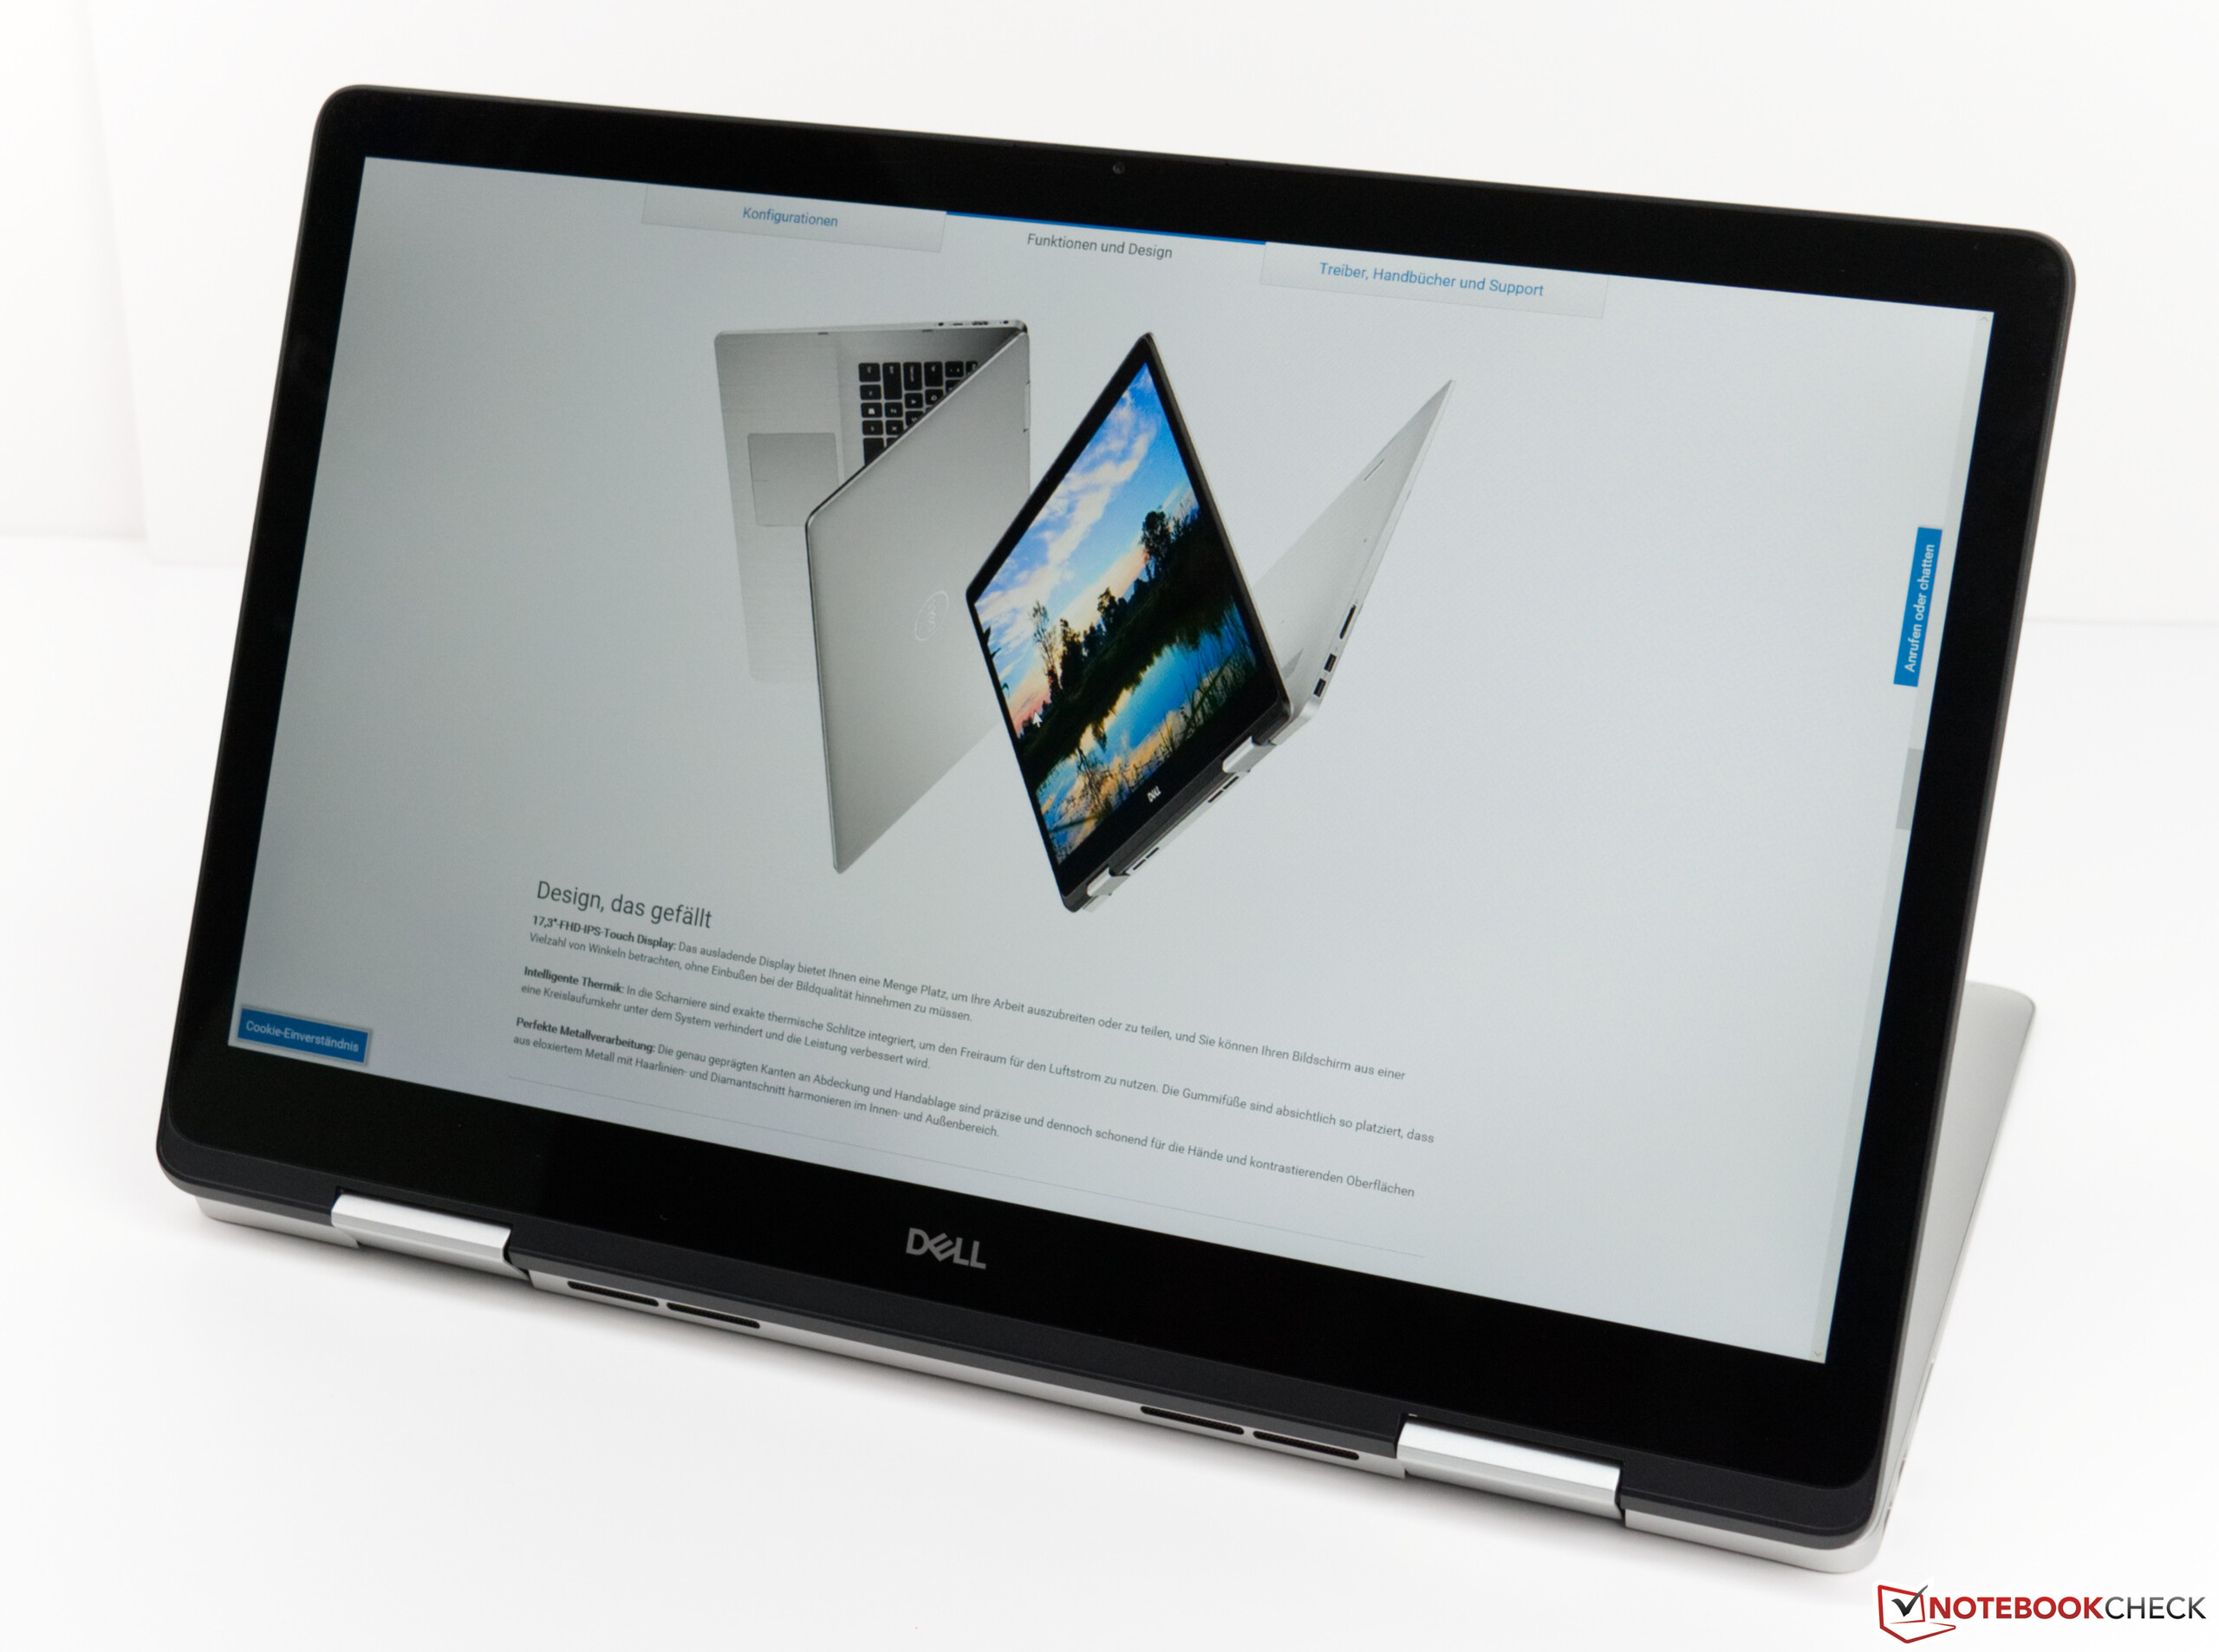
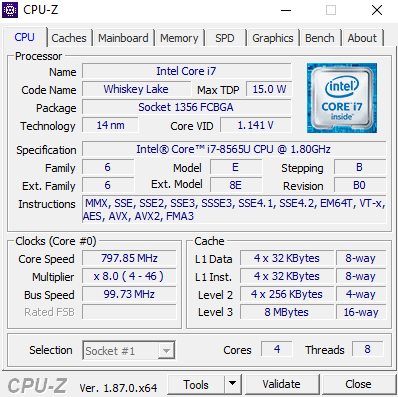
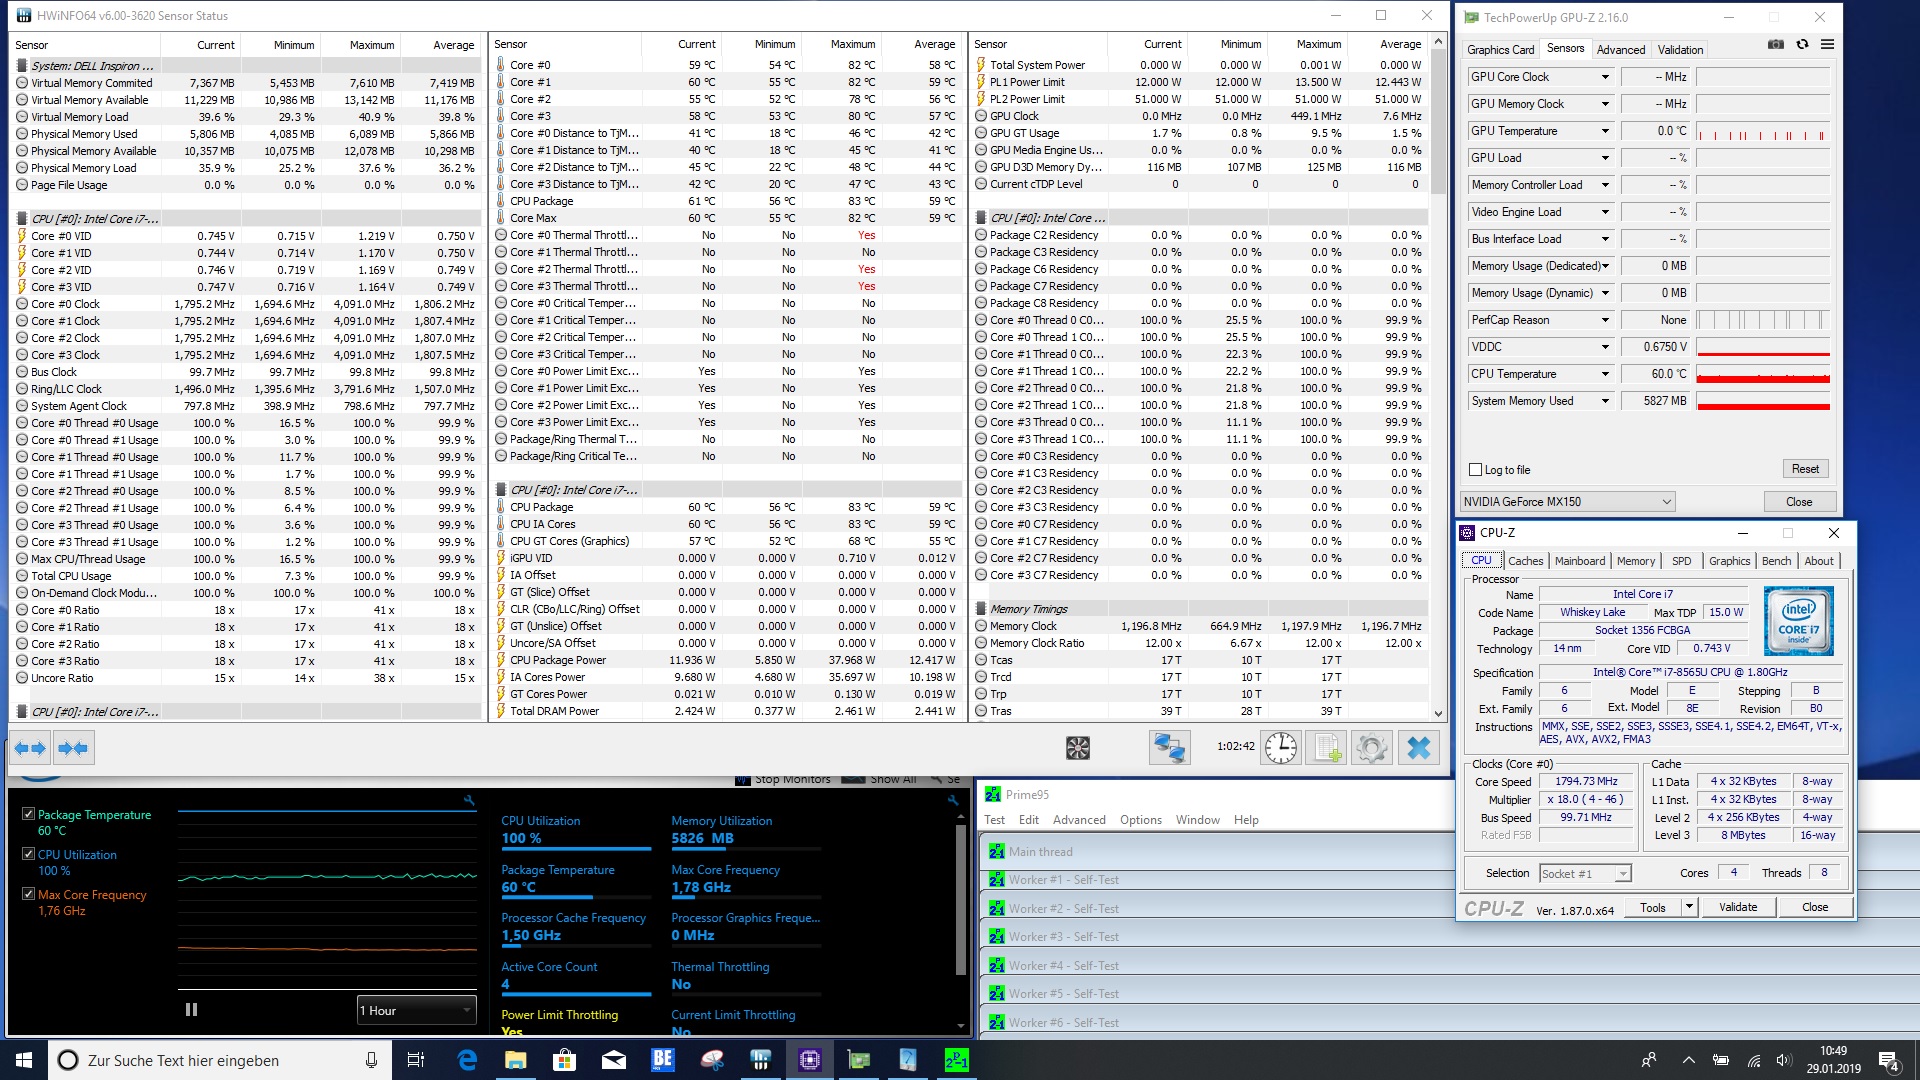
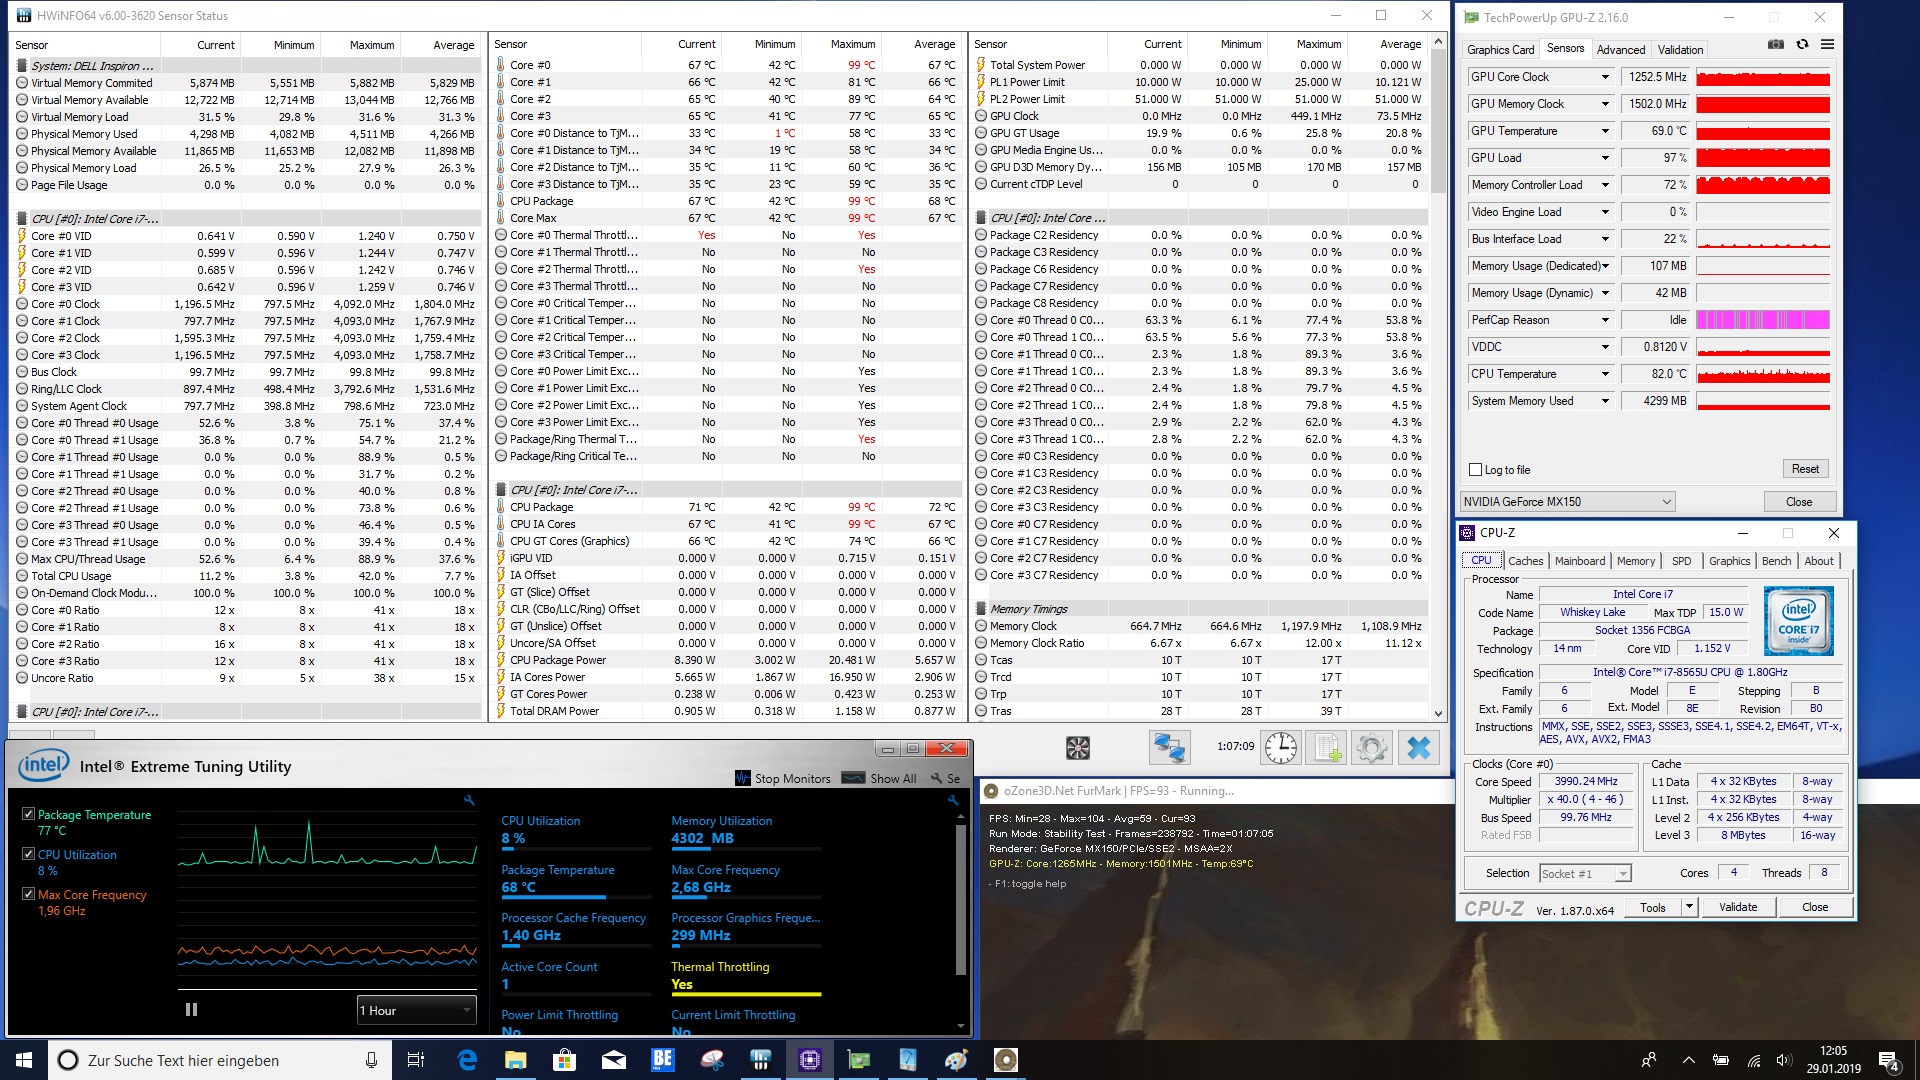
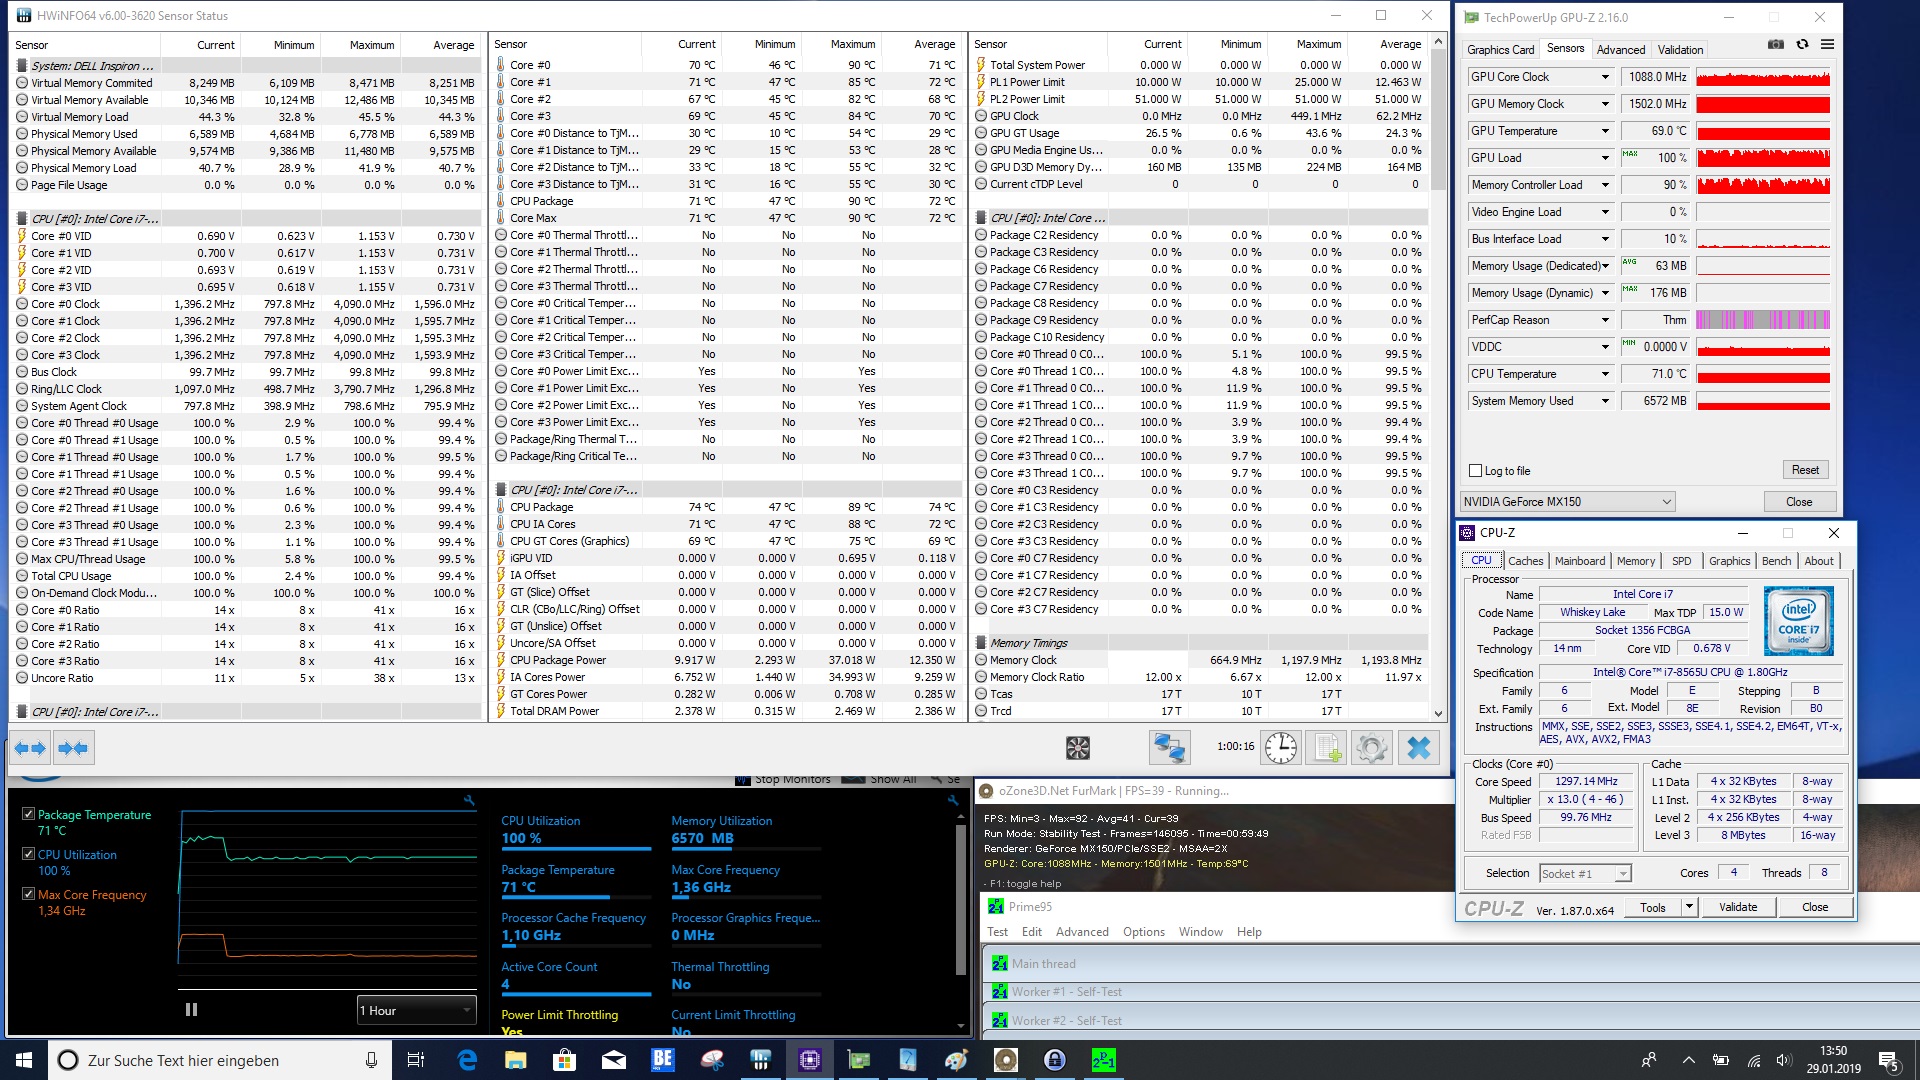
Como um conversível de 17 polegadas, o Dell Inspiron 17-7786 continua a ser incomparável, se ignorarmos o antecessor direto. Com o novo conversível gigantesco, a Dell segue seu predecessor, o Dell Inspiron 17-7773. À primeira vista, o novo dispositivo 2-em-1 não parece muito diferente, já que você só vê as pequenas alterações visuais quando olha com mais cuidado. Você pode argumentar se essas mudanças foram sensatas ou não. Mas mais importantes são as mudanças sob o capô, já que o processador Kaby-Lake foi substituído pelo novo Intel Core i7-8565U (Whiskey Lake). Isso oferece uma velocidade de Boost significativamente maior e deve oferecer mais desempenho em conformidade. Durante o teste, infelizmente não foi possível mantê-lo constante, e nossa unidade de teste foi realmente derrotada pelo predecessor no multi-loop Cinebench-R15. No entanto, no geral ficamos satisfeitos com a CPU no dispositivo.
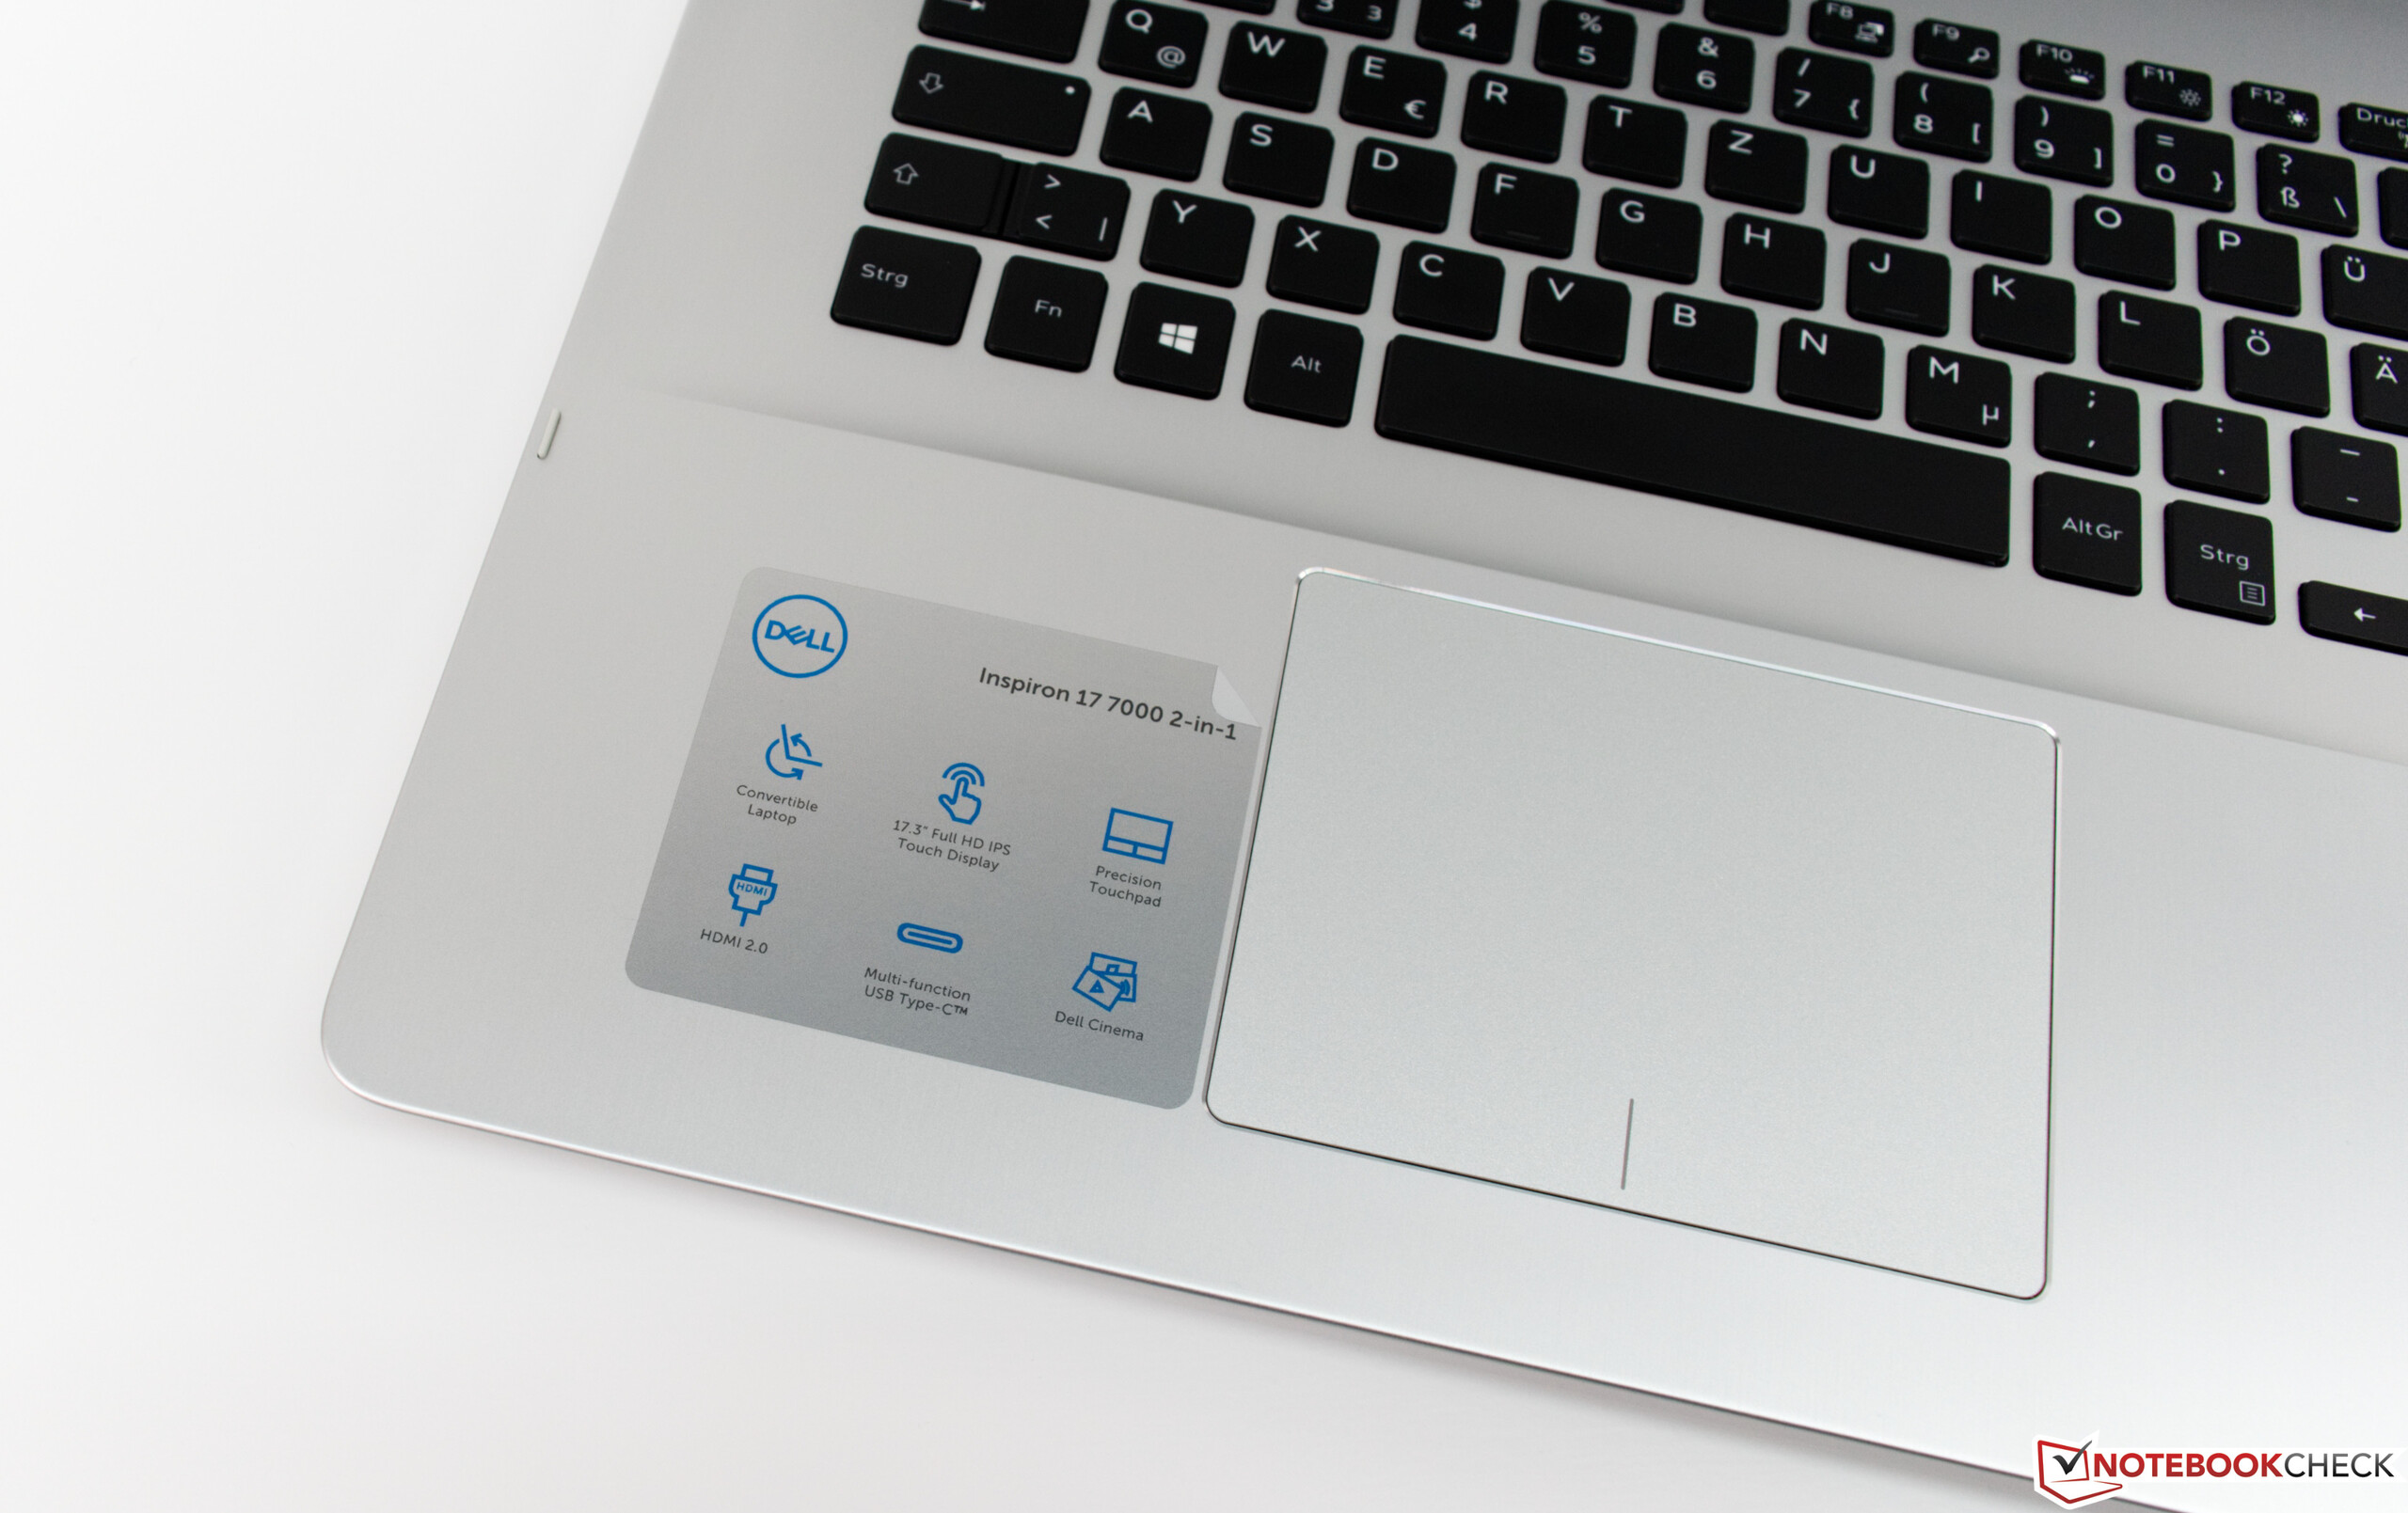
Infelizmente, a Dell oferece o dispositivo apenas com essa configuração de CPU/GPU. Não está claro para nós por que não é oferecido com um processador i5 baseado em Whiskey Lake. Os compradores somente têm opções em termos da solução de armazenamento. Recomendamos a combinação de SSD e HD, assim como nossa unidade de teste também foi configurada. Juntamente com os 16 GB de RAM e a tela táctil de 17 polegadas, os compradores terão que colocar 1.328 Euros (~$1.521) sobre a mesa.
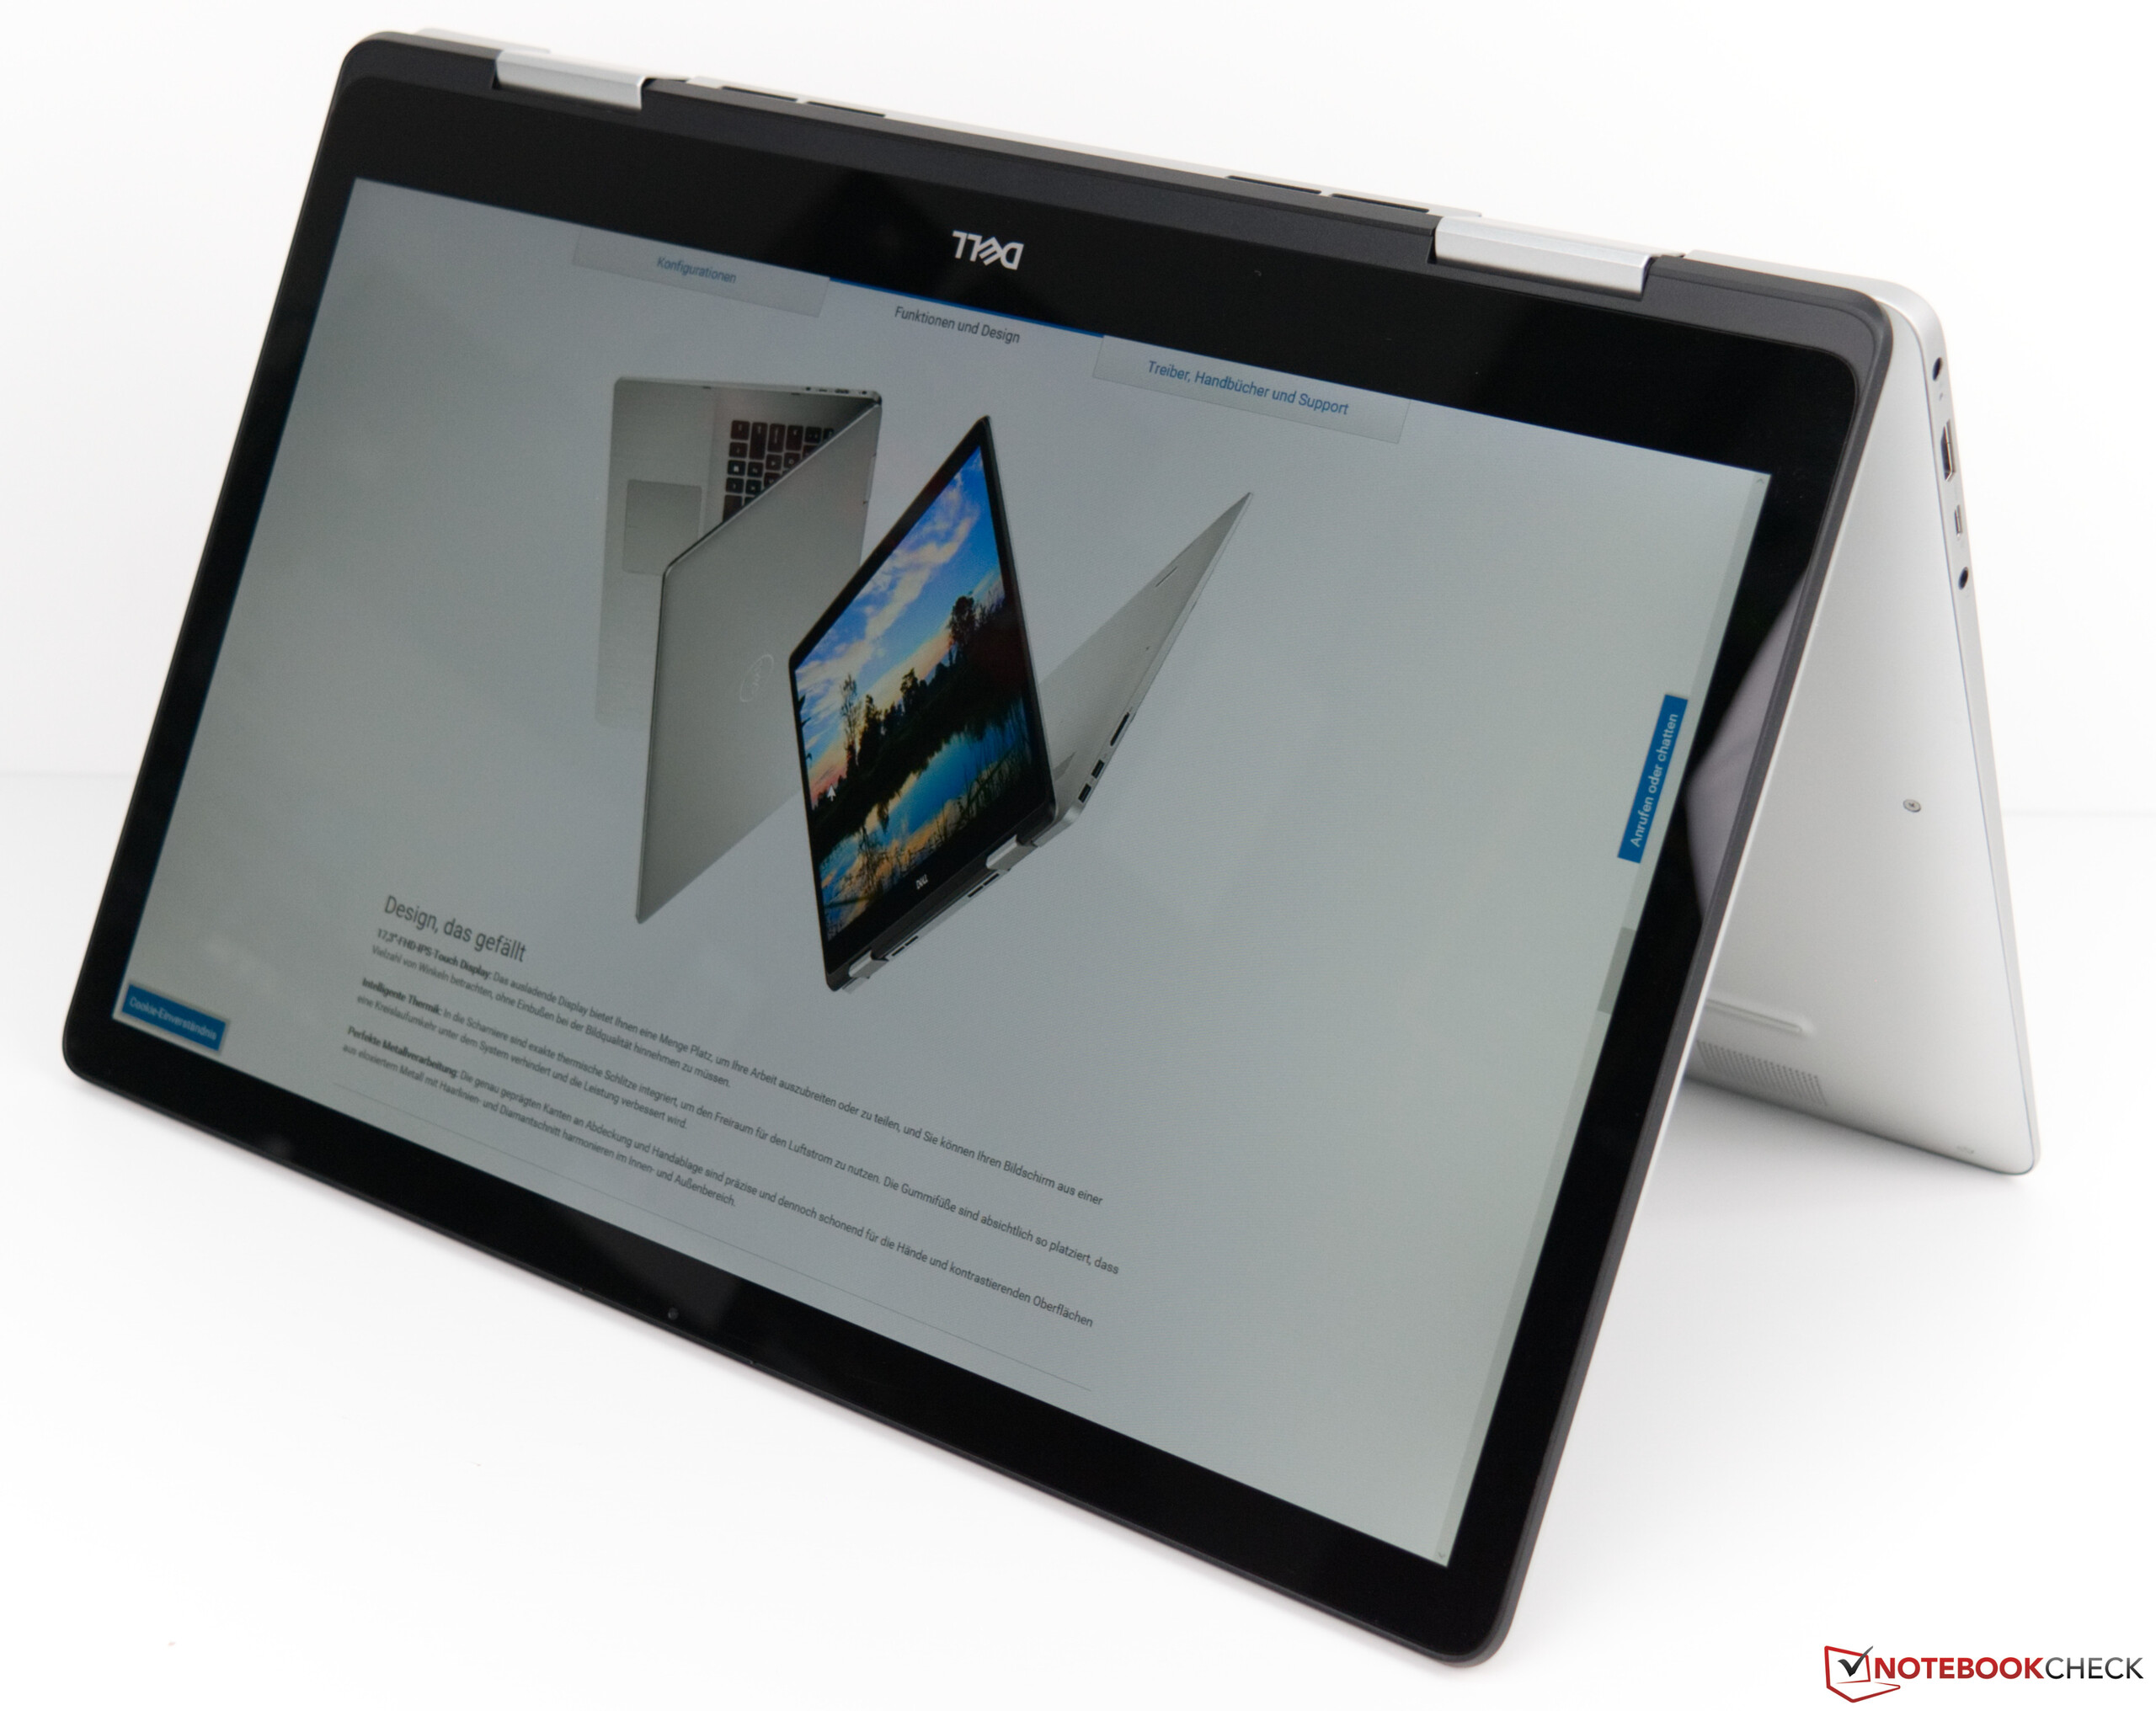
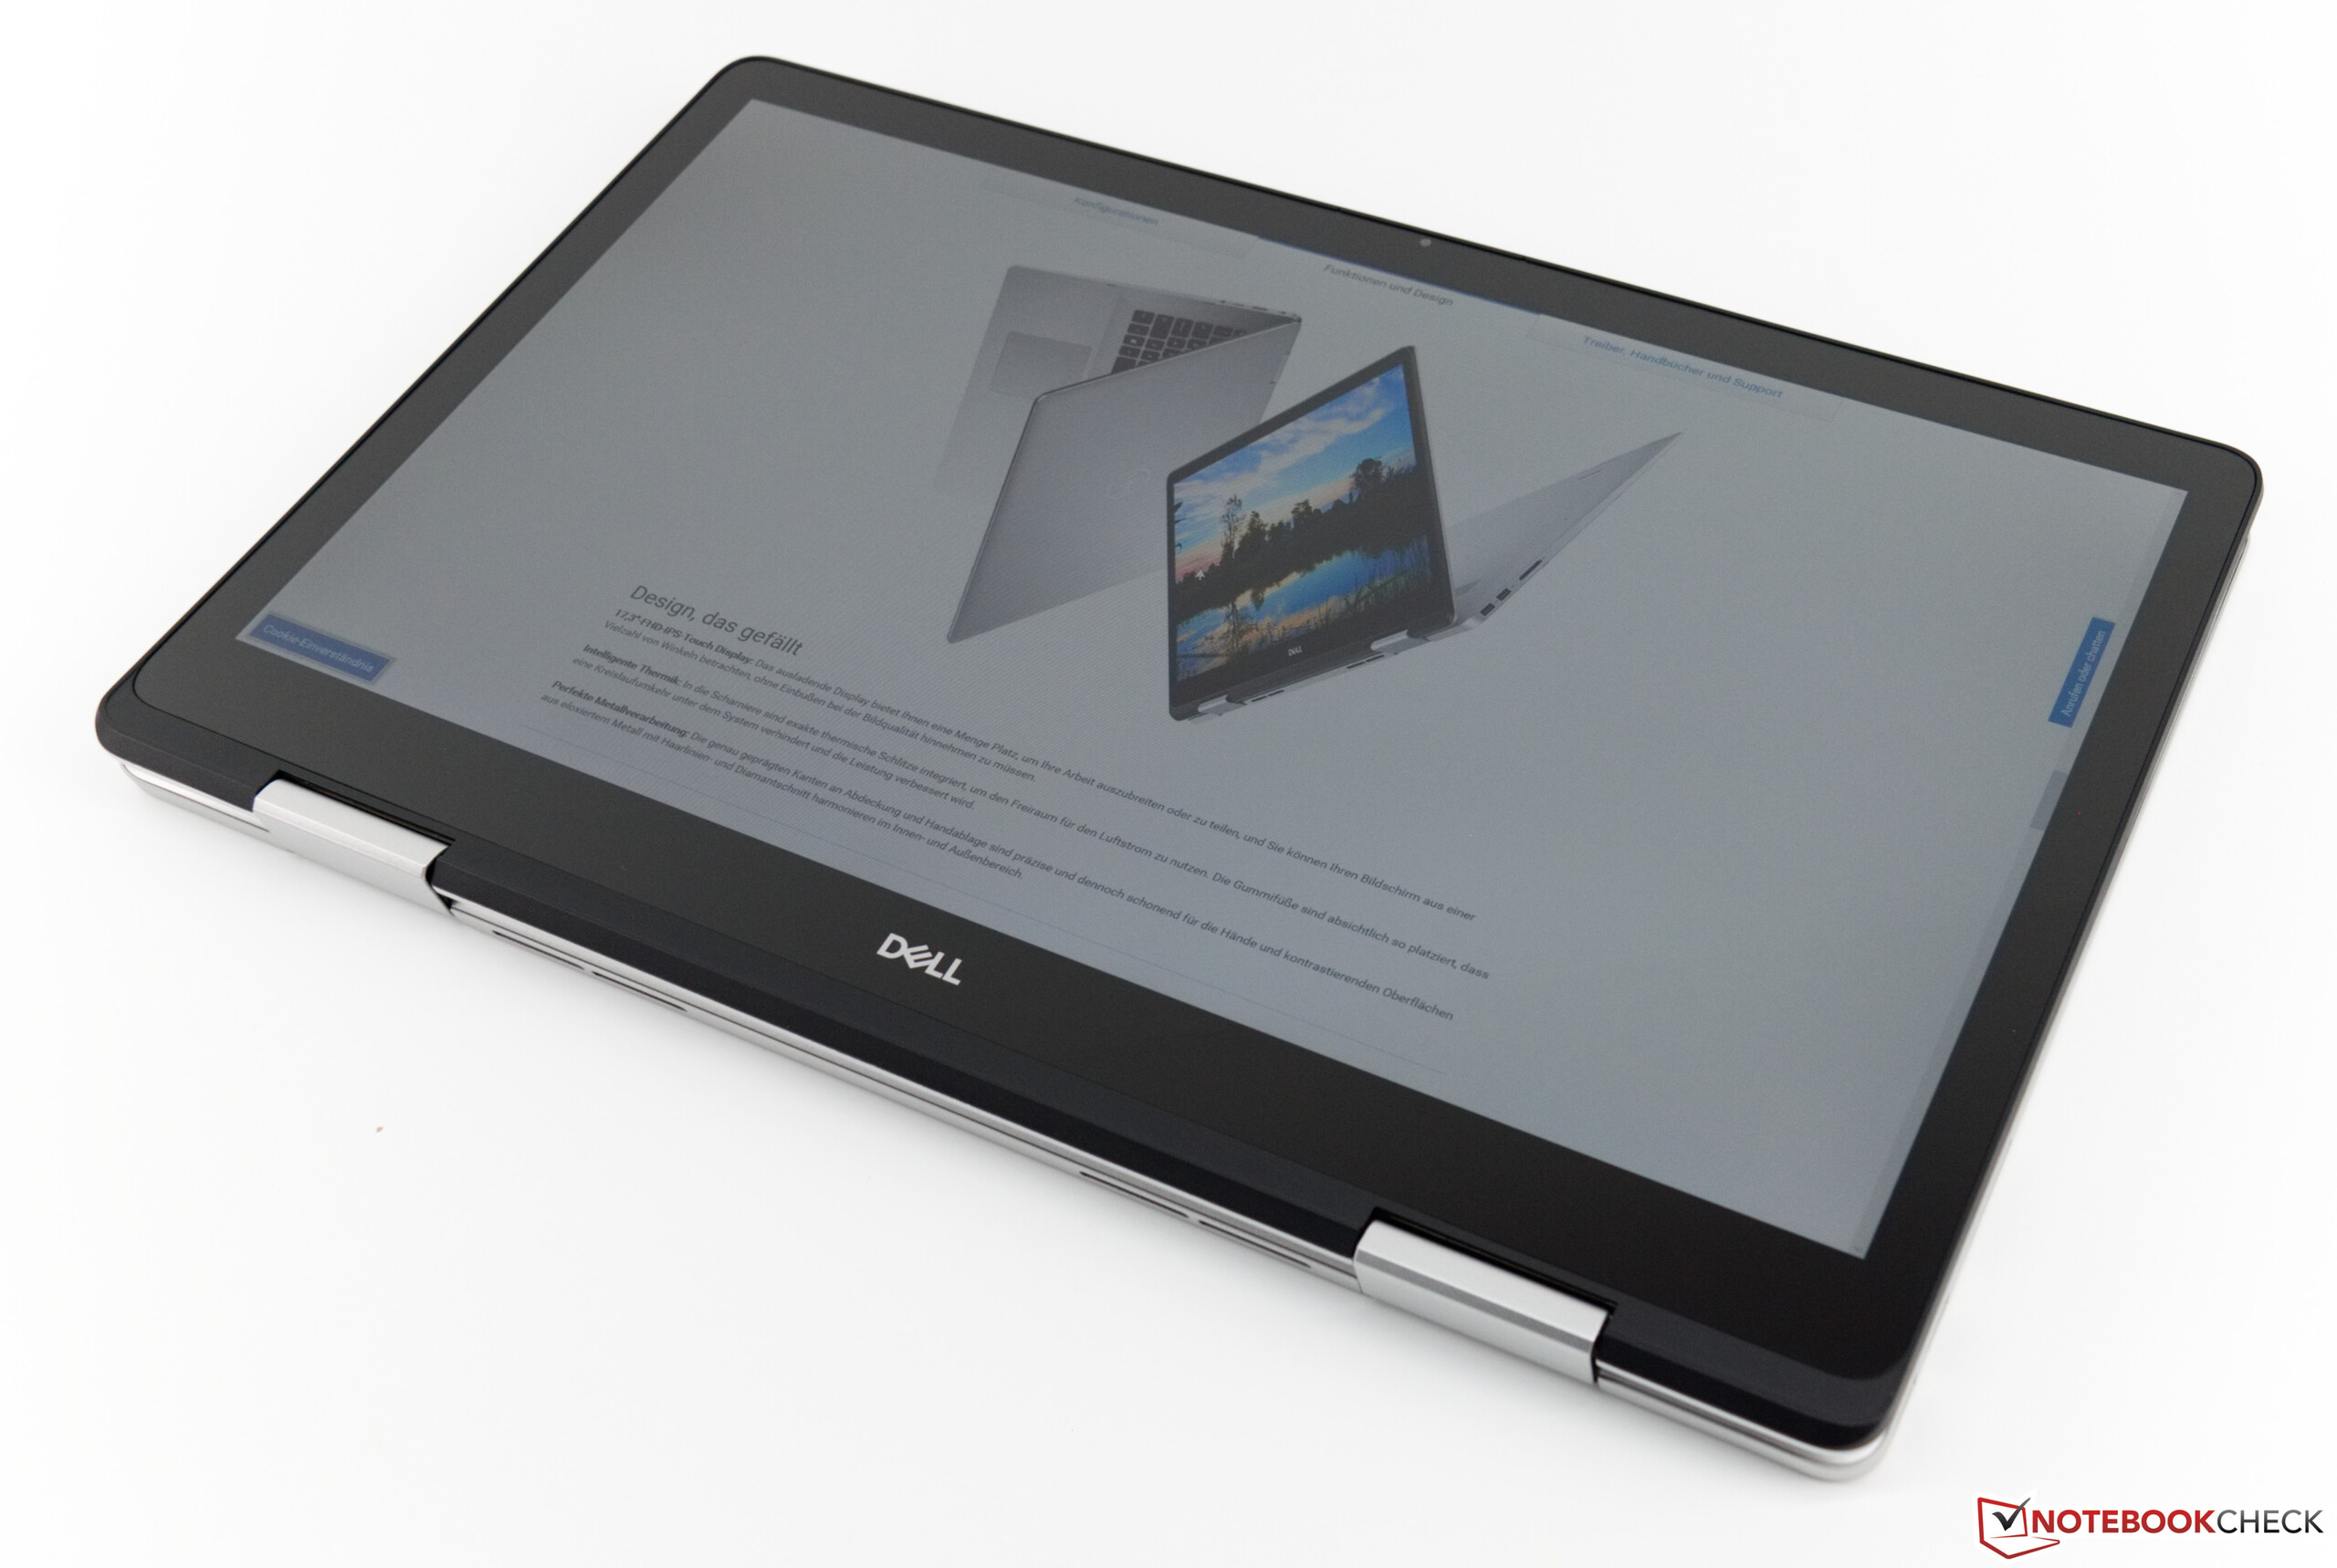
Quem estiver indeciso entre um conversível e um dispositivo multimídia deveria optar simplesmente pelo Dell Inspiron 17-7786. Este portátil de 17 polegadas combina as duas classes de dispositivos, e a GPU dedicada permite que você também possa jogar alguns jogos.
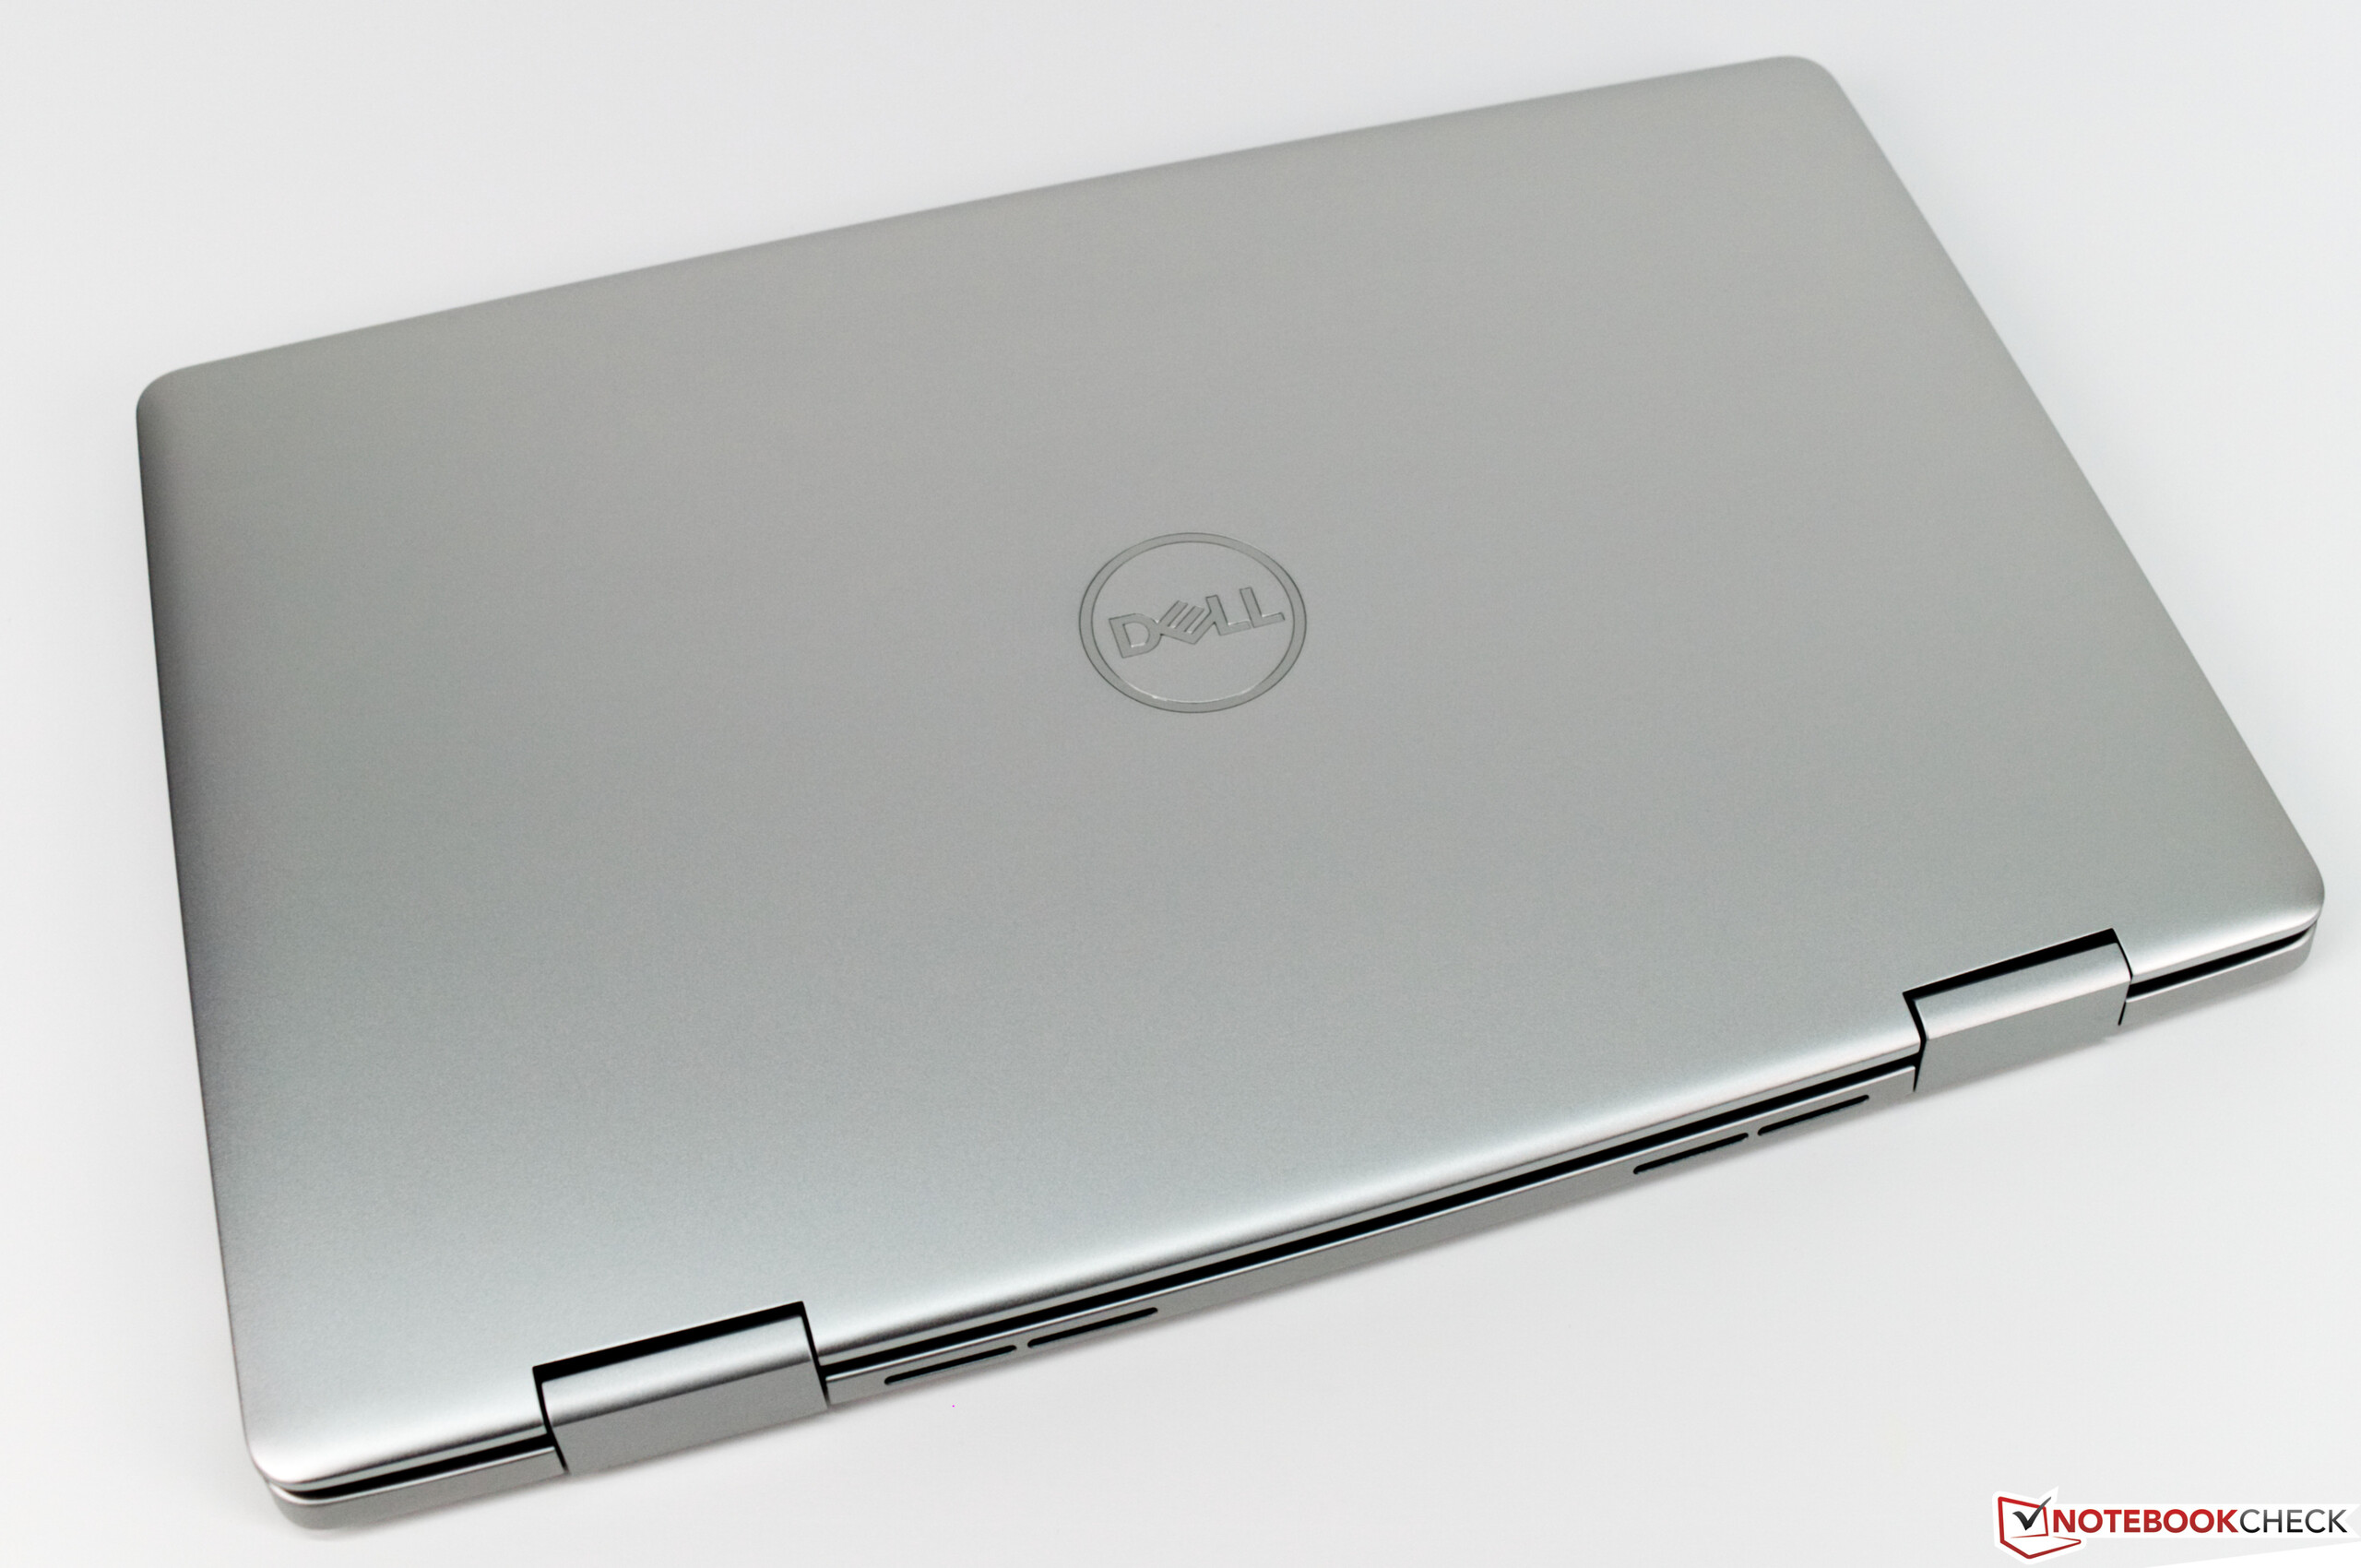
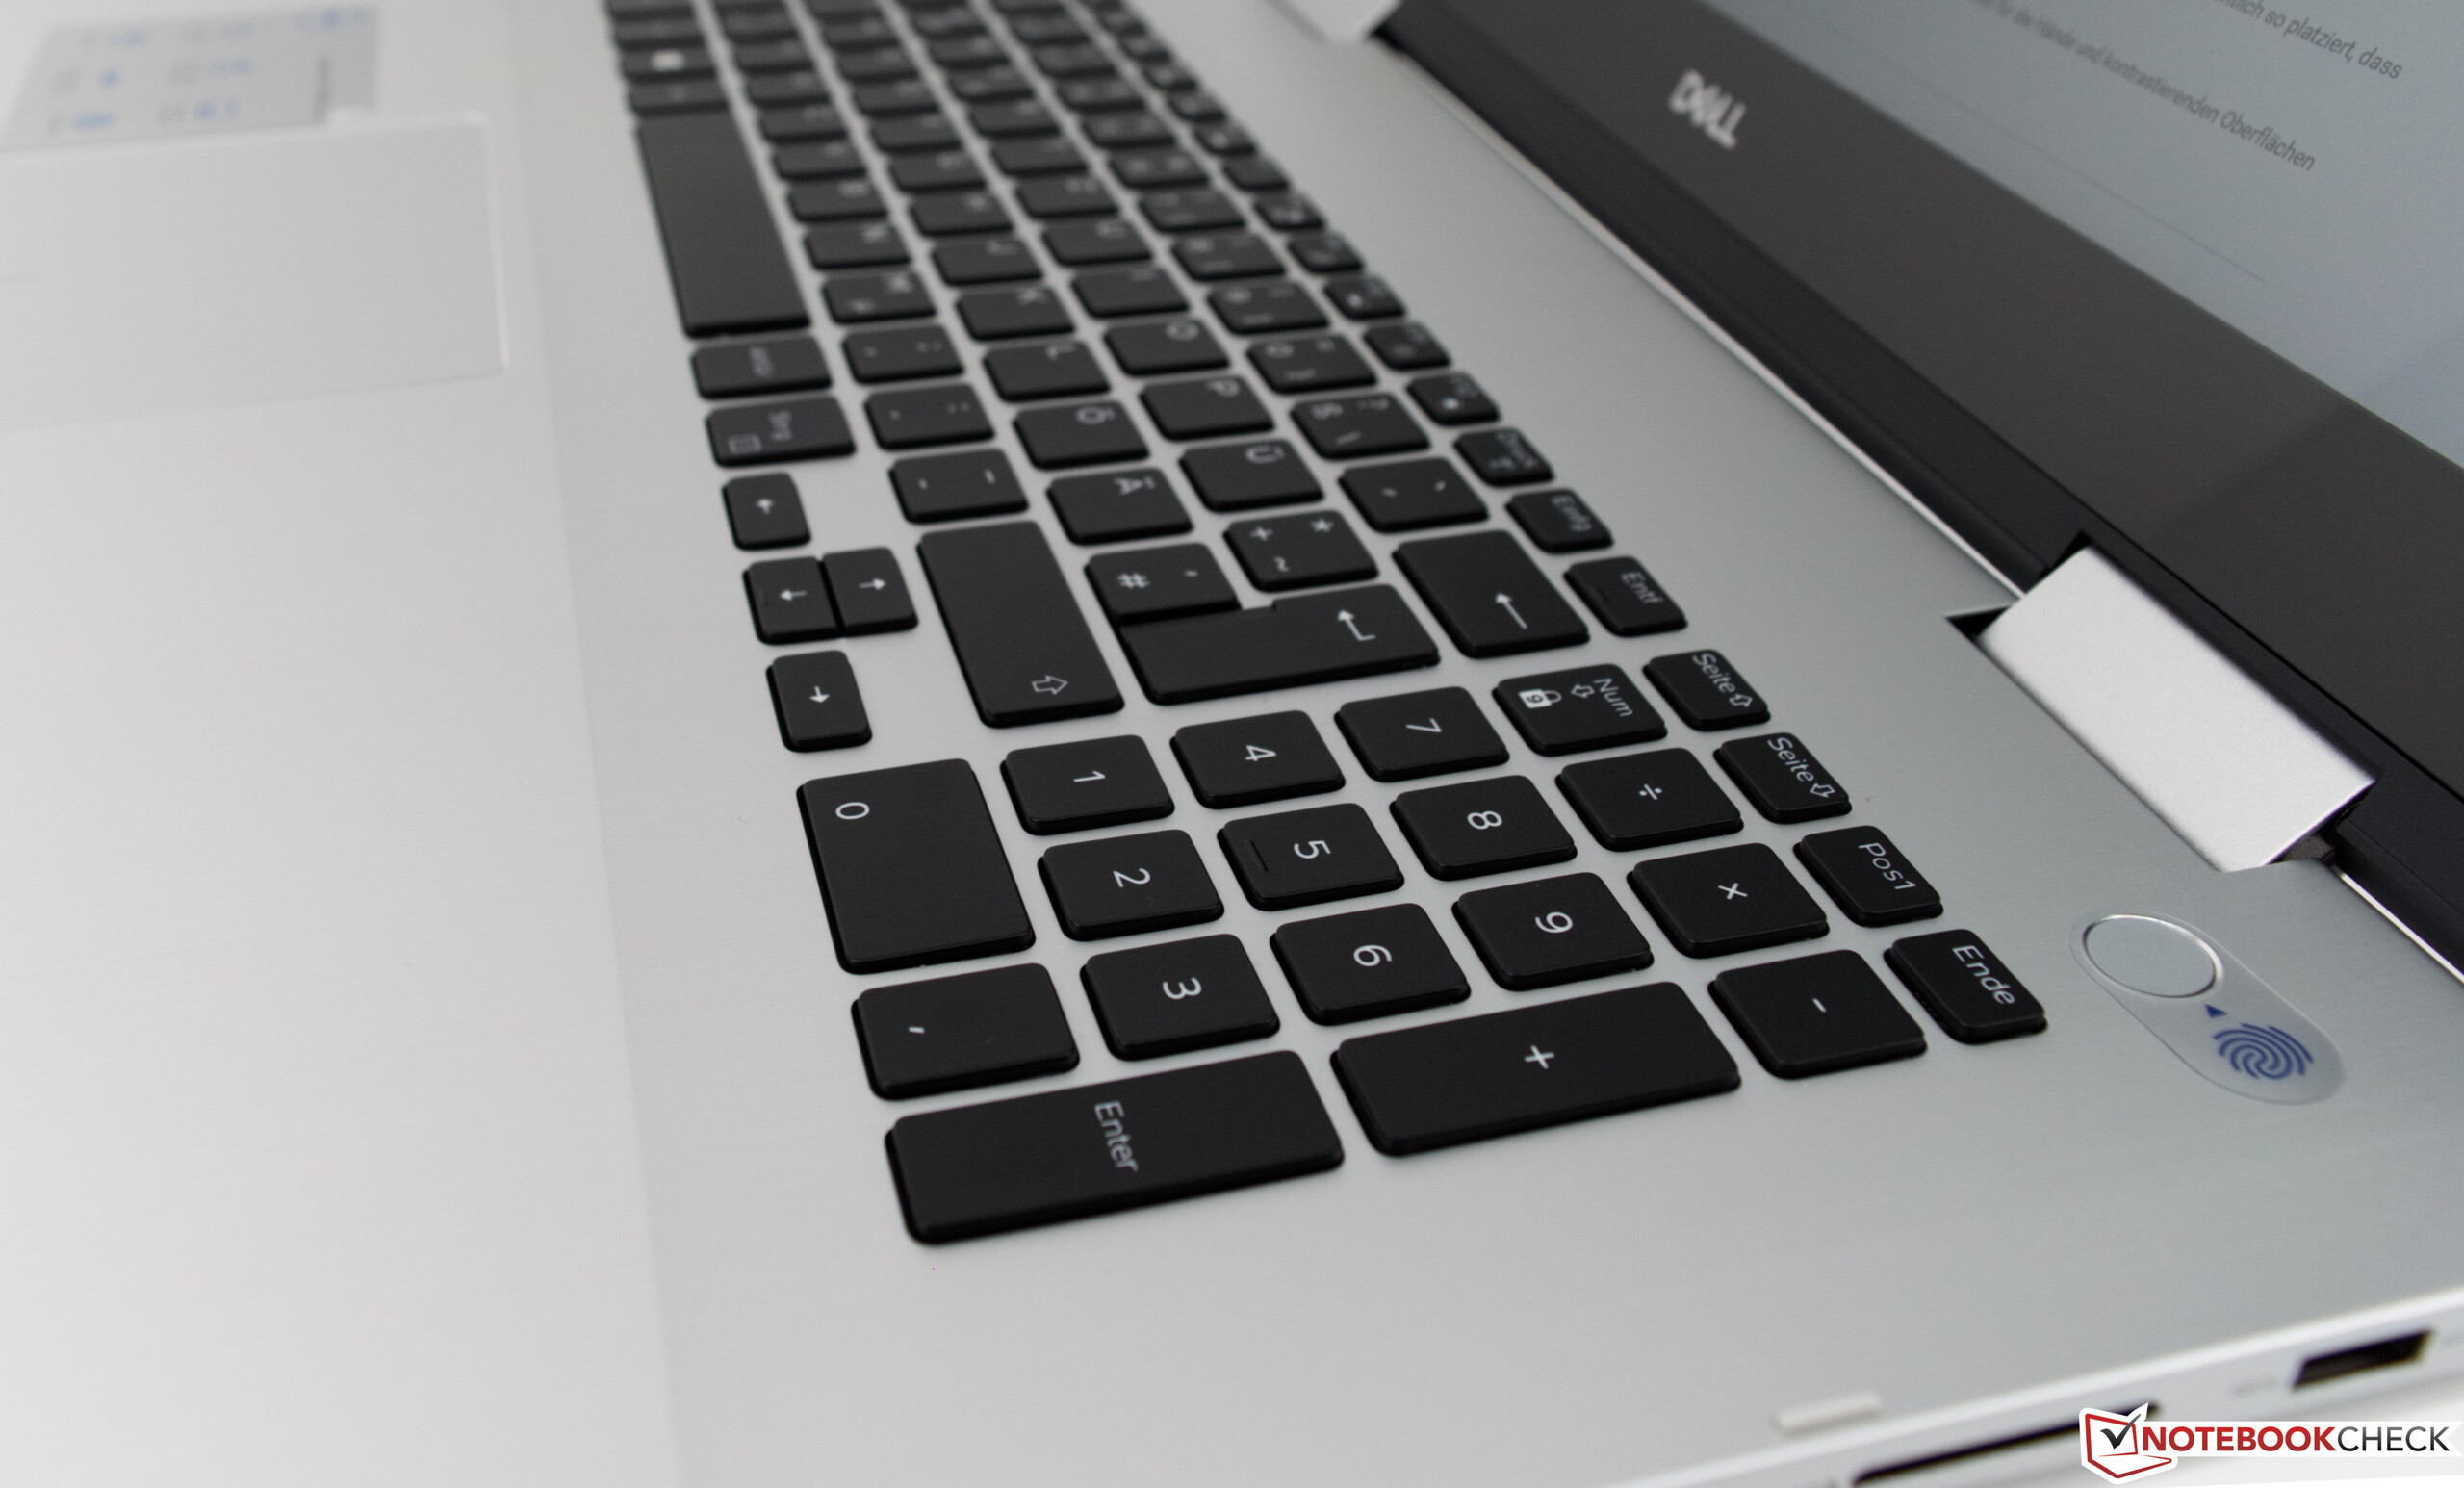
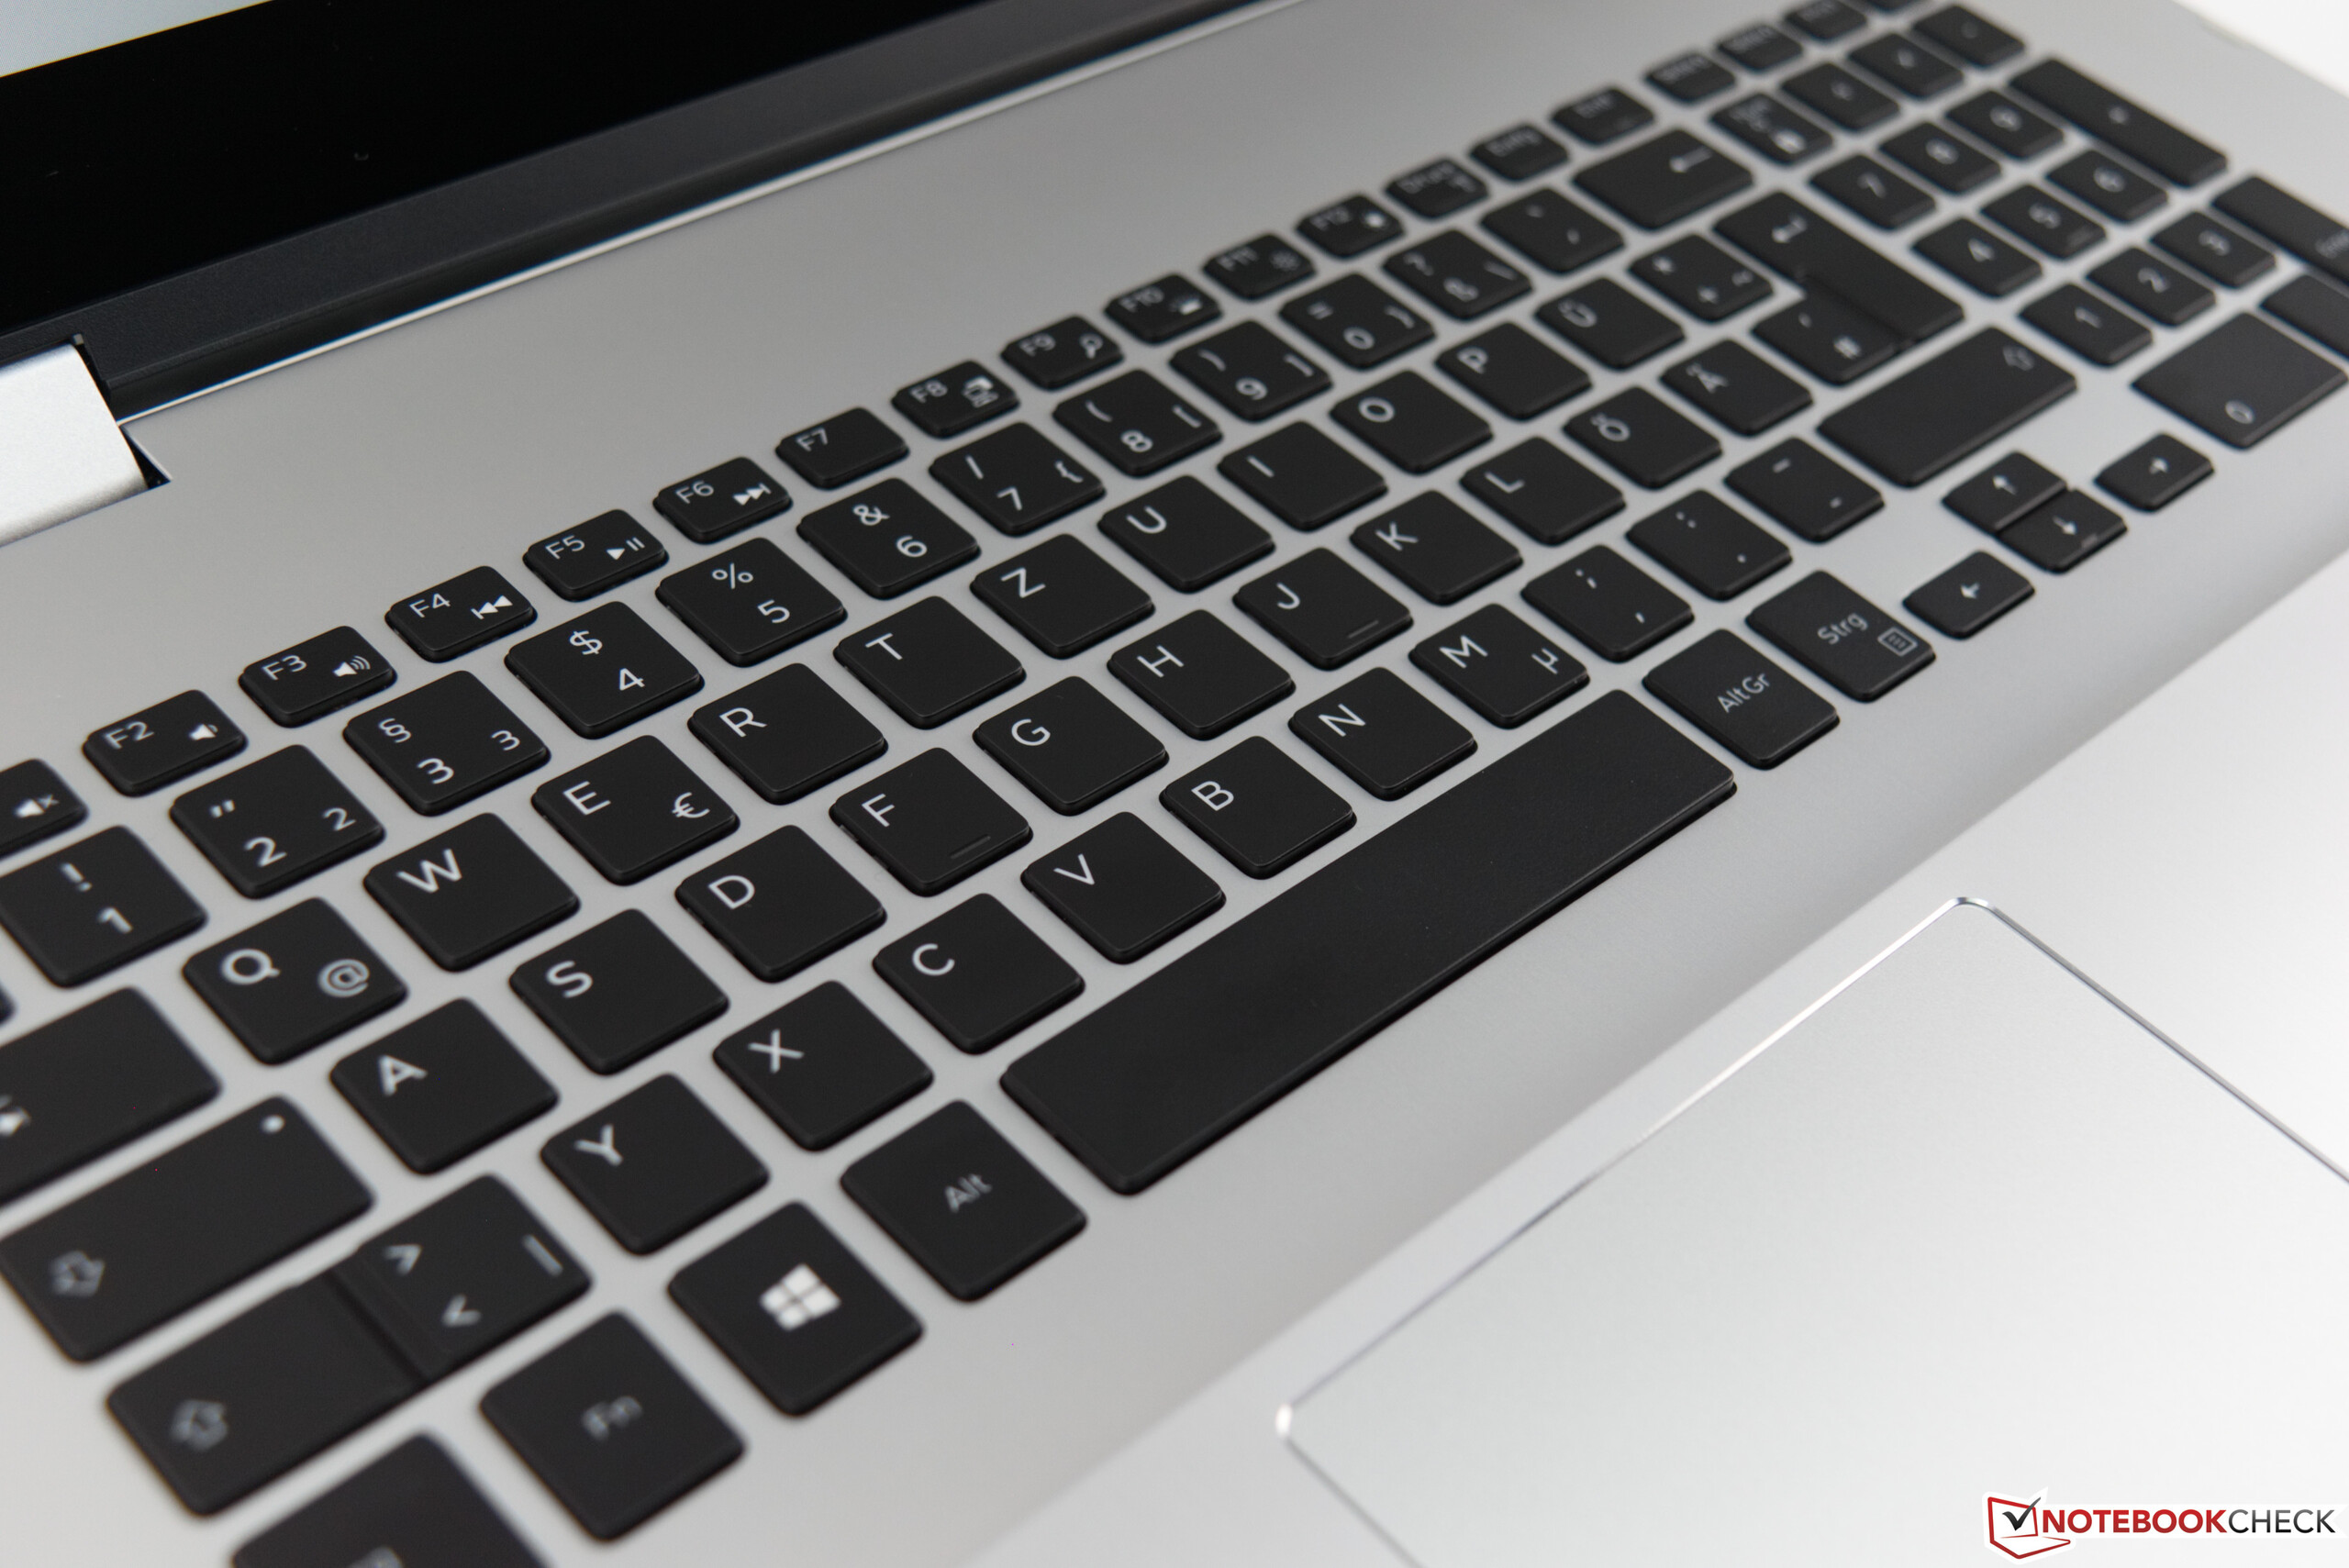
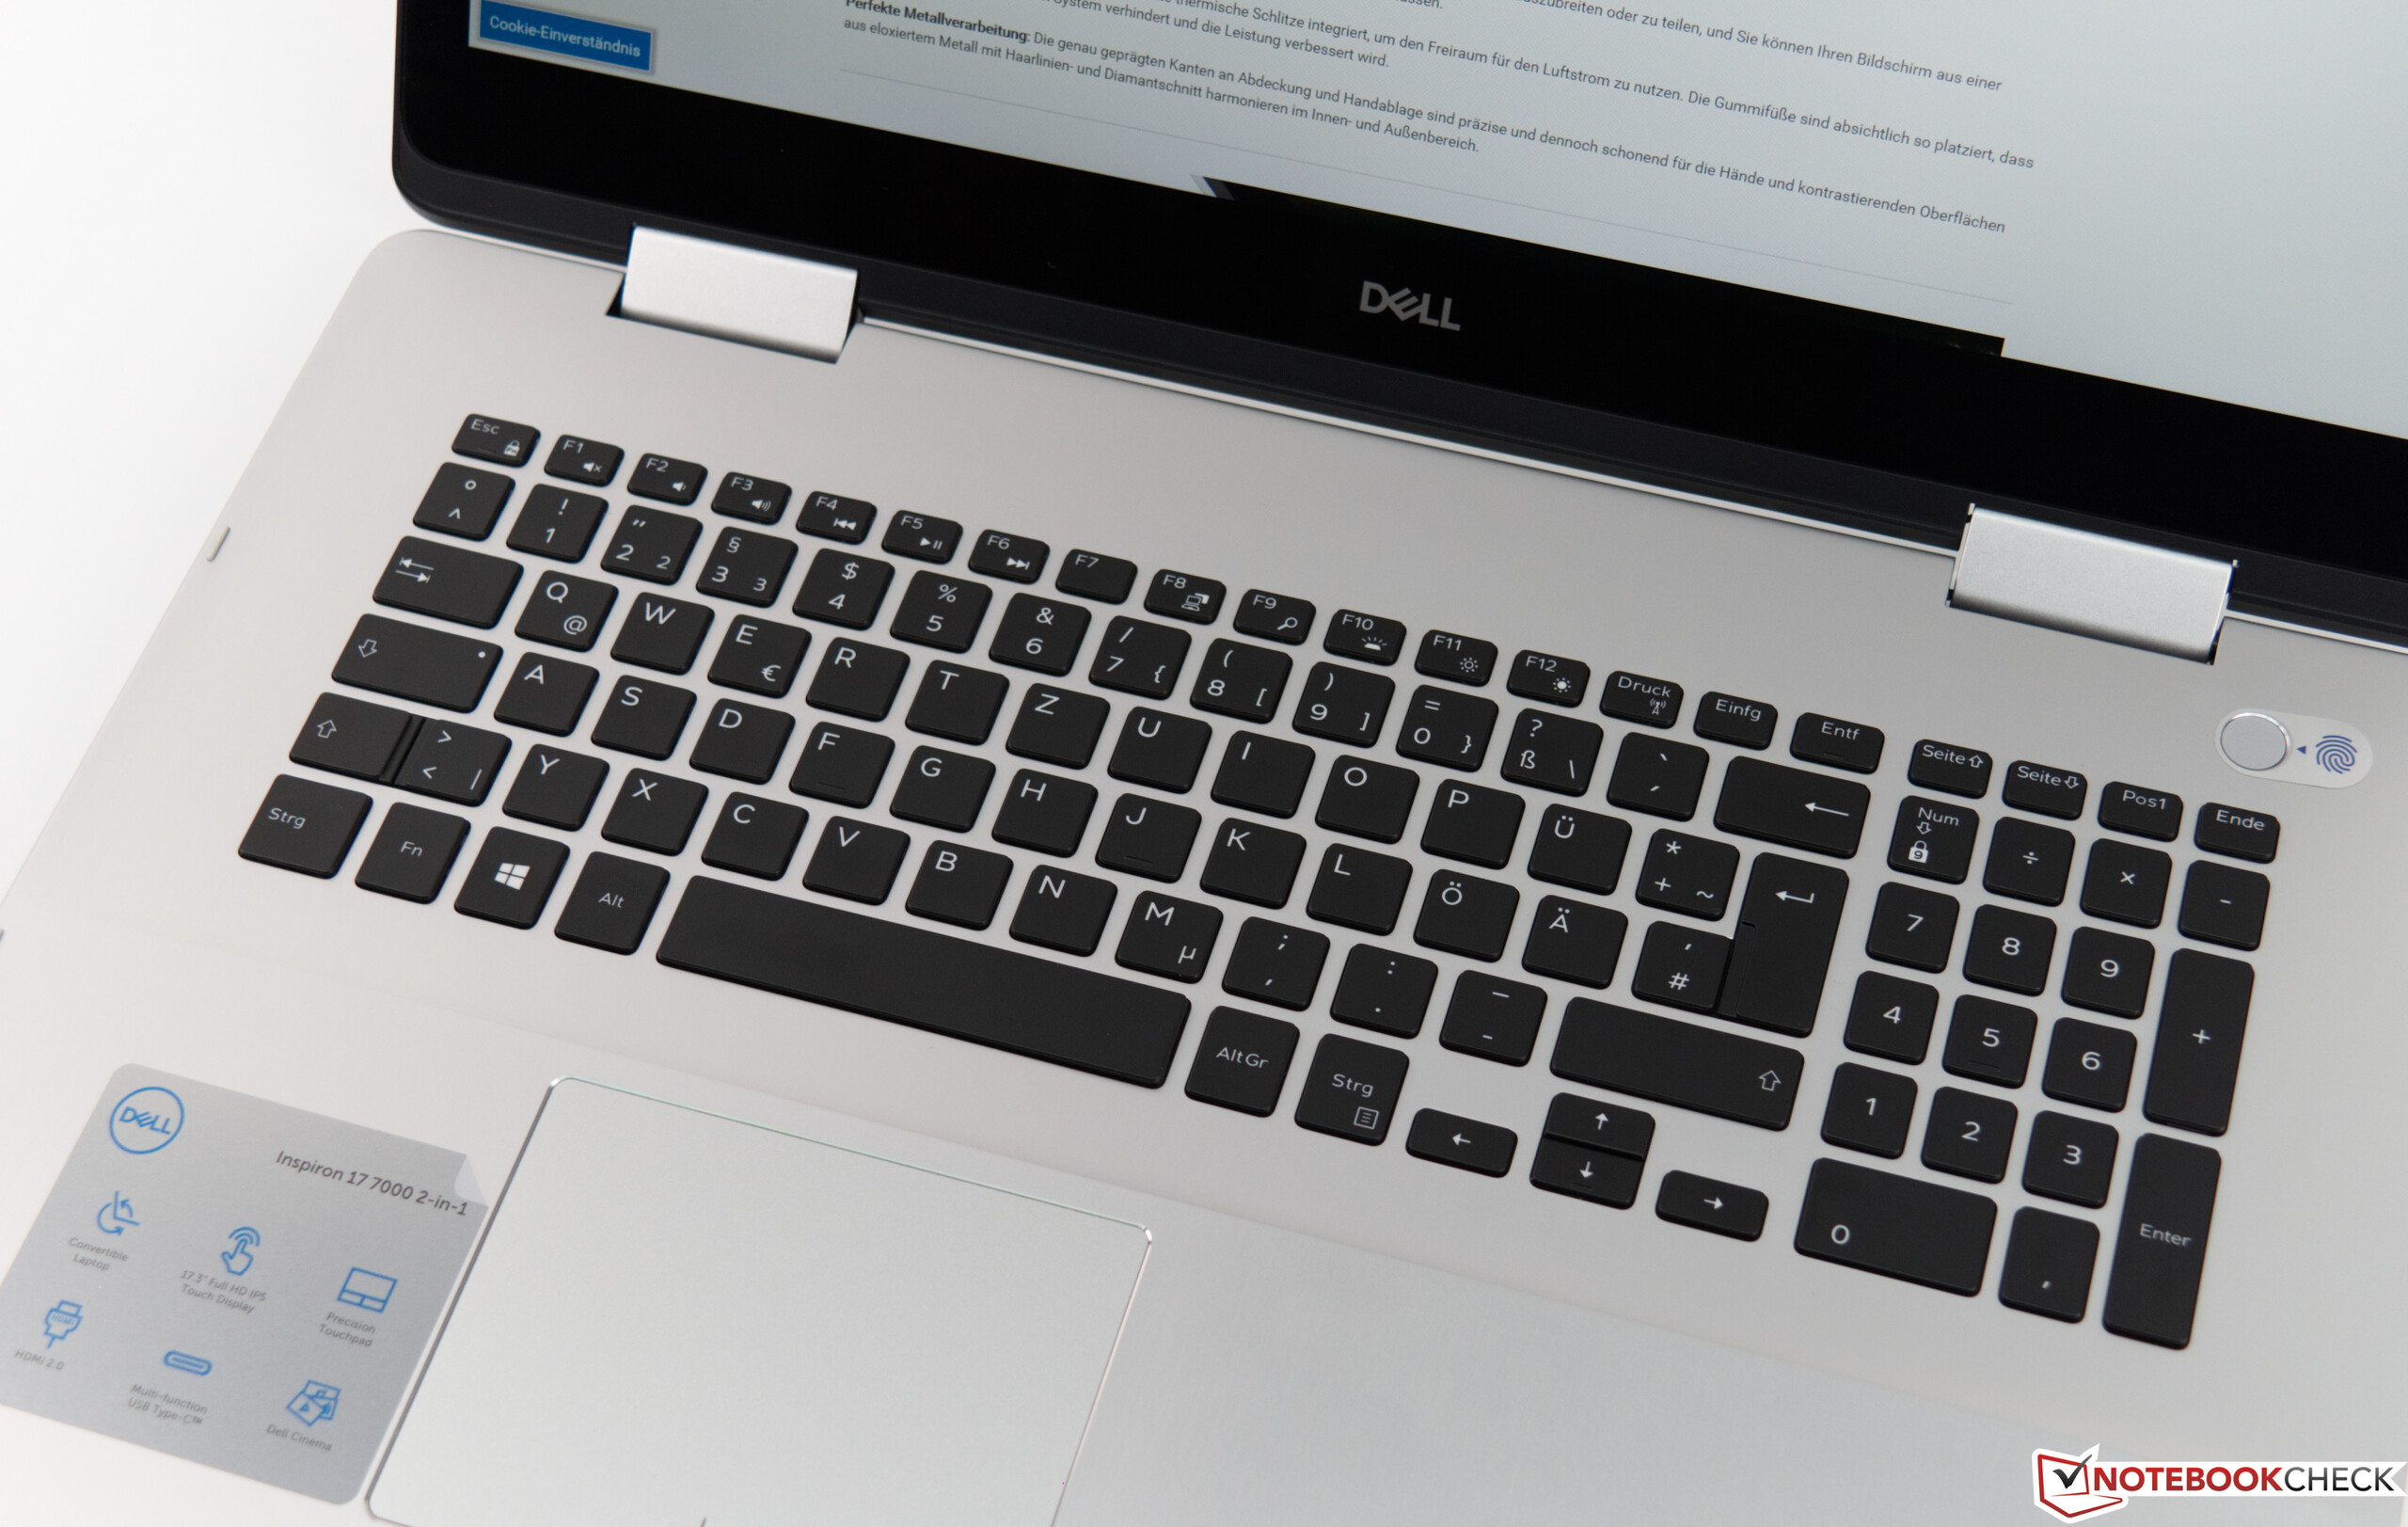
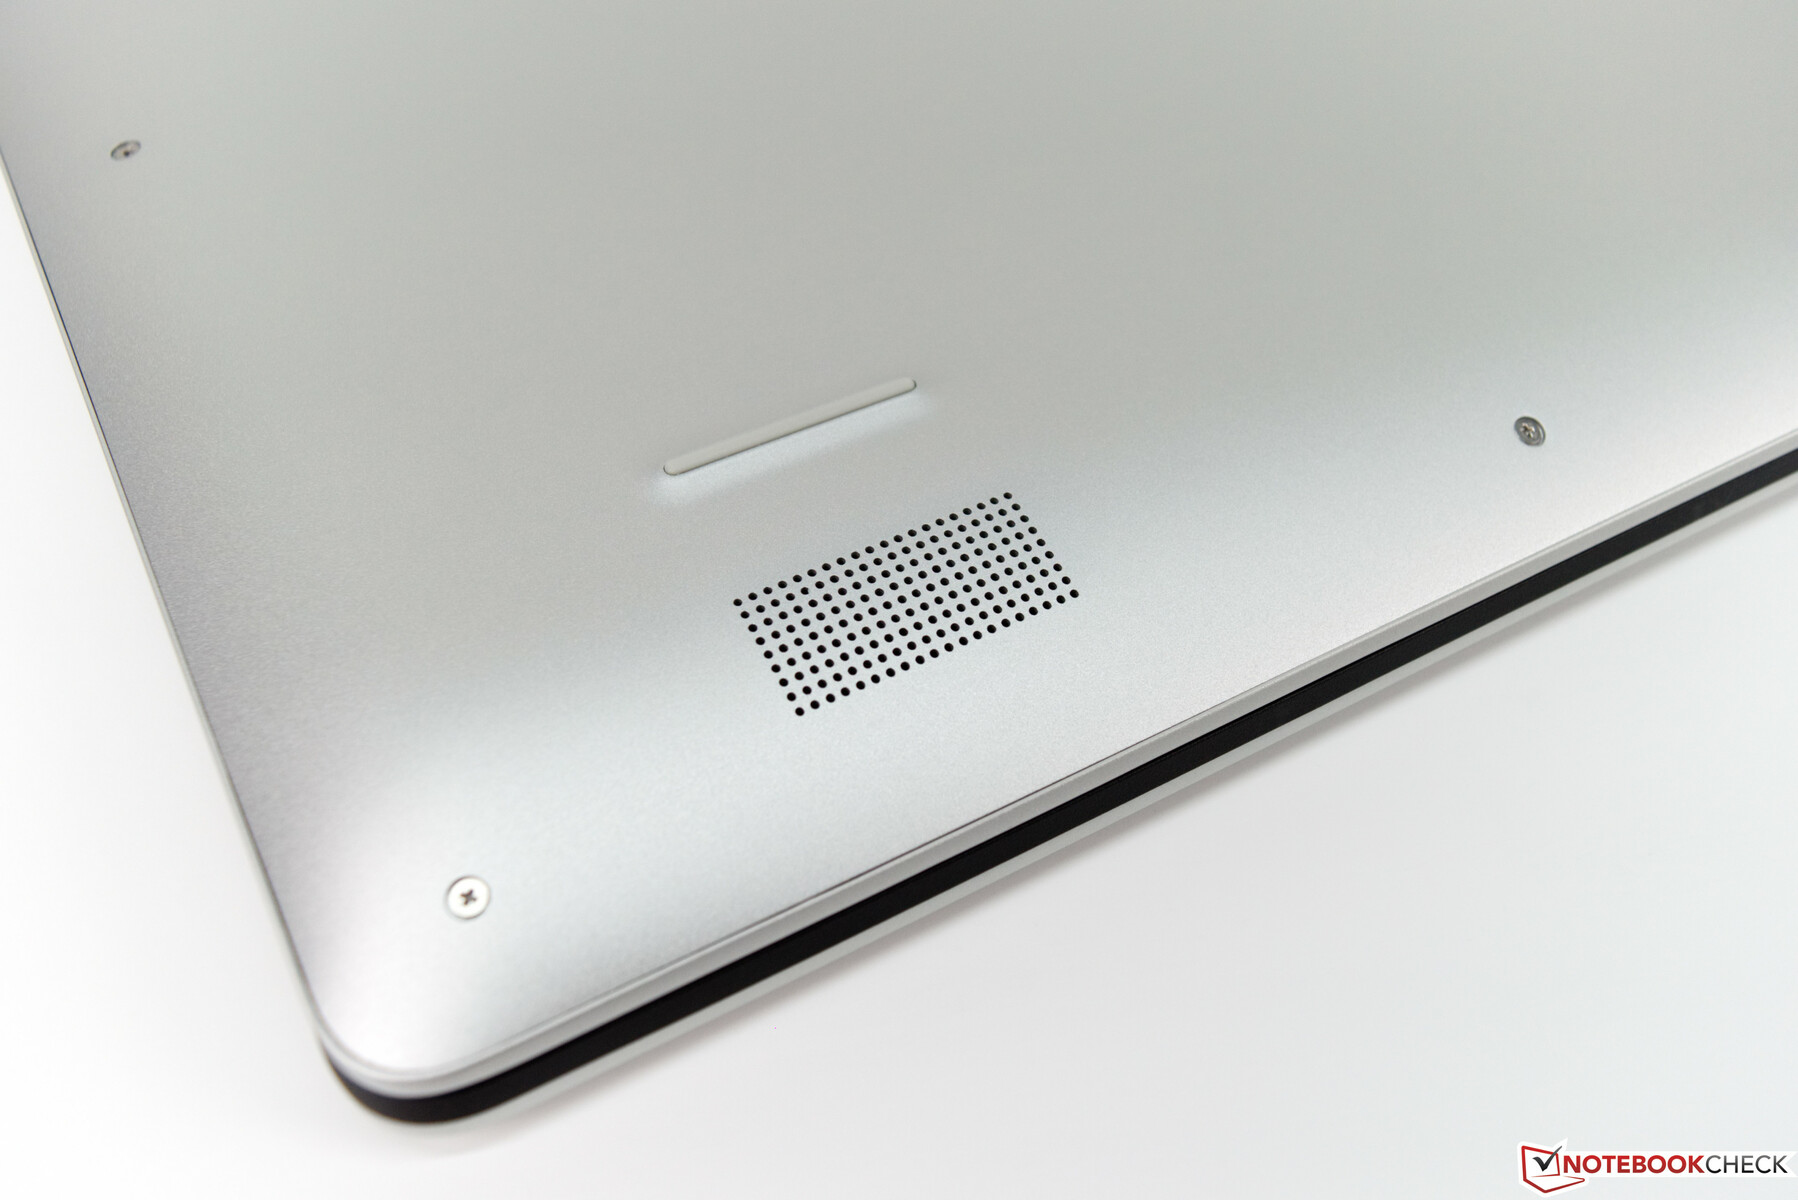
O Dell Inspiron 17-7786 foi capaz de nos convencer com sua excelente seleção de materiais e base robusta. Os dispositivos de entrada são bons e utilizáveis, mesmo que alguns pequenos detalhes impediram uma melhor avaliação. A experiência de digitação é melhor do que com o predecessor, e a altura das teclas também foi ajustada.
Comparado ao predecessor, a tela é ligeiramente mais brilhante e mais responsiva, mas em termos de cobertura de espaço de cor, o dispositivo atual não consegue acompanhar o Inspiron 17-7773. Devido à superfície fortemente refletiva, o brilho aprimorado não é capaz de fazer uma diferença positiva ao usar o dispositivo em exteriores.
No geral, o Dell Inspiron 17-7786 é uma atualização bem-sucedida com um consumo de energia significativamente aprimorado e também uma duração de bateria consideravelmente maior.
Dell Inspiron 17-7786
- 01/31/2019 v6 (old)
Sebastian Bade
Price comparison
