Breve Análise do Conversível Dell Latitude 3390 (Core i5-8250U, Full HD, SSD de 256 GB)
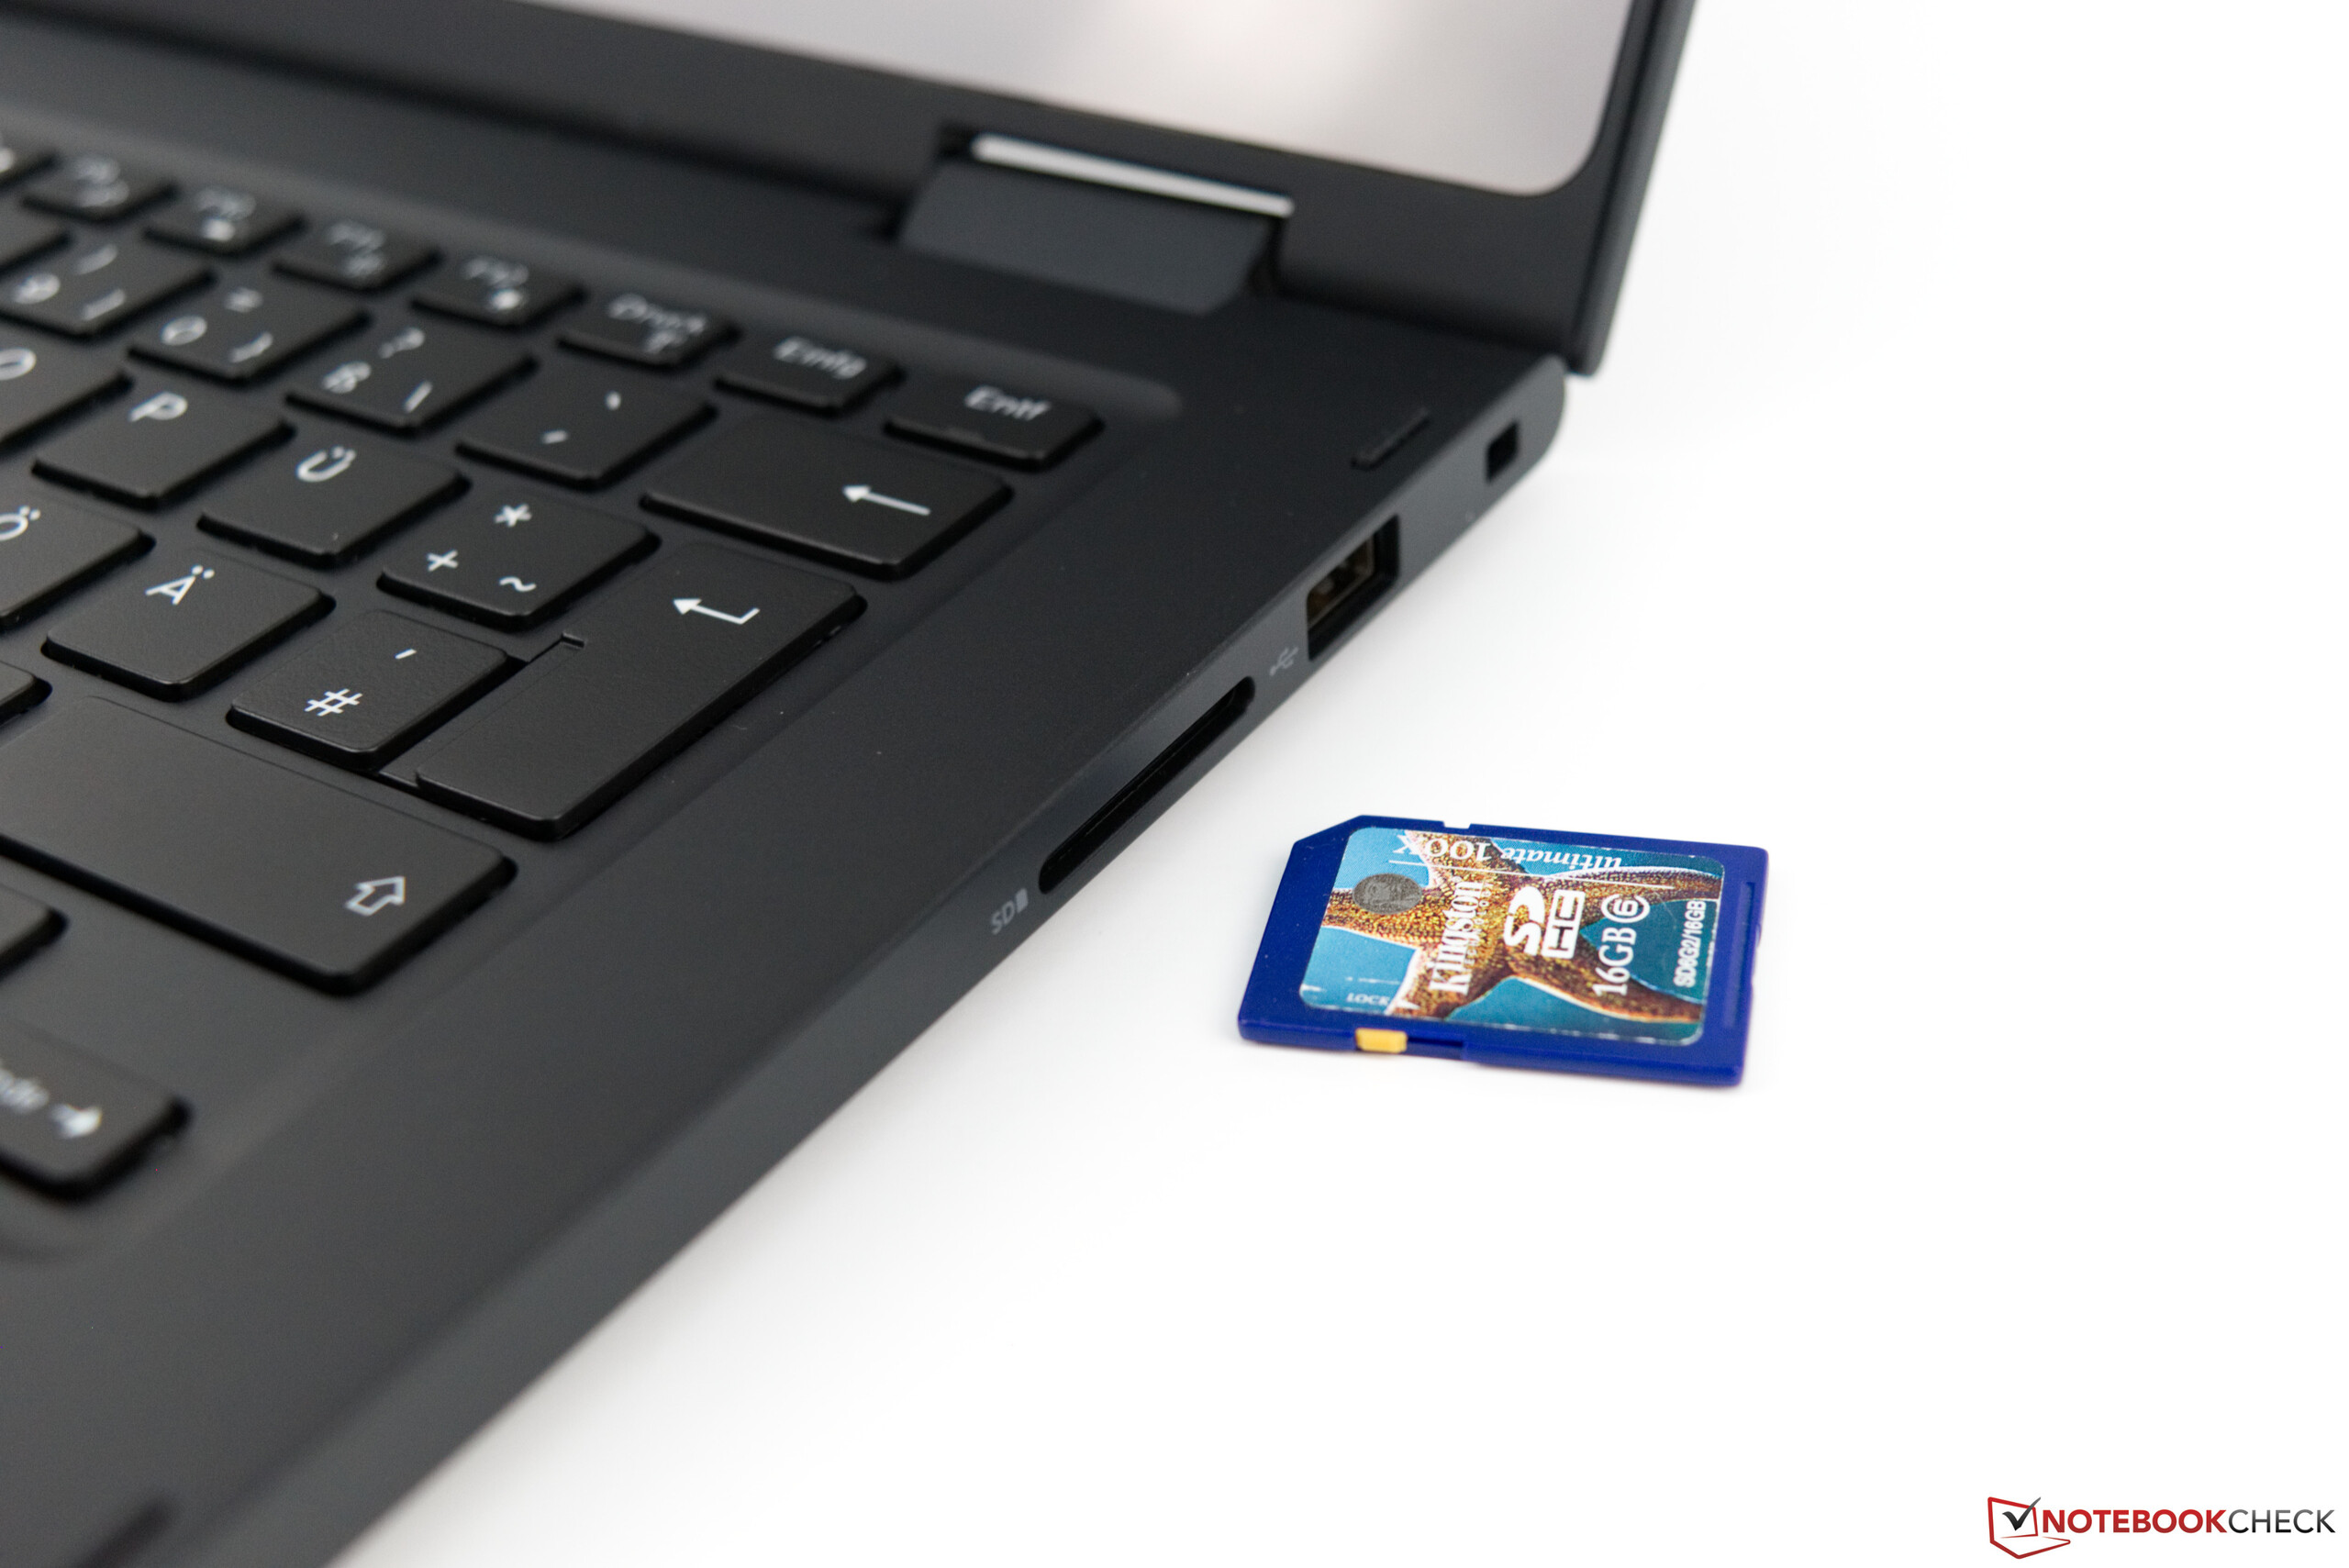
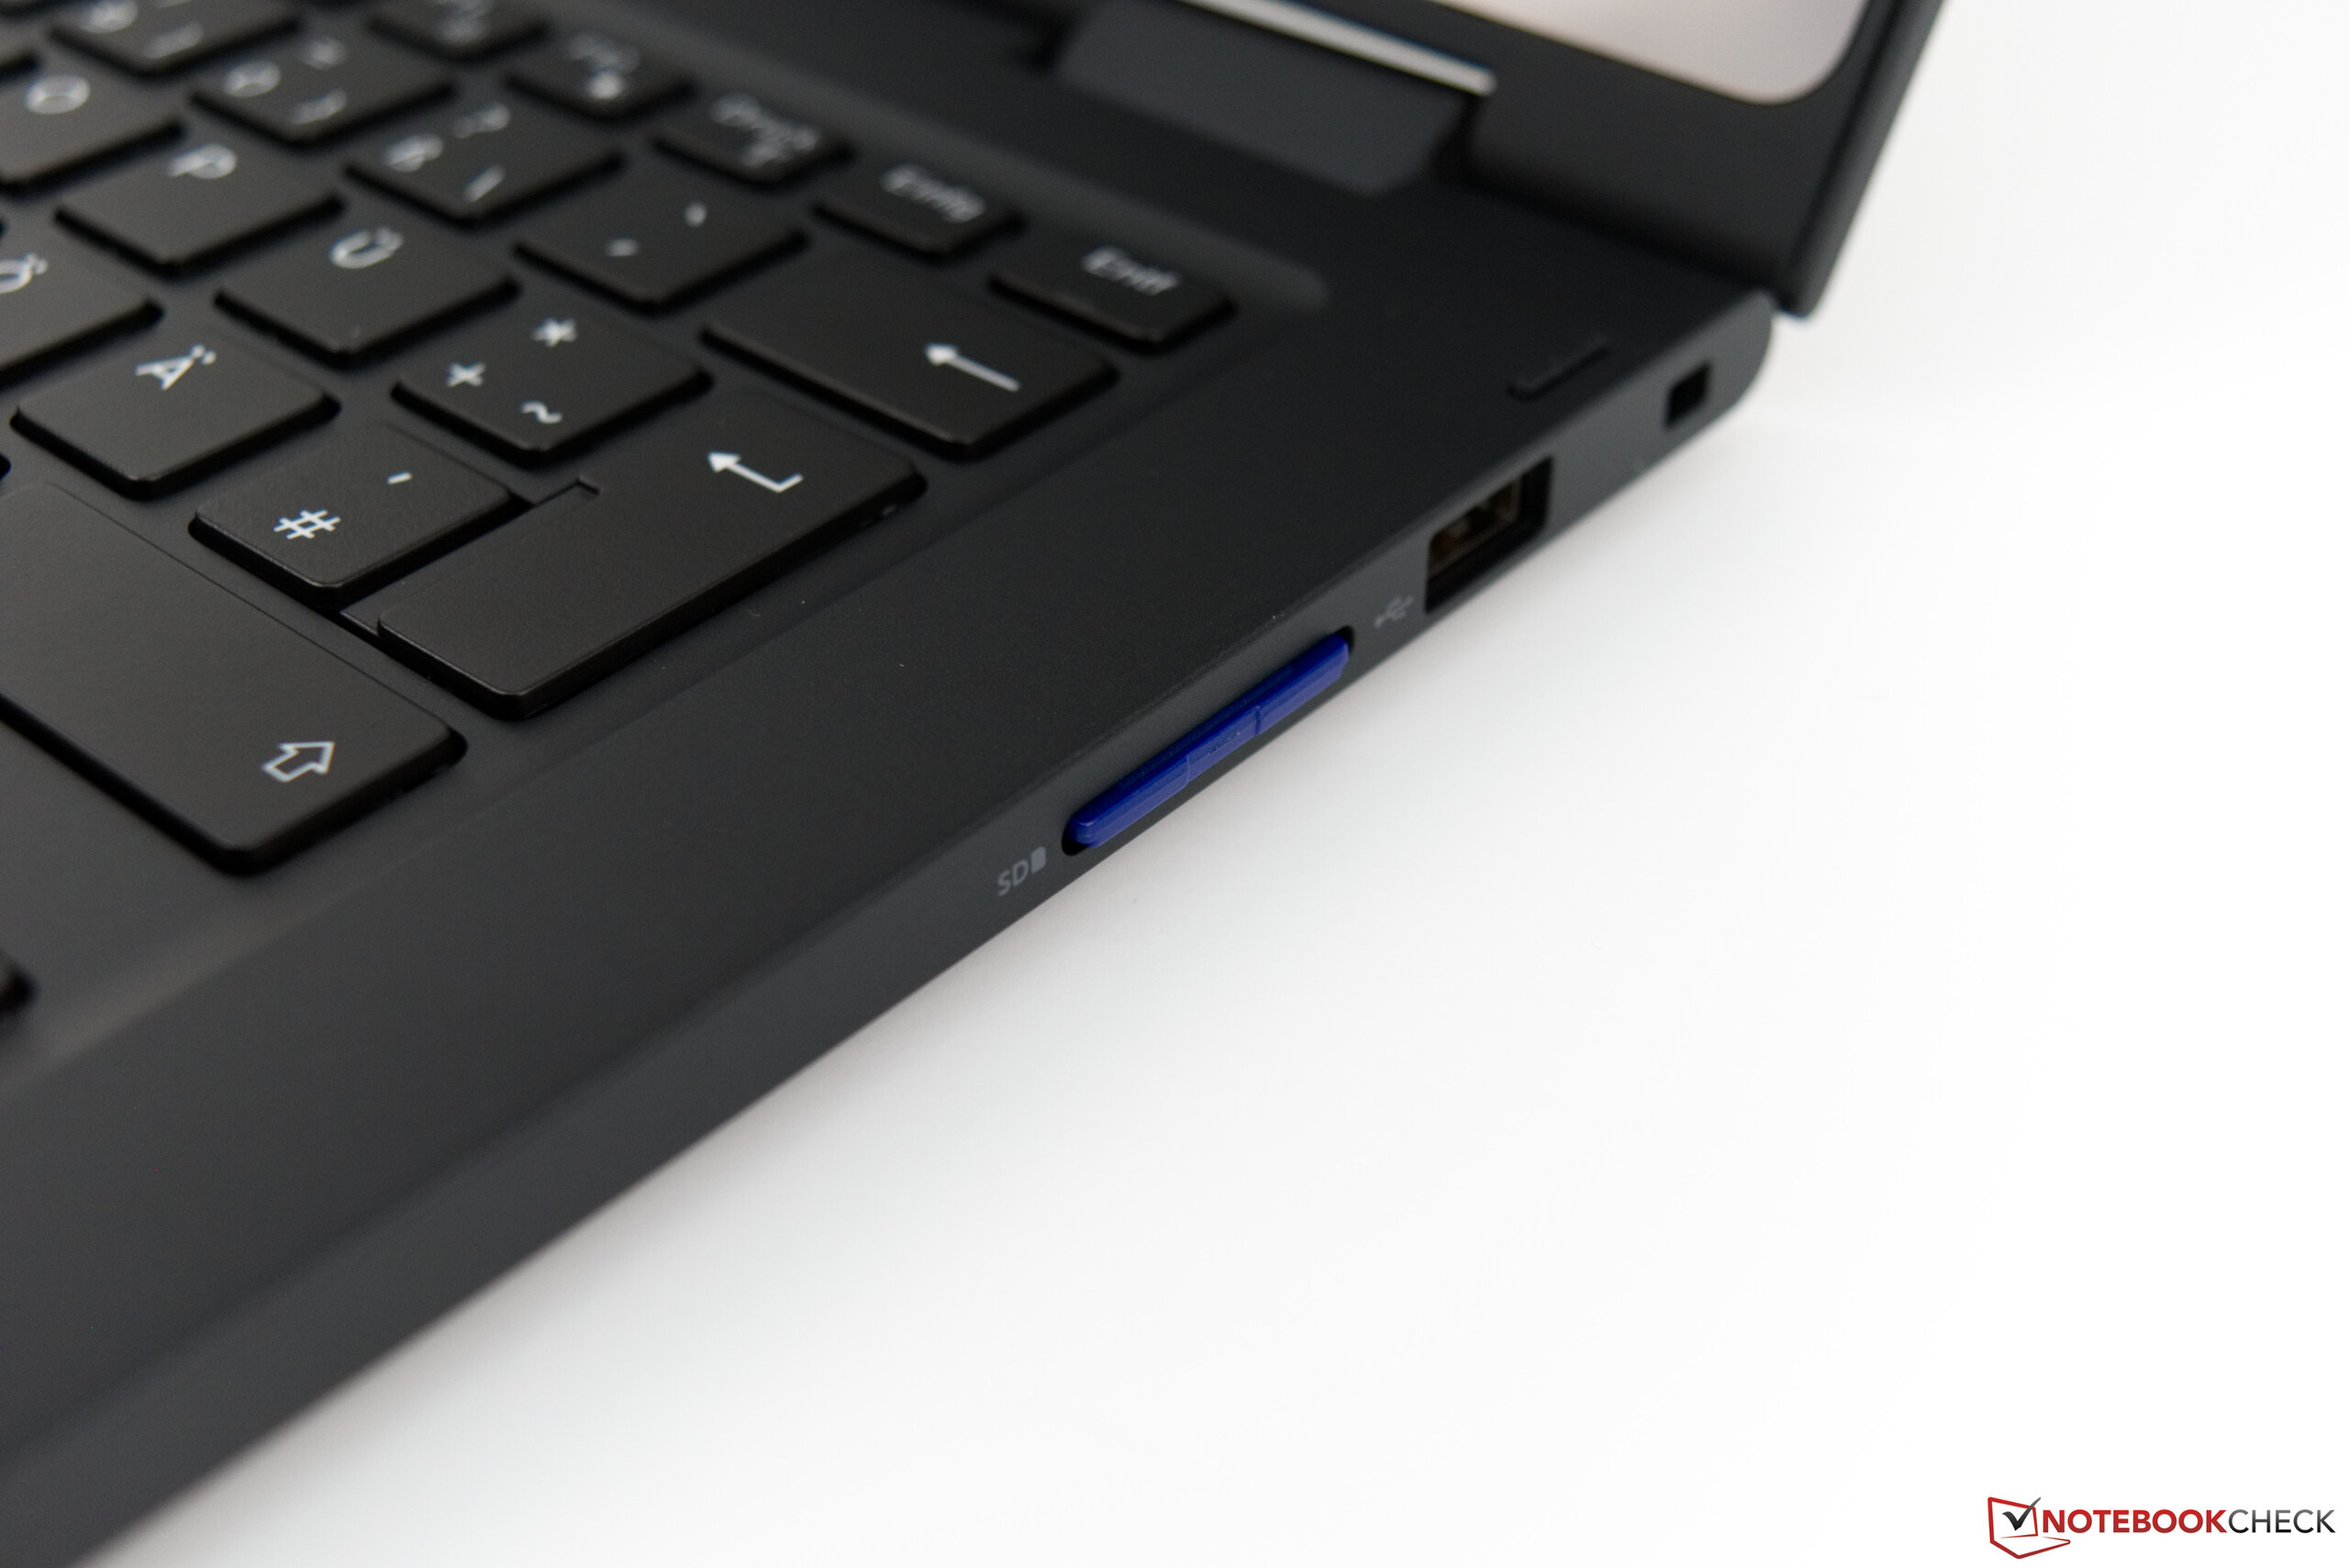
| SD Card Reader | |
| average JPG Copy Test (av. of 3 runs) | |
| HP ProBook x360 440 G1 (Toshiba Exceria Pro M501 microSDXC 64GB) | |
| Lenovo ThinkPad L390 Yoga-20NT000XGE (Toshiba Exceria Pro M501 UHS-II) | |
| Média da turma Convertible (29.4 - 186, n=21, últimos 2 anos) | |
| Asus ZenBook Flip 14 UX461UA (Toshiba Exceria Pro M501 microSDXC 64GB) | |
| Dell Latitude 13 3390 (Toshiba Exceria Pro SDXC 64 GB UHS-II) | |
| maximum AS SSD Seq Read Test (1GB) | |
| Média da turma Convertible (67.5 - 254, n=20, últimos 2 anos) | |
| Lenovo ThinkPad L390 Yoga-20NT000XGE (Toshiba Exceria Pro M501 UHS-II) | |
| HP ProBook x360 440 G1 (Toshiba Exceria Pro M501 microSDXC 64GB) | |
| Asus ZenBook Flip 14 UX461UA (Toshiba Exceria Pro M501 microSDXC 64GB) | |
| Dell Latitude 13 3390 (Toshiba Exceria Pro SDXC 64 GB UHS-II) | |
| |||||||||||||||||||||||||
iluminação: 82 %
iluminação com acumulador: 276 cd/m²
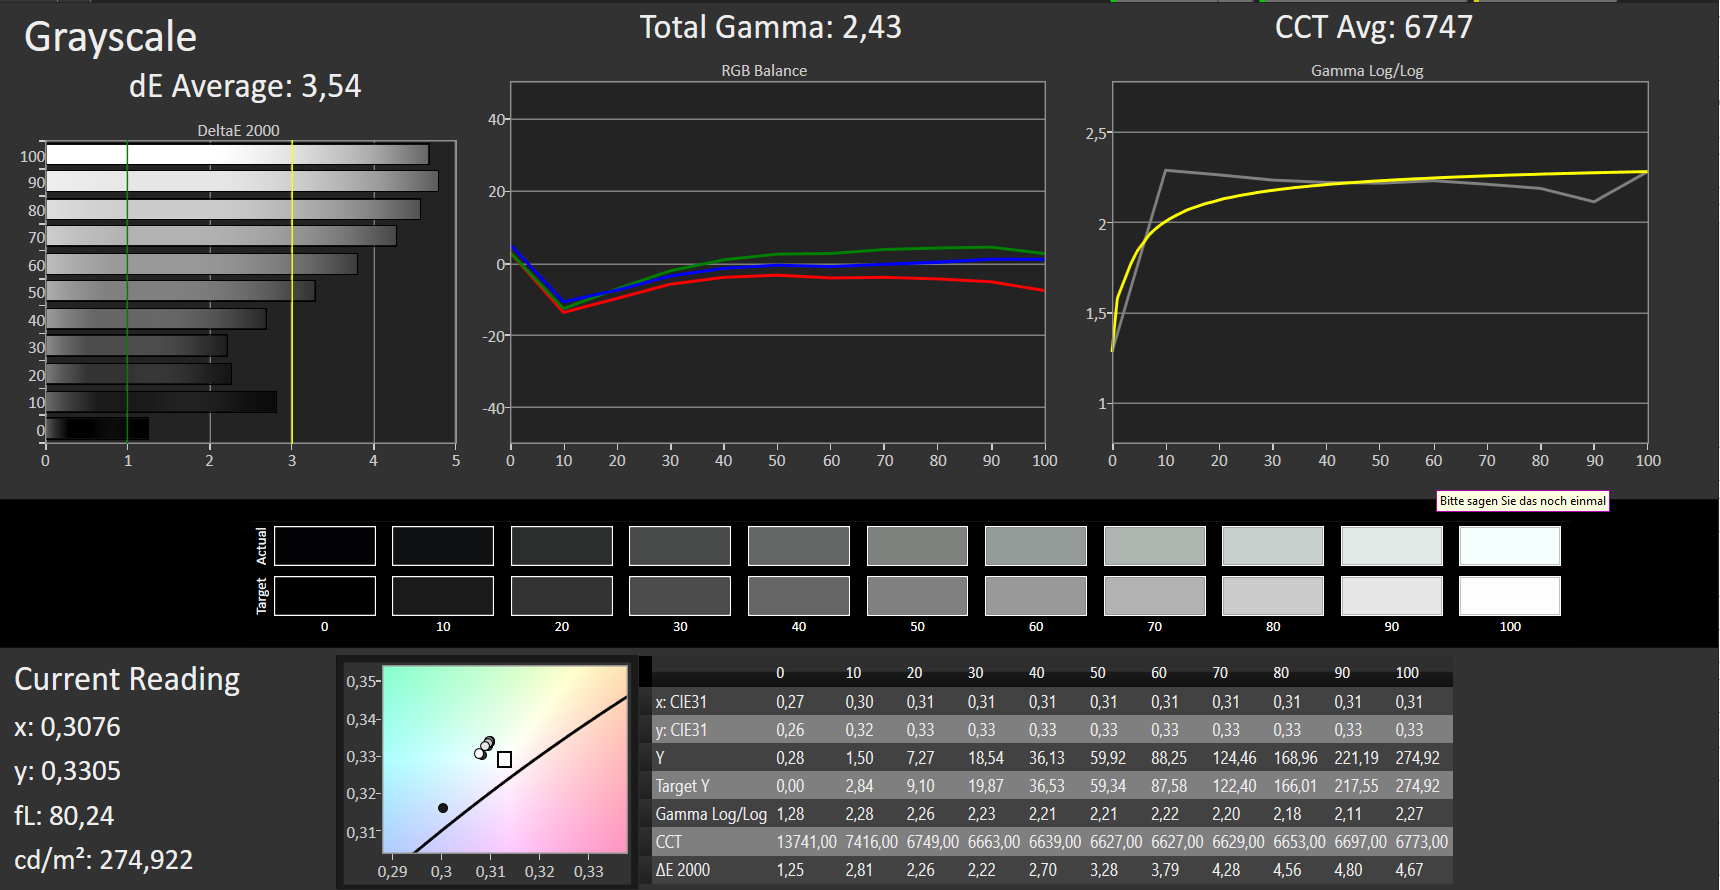
Contraste: 952:1 (Preto: 0.29 cd/m²)
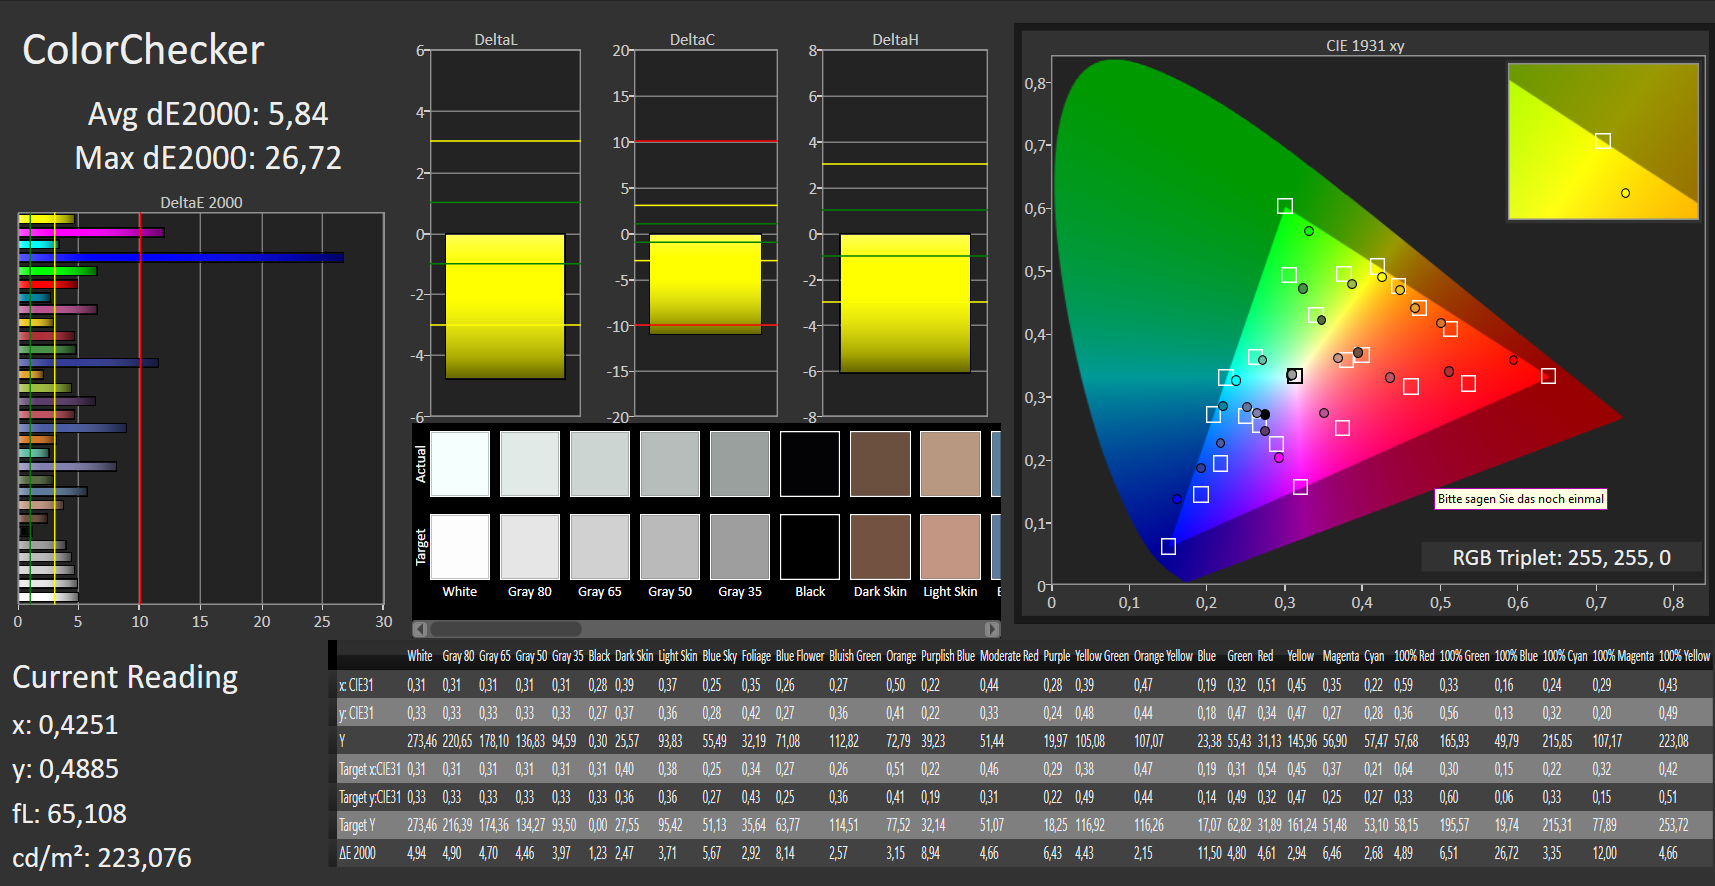
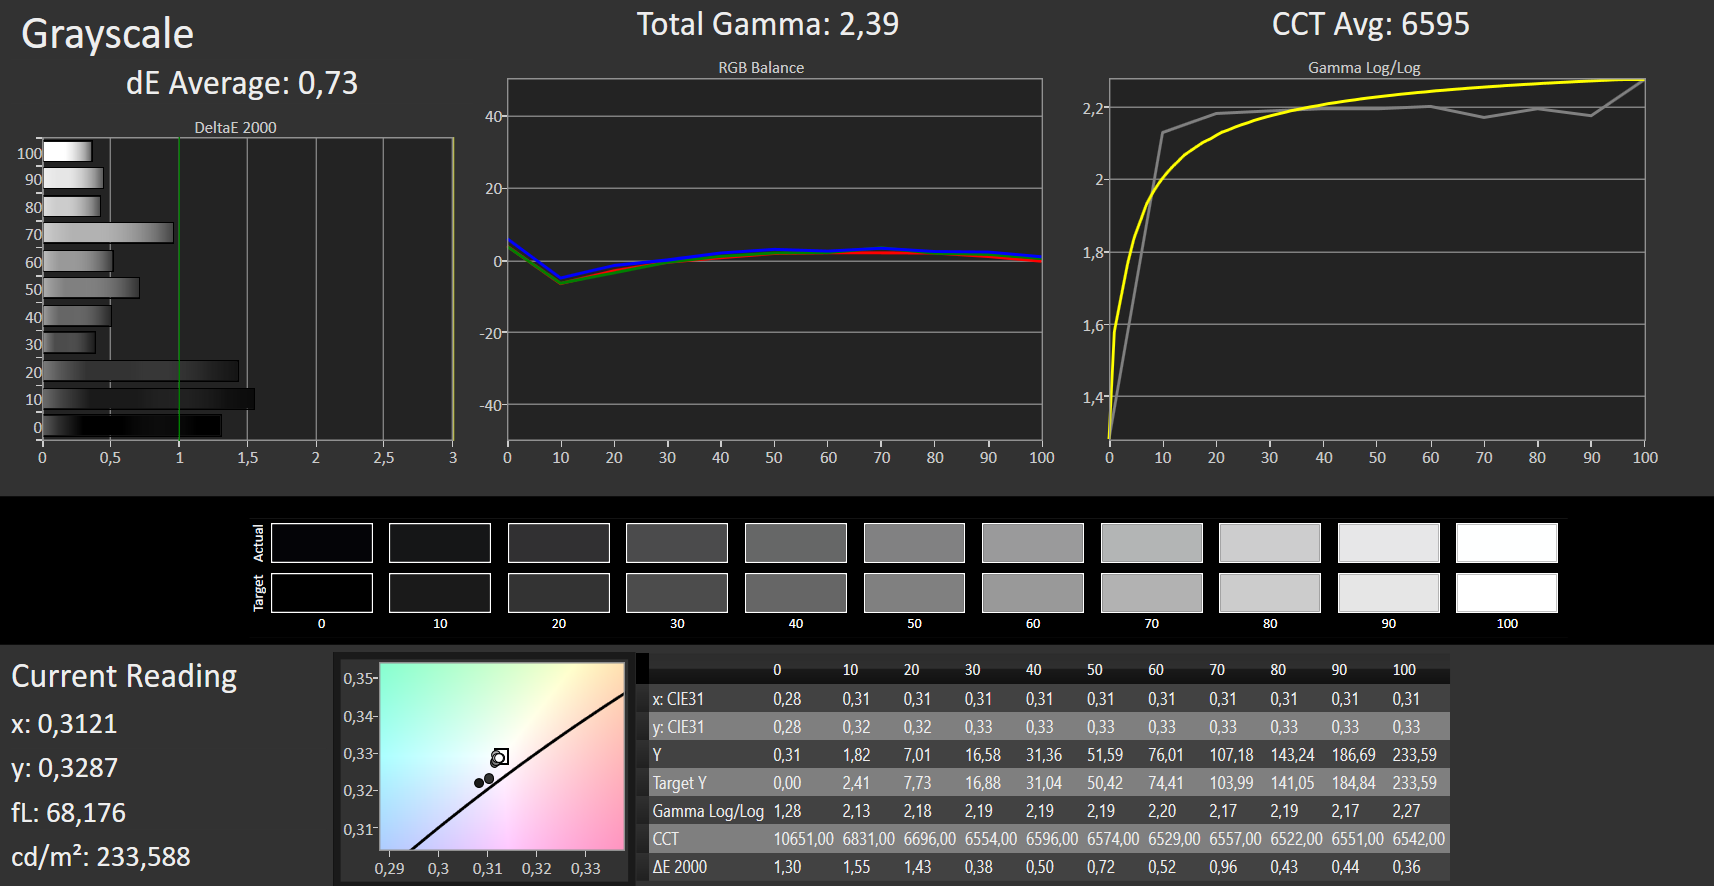
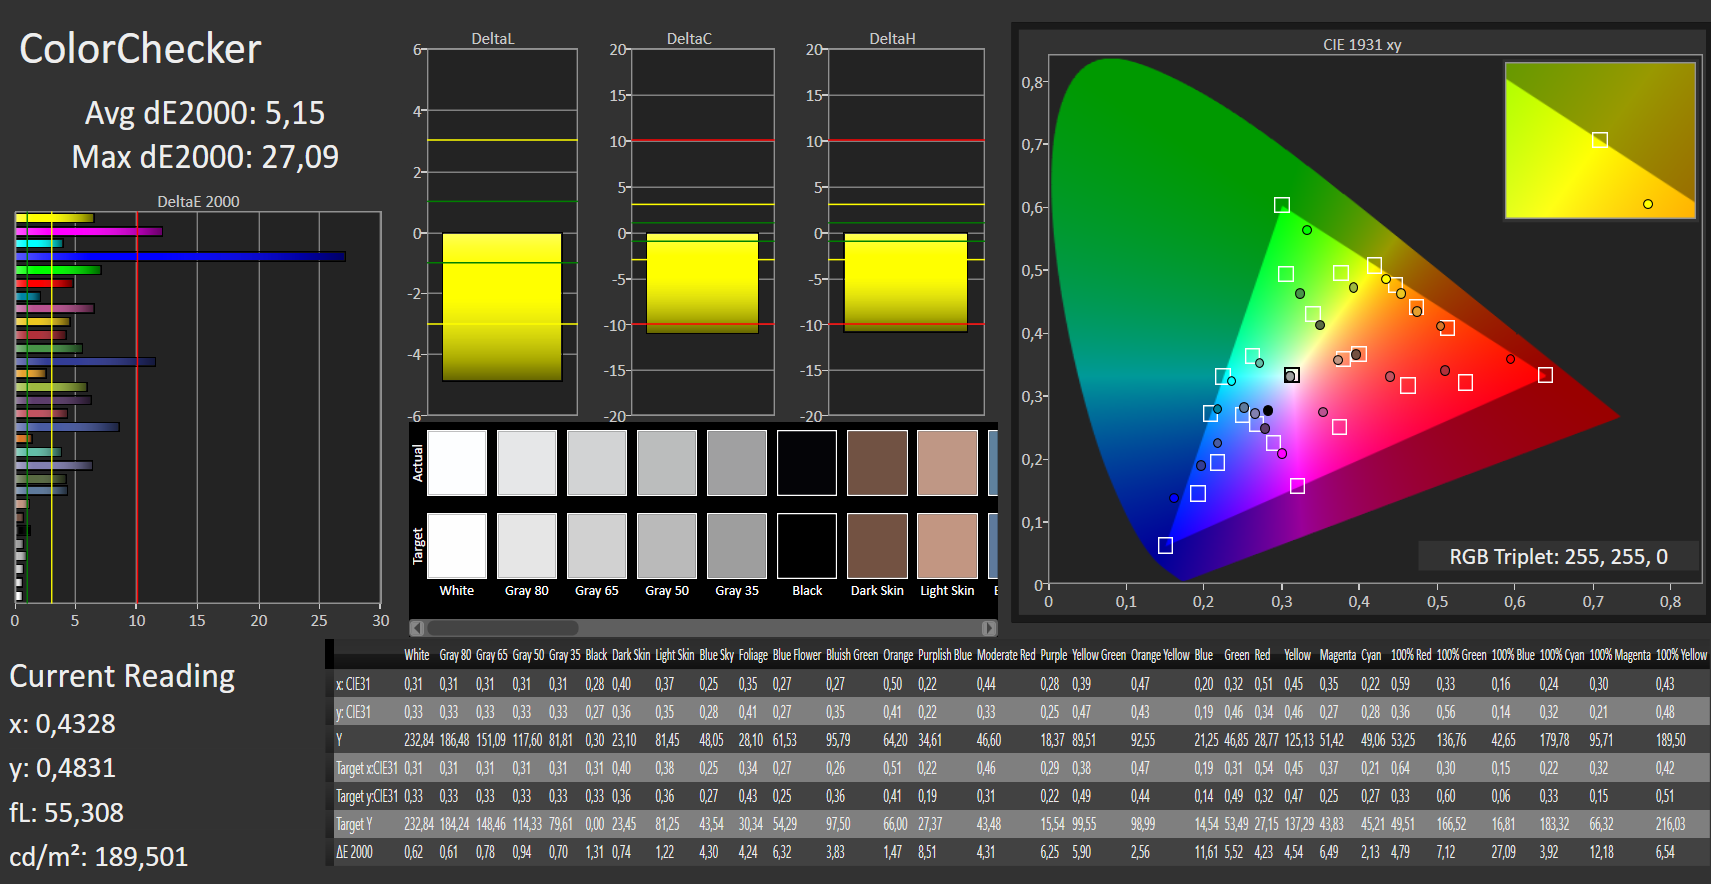
ΔE ColorChecker Calman: 5.84 | ∀{0.5-29.43 Ø4.71}
calibrated: 5.15
ΔE Greyscale Calman: 3.54 | ∀{0.09-98 Ø4.96}
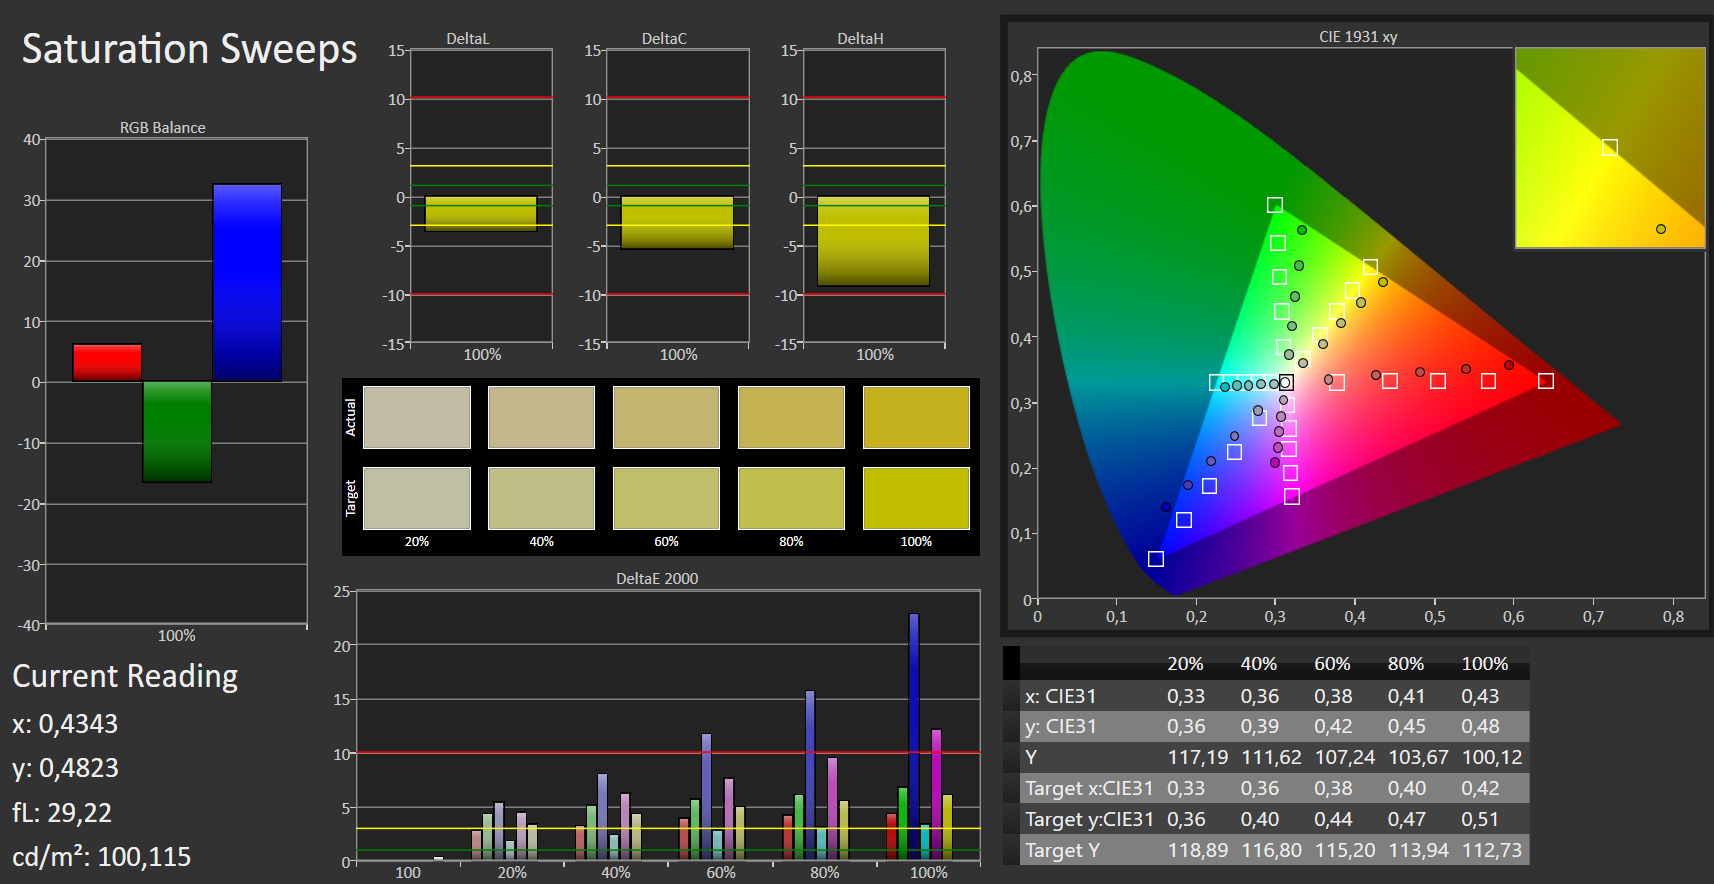
61% sRGB (Argyll 1.6.3 3D)
39% AdobeRGB 1998 (Argyll 1.6.3 3D)
42.29% AdobeRGB 1998 (Argyll 3D)
61.3% sRGB (Argyll 3D)
40.9% Display P3 (Argyll 3D)
Gamma: 2.43
CCT: 6747 K
| Dell Latitude 13 3390 BOE06A7, NV13FHM, IPS, 1920x1080, 13.3" | Lenovo ThinkPad L390 Yoga-20NT000XGE LEN4094, NV133FHM-N5A, IPS LED, 1920x1080, 13.3" | Lenovo Yoga C930-13IKB B139HAN03_0, IPS, 1920x1080, 13.9" | Asus ZenBook Flip 14 UX461UA BOE NV140FHM-N62, IPS, 1920x1080, 14" | HP ProBook x360 440 G1 Chi MEi, CMN14E0, IPS, 1920x1080, 14" | |
|---|---|---|---|---|---|
| Display | 58% | 56% | 47% | 60% | |
| Display P3 Coverage (%) | 40.9 | 69.2 69% | 64.3 57% | 64.4 57% | 65.8 61% |
| sRGB Coverage (%) | 61.3 | 90.6 48% | 94.6 54% | 84.6 38% | 98.2 60% |
| AdobeRGB 1998 Coverage (%) | 42.29 | 66.3 57% | 66.2 57% | 61.8 46% | 67.8 60% |
| Response Times | -19% | 9% | -4% | 28% | |
| Response Time Grey 50% / Grey 80% * (ms) | 42 ? | 51.2 ? -22% | 40.8 ? 3% | 44 ? -5% | 34 ? 19% |
| Response Time Black / White * (ms) | 32 ? | 36.8 ? -15% | 27.6 ? 14% | 33 ? -3% | 20 ? 37% |
| PWM Frequency (Hz) | 208 ? | 1000 ? | 200 ? | 26000 ? | |
| Screen | 17% | 8% | 5% | 50% | |
| Brightness middle (cd/m²) | 276 | 313 13% | 316 14% | 302 9% | 408 48% |
| Brightness (cd/m²) | 274 | 295 8% | 291 6% | 288 5% | 375 37% |
| Brightness Distribution (%) | 82 | 90 10% | 83 1% | 90 10% | 87 6% |
| Black Level * (cd/m²) | 0.29 | 0.22 24% | 0.36 -24% | 0.57 -97% | 0.34 -17% |
| Contrast (:1) | 952 | 1423 49% | 878 -8% | 530 -44% | 1200 26% |
| Colorchecker dE 2000 * | 5.84 | 6.2 -6% | 5.9 -1% | 5.17 11% | 1.2 79% |
| Colorchecker dE 2000 max. * | 26.72 | 10.7 60% | 12.9 52% | 7.68 71% | 2.44 91% |
| Colorchecker dE 2000 calibrated * | 5.15 | 2.5 51% | 1.3 75% | 0.67 87% | |
| Greyscale dE 2000 * | 3.54 | 8 -126% | 8.6 -143% | 3.26 8% | 0.98 72% |
| Gamma | 2.43 91% | 2.38 92% | 2.1 105% | 2.45 90% | 2.32 95% |
| CCT | 6747 96% | 7100 92% | 6854 95% | 7142 91% | 6485 100% |
| Color Space (Percent of AdobeRGB 1998) (%) | 39 | 59.1 52% | 60.7 56% | 55 41% | 62 59% |
| Color Space (Percent of sRGB) (%) | 61 | 90.6 49% | 94.5 55% | 85 39% | 98 61% |
| Média Total (Programa/Configurações) | 19% /
20% | 24% /
17% | 16% /
12% | 46% /
49% |
* ... menor é melhor
Exibir tempos de resposta
| ↔ Tempo de resposta preto para branco | ||
|---|---|---|
| 32 ms ... ascensão ↗ e queda ↘ combinadas | ↗ 18 ms ascensão | 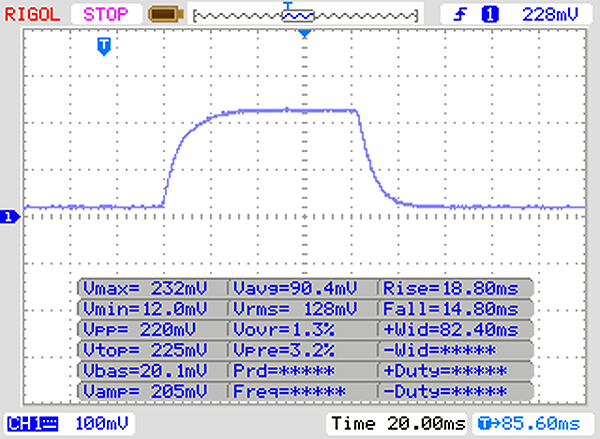 |
| ↘ 14 ms queda | ||
| A tela mostra taxas de resposta lentas em nossos testes e será insatisfatória para os jogadores. Em comparação, todos os dispositivos testados variam de 0.1 (mínimo) a 240 (máximo) ms. » 86 % de todos os dispositivos são melhores. Isso significa que o tempo de resposta medido é pior que a média de todos os dispositivos testados (19.8 ms). | ||
| ↔ Tempo de resposta 50% cinza a 80% cinza | ||
| 42 ms ... ascensão ↗ e queda ↘ combinadas | ↗ 22 ms ascensão | 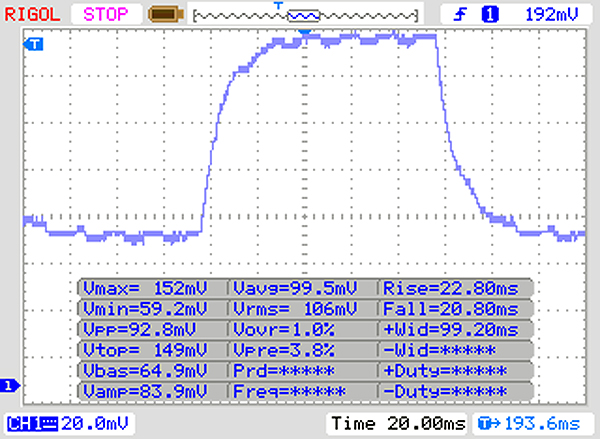 |
| ↘ 20 ms queda | ||
| A tela mostra taxas de resposta lentas em nossos testes e será insatisfatória para os jogadores. Em comparação, todos os dispositivos testados variam de 0.165 (mínimo) a 636 (máximo) ms. » 67 % de todos os dispositivos são melhores. Isso significa que o tempo de resposta medido é pior que a média de todos os dispositivos testados (30.9 ms). | ||
Cintilação da tela / PWM (modulação por largura de pulso)
| Tela tremeluzindo/PWM detectado | 208 Hz | ≤ 90 % configuração de brilho | 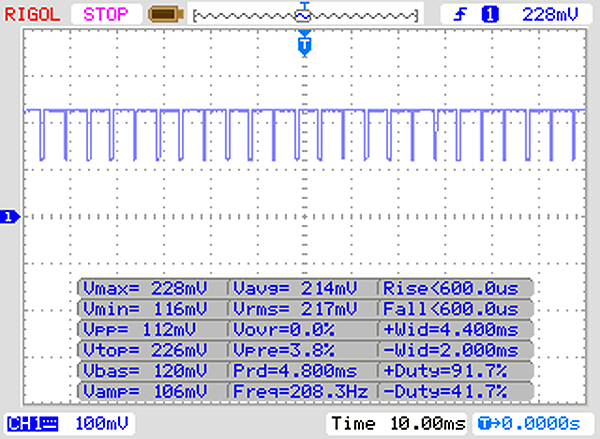 |
A luz de fundo da tela pisca em 208 Hz (pior caso, por exemplo, utilizando PWM) Cintilação detectada em uma configuração de brilho de 90 % e abaixo. Não deve haver cintilação ou PWM acima desta configuração de brilho. A frequência de 208 Hz é relativamente baixa, portanto, usuários sensíveis provavelmente notarão cintilação e sentirão fadiga ocular na configuração de brilho indicada e abaixo. [pwm_comparison] Em comparação: 52 % de todos os dispositivos testados não usam PWM para escurecer a tela. Se PWM foi detectado, uma média de 7741 (mínimo: 5 - máximo: 343500) Hz foi medida. | |||

| Cinebench R20 | |
| CPU (Single Core) | |
| Média da turma Convertible (273 - 834, n=49, últimos 2 anos) | |
| Dell Latitude 13 3390 | |
| Média Intel Core i5-8250U (332 - 355, n=5) | |
| CPU (Multi Core) | |
| Média da turma Convertible (595 - 12102, n=49, últimos 2 anos) | |
| Média Intel Core i5-8250U (846 - 1325, n=5) | |
| Dell Latitude 13 3390 | |
| HWBOT x265 Benchmark v2.2 - 4k Preset | |
| Média da turma Convertible (3.43 - 36.2, n=48, últimos 2 anos) | |
| Lenovo ThinkPad L390 Yoga-20NT000XGE | |
| Média Intel Core i5-8250U (3.02 - 4.78, n=8) | |
| Dell Latitude 13 3390 | |
| Blender - v2.79 BMW27 CPU | |
| Média Intel Core i5-8250U (813 - 1209, n=8) | |
| Dell Latitude 13 3390 | |
| Lenovo ThinkPad L390 Yoga-20NT000XGE | |
| Média da turma Convertible (105 - 1051, n=48, últimos 2 anos) | |
* ... menor é melhor
| PCMark 8 Home Score Accelerated v2 | 3797 pontos | |
| PCMark 8 Work Score Accelerated v2 | 4799 pontos | |
| PCMark 10 Score | 3541 pontos | |
Ajuda | ||
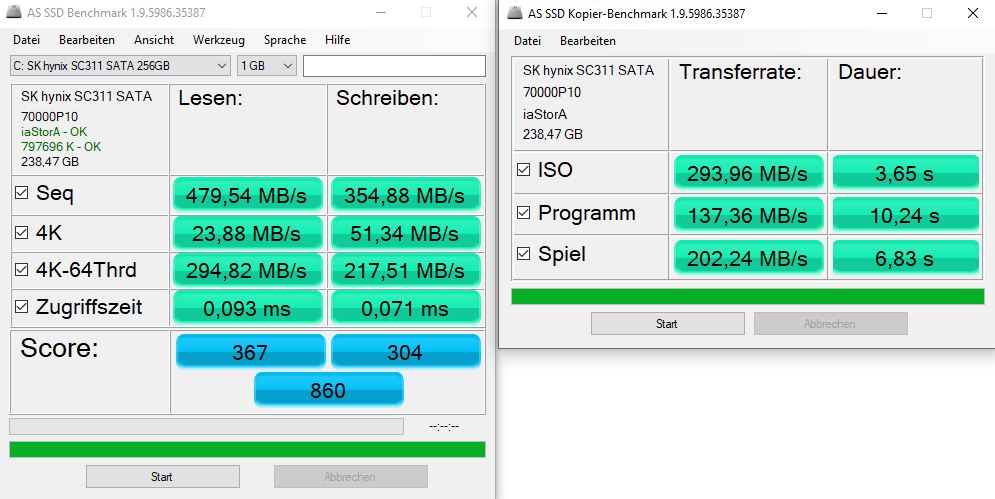
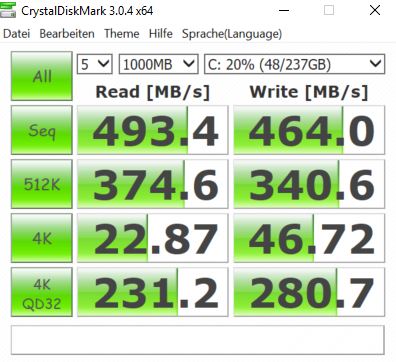
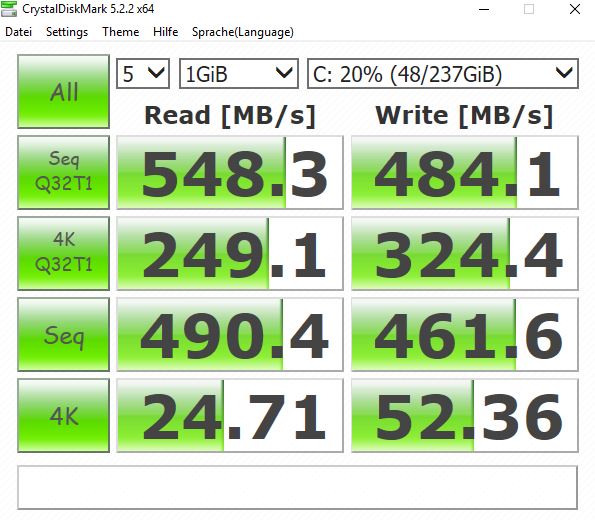
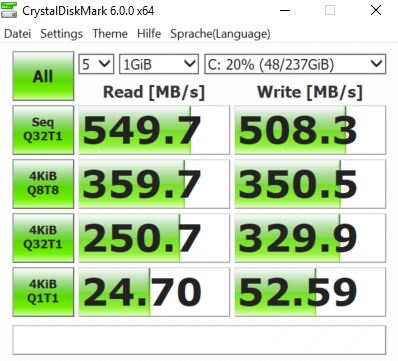
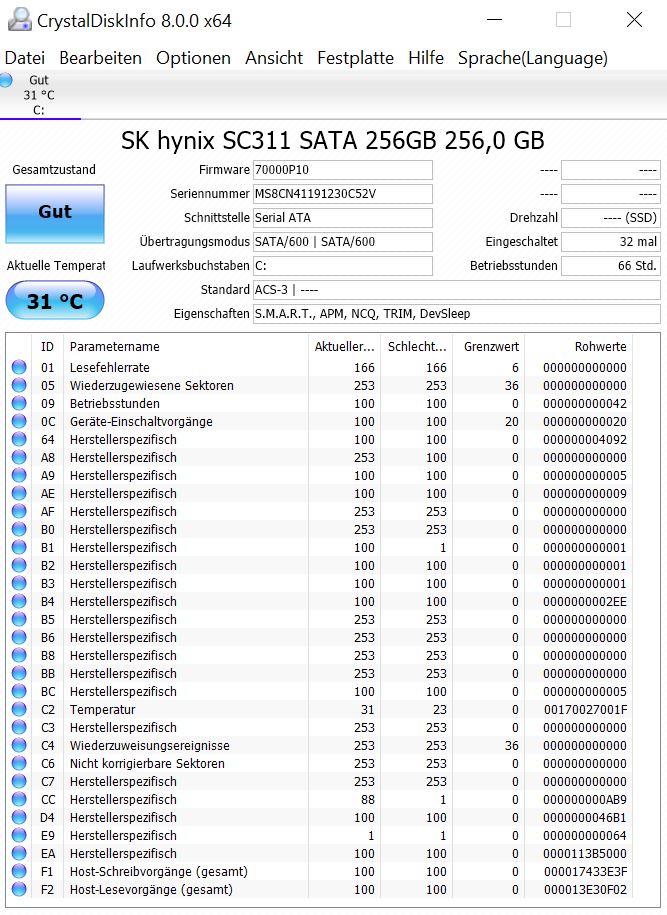
| Dell Latitude 13 3390 SK hynix SC311 SATA | Lenovo ThinkPad L390 Yoga-20NT000XGE Samsung SSD PM981 MZVLB256HAHQ | Lenovo Yoga C930-13IKB SK hynix PC401 HFS256GD9TNG | Asus ZenBook Flip 14 UX461UA SanDisk SD8SN8U256G1002 | HP ProBook x360 440 G1 Toshiba KBG30ZMV256G | Média SK hynix SC311 SATA | |
|---|---|---|---|---|---|---|
| AS SSD | 203% | 73% | -4% | 77% | -11% | |
| Seq Read (MB/s) | 479.5 | 1724 260% | 1850 286% | 459.9 -4% | 1255 162% | 499 ? 4% |
| Seq Write (MB/s) | 354.9 | 1123 216% | 661 86% | 388.2 9% | 625 76% | 296 ? -17% |
| 4K Read (MB/s) | 23.88 | 51.8 117% | 38.04 59% | 26.93 13% | 42.09 76% | 23.9 ? 0% |
| 4K Write (MB/s) | 51.3 | 133.8 161% | 95 85% | 50.7 -1% | 96.1 87% | 54.3 ? 6% |
| 4K-64 Read (MB/s) | 294.8 | 745 153% | 434.3 47% | 368.3 25% | 624 112% | 231 ? -22% |
| 4K-64 Write (MB/s) | 217.5 | 1193 449% | 266.3 22% | 146.4 -33% | 298.3 37% | 169.7 ? -22% |
| Access Time Read * (ms) | 0.093 | 0.041 56% | 0.069 26% | 0.123 -32% | 0.122 -31% | 0.133 ? -43% |
| Access Time Write * (ms) | 0.071 | 0.028 61% | 0.056 21% | 0.086 -21% | 0.224 -215% | 0.07075 ? -0% |
| Score Read (Points) | 367 | 969 164% | 657 79% | 441 20% | 791 116% | 305 ? -17% |
| Score Write (Points) | 304 | 1440 374% | 427 40% | 236 -22% | 457 50% | 254 ? -16% |
| Score Total (Points) | 860 | 2889 236% | 1373 60% | 908 6% | 1634 90% | 713 ? -17% |
| Copy ISO MB/s (MB/s) | 294 | 1025 249% | 539 83% | 324.1 10% | 983 234% | 303 ? 3% |
| Copy Program MB/s (MB/s) | 137.4 | 322.1 134% | 209.7 53% | 118.6 -14% | 274.5 100% | 132.6 ? -3% |
| Copy Game MB/s (MB/s) | 202.2 | 637 215% | 340 68% | 186.1 -8% | 572 183% | 195.3 ? -3% |
* ... menor é melhor

| 3DMark 11 Performance | 1779 pontos | |
| 3DMark Ice Storm Standard Score | 76683 pontos | |
| 3DMark Cloud Gate Standard Score | 7687 pontos | |
| 3DMark Fire Strike Score | 1016 pontos | |
| 3DMark Fire Strike Extreme Score | 468 pontos | |
| 3DMark Time Spy Score | 379 pontos | |
Ajuda | ||
| baixo | média | alto | ultra | |
|---|---|---|---|---|
| BioShock Infinite (2013) | 48 | 28.4 | 25.8 | 8.9 |
| Battlefield 4 (2013) | 44.7 | 31.4 | 22.1 | 7.3 |
| Dota 2 Reborn (2015) | 62.9 | 40.6 | 17.9 | 16.1 |
| Rise of the Tomb Raider (2016) | 19.2 | 11.6 | 6.2 | |
| X-Plane 11.11 (2018) | 24.1 | 15.4 | 13.9 |
Barulho
| Ocioso |
| 30.6 / 30.6 / 30.6 dB |
| Carga |
| 33.3 / 33 dB |
 | ||
30 dB silencioso 40 dB(A) audível 50 dB(A) ruidosamente alto |
||
min: | ||
| Dell Latitude 13 3390 UHD Graphics 620, i5-8250U, SK hynix SC311 SATA | Lenovo ThinkPad L390 Yoga-20NT000XGE UHD Graphics 620, i5-8265U, Samsung SSD PM981 MZVLB256HAHQ | Lenovo Yoga C930-13IKB UHD Graphics 620, i5-8250U, SK hynix PC401 HFS256GD9TNG | Asus ZenBook Flip 14 UX461UA UHD Graphics 620, i5-8250U, SanDisk SD8SN8U256G1002 | HP ProBook x360 440 G1 UHD Graphics 620, i5-8250U, Toshiba KBG30ZMV256G | |
|---|---|---|---|---|---|
| Noise | 5% | 4% | -1% | -4% | |
| desligado / ambiente * (dB) | 30.6 | 29.5 4% | 29.3 4% | 30.4 1% | 30.6 -0% |
| Idle Minimum * (dB) | 30.6 | 29.5 4% | 29.3 4% | 30.4 1% | 30.6 -0% |
| Idle Average * (dB) | 30.6 | 29.5 4% | 29.3 4% | 30.4 1% | 30.6 -0% |
| Idle Maximum * (dB) | 30.6 | 29.5 4% | 29.7 3% | 32 -5% | 32 -5% |
| Load Average * (dB) | 33.3 | 30.6 8% | 31.8 5% | 31.7 5% | 36.7 -10% |
| Load Maximum * (dB) | 33 | 30.6 7% | 32.7 1% | 35.9 -9% | 36.7 -11% |
* ... menor é melhor
(±) A temperatura máxima no lado superior é 40 °C / 104 F, em comparação com a média de 35.4 °C / 96 F , variando de 19.6 a 60 °C para a classe Convertible.
(-) A parte inferior aquece até um máximo de 46.1 °C / 115 F, em comparação com a média de 36.9 °C / 98 F
(+) Em uso inativo, a temperatura média para o lado superior é 24.4 °C / 76 F, em comparação com a média do dispositivo de 30.3 °C / ### class_avg_f### F.
(+) Os apoios para as mãos e o touchpad são mais frios que a temperatura da pele, com um máximo de 27.6 °C / 81.7 F e, portanto, são frios ao toque.
(±) A temperatura média da área do apoio para as mãos de dispositivos semelhantes foi 28 °C / 82.4 F (+0.4 °C / 0.7 F).
| Dell Latitude 13 3390 UHD Graphics 620, i5-8250U, SK hynix SC311 SATA | Lenovo ThinkPad L390 Yoga-20NT000XGE UHD Graphics 620, i5-8265U, Samsung SSD PM981 MZVLB256HAHQ | Lenovo Yoga C930-13IKB UHD Graphics 620, i5-8250U, SK hynix PC401 HFS256GD9TNG | Asus ZenBook Flip 14 UX461UA UHD Graphics 620, i5-8250U, SanDisk SD8SN8U256G1002 | HP ProBook x360 440 G1 UHD Graphics 620, i5-8250U, Toshiba KBG30ZMV256G | |
|---|---|---|---|---|---|
| Heat | -5% | 3% | 6% | -2% | |
| Maximum Upper Side * (°C) | 40 | 46.7 -17% | 41.8 -5% | 39 2% | 41.2 -3% |
| Maximum Bottom * (°C) | 46.1 | 50.7 -10% | 40.9 11% | 45.6 1% | 42.4 8% |
| Idle Upper Side * (°C) | 25.7 | 23.8 7% | 25.6 -0% | 23.3 9% | 26.9 -5% |
| Idle Bottom * (°C) | 26 | 25.6 2% | 24.5 6% | 23.1 11% | 28.4 -9% |
* ... menor é melhor
Dell Latitude 13 3390 análise de áudio
(-) | alto-falantes não muito altos (###valor### dB)
Graves 100 - 315Hz
(-) | quase nenhum baixo - em média 15.6% menor que a mediana
(±) | a linearidade dos graves é média (12.4% delta para a frequência anterior)
Médios 400 - 2.000 Hz
(+) | médios equilibrados - apenas 4% longe da mediana
(±) | a linearidade dos médios é média (7.9% delta para frequência anterior)
Altos 2 - 16 kHz
(+) | agudos equilibrados - apenas 4.4% longe da mediana
(±) | a linearidade dos máximos é média (7% delta para frequência anterior)
Geral 100 - 16.000 Hz
(±) | a linearidade do som geral é média (22.6% diferença em relação à mediana)
Comparado com a mesma classe
» 68% de todos os dispositivos testados nesta classe foram melhores, 5% semelhantes, 27% piores
» O melhor teve um delta de 6%, a média foi 20%, o pior foi 57%
Comparado com todos os dispositivos testados
» 67% de todos os dispositivos testados foram melhores, 6% semelhantes, 28% piores
» O melhor teve um delta de 4%, a média foi 23%, o pior foi 134%
Lenovo ThinkPad L390 Yoga-20NT000XGE análise de áudio
(±) | o volume do alto-falante é médio, mas bom (###valor### dB)
Graves 100 - 315Hz
(-) | quase nenhum baixo - em média 17.9% menor que a mediana
(±) | a linearidade dos graves é média (12.9% delta para a frequência anterior)
Médios 400 - 2.000 Hz
(+) | médios equilibrados - apenas 2.1% longe da mediana
(+) | médios são lineares (6.1% delta para frequência anterior)
Altos 2 - 16 kHz
(±) | máximos mais altos - em média 7.5% maior que a mediana
(±) | a linearidade dos máximos é média (9.1% delta para frequência anterior)
Geral 100 - 16.000 Hz
(±) | a linearidade do som geral é média (23% diferença em relação à mediana)
Comparado com a mesma classe
» 69% de todos os dispositivos testados nesta classe foram melhores, 5% semelhantes, 26% piores
» O melhor teve um delta de 6%, a média foi 20%, o pior foi 57%
Comparado com todos os dispositivos testados
» 69% de todos os dispositivos testados foram melhores, 5% semelhantes, 26% piores
» O melhor teve um delta de 4%, a média foi 23%, o pior foi 134%
| desligado | |
| Ocioso | |
| Carga |
|
Key:
min: | |
| Dell Latitude 13 3390 i5-8250U, UHD Graphics 620, SK hynix SC311 SATA, IPS, 1920x1080, 13.3" | Lenovo ThinkPad L390 Yoga-20NT000XGE i5-8265U, UHD Graphics 620, Samsung SSD PM981 MZVLB256HAHQ, IPS LED, 1920x1080, 13.3" | Lenovo Yoga C930-13IKB i5-8250U, UHD Graphics 620, SK hynix PC401 HFS256GD9TNG, IPS, 1920x1080, 13.9" | Asus ZenBook Flip 14 UX461UA i5-8250U, UHD Graphics 620, SanDisk SD8SN8U256G1002, IPS, 1920x1080, 14" | HP ProBook x360 440 G1 i5-8250U, UHD Graphics 620, Toshiba KBG30ZMV256G, IPS, 1920x1080, 14" | Média Intel UHD Graphics 620 | Média da turma Convertible | |
|---|---|---|---|---|---|---|---|
| Power Consumption | -14% | -16% | -1% | -15% | -9% | -28% | |
| Idle Minimum * (Watt) | 3.9 | 4 -3% | 3.3 15% | 3.3 15% | 4.6 -18% | 3.81 ? 2% | 4.28 ? -10% |
| Idle Average * (Watt) | 6.5 | 7.1 -9% | 6.8 -5% | 6.3 3% | 7.5 -15% | 6.94 ? -7% | 6.96 ? -7% |
| Idle Maximum * (Watt) | 8.6 | 10.7 -24% | 9.5 -10% | 11 -28% | 9.6 -12% | 8.75 ? -2% | 8.67 ? -1% |
| Load Average * (Watt) | 25 | 33.8 -35% | 40.8 -63% | 30 -20% | 37 -48% | 35 ? -40% | 45.1 ? -80% |
| Load Maximum * (Watt) | 48.1 | 48.8 -1% | 57 -19% | 35.4 26% | 38.8 19% | 47.5 ? 1% | 67.7 ? -41% |
* ... menor é melhor

| Dell Latitude 13 3390 i5-8250U, UHD Graphics 620, 42 Wh | Lenovo ThinkPad L390 Yoga-20NT000XGE i5-8265U, UHD Graphics 620, 45 Wh | Lenovo Yoga C930-13IKB i5-8250U, UHD Graphics 620, 60 Wh | Asus ZenBook Flip 14 UX461UA i5-8250U, UHD Graphics 620, 57 Wh | HP ProBook x360 440 G1 i5-8250U, UHD Graphics 620, 48 Wh | Média da turma Convertible | |
|---|---|---|---|---|---|---|
| Duração da bateria | 3% | 44% | 29% | 32% | 72% | |
| Reader / Idle (h) | 16.7 | 15.8 -5% | 23.9 43% | 18.9 13% | 17.3 4% | 26.7 ? 60% |
| H.264 (h) | 5.9 | 7.4 25% | 10.5 78% | 8.6 46% | 8.3 41% | 15 ? 154% |
| WiFi v1.3 (h) | 6.7 | 7.2 7% | 9.2 37% | 9.4 40% | 8.9 33% | 12 ? 79% |
| Load (h) | 1.8 | 1.5 -17% | 2.1 17% | 2.1 17% | 2.7 50% | 1.713 ? -5% |
Pro
Contra
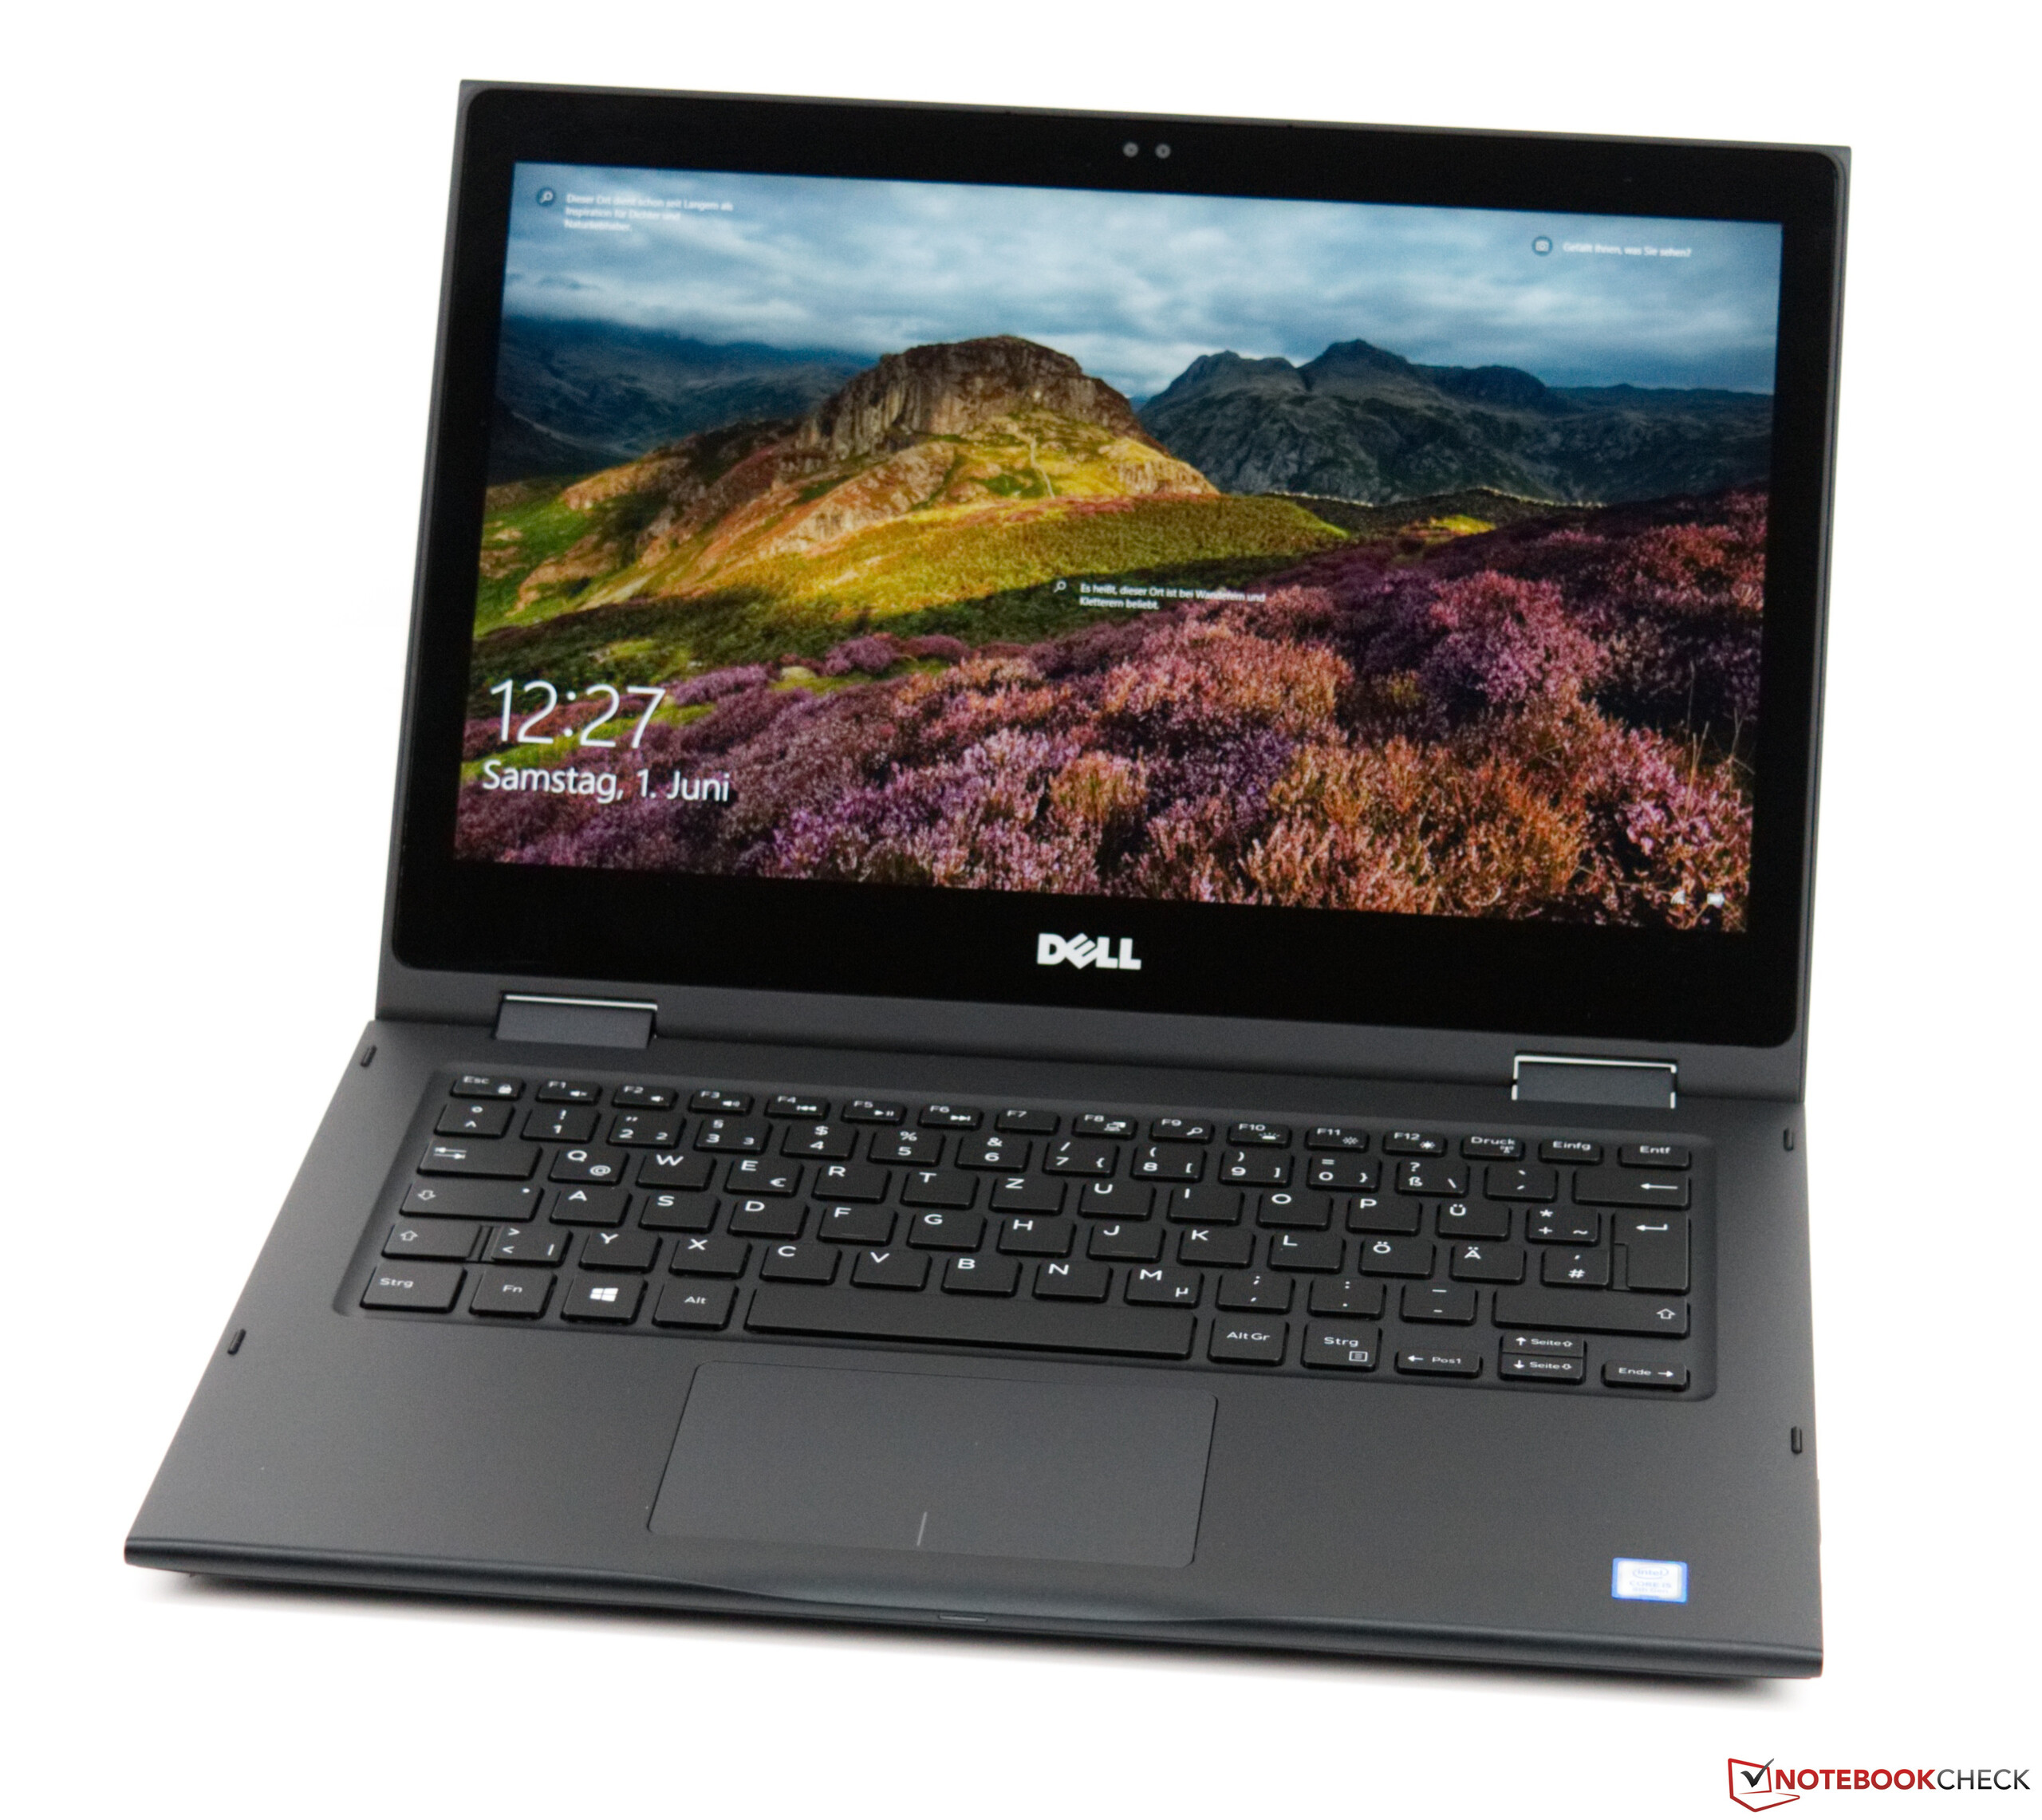
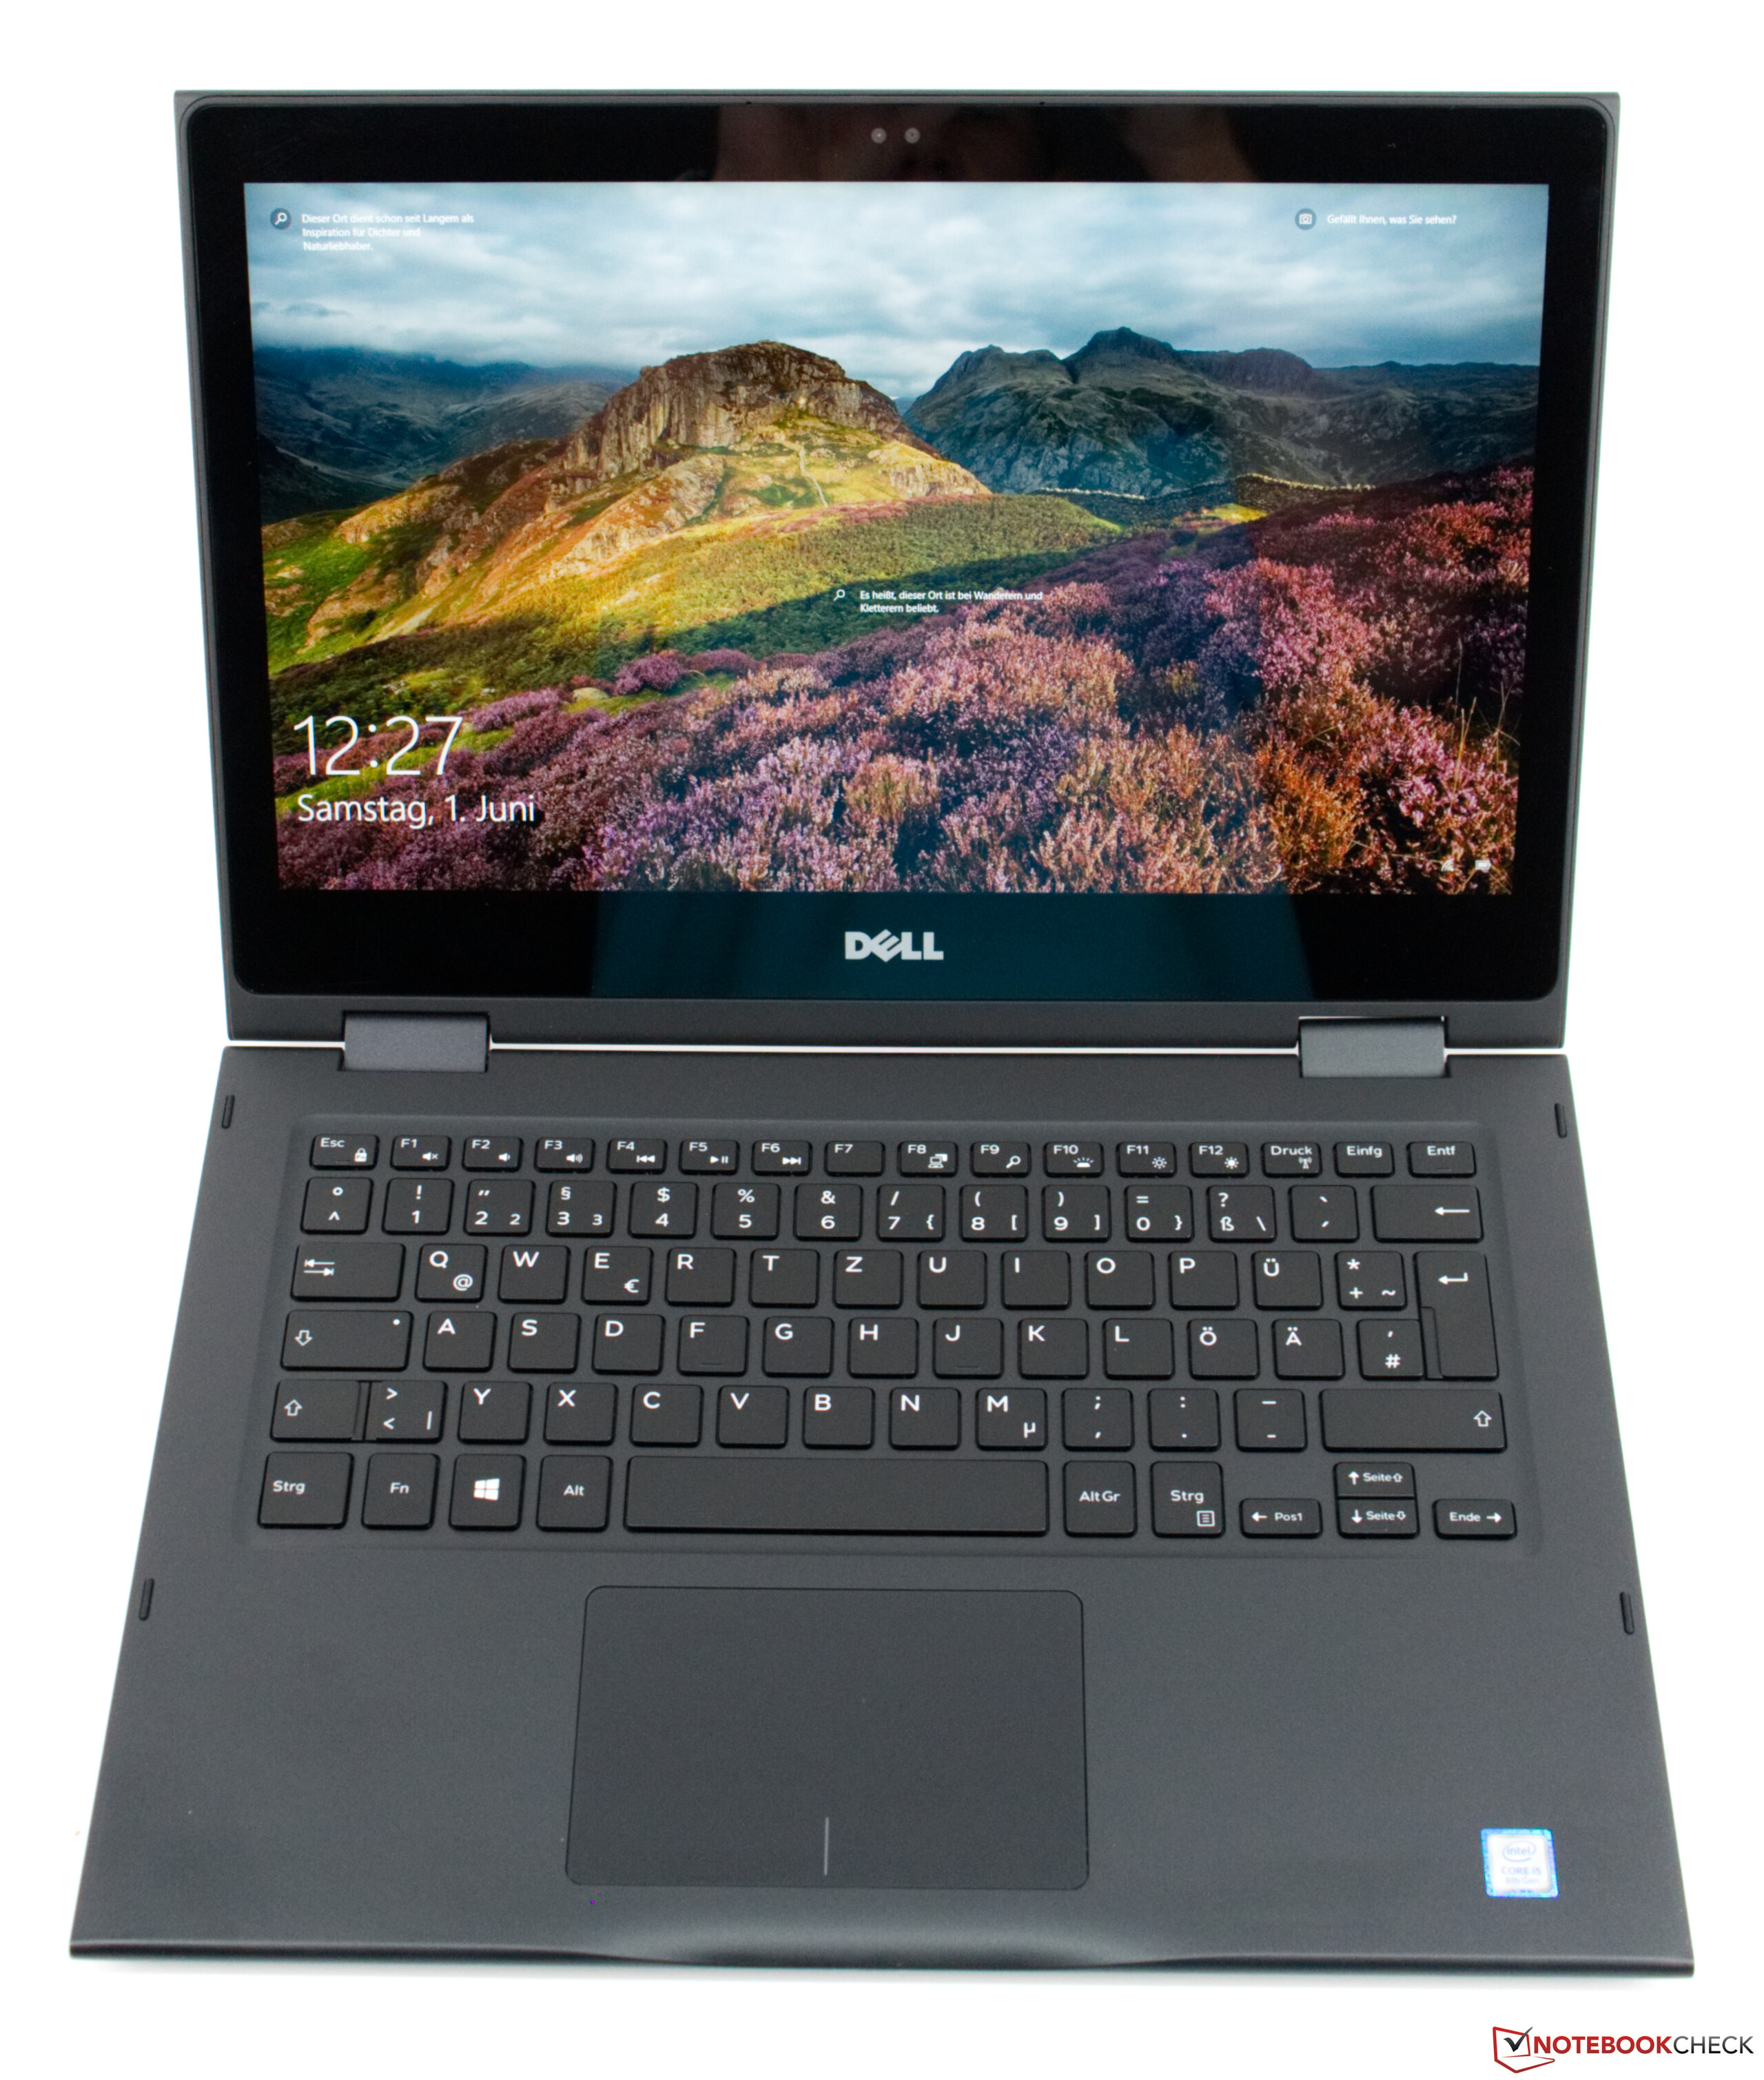
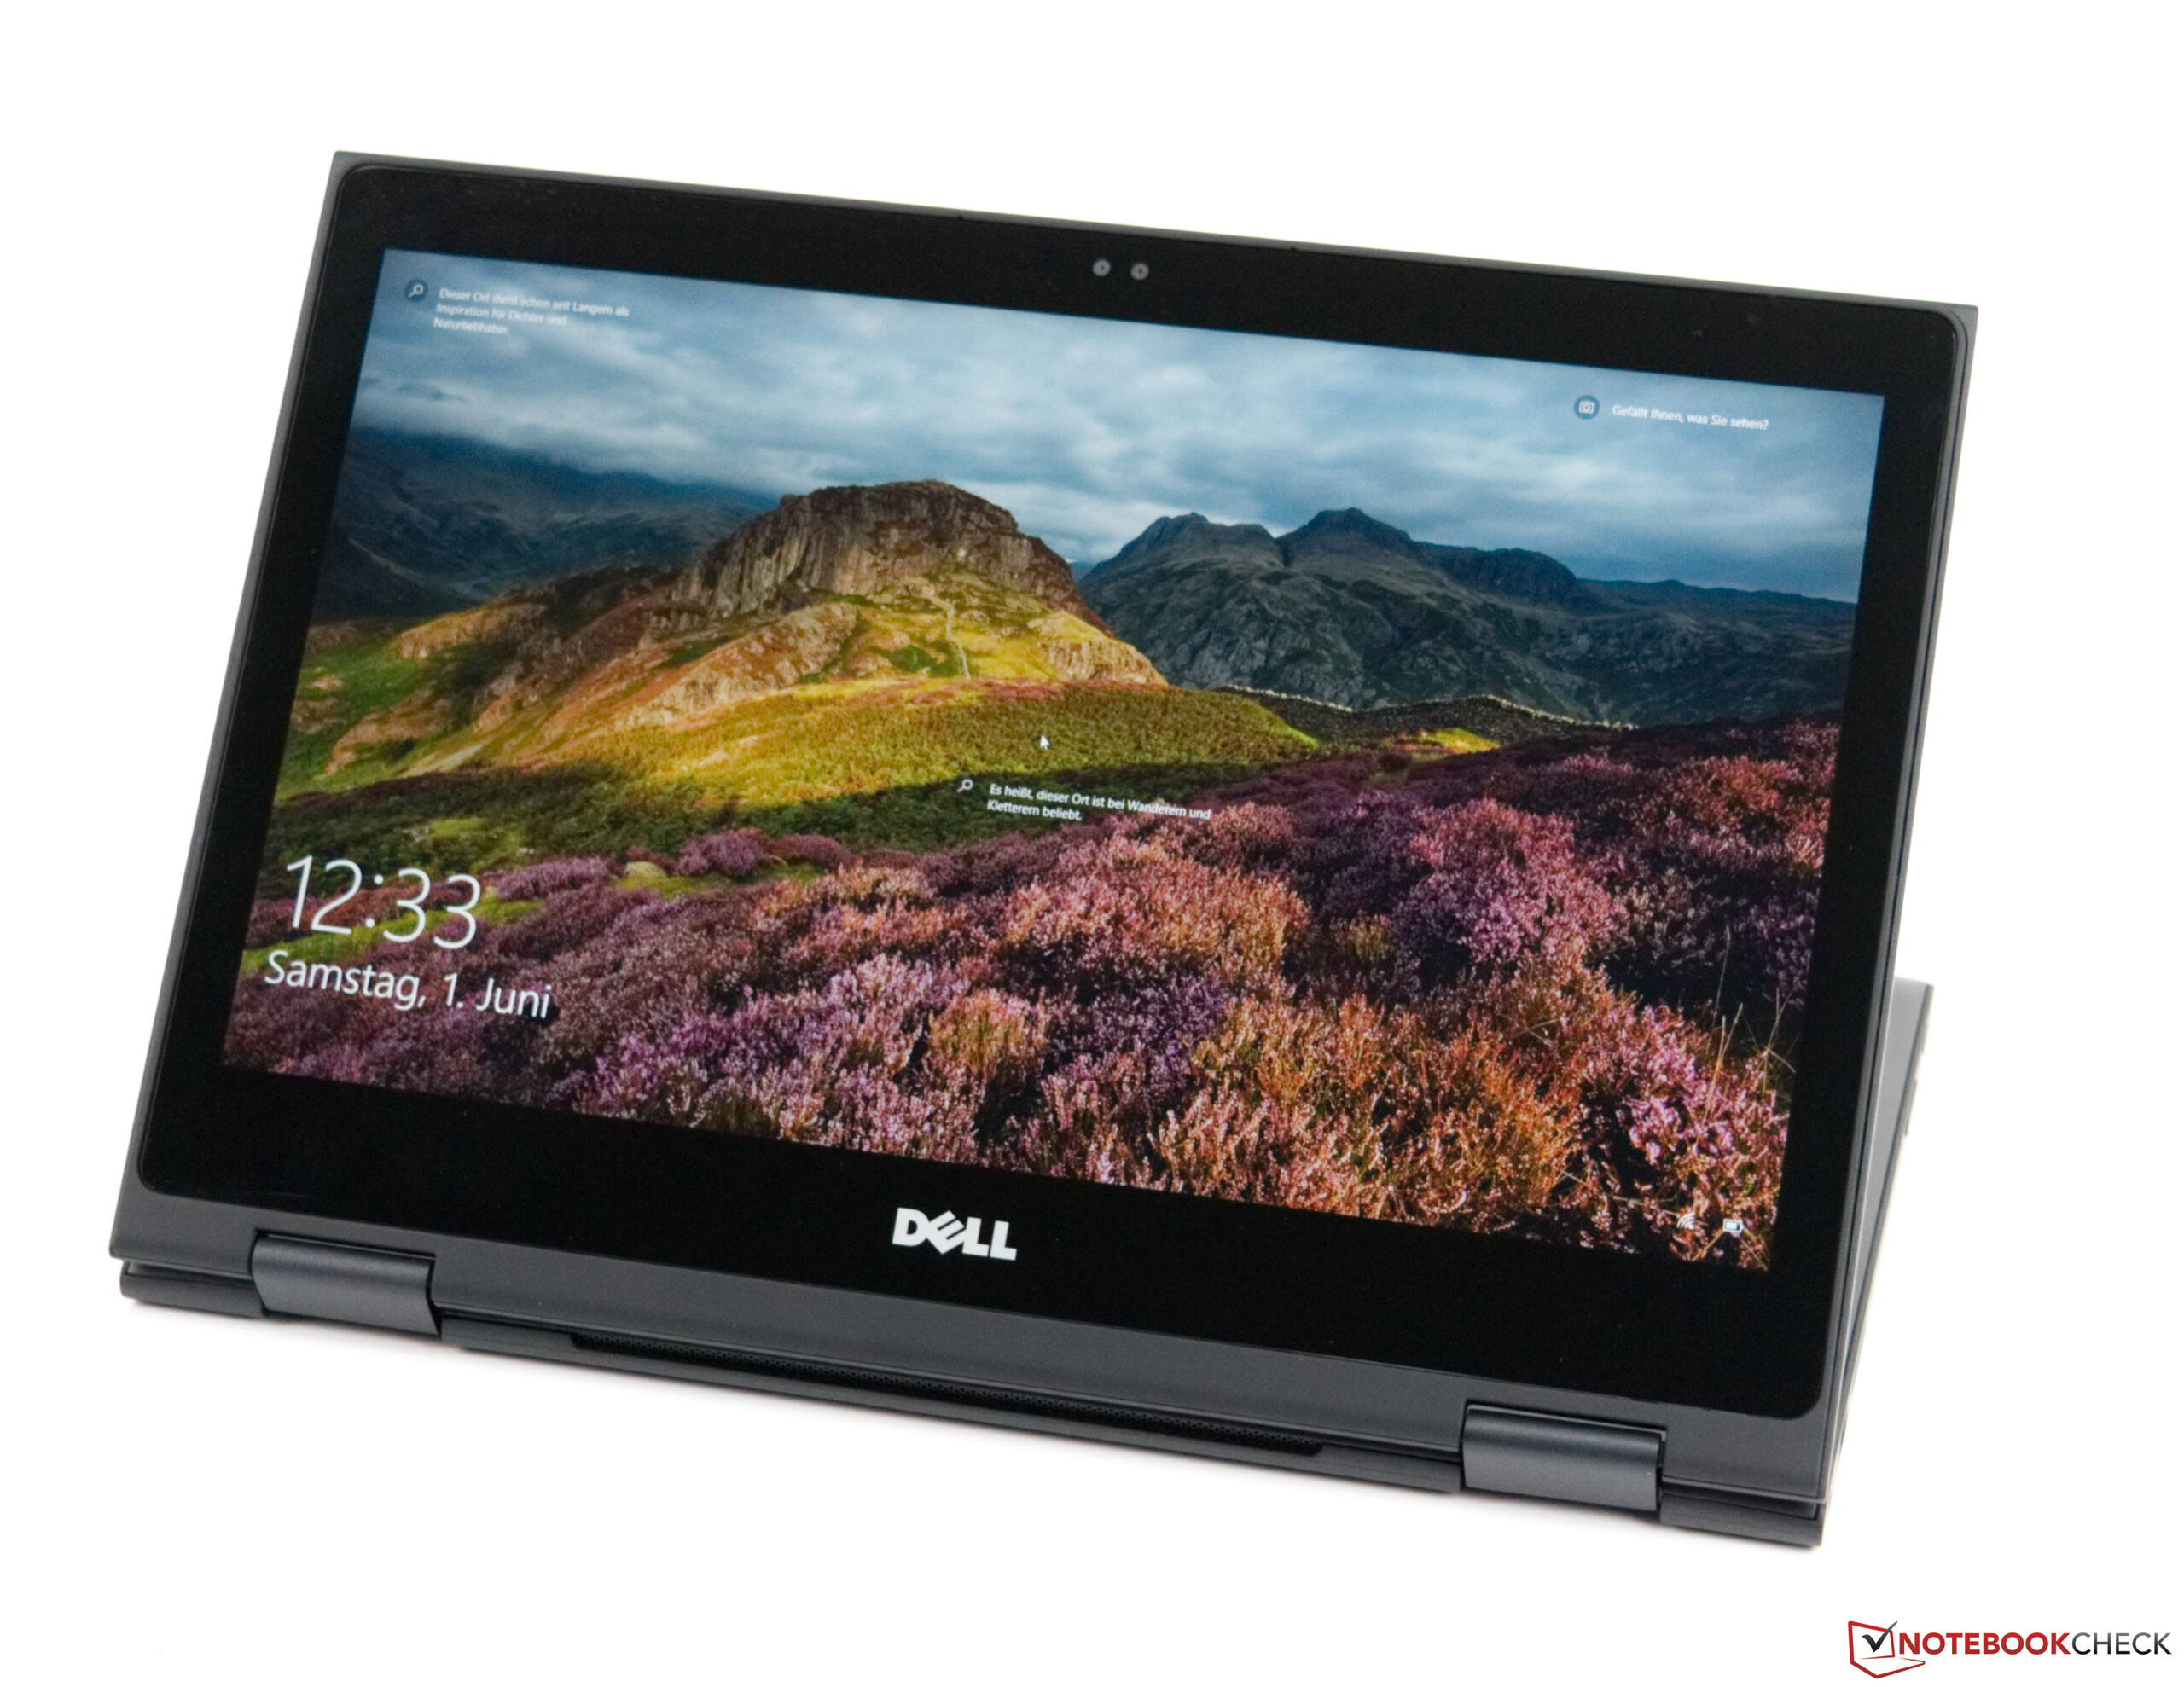
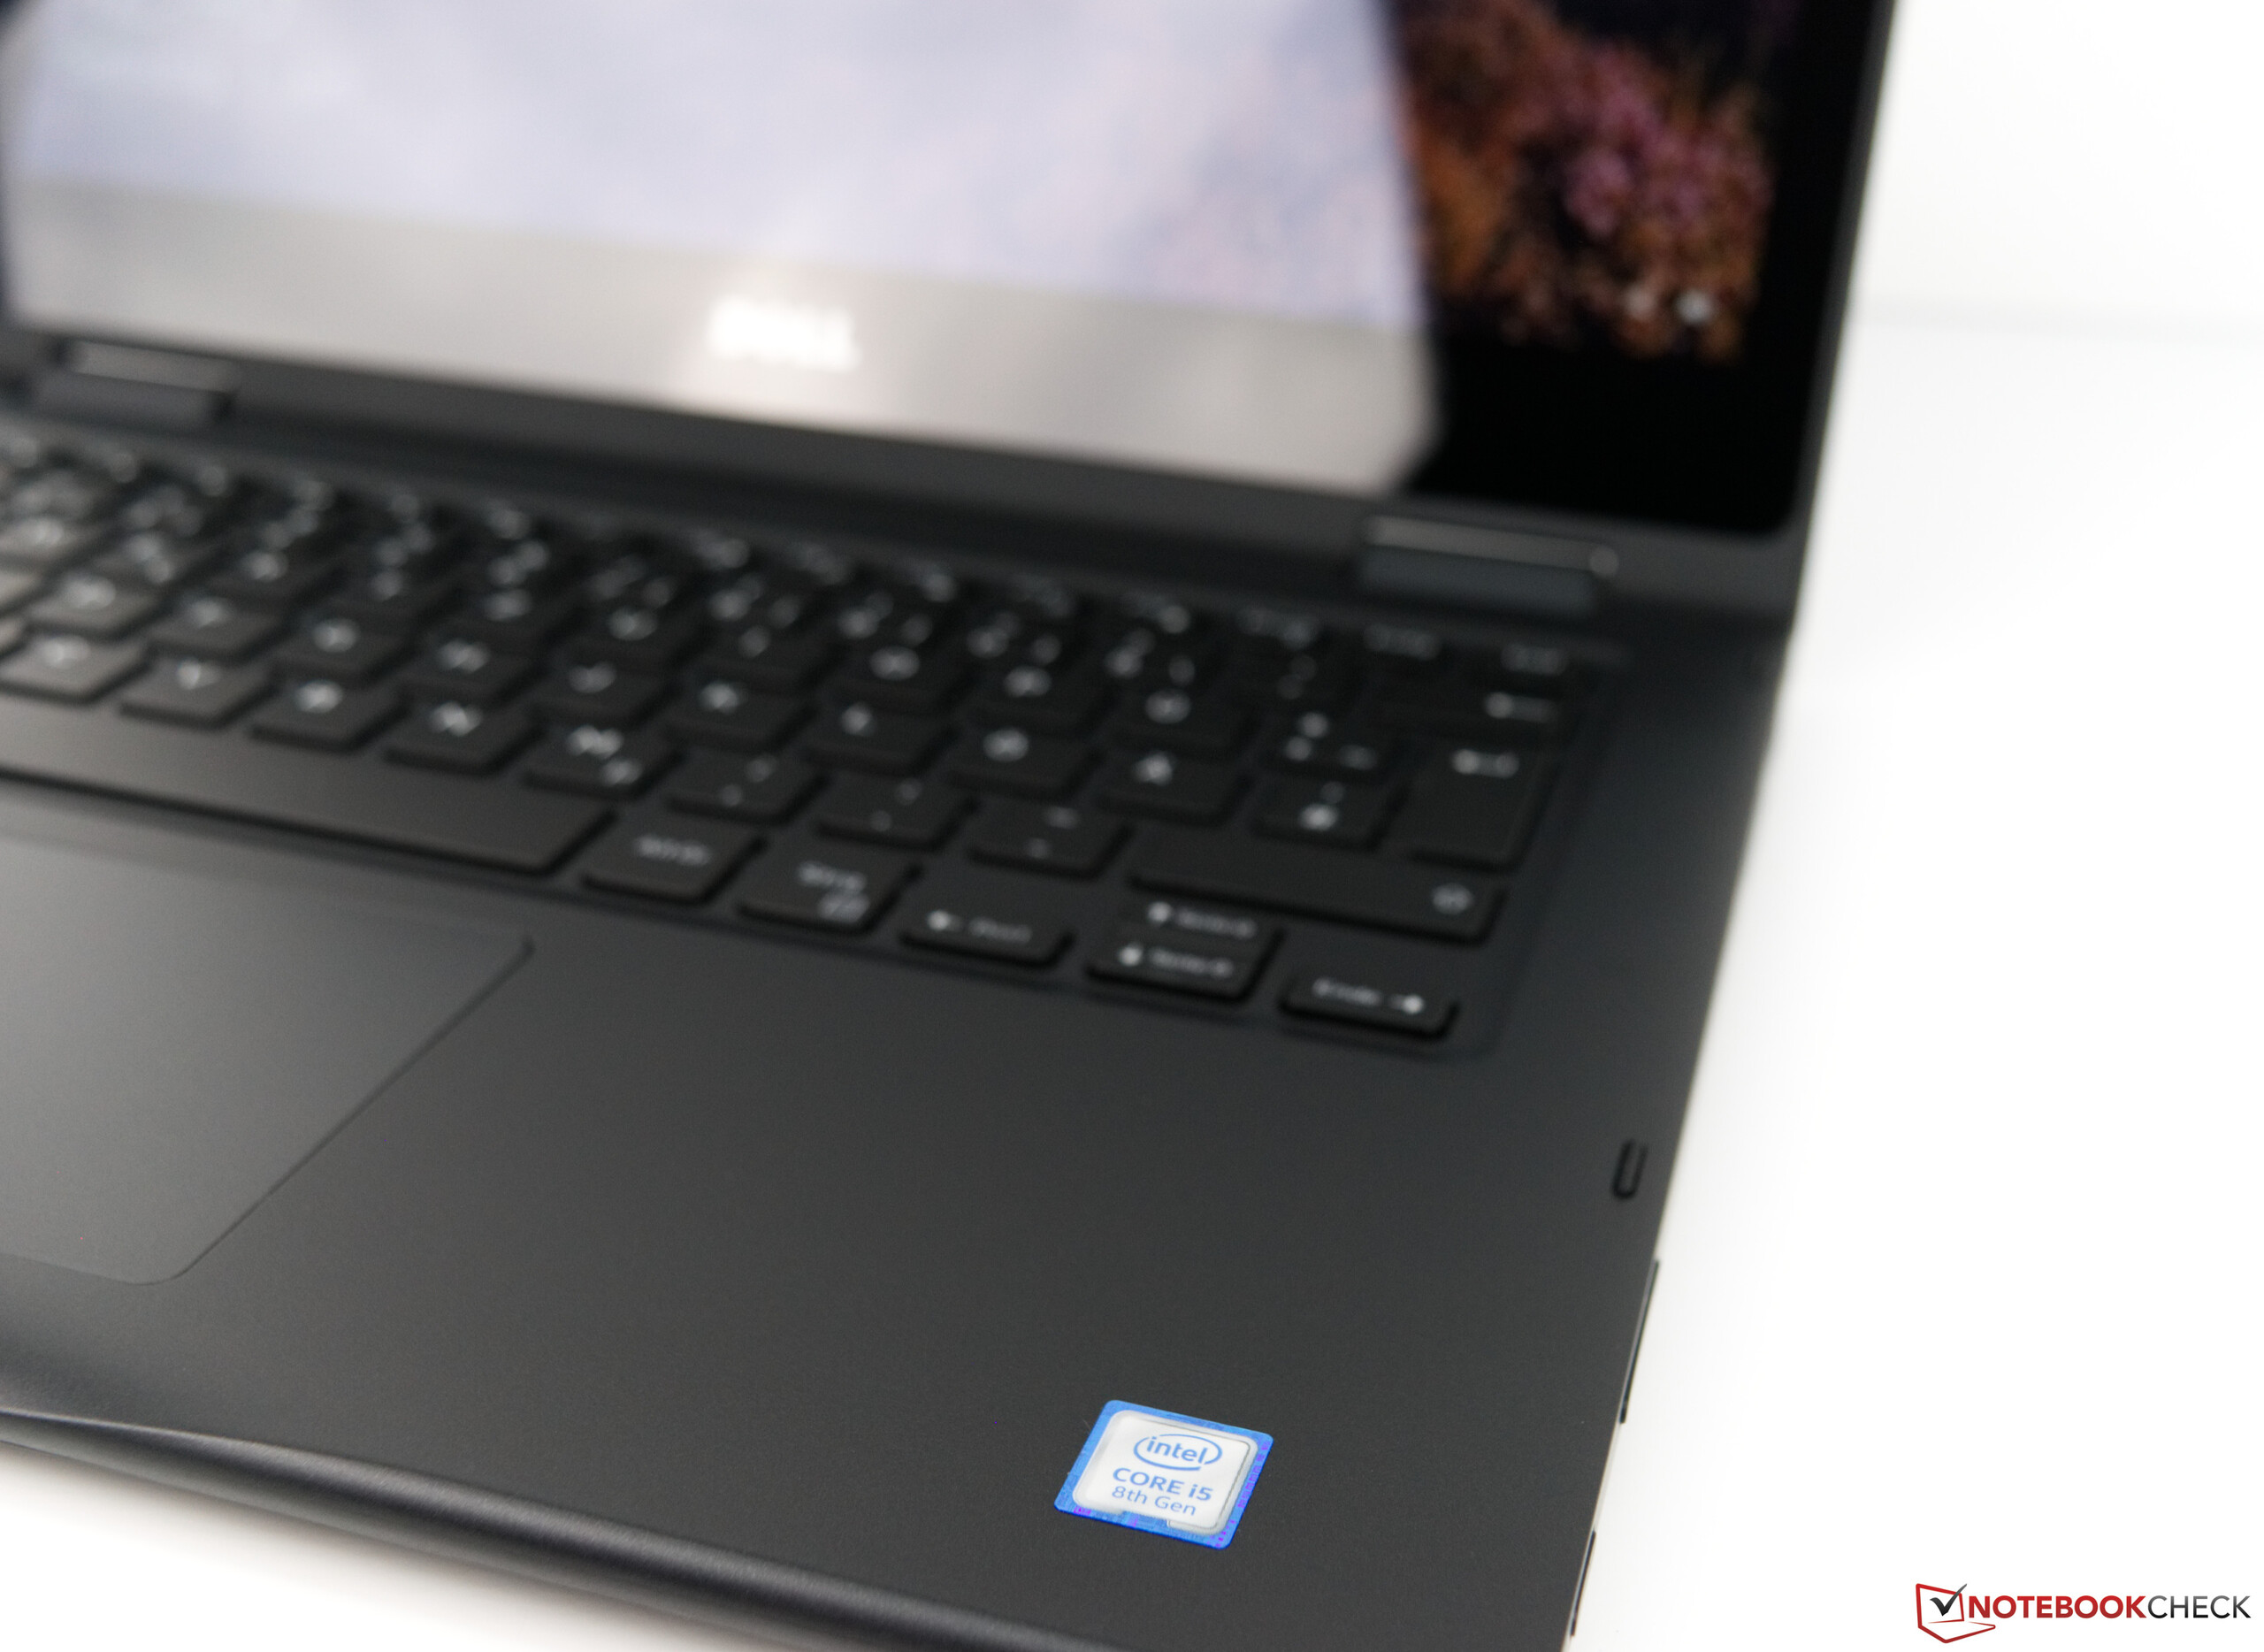
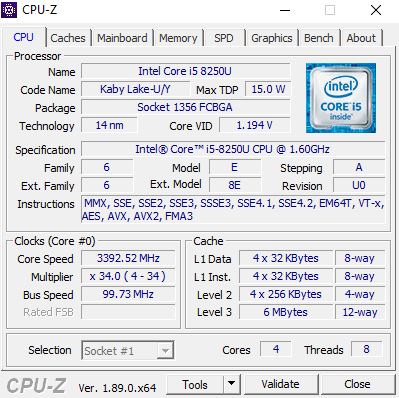
O Dell Latitude 3390 é um conversível empresarial de 13,3 polegadas com preços razoáveis. Nossa unidade de teste vem com um processador Intel Core i5-8250U, 8 GB de RAM e um SSD de 256 GB, o que o torna bem equipado para seu preço de de 999 Euros (~$ 1.130). Em suma, o Latitude 3390 na configuração que testamos é comparativamente barato para um dispositivo de negócios e é uma alternativa decente para portáteis de consumo e para compradores privados também.
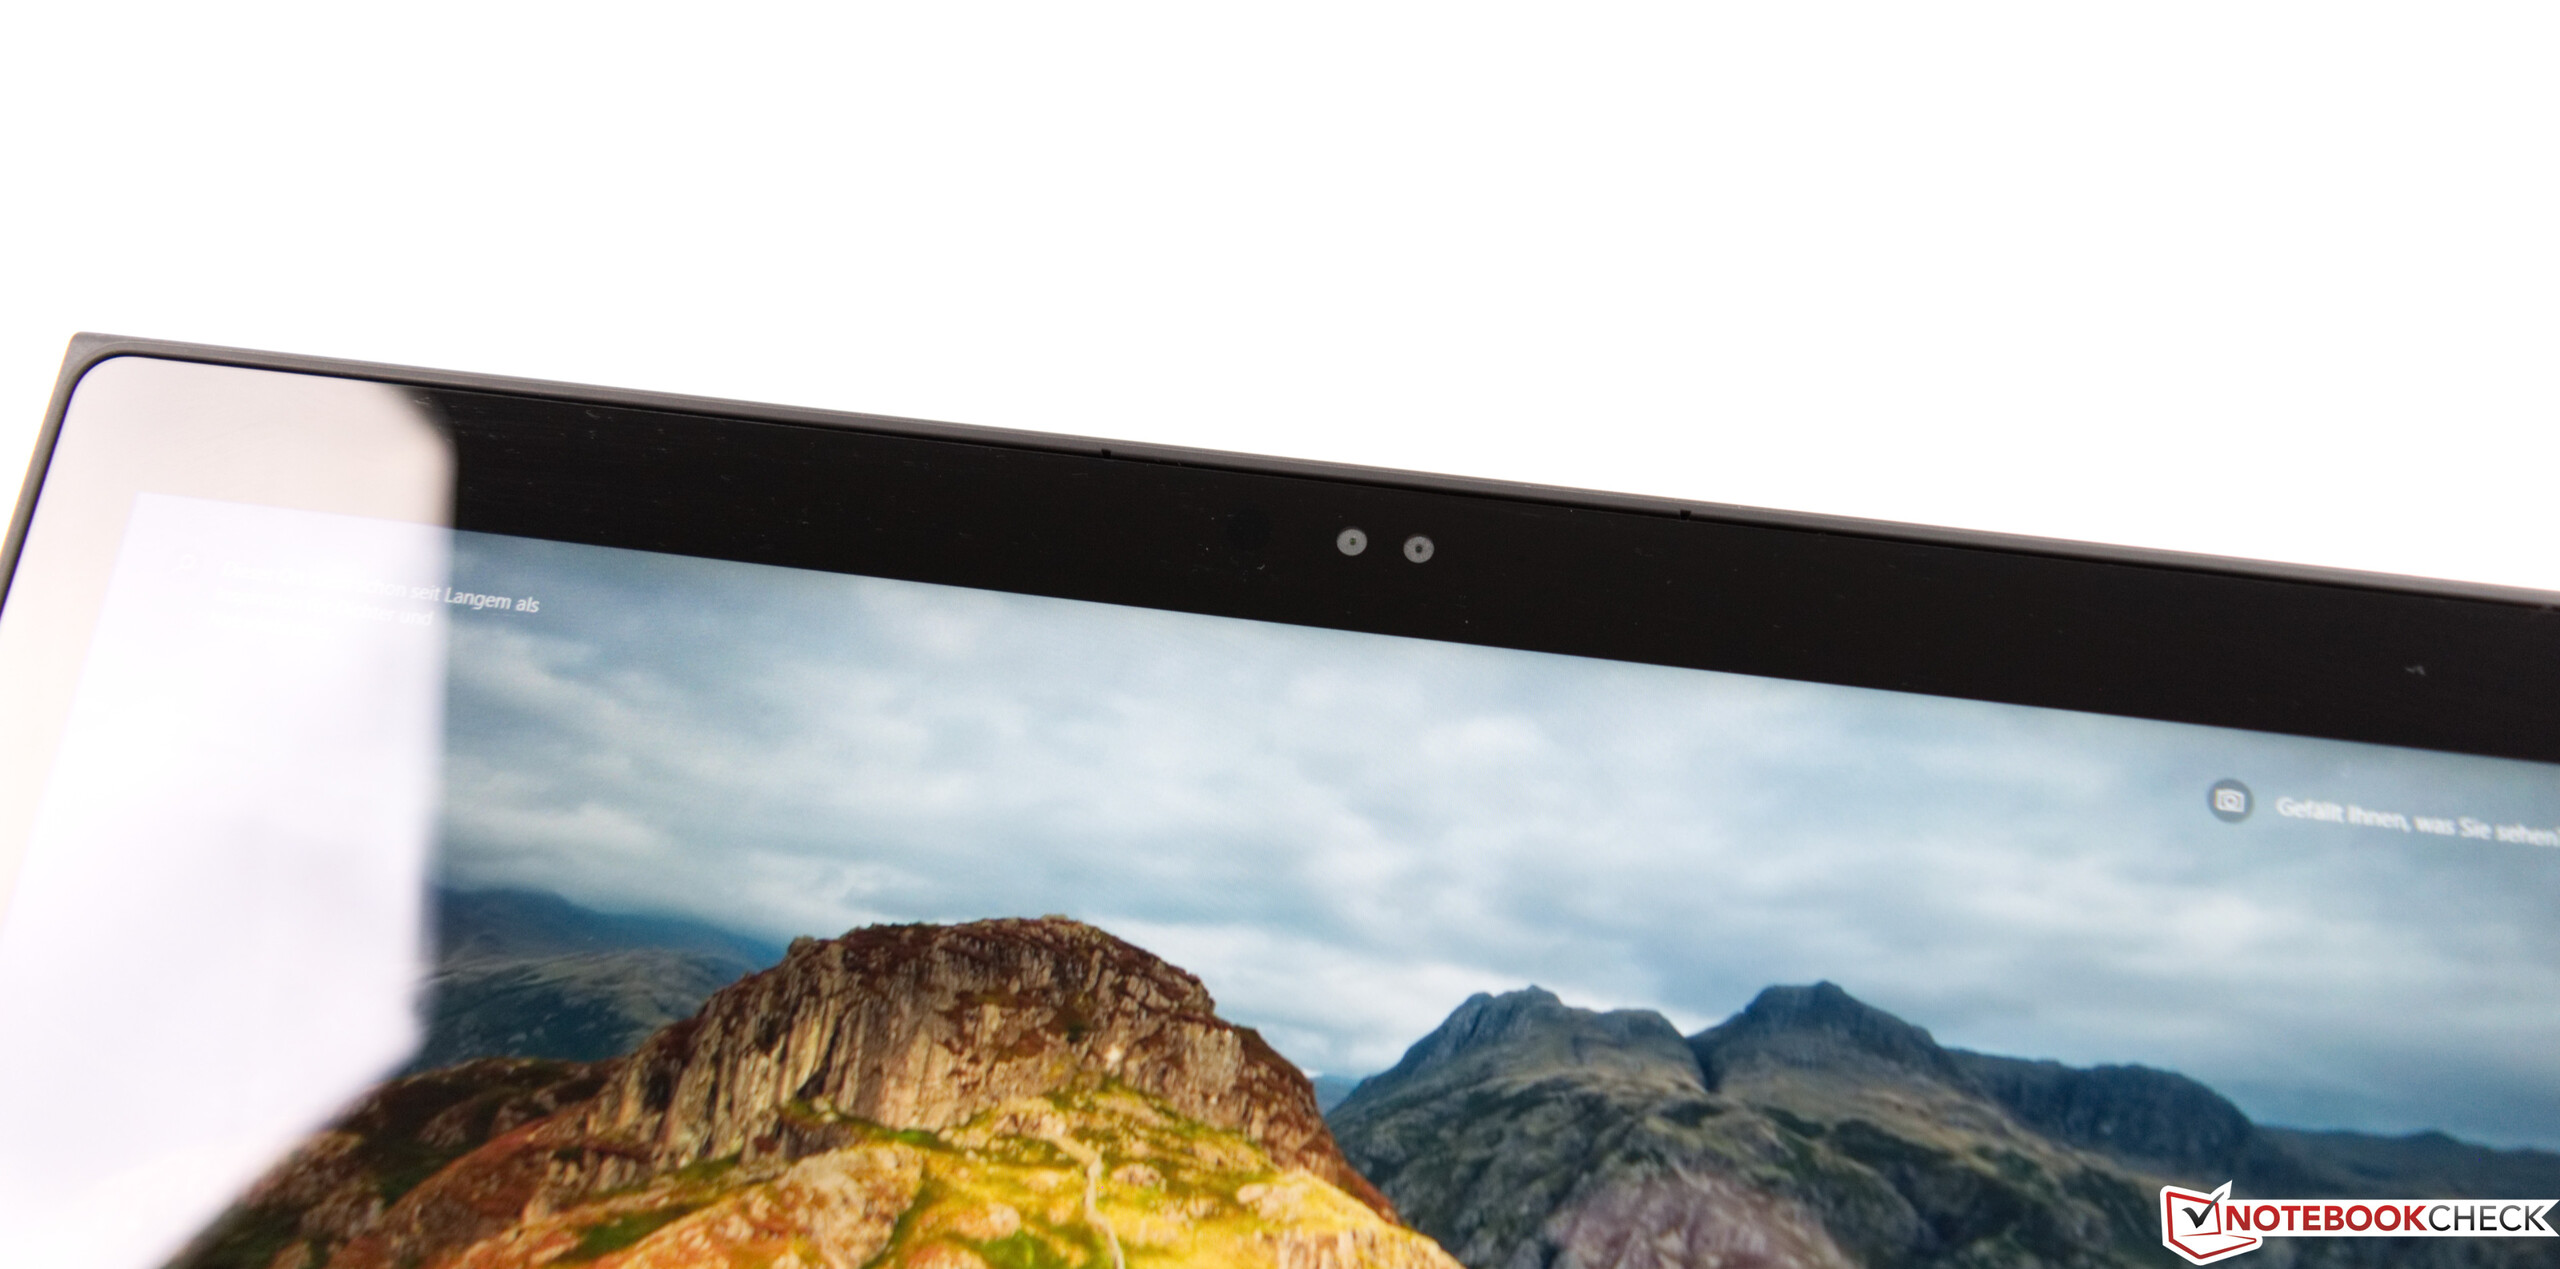
Infelizmente, o dispositivo não possui recursos empresariais importantes, como conectividade LTE opcional e recursos de segurança, como um sensor de digitais. Portanto, o Latitude 3390 provavelmente será uma opção pouco atraente para os profissionais.
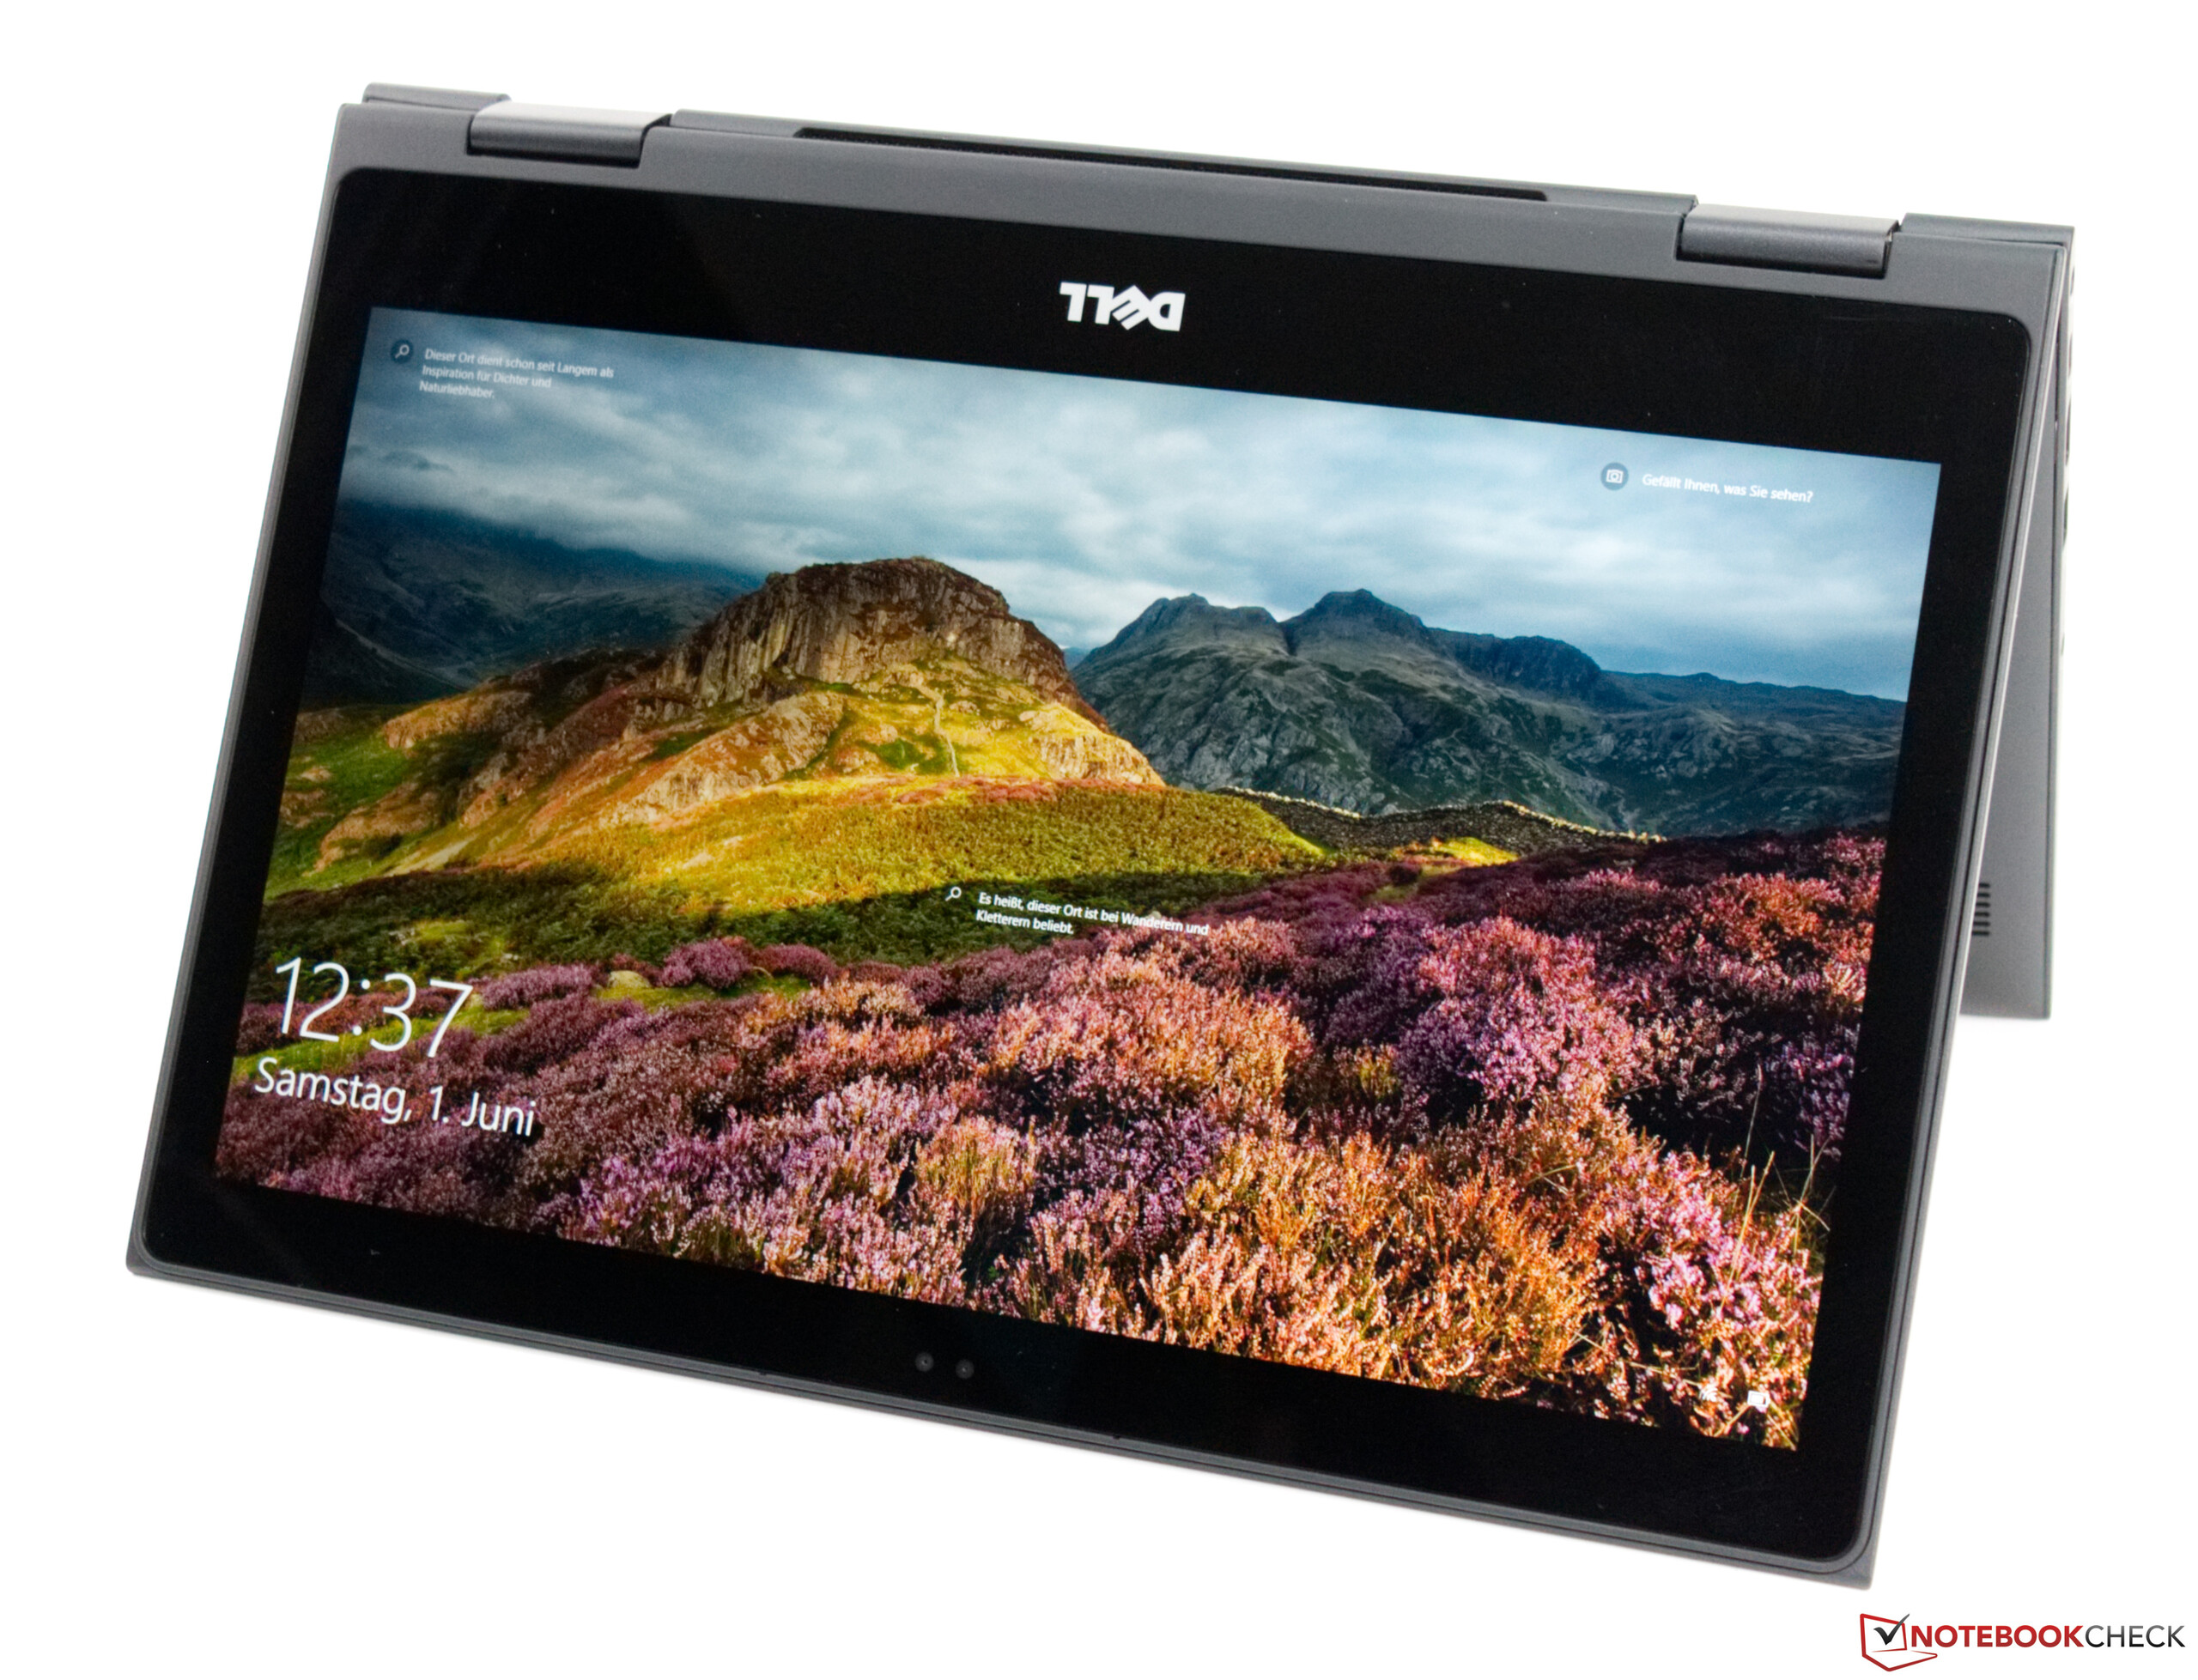
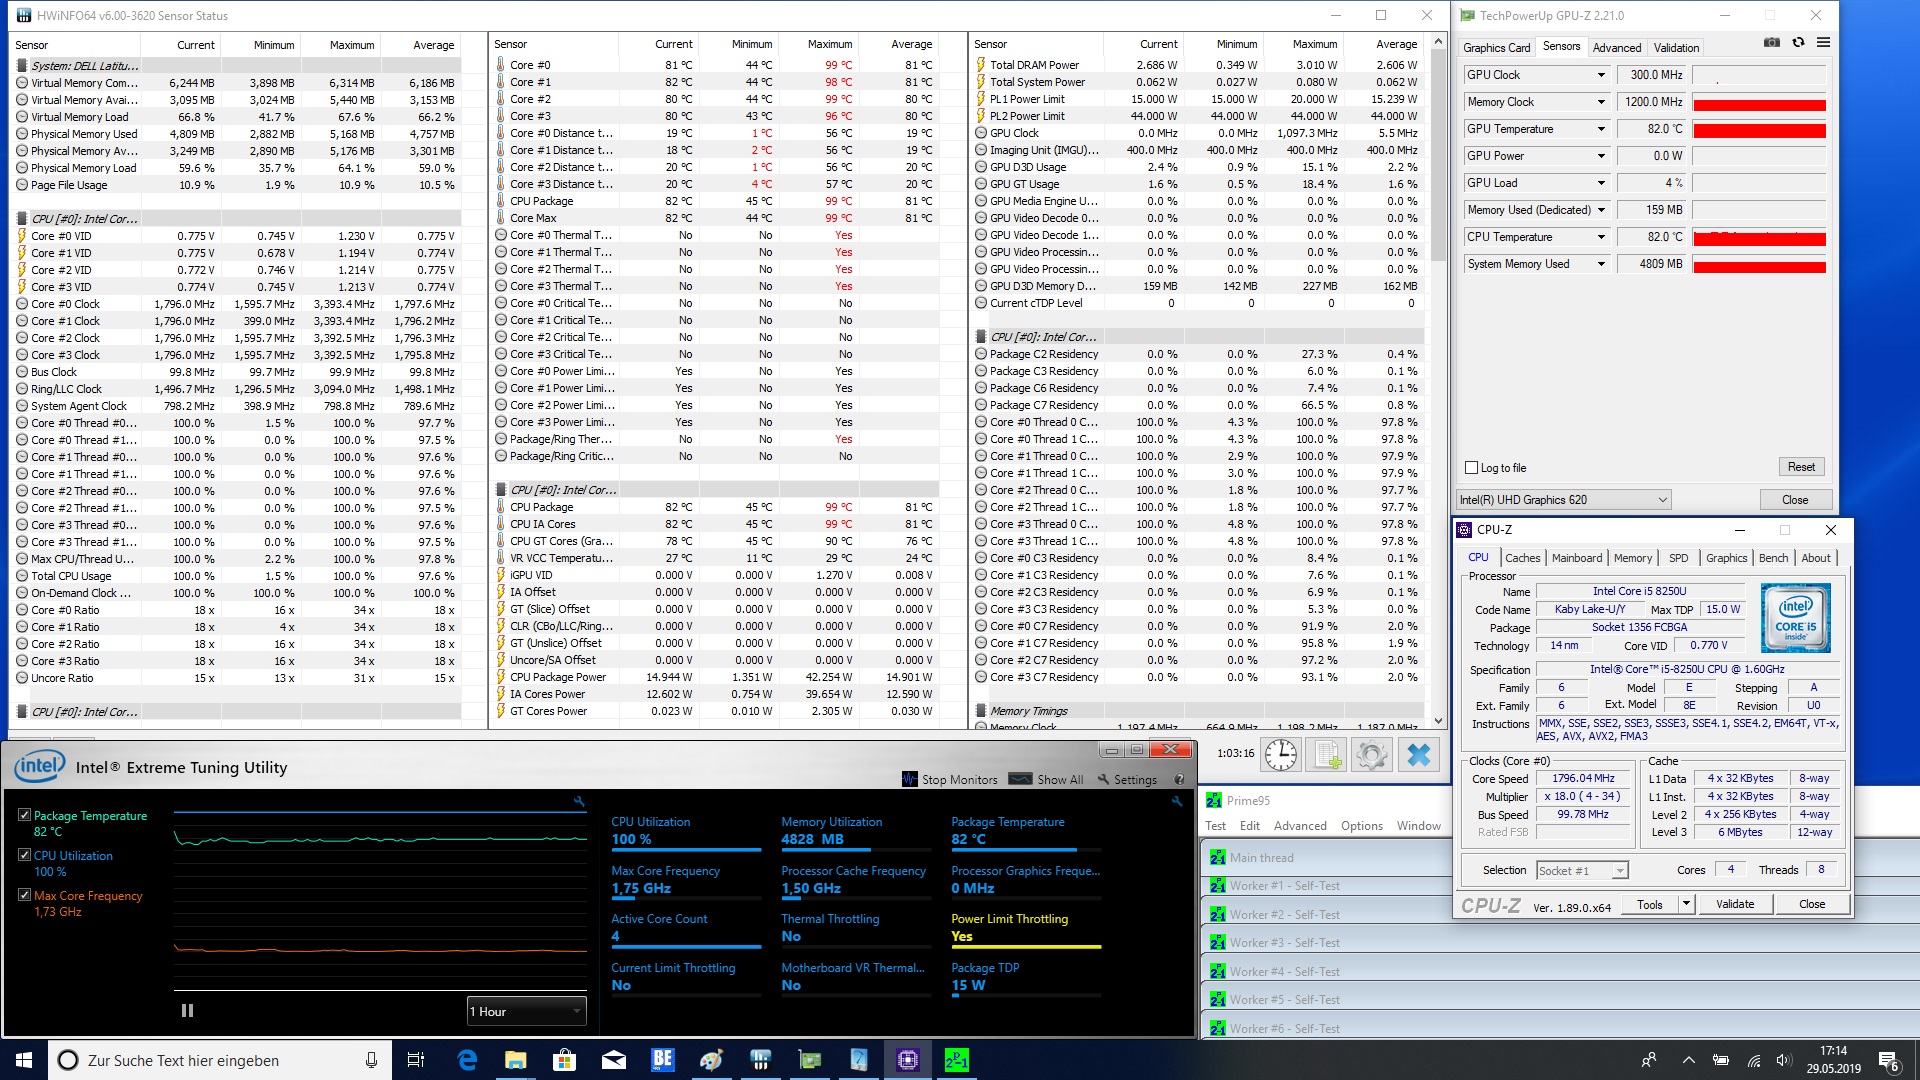
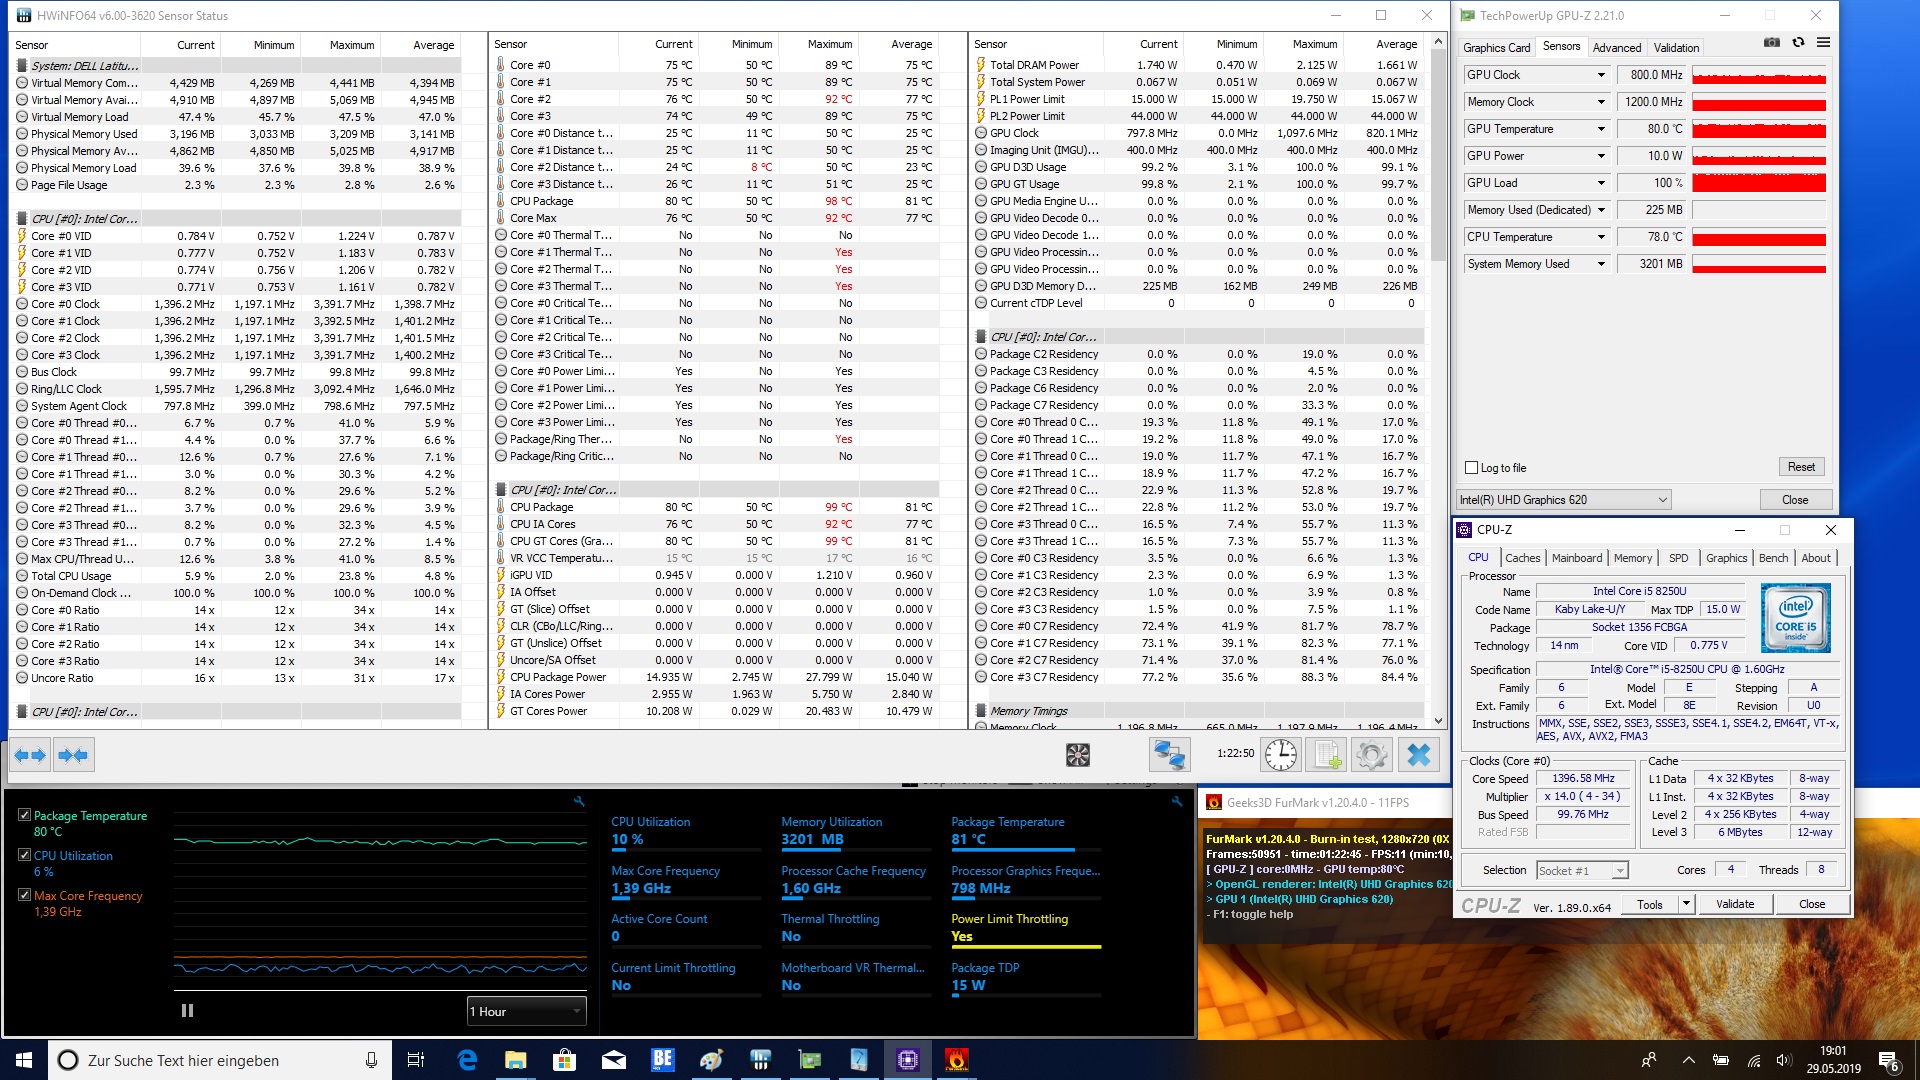
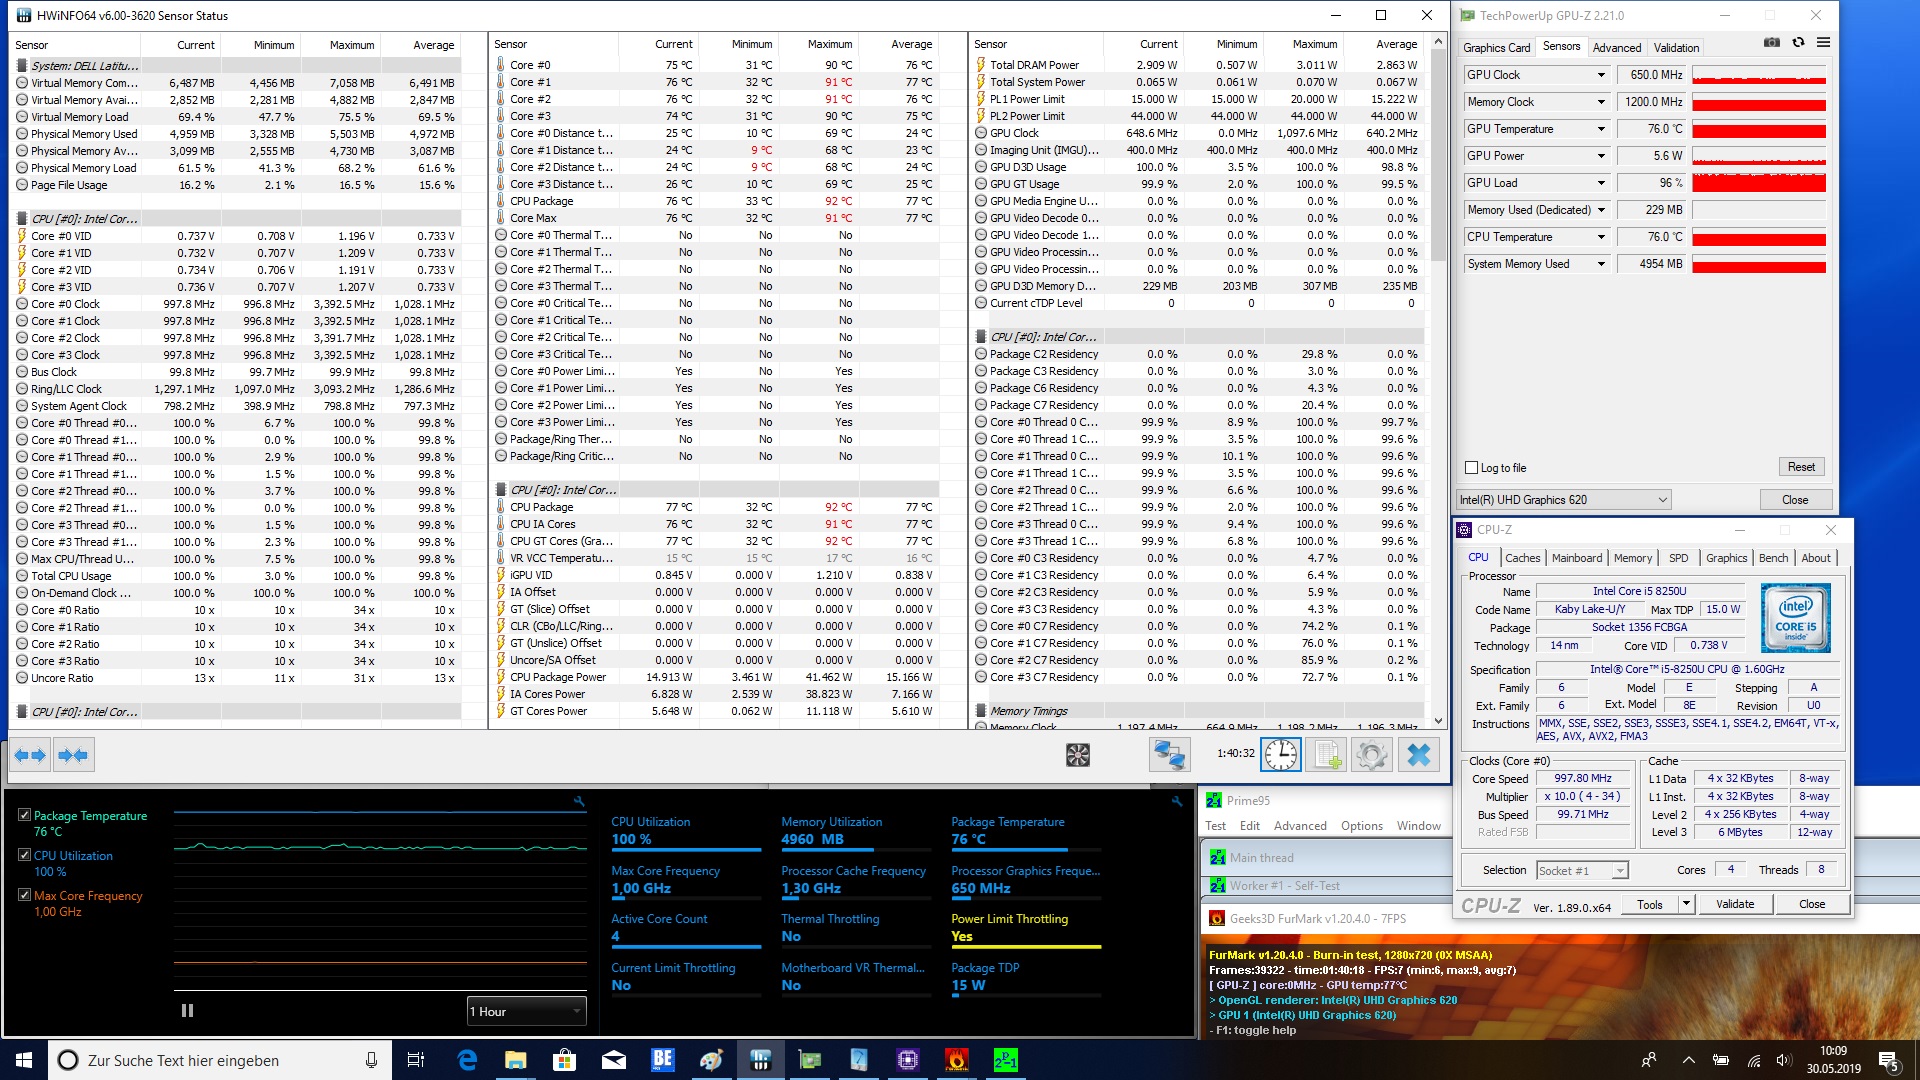
O Core i5-8250U quad-core é poderoso o suficiente para as tarefas mais exigentes, assim como os 8 GB de RAM. No entanto, eles não são preparados para o futuro e dão a impressão de que a Dell trouxe o Latitude 3390 ao mercado com um ano de atraso. O design também é parte dessa visão. O design simples parecerá elegante para algumas pessoas, mas os marcos de tela ampla parecem desatualizados. A Dell poderia ter facilmente equipado o Latitude 3390 com um painel de 14 polegadas dentro do mesmo chassi.
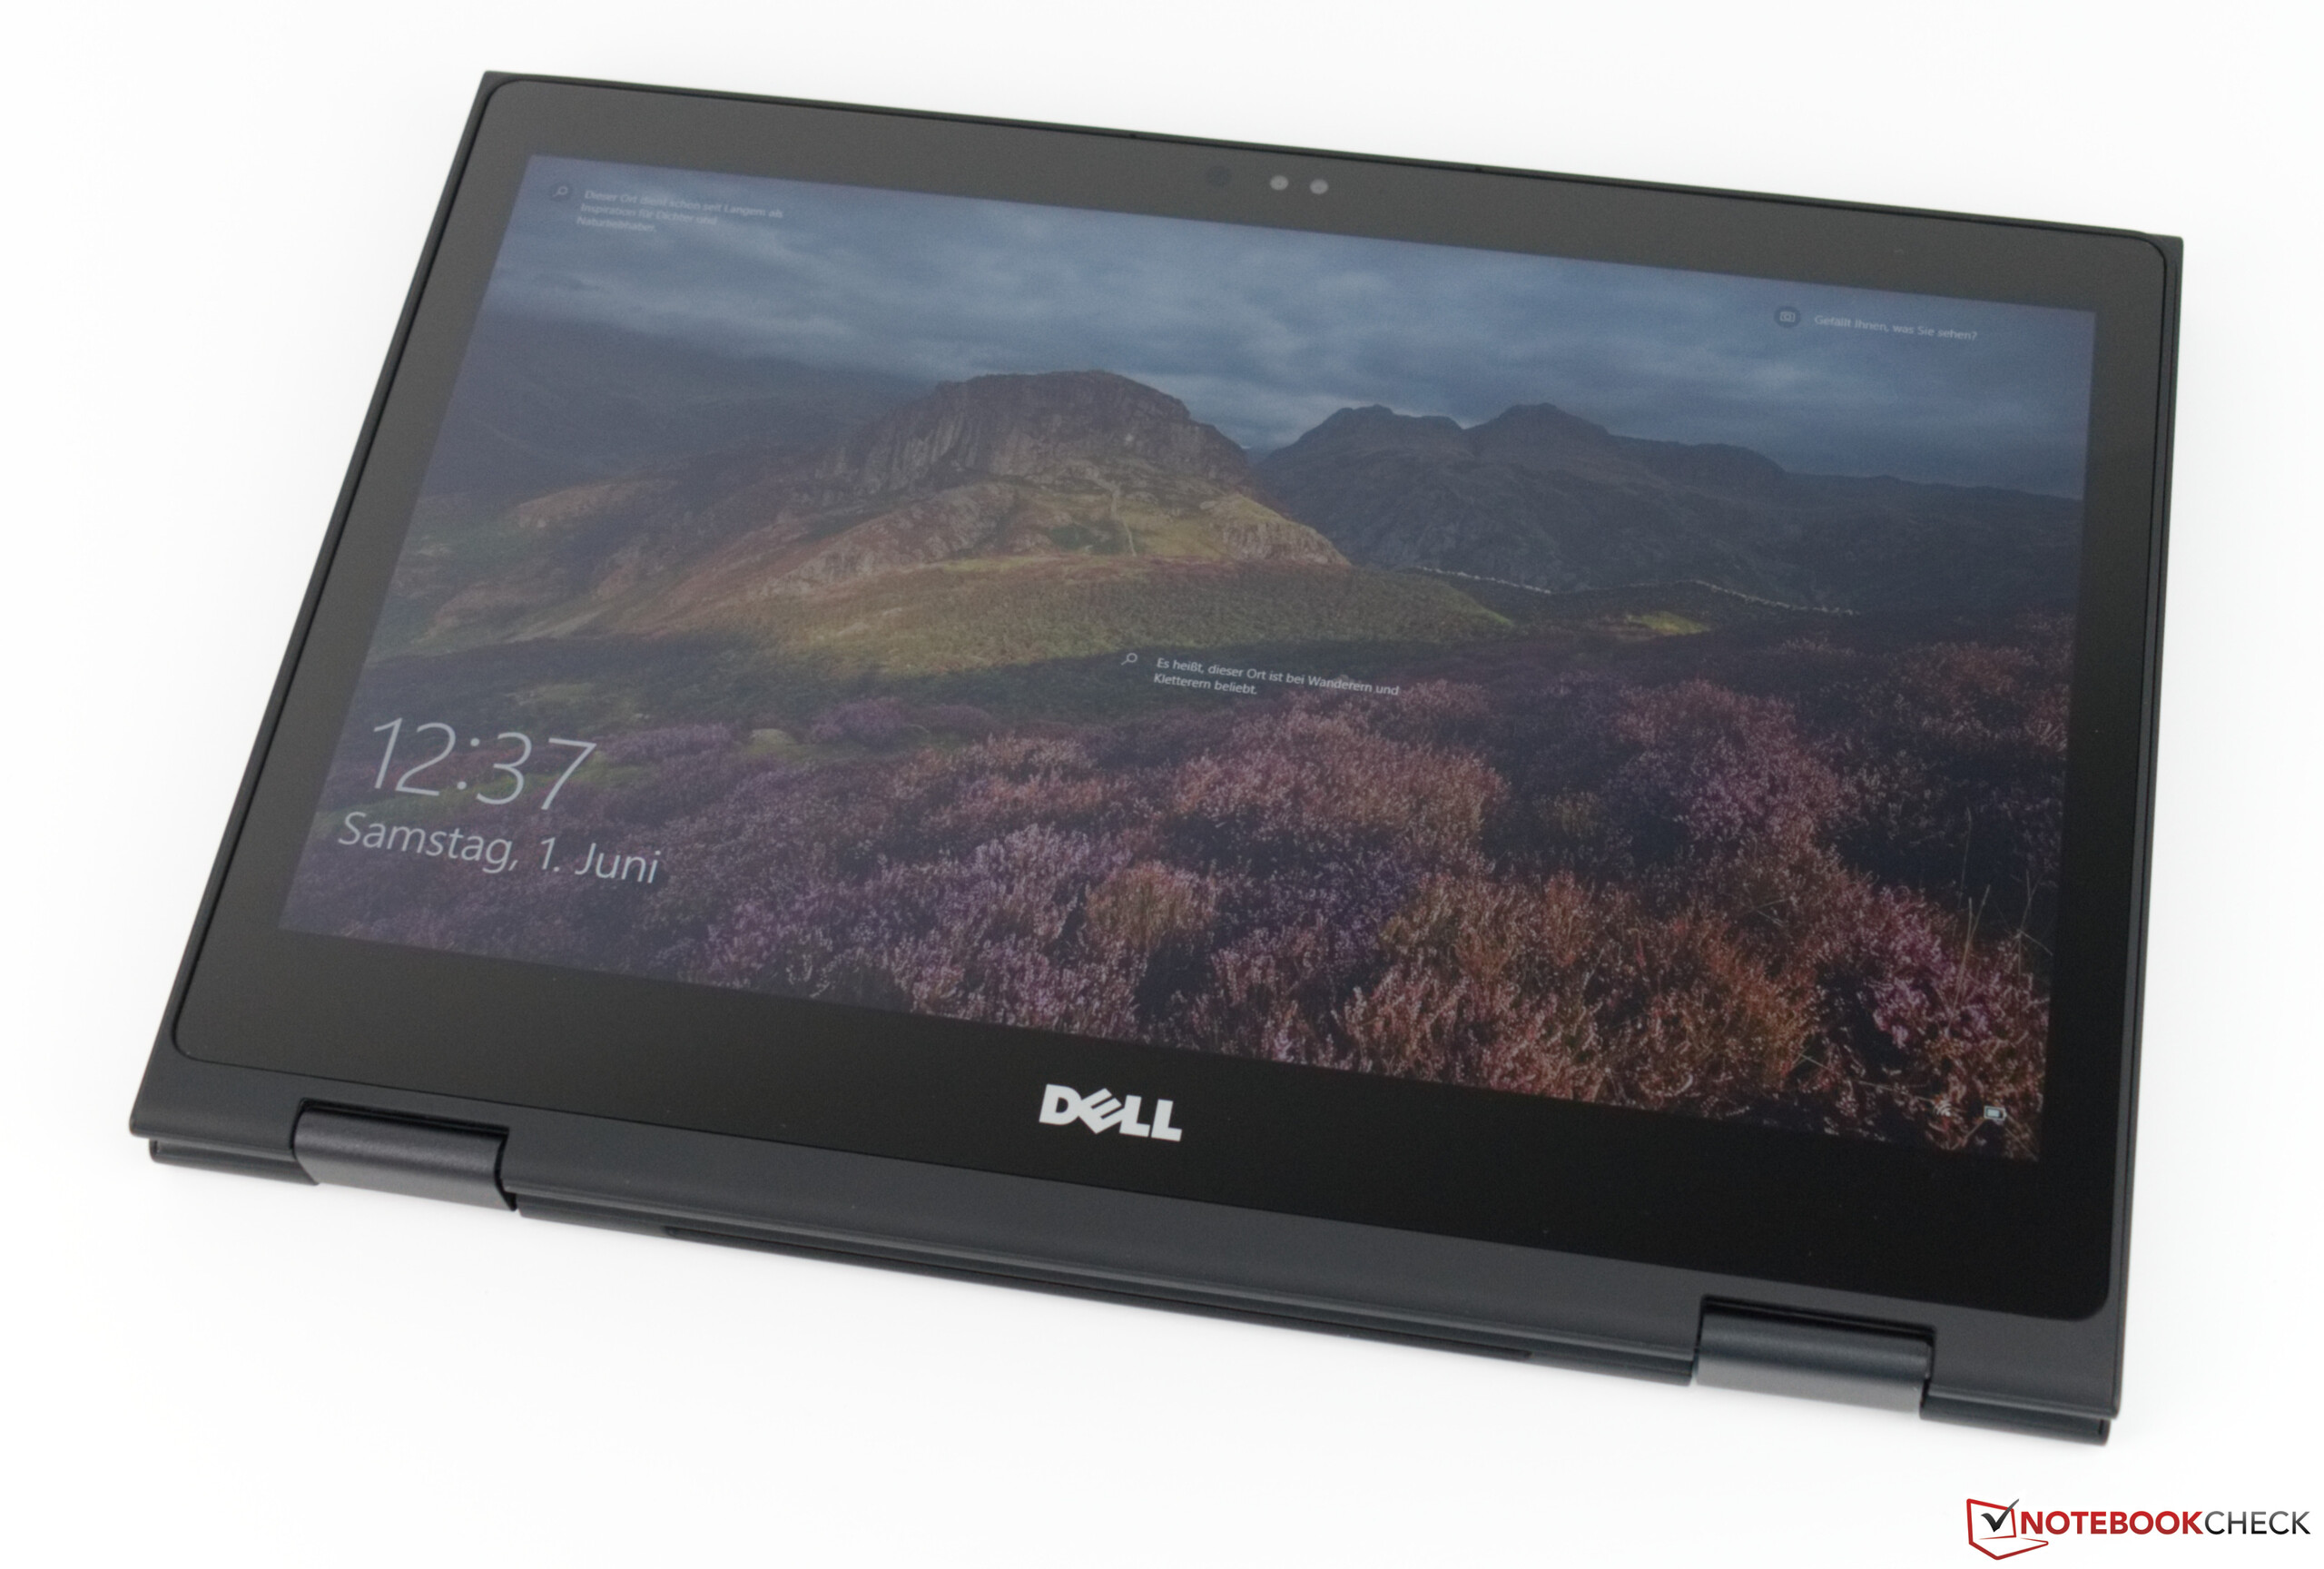
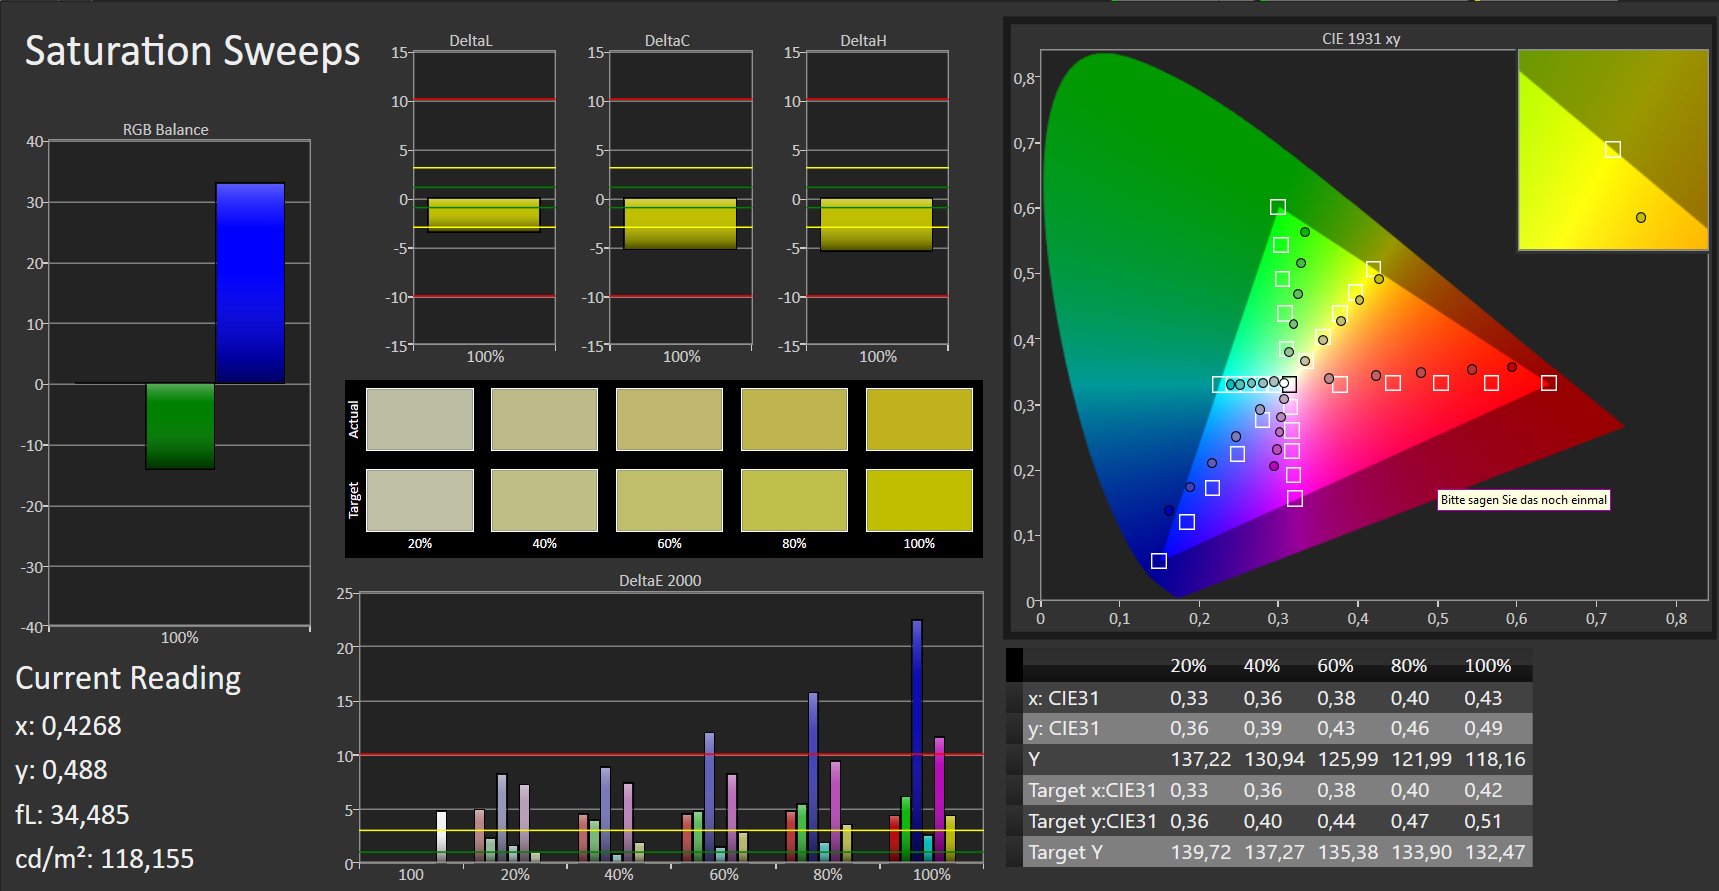
Enquanto estamos no assunto, a tela é uma das grandes decepções do Latitude 3390. É simplesmente muito escura, tornando muito desconfortáveis as tarefas em exteriores Da mesma forma, em nossa opinião, a cobertura de espaço de cores é muito baixa para um dispositivo de negócios.
O Dell Latitude 3390 deixa uma impressão ambígua. Não tem um ponto de venda exclusivo e não atende às expectativas do que um conversível empresarial deveria ser.
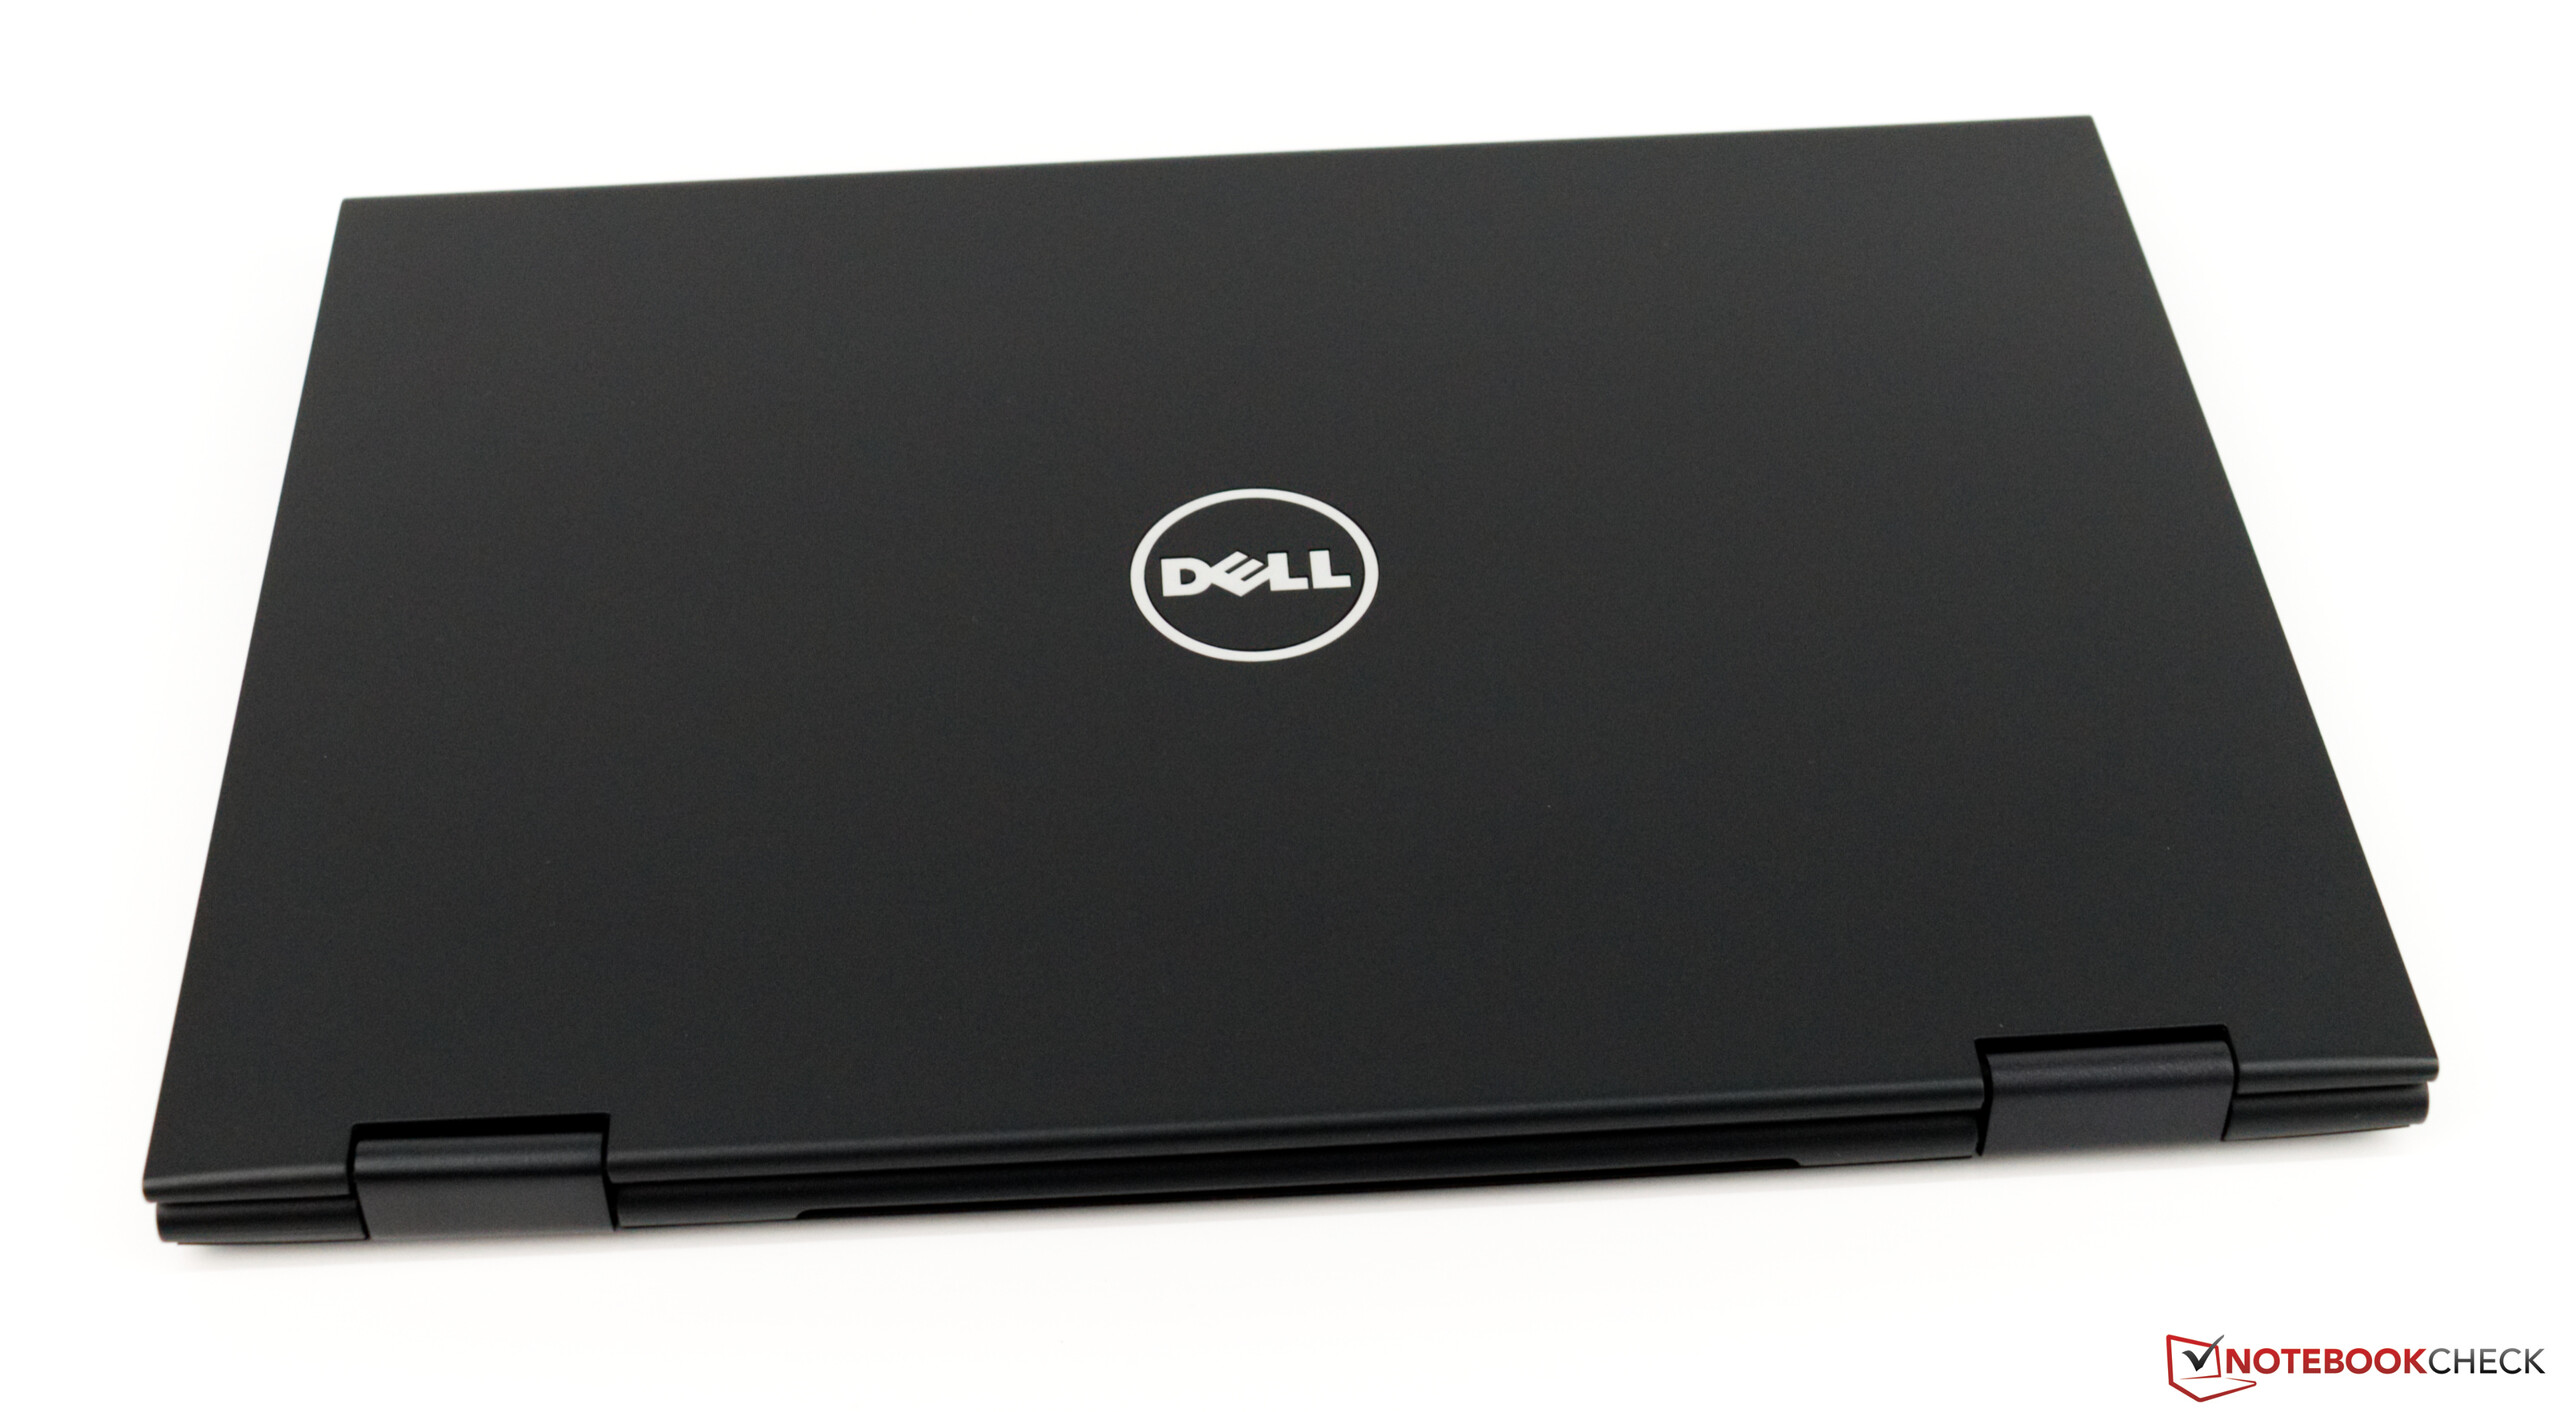
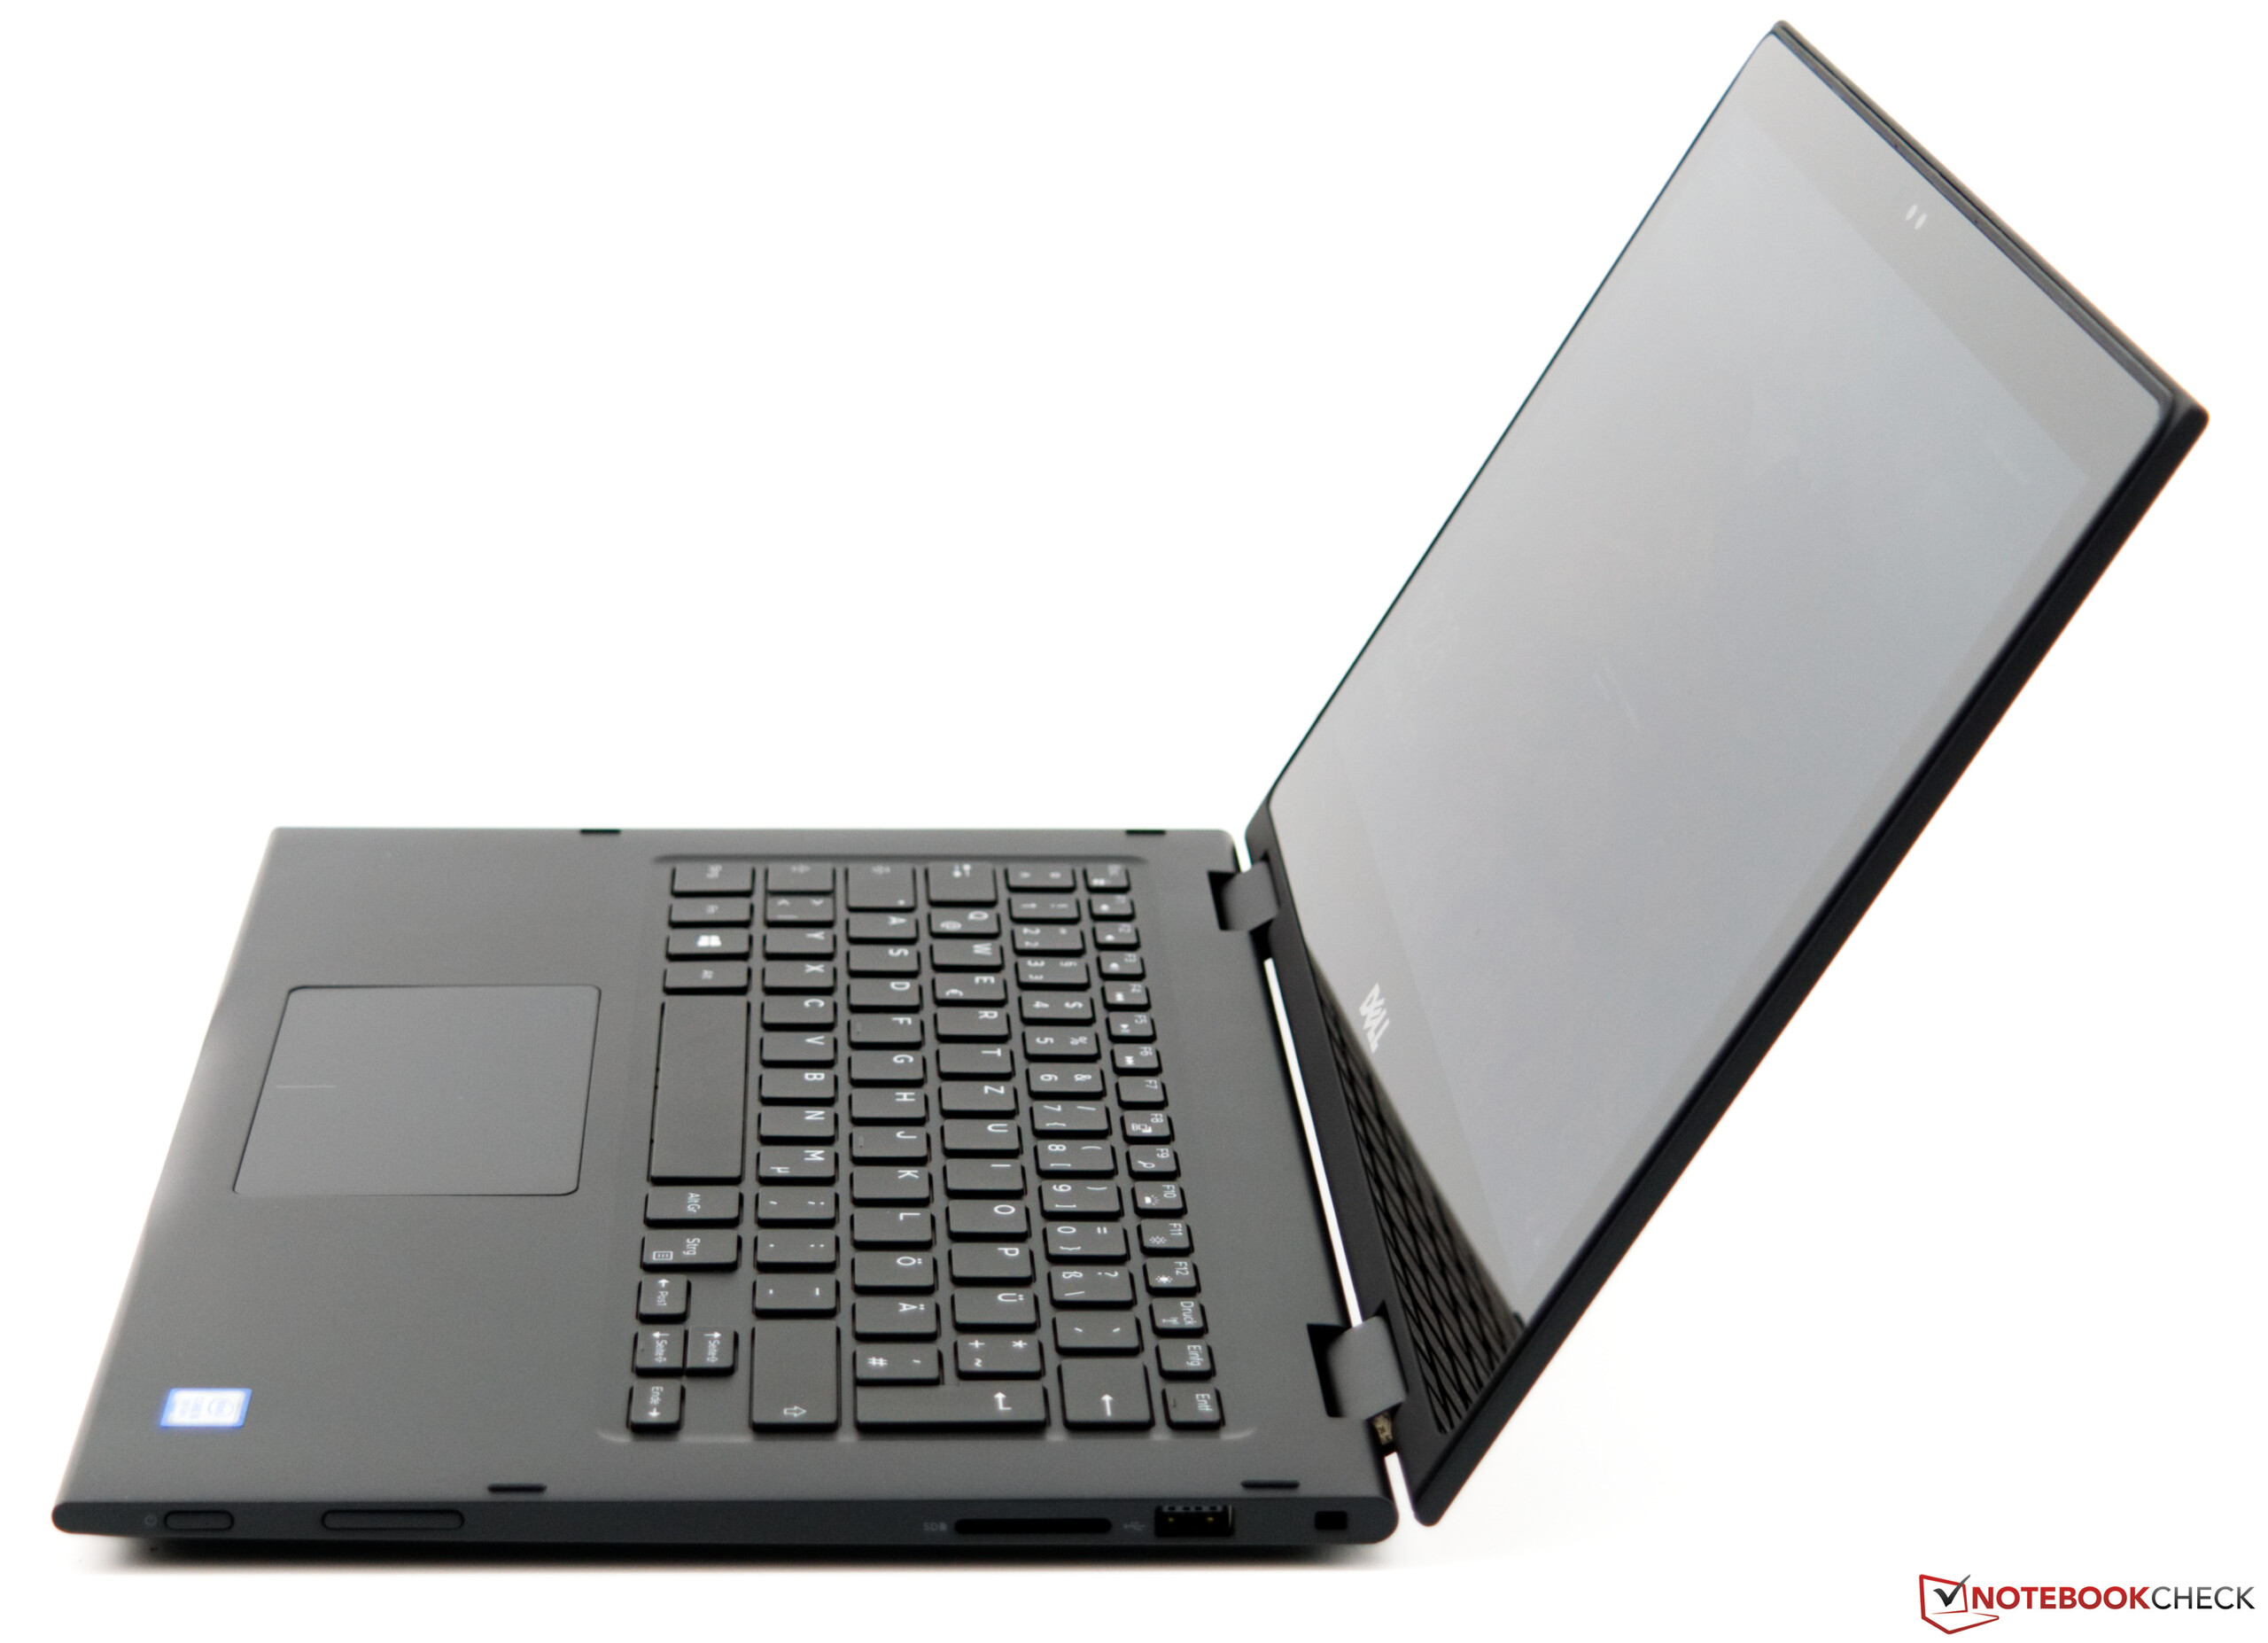
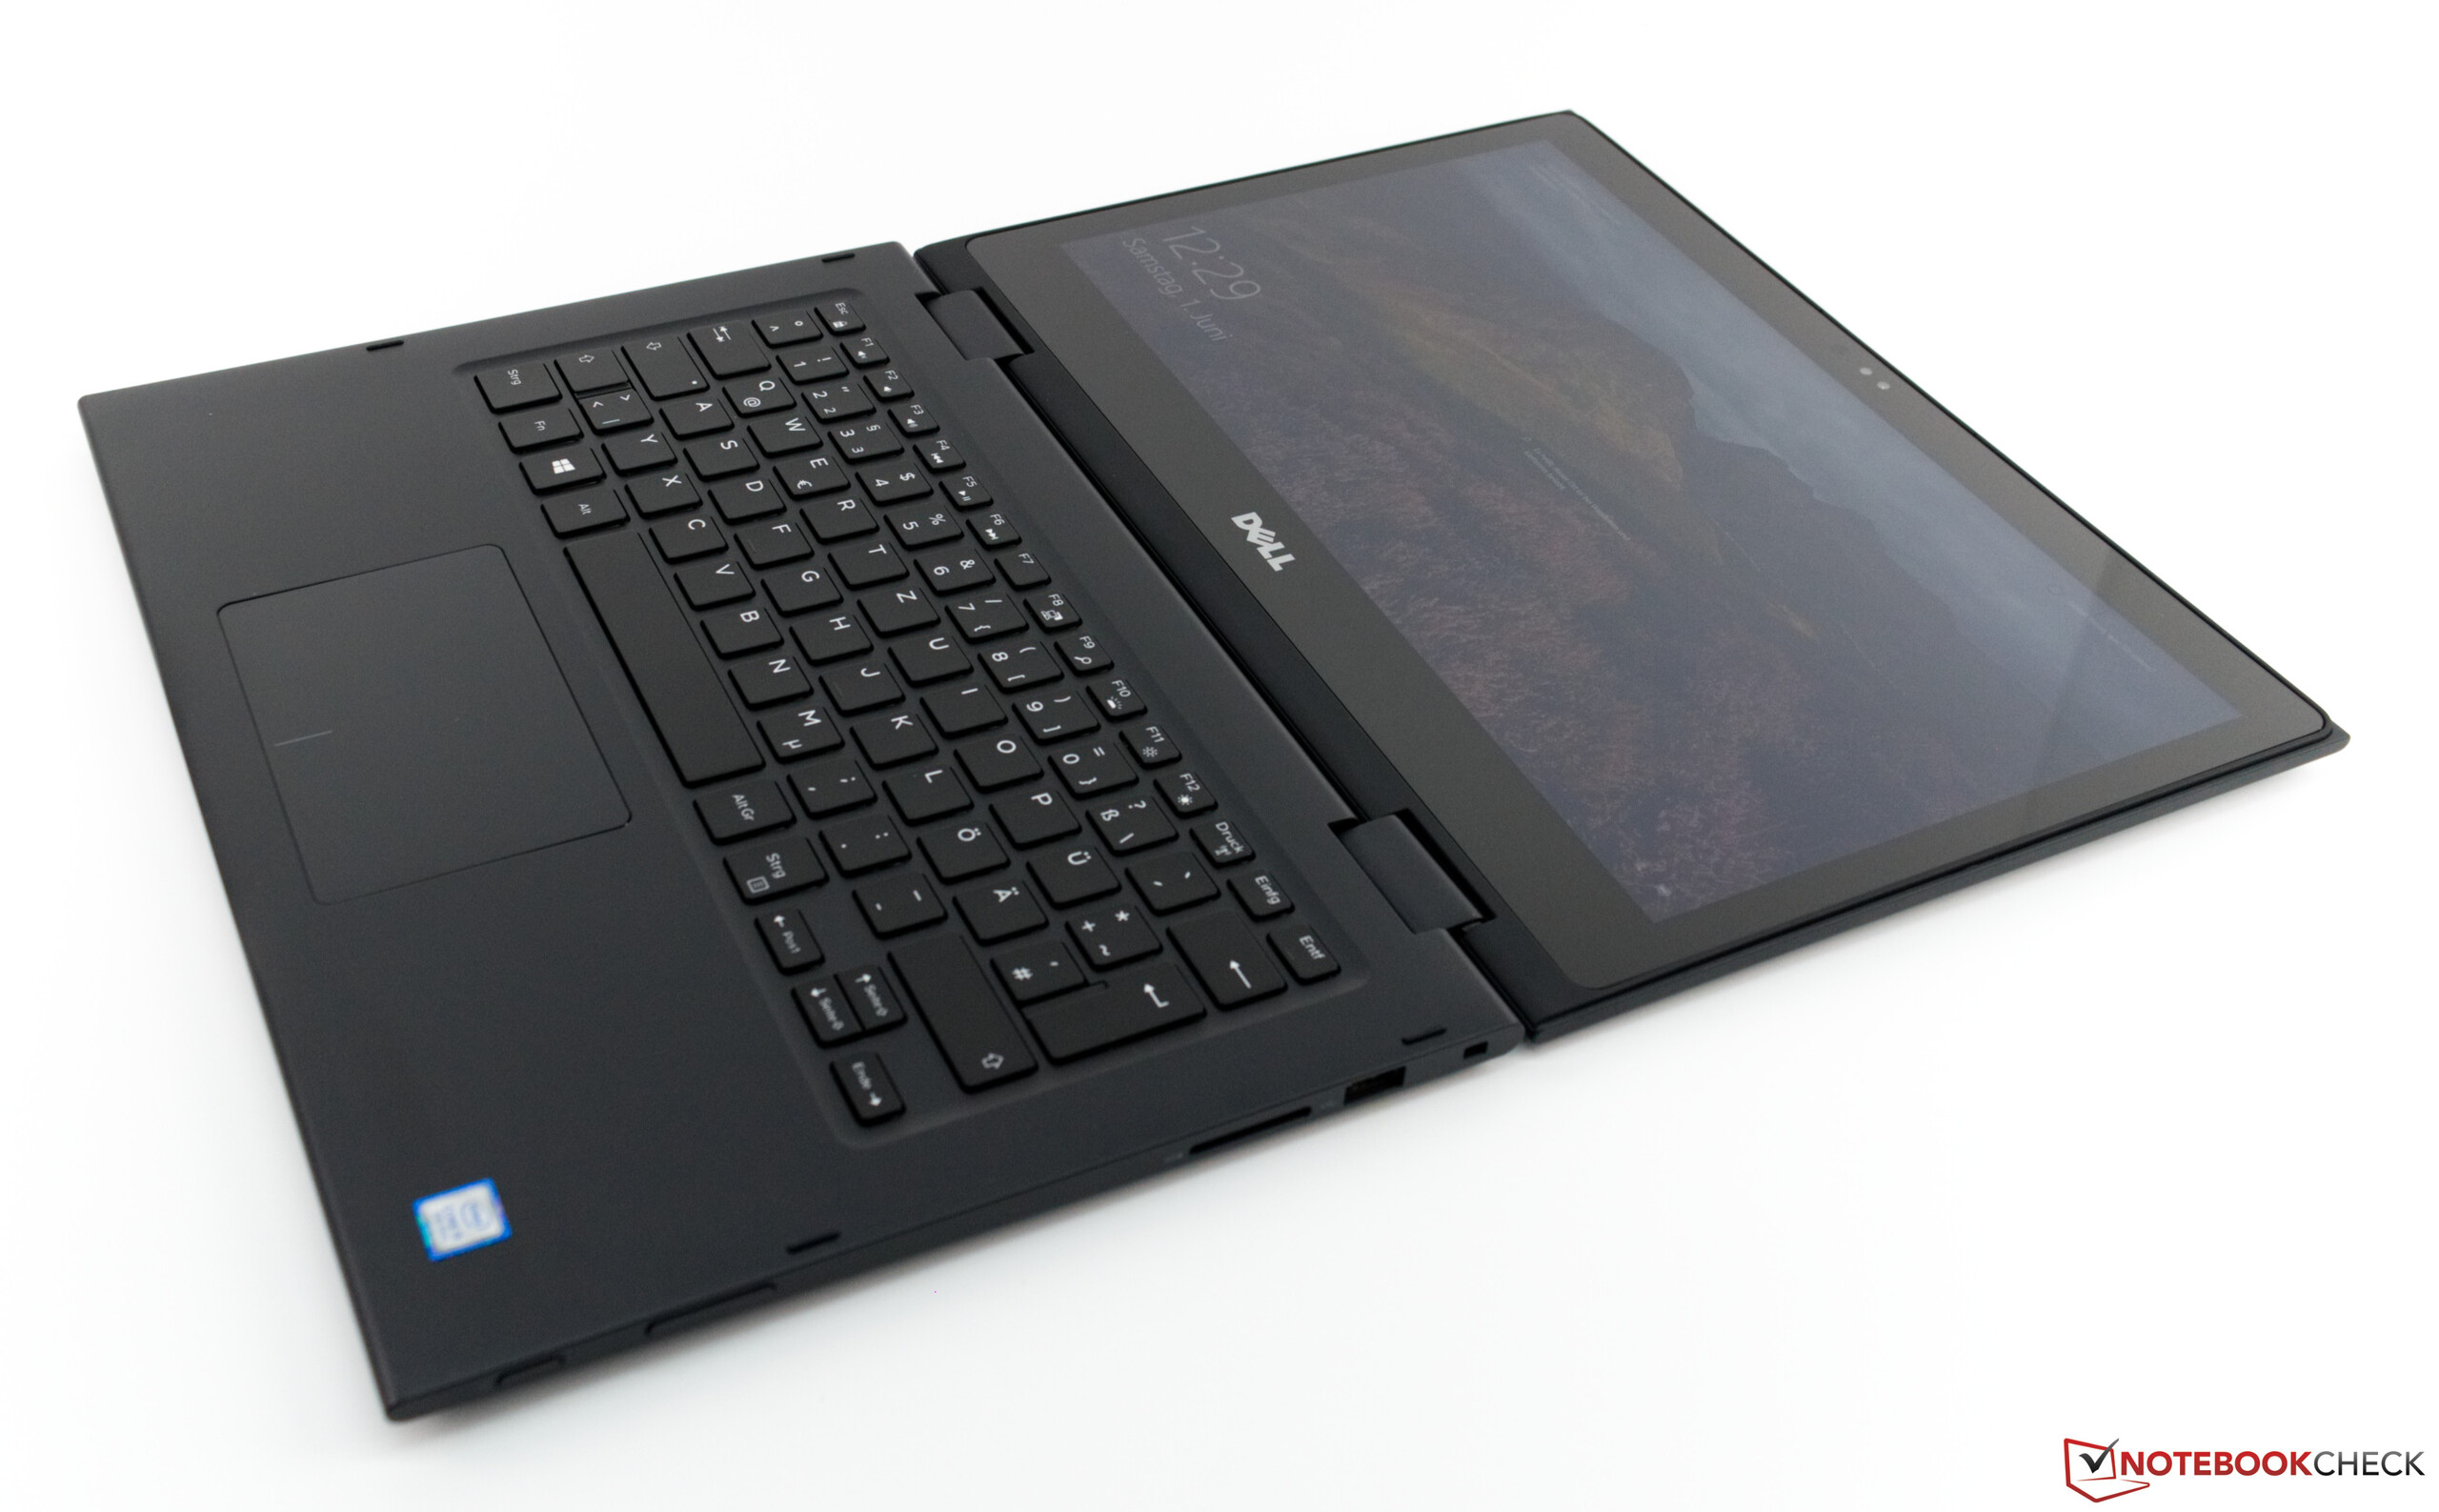
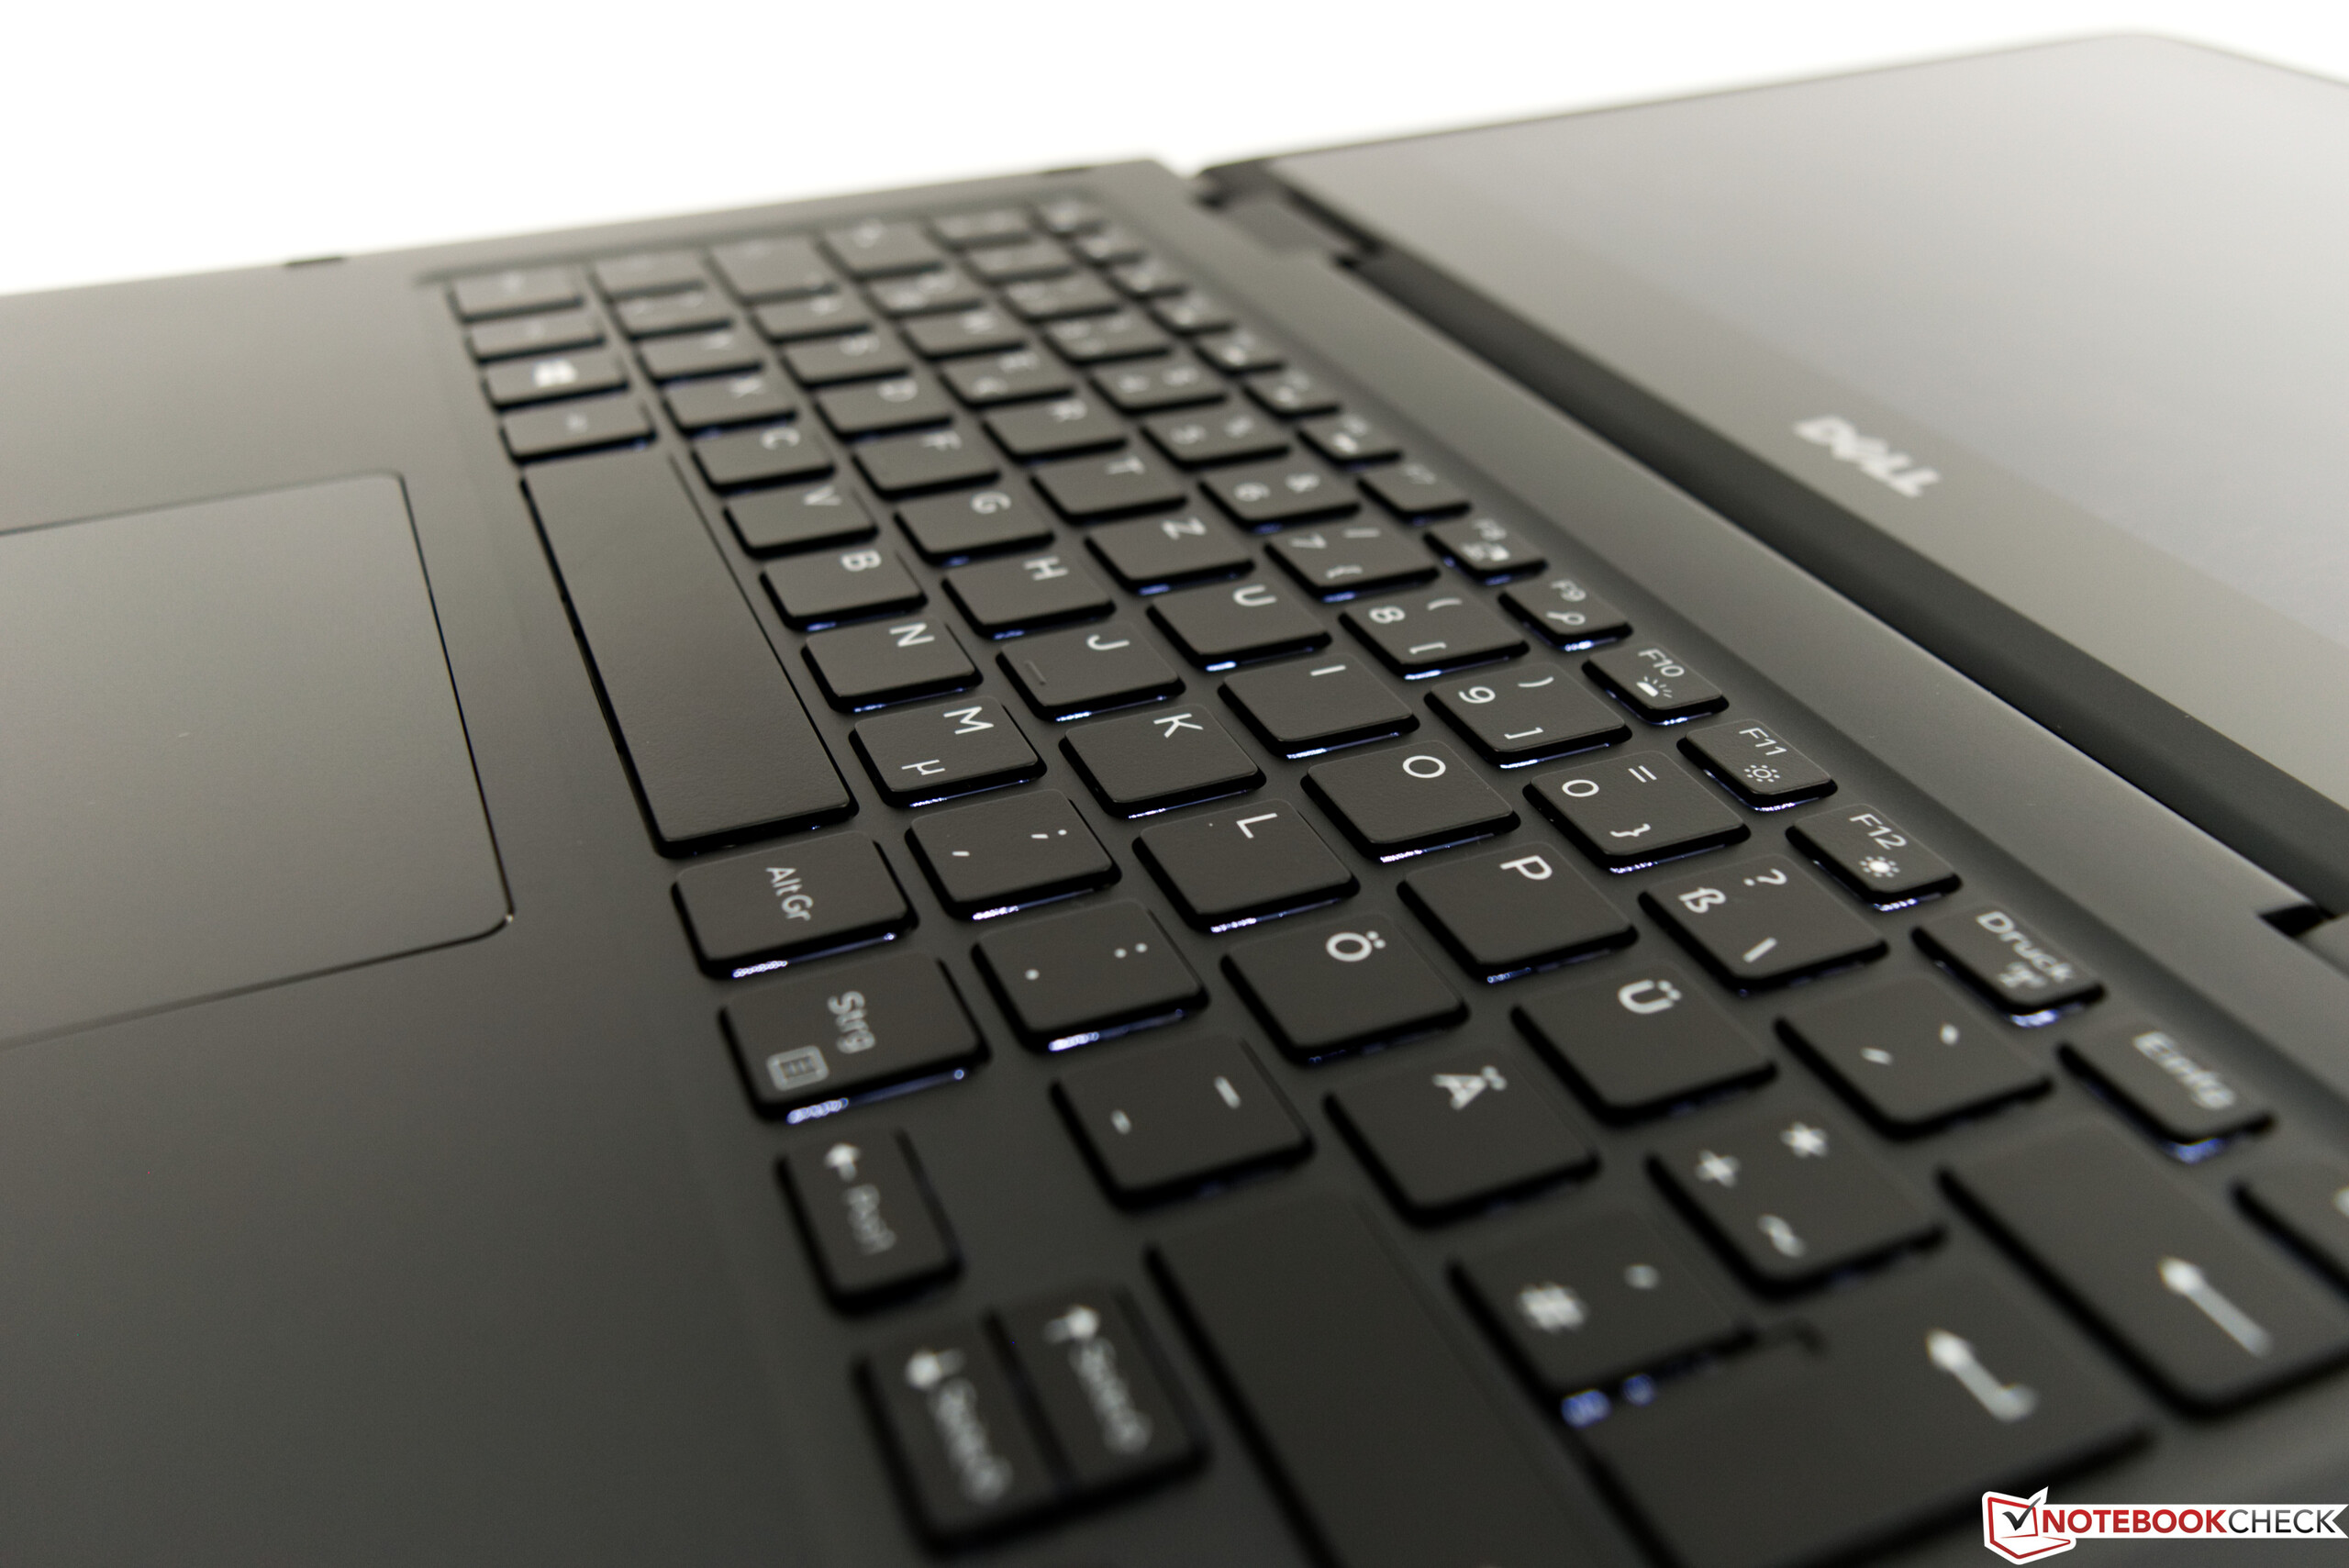
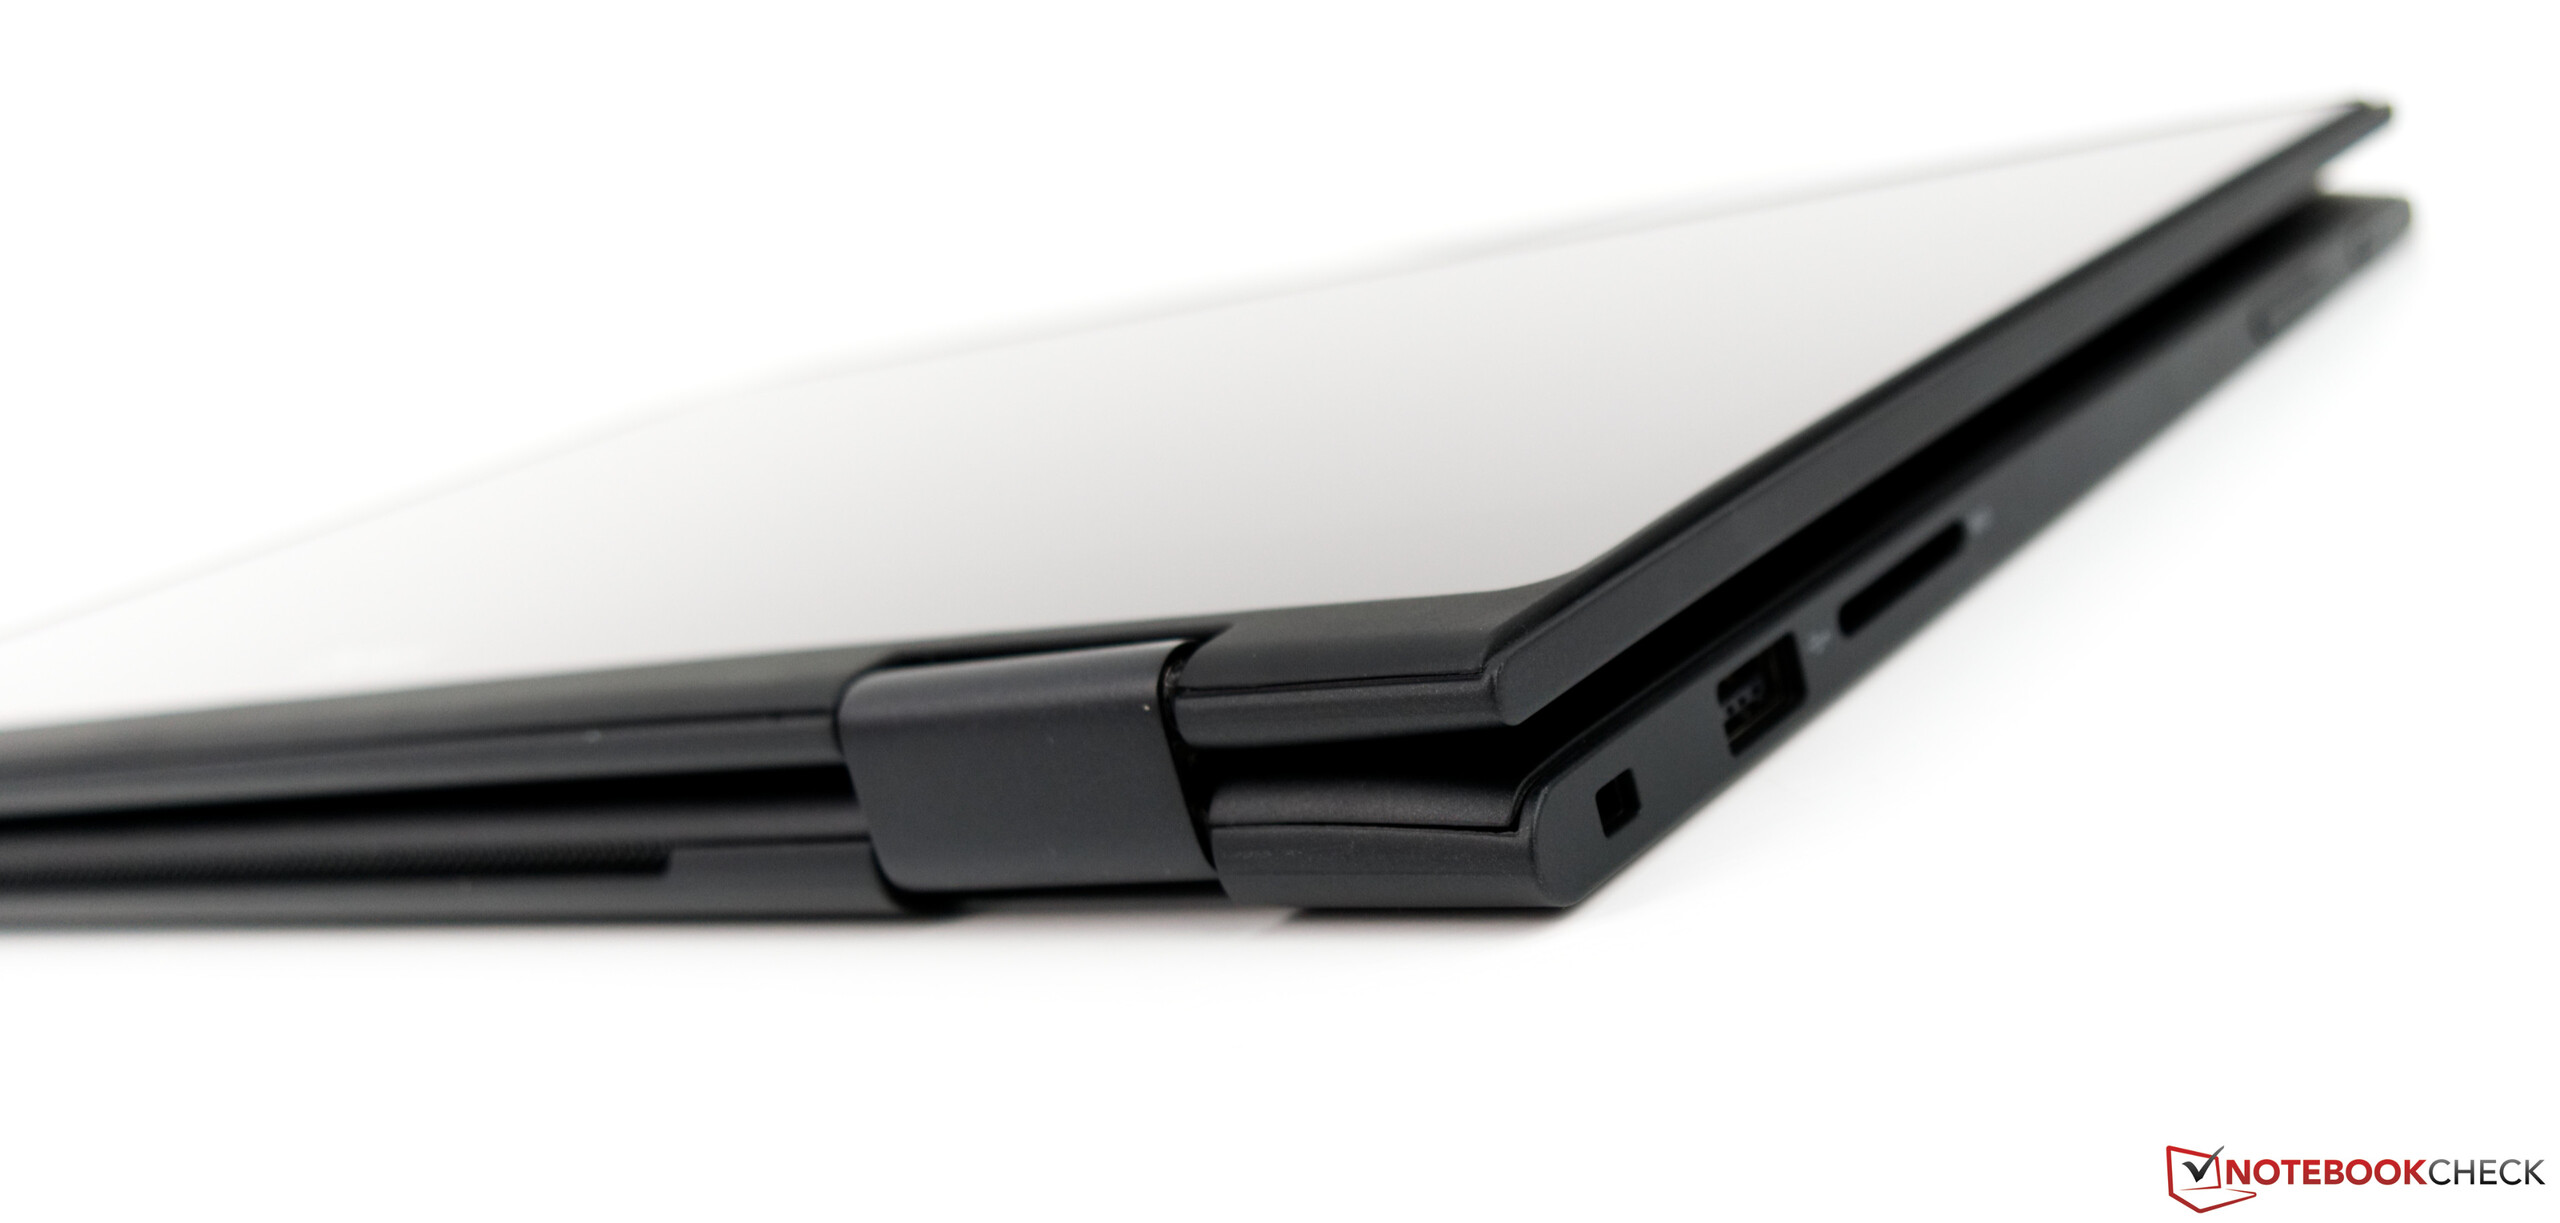
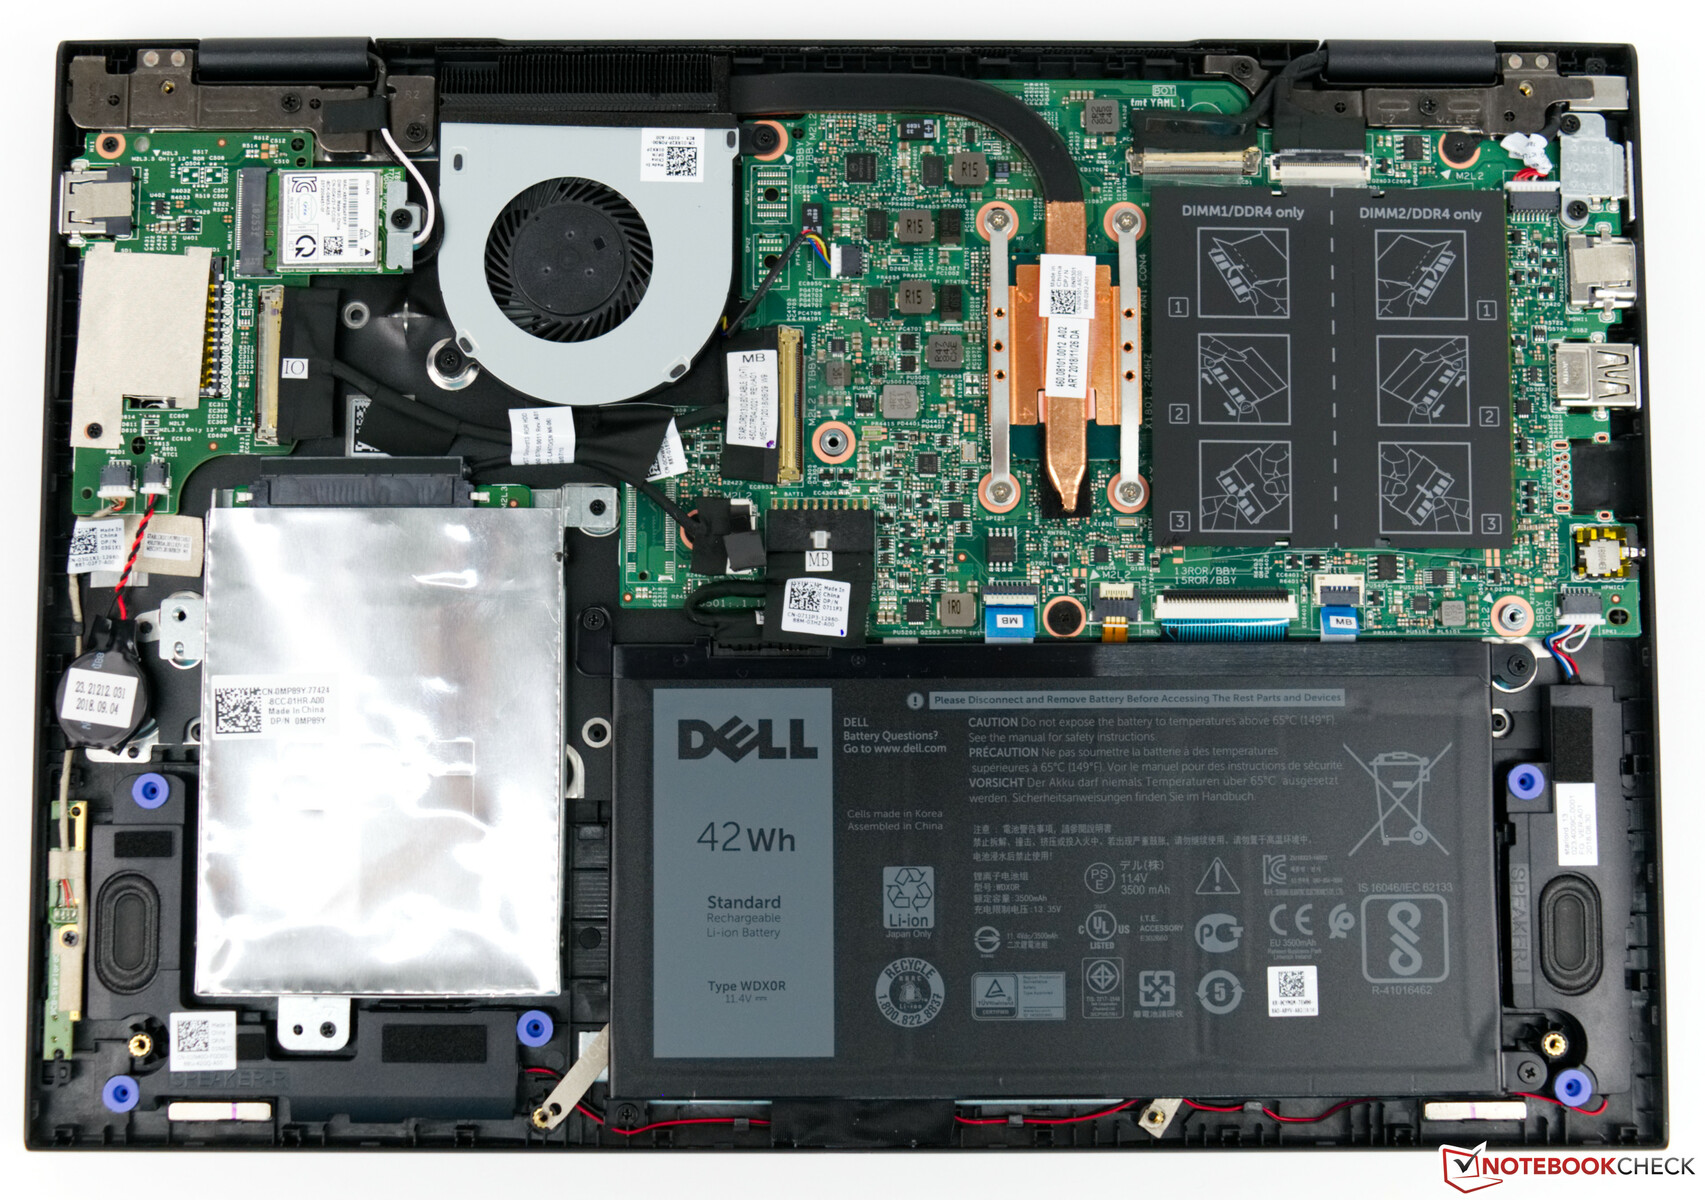
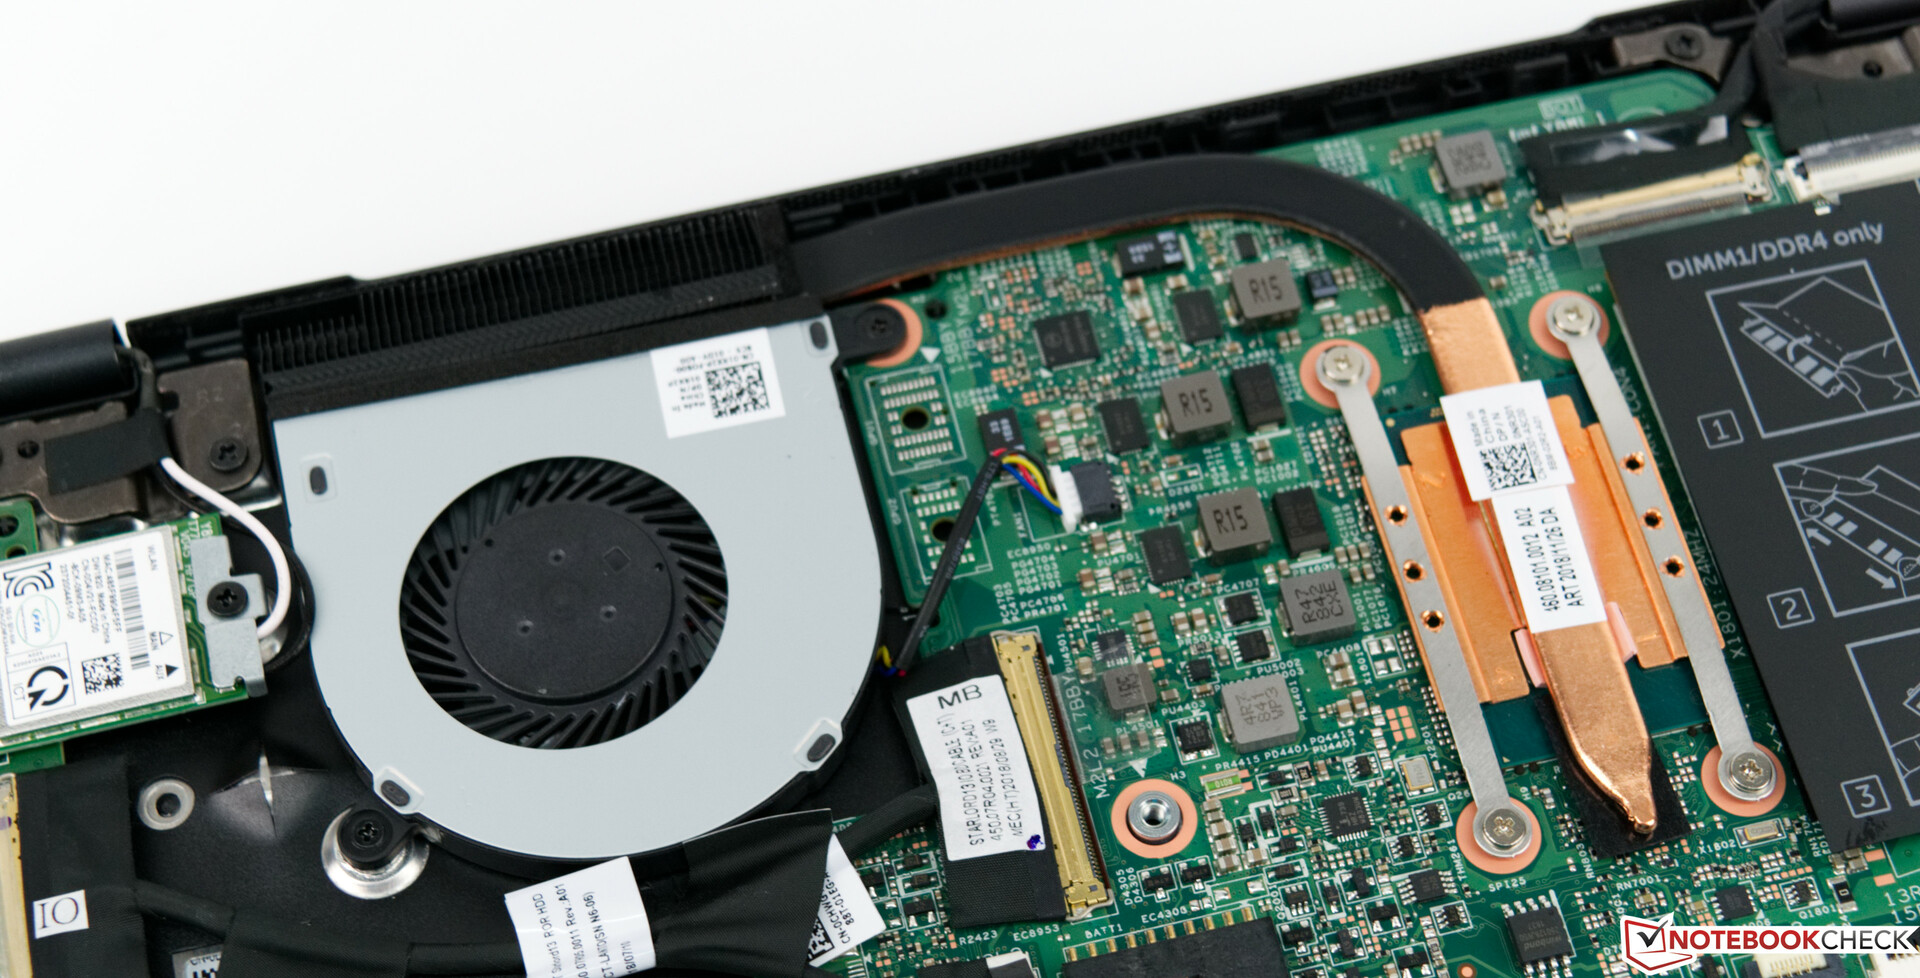
No entanto, nem tudo são más notícias. A Dell construiu o Latitude 3390 com fibra de carbono reciclada, o que torna a nossa unidade de teste mais robusta. Ao mesmo tempo, mantém o peso total abaixo dos 1,6 kg. A tela táctil, o trackpad e o teclado também são decentes, embora o último não esteja no mesmo nível que os concorrentes do ThinkPad. O Latitude 3390 também é extremamente eficiente em termos de energia e tem alto-falantes amplos, mas é provável que eles sejam esquecidos quando as pessoas experimentem sua tela.
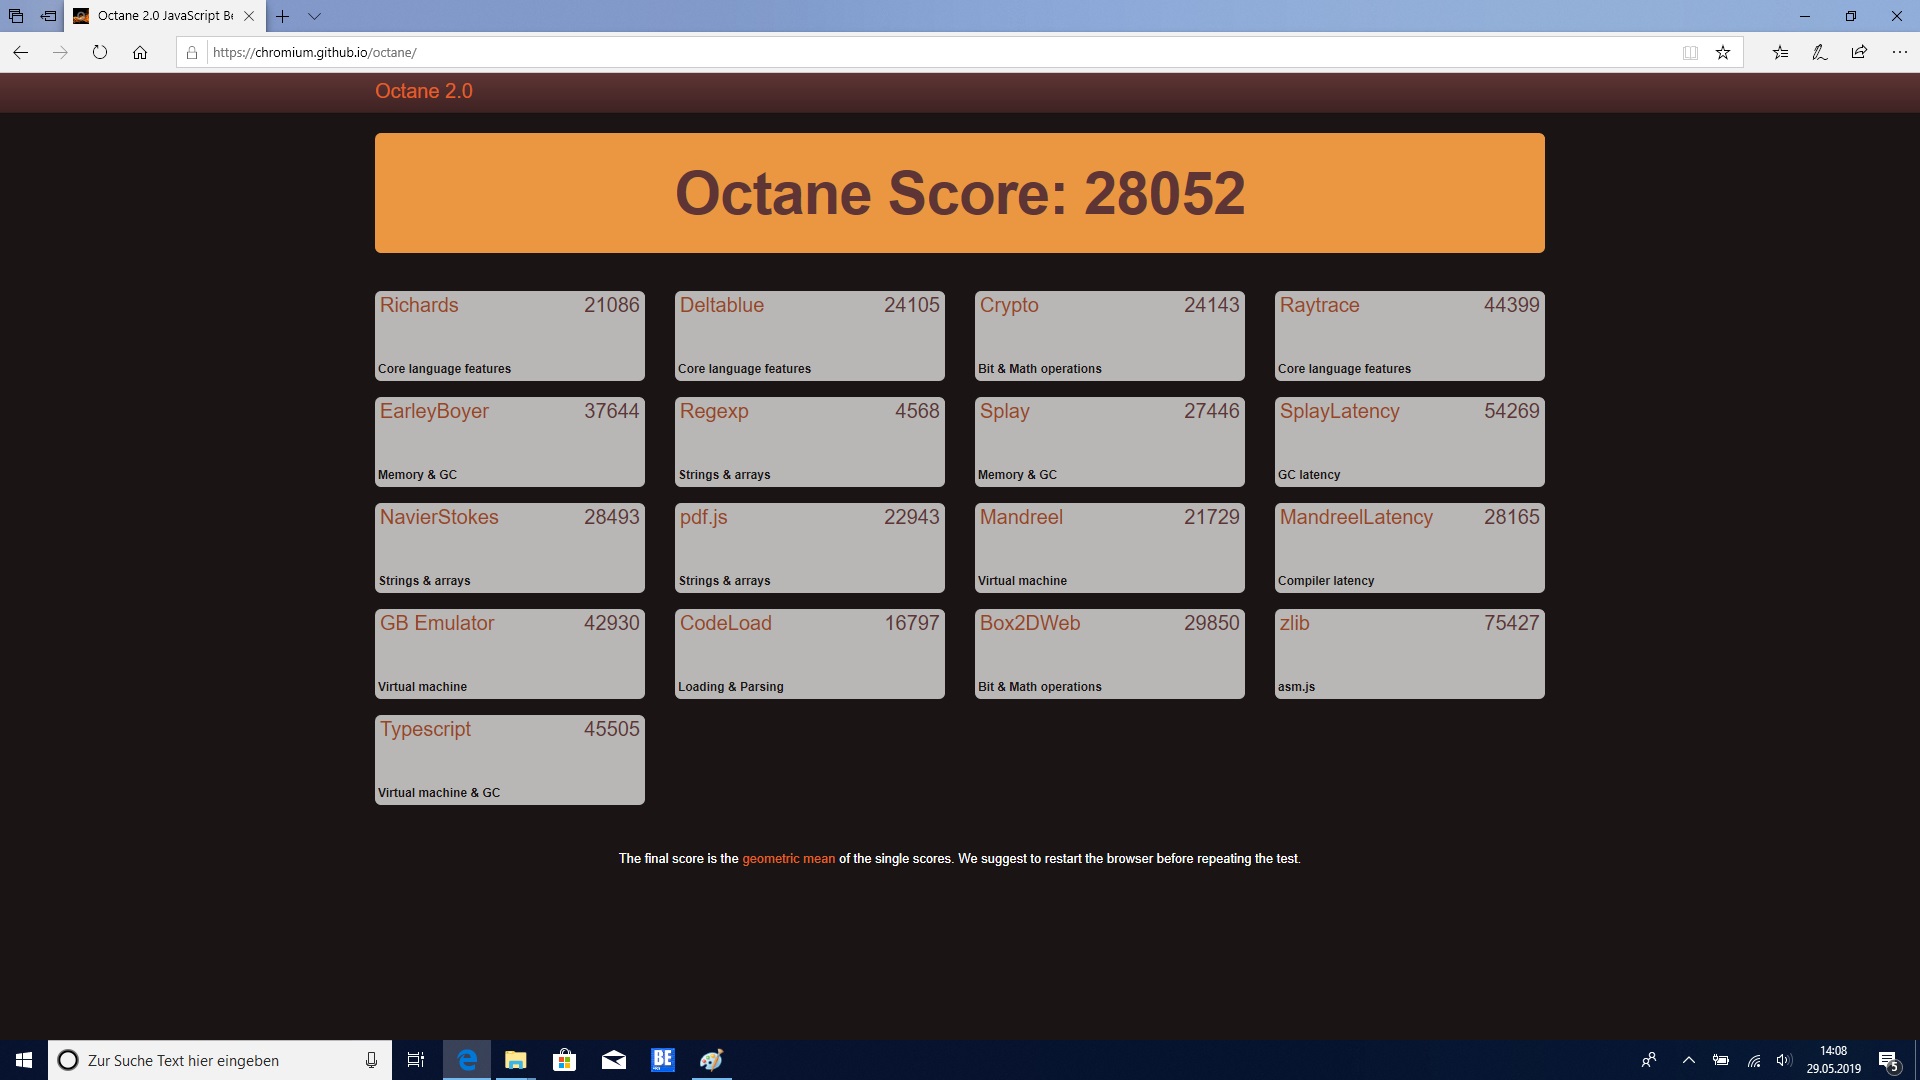
The Dell Latitude 3390 is a reasonably priced 13.3-inch business convertible. Our review unit comes with an Intel Core i5-8250U processor, 8 GB of RAM and a 256 GB SSD, which makes it well equipped for its 999-Euro (~$1,130) retail price. In short, the Latitude 3390 in the configuration that we tested is comparatively cheap for a business device and is a decent alternative to consumer-grade laptops for private buyers too.
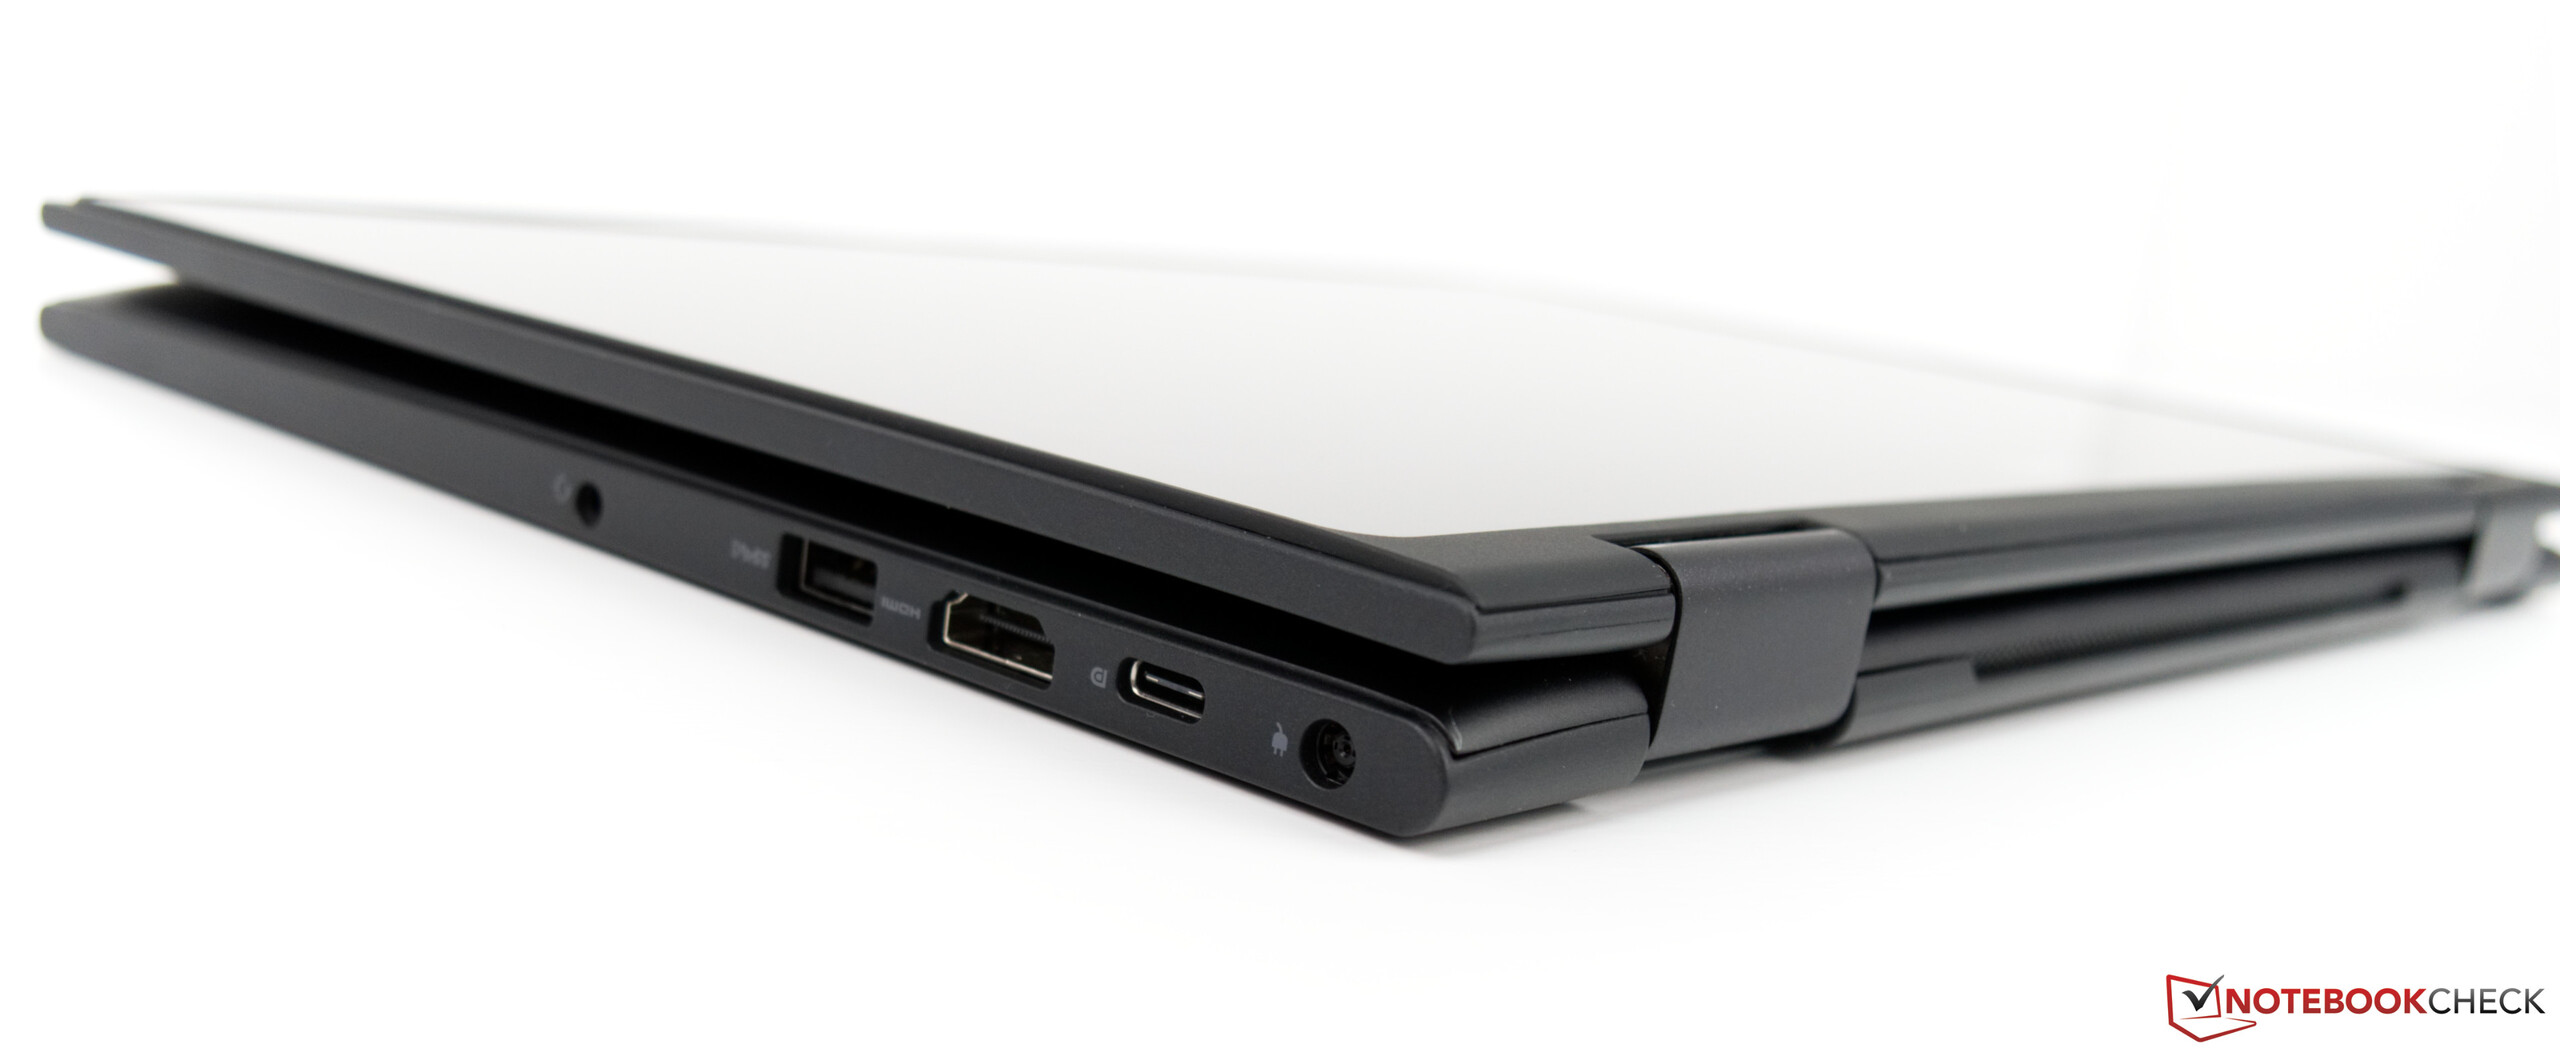
Unfortunately, the device lacks important business features like optional LTE connectivity and security features like a fingerprint sensor. Hence, the Latitude 3390 will probably prove an unattractive option for professionals.
The quad-core Core i5-8250U is powerful enough for most demanding tasks though, as is the 8 GB of RAM. However, they are not future-proofed and give the impression that Dell has brought the Latitude 3390 to market a year late. The design compounds this view too. The simple design will look elegant to some people, but the wide display bezels look outdated. Dell could have easily equipped the Latitude 3390 with a 14-inch panel within the same chassis.
While we are on the subject, the display is one of the big let-downs of the Latitude 3390. It is simply too dark, making outdoor use a chore. Likewise, the colour-space coverage is too low for a business device in our opinion.
The Dell Latitude 3390 leaves an ambiguous impression. It has no unique selling point and does not meet expectations of what a business convertible should be.
It is not all bad news though. Dell has built the Latitude 3390 with recycled carbon fibre, which makes our review unit feel sturdy. At the same time, it keeps the overall weight below 1.6 kg. The touchscreen, trackpad and keyboard are decent too, although the latter is not in the same league as its ThinkPad competitors. The Latitude 3390 is impressively energy-efficient too and has full-bodied speakers, but these are likely to be forgotten when people experience its display.
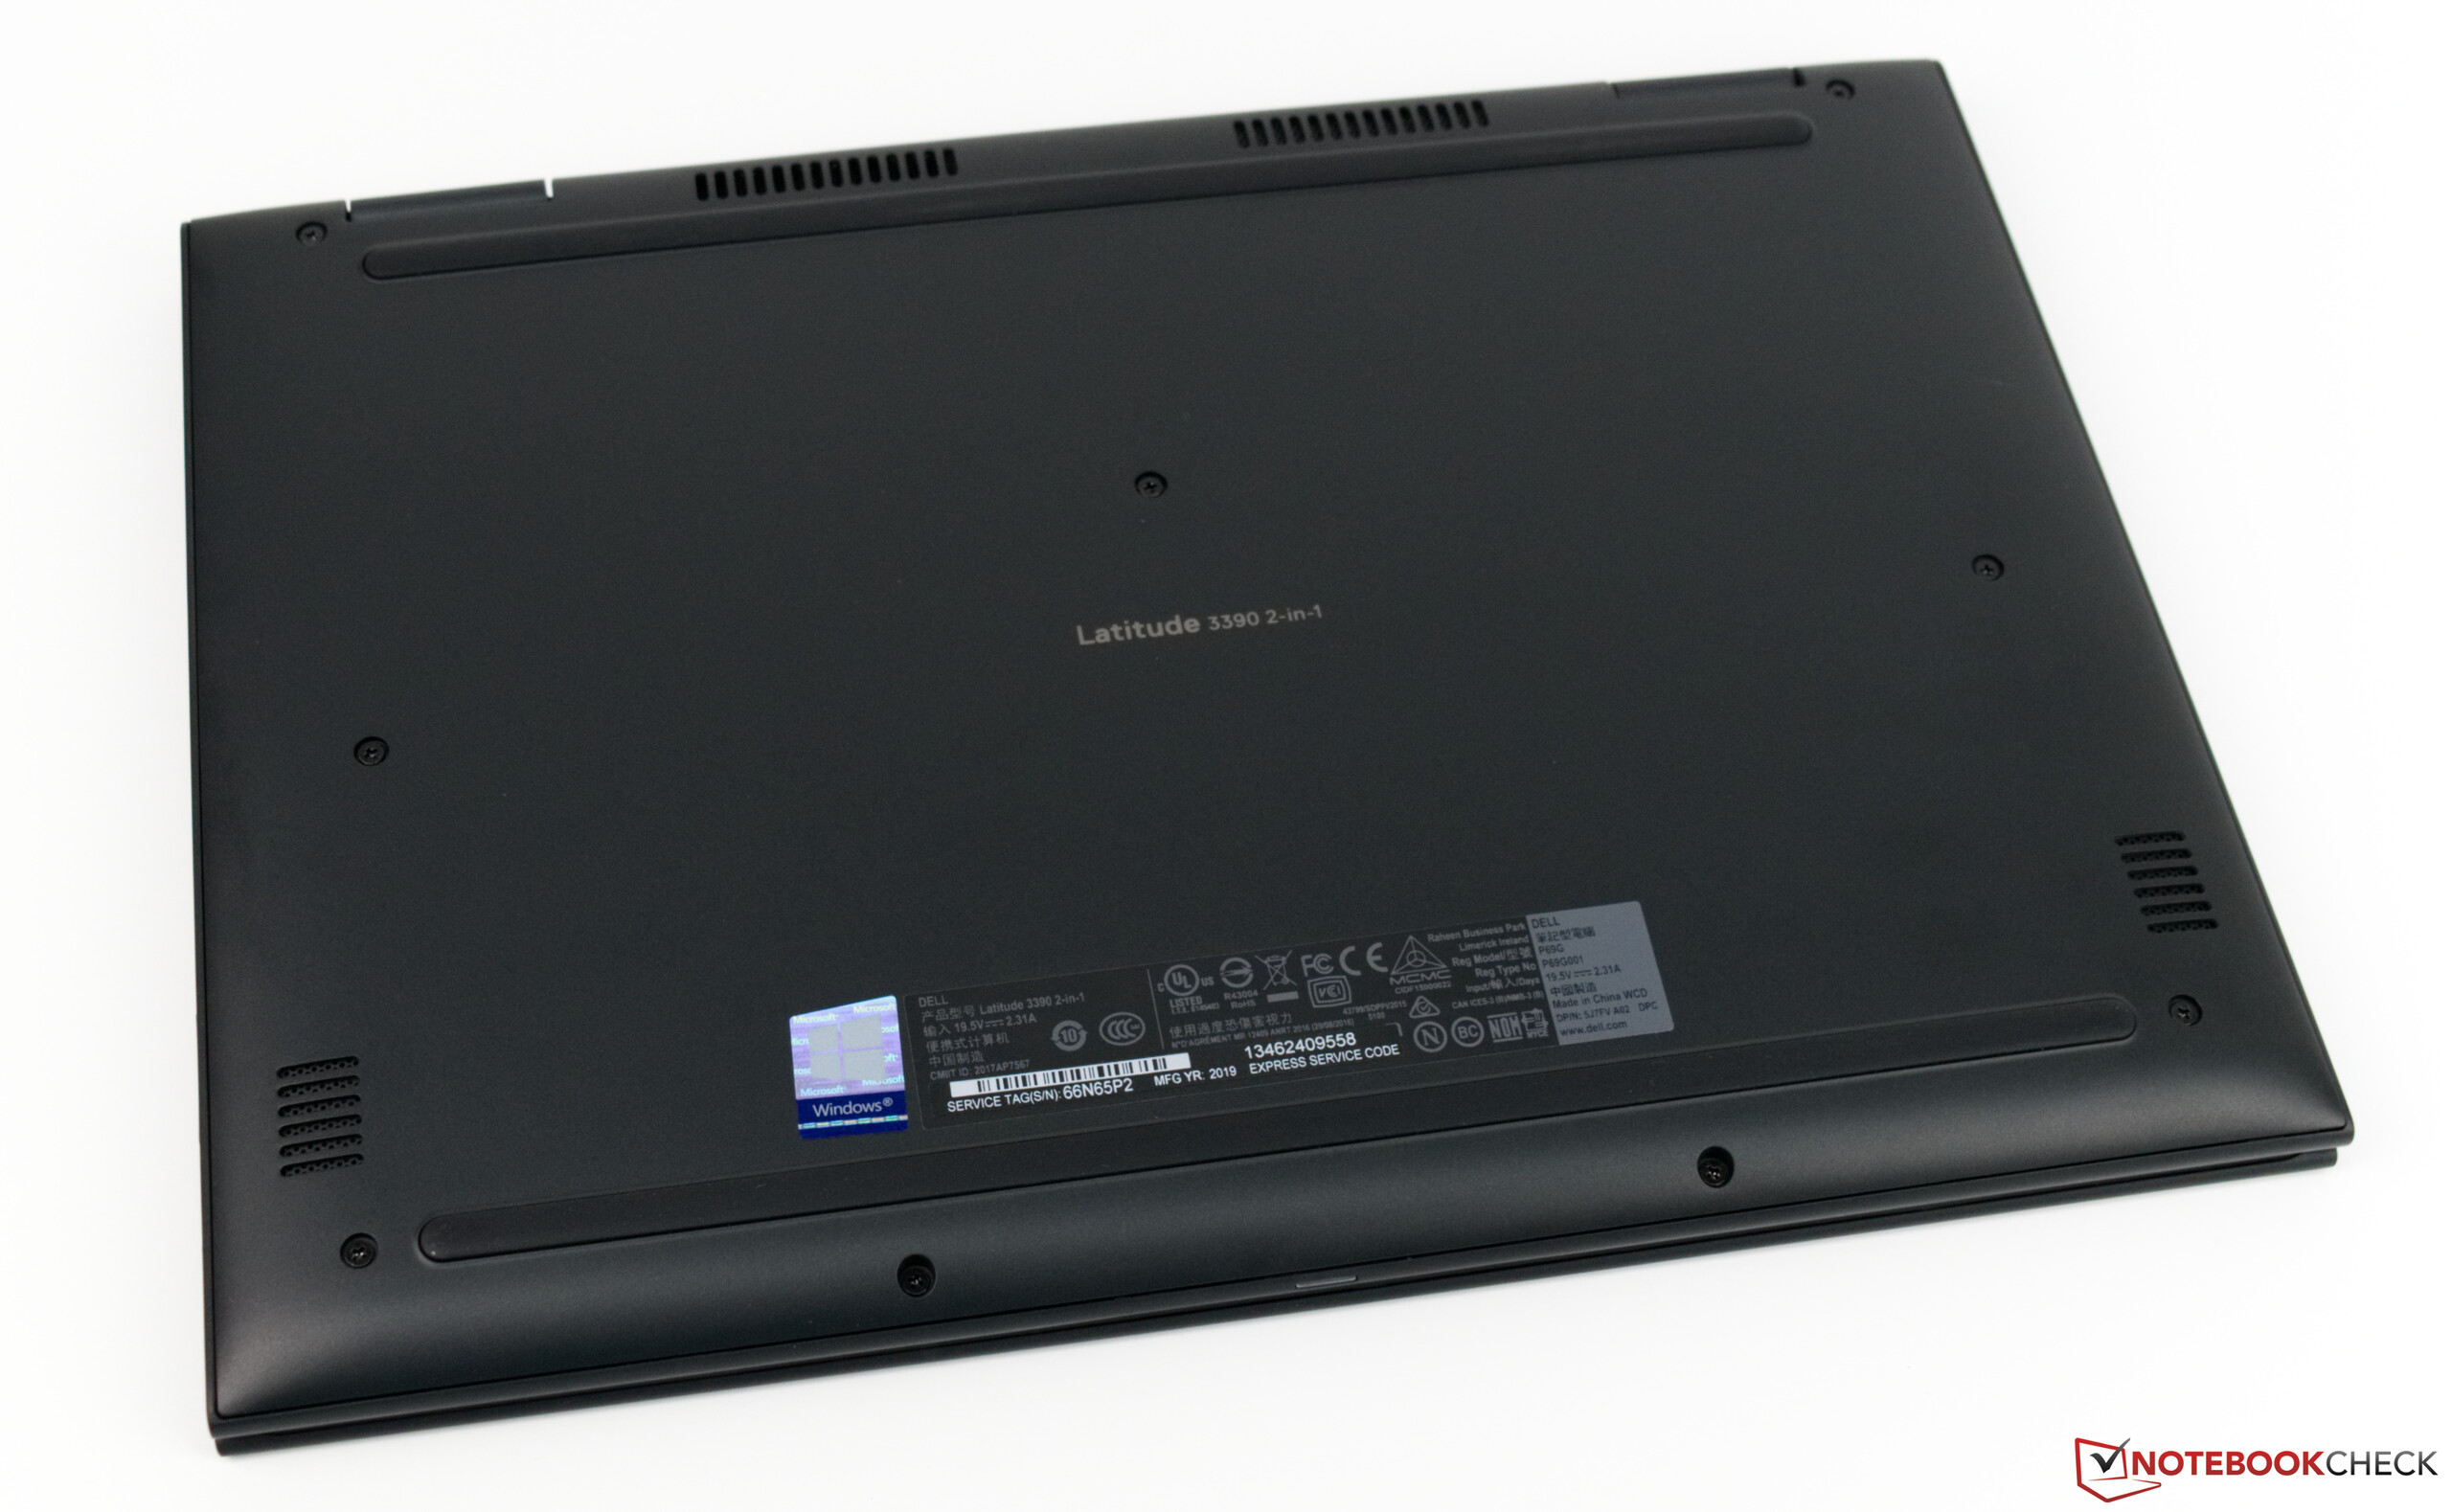
Dell Latitude 13 3390
- 06/11/2019 v6 (old)
Sebastian Bade
Price comparison
