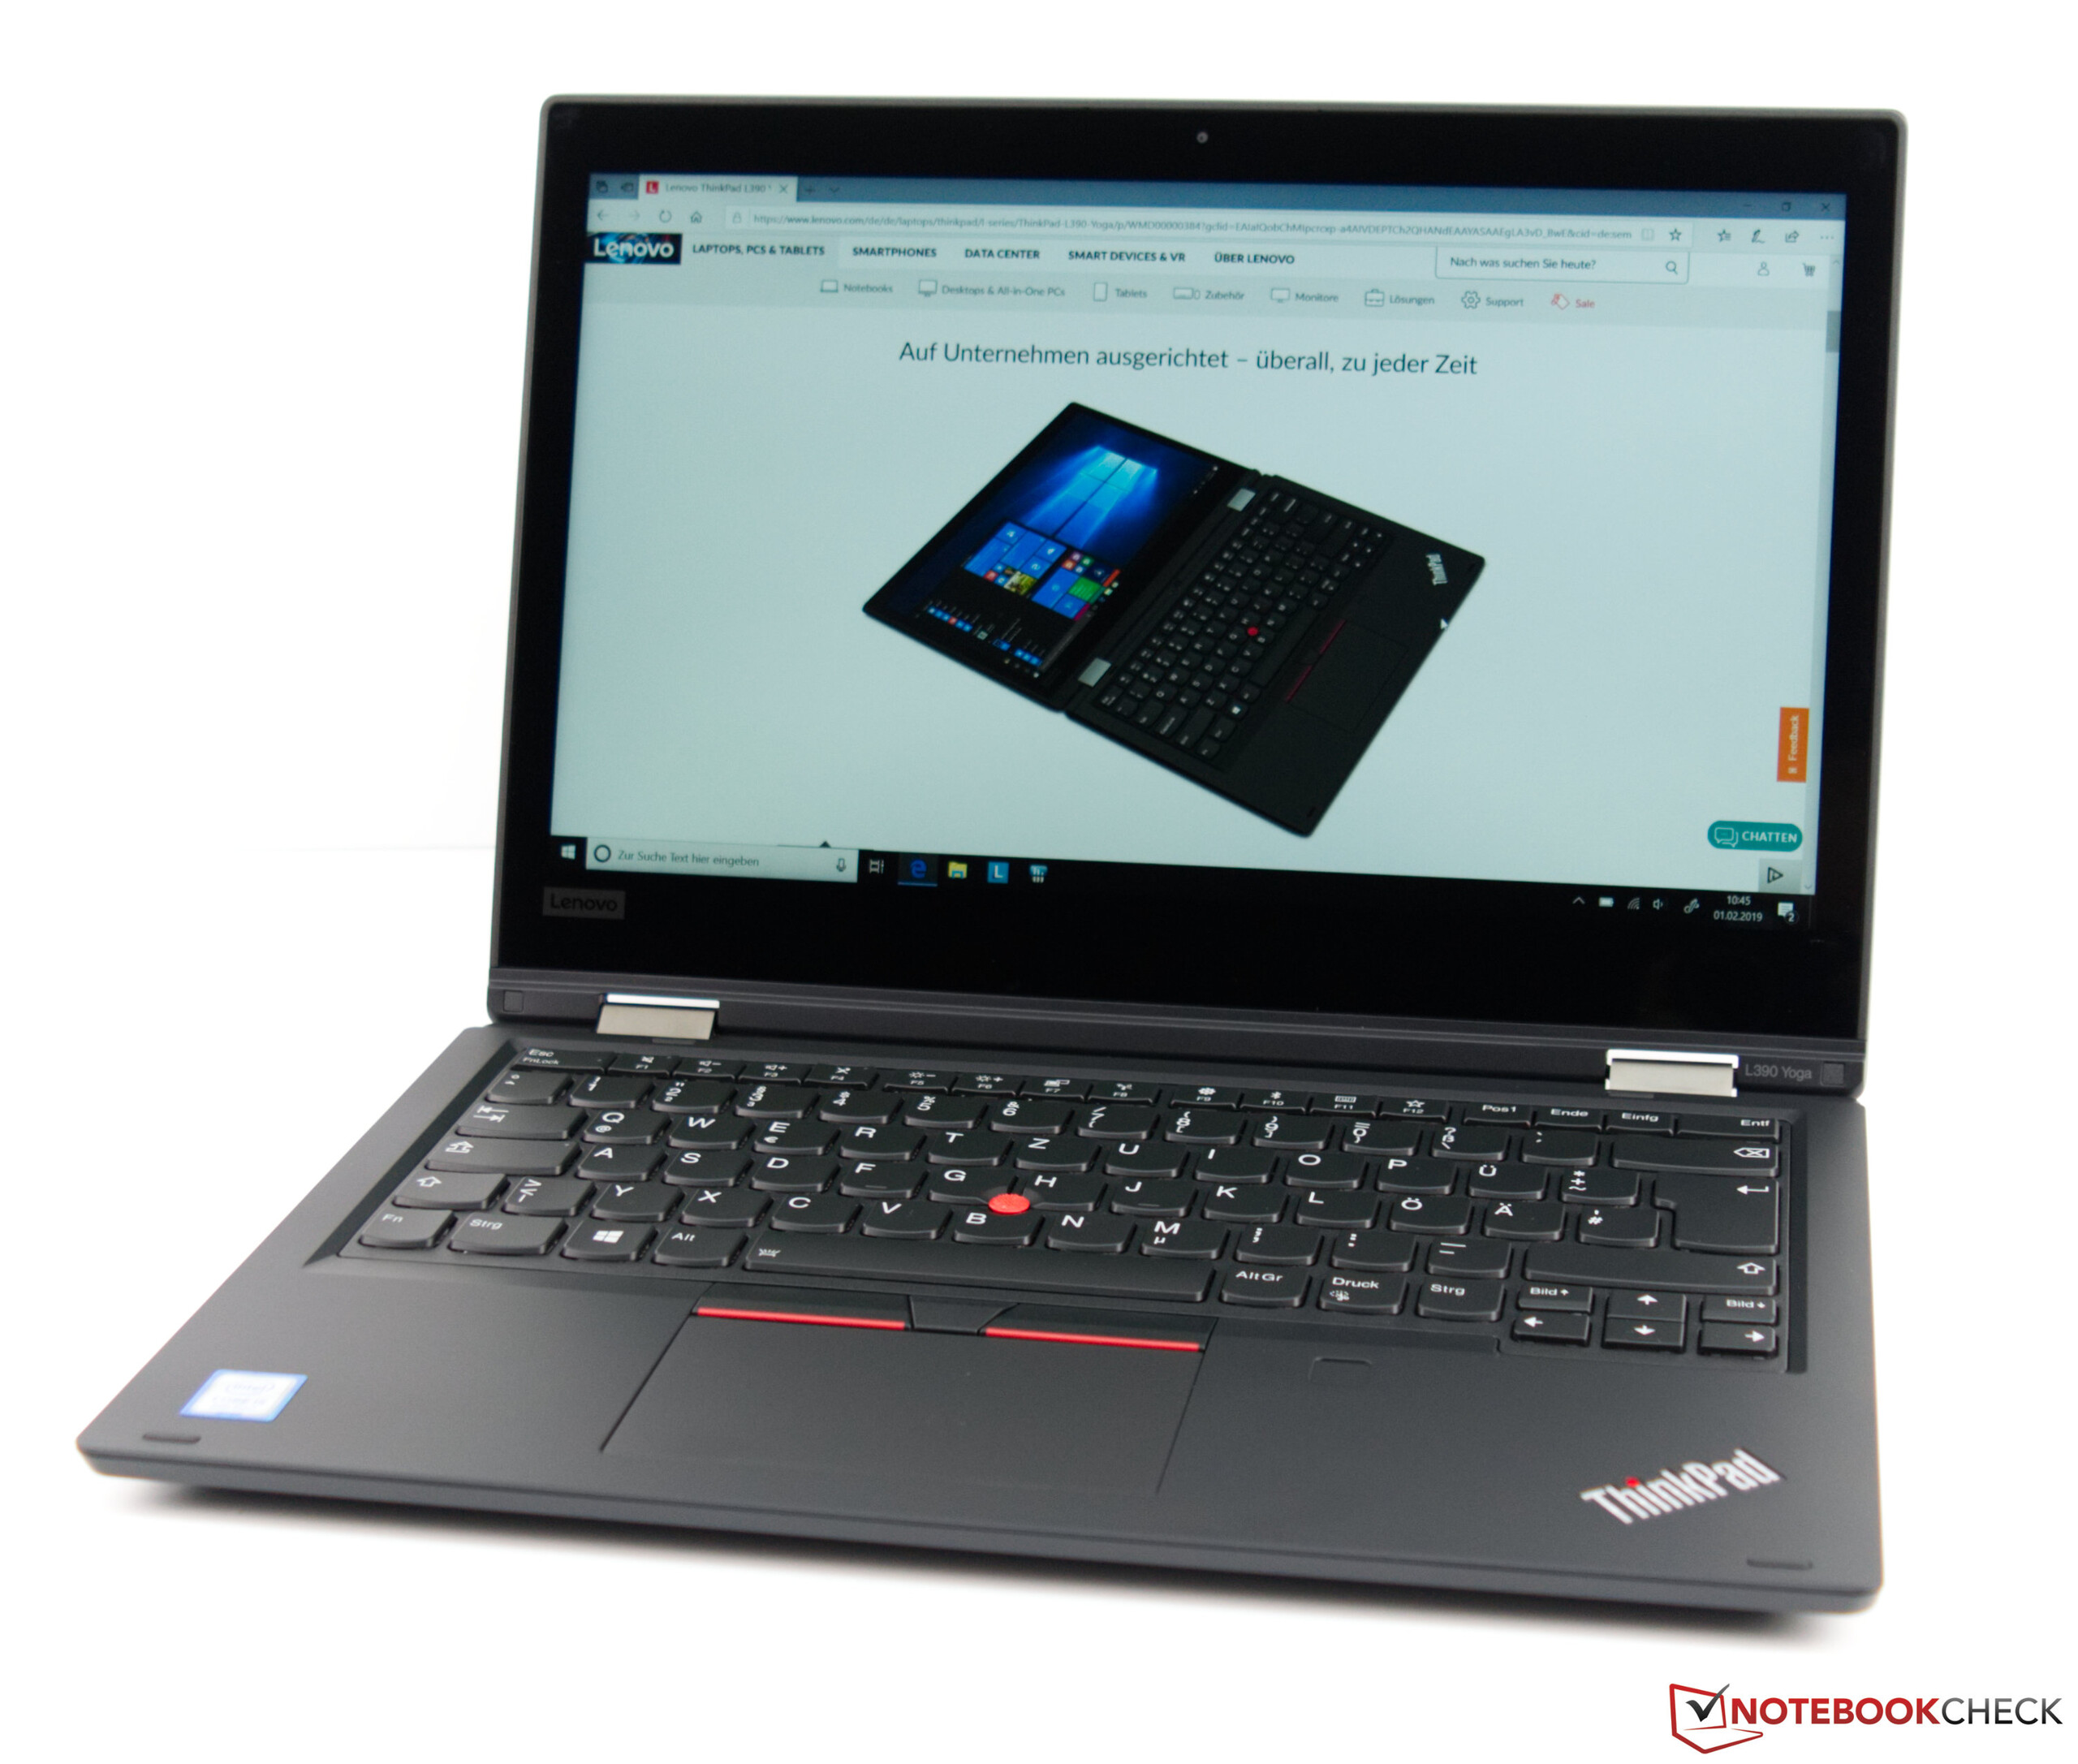
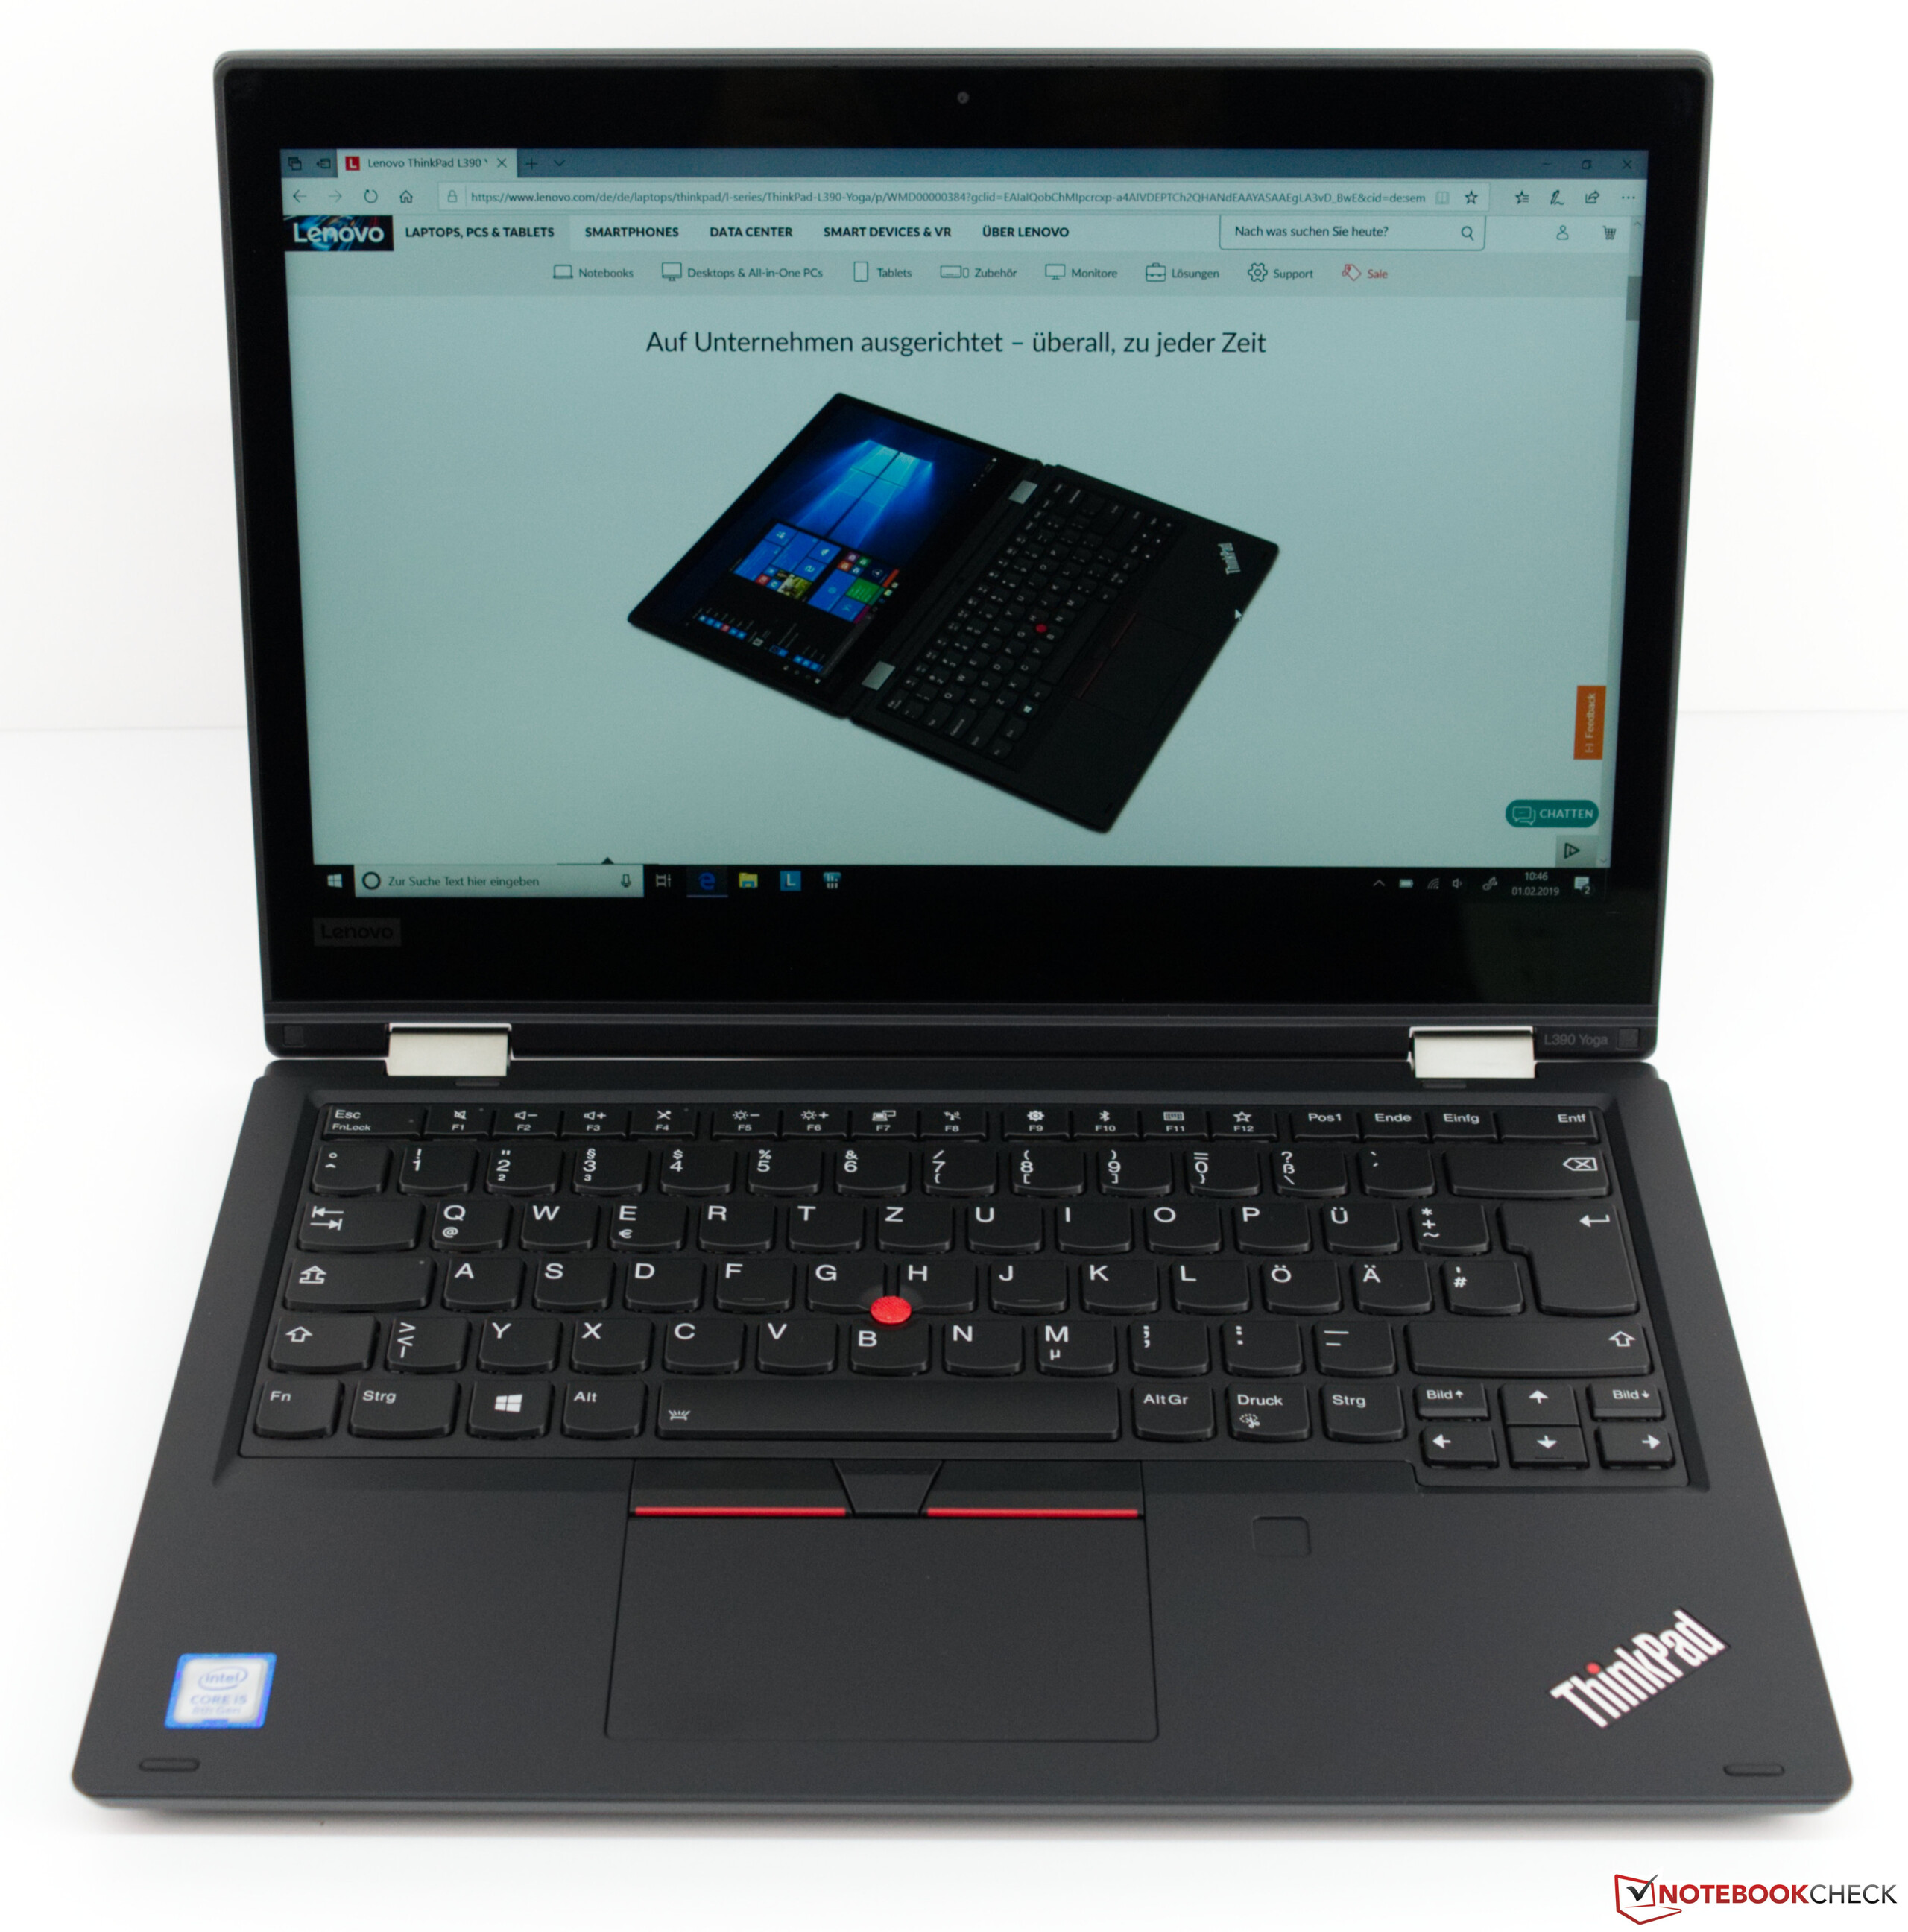
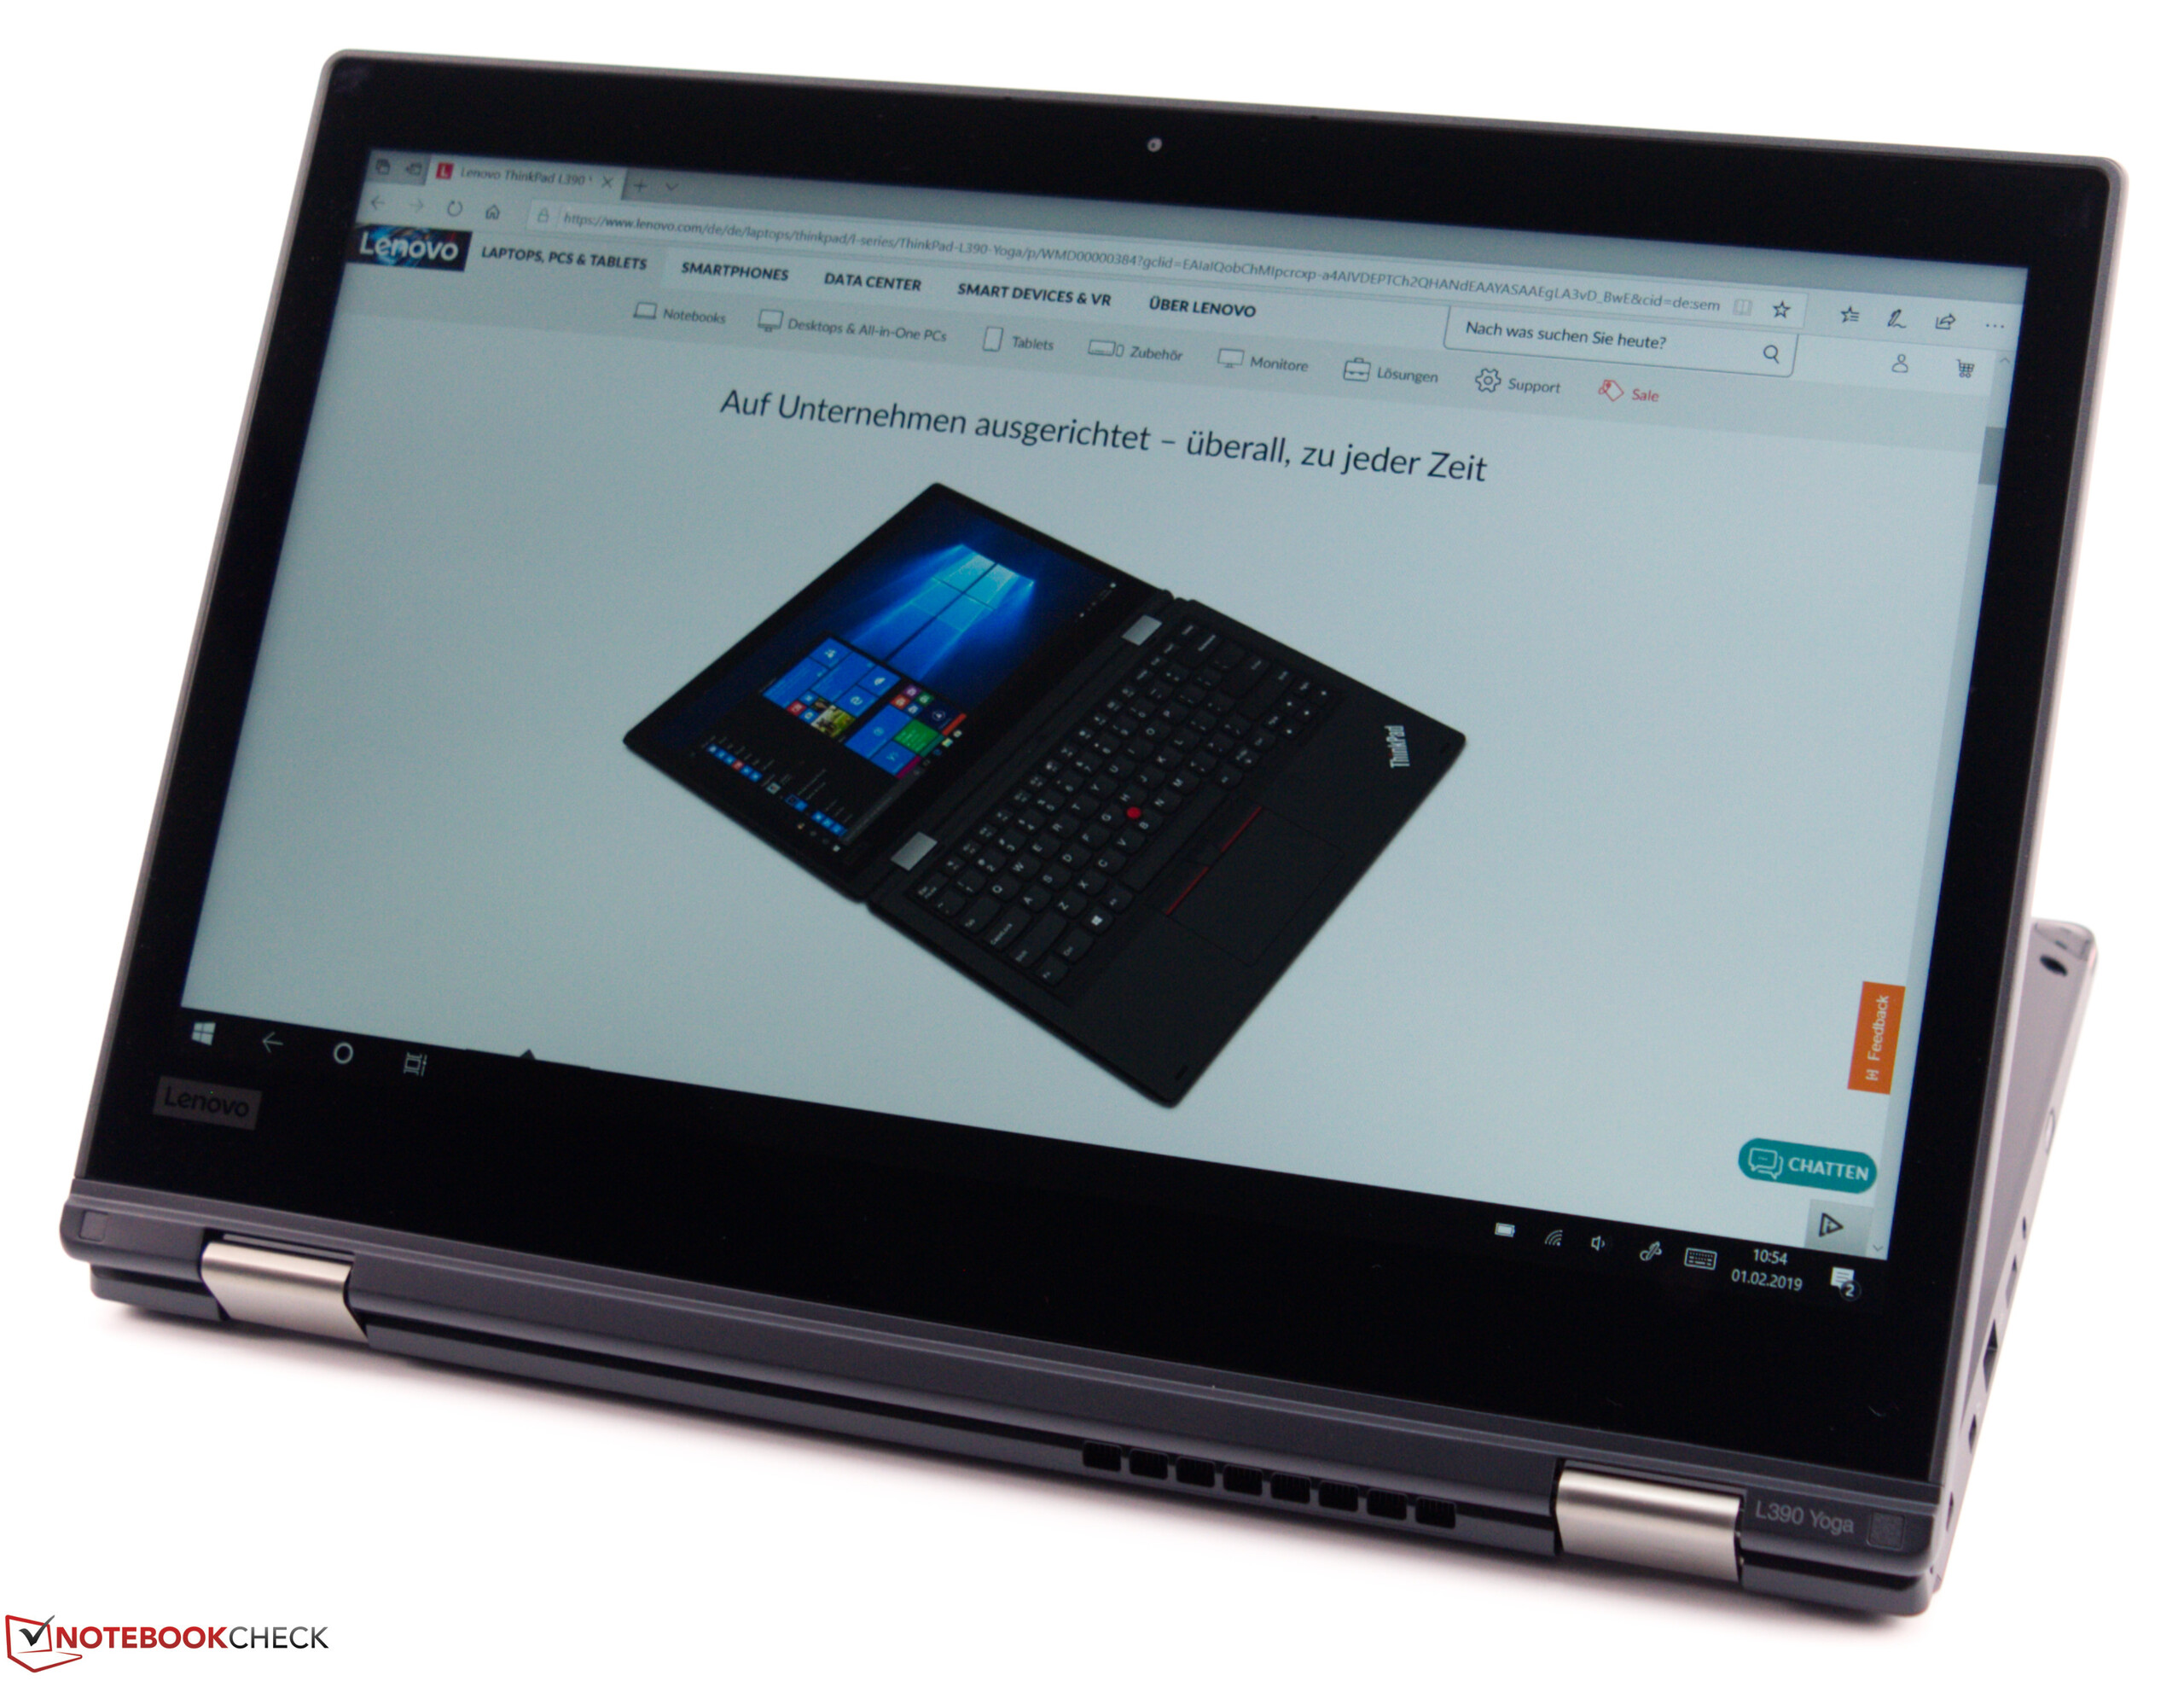
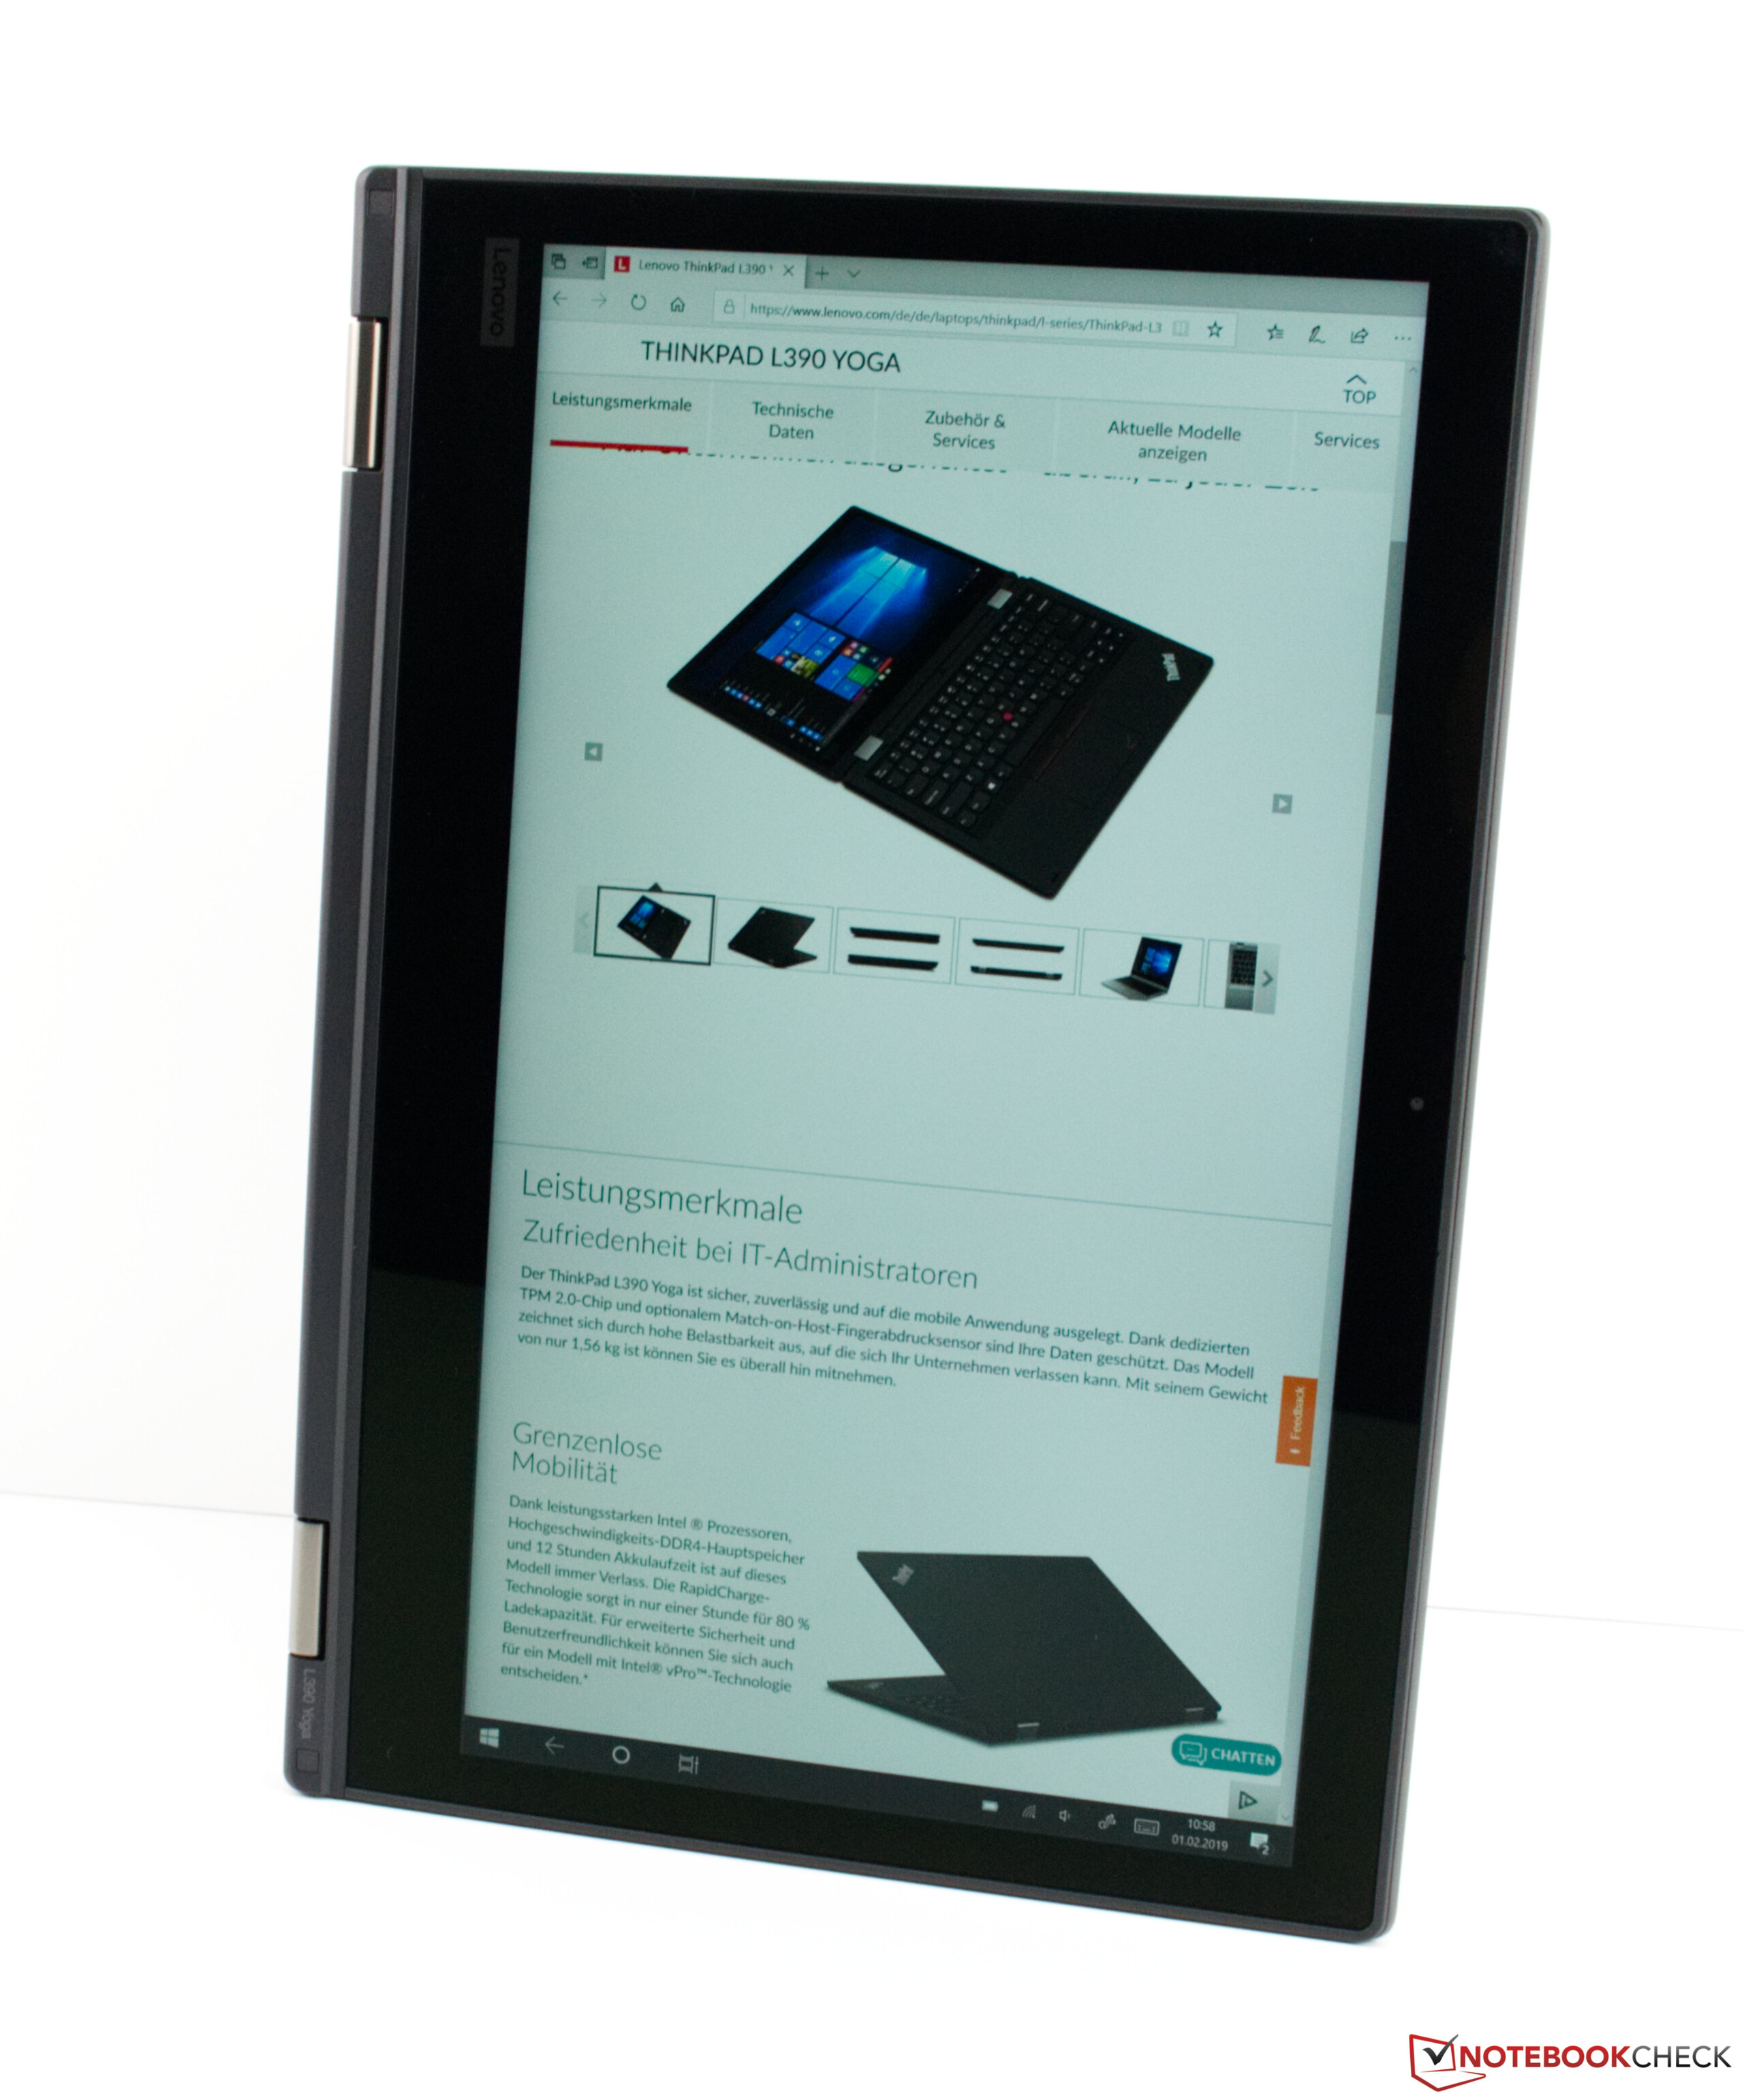
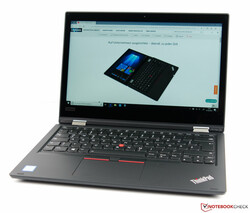
Breve Análise do Conversível Lenovo ThinkPad L390 Yoga (Core i5-8265U, 256 GB, FHD)
| SD Card Reader | |
| average JPG Copy Test (av. of 3 runs) | |
| Lenovo ThinkPad L380 Yoga-20M7001BGE (Toshiba Exceria Pro M501 microSDXC 64GB) | |
| Lenovo ThinkPad L390 Yoga-20NT000XGE (Toshiba Exceria Pro M501 UHS-II) | |
| Média da turma Convertible (28.1 - 197, n=23, últimos 2 anos) | |
| Dell Inspiron 13-5379-9573 (Toshiba Exceria Pro SDXC 64 GB UHS-II) | |
| Acer Spin 5 SP513-52N-54SF (Toshiba Exceria Pro SDXC 64 GB UHS-II) | |
| maximum AS SSD Seq Read Test (1GB) | |
| Média da turma Convertible (28.9 - 254, n=22, últimos 2 anos) | |
| Lenovo ThinkPad L380 Yoga-20M7001BGE (Toshiba Exceria Pro M501 microSDXC 64GB) | |
| Lenovo ThinkPad L390 Yoga-20NT000XGE (Toshiba Exceria Pro M501 UHS-II) | |
| Dell Inspiron 13-5379-9573 (Toshiba Exceria Pro SDXC 64 GB UHS-II) | |
| Acer Spin 5 SP513-52N-54SF (Toshiba Exceria Pro SDXC 64 GB UHS-II) | |
| |||||||||||||||||||||||||
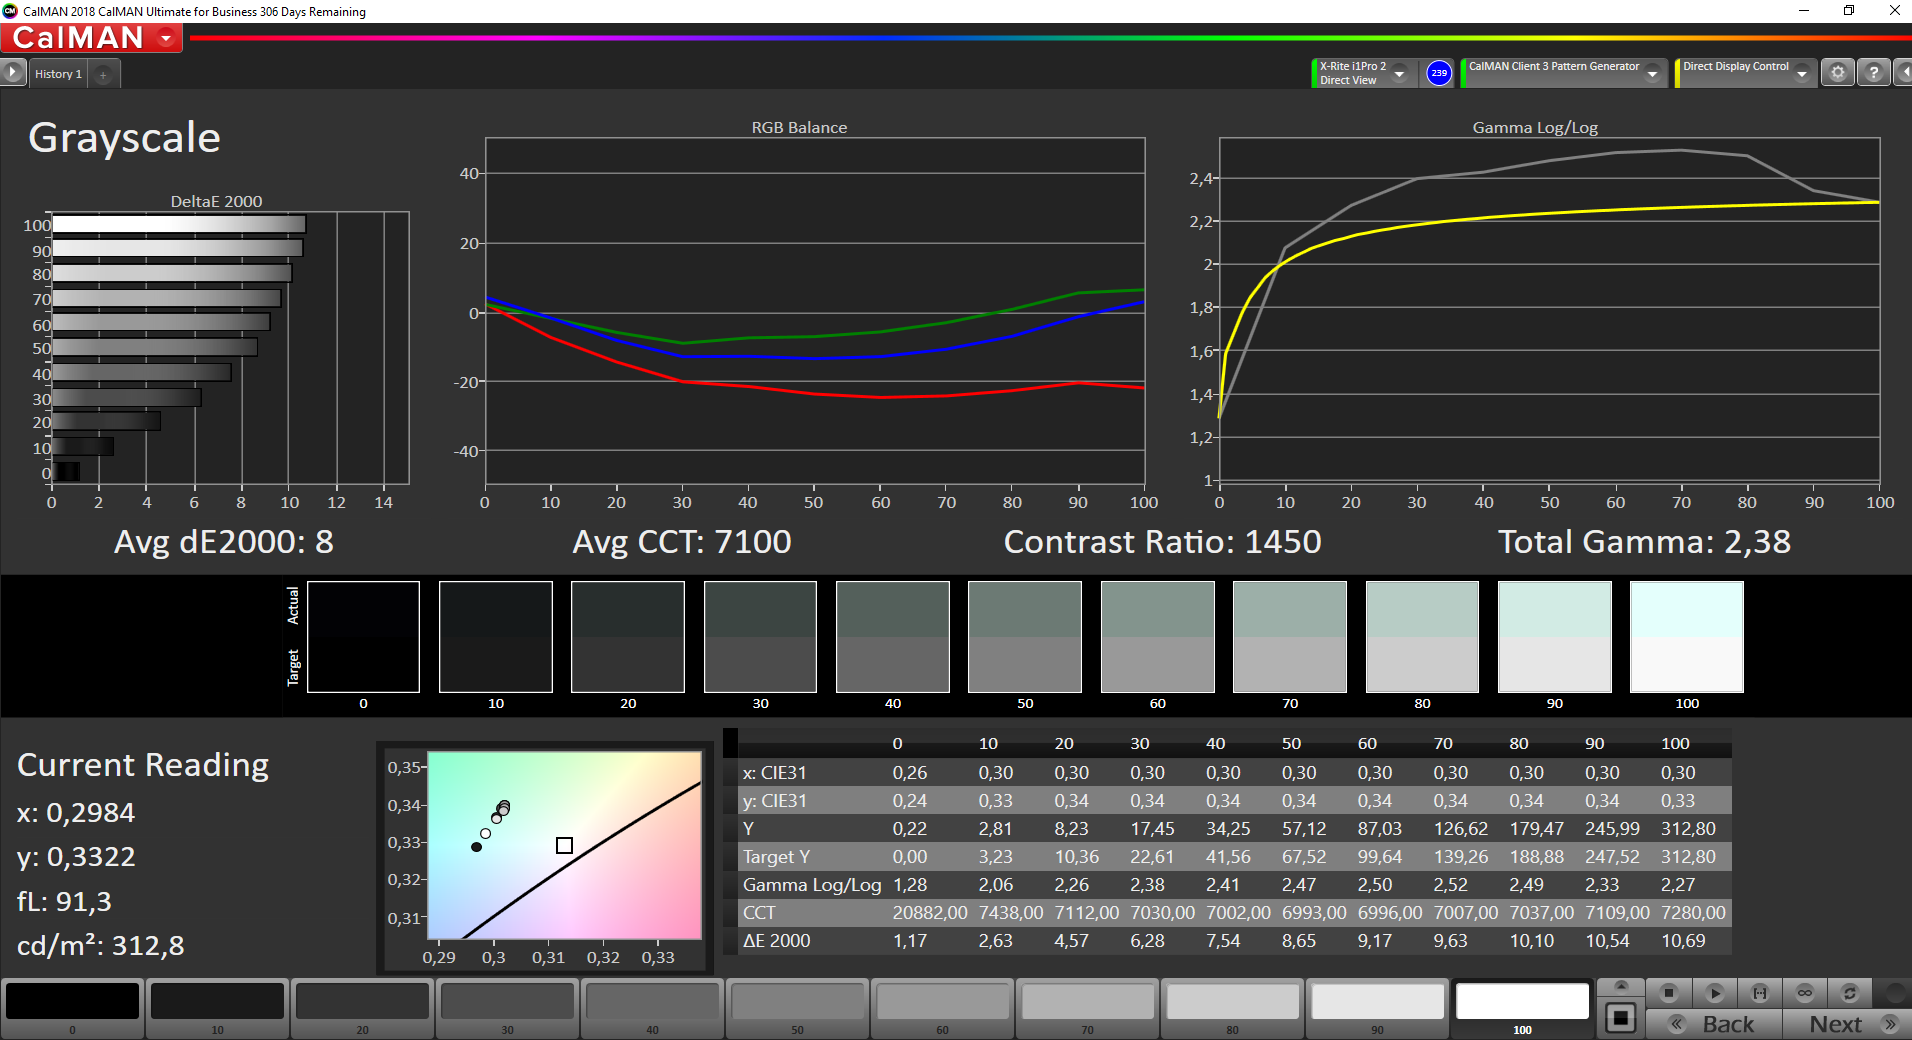
iluminação: 90 %
iluminação com acumulador: 311 cd/m²
Contraste: 1423:1 (Preto: 0.22 cd/m²)
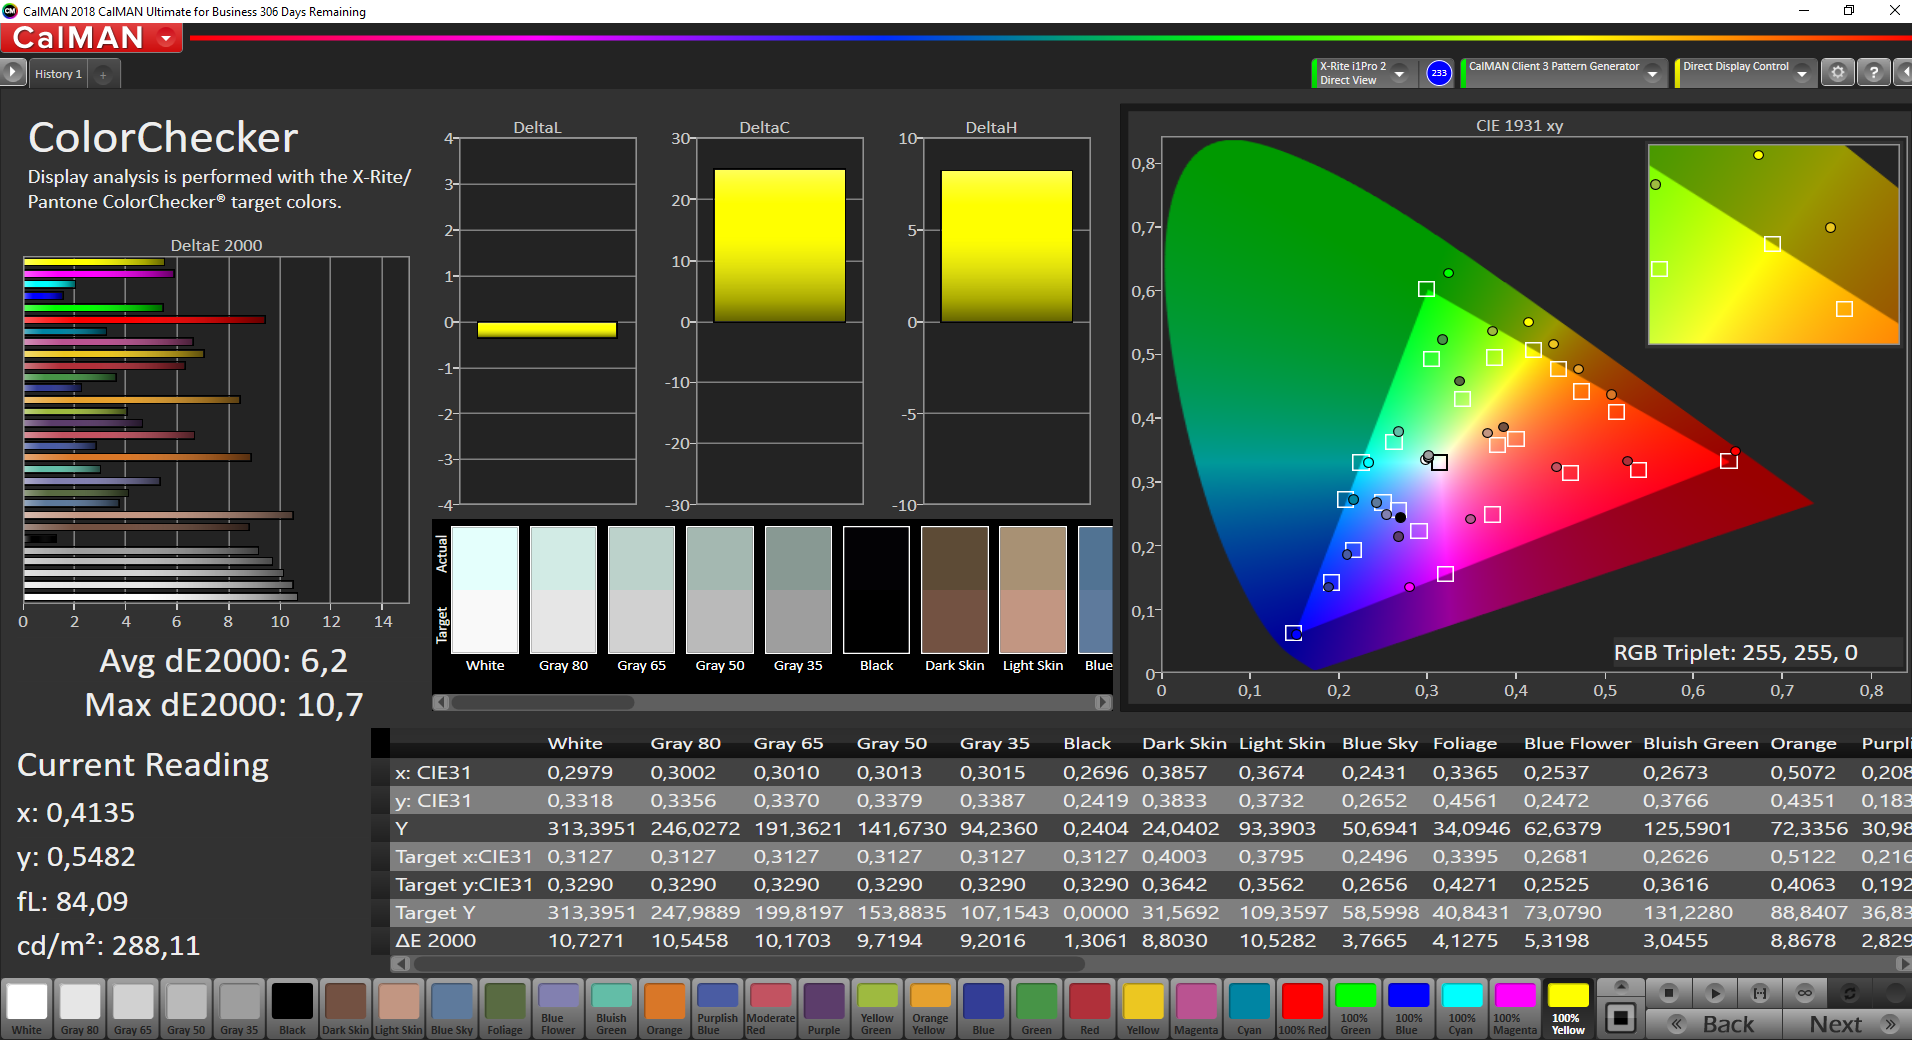
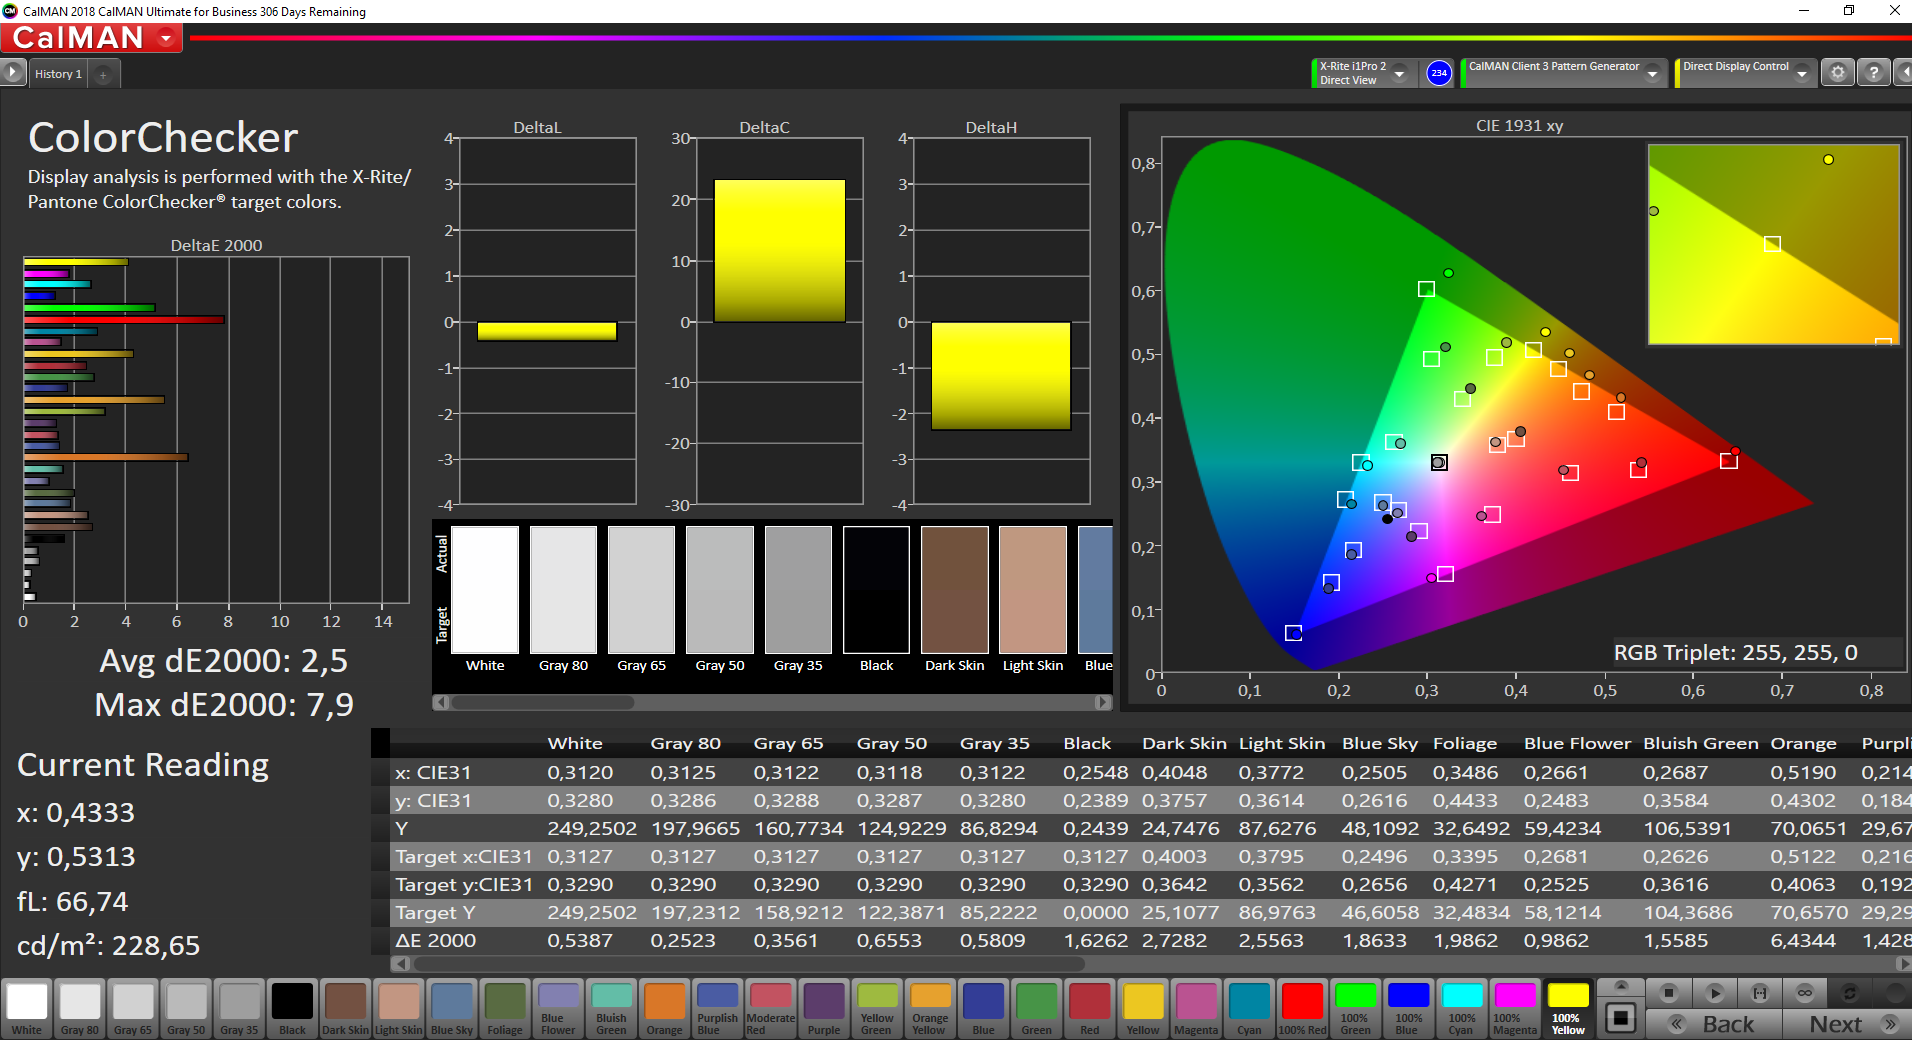
ΔE ColorChecker Calman: 6.2 | ∀{0.5-29.43 Ø4.72}
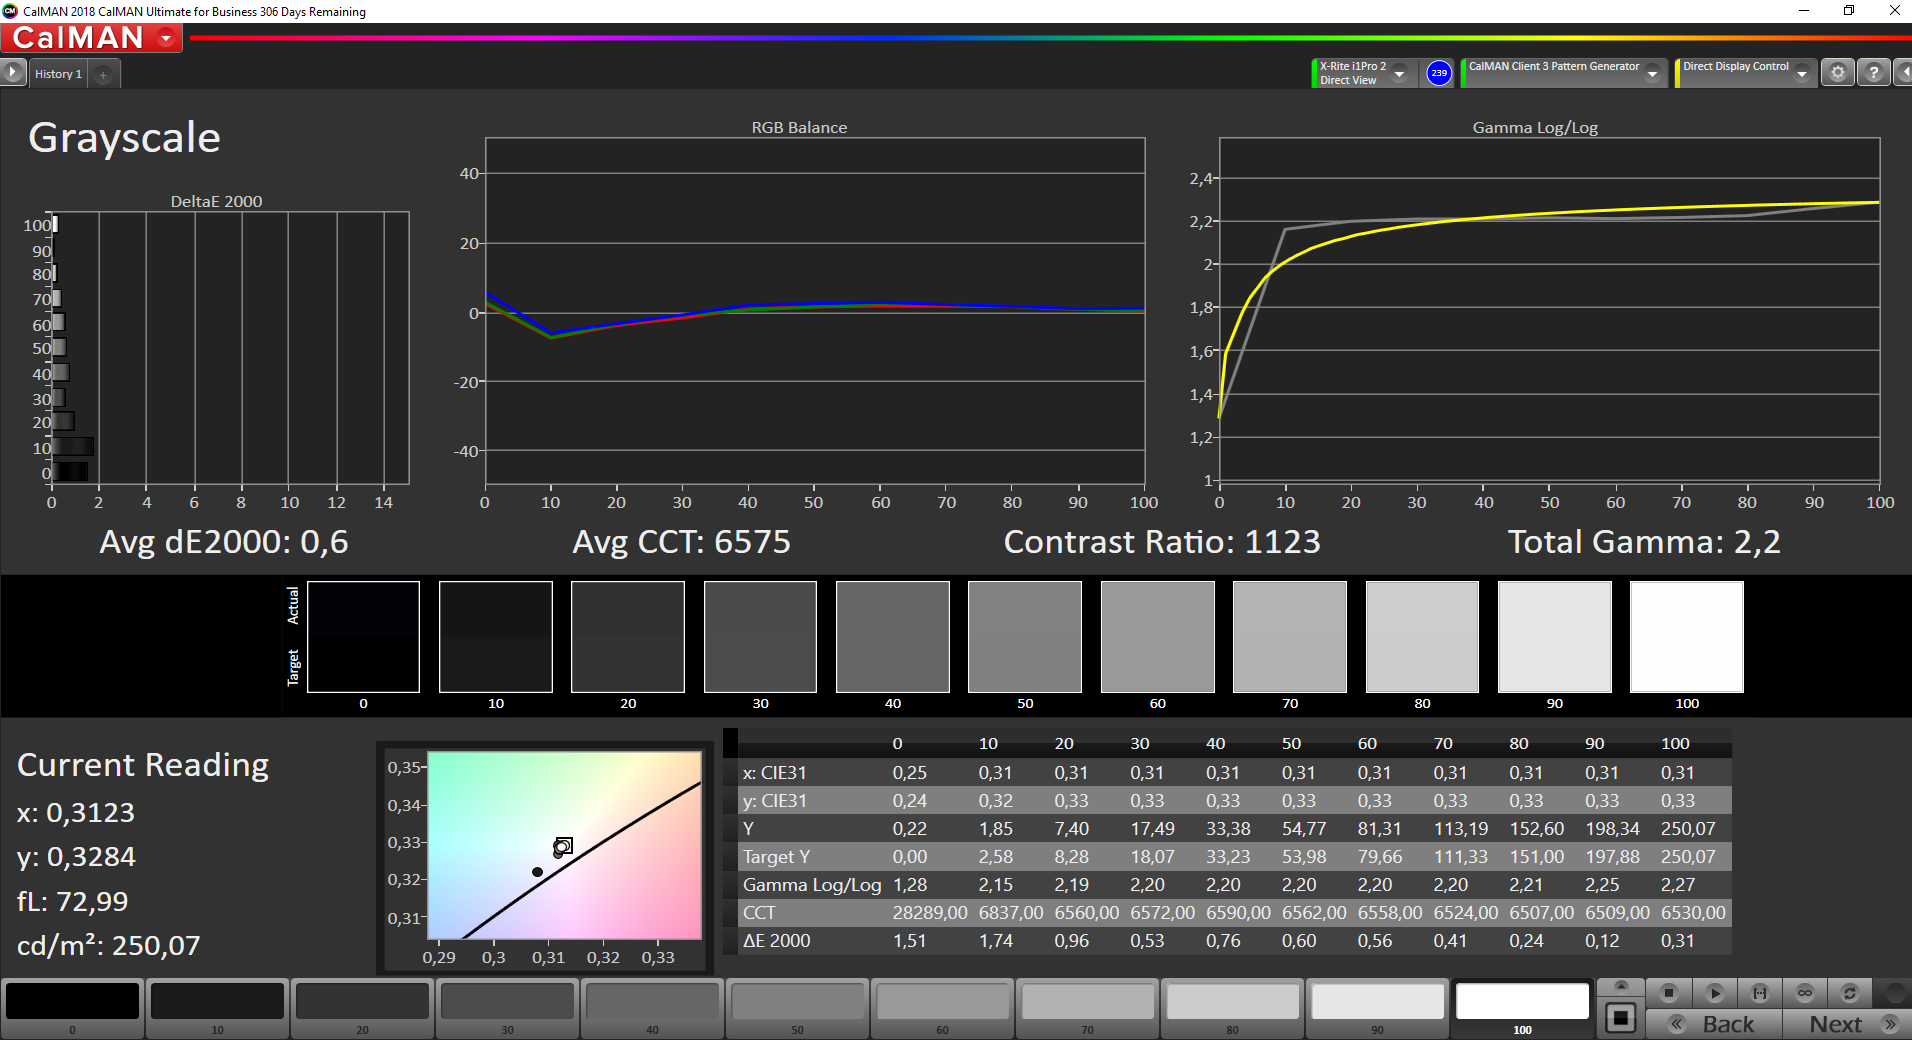
calibrated: 2.5
ΔE Greyscale Calman: 8 | ∀{0.09-98 Ø4.97}
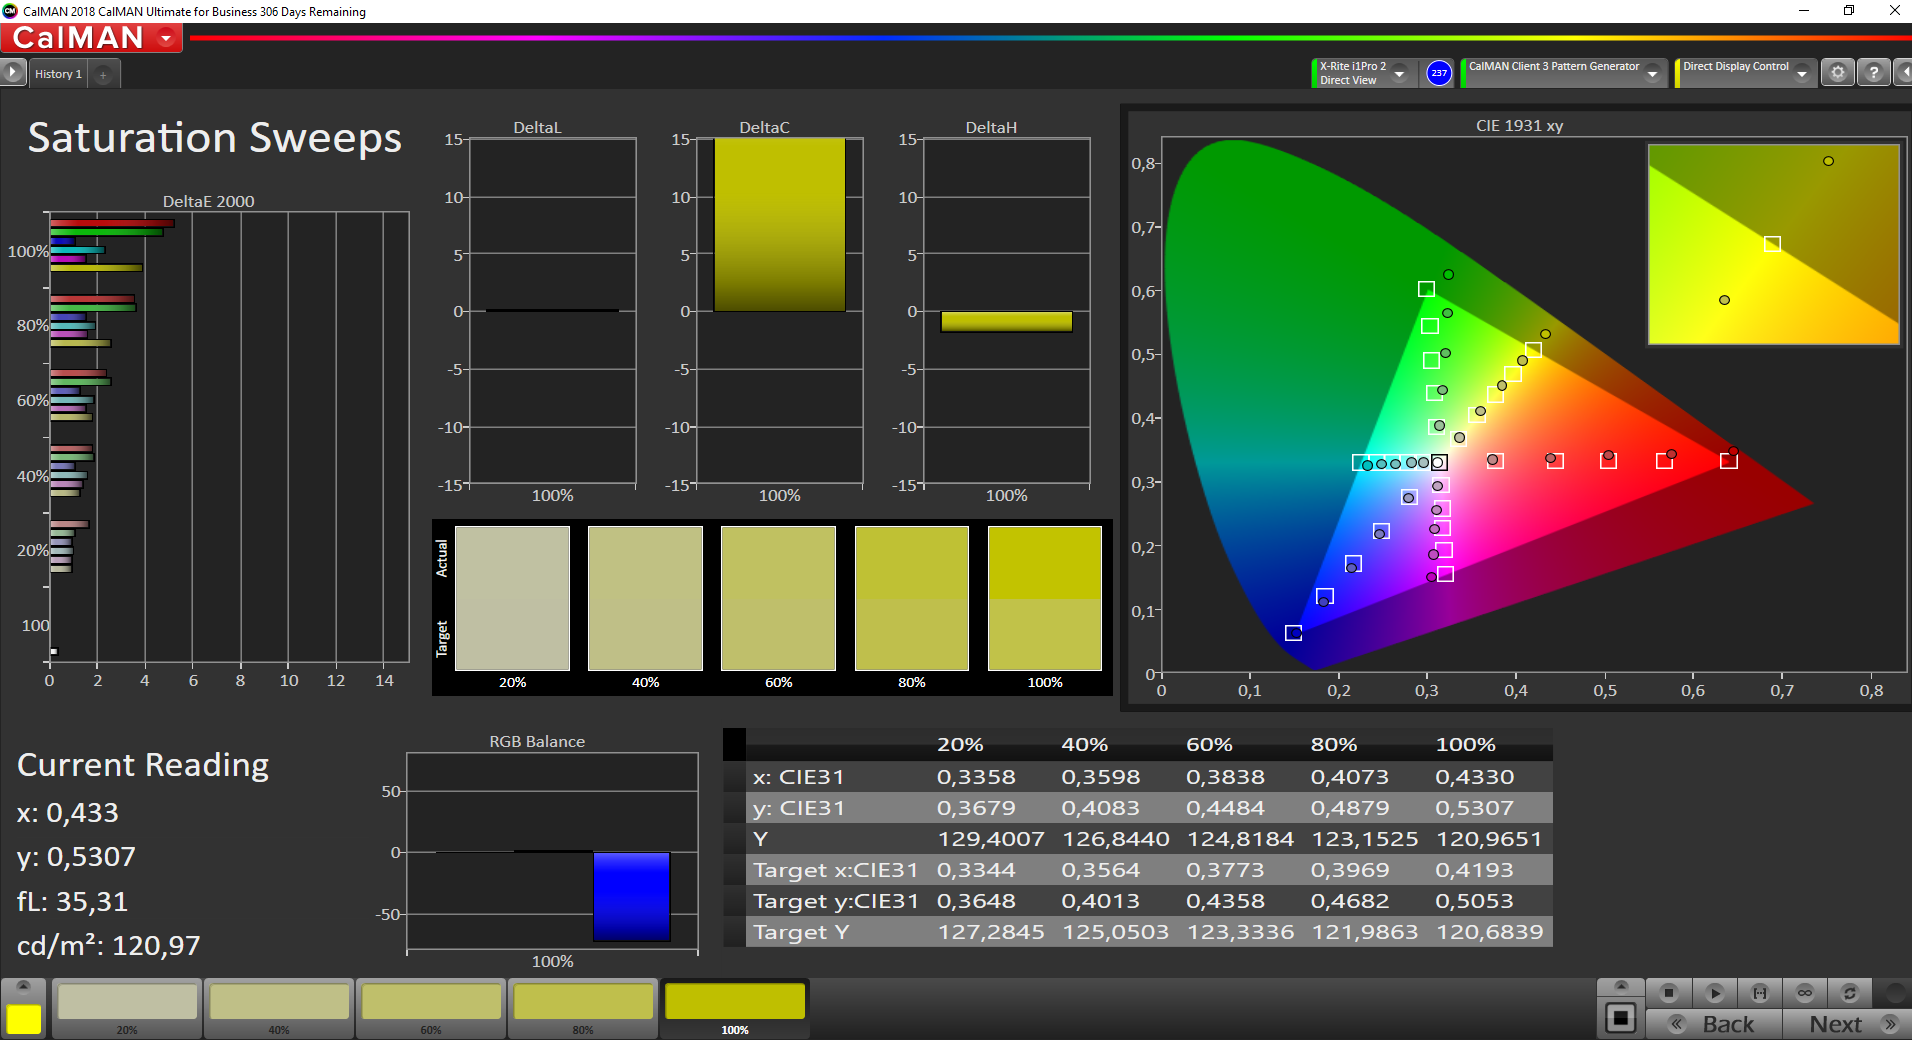
90.6% sRGB (Argyll 1.6.3 3D)
59.1% AdobeRGB 1998 (Argyll 1.6.3 3D)
66.3% AdobeRGB 1998 (Argyll 3D)
90.6% sRGB (Argyll 3D)
69.2% Display P3 (Argyll 3D)
Gamma: 2.38
CCT: 7100 K
| Lenovo ThinkPad L390 Yoga-20NT000XGE LEN4094, NV133FHM-N5A, IPS LED, 1920x1080, 13.3" | Lenovo ThinkPad L380 Yoga-20M7001BGE M133NWF4-R3, IPS LED, 1920x1080, 13.3" | Dell Inspiron 13-5379-9573 BOE BOE06A7, IPS, 1920x1080, 13.3" | Lenovo Yoga C930-13IKB B139HAN03_0, IPS, 1920x1080, 13.9" | Acer Spin 5 SP513-52N-54SF LC133LF102, IPS, 1920x1080, 13.3" | |
|---|---|---|---|---|---|
| Display | 0% | -36% | -1% | 3% | |
| Display P3 Coverage (%) | 69.2 | 65.1 -6% | 41.2 -40% | 64.3 -7% | 69.8 1% |
| sRGB Coverage (%) | 90.6 | 95.5 5% | 61.7 -32% | 94.6 4% | 94.6 4% |
| AdobeRGB 1998 Coverage (%) | 66.3 | 66.9 1% | 42.6 -36% | 66.2 0% | 69.3 5% |
| Response Times | 16% | 11% | 23% | 16% | |
| Response Time Grey 50% / Grey 80% * (ms) | 51.2 ? | 47 ? 8% | 45 ? 12% | 40.8 ? 20% | 49 ? 4% |
| Response Time Black / White * (ms) | 36.8 ? | 28 ? 24% | 33 ? 10% | 27.6 ? 25% | 27 ? 27% |
| PWM Frequency (Hz) | 1000 ? | 217 ? | 192 ? | 1000 ? | |
| Screen | 6% | -16% | -7% | 11% | |
| Brightness middle (cd/m²) | 313 | 323 3% | 274 -12% | 316 1% | 295 -6% |
| Brightness (cd/m²) | 295 | 310 5% | 272 -8% | 291 -1% | 276 -6% |
| Brightness Distribution (%) | 90 | 88 -2% | 81 -10% | 83 -8% | 88 -2% |
| Black Level * (cd/m²) | 0.22 | 0.22 -0% | 0.32 -45% | 0.36 -64% | 0.27 -23% |
| Contrast (:1) | 1423 | 1468 3% | 856 -40% | 878 -38% | 1093 -23% |
| Colorchecker dE 2000 * | 6.2 | 5 19% | 5.57 10% | 5.9 5% | 2.97 52% |
| Colorchecker dE 2000 max. * | 10.7 | 9.56 11% | 13.48 -26% | 12.9 -21% | 5.67 47% |
| Colorchecker dE 2000 calibrated * | 2.5 | 1.3 48% | |||
| Greyscale dE 2000 * | 8 | 6.64 17% | 4.66 42% | 8.6 -8% | 3.12 61% |
| Gamma | 2.38 92% | 2.2 100% | 2.53 87% | 2.1 105% | 2.45 90% |
| CCT | 7100 92% | 6638 98% | 7010 93% | 6854 95% | 6676 97% |
| Color Space (Percent of AdobeRGB 1998) (%) | 59.1 | 61 3% | 39 -34% | 60.7 3% | 62 5% |
| Color Space (Percent of sRGB) (%) | 90.6 | 95 5% | 61 -33% | 94.5 4% | 94 4% |
| Média Total (Programa/Configurações) | 7% /
6% | -14% /
-16% | 5% /
-2% | 10% /
10% |
* ... menor é melhor
Exibir tempos de resposta
| ↔ Tempo de resposta preto para branco | ||
|---|---|---|
| 36.8 ms ... ascensão ↗ e queda ↘ combinadas | ↗ 19.2 ms ascensão | 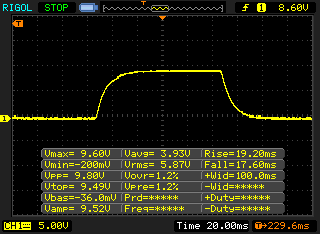 |
| ↘ 17.6 ms queda | ||
| A tela mostra taxas de resposta lentas em nossos testes e será insatisfatória para os jogadores. Em comparação, todos os dispositivos testados variam de 0.1 (mínimo) a 240 (máximo) ms. » 95 % de todos os dispositivos são melhores. Isso significa que o tempo de resposta medido é pior que a média de todos os dispositivos testados (19.8 ms). | ||
| ↔ Tempo de resposta 50% cinza a 80% cinza | ||
| 51.2 ms ... ascensão ↗ e queda ↘ combinadas | ↗ 26.8 ms ascensão | 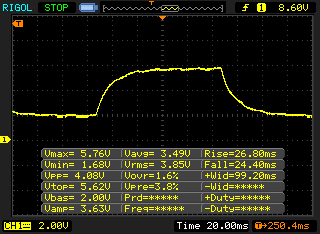 |
| ↘ 24.4 ms queda | ||
| A tela mostra taxas de resposta lentas em nossos testes e será insatisfatória para os jogadores. Em comparação, todos os dispositivos testados variam de 0.165 (mínimo) a 636 (máximo) ms. » 88 % de todos os dispositivos são melhores. Isso significa que o tempo de resposta medido é pior que a média de todos os dispositivos testados (31 ms). | ||
Cintilação da tela / PWM (modulação por largura de pulso)
| Tela tremeluzindo/PWM detectado | 1000 Hz | ≤ 99 % configuração de brilho | 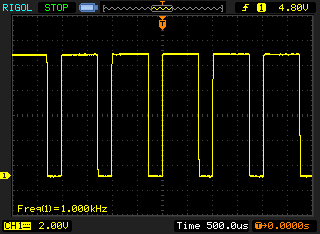 |
A luz de fundo da tela pisca em 1000 Hz (pior caso, por exemplo, utilizando PWM) Cintilação detectada em uma configuração de brilho de 99 % e abaixo. Não deve haver cintilação ou PWM acima desta configuração de brilho. A frequência de 1000 Hz é bastante alta, então a maioria dos usuários sensíveis ao PWM não deve notar nenhuma oscilação. [pwm_comparison] Em comparação: 52 % de todos os dispositivos testados não usam PWM para escurecer a tela. Se PWM foi detectado, uma média de 7763 (mínimo: 5 - máximo: 343500) Hz foi medida. | |||

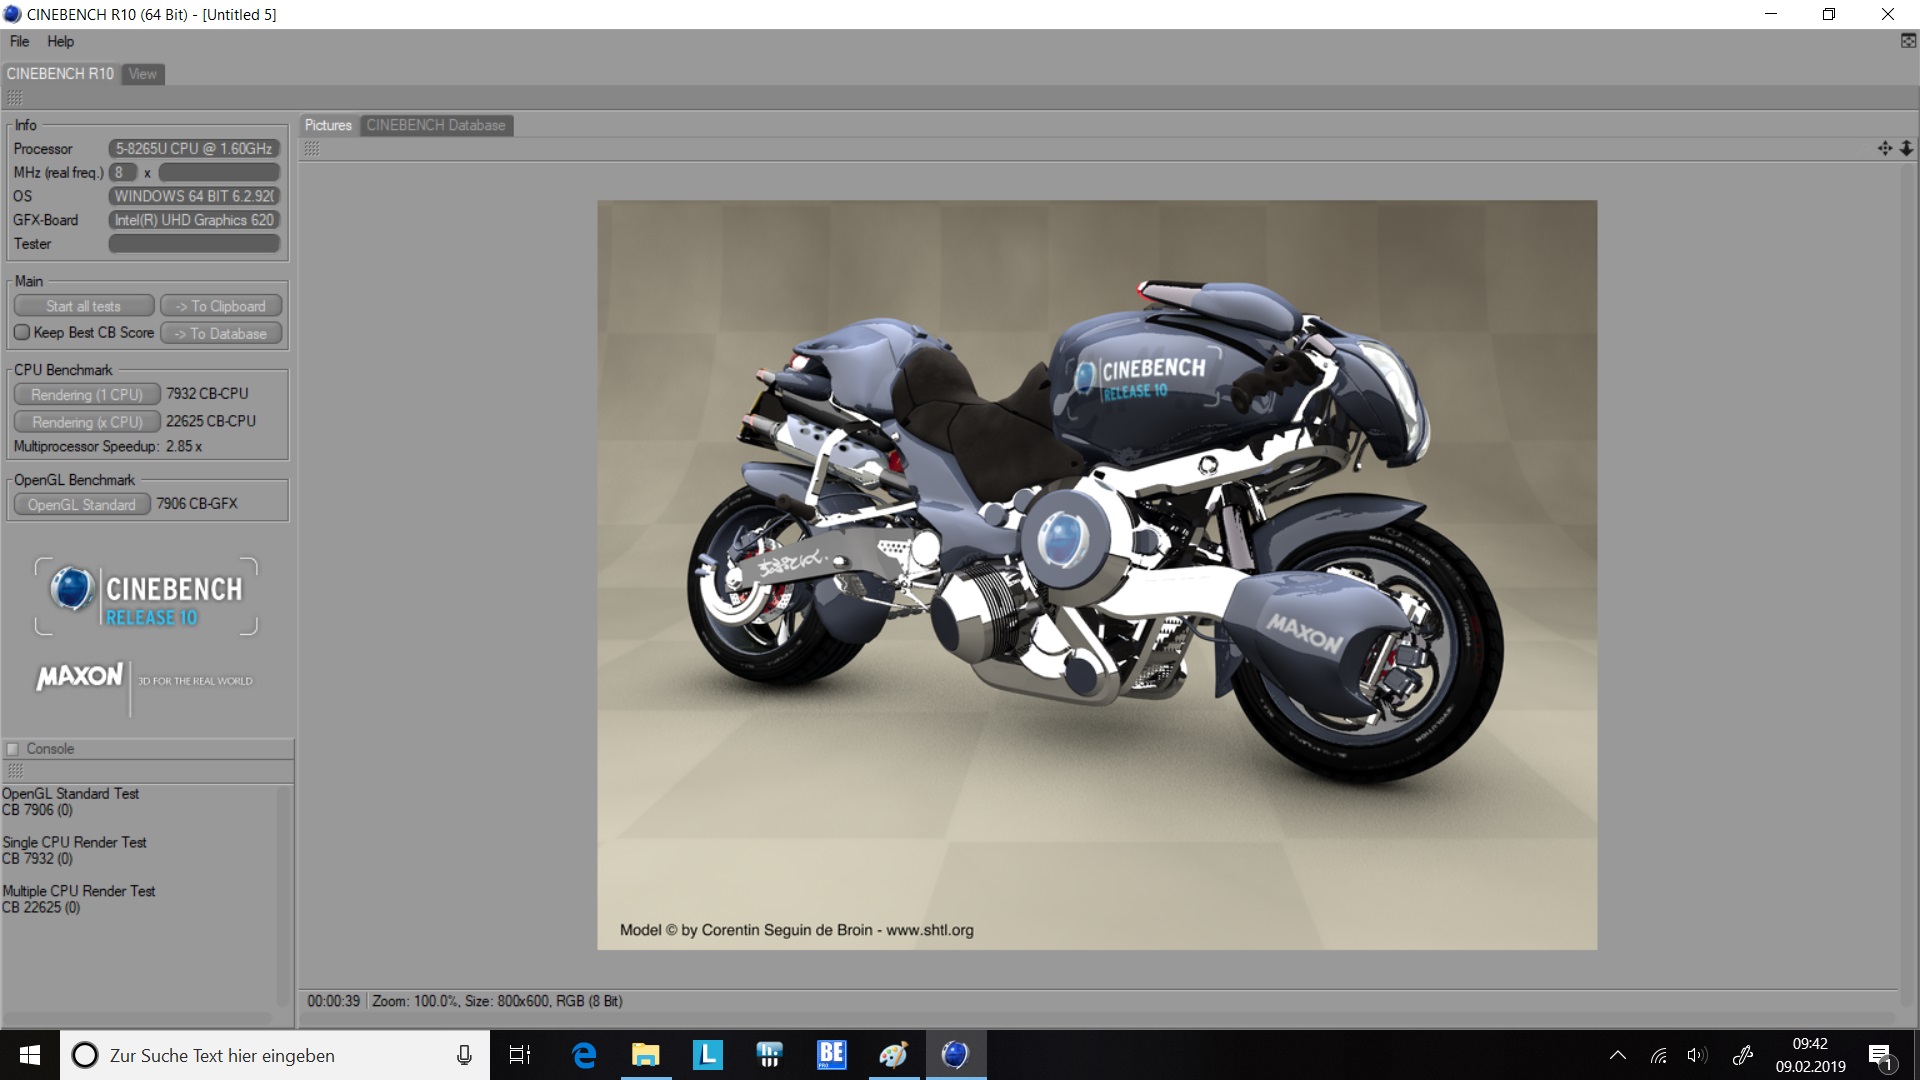
| Cinebench R10 | |
| Rendering Single CPUs 64Bit | |
| Média da turma Convertible (12127 - 12555, n=2, últimos 2 anos) | |
| Lenovo ThinkPad L390 Yoga-20NT000XGE | |
| Média Intel Core i5-8265U (7705 - 7975, n=4) | |
| Lenovo Yoga C930-13IKB | |
| Rendering Multiple CPUs 64Bit | |
| Média da turma Convertible (36094 - 50439, n=2, últimos 2 anos) | |
| Lenovo Yoga C930-13IKB | |
| Lenovo ThinkPad L390 Yoga-20NT000XGE | |
| Média Intel Core i5-8265U (18924 - 25361, n=4) | |
| Blender - v2.79 BMW27 CPU | |
| Média Intel Core i5-8265U (769 - 1098, n=15) | |
| Lenovo ThinkPad L390 Yoga-20NT000XGE | |
| Média da turma Convertible (105 - 1051, n=50, últimos 2 anos) | |
* ... menor é melhor
| PCMark 8 Home Score Accelerated v2 | 3780 pontos | |
| PCMark 8 Creative Score Accelerated v2 | 4924 pontos | |
| PCMark 8 Work Score Accelerated v2 | 4843 pontos | |
| PCMark 10 Score | 3840 pontos | |
Ajuda | ||
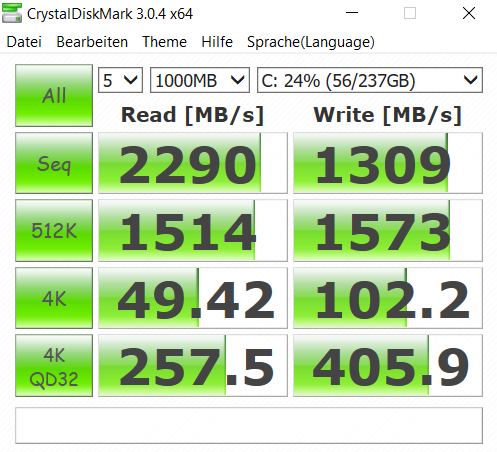
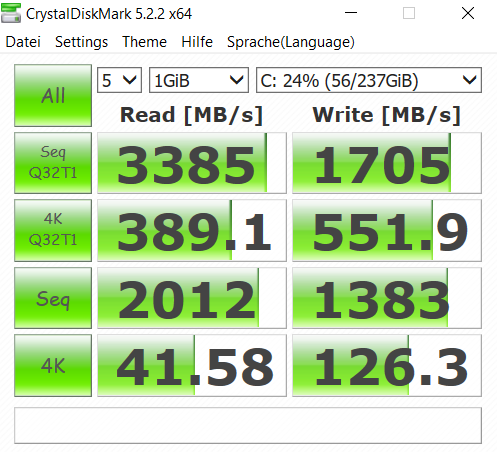
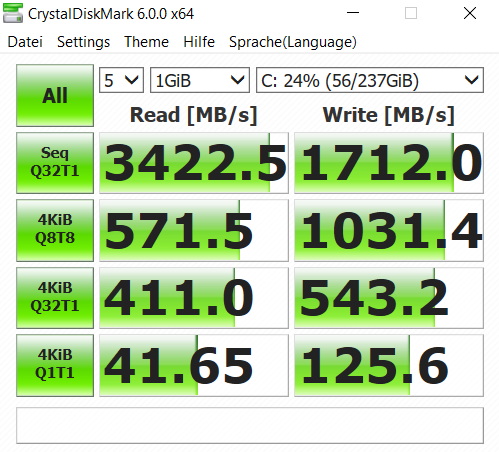
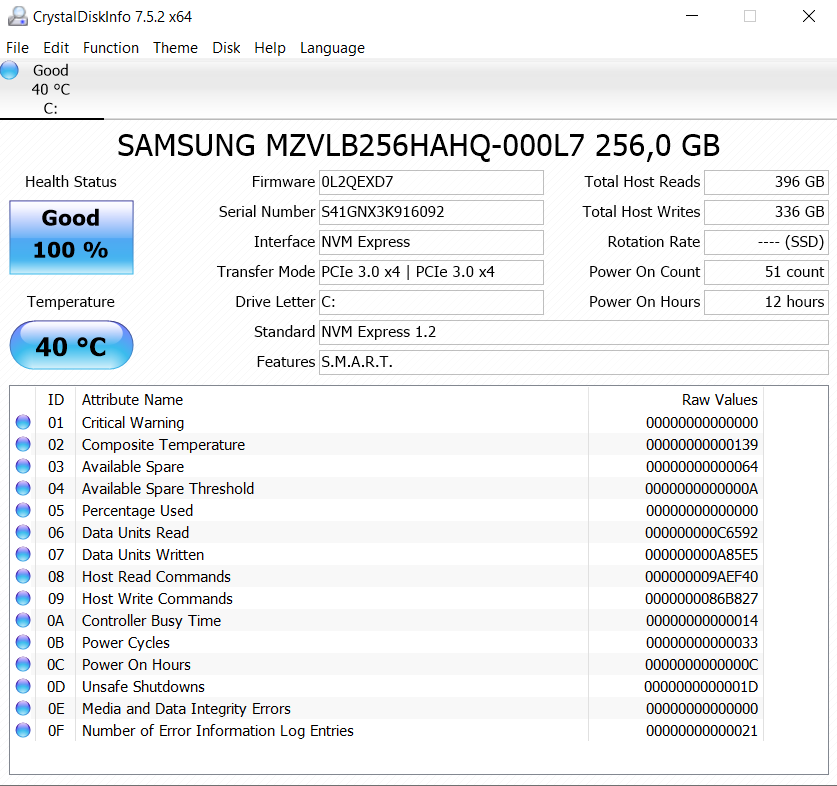
| Lenovo ThinkPad L390 Yoga-20NT000XGE Samsung SSD PM981 MZVLB256HAHQ | Lenovo ThinkPad L380 Yoga-20M7001BGE Samsung PM961 MZVLW256HEHP | Dell Inspiron 13-5379-9573 Micron 1100 MTFDDAV256TBN | Lenovo Yoga C930-13IKB SK hynix PC401 HFS256GD9TNG | Acer Spin 5 SP513-52N-54SF Micron 1100 MTFDDAV256TBN | Média Samsung SSD PM981 MZVLB256HAHQ | |
|---|---|---|---|---|---|---|
| CrystalDiskMark 5.2 / 6 | -8% | -62% | -35% | 32% | ||
| Write 4K (MB/s) | 126.3 | 123.4 -2% | 71.2 -44% | 94.5 -25% | 116.1 ? -8% | |
| Read 4K (MB/s) | 41.58 | 42.24 2% | 25.36 -39% | 39.95 -4% | 189.5 ? 356% | |
| Write Seq (MB/s) | 1383 | 920 -33% | 196.3 -86% | 531 -62% | 1409 ? 2% | |
| Read Seq (MB/s) | 2012 | 1991 -1% | 455.7 -77% | 1499 -25% | 1624 ? -19% | |
| Write 4K Q32T1 (MB/s) | 543 | 531 -2% | 261 -52% | 315.3 -42% | 360 ? -34% | |
| Read 4K Q32T1 (MB/s) | 411 | 373.6 -9% | 231.8 -44% | 279.8 -32% | 396 ? -4% | |
| Write Seq Q32T1 (MB/s) | 1712 | 1360 -21% | 510 -70% | 829 -52% | 1492 ? -13% | |
| Read Seq Q32T1 (MB/s) | 3423 | 3394 -1% | 525 -85% | 2570 -25% | 3313 ? -3% | |
| Write 4K Q8T8 (MB/s) | 1031 | 332 -68% | 1152 ? 12% | |||
| Read 4K Q8T8 (MB/s) | 572 | 488.6 -15% | 736 ? 29% | |||
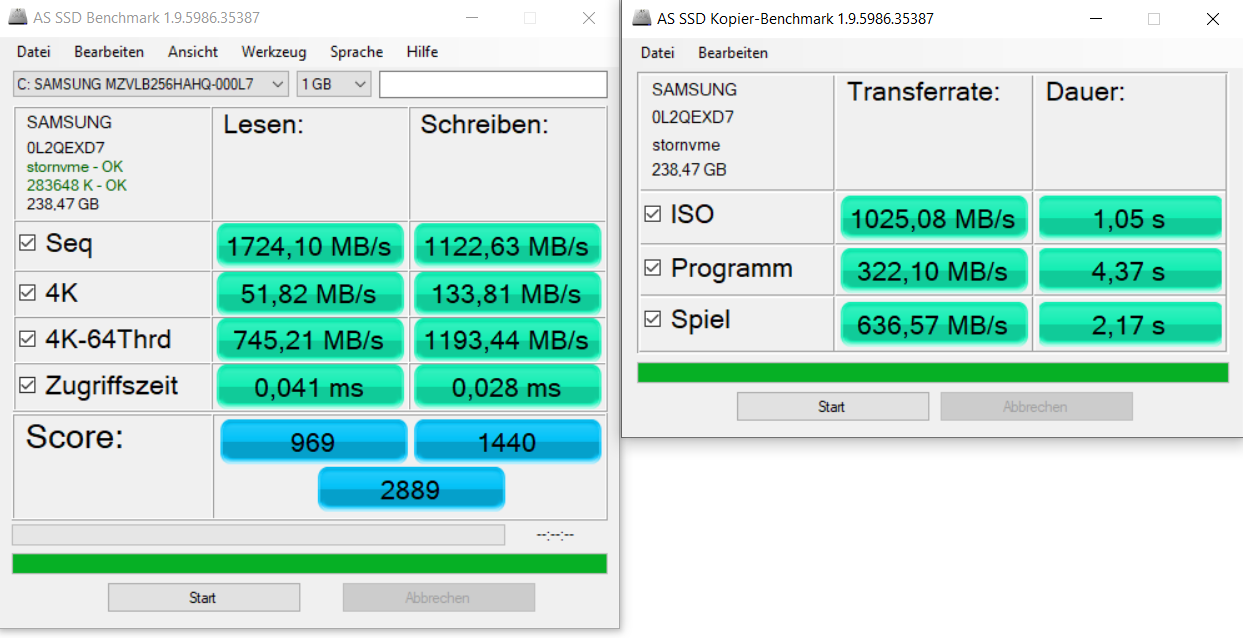
| AS SSD | -25% | -90% | -47% | -74% | -6% | |
| Seq Read (MB/s) | 1724 | 1609 -7% | 462.8 -73% | 1850 7% | 486.3 -72% | 2032 ? 18% |
| Seq Write (MB/s) | 1123 | 859 -24% | 365.7 -67% | 661 -41% | 421.4 -62% | 1339 ? 19% |
| 4K Read (MB/s) | 51.8 | 49.34 -5% | 24.71 -52% | 38.04 -27% | 25.48 -51% | 46.1 ? -11% |
| 4K Write (MB/s) | 133.8 | 117 -13% | 68.2 -49% | 95 -29% | 80.8 -40% | 107.4 ? -20% |
| 4K-64 Read (MB/s) | 745 | 774 4% | 232.2 -69% | 434.3 -42% | 235.5 -68% | 712 ? -4% |
| 4K-64 Write (MB/s) | 1193 | 299.9 -75% | 245.1 -79% | 266.3 -78% | 216.5 -82% | 999 ? -16% |
| Access Time Read * (ms) | 0.041 | 0.049 -20% | 0.13 -217% | 0.069 -68% | 0.11 -168% | 0.07076 ? -73% |
| Access Time Write * (ms) | 0.028 | 0.031 -11% | 0.074 -164% | 0.056 -100% | 0.055 -96% | 0.04352 ? -55% |
| Score Read (Points) | 969 | 984 2% | 303 -69% | 657 -32% | 310 -68% | 961 ? -1% |
| Score Write (Points) | 1440 | 503 -65% | 350 -76% | 427 -70% | 340 -76% | 1240 ? -14% |
| Score Total (Points) | 2889 | 1966 -32% | 812 -72% | 1373 -52% | 813 -72% | 2671 ? -8% |
| Copy ISO MB/s (MB/s) | 1025 | 747 -27% | 539 -47% | 327.5 -68% | 1297 ? 27% | |
| Copy Program MB/s (MB/s) | 322.1 | 216.3 -33% | 209.7 -35% | 157.3 -51% | 409 ? 27% | |
| Copy Game MB/s (MB/s) | 637 | 364.9 -43% | 340 -47% | 246.6 -61% | 786 ? 23% | |
| Média Total (Programa/Configurações) | -17% /
-19% | -76% /
-78% | -41% /
-42% | -74% /
-74% | 13% /
10% |
* ... menor é melhor

| SPECviewperf 13 | |
| Solidworks (sw-04) | |
| Média Intel UHD Graphics 620 (28 - 37.6, n=7) | |
| Lenovo ThinkPad L390 Yoga-20NT000XGE | |
| Siemens NX (snx-03) | |
| Média Intel UHD Graphics 620 (4.37 - 5.37, n=7) | |
| Lenovo ThinkPad L390 Yoga-20NT000XGE | |
| Showcase (showcase-02) | |
| Média Intel UHD Graphics 620 (4.99 - 8.34, n=7) | |
| Lenovo ThinkPad L390 Yoga-20NT000XGE | |
| Medical (medical-02) | |
| Lenovo ThinkPad L390 Yoga-20NT000XGE | |
| Média Intel UHD Graphics 620 (1.96 - 2.26, n=7) | |
| Maya (maya-05) | |
| Média Intel UHD Graphics 620 (15.7 - 23, n=7) | |
| Lenovo ThinkPad L390 Yoga-20NT000XGE | |
| Energy (energy-02) | |
| Média Intel UHD Graphics 620 (0.21 - 2.85, n=6) | |
| Lenovo ThinkPad L390 Yoga-20NT000XGE | |
| Creo (creo-02) | |
| Média Intel UHD Graphics 620 (15.2 - 18.9, n=7) | |
| Lenovo ThinkPad L390 Yoga-20NT000XGE | |
| Catia (catia-05) | |
| Média Intel UHD Graphics 620 (17.4 - 23.4, n=7) | |
| Lenovo ThinkPad L390 Yoga-20NT000XGE | |
| 3ds Max (3dsmax-06) | |
| Média Intel UHD Graphics 620 (10.8 - 15, n=7) | |
| Lenovo ThinkPad L390 Yoga-20NT000XGE | |
| 3DMark 11 Performance | 1874 pontos | |
| 3DMark Ice Storm Standard Score | 57630 pontos | |
| 3DMark Cloud Gate Standard Score | 7947 pontos | |
| 3DMark Fire Strike Score | 1000 pontos | |
| 3DMark Fire Strike Extreme Score | 452 pontos | |
Ajuda | ||
| baixo | média | alto | ultra | |
|---|---|---|---|---|
| BioShock Infinite (2013) | 54.3 | 29.1 | 23.7 | 7.3 |
| Dota 2 Reborn (2015) | 69.5 | 38.7 | 18 | 16 |
| X-Plane 11.11 (2018) | 30.3 | 22.7 | 19.1 |
Barulho
| Ocioso |
| 29.5 / 29.5 / 29.5 dB |
| Carga |
| 30.6 / 30.6 dB |
 | ||
30 dB silencioso 40 dB(A) audível 50 dB(A) ruidosamente alto |
||
min: | ||
| Lenovo ThinkPad L390 Yoga-20NT000XGE UHD Graphics 620, i5-8265U, Samsung SSD PM981 MZVLB256HAHQ | Lenovo ThinkPad L380 Yoga-20M7001BGE UHD Graphics 620, i5-8250U, Samsung PM961 MZVLW256HEHP | Dell Inspiron 13-5379-9573 UHD Graphics 620, i5-8250U, Micron 1100 MTFDDAV256TBN | Lenovo Yoga C930-13IKB UHD Graphics 620, i5-8250U, SK hynix PC401 HFS256GD9TNG | Acer Spin 5 SP513-52N-54SF UHD Graphics 620, i5-8250U, Micron 1100 MTFDDAV256TBN | |
|---|---|---|---|---|---|
| Noise | -4% | -5% | -2% | -6% | |
| desligado / ambiente * (dB) | 29.5 | 30.4 -3% | 30.1 -2% | 29.3 1% | 30.4 -3% |
| Idle Minimum * (dB) | 29.5 | 30.4 -3% | 30.1 -2% | 29.3 1% | 30.4 -3% |
| Idle Average * (dB) | 29.5 | 30.4 -3% | 30.1 -2% | 29.3 1% | 30.4 -3% |
| Idle Maximum * (dB) | 29.5 | 30.8 -4% | 30.1 -2% | 29.7 -1% | 30.9 -5% |
| Load Average * (dB) | 30.6 | 32.1 -5% | 33 -8% | 31.8 -4% | 34 -11% |
| Load Maximum * (dB) | 30.6 | 32.9 -8% | 35 -14% | 32.7 -7% | 33.5 -9% |
* ... menor é melhor
(-) A temperatura máxima no lado superior é 46.7 °C / 116 F, em comparação com a média de 35.4 °C / 96 F , variando de 19.6 a 60 °C para a classe Convertible.
(-) A parte inferior aquece até um máximo de 50.7 °C / 123 F, em comparação com a média de 36.9 °C / 98 F
(+) Em uso inativo, a temperatura média para o lado superior é 22.9 °C / 73 F, em comparação com a média do dispositivo de 30.3 °C / ### class_avg_f### F.
(+) Os apoios para as mãos e o touchpad são mais frios que a temperatura da pele, com um máximo de 24.7 °C / 76.5 F e, portanto, são frios ao toque.
(+) A temperatura média da área do apoio para as mãos de dispositivos semelhantes foi 28 °C / 82.4 F (+3.3 °C / 5.9 F).
| Lenovo ThinkPad L390 Yoga-20NT000XGE UHD Graphics 620, i5-8265U, Samsung SSD PM981 MZVLB256HAHQ | Lenovo ThinkPad L380 Yoga-20M7001BGE UHD Graphics 620, i5-8250U, Samsung PM961 MZVLW256HEHP | Dell Inspiron 13-5379-9573 UHD Graphics 620, i5-8250U, Micron 1100 MTFDDAV256TBN | Lenovo Yoga C930-13IKB UHD Graphics 620, i5-8250U, SK hynix PC401 HFS256GD9TNG | Acer Spin 5 SP513-52N-54SF UHD Graphics 620, i5-8250U, Micron 1100 MTFDDAV256TBN | |
|---|---|---|---|---|---|
| Heat | 0% | -23% | 6% | 1% | |
| Maximum Upper Side * (°C) | 46.7 | 45 4% | 43.2 7% | 41.8 10% | 41.8 10% |
| Maximum Bottom * (°C) | 50.7 | 44.5 12% | 57.8 -14% | 40.9 19% | 47.8 6% |
| Idle Upper Side * (°C) | 23.8 | 25.6 -8% | 35.7 -50% | 25.6 -8% | 26 -9% |
| Idle Bottom * (°C) | 25.6 | 27.7 -8% | 34.6 -35% | 24.5 4% | 26.9 -5% |
* ... menor é melhor
Lenovo ThinkPad L390 Yoga-20NT000XGE análise de áudio
(±) | o volume do alto-falante é médio, mas bom (###valor### dB)
Graves 100 - 315Hz
(-) | quase nenhum baixo - em média 17.9% menor que a mediana
(±) | a linearidade dos graves é média (12.9% delta para a frequência anterior)
Médios 400 - 2.000 Hz
(+) | médios equilibrados - apenas 2.1% longe da mediana
(+) | médios são lineares (6.1% delta para frequência anterior)
Altos 2 - 16 kHz
(±) | máximos mais altos - em média 7.5% maior que a mediana
(±) | a linearidade dos máximos é média (9.1% delta para frequência anterior)
Geral 100 - 16.000 Hz
(±) | a linearidade do som geral é média (23% diferença em relação à mediana)
Comparado com a mesma classe
» 69% de todos os dispositivos testados nesta classe foram melhores, 5% semelhantes, 26% piores
» O melhor teve um delta de 6%, a média foi 20%, o pior foi 57%
Comparado com todos os dispositivos testados
» 69% de todos os dispositivos testados foram melhores, 5% semelhantes, 26% piores
» O melhor teve um delta de 4%, a média foi 23%, o pior foi 134%
Lenovo Yoga C930-13IKB análise de áudio
(±) | o volume do alto-falante é médio, mas bom (###valor### dB)
Graves 100 - 315Hz
(+) | bons graves - apenas 4.8% longe da mediana
(±) | a linearidade dos graves é média (8.8% delta para a frequência anterior)
Médios 400 - 2.000 Hz
(+) | médios equilibrados - apenas 3% longe da mediana
(+) | médios são lineares (4.6% delta para frequência anterior)
Altos 2 - 16 kHz
(±) | máximos reduzidos - em média 5.1% menor que a mediana
(+) | os máximos são lineares (5.4% delta da frequência anterior)
Geral 100 - 16.000 Hz
(+) | o som geral é linear (14.1% diferença em relação à mediana)
Comparado com a mesma classe
» 20% de todos os dispositivos testados nesta classe foram melhores, 4% semelhantes, 76% piores
» O melhor teve um delta de 6%, a média foi 20%, o pior foi 57%
Comparado com todos os dispositivos testados
» 17% de todos os dispositivos testados foram melhores, 4% semelhantes, 79% piores
» O melhor teve um delta de 4%, a média foi 23%, o pior foi 134%
| desligado | |
| Ocioso | |
| Carga |
|
Key:
min: | |
| Lenovo ThinkPad L390 Yoga-20NT000XGE i5-8265U, UHD Graphics 620, Samsung SSD PM981 MZVLB256HAHQ, IPS LED, 1920x1080, 13.3" | Lenovo ThinkPad L380 Yoga-20M7001BGE i5-8250U, UHD Graphics 620, Samsung PM961 MZVLW256HEHP, IPS LED, 1920x1080, 13.3" | Dell Inspiron 13-5379-9573 i5-8250U, UHD Graphics 620, Micron 1100 MTFDDAV256TBN, IPS, 1920x1080, 13.3" | Lenovo Yoga C930-13IKB i5-8250U, UHD Graphics 620, SK hynix PC401 HFS256GD9TNG, IPS, 1920x1080, 13.9" | Acer Spin 5 SP513-52N-54SF i5-8250U, UHD Graphics 620, Micron 1100 MTFDDAV256TBN, IPS, 1920x1080, 13.3" | Média Intel UHD Graphics 620 | Média da turma Convertible | |
|---|---|---|---|---|---|---|---|
| Power Consumption | 18% | 15% | -1% | 12% | 5% | -11% | |
| Idle Minimum * (Watt) | 4 | 3.44 14% | 3.2 20% | 3.3 17% | 3.9 2% | 3.81 ? 5% | 4.22 ? -6% |
| Idle Average * (Watt) | 7.1 | 6.9 3% | 5.9 17% | 6.8 4% | 8.2 -15% | 6.94 ? 2% | 6.97 ? 2% |
| Idle Maximum * (Watt) | 10.7 | 9.2 14% | 8.8 18% | 9.5 11% | 8.8 18% | 8.75 ? 18% | 8.63 ? 19% |
| Load Average * (Watt) | 33.8 | 27.6 18% | 31.2 8% | 40.8 -21% | 28.5 16% | 35 ? -4% | 43.9 ? -30% |
| Load Maximum * (Watt) | 48.8 | 29 41% | 42.2 14% | 57 -17% | 30.7 37% | 47.5 ? 3% | 67.1 ? -38% |
* ... menor é melhor
| Lenovo ThinkPad L390 Yoga-20NT000XGE i5-8265U, UHD Graphics 620, 45 Wh | Lenovo ThinkPad L380 Yoga-20M7001BGE i5-8250U, UHD Graphics 620, 45 Wh | Dell Inspiron 13-5379-9573 i5-8250U, UHD Graphics 620, 42 Wh | Lenovo Yoga C930-13IKB i5-8250U, UHD Graphics 620, 60 Wh | Acer Spin 5 SP513-52N-54SF i5-8250U, UHD Graphics 620, 53.9 Wh | Média da turma Convertible | |
|---|---|---|---|---|---|---|
| Duração da bateria | 3% | -7% | 40% | 15% | 67% | |
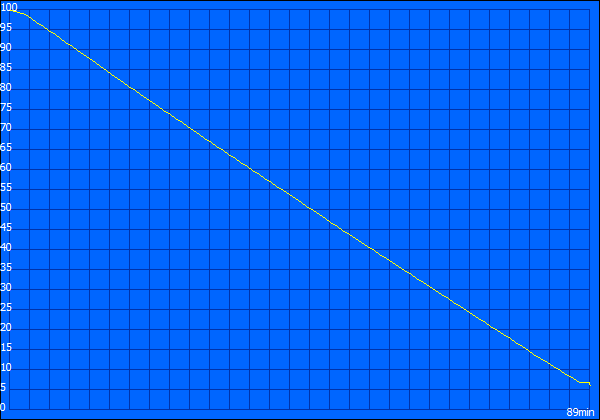
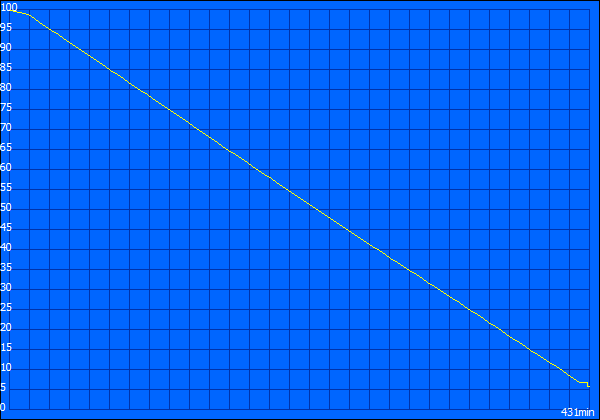
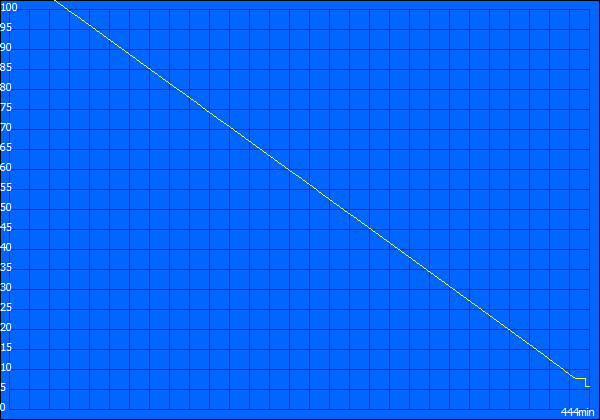
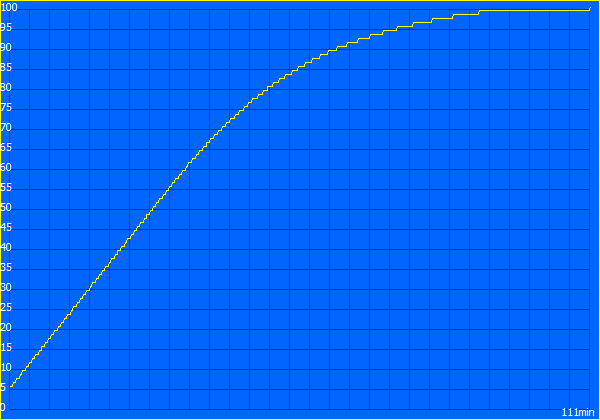
| Reader / Idle (h) | 15.8 | 13.9 -12% | 15.3 -3% | 23.9 51% | 27.7 ? 75% | |
| H.264 (h) | 7.4 | 8.5 15% | 10.5 42% | 15.3 ? 107% | ||
| WiFi v1.3 (h) | 7.2 | 7 -3% | 5.4 -25% | 9.2 28% | 8.3 15% | 12.1 ? 68% |
| Load (h) | 1.5 | 1.7 13% | 1.6 7% | 2.1 40% | 1.779 ? 19% |
Pro
Contra
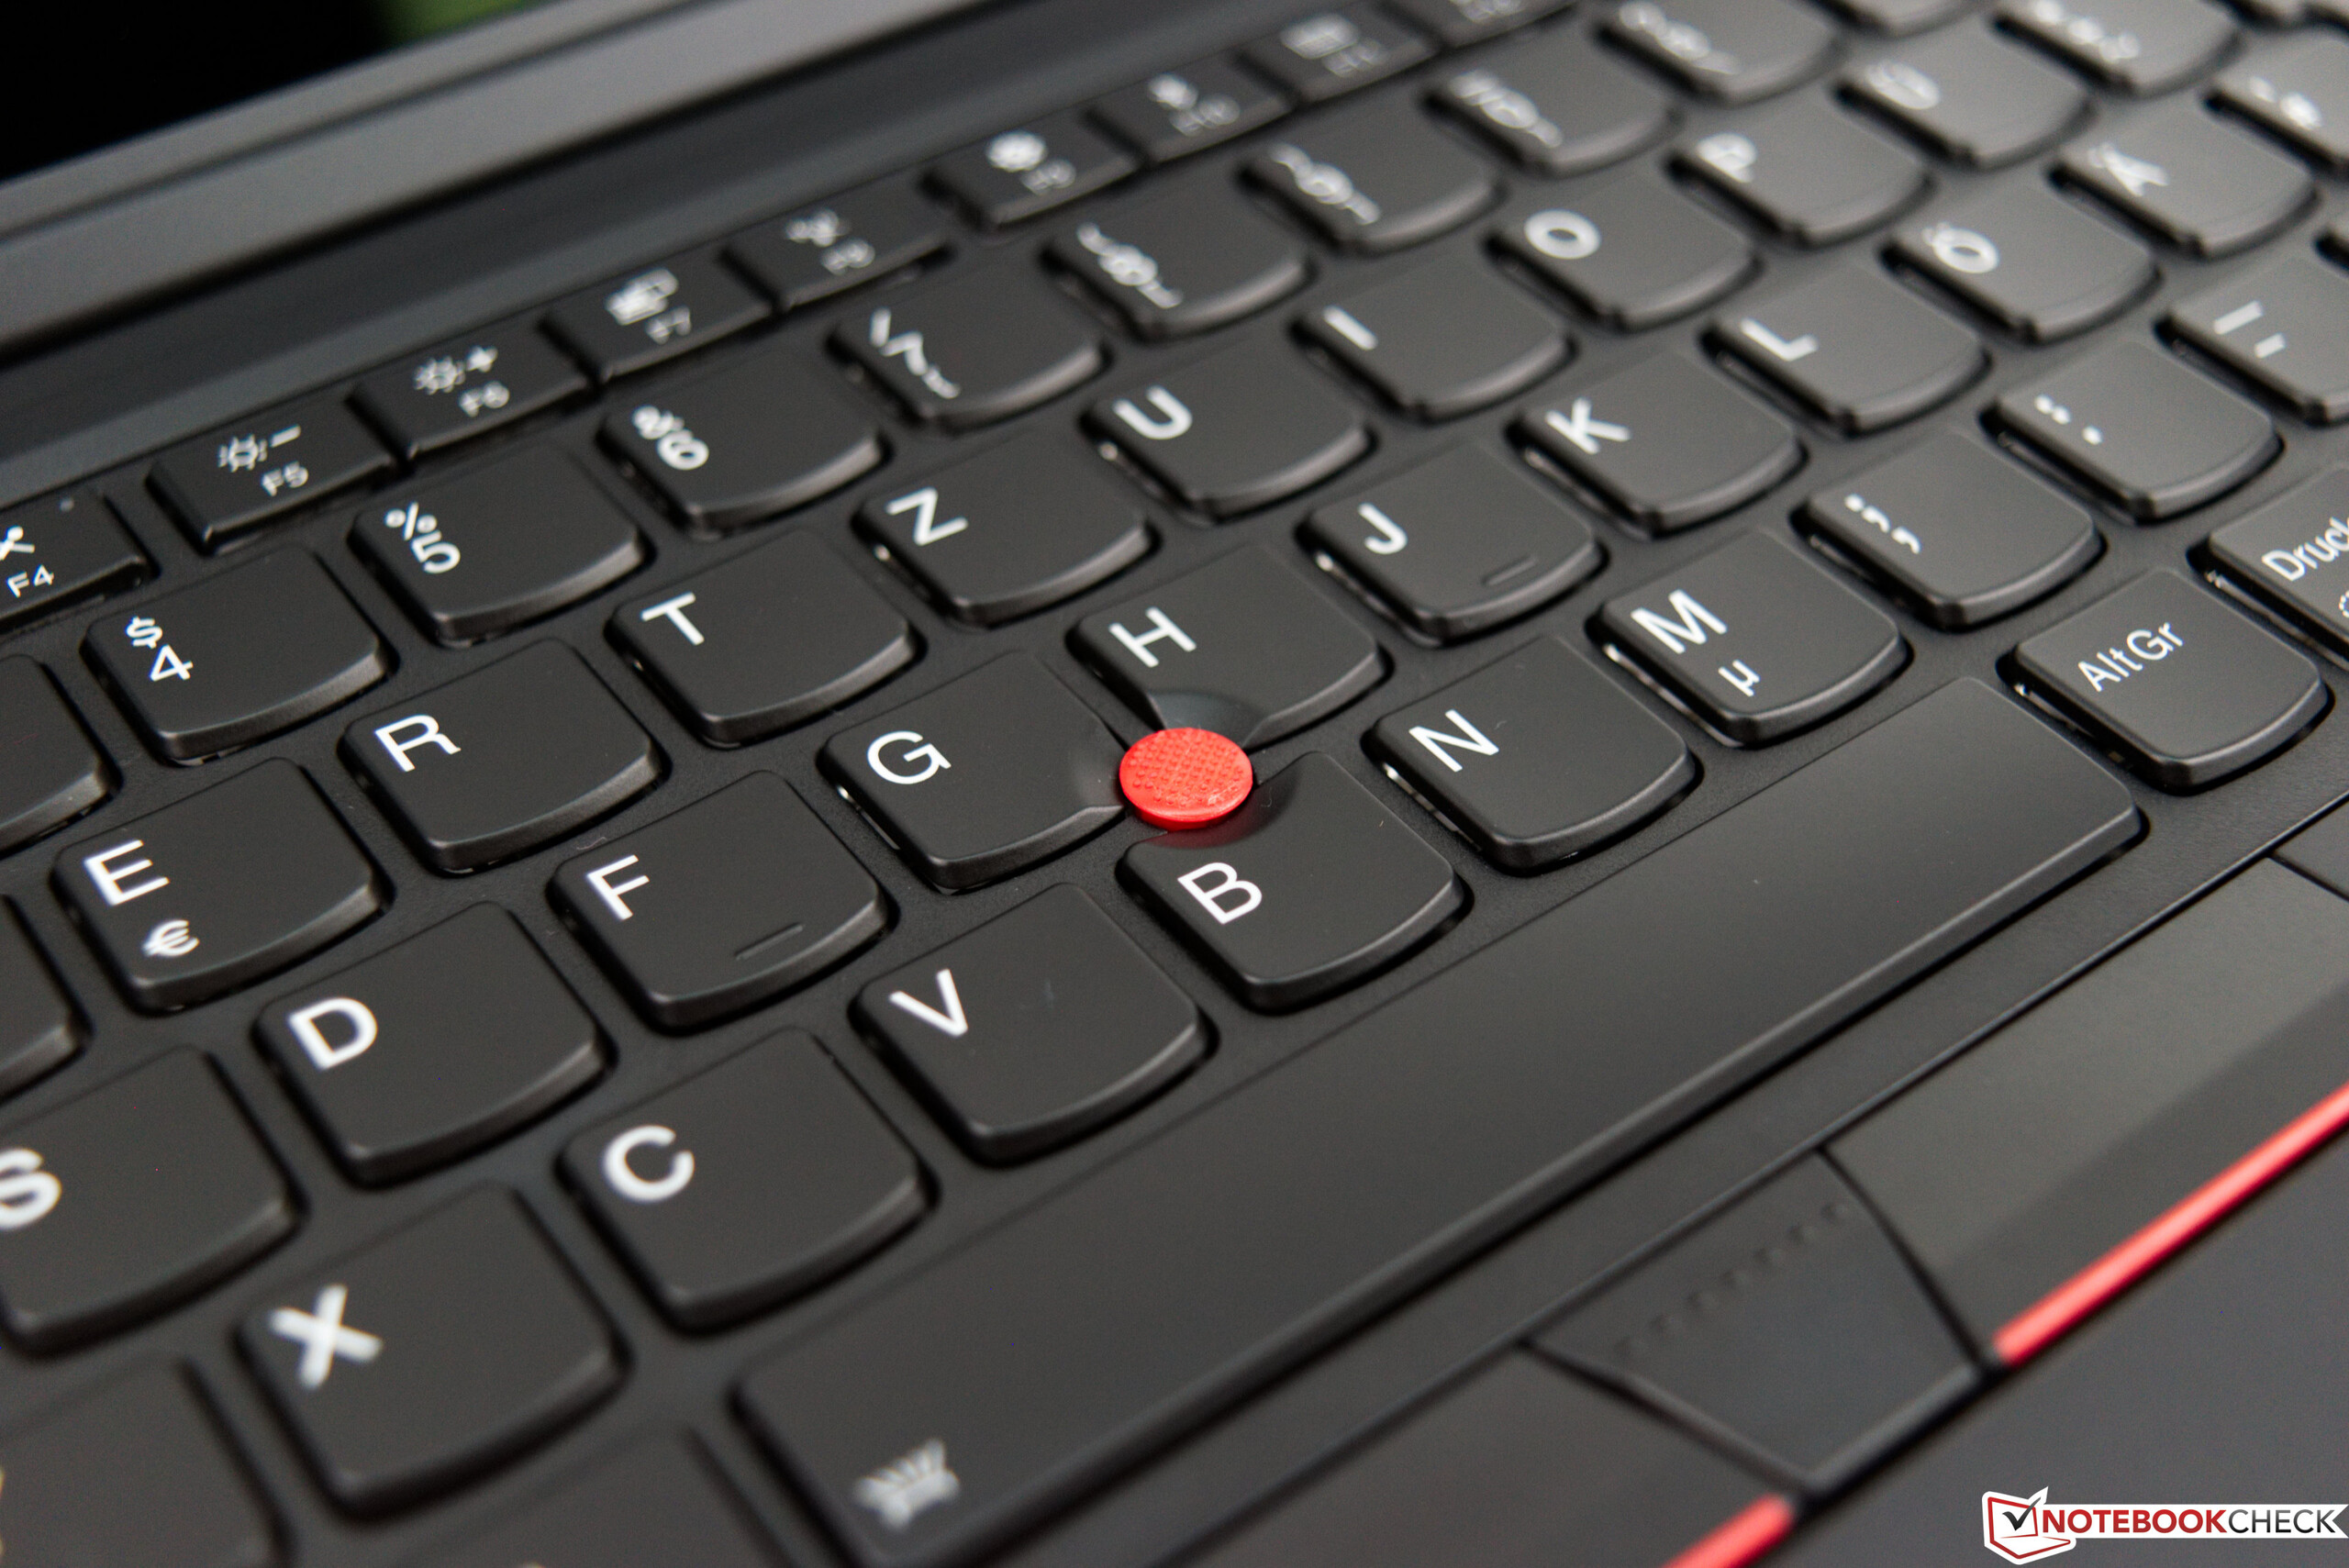
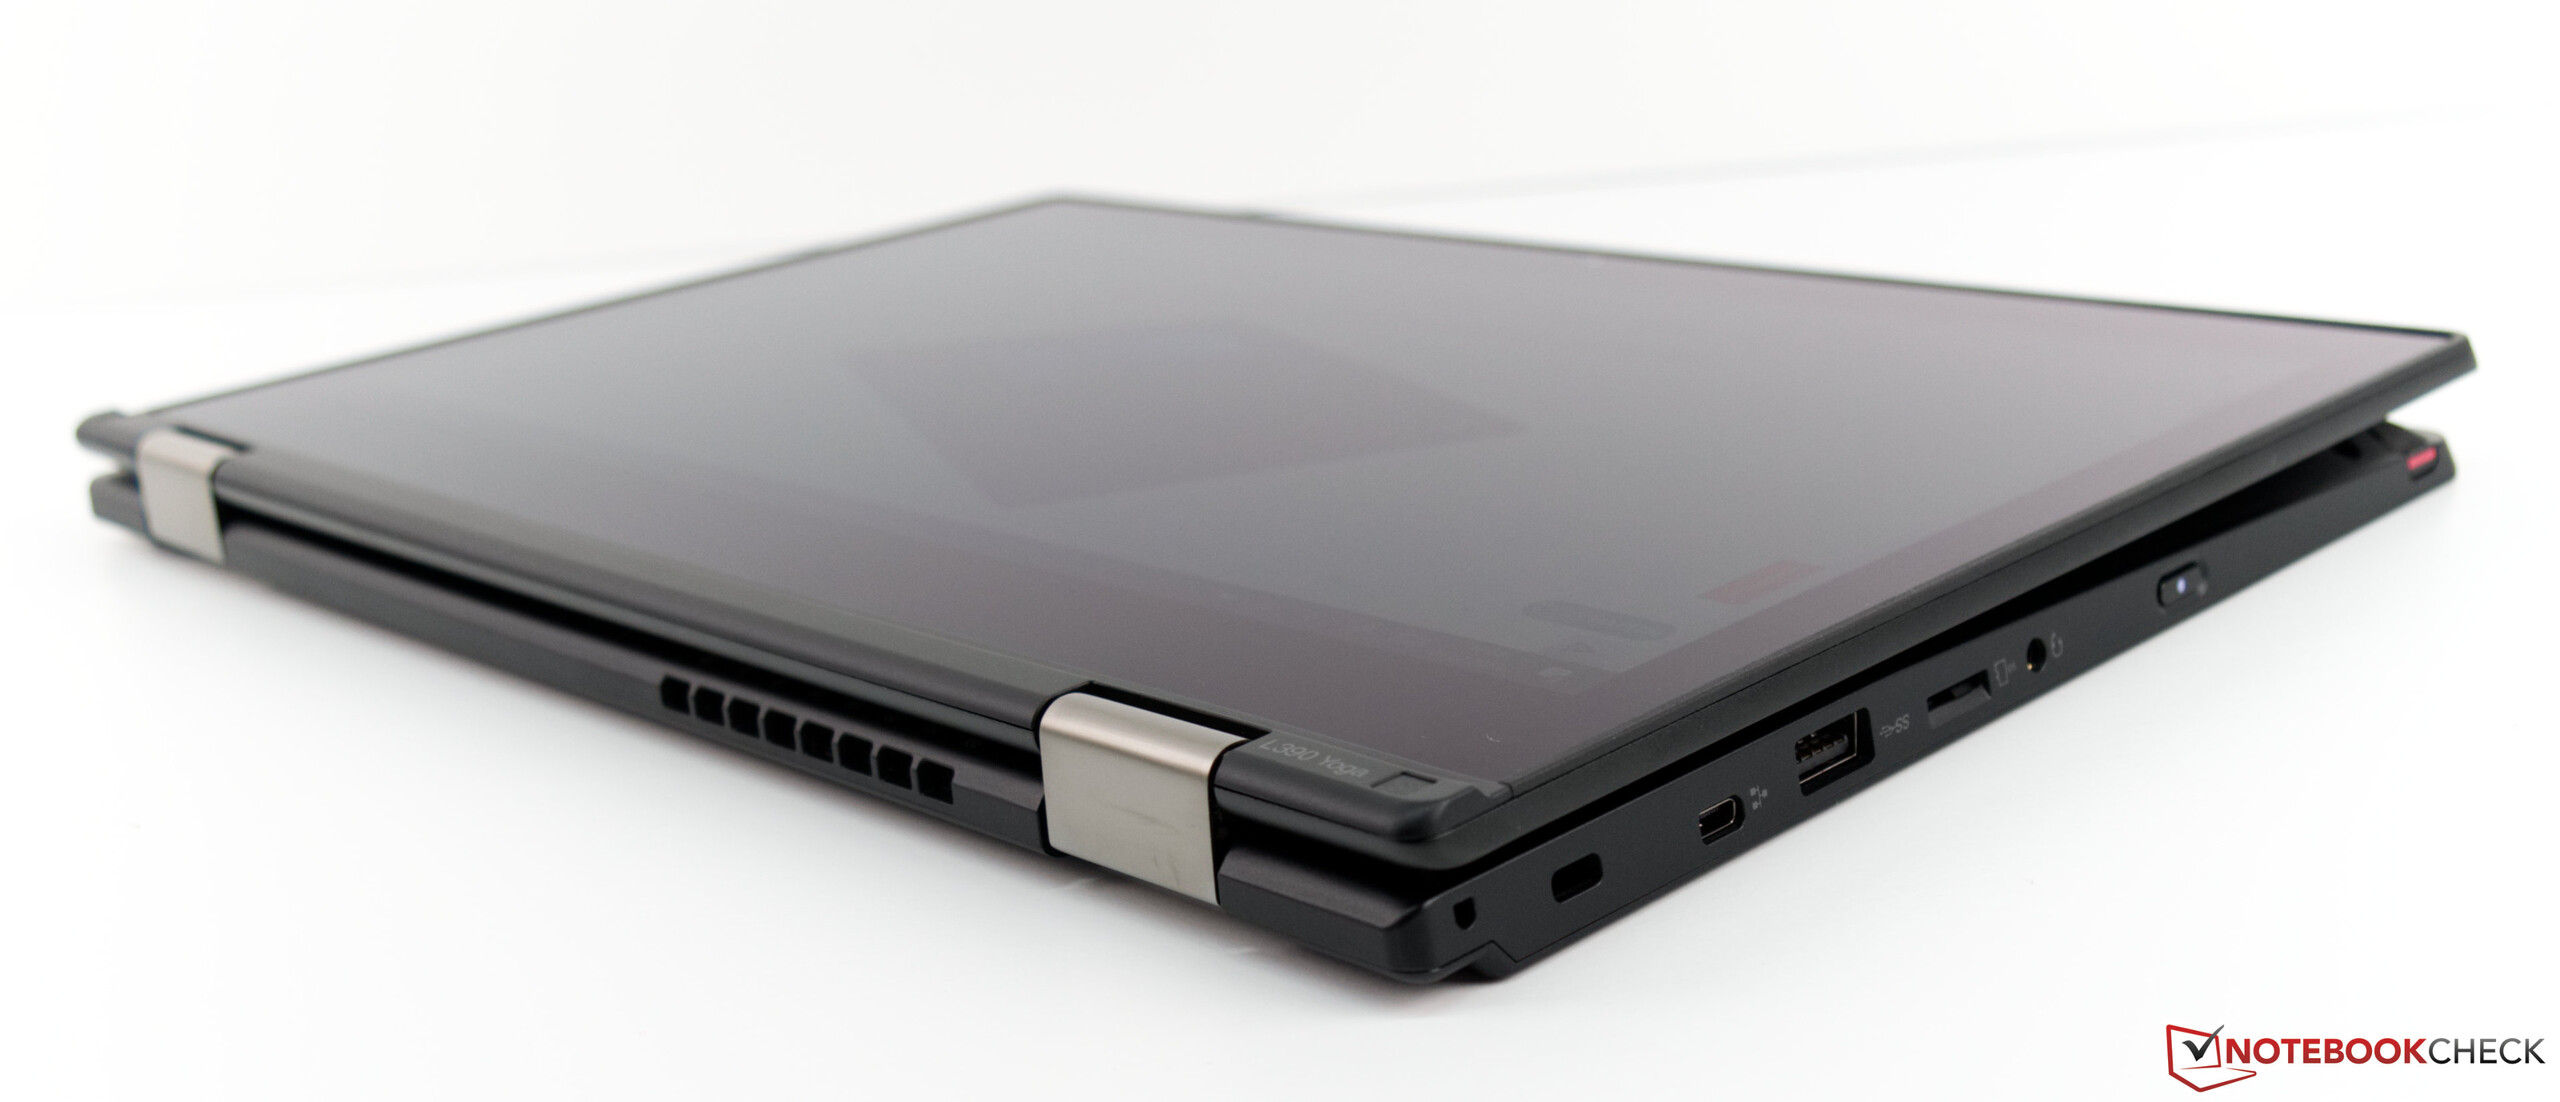
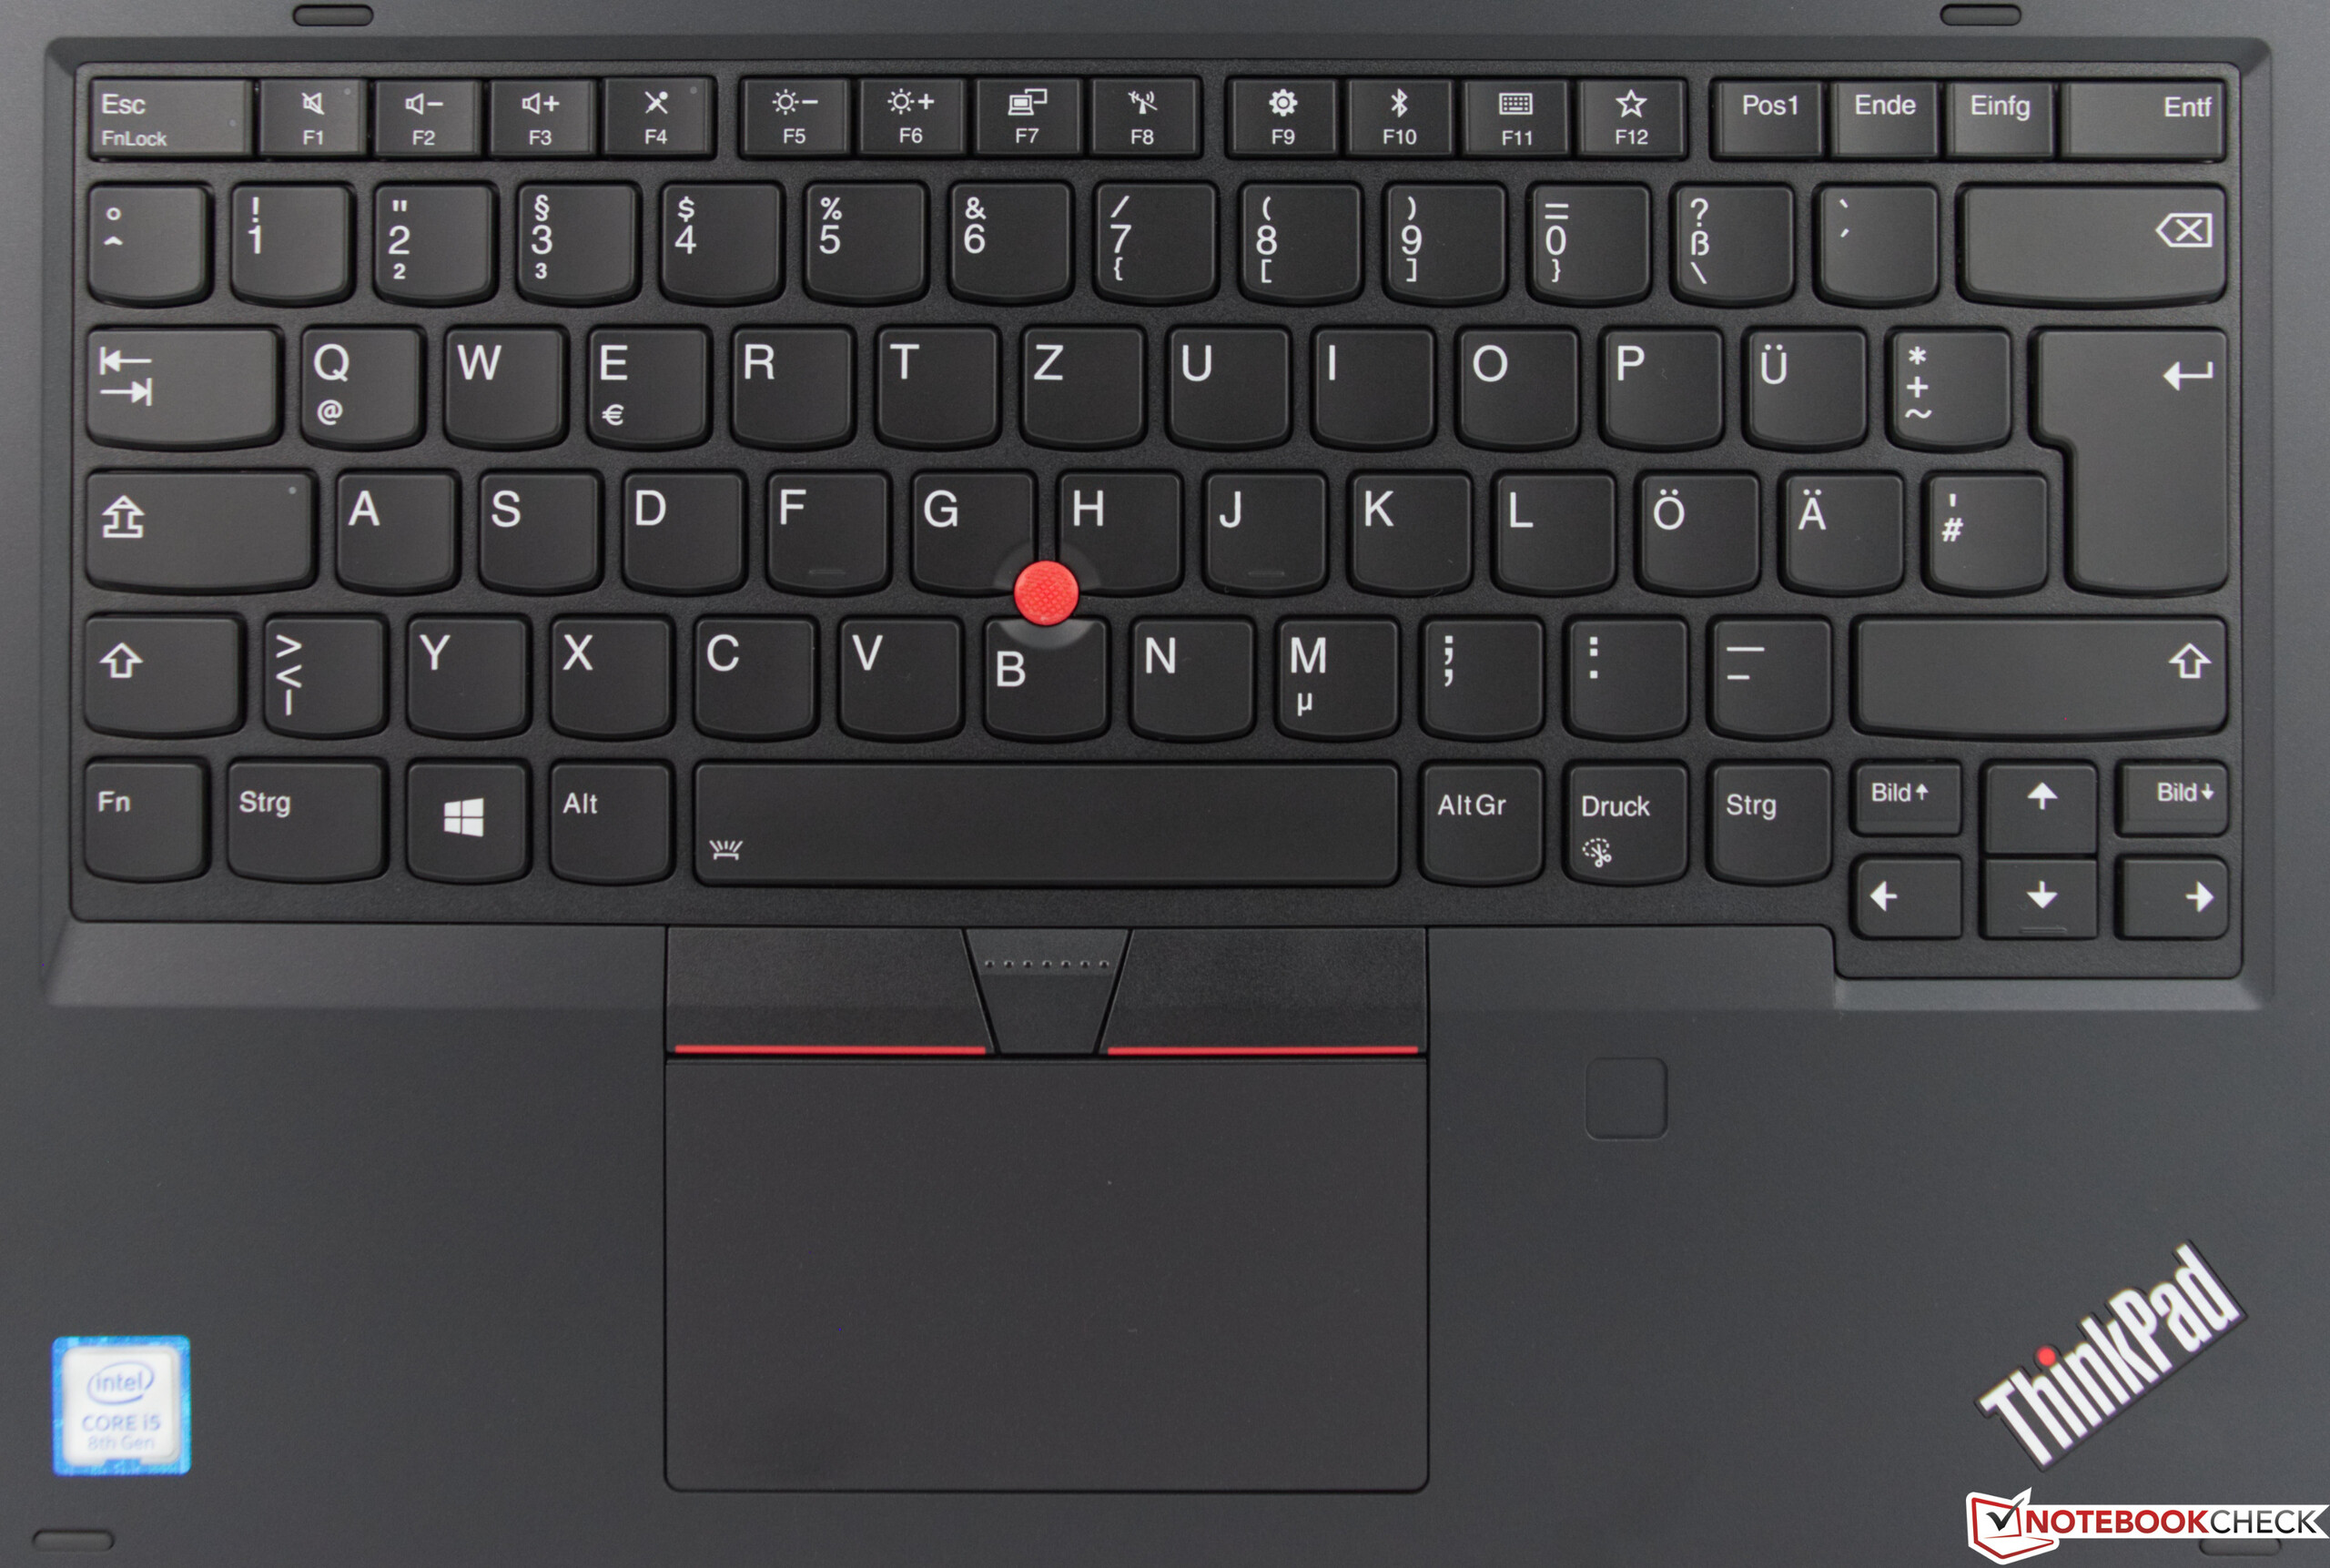
O Lenovo ThinkPad L390 Yoga é um portátil conversível de 13 polegadas bem feito a preço razoável. A Lenovo não abandonou o que nos impressionou sobre outros ThinkPads para manter os custos baixos. A empresa constrói o L390 Yoga com fibra de vidro, alumínio e magnésio, como faz com os seus irmãos mais caros, o que faz com que o L390 Yoga pareça premium e robusto. A empresa constrói o L390 Yoga com fibra de vidro, alumínio e magnésio, como faz com os seus irmãos mais caros, o que faz com que o L390 Yoga pareça melhor e mais robusto. O teclado oferece a mesma experiência de digitação excelente que passamos a amar em outros ThinkPads, mas é uma pena que tenha omitido o mecanismo “lift & lock” que usa em seus conversíveis mais caros.
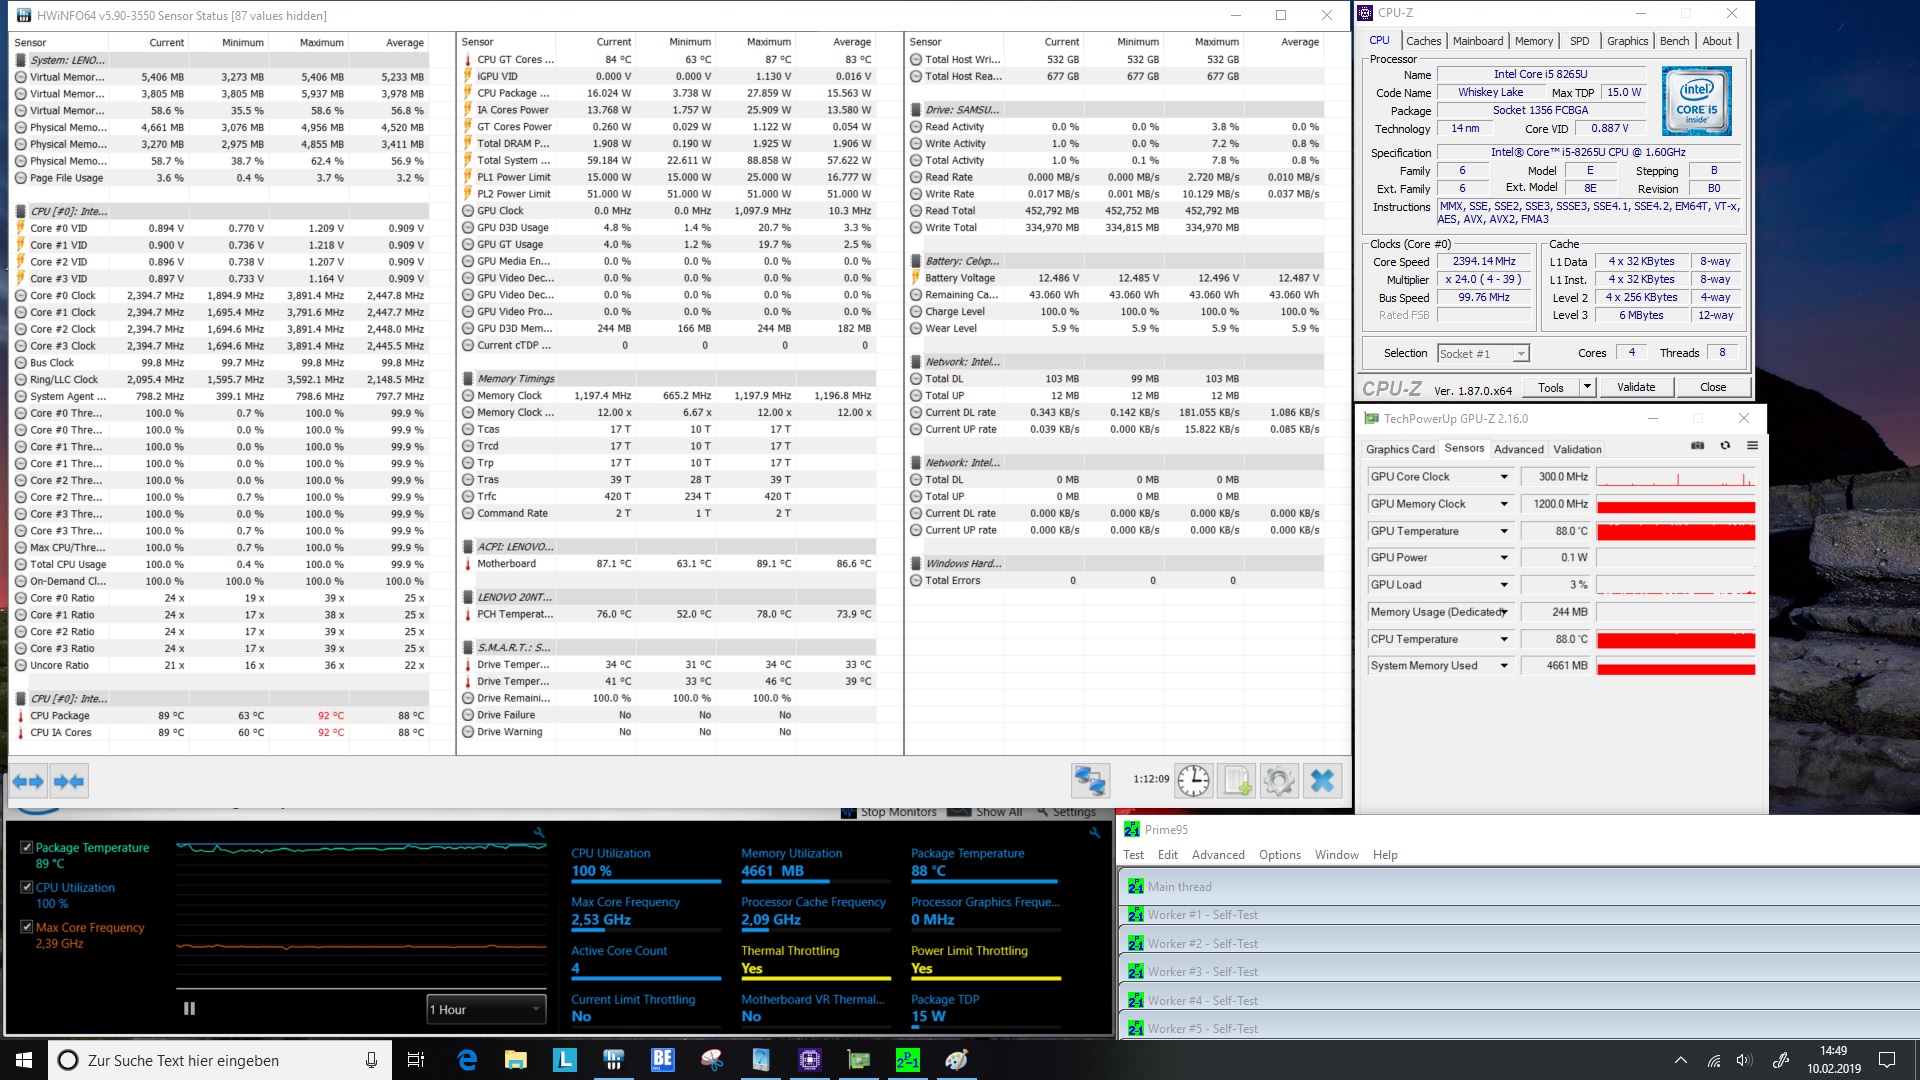
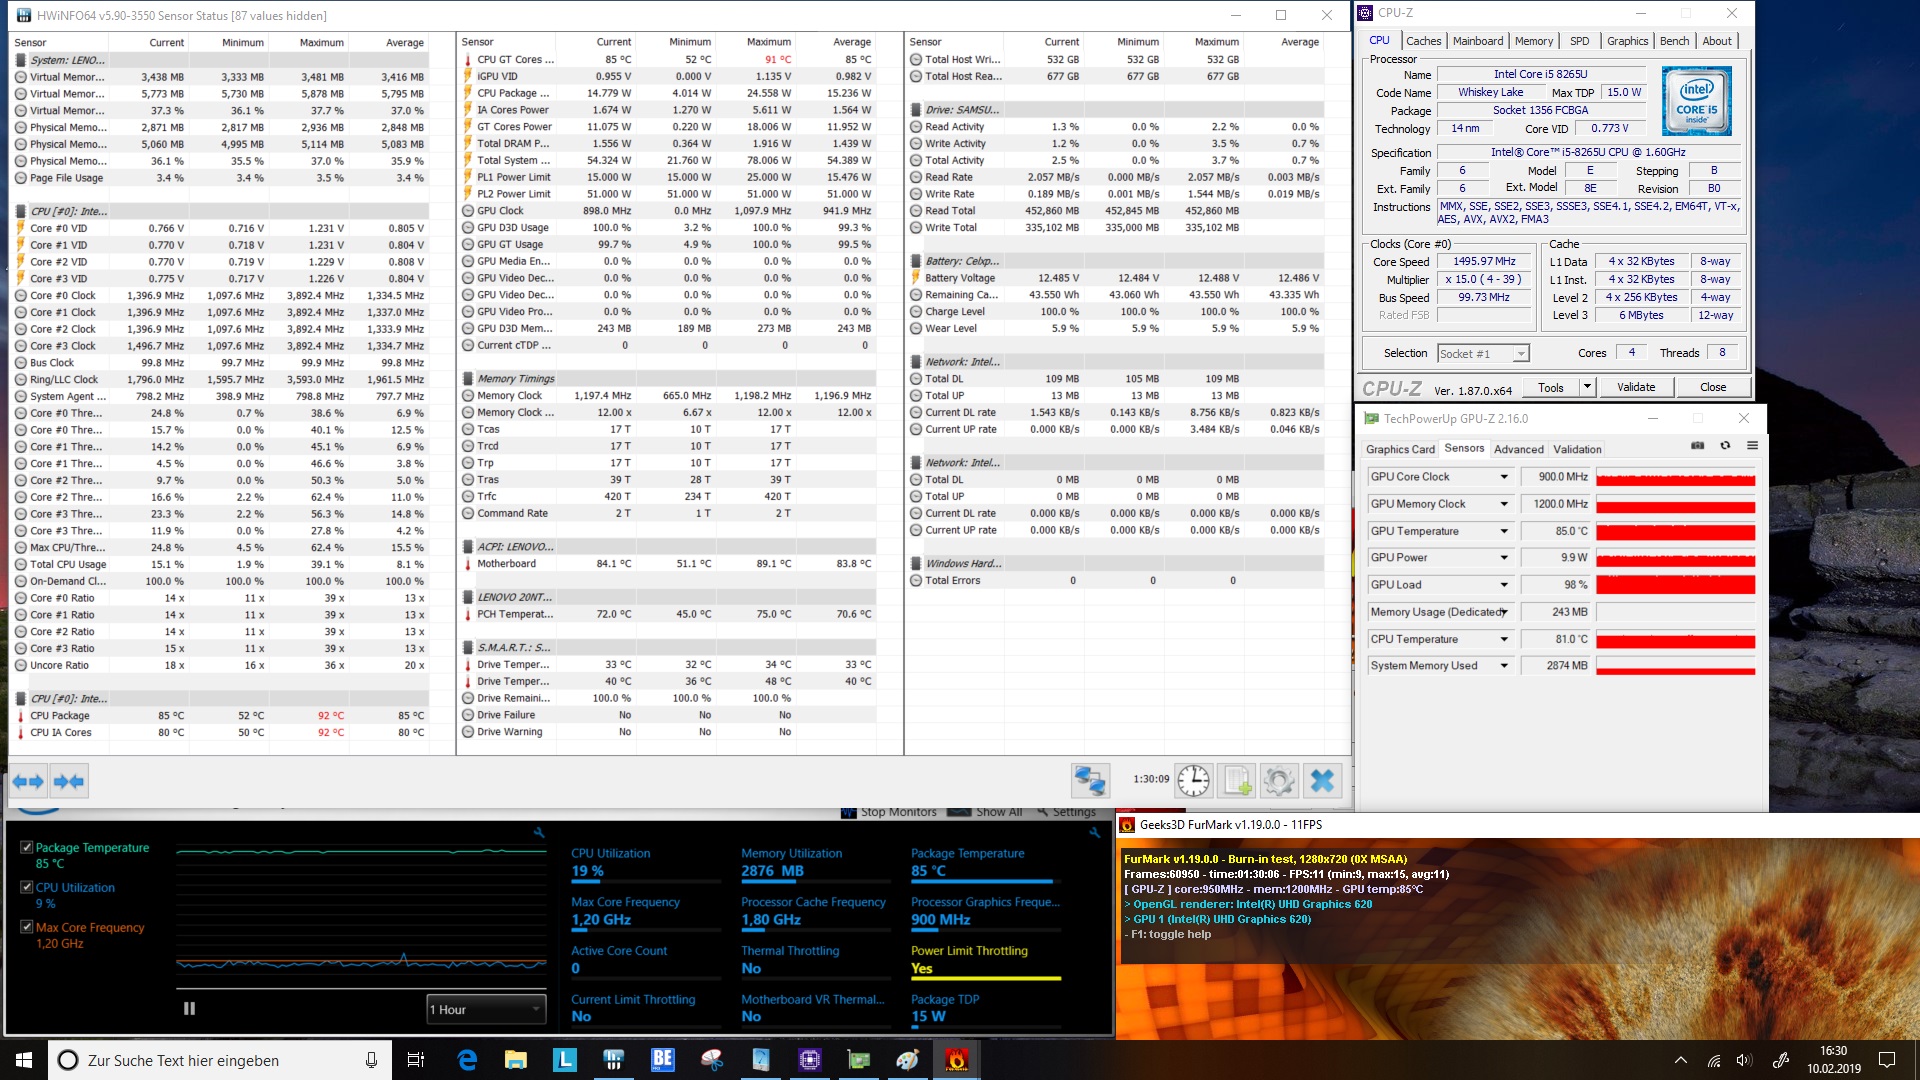
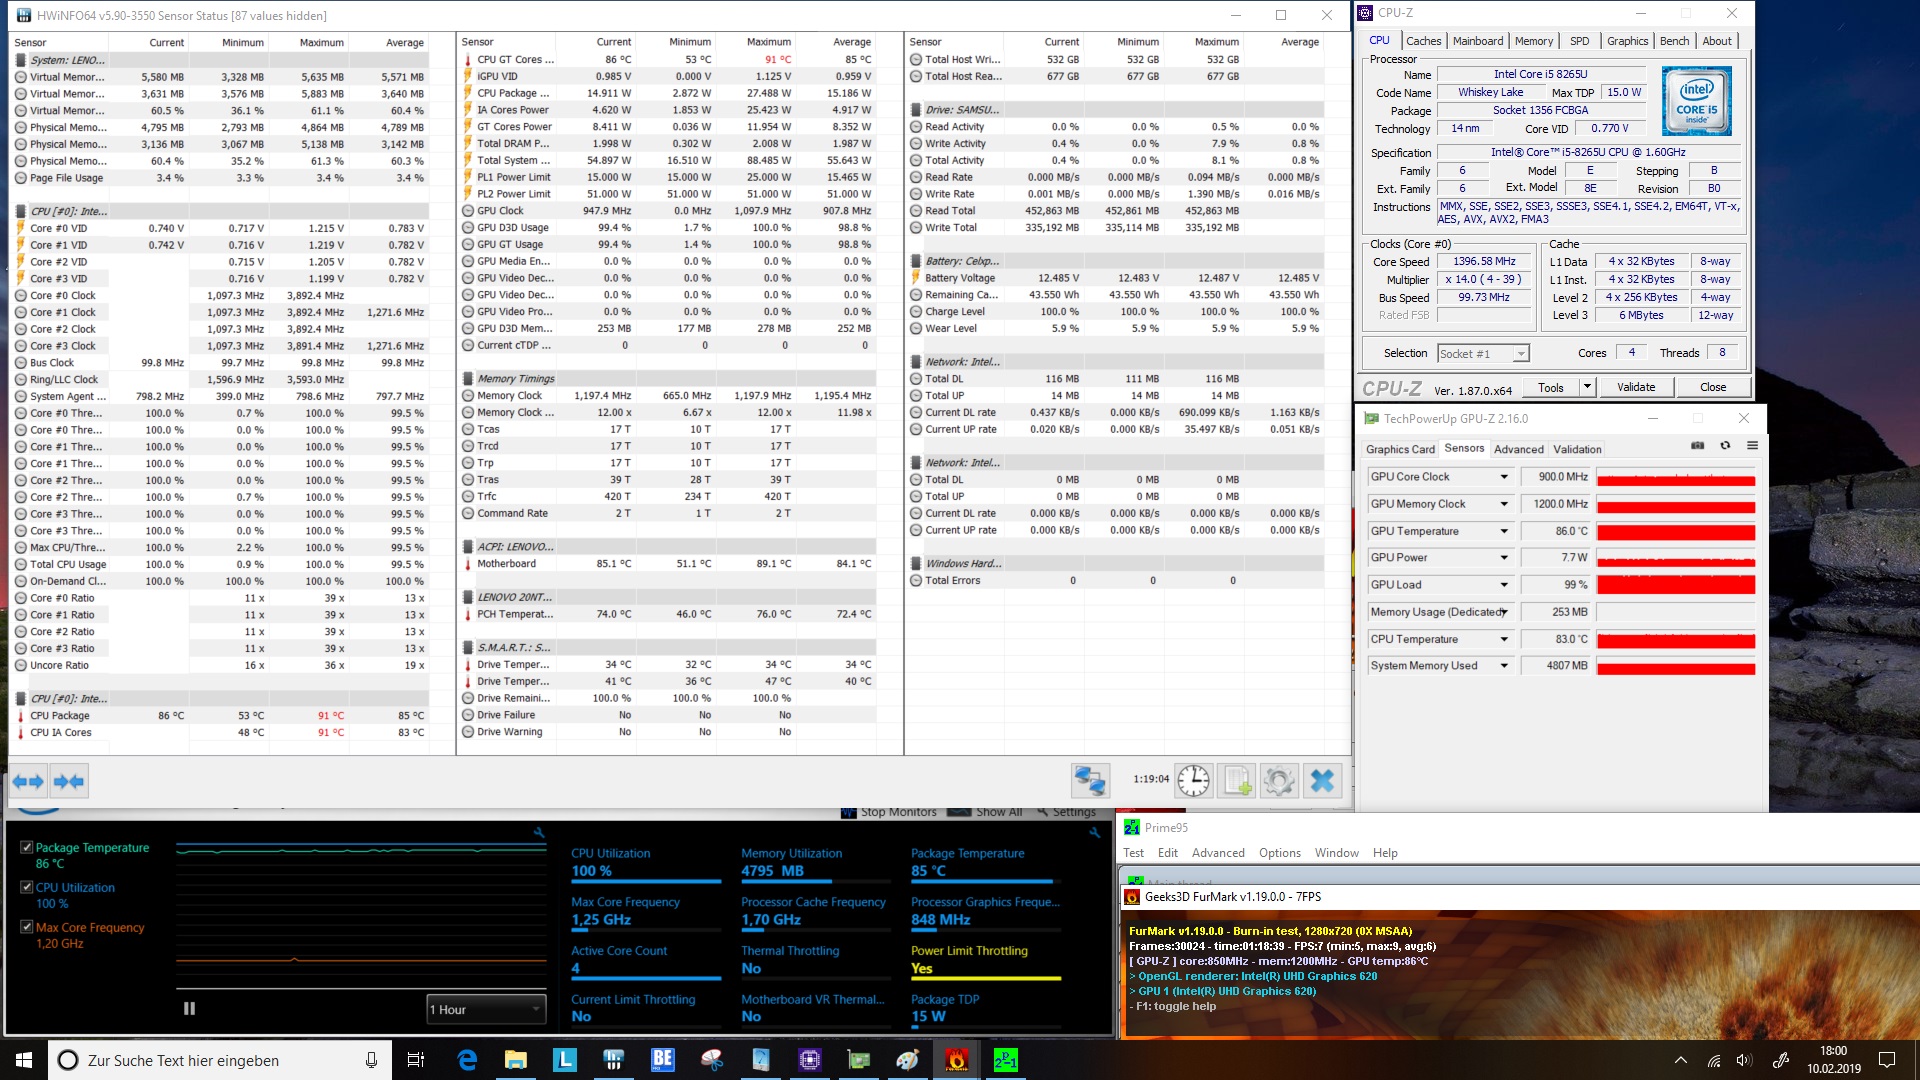
O upgrade para os processadores Whiskey Lake também traz um aumento moderado no desempenho em comparação com o L380 Yoga, mas o sistema de resfriamento é rapidamente sobrecarregado sob carga sustentada, o que pode causar afogamento térmico temporário. Portanto, não temos certeza de como o modelo Core i7 funcionará nos nossos testes. O ventilador também é impressionantemente silencioso, mas ao custo de altas temperaturas.
O Lenovo ThinkPad L390 Yoga é uma atualização incremental sobre o L380 Yoga. A mudança para os processadores Whiskey Lake traz um melhor desempenho, e a Lenovo entregou novamente um ThinkPad conversível de baixo custo que não compromete o impressionante acabamento, dispositivos de entrada e desempenho com os quais o nome do ThinkPad é sinônimo.
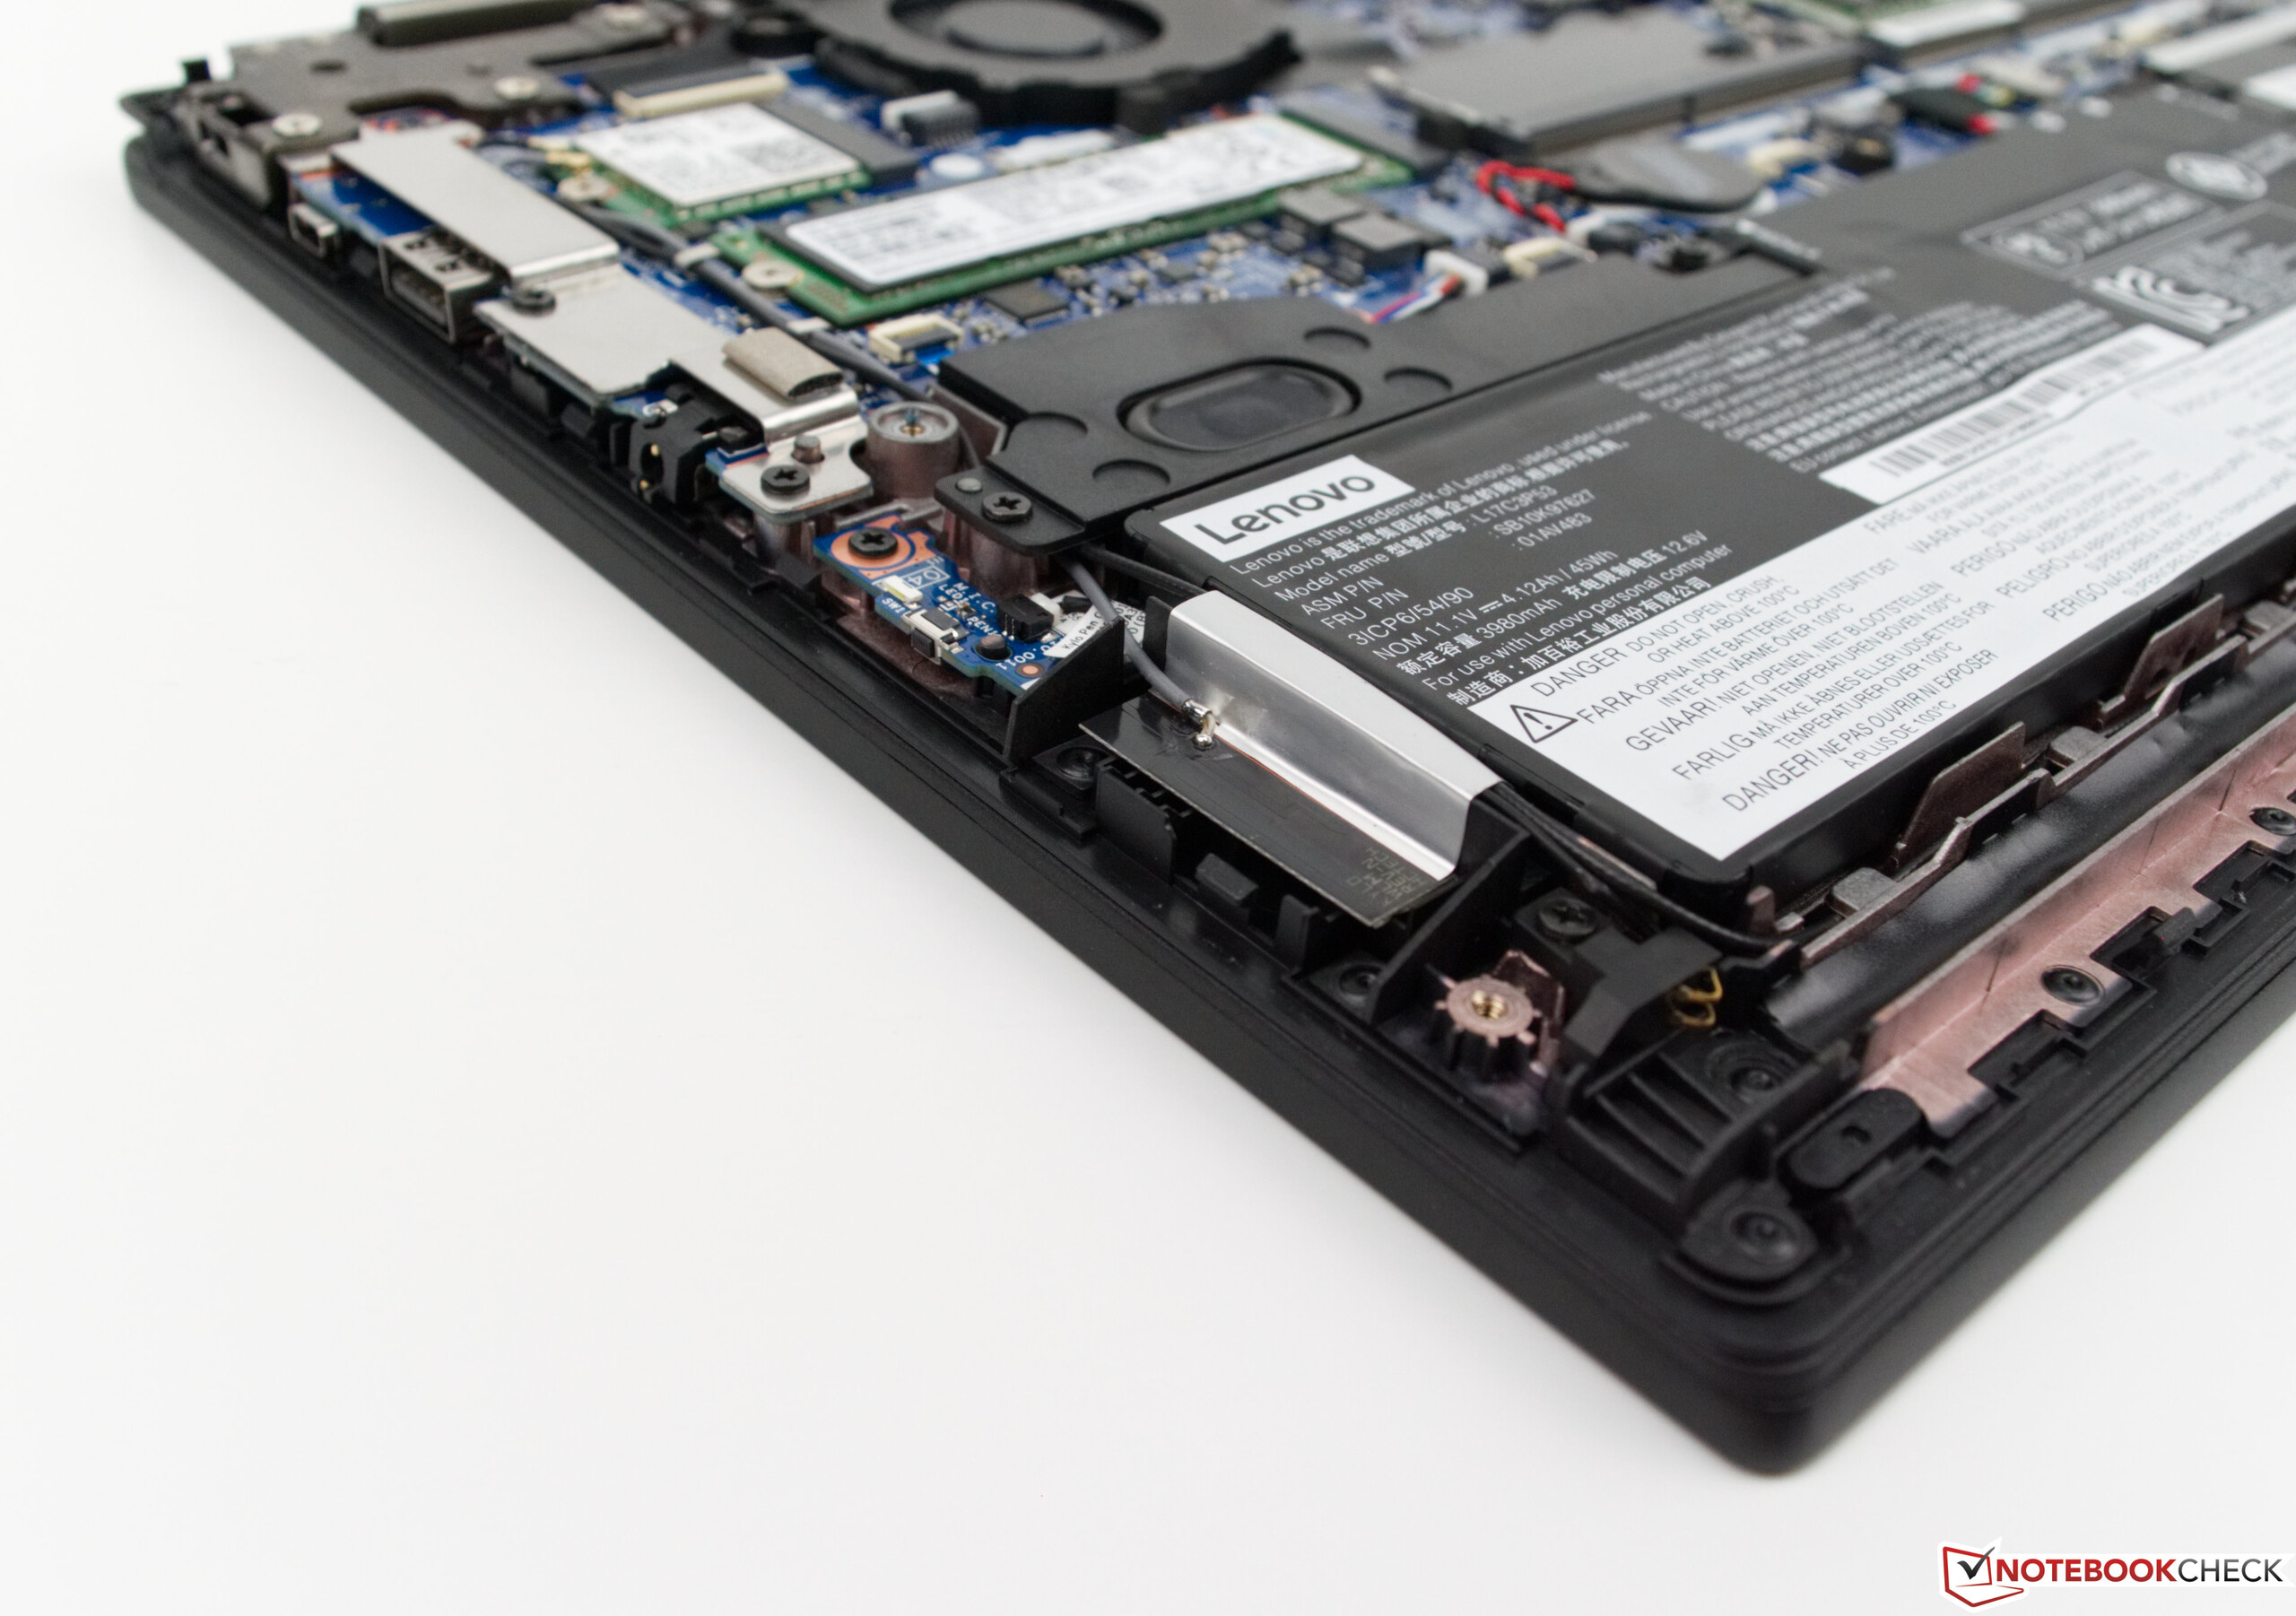
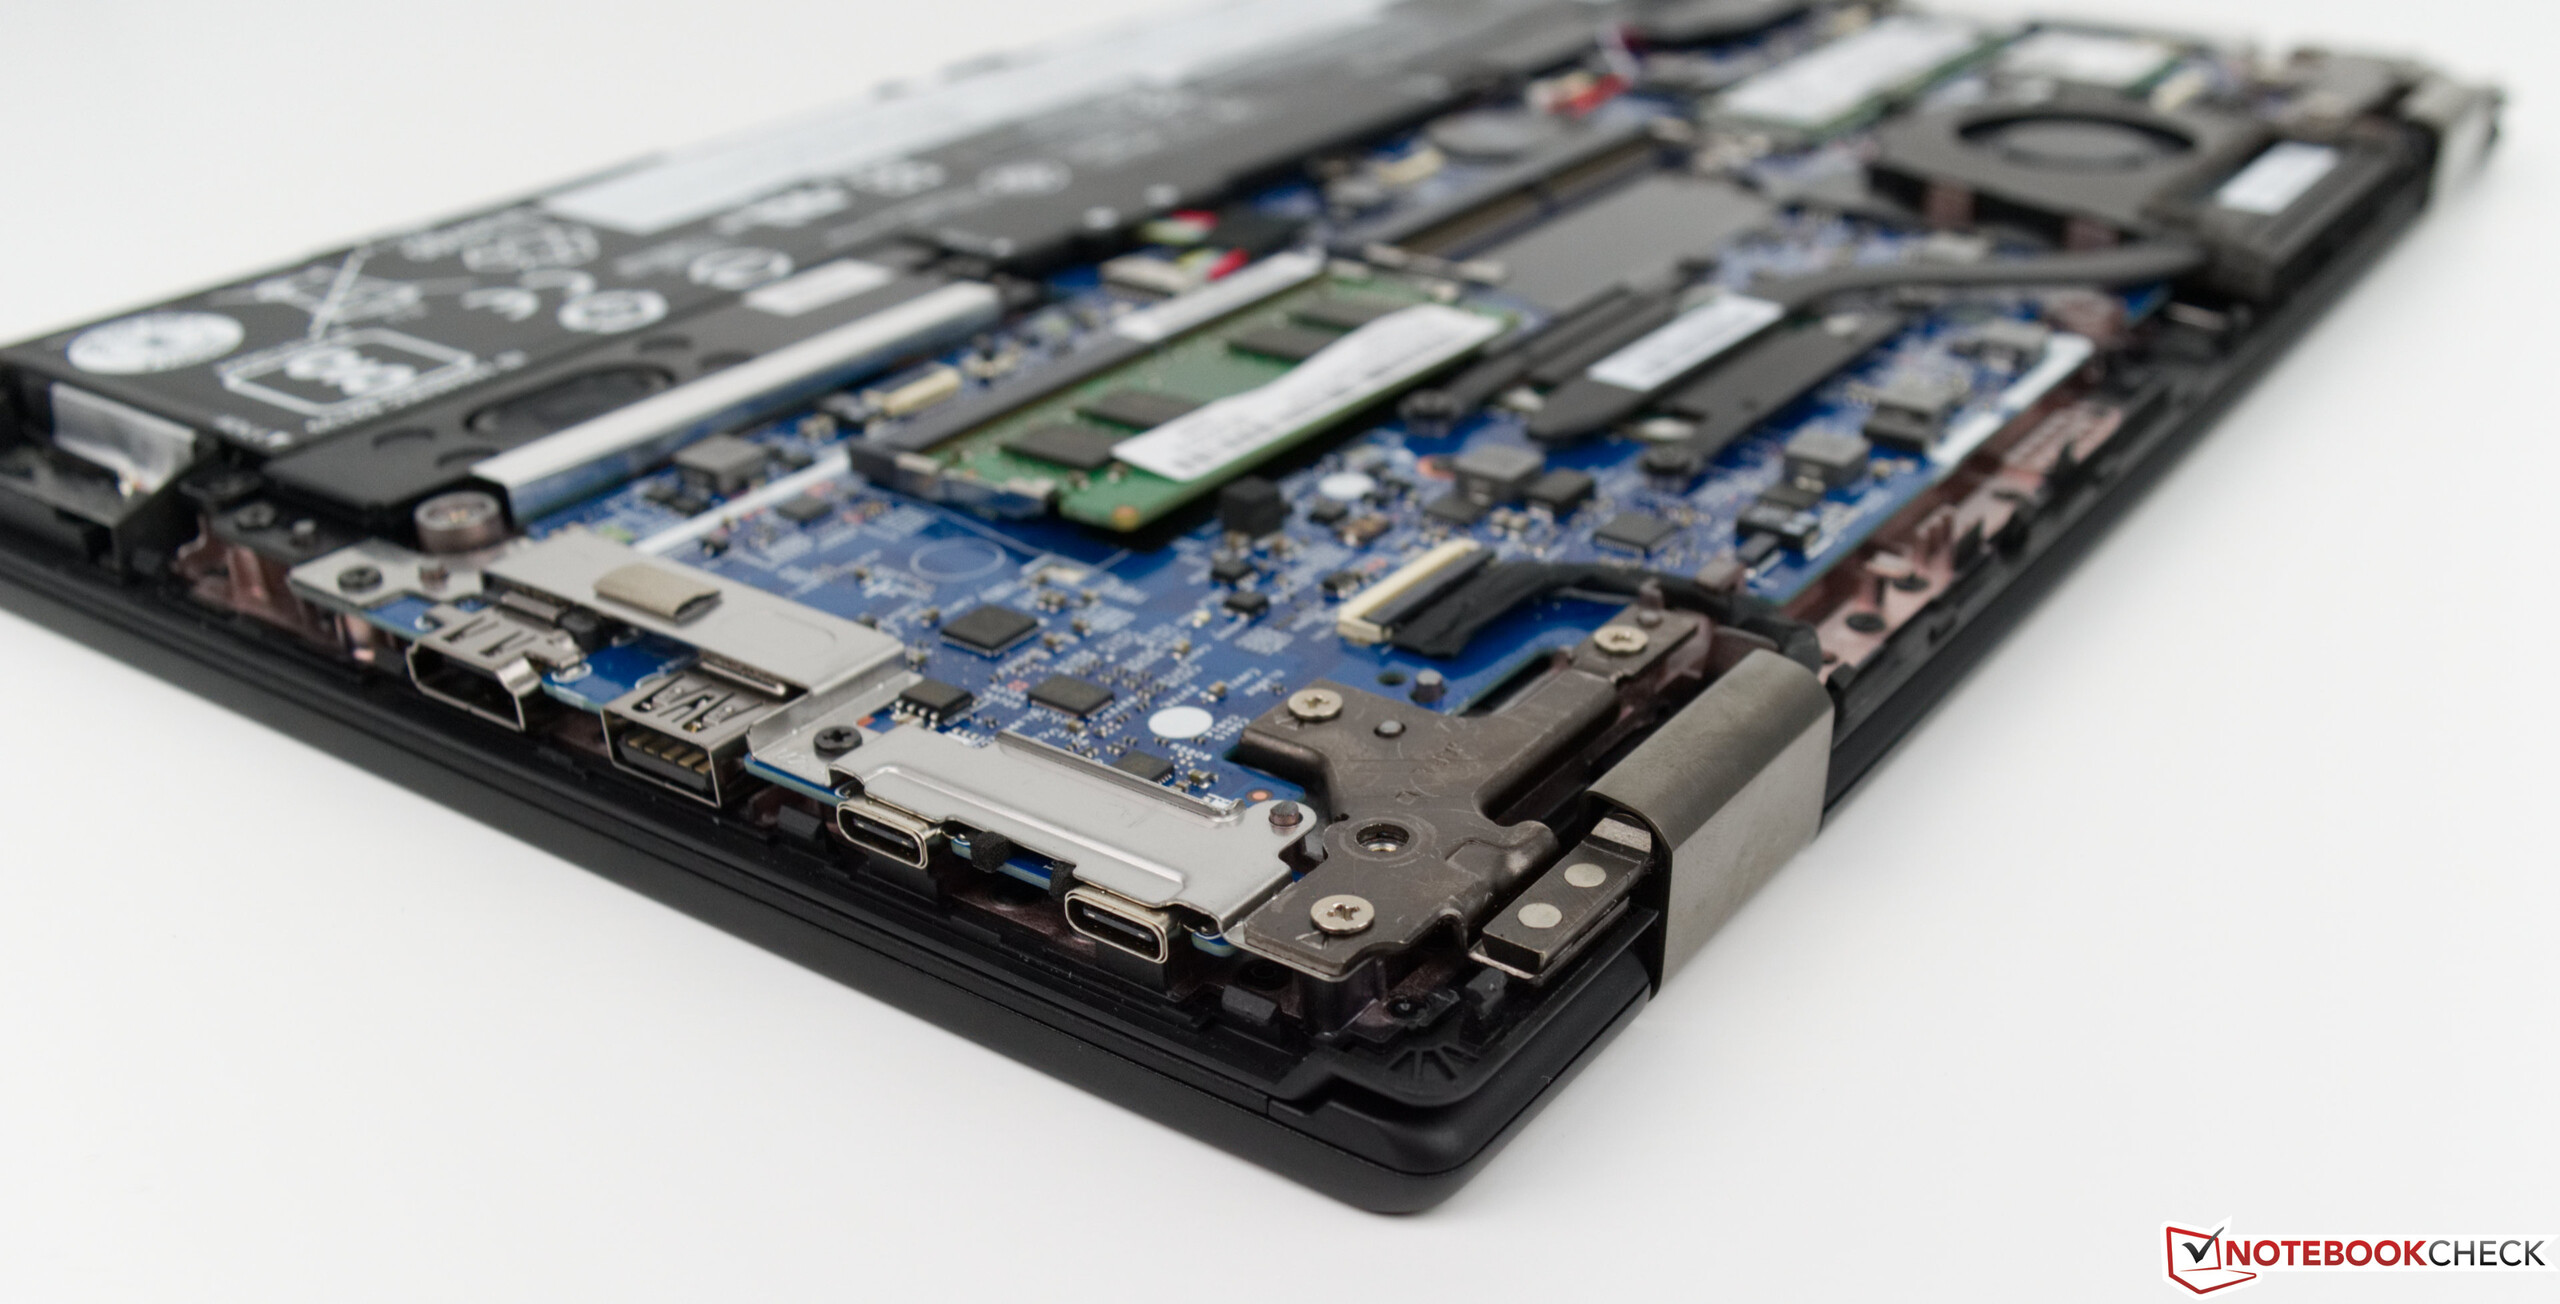
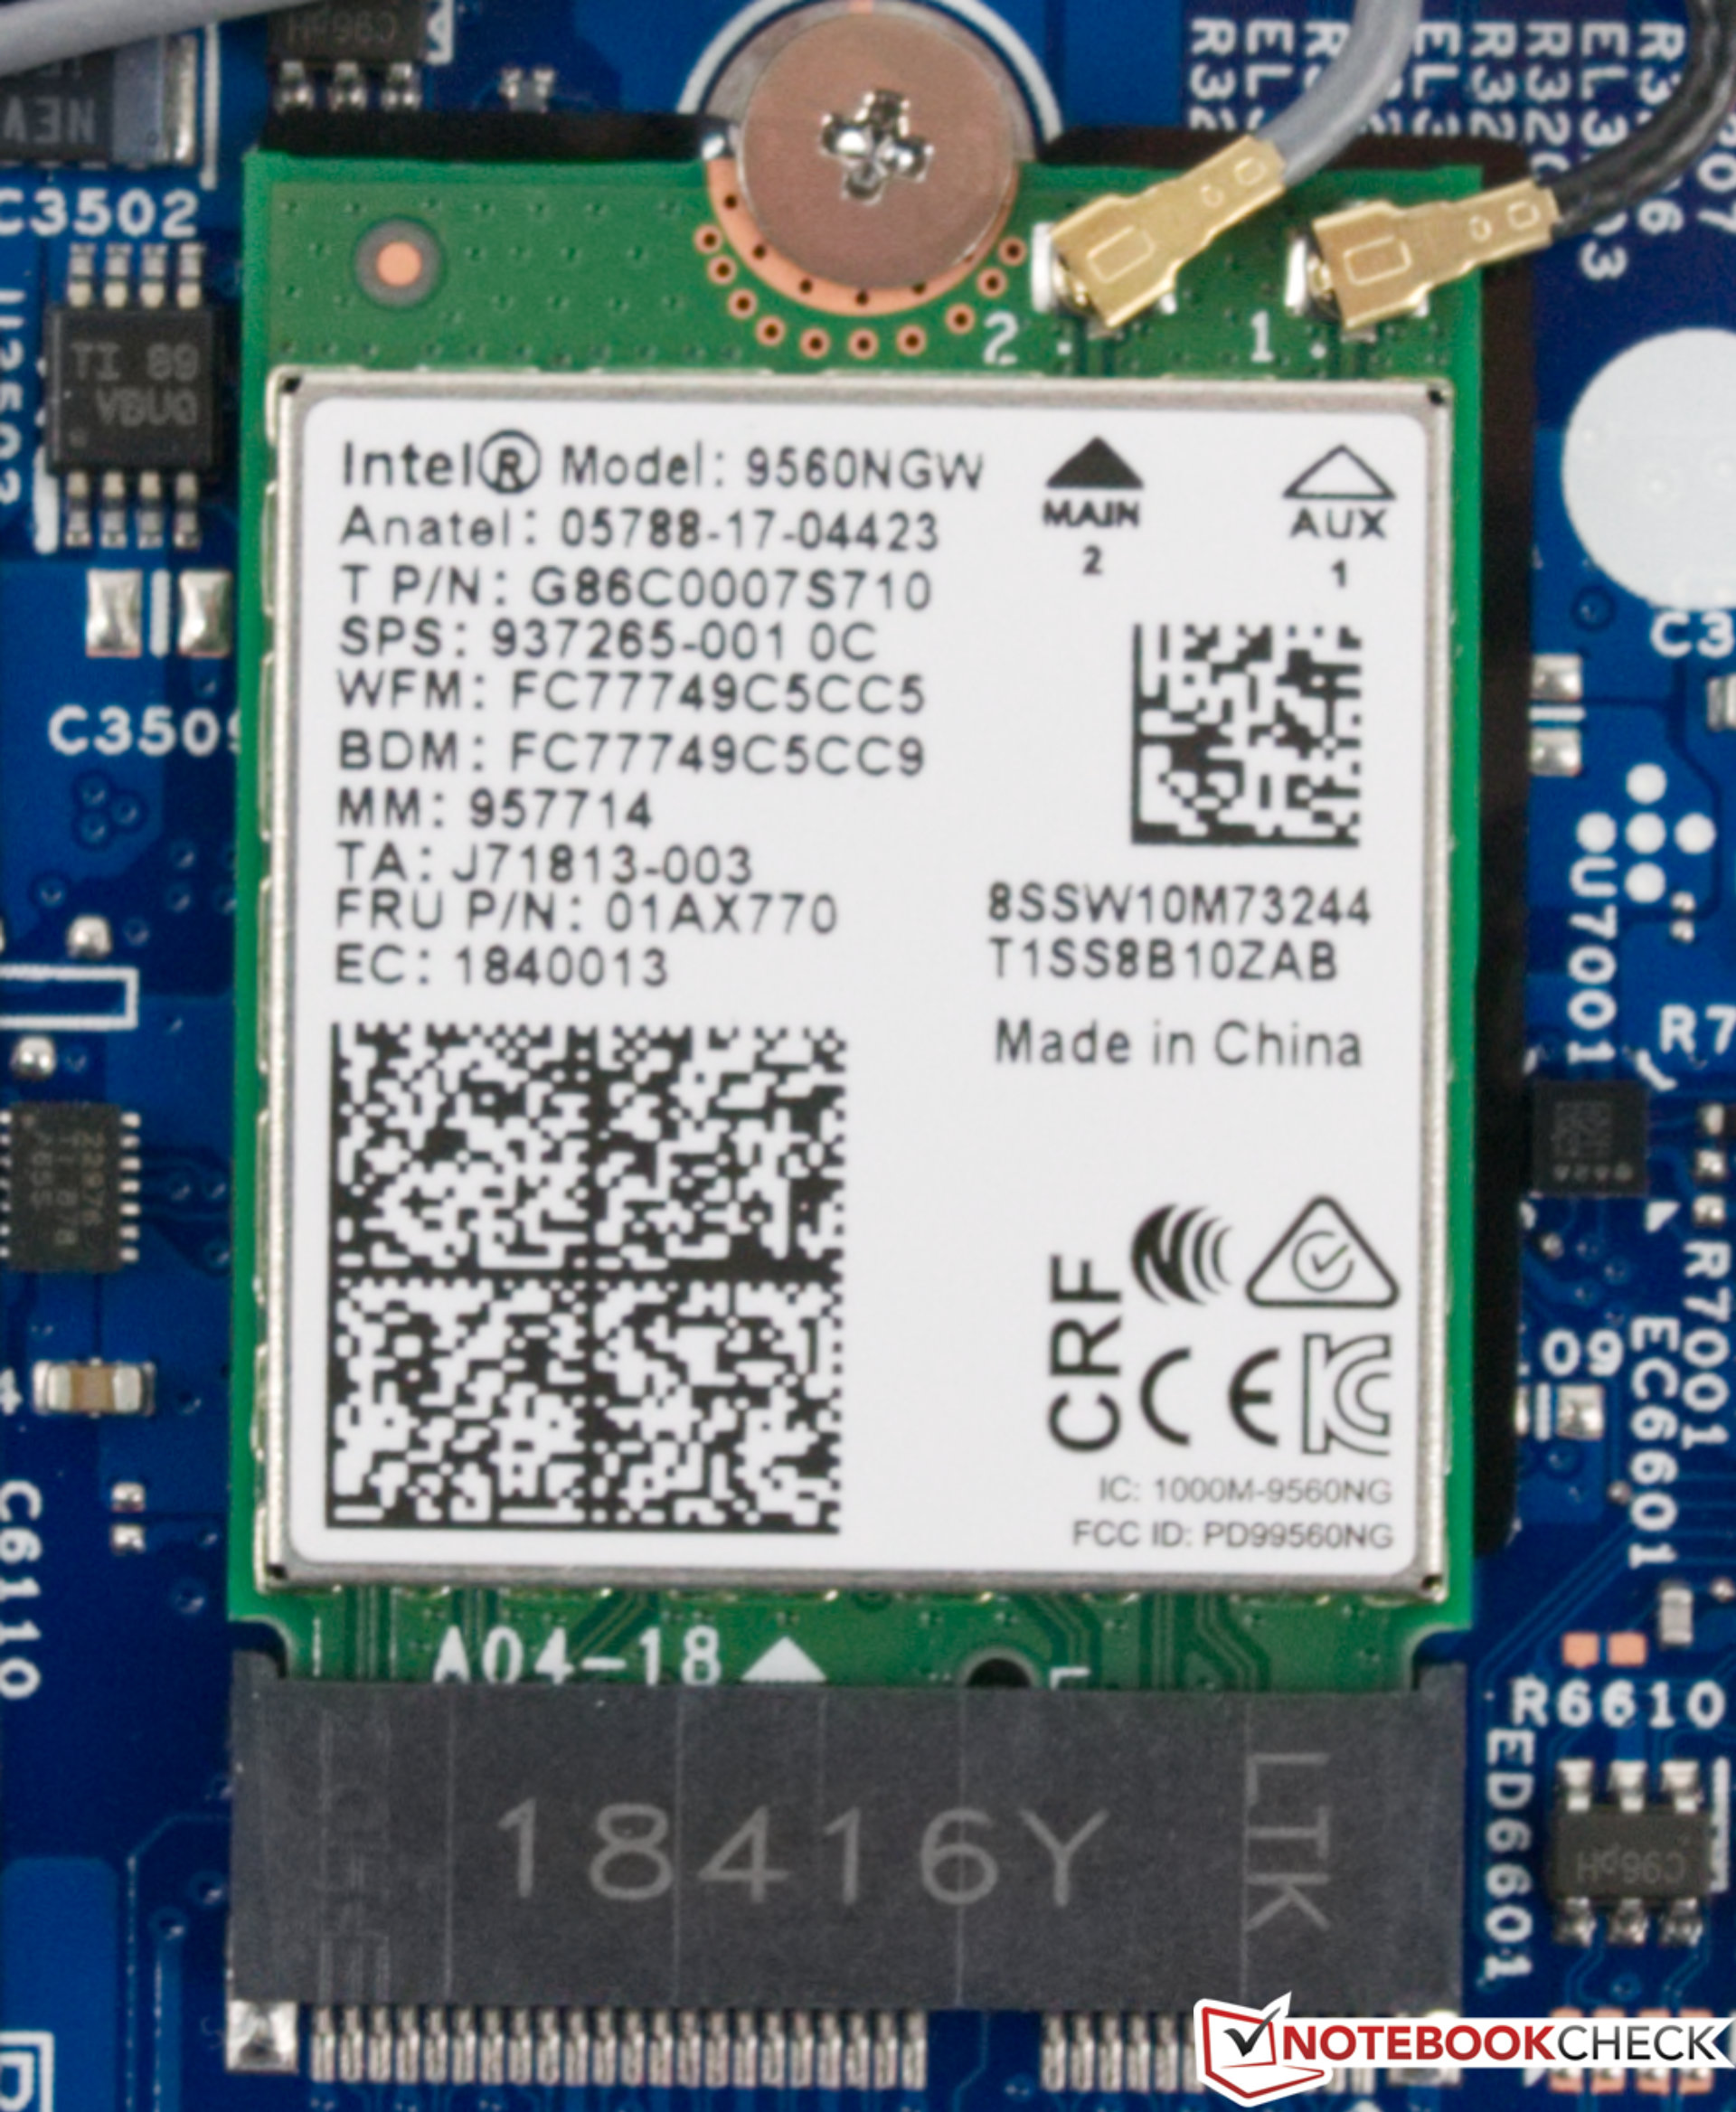
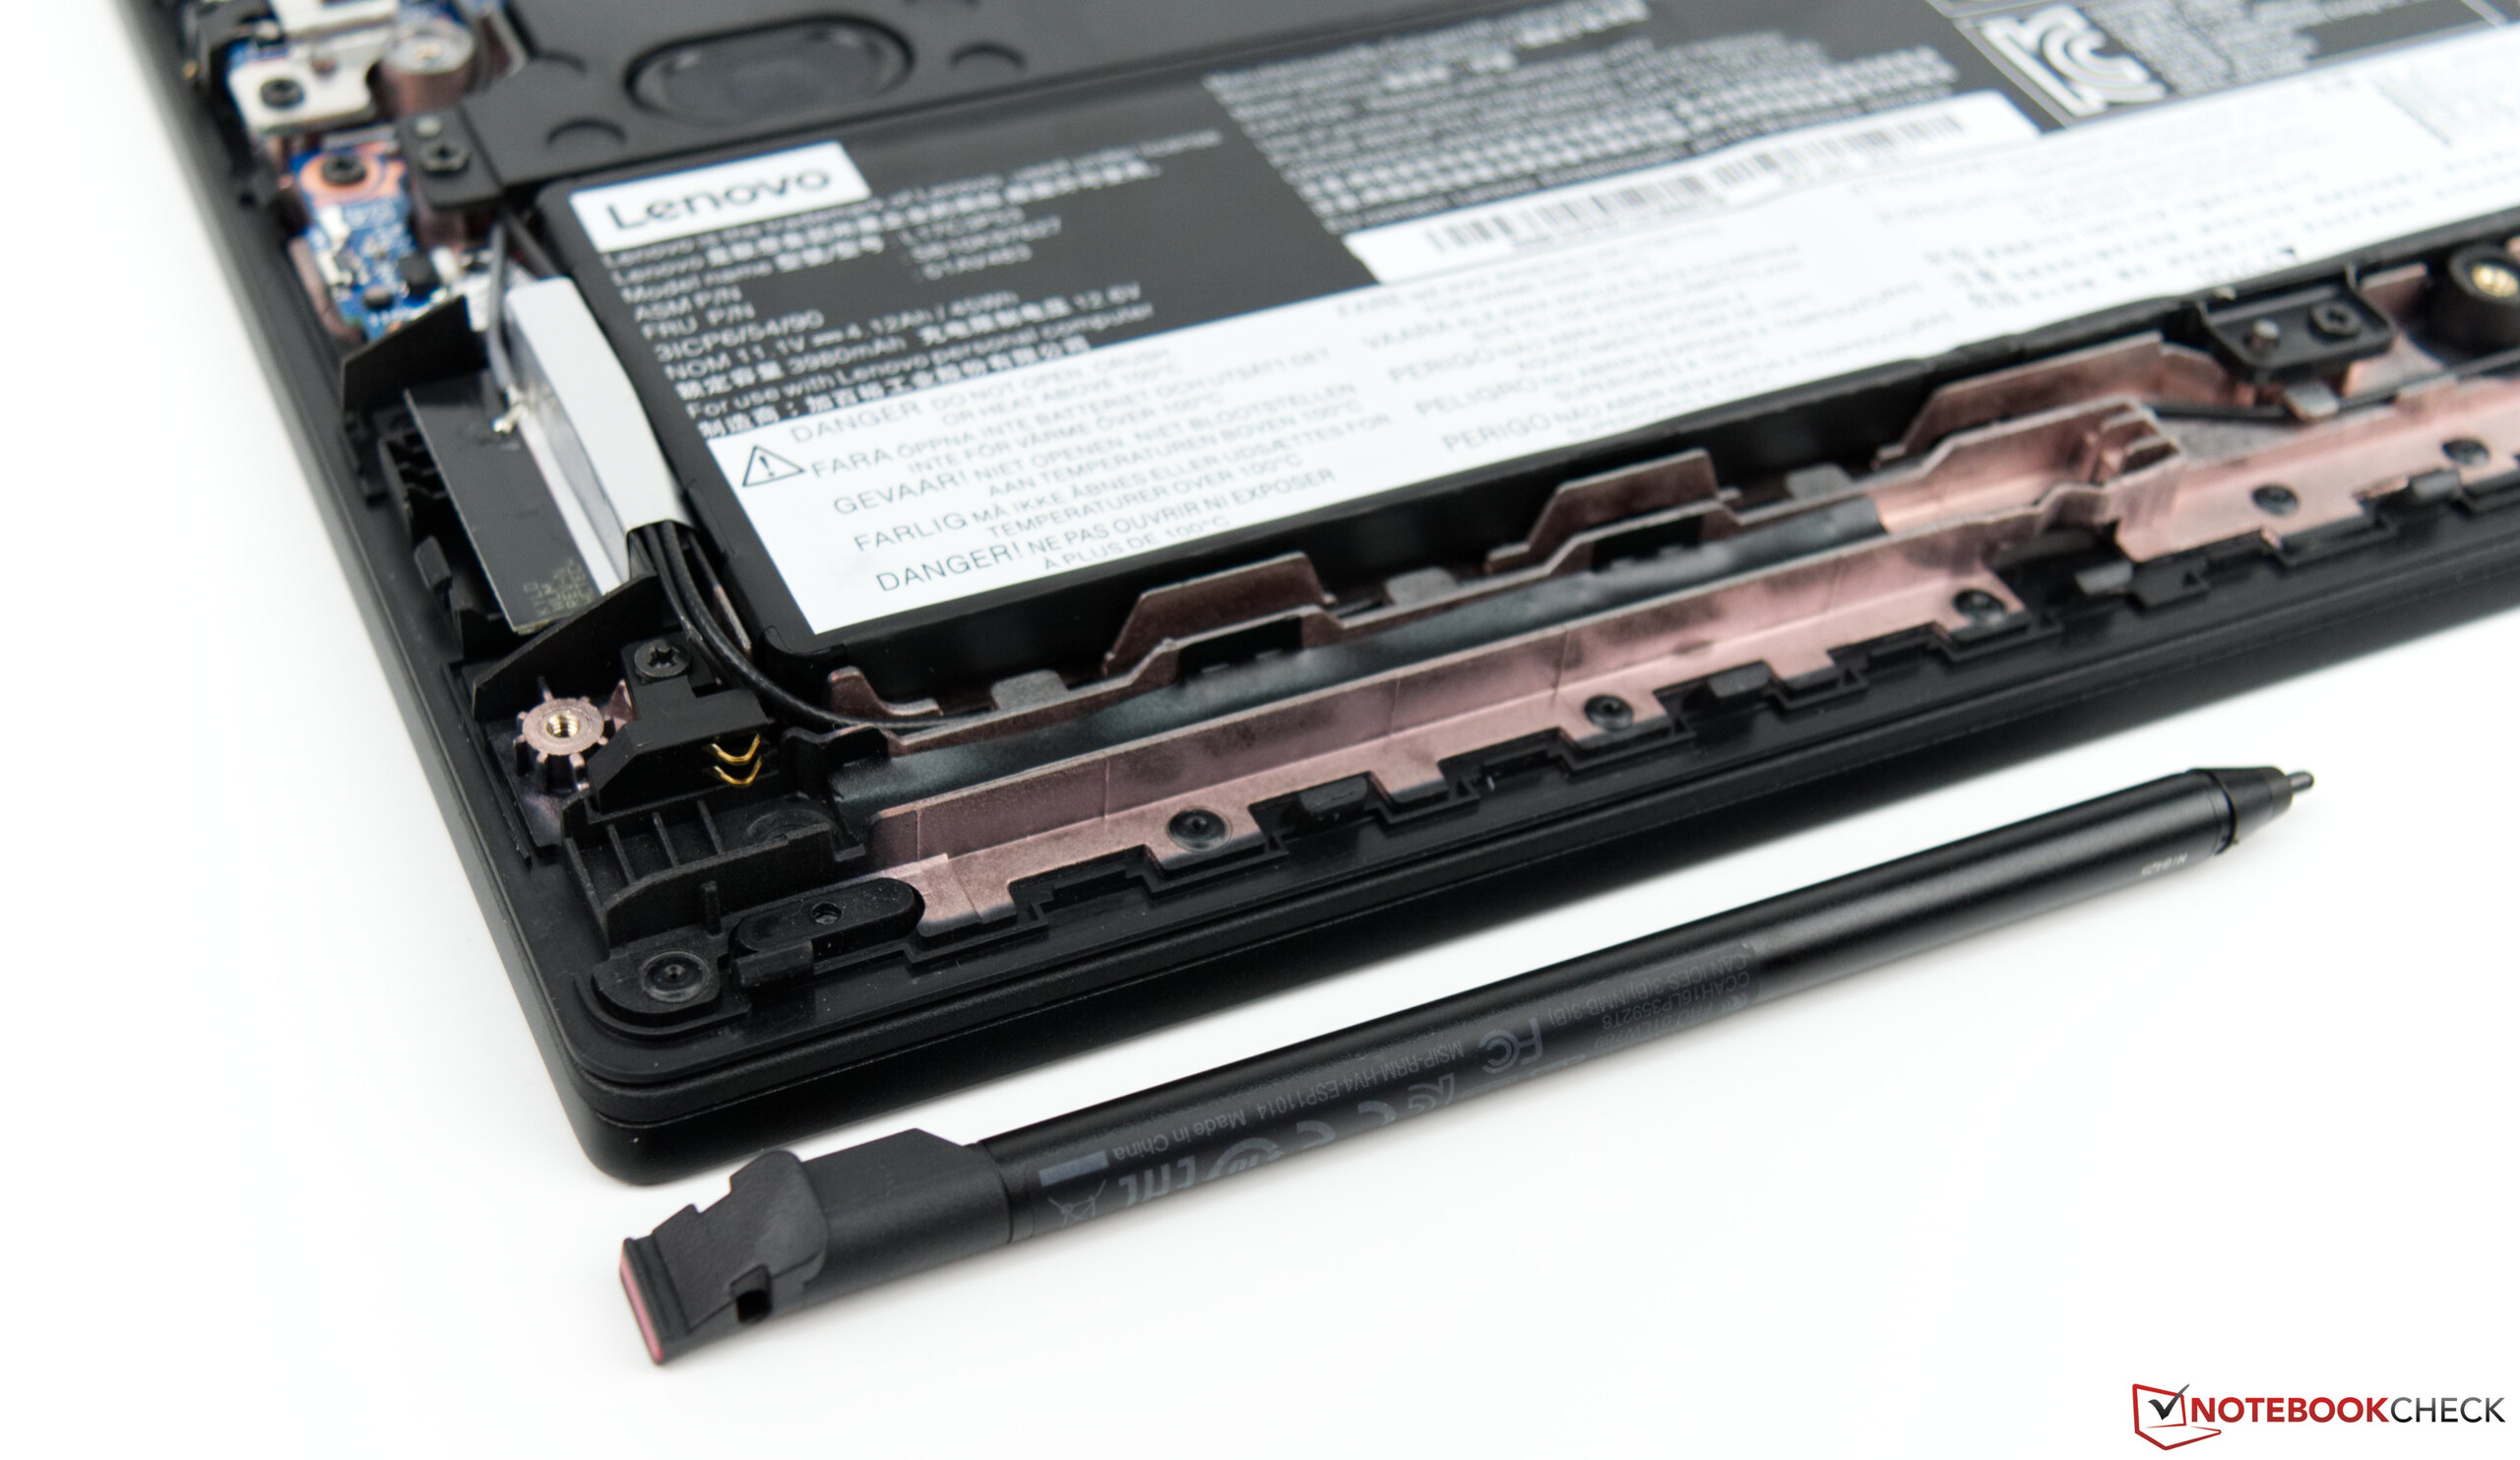
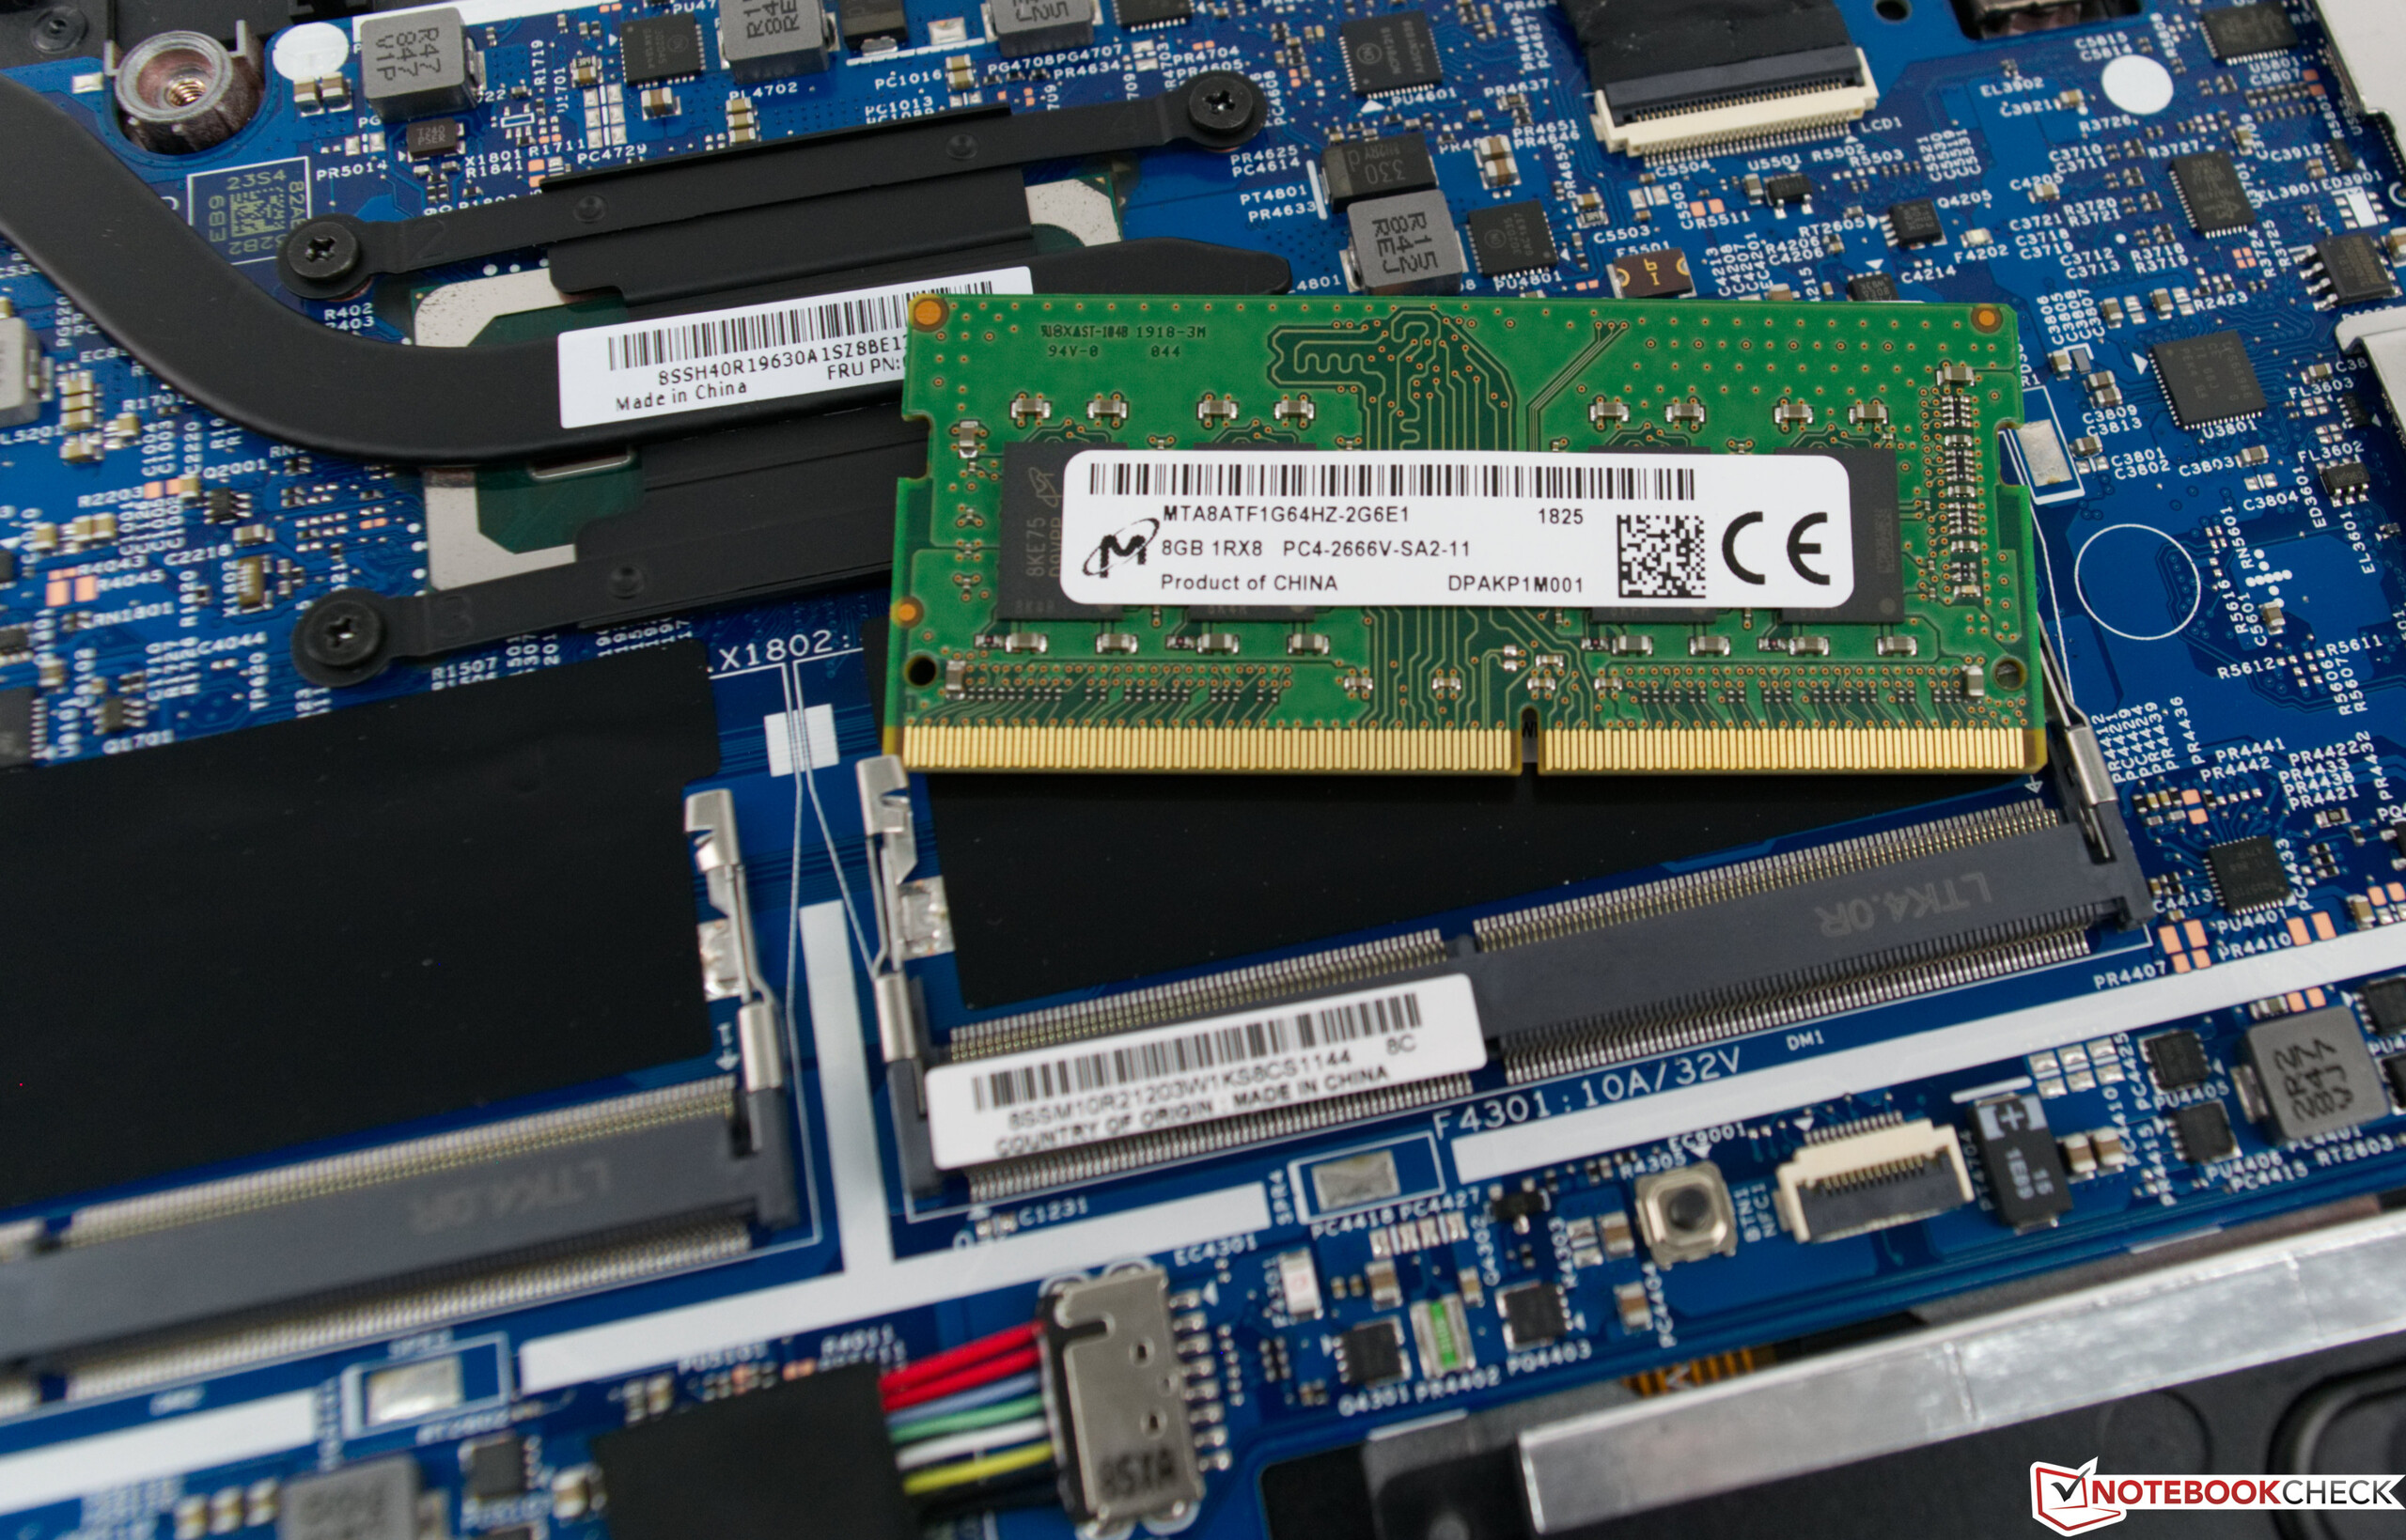
Também gostamos da inclusão de um SSD rápido, enquanto a Lenovo equipou o conversível com um módulo Intel Wi-Fi mais novo e mais veloz do que o do seu antecessor. O ThinkPad econômico continua fácil de manter e reparar também, o que é um bônus.
A tela mais uma vez nos deixa com sentimentos encontrados. Tem ângulos de visão estáveis, é legível em exteriores, apesar de seu acabamento refletivo, mas é muito escura e com cores imprecisas para o nosso gosto. No geral, o L390 Yoga é um conversível comercial impressionante que oferece uma experiência ThinkPad com um orçamento mais apertado.
Lenovo ThinkPad L390 Yoga-20NT000XGE
- 02/13/2019 v6 (old)
Sebastian Bade
Price comparison
