Breve Análise do Conversível Ematic EWT117 (Atom x5-Z8350)
| SD Card Reader | |
| average JPG Copy Test (av. of 3 runs) | |
| Lenovo Ideapad 120s-11IAP (Toshiba Exceria Pro M401) | |
| Lenovo Yoga 330-11IGM (Toshiba Exceria Pro SDXC 64 GB UHS-II) | |
| Lenovo IdeaPad 330-15ARR-81D2005JGE (Toshiba Exceria Pro SDXC 64 GB UHS-II) | |
| Asus Zenbook UX360CA-FC060T (Toshiba Exceria Pro SDXC 64 GB UHS-II) | |
| Ematic EWT117 (Toshiba Exceria Pro M401) | |
| maximum AS SSD Seq Read Test (1GB) | |
| Lenovo Ideapad 120s-11IAP (Toshiba Exceria Pro M401) | |
| Lenovo Yoga 330-11IGM (Toshiba Exceria Pro SDXC 64 GB UHS-II) | |
| Asus Zenbook UX360CA-FC060T (Toshiba Exceria Pro SDXC 64 GB UHS-II) | |
| Trekstor Yourbook C11B (Toshiba Exceria Pro M501 microSDXC 64GB) | |
| Ematic EWT117 (Toshiba Exceria Pro M401) | |
| Networking | |
| iperf3 transmit AX12 | |
| Trekstor Yourbook C11B | |
| Asus E203MA-FD825TS | |
| Lenovo Yoga 330-11IGM | |
| Ematic EWT117 | |
| iperf3 receive AX12 | |
| Trekstor Yourbook C11B | |
| Lenovo Yoga 330-11IGM | |
| Asus E203MA-FD825TS | |
| Ematic EWT117 | |
| |||||||||||||||||||||||||
iluminação: 88 %
iluminação com acumulador: 194.6 cd/m²
Contraste: 556:1 (Preto: 0.35 cd/m²)
ΔE ColorChecker Calman: 8 | ∀{0.5-29.43 Ø4.71}
calibrated: 2.11
ΔE Greyscale Calman: 9 | ∀{0.09-98 Ø4.96}
94.8% sRGB (Argyll 1.6.3 3D)
60.9% AdobeRGB 1998 (Argyll 1.6.3 3D)
66.2% AdobeRGB 1998 (Argyll 3D)
95.1% sRGB (Argyll 3D)
64.8% Display P3 (Argyll 3D)
Gamma: 2.12
CCT: 9539 K
| Ematic EWT117 LC116LF3L01, IPS, 11.6", 1920x1080 | Asus E203MA-FD825TS AUO225C, TN LED, 11.6", 1366x768 | Trekstor Yourbook C11B LC116LF1L01, IPS, 11.6", 1920x1080 | Lenovo Yoga 330-11IGM BOE CQ NT116WHM-N42, TN LED, 11.6", 1366x768 | Lenovo Ideapad 120s-11IAP AU Optronics AUO-B116XTN02.5 , TN LED, 11.6", 1366x768 | Dell Latitude 3189 AU Optronics AUO235C B116XAT, IPS, 11.6", 1366x768 | |
|---|---|---|---|---|---|---|
| Display | -44% | -2% | -37% | -39% | -30% | |
| Display P3 Coverage (%) | 64.8 | 35.75 -45% | 64.4 -1% | 40.42 -38% | 39.03 -40% | 44.96 -31% |
| sRGB Coverage (%) | 95.1 | 53.8 -43% | 92.5 -3% | 60.8 -36% | 58.7 -38% | 67.3 -29% |
| AdobeRGB 1998 Coverage (%) | 66.2 | 36.94 -44% | 65.7 -1% | 41.76 -37% | 40.33 -39% | 46.49 -30% |
| Response Times | 30% | -9% | 12% | -34% | -4% | |
| Response Time Grey 50% / Grey 80% * (ms) | 38.4 ? | 41 ? -7% | 42 ? -9% | 50 ? -30% | 72.8 ? -90% | 40 ? -4% |
| Response Time Black / White * (ms) | 29.6 ? | 10 ? 66% | 32 ? -8% | 14 ? 53% | 22.8 ? 23% | 30.4 ? -3% |
| PWM Frequency (Hz) | 500 ? | 200 ? | 200 ? | |||
| Screen | -25% | 21% | -28% | -32% | 49% | |
| Brightness middle (cd/m²) | 194.6 | 235 21% | 304 56% | 224 15% | 266.2 37% | 291 50% |
| Brightness (cd/m²) | 193 | 227 18% | 267 38% | 213 10% | 251 30% | 284 47% |
| Brightness Distribution (%) | 88 | 93 6% | 77 -12% | 80 -9% | 90 2% | 92 5% |
| Black Level * (cd/m²) | 0.35 | 0.44 -26% | 0.28 20% | 0.52 -49% | 0.67 -91% | 0.16 54% |
| Contrast (:1) | 556 | 534 -4% | 1086 95% | 431 -22% | 397 -29% | 1819 227% |
| Colorchecker dE 2000 * | 8 | 11.73 -47% | 7.28 9% | 11.64 -46% | 12.4 -55% | 3.4 57% |
| Colorchecker dE 2000 max. * | 13.71 | 18.8 -37% | 12.65 8% | 20.8 -52% | 24.5 -79% | 9.6 30% |
| Colorchecker dE 2000 calibrated * | 2.11 | 3.73 -77% | 1.89 10% | |||
| Greyscale dE 2000 * | 9 | 12.64 -40% | 8.34 7% | 13.4 -49% | 14.4 -60% | 1.8 80% |
| Gamma | 2.12 104% | 2.61 84% | 2.33 94% | 2.57 86% | 2.16 102% | 2.14 103% |
| CCT | 9539 68% | 14819 44% | 9038 72% | 15186 43% | 19436 33% | 6544 99% |
| Color Space (Percent of AdobeRGB 1998) (%) | 60.9 | 34 -44% | 60 -1% | 38 -38% | 37 -39% | 42.8 -30% |
| Color Space (Percent of sRGB) (%) | 94.8 | 54 -43% | 92 -3% | 61 -36% | 59 -38% | 67 -29% |
| Média Total (Programa/Configurações) | -13% /
-22% | 3% /
13% | -18% /
-24% | -35% /
-34% | 5% /
26% |
* ... menor é melhor
Exibir tempos de resposta
| ↔ Tempo de resposta preto para branco | ||
|---|---|---|
| 29.6 ms ... ascensão ↗ e queda ↘ combinadas | ↗ 18.4 ms ascensão | 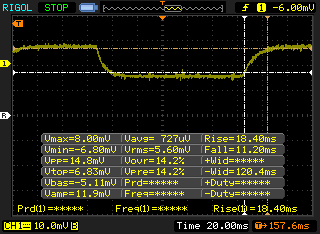 |
| ↘ 11.2 ms queda | ||
| A tela mostra taxas de resposta relativamente lentas em nossos testes e pode ser muito lenta para os jogadores. Em comparação, todos os dispositivos testados variam de 0.1 (mínimo) a 240 (máximo) ms. » 79 % de todos os dispositivos são melhores. Isso significa que o tempo de resposta medido é pior que a média de todos os dispositivos testados (19.8 ms). | ||
| ↔ Tempo de resposta 50% cinza a 80% cinza | ||
| 38.4 ms ... ascensão ↗ e queda ↘ combinadas | ↗ 19.6 ms ascensão | 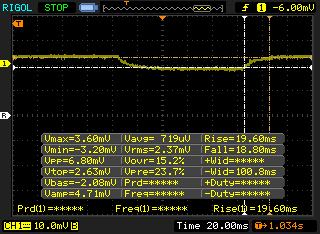 |
| ↘ 18.8 ms queda | ||
| A tela mostra taxas de resposta lentas em nossos testes e será insatisfatória para os jogadores. Em comparação, todos os dispositivos testados variam de 0.165 (mínimo) a 636 (máximo) ms. » 58 % de todos os dispositivos são melhores. Isso significa que o tempo de resposta medido é pior que a média de todos os dispositivos testados (30.9 ms). | ||
Cintilação da tela / PWM (modulação por largura de pulso)
| Tela tremeluzindo/PWM detectado | 500 Hz | ≤ 25 % configuração de brilho | 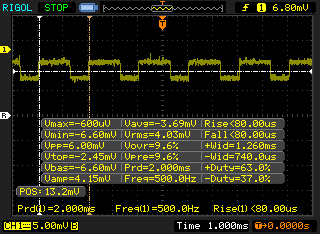 |
A luz de fundo da tela pisca em 500 Hz (pior caso, por exemplo, utilizando PWM) Cintilação detectada em uma configuração de brilho de 25 % e abaixo. Não deve haver cintilação ou PWM acima desta configuração de brilho. A frequência de 500 Hz é relativamente alta, portanto, a maioria dos usuários sensíveis ao PWM não deve notar nenhuma oscilação. No entanto, há relatos de que alguns usuários ainda são sensíveis ao PWM em 500 Hz e acima, portanto, esteja atento. [pwm_comparison] Em comparação: 52 % de todos os dispositivos testados não usam PWM para escurecer a tela. Se PWM foi detectado, uma média de 7741 (mínimo: 5 - máximo: 343500) Hz foi medida. | |||
| Cinebench R15 | |
| CPU Single 64Bit | |
| Lenovo IdeaPad 330-15ARR-81D2005JGE | |
| Dell Latitude 13 7370 | |
| Apple MacBook 12 (Early 2015) 1.1 GHz | |
| Asus Zenbook UX360CA-FC060T | |
| Lenovo Yoga 330-11IGM | |
| Dell Latitude 3189 | |
| Lenovo Ideapad 120s-11IAP | |
| Dell Venue 8 Pro 5855 | |
| Média Intel Atom x5-Z8350 (25 - 31, n=9) | |
| Ematic EWT117 | |
| CPU Multi 64Bit | |
| Lenovo IdeaPad 330-15ARR-81D2005JGE | |
| Lenovo Yoga 330-11IGM | |
| Apple MacBook 12 (Early 2015) 1.1 GHz | |
| Asus Zenbook UX360CA-FC060T | |
| Dell Latitude 13 7370 | |
| Dell Latitude 3189 | |
| Média Intel Atom x5-Z8350 (88 - 101, n=10) | |
| Ematic EWT117 | |
| Lenovo Ideapad 120s-11IAP | |
| Dell Venue 8 Pro 5855 | |
| PCMark 10 | |
| Score | |
| Lenovo Yoga 330-11IGM | |
| Asus E203MA-FD825TS | |
| Trekstor Yourbook C11B | |
| Lenovo Ideapad 120s-11IAP | |
| Ematic EWT117 | |
| Essentials | |
| Asus E203MA-FD825TS | |
| Lenovo Yoga 330-11IGM | |
| Trekstor Yourbook C11B | |
| Lenovo Ideapad 120s-11IAP | |
| Ematic EWT117 | |
| Productivity | |
| Asus E203MA-FD825TS | |
| Lenovo Yoga 330-11IGM | |
| Trekstor Yourbook C11B | |
| Lenovo Ideapad 120s-11IAP | |
| Ematic EWT117 | |
| Digital Content Creation | |
| Lenovo Yoga 330-11IGM | |
| Asus E203MA-FD825TS | |
| Lenovo Ideapad 120s-11IAP | |
| Trekstor Yourbook C11B | |
| Ematic EWT117 | |
| PCMark 8 | |
| Home Score Accelerated v2 | |
| Apple MacBook 12 (Early 2016) 1.1 GHz | |
| Lenovo Yoga 330-11IGM | |
| Dell Latitude 3189 | |
| Asus E203MA-FD825TS | |
| Lenovo Ideapad 120s-11IAP | |
| Trekstor Yourbook C11B | |
| Ematic EWT117 | |
| Work Score Accelerated v2 | |
| Apple MacBook 12 (Early 2016) 1.1 GHz | |
| Lenovo Yoga 330-11IGM | |
| Dell Latitude 3189 | |
| Lenovo Ideapad 120s-11IAP | |
| Trekstor Yourbook C11B | |
| PCMark 8 Home Score Accelerated v2 | 1191 pontos | |
| PCMark 10 Score | 743 pontos | |
Ajuda | ||
| Ematic EWT117 32 GB eMMC Flash | Asus E203MA-FD825TS SanDisk DA4064 | Trekstor Yourbook C11B 64 GB eMMC Flash | Lenovo Yoga 330-11IGM 128 GB eMMC Flash | Lenovo Ideapad 120s-11IAP 64 GB eMMC Flash | |
|---|---|---|---|---|---|
| CrystalDiskMark 5.2 / 6 | 274% | 105% | 131% | 87% | |
| Write 4K (MB/s) | 8.216 | 38.28 366% | 9.498 16% | 14.55 77% | 12.19 48% |
| Read 4K (MB/s) | 12.86 | 12.14 -6% | 4.941 -62% | 13.4 4% | 6.61 -49% |
| Write Seq (MB/s) | 48.87 | 220.2 351% | 114.3 134% | 110.1 125% | 108.2 121% |
| Read Seq (MB/s) | 141.6 | 262 85% | 262.8 86% | 294.9 108% | 167.1 18% |
| Write 4K Q32T1 (MB/s) | 16.47 | 45.72 178% | 15.3 -7% | 14.17 -14% | 15.38 -7% |
| Read 4K Q32T1 (MB/s) | 17.83 | 61 242% | 31.59 77% | 36.92 107% | 31.28 75% |
| Write Seq Q32T1 (MB/s) | 16.72 | 167.1 899% | 111.8 569% | 106.4 536% | 96.2 475% |
| Read Seq Q32T1 (MB/s) | 117.7 | 211.5 80% | 151.5 29% | 238.2 102% | 134.1 14% |

| 3DMark | |
| 1280x720 Cloud Gate Standard Graphics | |
| Apple MacBook 12 (Early 2016) 1.1 GHz | |
| Asus Zenbook UX360CA-FC060T | |
| Dell Latitude 3189 | |
| Dell Latitude 13 7370 | |
| Lenovo Yoga 330-11IGM | |
| Lenovo Ideapad 120s-11IAP | |
| Média Intel HD Graphics (Cherry Trail) (1537 - 2272, n=8) | |
| Dell Venue 8 Pro 5855 | |
| 1920x1080 Fire Strike Graphics | |
| Apple MacBook 12 (Early 2016) 1.1 GHz | |
| Dell Latitude 3189 | |
| Dell Latitude 13 7370 | |
| Lenovo Yoga 330-11IGM | |
| Lenovo Ideapad 120s-11IAP | |
| Média Intel HD Graphics (Cherry Trail) (193 - 281, n=3) | |
| 1920x1080 Ice Storm Extreme Graphics | |
| Dell Latitude 13 7370 | |
| Dell Latitude 3189 | |
| 2560x1440 Time Spy Graphics | |
| Dell Latitude 3189 | |
| 3DMark 11 Performance | 320 pontos | |
Ajuda | ||
(±) A temperatura máxima no lado superior é 42 °C / 108 F, em comparação com a média de 35.9 °C / 97 F , variando de 21.4 a 59 °C para a classe Subnotebook.
(±) A parte inferior aquece até um máximo de 42.8 °C / 109 F, em comparação com a média de 39.2 °C / 103 F
(+) Em uso inativo, a temperatura média para o lado superior é 25.9 °C / 79 F, em comparação com a média do dispositivo de 30.8 °C / ### class_avg_f### F.
(+) Os apoios para as mãos e o touchpad são mais frios que a temperatura da pele, com um máximo de 26.2 °C / 79.2 F e, portanto, são frios ao toque.
(±) A temperatura média da área do apoio para as mãos de dispositivos semelhantes foi 28.2 °C / 82.8 F (+2 °C / 3.6 F).
Ematic EWT117 análise de áudio
(±) | o volume do alto-falante é médio, mas bom (###valor### dB)
Graves 100 - 315Hz
(-) | quase nenhum baixo - em média 20.6% menor que a mediana
(+) | o baixo é linear (2.4% delta para a frequência anterior)
Médios 400 - 2.000 Hz
(±) | médios reduzidos - em média 7.1% menor que a mediana
(±) | a linearidade dos médios é média (10% delta para frequência anterior)
Altos 2 - 16 kHz
(±) | máximos mais altos - em média 6.4% maior que a mediana
(±) | a linearidade dos máximos é média (10.4% delta para frequência anterior)
Geral 100 - 16.000 Hz
(±) | a linearidade do som geral é média (28.1% diferença em relação à mediana)
Comparado com a mesma classe
» 89% de todos os dispositivos testados nesta classe foram melhores, 3% semelhantes, 8% piores
» O melhor teve um delta de 5%, a média foi 18%, o pior foi 53%
Comparado com todos os dispositivos testados
» 85% de todos os dispositivos testados foram melhores, 3% semelhantes, 12% piores
» O melhor teve um delta de 4%, a média foi 23%, o pior foi 134%
Apple MacBook 12 (Early 2016) 1.1 GHz análise de áudio
(+) | os alto-falantes podem tocar relativamente alto (###valor### dB)
Graves 100 - 315Hz
(±) | graves reduzidos - em média 11.3% menor que a mediana
(±) | a linearidade dos graves é média (14.2% delta para a frequência anterior)
Médios 400 - 2.000 Hz
(+) | médios equilibrados - apenas 2.4% longe da mediana
(+) | médios são lineares (5.5% delta para frequência anterior)
Altos 2 - 16 kHz
(+) | agudos equilibrados - apenas 2% longe da mediana
(+) | os máximos são lineares (4.5% delta da frequência anterior)
Geral 100 - 16.000 Hz
(+) | o som geral é linear (10.2% diferença em relação à mediana)
Comparado com a mesma classe
» 7% de todos os dispositivos testados nesta classe foram melhores, 2% semelhantes, 90% piores
» O melhor teve um delta de 5%, a média foi 18%, o pior foi 53%
Comparado com todos os dispositivos testados
» 5% de todos os dispositivos testados foram melhores, 1% semelhantes, 94% piores
» O melhor teve um delta de 4%, a média foi 23%, o pior foi 134%
| desligado | |
| Ocioso | |
| Carga |
|
Key:
min: | |
| Ematic EWT117 Z8350, HD Graphics (Cherry Trail), 32 GB eMMC Flash, IPS, 1920x1080, 11.6" | Asus E203MA-FD825TS Pentium N5000, UHD Graphics 605, SanDisk DA4064, TN LED, 1366x768, 11.6" | Trekstor Yourbook C11B Celeron N3350, HD Graphics 500, 64 GB eMMC Flash, IPS, 1920x1080, 11.6" | Lenovo Yoga 330-11IGM Pentium N5000, UHD Graphics 605, 128 GB eMMC Flash, TN LED, 1366x768, 11.6" | Lenovo Ideapad 120s-11IAP Celeron N3350, HD Graphics 500, 64 GB eMMC Flash, TN LED, 1366x768, 11.6" | Apple MacBook 12 (Early 2016) 1.1 GHz 6Y30, HD Graphics 515, Apple SSD AP0256, IPS, 2304x1440, 12" | |
|---|---|---|---|---|---|---|
| Power Consumption | 10% | -18% | -8% | 15% | -22% | |
| Idle Minimum * (Watt) | 4.2 | 1.9 55% | 3.2 24% | 2.3 45% | 2.8 33% | 2.7 36% |
| Idle Average * (Watt) | 7 | 3.5 50% | 6.1 13% | 4.2 40% | 4.2 40% | 2.7 61% |
| Idle Maximum * (Watt) | 8.5 | 3.9 54% | 7 18% | 5.4 36% | 5.1 40% | 7.2 15% |
| Load Average * (Watt) | 9.4 | 12.7 -35% | 15.4 -64% | 11.8 -26% | 22 -134% | |
| Load Maximum * (Watt) | 11 | 19 -73% | 24.7 -125% | 21.4 -95% | 12.1 -10% | 20.5 -86% |
* ... menor é melhor
| Ematic EWT117 Z8350, HD Graphics (Cherry Trail), 30.4 Wh | Asus E203MA-FD825TS Pentium N5000, UHD Graphics 605, 38 Wh | Trekstor Yourbook C11B Celeron N3350, HD Graphics 500, 36.48 Wh | Lenovo Yoga 330-11IGM Pentium N5000, UHD Graphics 605, 36 Wh | Lenovo Ideapad 120s-11IAP Celeron N3350, HD Graphics 500, 32 Wh | Apple MacBook 12 (Early 2016) 1.1 GHz 6Y30, HD Graphics 515, 41.4 Wh | |
|---|---|---|---|---|---|---|
| Duração da bateria | 108% | 110% | 135% | 80% | 110% | |
| WiFi v1.3 (h) | 4 | 8.3 108% | 8.4 110% | 9.4 135% | 7.2 80% | 8.4 110% |
| Reader / Idle (h) | 15.3 | |||||
| Load (h) | 3.8 | 3.9 |
Pro
Contra
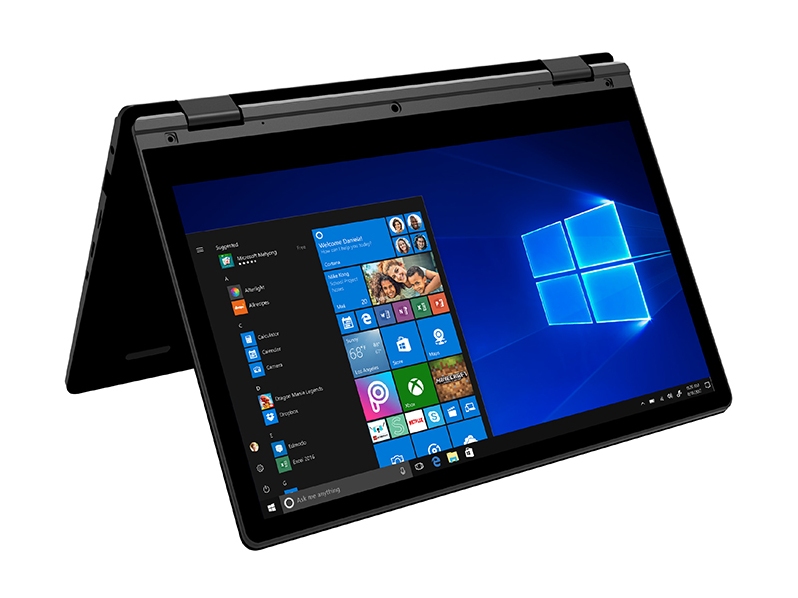
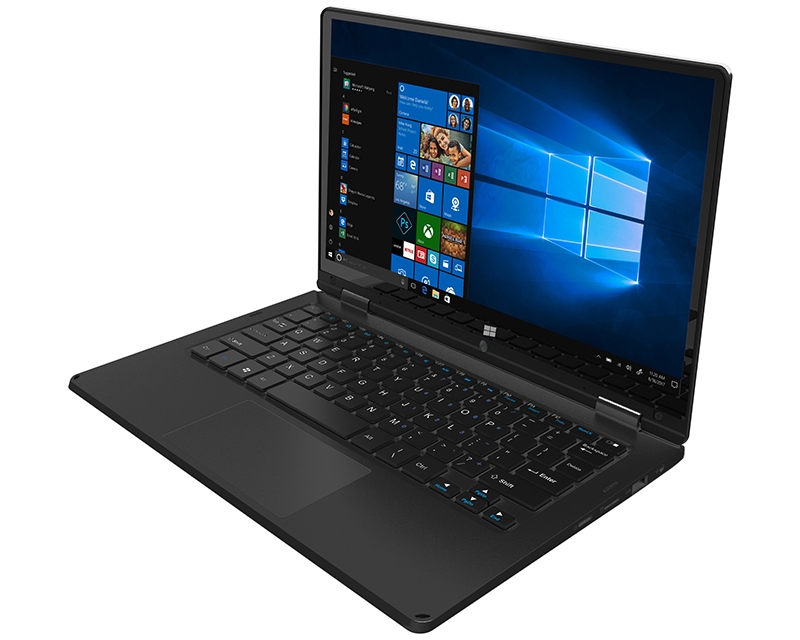
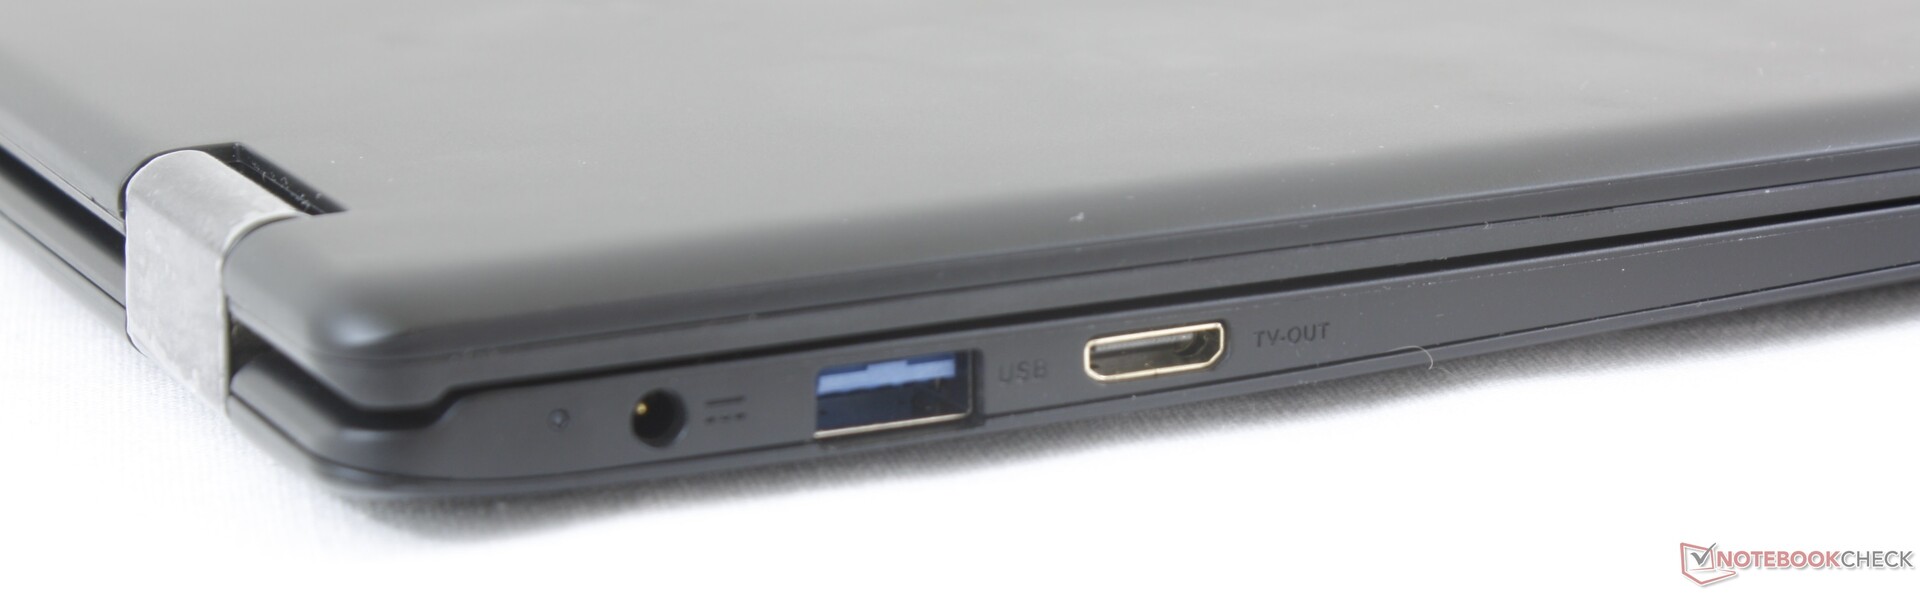
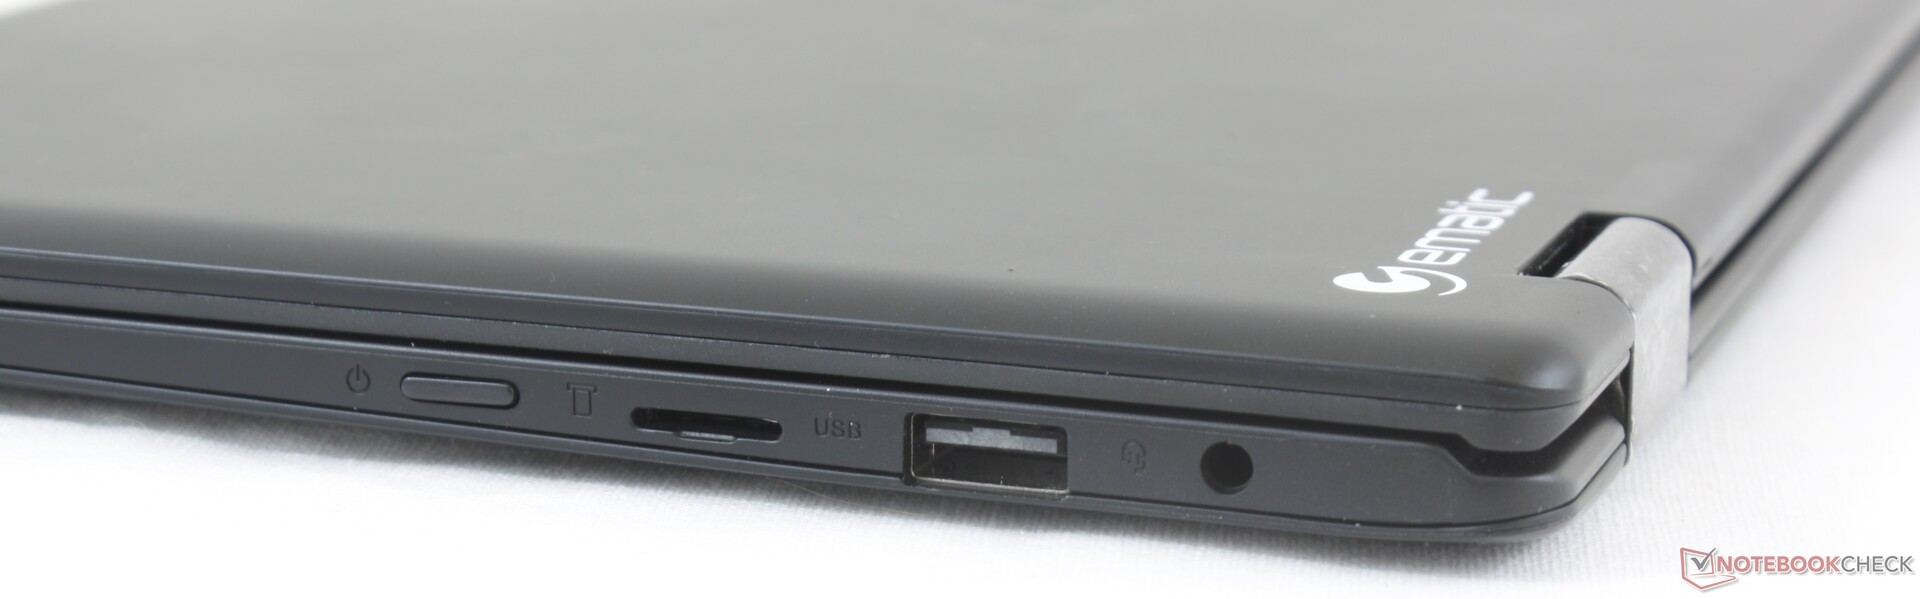
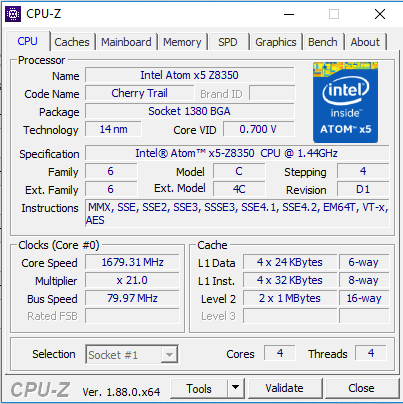
O EWT117 da Ematic é um exemplo clássico de prometer muito por pouco dinheiro. Um portátil conversível Windows 10 totalmente funcional com leitor MicroSD, porta HDMI e tela táctil IPS de 1080p por menos de $180 dólares ainda é bom demais para ser verdade, sem grandes inconvenientes. Nesse caso, o sistema é extraordinariamente lento devido à CPU Atom e ao desempenho muito ruim do SSD. Até mesmo ações simples como processamento de texto ou reprodução de vídeo - nas quais a Ematic deve se destacar - movem-se a passo de caracol.
Nossa unidade também apresentou alguns problemas de hardware. O trackpad frequentemente fazia com que o cursor do mouse pulasse inesperadamente e nosso cartão MicroSD às vezes ficava preso no mecanismo com mola do leitor MicroSD.
O melhor aspecto do Ematic é sua tela táctil IPS de 1080p, que abrange uma gama surpreendentemente ampla de cores (95% sRGB), considerando o preço. Infelizmente, isso significa pouco dado que o resto do sistema é inferior.
Nós não estamos pedindo muito de um netbook táctil de $ 200. No entanto, quando até mesmo um tablet Android de $200 de orçamento pode navegar, digitar e reproduzir vídeos mais rapidamente do que a Ematic, torna-se difícil recomendar o EWT117 para a maioria dos usuários domésticos.
Ematic EWT117
- 04/06/2019 v6 (old)
Allen Ngo
Price comparison
