Breve Análise do Conversível Dell Latitude 3189 (N4200, HD)


| SD Card Reader | |
| average JPG Copy Test (av. of 3 runs) | |
| HP Pavilion x360 13-u102ng | |
| Dell Latitude 3189 | |
| HP Pavilion 11-k103ng x360 | |
| Lenovo Yoga 700-11ISK | |
| maximum AS SSD Seq Read Test (1GB) | |
| HP Pavilion x360 13-u102ng | |
| Dell Latitude 3189 | |
| HP Pavilion 11-k103ng x360 | |
| Lenovo Yoga 700-11ISK | |
| Networking | |
| iperf3 transmit AX12 | |
| Medion Akoya P3401T 2in1 | |
| Dell Latitude 3189 | |
| iperf3 receive AX12 | |
| Dell Latitude 3189 | |
| Medion Akoya P3401T 2in1 | |
| |||||||||||||||||||||||||
iluminação: 92 %
iluminação com acumulador: 291 cd/m²
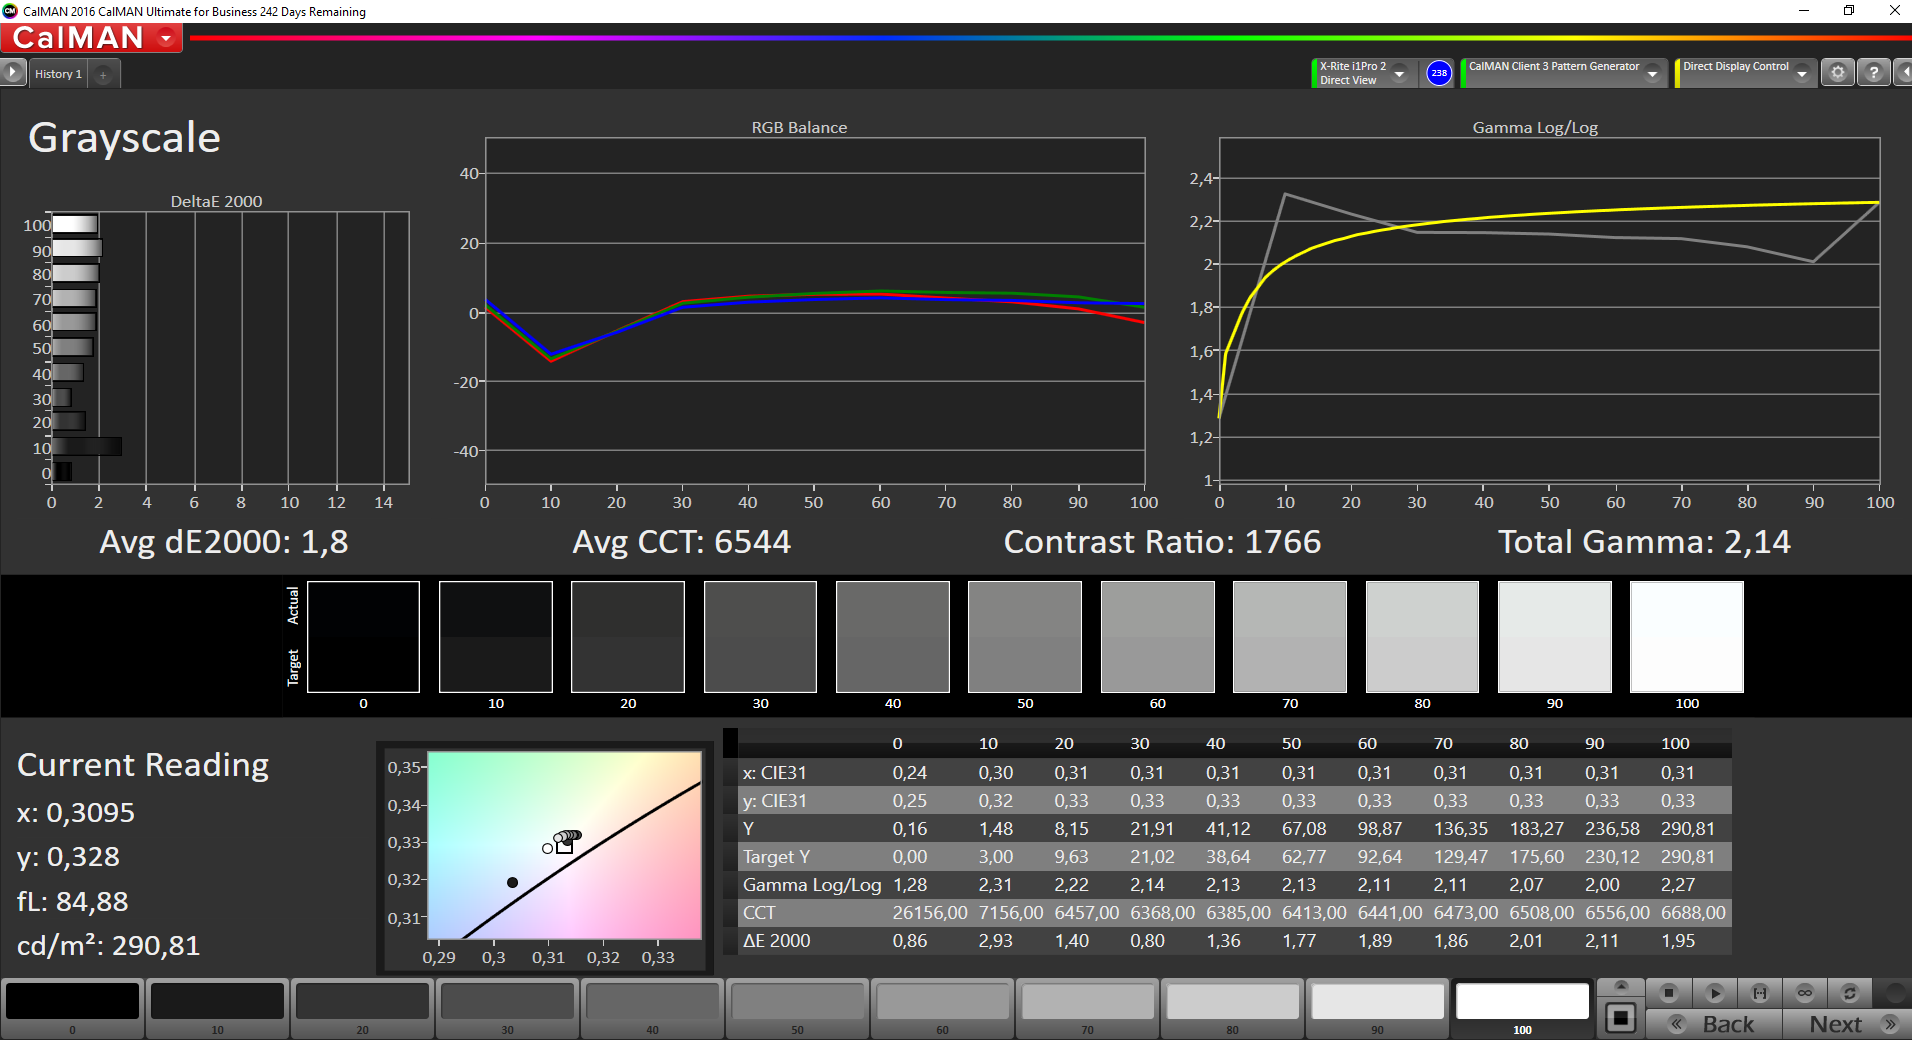
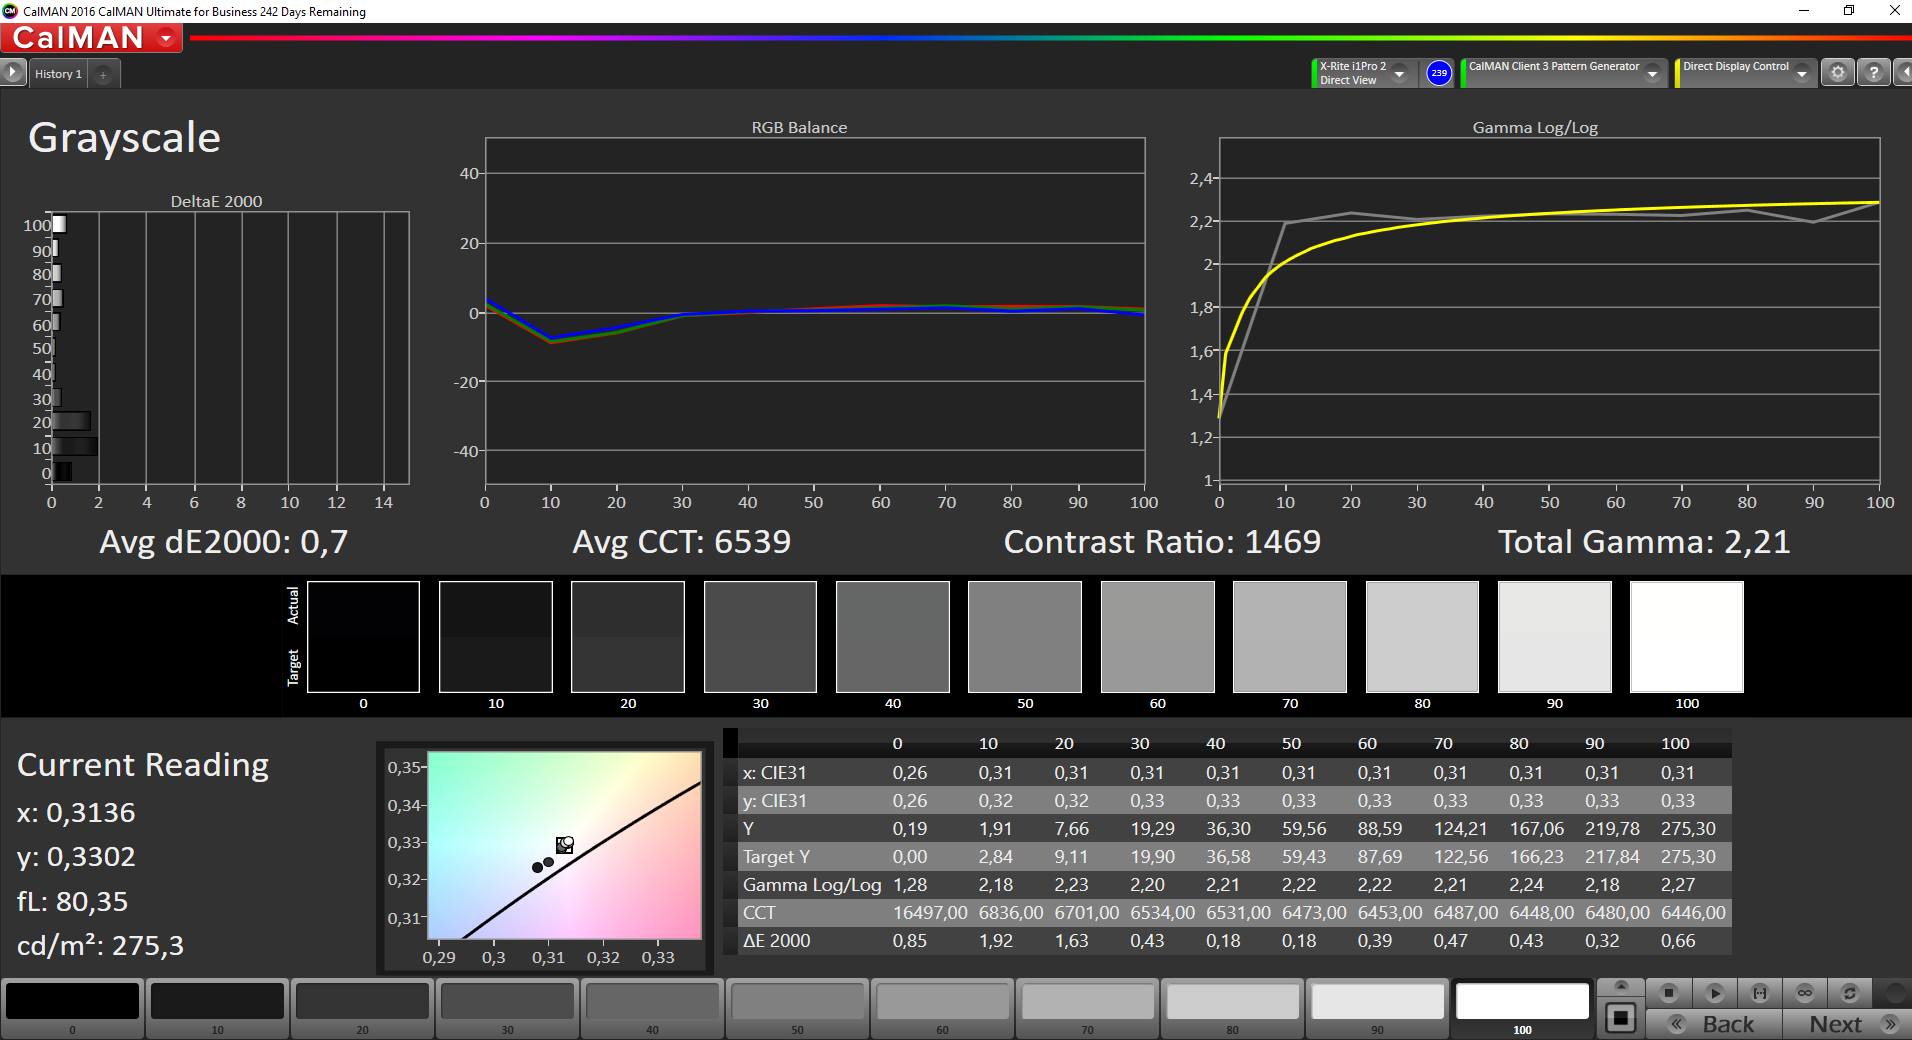
Contraste: 1819:1 (Preto: 0.16 cd/m²)
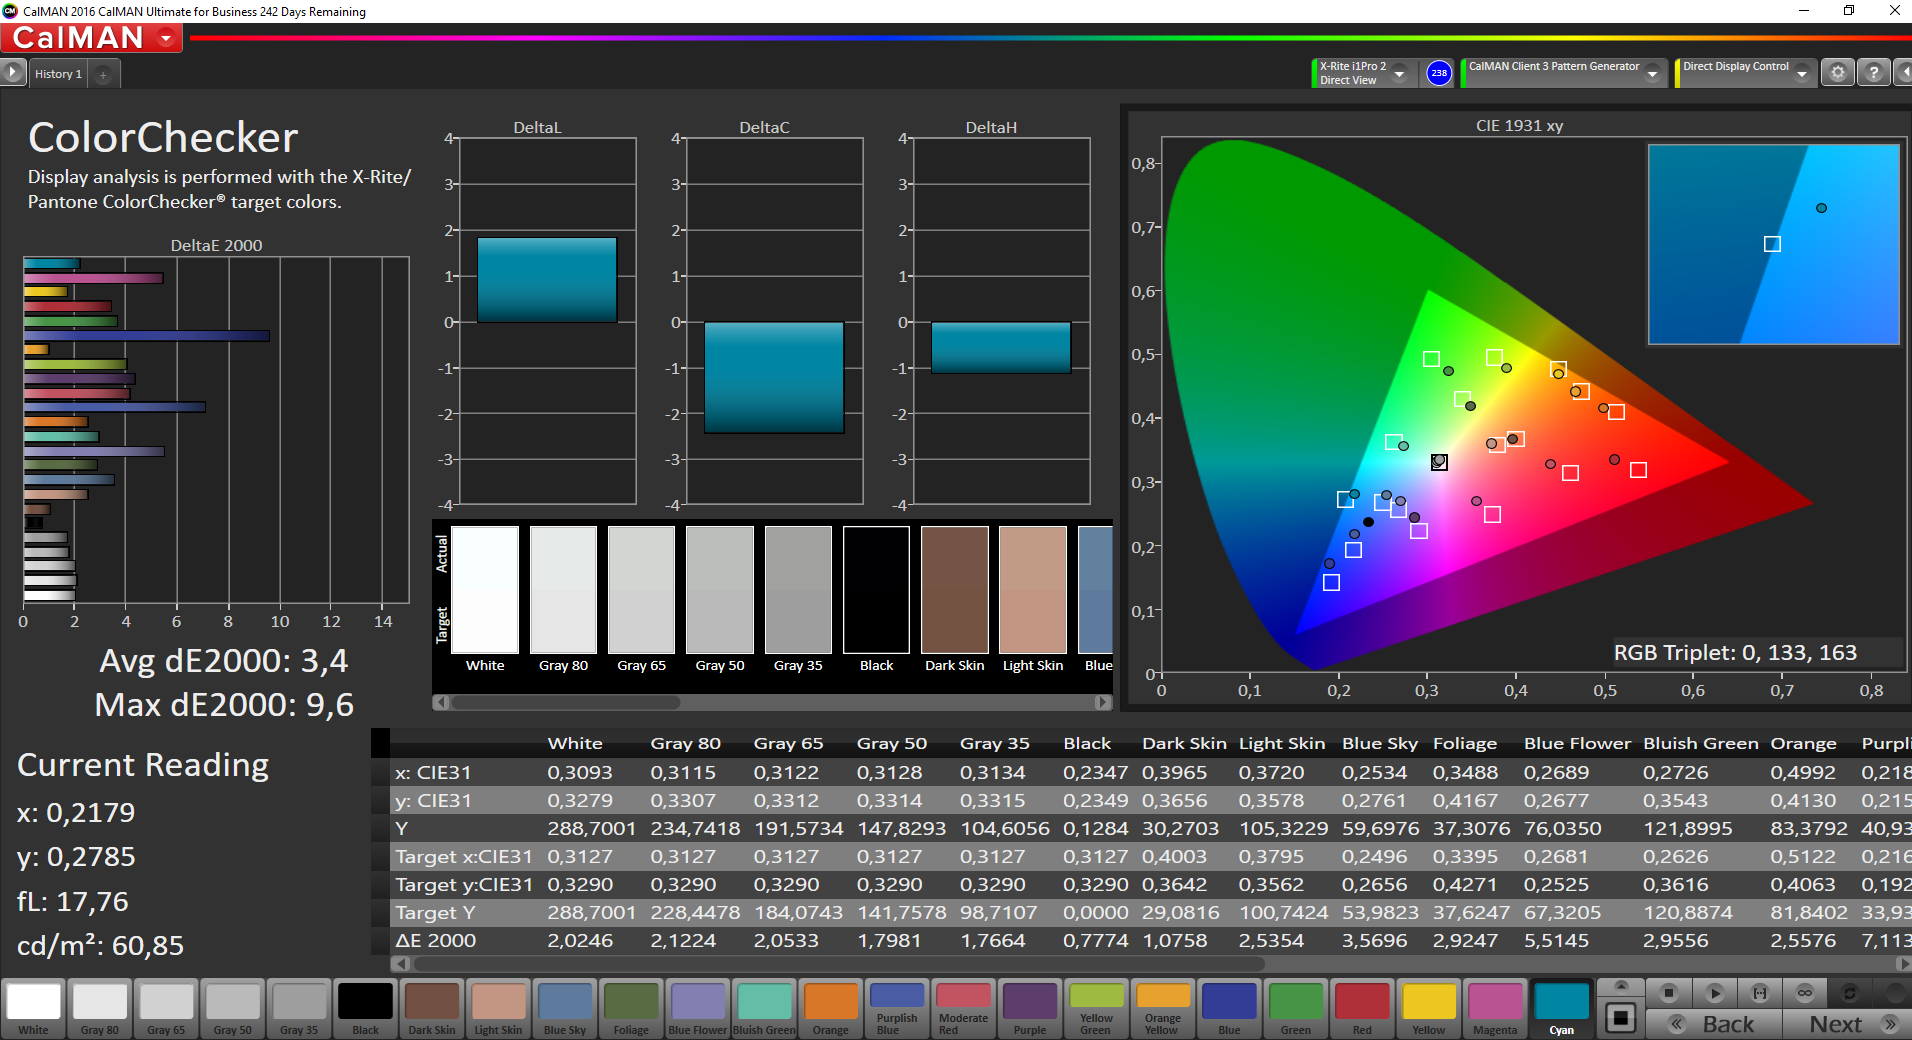
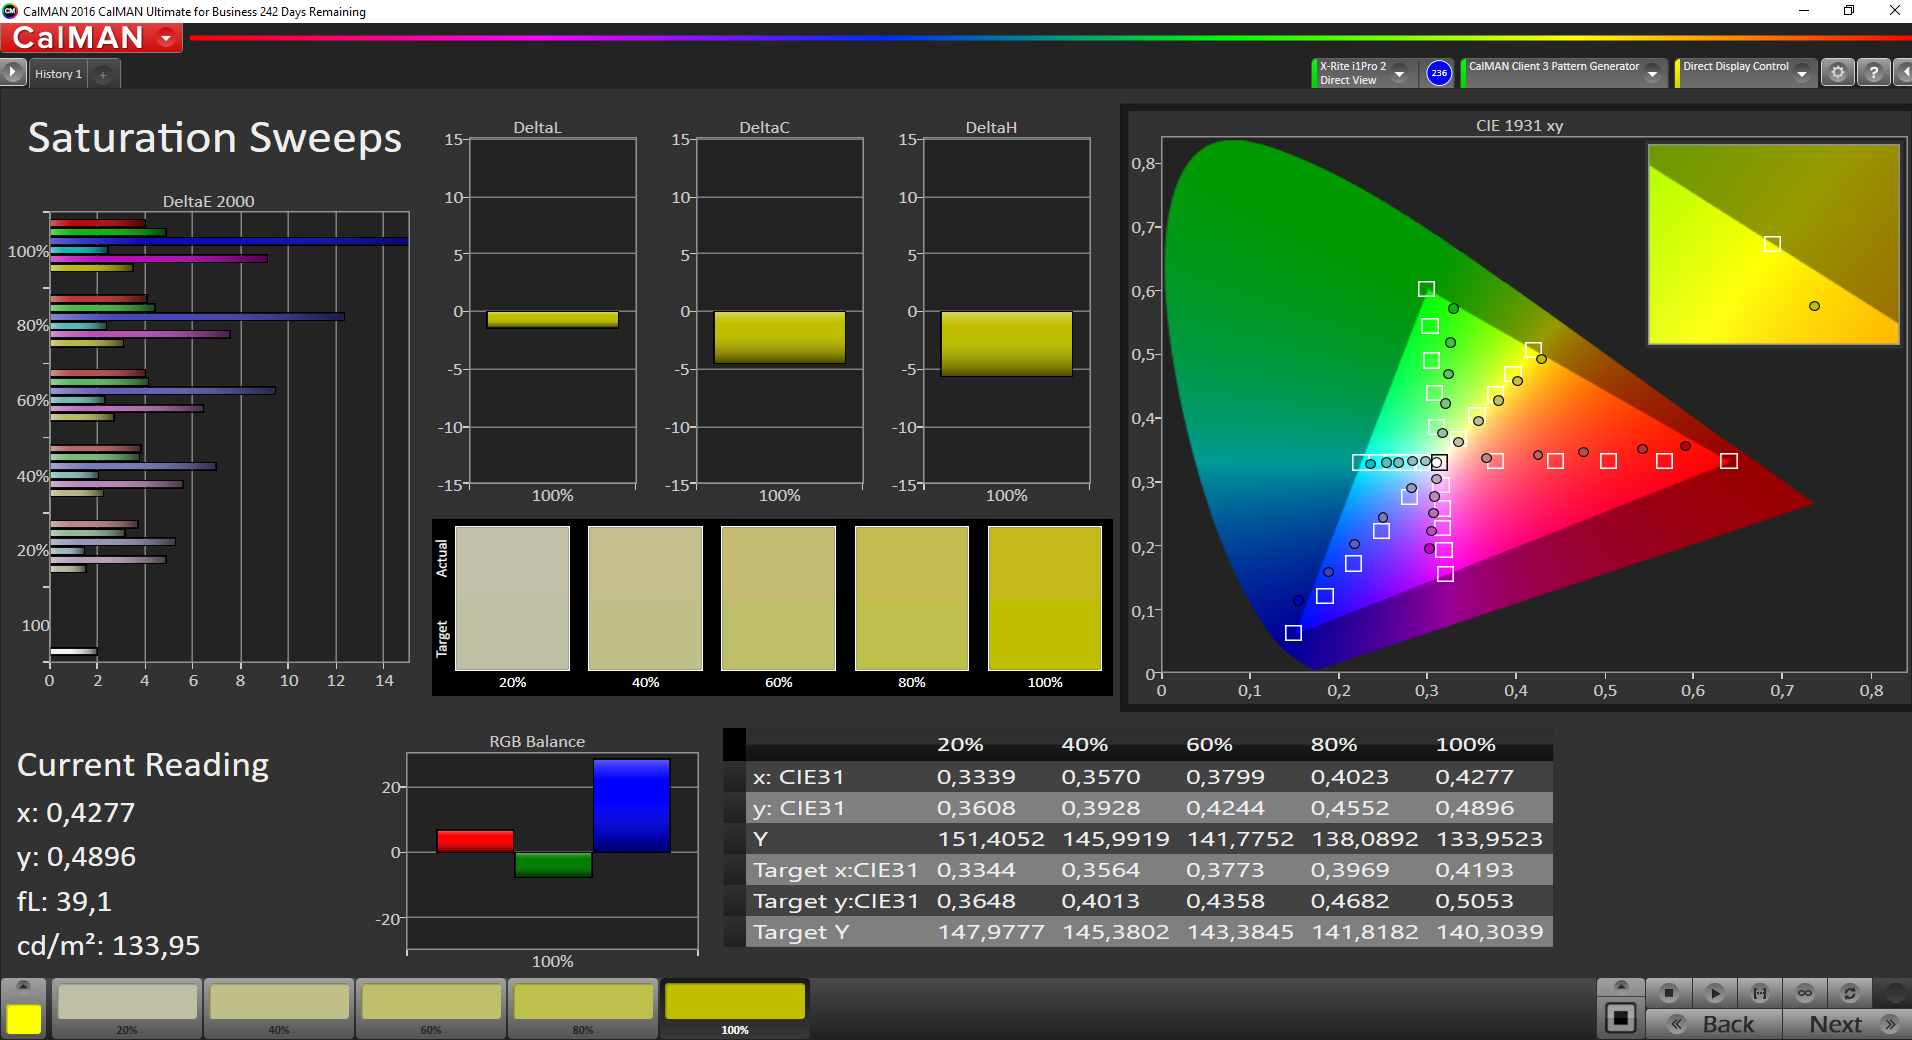
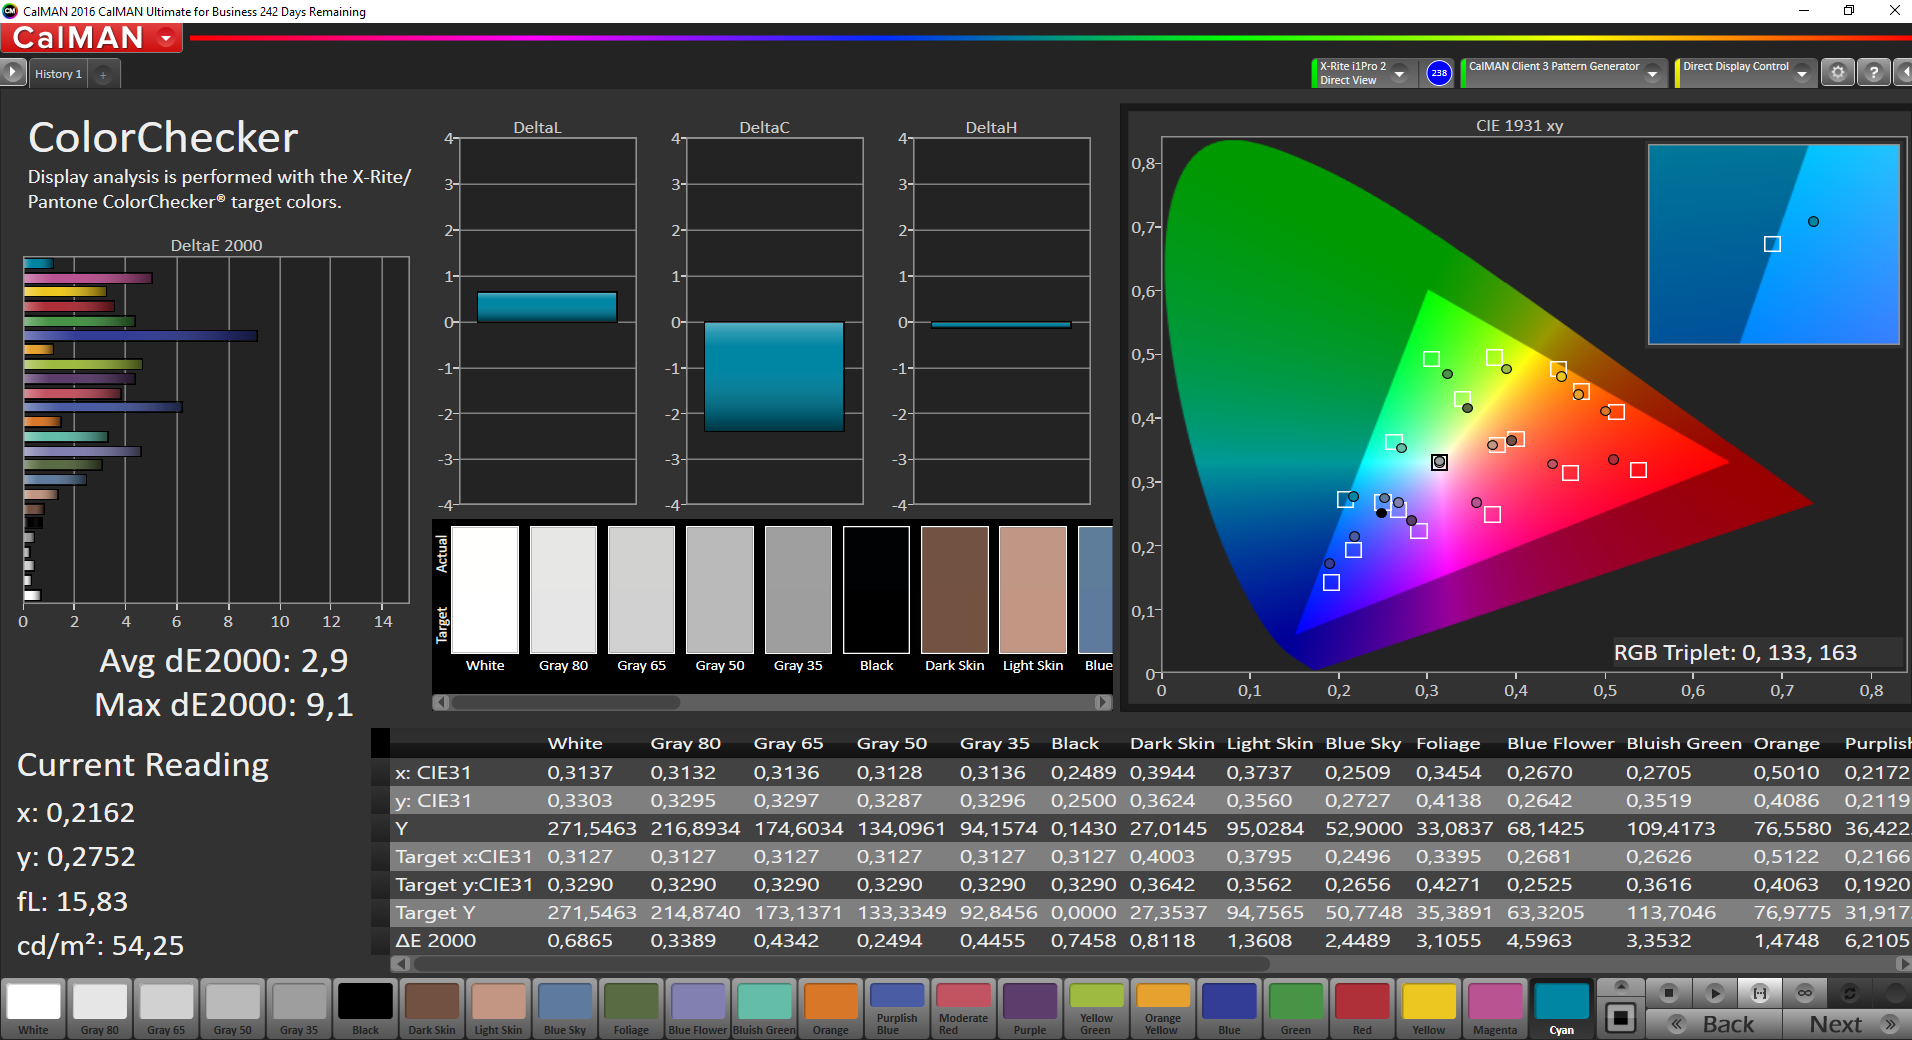
ΔE ColorChecker Calman: 3.4 | ∀{0.5-29.43 Ø4.71}
ΔE Greyscale Calman: 1.8 | ∀{0.09-98 Ø4.96}
67% sRGB (Argyll 1.6.3 3D)
42.8% AdobeRGB 1998 (Argyll 1.6.3 3D)
46.49% AdobeRGB 1998 (Argyll 3D)
67.3% sRGB (Argyll 3D)
44.96% Display P3 (Argyll 3D)
Gamma: 2.14
CCT: 6544 K
| Dell Latitude 3189 IPS, 1366x768, 11.6" | Medion Akoya P3401T 2in1 IPS, 1920x1080, 12.5" | HP Pavilion 11-k103ng x360 IPS, 1366x768, 11.6" | HP Pavilion x360 13-u102ng IPS, 1920x1080, 13.3" | Lenovo Yoga 700-11ISK IPS, 1920x1080, 11.6" | Acer Aspire Switch Alpha 12 SA5-271-56HM IPS, 2160x1440, 12" | |
|---|---|---|---|---|---|---|
| Display | -5% | 1% | -12% | -4% | 44% | |
| Display P3 Coverage (%) | 44.96 | 42.92 -5% | 45.21 1% | 39.43 -12% | 43.6 -3% | 65.5 46% |
| sRGB Coverage (%) | 67.3 | 64.3 -4% | 67.8 1% | 59.1 -12% | 64.2 -5% | 96.1 43% |
| AdobeRGB 1998 Coverage (%) | 46.49 | 44.35 -5% | 46.73 1% | 40.76 -12% | 45.17 -3% | 66.9 44% |
| Response Times | 7% | 39% | 12% | 40% | 19% | |
| Response Time Grey 50% / Grey 80% * (ms) | 40 ? | 40 ? -0% | 18.8 ? 53% | 38 ? 5% | 23 ? 43% | 20 ? 50% |
| Response Time Black / White * (ms) | 30.4 ? | 26 ? 14% | 23.2 ? 24% | 25 ? 18% | 19 ? 37% | 34 ? -12% |
| PWM Frequency (Hz) | 50 ? | 1000 ? | ||||
| Screen | -27% | -13% | -44% | -76% | -47% | |
| Brightness middle (cd/m²) | 291 | 392 35% | 194 -33% | 277 -5% | 300 3% | 345 19% |
| Brightness (cd/m²) | 284 | 392 38% | 186 -35% | 263 -7% | 284 0% | 328 15% |
| Brightness Distribution (%) | 92 | 93 1% | 86 -7% | 88 -4% | 82 -11% | 91 -1% |
| Black Level * (cd/m²) | 0.16 | 0.33 -106% | 0.22 -38% | 0.31 -94% | 0.33 -106% | 0.38 -138% |
| Contrast (:1) | 1819 | 1188 -35% | 882 -52% | 894 -51% | 909 -50% | 908 -50% |
| Colorchecker dE 2000 * | 3.4 | 4.99 -47% | 3.06 10% | 5.57 -64% | 7.87 -131% | 8.4 -147% |
| Colorchecker dE 2000 max. * | 9.6 | 9.08 5% | 8.81 8% | 13.6 -42% | 17.75 -85% | 11.9 -24% |
| Greyscale dE 2000 * | 1.8 | 4.53 -152% | 1.42 21% | 4.56 -153% | 8.45 -369% | 4.3 -139% |
| Gamma | 2.14 103% | 2.46 89% | 2.34 94% | 2.28 96% | 2.42 91% | 2.63 84% |
| CCT | 6544 99% | 7394 88% | 6432 101% | 6648 98% | 6856 95% | 7368 88% |
| Color Space (Percent of AdobeRGB 1998) (%) | 42.8 | 41 -4% | 42.98 0% | 38 -11% | 41 -4% | 62 45% |
| Color Space (Percent of sRGB) (%) | 67 | 64 -4% | 67.56 1% | 59 -12% | 64 -4% | |
| Média Total (Programa/Configurações) | -8% /
-18% | 9% /
-3% | -15% /
-30% | -13% /
-46% | 5% /
-18% |
* ... menor é melhor

Exibir tempos de resposta
| ↔ Tempo de resposta preto para branco | ||
|---|---|---|
| 30.4 ms ... ascensão ↗ e queda ↘ combinadas | ↗ 16.4 ms ascensão | 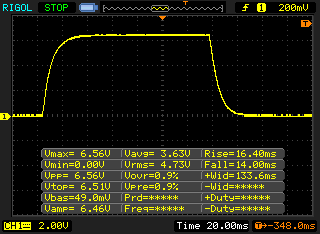 |
| ↘ 14 ms queda | ||
| A tela mostra taxas de resposta lentas em nossos testes e será insatisfatória para os jogadores. Em comparação, todos os dispositivos testados variam de 0.1 (mínimo) a 240 (máximo) ms. » 82 % de todos os dispositivos são melhores. Isso significa que o tempo de resposta medido é pior que a média de todos os dispositivos testados (19.8 ms). | ||
| ↔ Tempo de resposta 50% cinza a 80% cinza | ||
| 40 ms ... ascensão ↗ e queda ↘ combinadas | ↗ 18.8 ms ascensão | 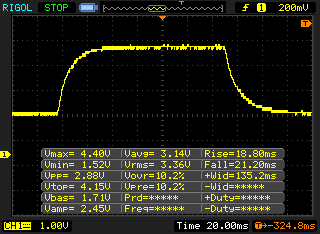 |
| ↘ 21.2 ms queda | ||
| A tela mostra taxas de resposta lentas em nossos testes e será insatisfatória para os jogadores. Em comparação, todos os dispositivos testados variam de 0.165 (mínimo) a 636 (máximo) ms. » 61 % de todos os dispositivos são melhores. Isso significa que o tempo de resposta medido é pior que a média de todos os dispositivos testados (31 ms). | ||
Cintilação da tela / PWM (modulação por largura de pulso)
| Tela tremeluzindo / PWM não detectado | 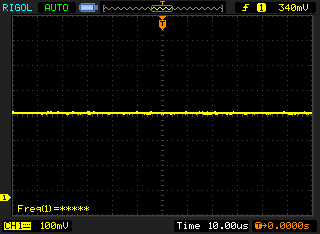 | ||
[pwm_comparison] Em comparação: 52 % de todos os dispositivos testados não usam PWM para escurecer a tela. Se PWM foi detectado, uma média de 7757 (mínimo: 5 - máximo: 343500) Hz foi medida. | |||
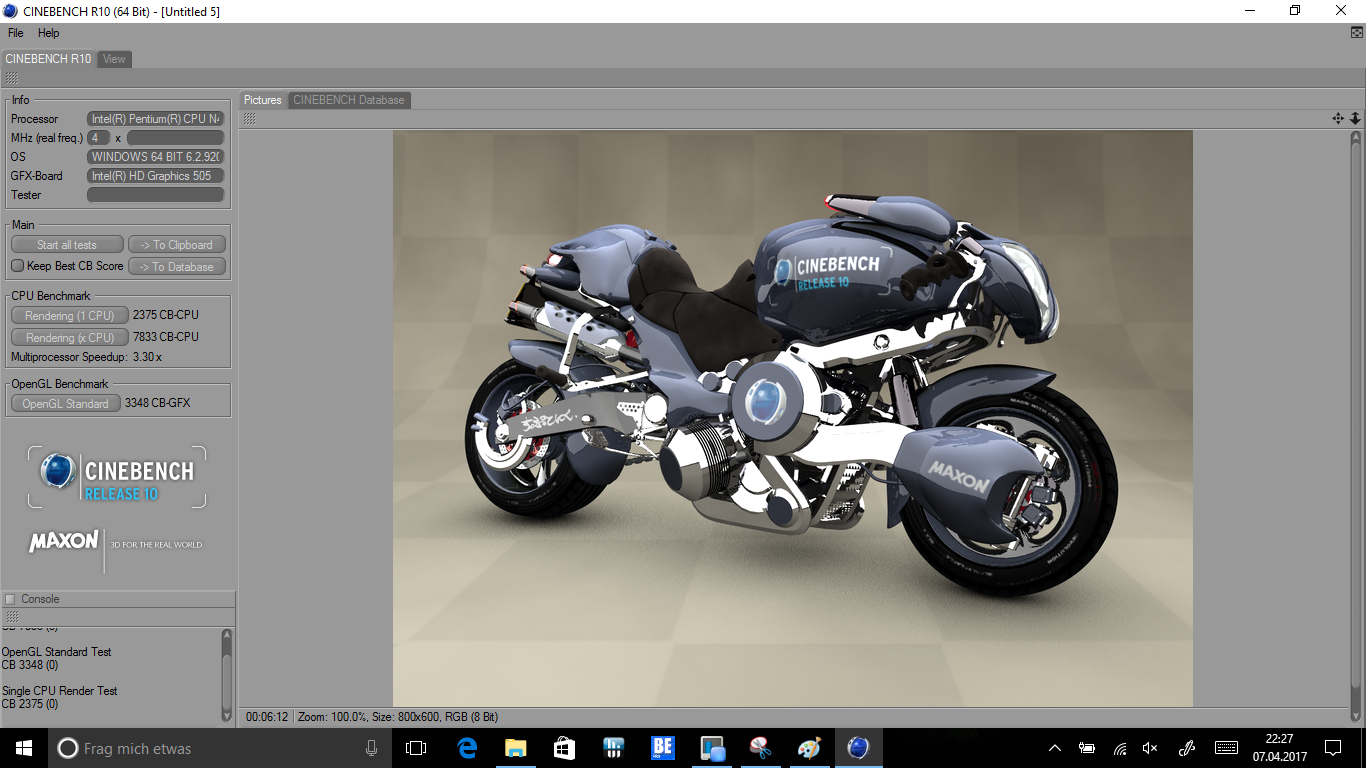
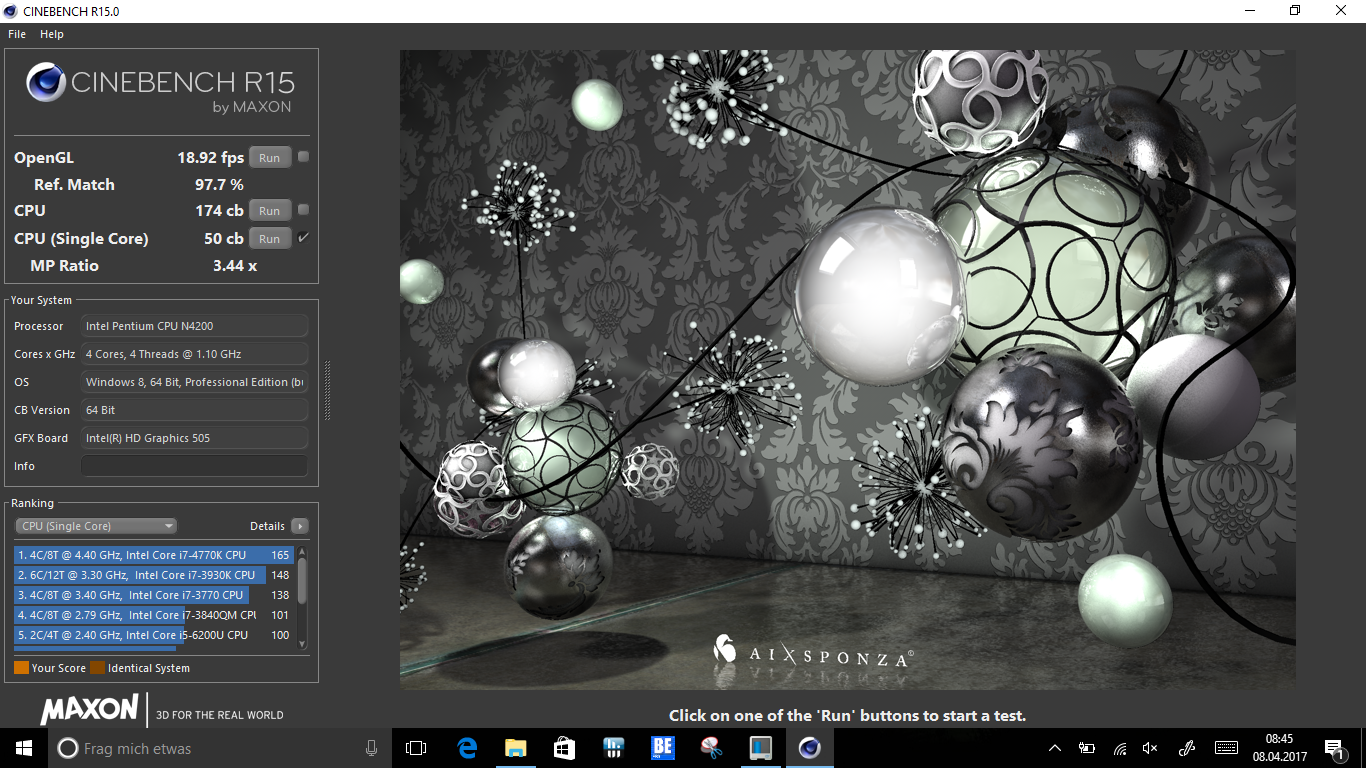
| Cinebench R15 | |
| CPU Single 64Bit | |
| HP Pavilion x360 13-u102ng | |
| Acer Aspire Switch Alpha 12 SA5-271-56HM | |
| Medion Akoya P3401T 2in1 | |
| Lenovo Yoga 700-11ISK | |
| Dell Latitude 3189 | |
| HP Pavilion 11-k103ng x360 | |
| CPU Multi 64Bit | |
| HP Pavilion x360 13-u102ng | |
| Acer Aspire Switch Alpha 12 SA5-271-56HM | |
| Medion Akoya P3401T 2in1 | |
| Dell Latitude 3189 | |
| Lenovo Yoga 700-11ISK | |
| HP Pavilion 11-k103ng x360 | |
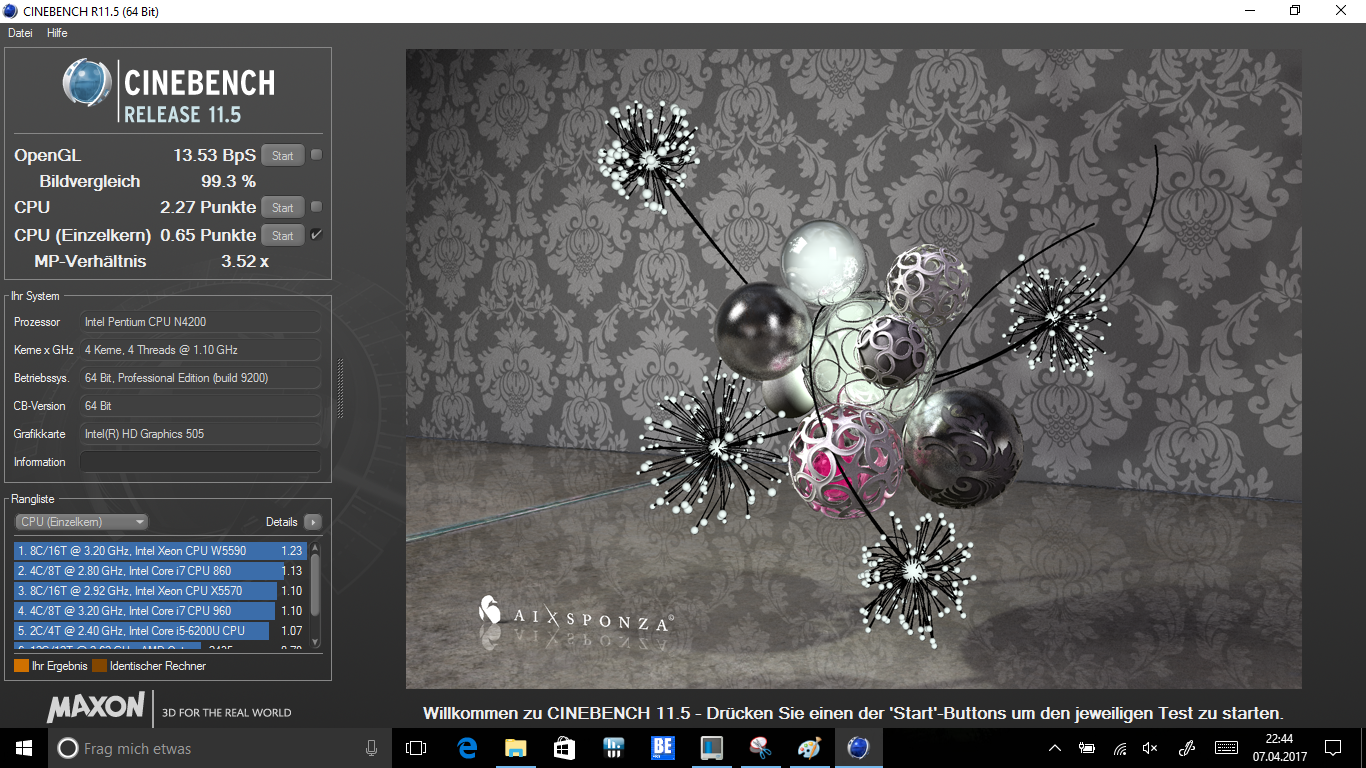
| Cinebench R11.5 | |
| CPU Single 64Bit | |
| HP Pavilion x360 13-u102ng | |
| Dell Latitude 3189 | |
| CPU Multi 64Bit | |
| HP Pavilion x360 13-u102ng | |
| Dell Latitude 3189 | |
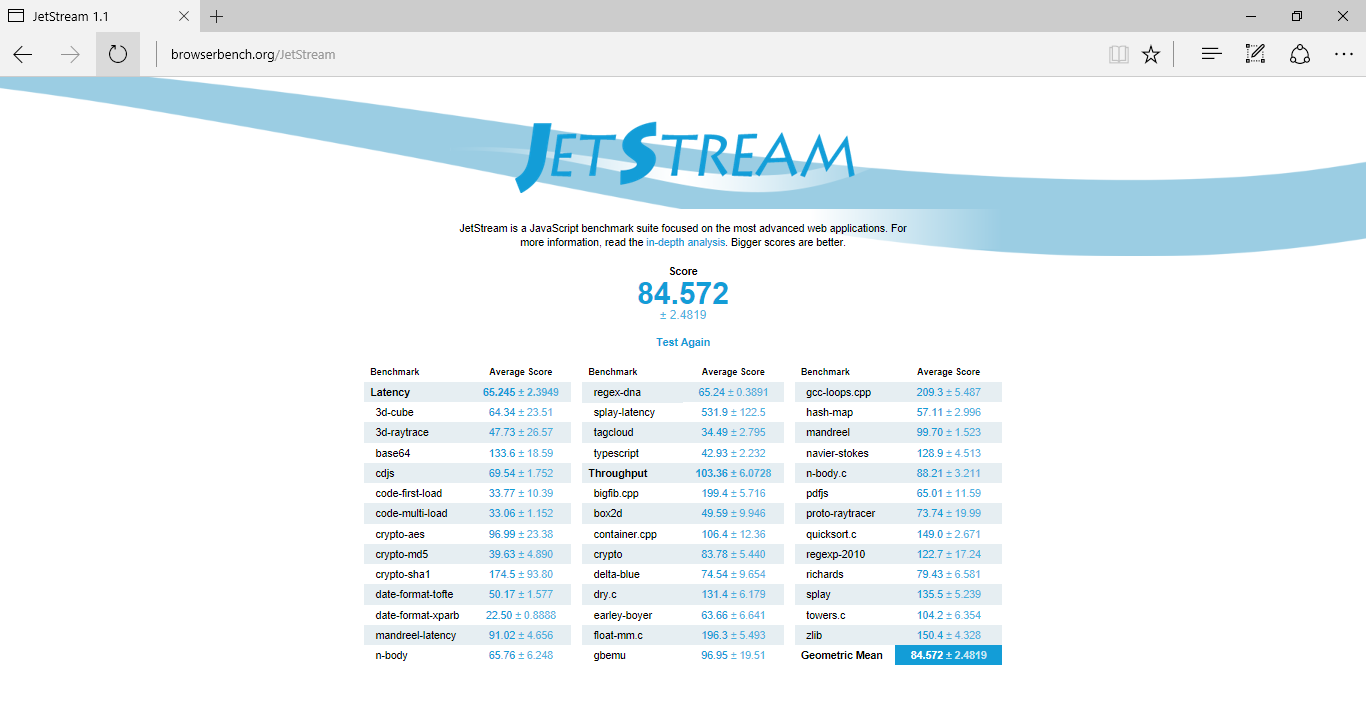
| JetStream 1.1 - 1.1 Total | |
| HP Pavilion x360 13-u102ng | |
| Medion Akoya P3401T 2in1 | |
| Acer Aspire Switch Alpha 12 SA5-271-56HM | |
| Lenovo Yoga 700-11ISK | |
| Dell Latitude 3189 | |
| HP Pavilion 11-k103ng x360 | |
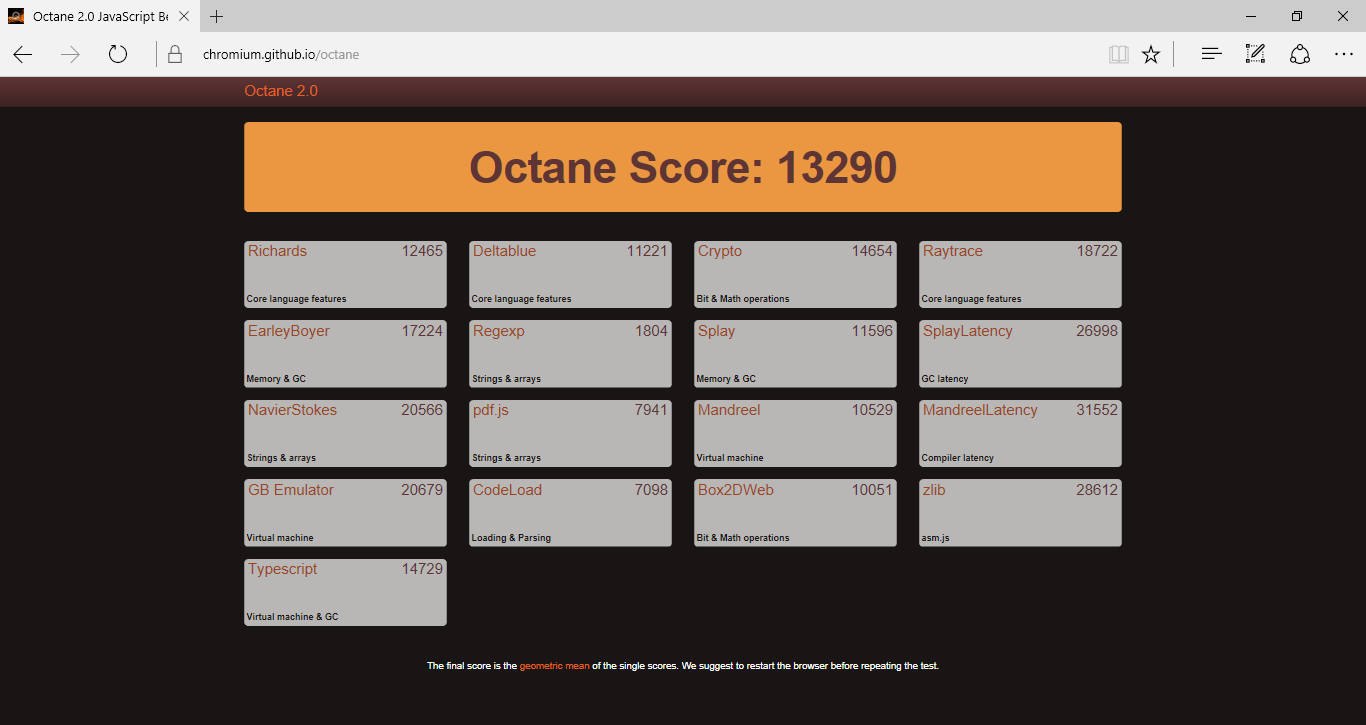
| Octane V2 - Total Score | |
| HP Pavilion x360 13-u102ng | |
| Acer Aspire Switch Alpha 12 SA5-271-56HM | |
| Lenovo Yoga 700-11ISK | |
| Dell Latitude 3189 | |
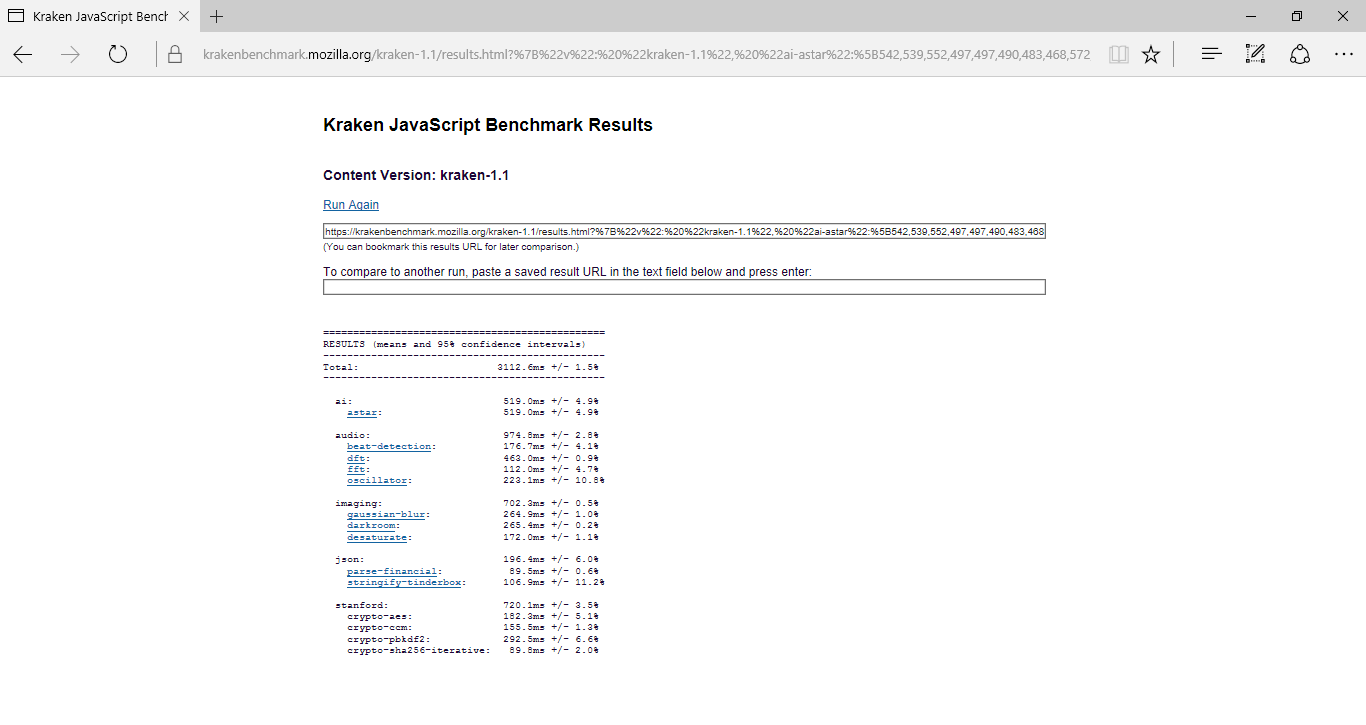
| Mozilla Kraken 1.1 - Total | |
| Dell Latitude 3189 | |
| Lenovo Yoga 700-11ISK | |
| Acer Aspire Switch Alpha 12 SA5-271-56HM | |
| HP Pavilion x360 13-u102ng | |
* ... menor é melhor
| PCMark 8 | |
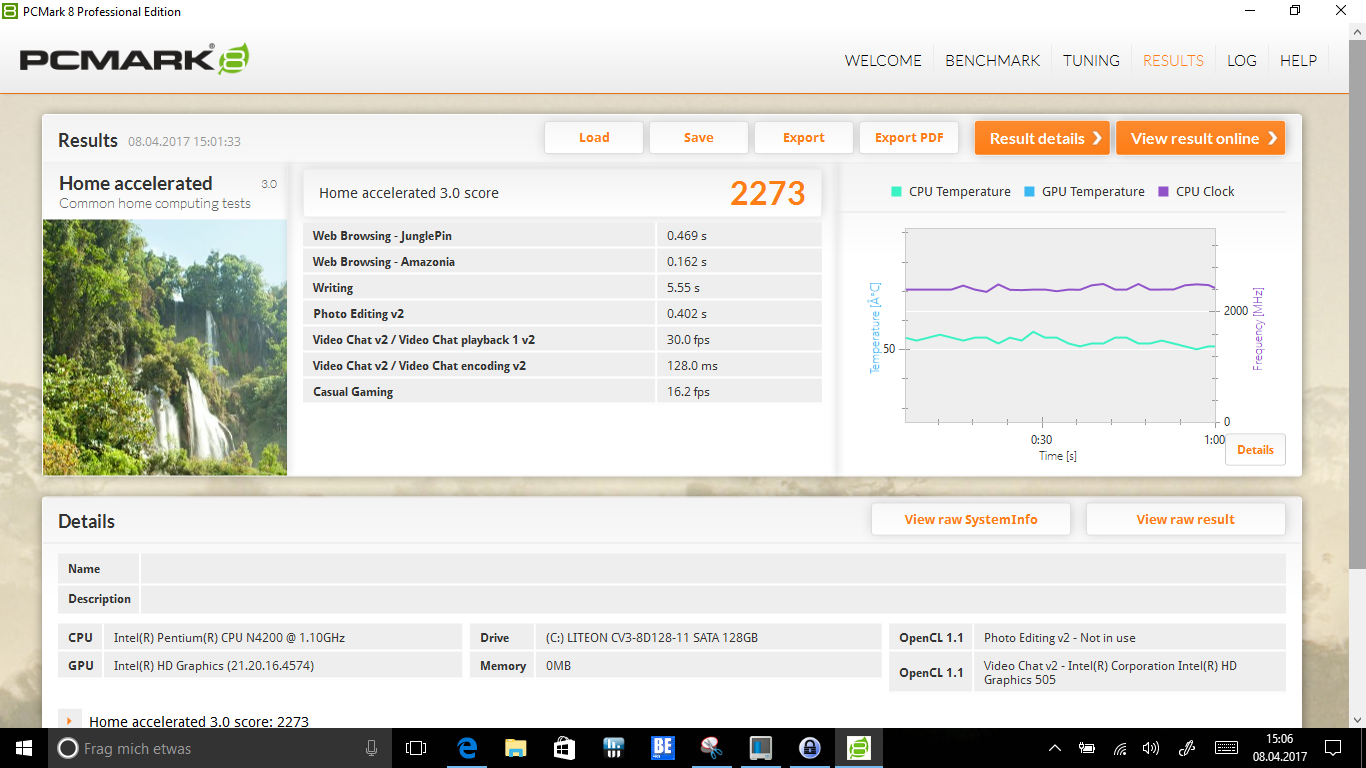
| Home Score Accelerated v2 | |
| Acer Aspire Switch Alpha 12 SA5-271-56HM | |
| HP Pavilion x360 13-u102ng | |
| Medion Akoya P3401T 2in1 | |
| Lenovo Yoga 700-11ISK | |
| Dell Latitude 3189 | |
| HP Pavilion 11-k103ng x360 | |
| Work Score Accelerated v2 | |
| HP Pavilion x360 13-u102ng | |
| Acer Aspire Switch Alpha 12 SA5-271-56HM | |
| Lenovo Yoga 700-11ISK | |
| Dell Latitude 3189 | |
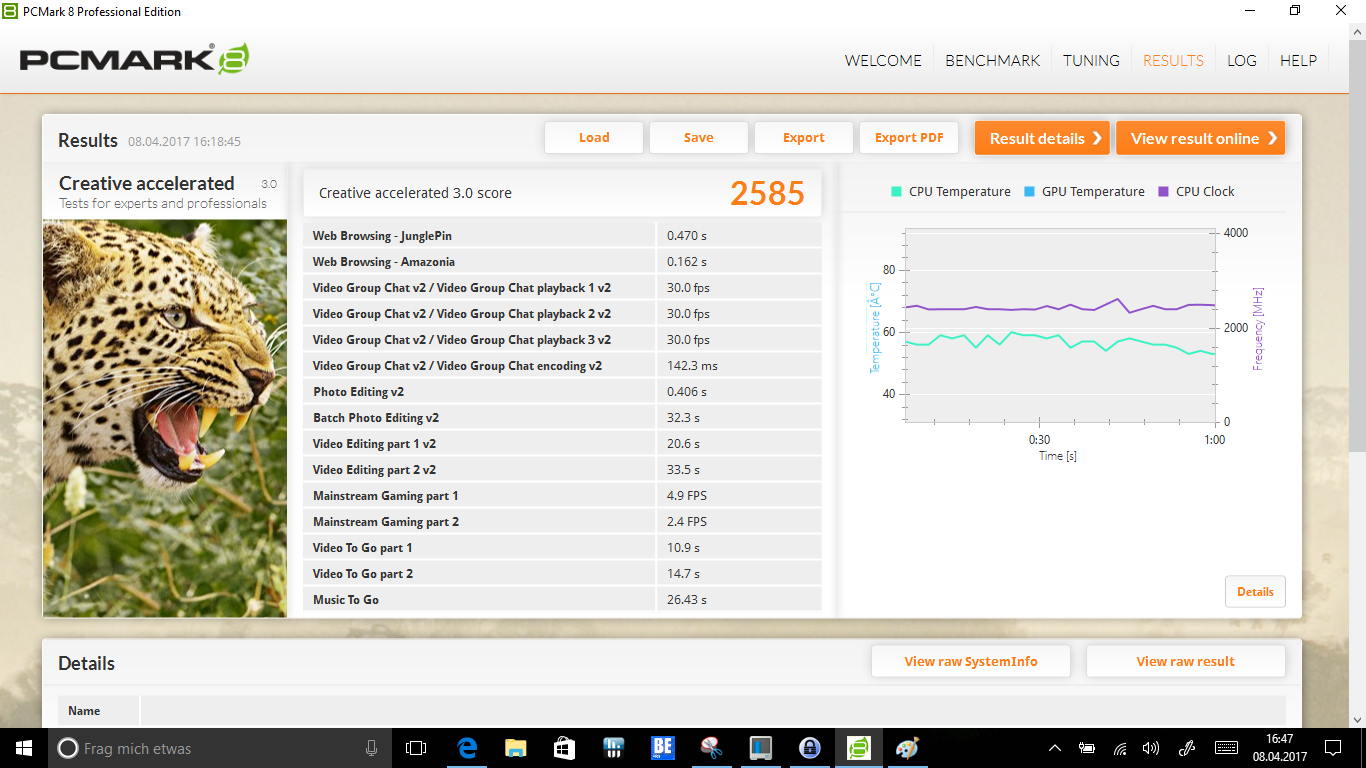
| Creative Score Accelerated v2 | |
| HP Pavilion x360 13-u102ng | |
| Lenovo Yoga 700-11ISK | |
| Dell Latitude 3189 | |
| PCMark 7 | |
| Score | |
| Dell Latitude 3189 | |
| HP Pavilion x360 13-u102ng | |
| Productivity | |
| Dell Latitude 3189 | |
| HP Pavilion x360 13-u102ng | |
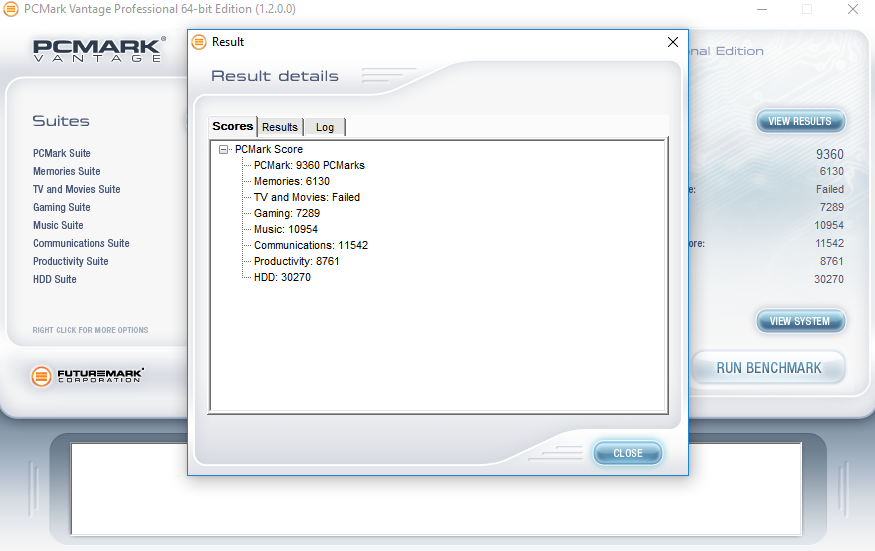
| PCMark Vantage Result | 9360 pontos | |
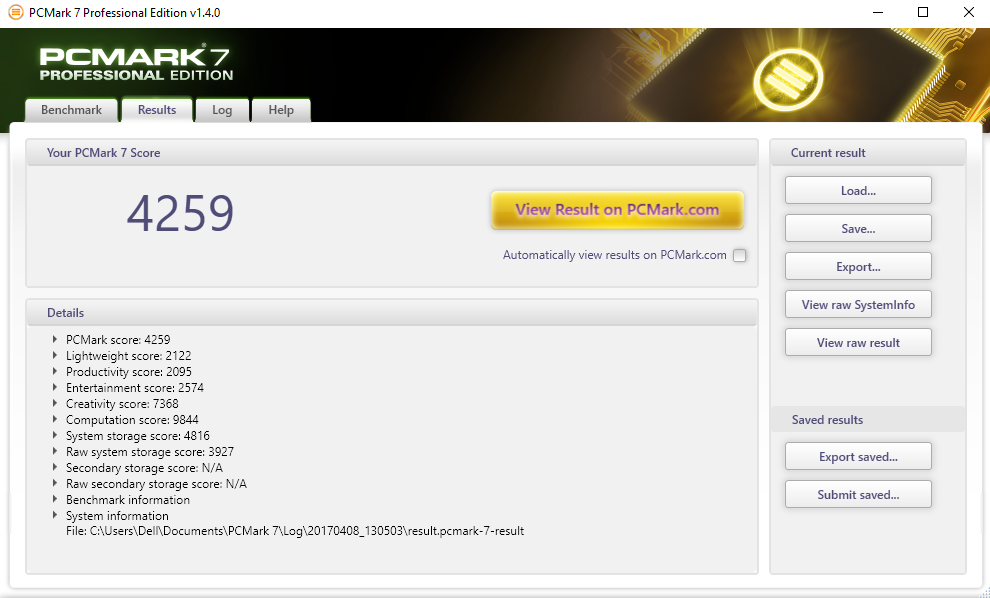
| PCMark 7 Score | 4259 pontos | |
| PCMark 8 Home Score Accelerated v2 | 2273 pontos | |
| PCMark 8 Creative Score Accelerated v2 | 2585 pontos | |
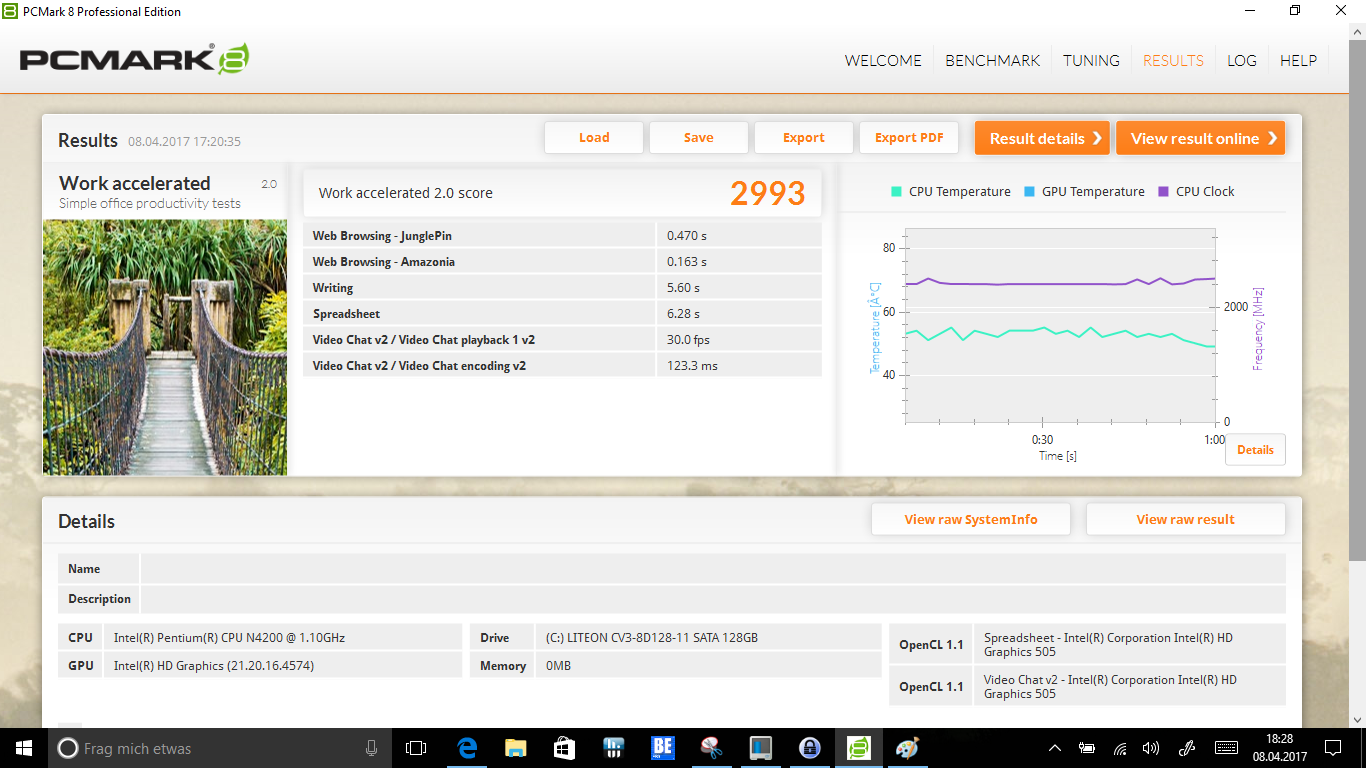
| PCMark 8 Work Score Accelerated v2 | 2993 pontos | |
Ajuda | ||
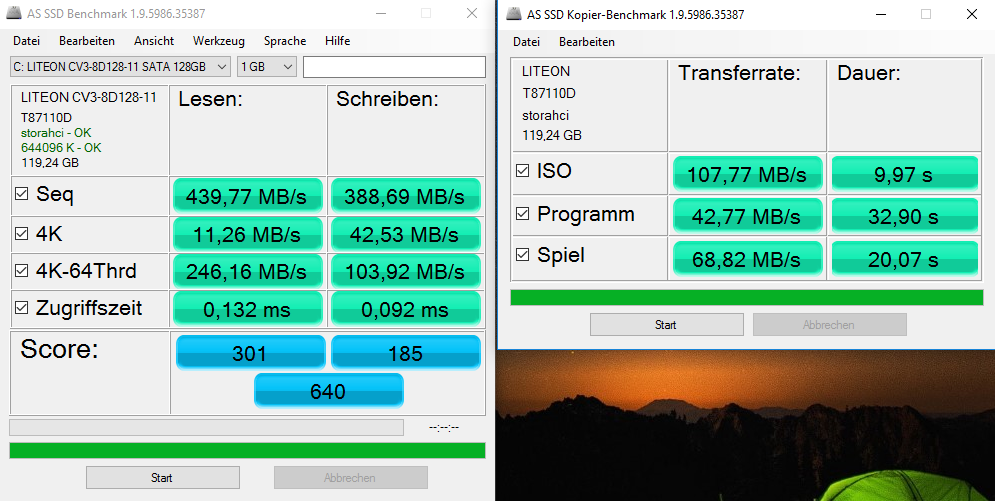
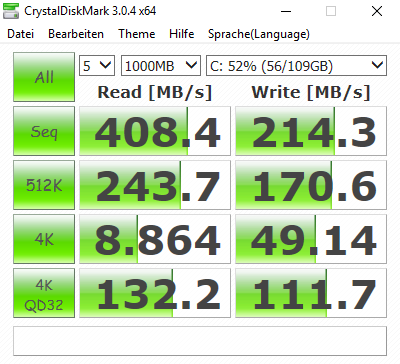
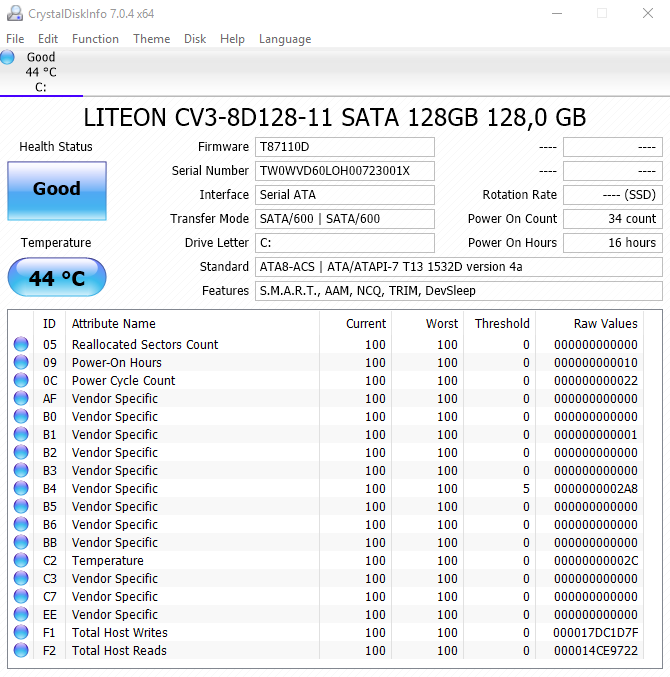
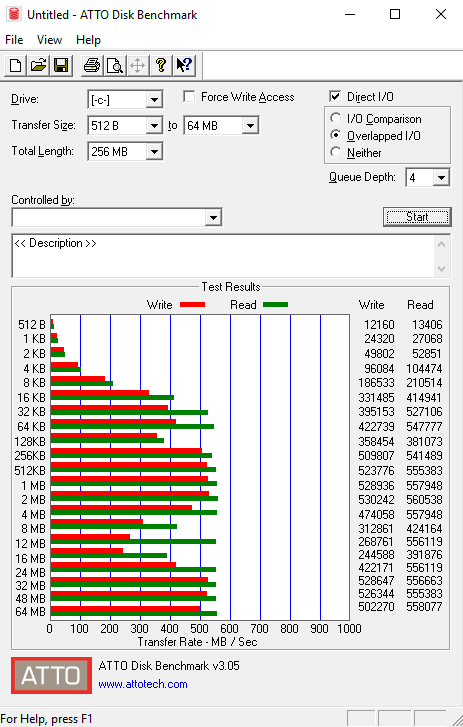
| Dell Latitude 3189 Liteonit CV3-8D128 | Medion Akoya P3401T 2in1 | HP Pavilion 11-k103ng x360 Hitachi Travelstar Z5K500 HTS545050A7E680 | HP Pavilion x360 13-u102ng HGST Travelstar 5K1000 HTS541010A7E630 | Lenovo Yoga 700-11ISK Samsung SSD PM871 MZNLN256HCHP | Acer Aspire Switch Alpha 12 SA5-271-56HM Kingston RBU-SNS8152S3256GG2 | |
|---|---|---|---|---|---|---|
| CrystalDiskMark 3.0 | 37% | -85% | -87% | 97% | 70% | |
| Read Seq (MB/s) | 408.4 | 427.6 5% | 106 -74% | 104.8 -74% | 456.2 12% | 518 27% |
| Write Seq (MB/s) | 214.3 | 286.5 34% | 106.1 -50% | 91 -58% | 302.8 41% | 199.9 -7% |
| Read 512 (MB/s) | 243.7 | 324.1 33% | 33.53 -86% | 20.67 -92% | 385.7 58% | 374.9 54% |
| Write 512 (MB/s) | 170.6 | 121.8 -29% | 39.03 -77% | 45.05 -74% | 301.9 77% | 201 18% |
| Read 4k (MB/s) | 8.864 | 28.11 217% | 0.407 -95% | 0.215 -98% | 31.27 253% | 29.3 231% |
| Write 4k (MB/s) | 49.14 | 41.68 -15% | 1.026 -98% | 1.037 -98% | 73.6 50% | 76.8 56% |
| Read 4k QD32 (MB/s) | 132.2 | 249.2 89% | 0.898 -99% | 0.968 -99% | 324.2 145% | 272 106% |
| Write 4k QD32 (MB/s) | 111.7 | 68.8 -38% | 1.003 -99% | 1.09 -99% | 268.6 140% | 197.1 76% |

| 3DMark | |
| 1280x720 Cloud Gate Standard Graphics | |
| Acer Aspire Switch Alpha 12 SA5-271-56HM | |
| HP Pavilion x360 13-u102ng | |
| Dell Latitude 3189 | |
| Lenovo Yoga 700-11ISK | |
| 1920x1080 Fire Strike Graphics | |
| HP Pavilion x360 13-u102ng | |
| Dell Latitude 3189 | |
| Lenovo Yoga 700-11ISK | |
| 3DMark 11 - 1280x720 Performance GPU | |
| Acer Aspire Switch Alpha 12 SA5-271-56HM | |
| HP Pavilion x360 13-u102ng | |
| Medion Akoya P3401T 2in1 | |
| Lenovo Yoga 700-11ISK | |
| Dell Latitude 3189 | |
| HP Pavilion 11-k103ng x360 | |
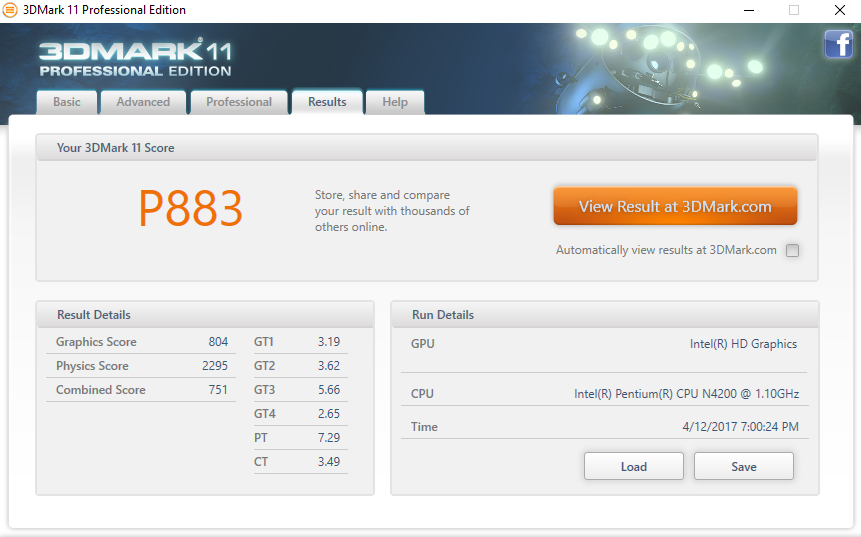
| 3DMark 11 Performance | 883 pontos | |
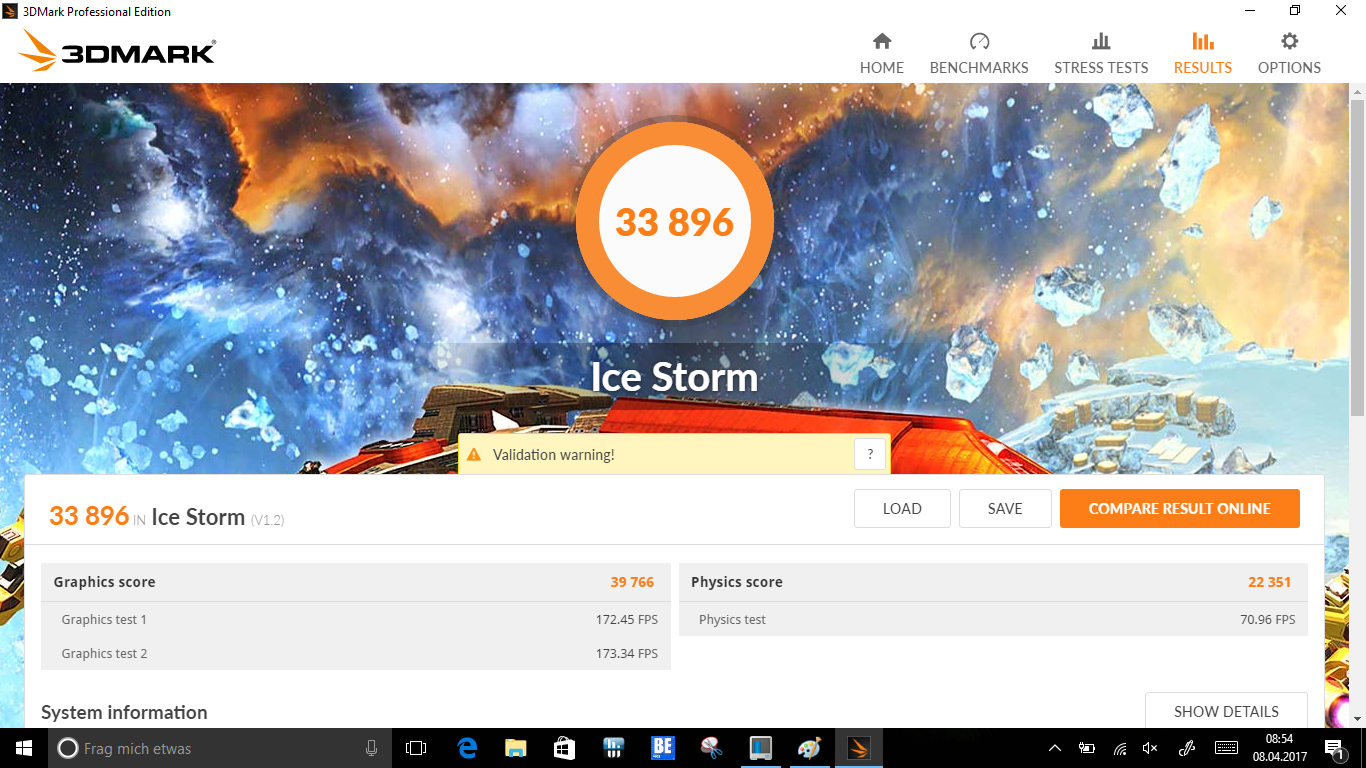
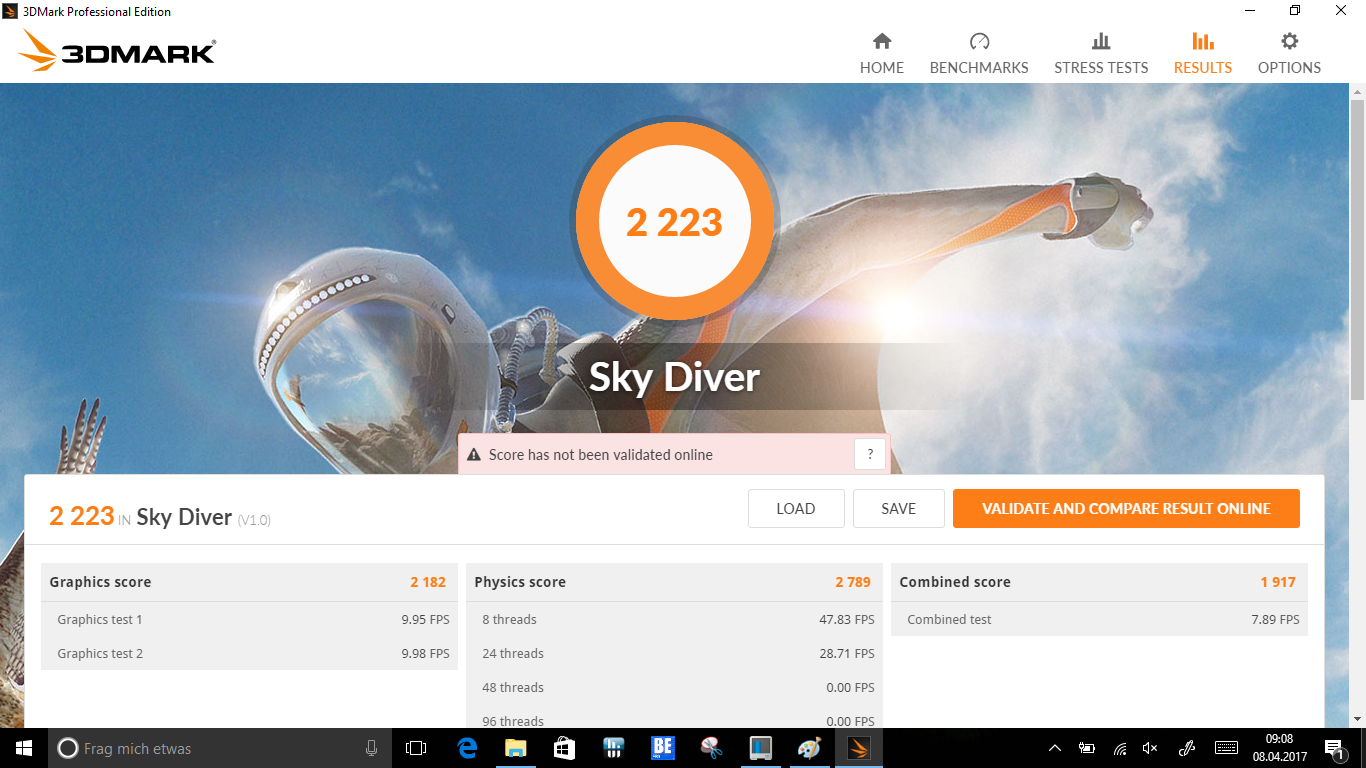
| 3DMark Ice Storm Standard Score | 33896 pontos | |
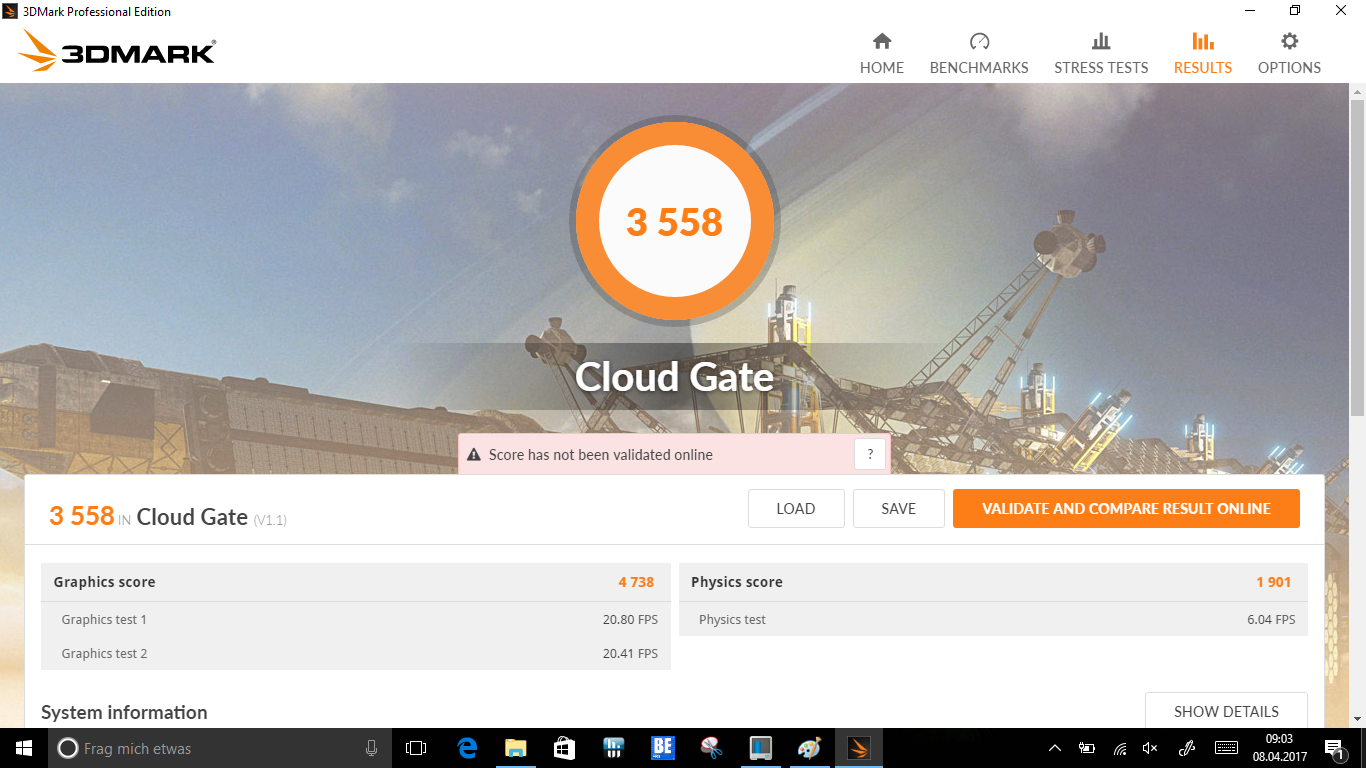
| 3DMark Cloud Gate Standard Score | 3558 pontos | |
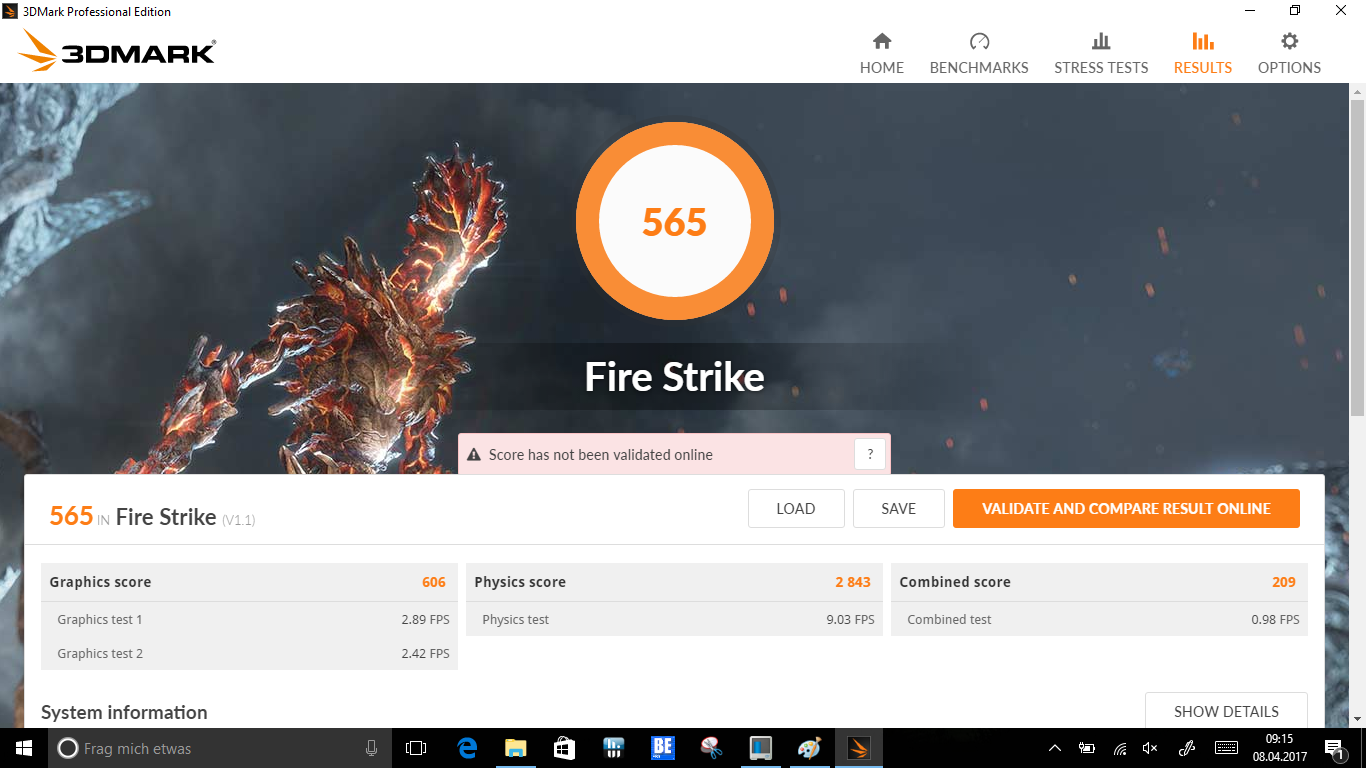
| 3DMark Fire Strike Score | 565 pontos | |
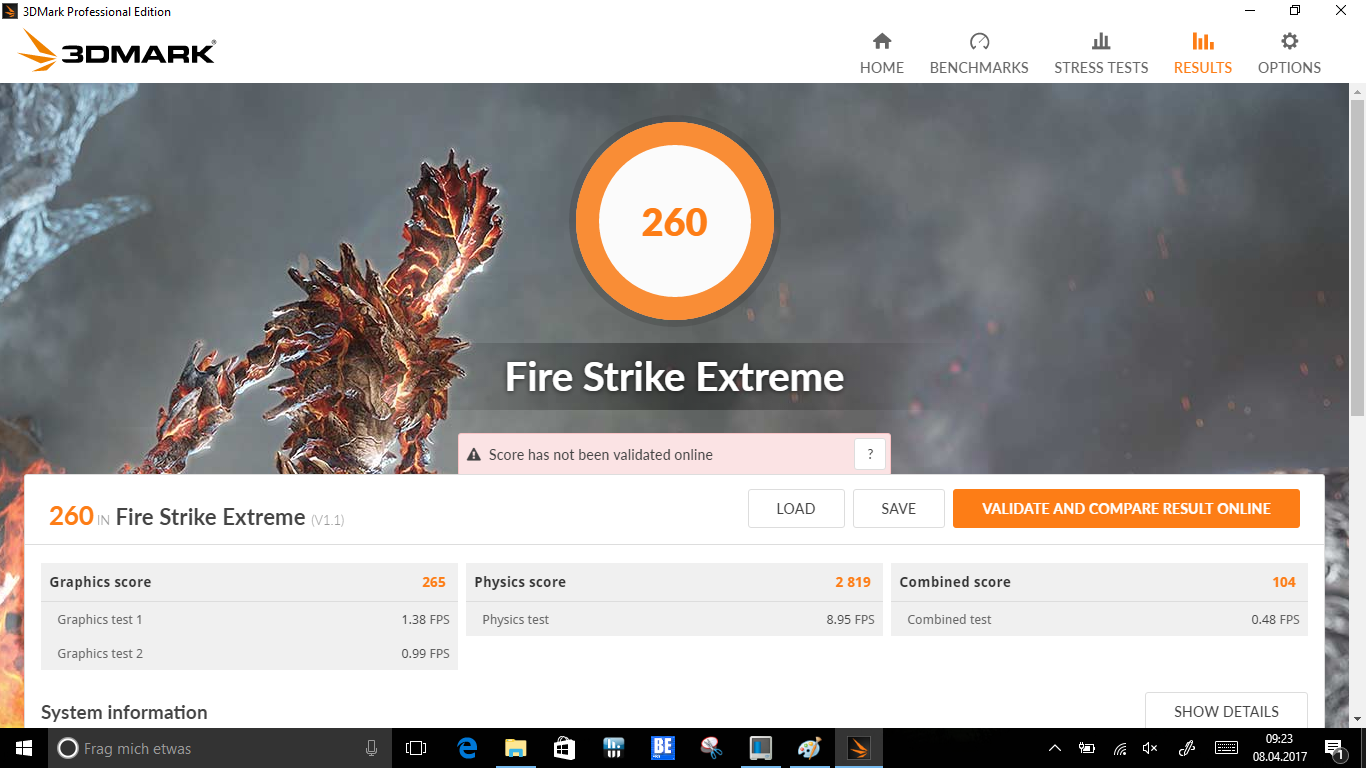
| 3DMark Fire Strike Extreme Score | 260 pontos | |
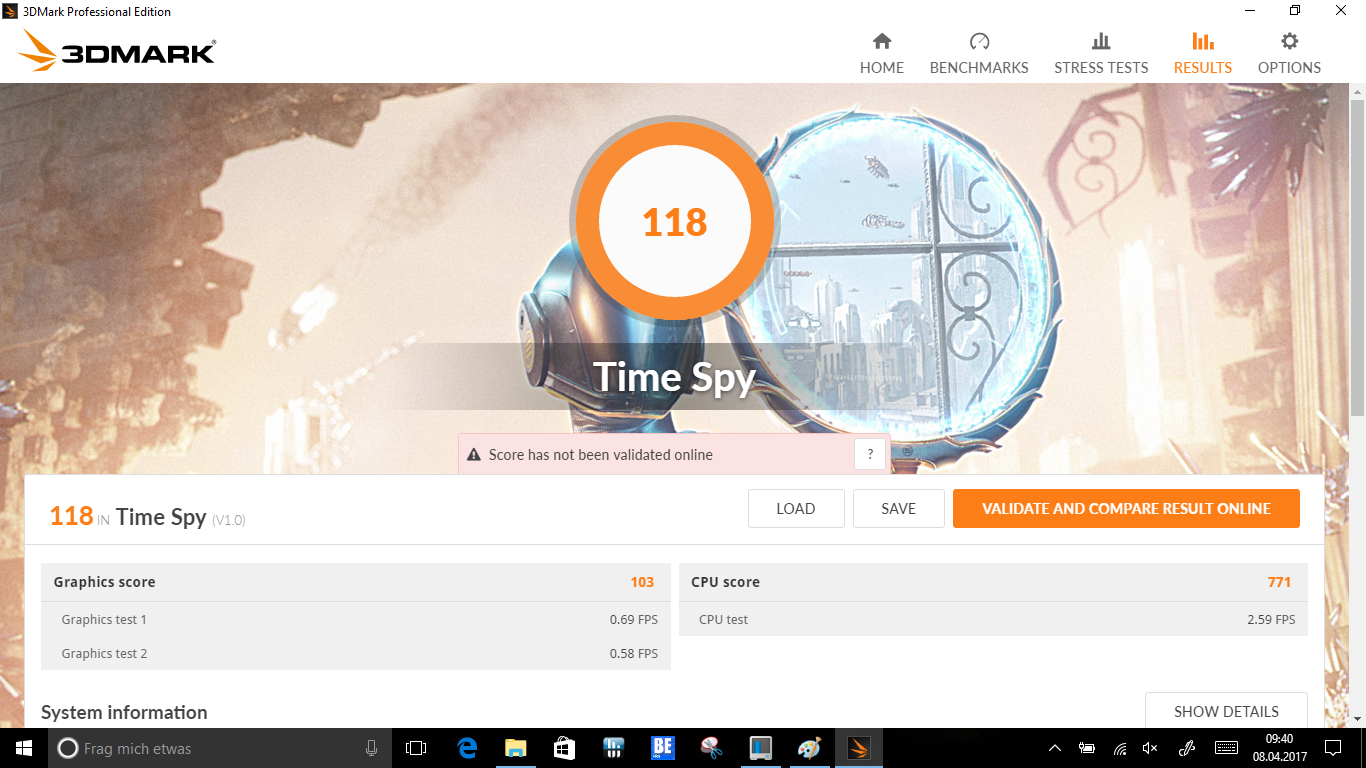
| 3DMark Time Spy Score | 118 pontos | |
Ajuda | ||
| baixo | média | alto | ultra | |
|---|---|---|---|---|
| BioShock Infinite (2013) | 30.6 | 17.3 | 15.1 | |
| Battlefield 4 (2013) | 20.9 | 15.2 | 9.5 | |
| Rise of the Tomb Raider (2016) | 6.1 | 4 |
| Dell Latitude 3189 Pentium N4200, HD Graphics 505 | Medion Akoya P3401T 2in1 6Y54, HD Graphics 515 | HP Pavilion 11-k103ng x360 N3050, HD Graphics (Braswell) | HP Pavilion x360 13-u102ng i5-7200U, HD Graphics 620 | Lenovo Yoga 700-11ISK 6Y30, HD Graphics 515 | Acer Aspire Switch Alpha 12 SA5-271-56HM 6200U, HD Graphics 520 | |
|---|---|---|---|---|---|---|
| Emissions | ||||||
| Fan Noise (dB(A)) | 37.3 |

(±) A temperatura máxima no lado superior é 43.3 °C / 110 F, em comparação com a média de 35.4 °C / 96 F , variando de 19.6 a 60 °C para a classe Convertible.
(-) A parte inferior aquece até um máximo de 54.9 °C / 131 F, em comparação com a média de 36.9 °C / 98 F
(+) Em uso inativo, a temperatura média para o lado superior é 26 °C / 79 F, em comparação com a média do dispositivo de 30.3 °C / ### class_avg_f### F.
(±) Os apoios para as mãos e o touchpad podem ficar muito quentes ao toque, com um máximo de 37.9 °C / 100.2 F.
(-) A temperatura média da área do apoio para as mãos de dispositivos semelhantes foi 28 °C / 82.4 F (-9.9 °C / -17.8 F).
| Dell Latitude 3189 Pentium N4200, HD Graphics 505 | Medion Akoya P3401T 2in1 6Y54, HD Graphics 515 | HP Pavilion 11-k103ng x360 N3050, HD Graphics (Braswell) | HP Pavilion x360 13-u102ng i5-7200U, HD Graphics 620 | Lenovo Yoga 700-11ISK 6Y30, HD Graphics 515 | Acer Aspire Switch Alpha 12 SA5-271-56HM 6200U, HD Graphics 520 | |
|---|---|---|---|---|---|---|
| Heat | 12% | -17% | 15% | -1% | -3% | |
| Maximum Upper Side * (°C) | 43.3 | 38.1 12% | 44.6 -3% | 34.6 20% | 36.8 15% | 46.7 -8% |
| Maximum Bottom * (°C) | 54.9 | 41.7 24% | 53.1 3% | 36.4 34% | 42 23% | 51 7% |
| Idle Upper Side * (°C) | 27.5 | 27.9 -1% | 35.2 -28% | 26.6 3% | 32.1 -17% | 29.5 -7% |
| Idle Bottom * (°C) | 27.9 | 24.1 14% | 38.6 -38% | 27.7 1% | 34.4 -23% | 28.6 -3% |
* ... menor é melhor
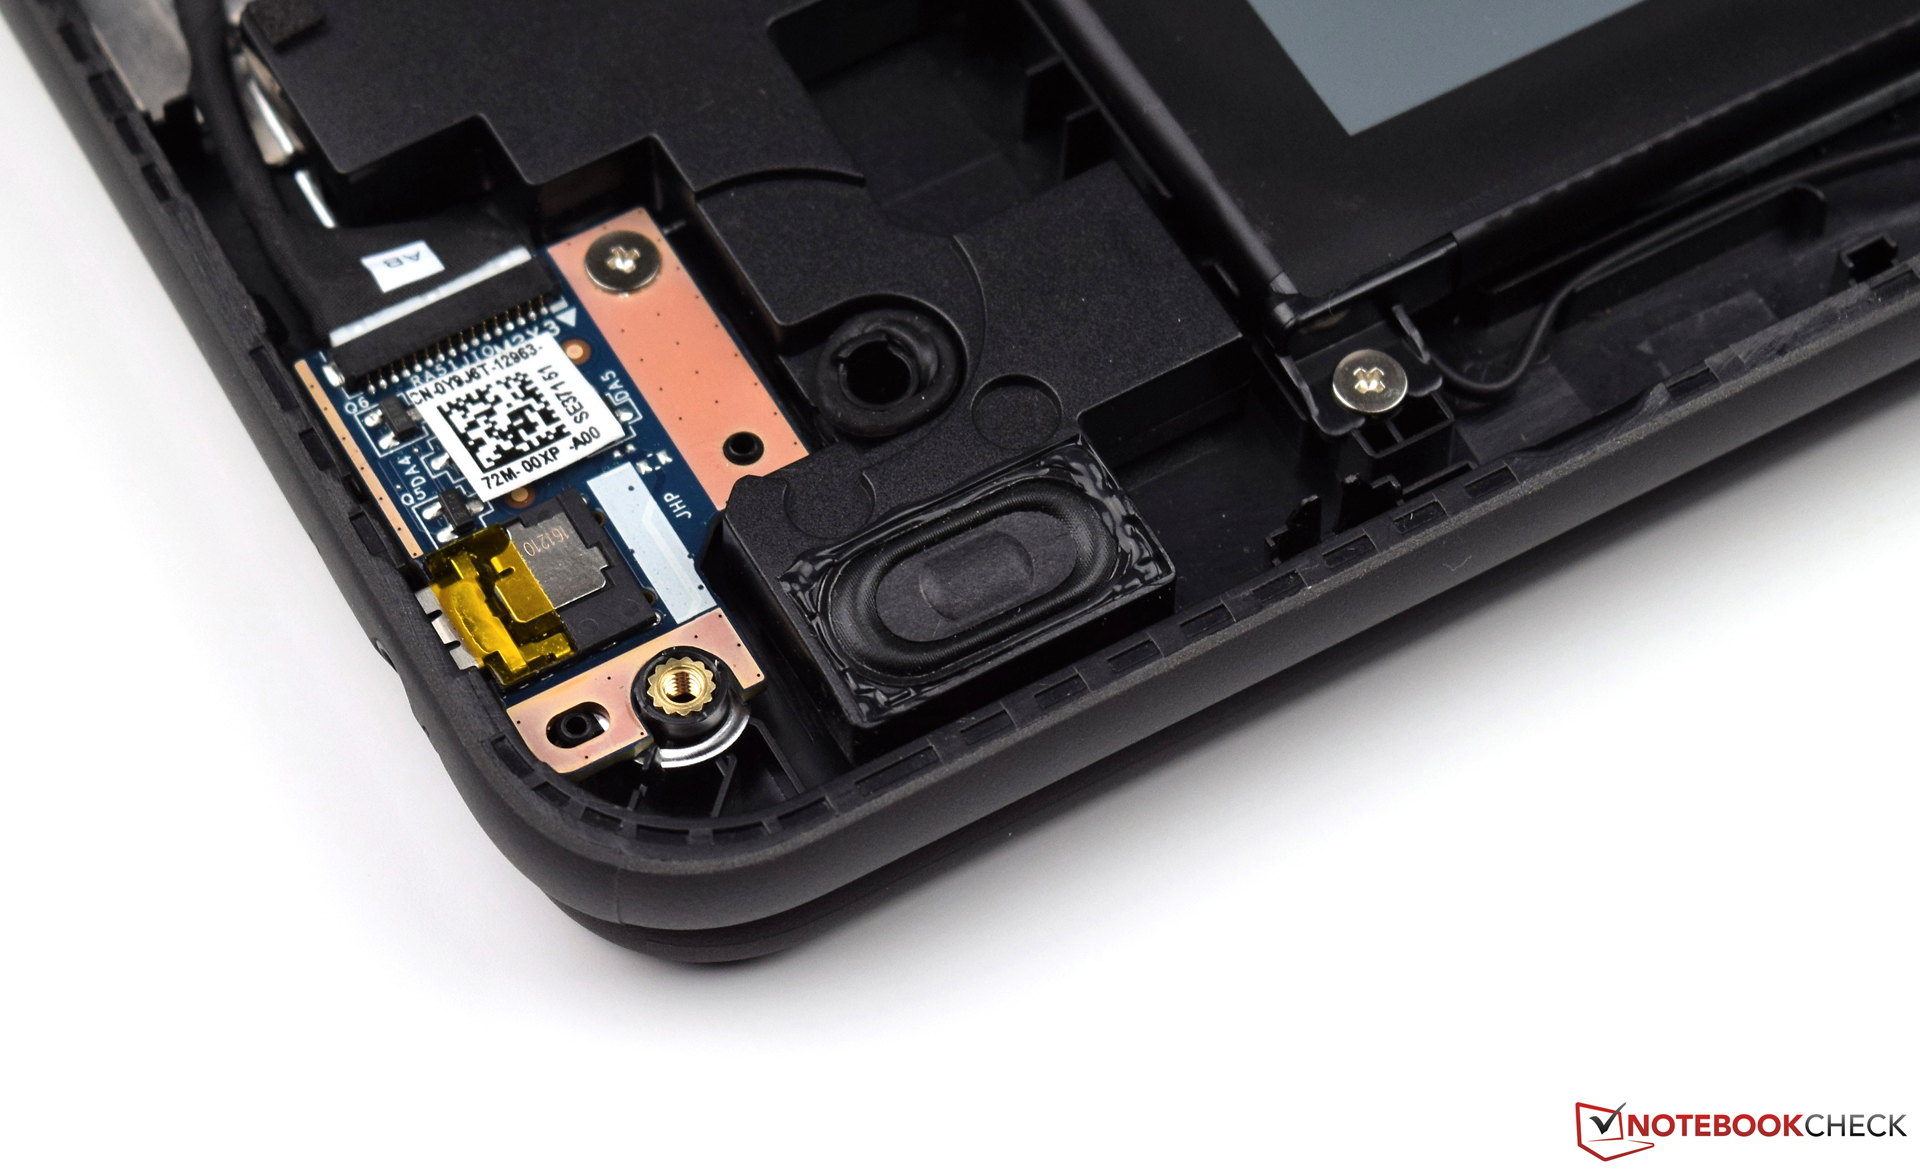
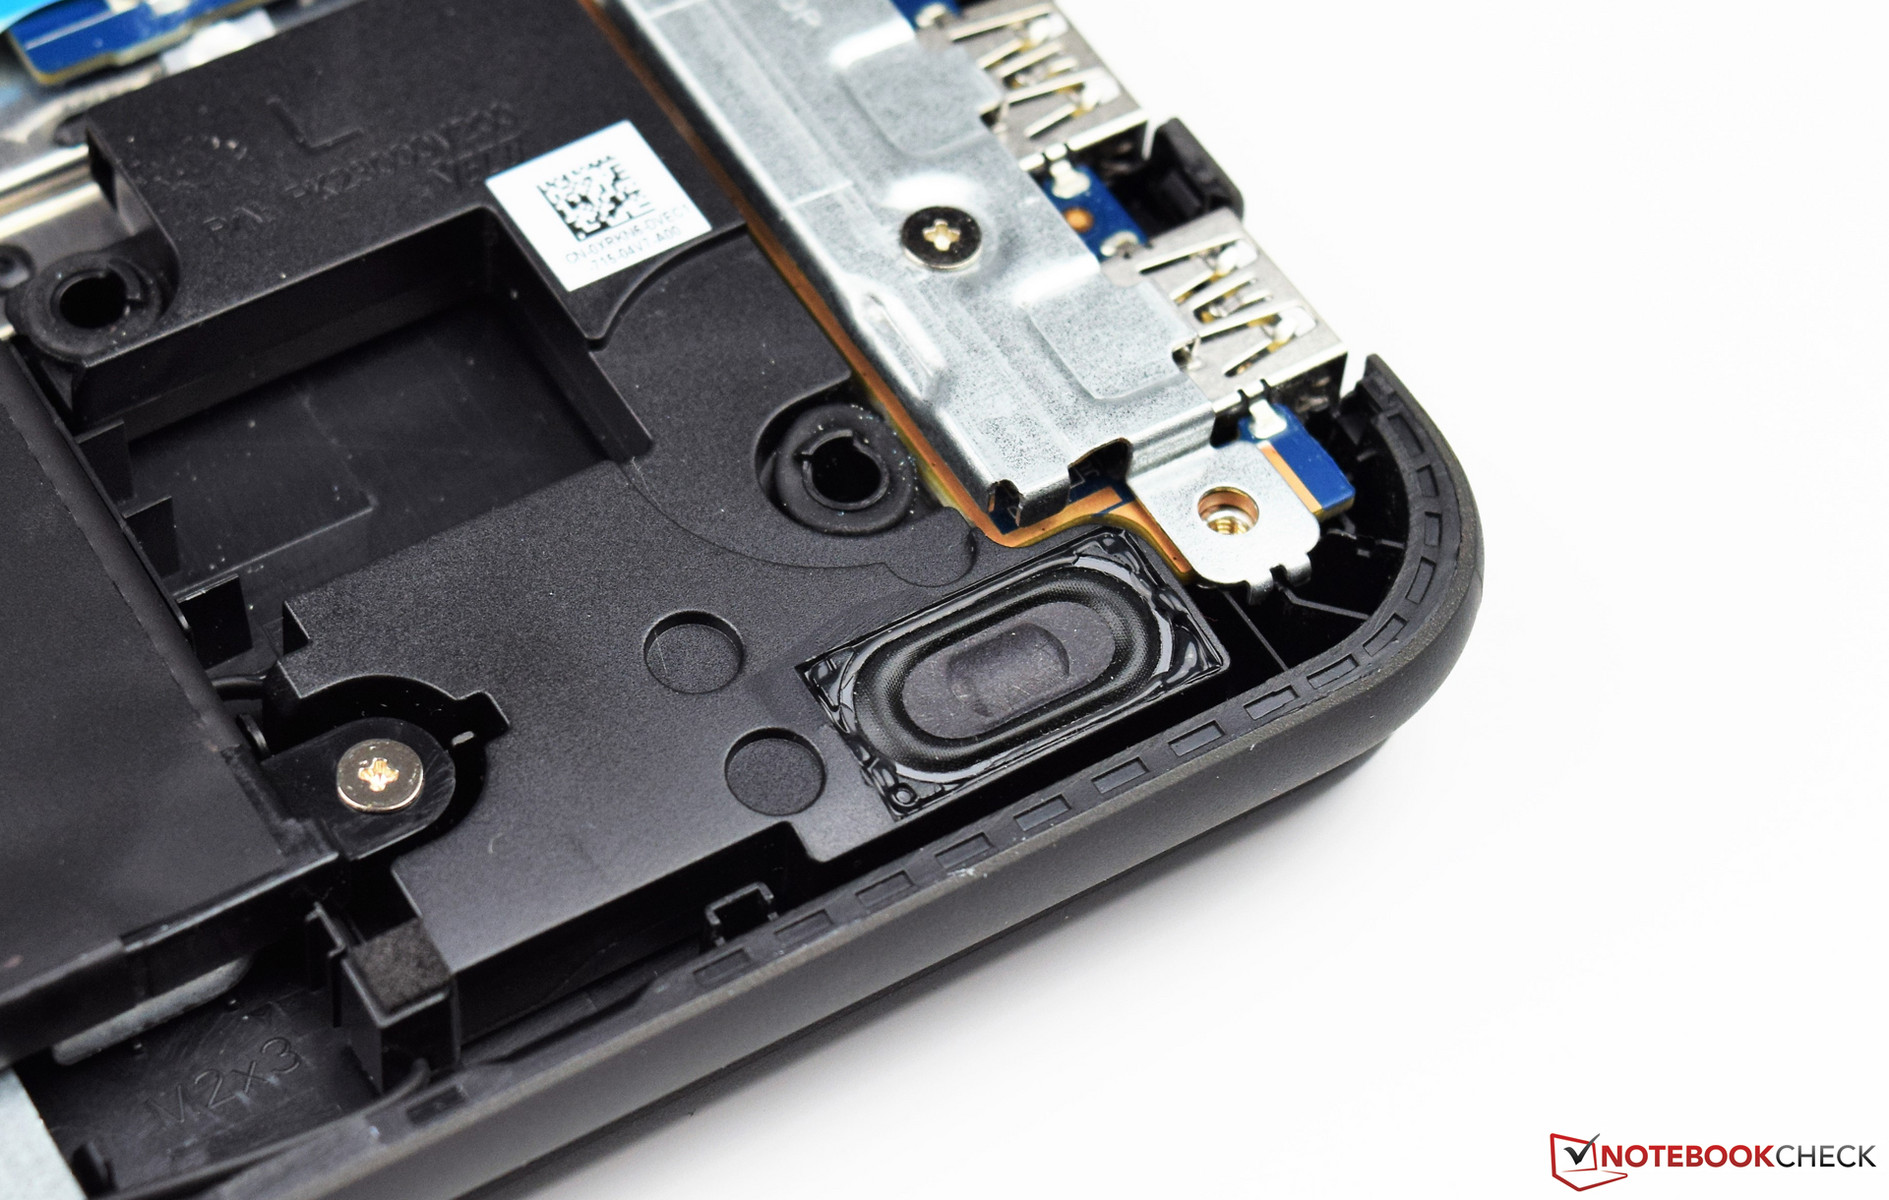
Dell Latitude 3189 análise de áudio
(+) | os alto-falantes podem tocar relativamente alto (###valor### dB)
Graves 100 - 315Hz
(-) | quase nenhum baixo - em média 23.3% menor que a mediana
(±) | a linearidade dos graves é média (8.3% delta para a frequência anterior)
Médios 400 - 2.000 Hz
(±) | médios reduzidos - em média 5% menor que a mediana
(±) | a linearidade dos médios é média (8.1% delta para frequência anterior)
Altos 2 - 16 kHz
(+) | agudos equilibrados - apenas 4.5% longe da mediana
(+) | os máximos são lineares (6.5% delta da frequência anterior)
Geral 100 - 16.000 Hz
(±) | a linearidade do som geral é média (19.2% diferença em relação à mediana)
Comparado com a mesma classe
» 46% de todos os dispositivos testados nesta classe foram melhores, 7% semelhantes, 47% piores
» O melhor teve um delta de 6%, a média foi 20%, o pior foi 57%
Comparado com todos os dispositivos testados
» 46% de todos os dispositivos testados foram melhores, 7% semelhantes, 46% piores
» O melhor teve um delta de 4%, a média foi 23%, o pior foi 134%
Apple MacBook 12 (Early 2016) 1.1 GHz análise de áudio
(+) | os alto-falantes podem tocar relativamente alto (###valor### dB)
Graves 100 - 315Hz
(±) | graves reduzidos - em média 11.3% menor que a mediana
(±) | a linearidade dos graves é média (14.2% delta para a frequência anterior)
Médios 400 - 2.000 Hz
(+) | médios equilibrados - apenas 2.4% longe da mediana
(+) | médios são lineares (5.5% delta para frequência anterior)
Altos 2 - 16 kHz
(+) | agudos equilibrados - apenas 2% longe da mediana
(+) | os máximos são lineares (4.5% delta da frequência anterior)
Geral 100 - 16.000 Hz
(+) | o som geral é linear (10.2% diferença em relação à mediana)
Comparado com a mesma classe
» 7% de todos os dispositivos testados nesta classe foram melhores, 2% semelhantes, 90% piores
» O melhor teve um delta de 5%, a média foi 18%, o pior foi 53%
Comparado com todos os dispositivos testados
» 5% de todos os dispositivos testados foram melhores, 1% semelhantes, 94% piores
» O melhor teve um delta de 4%, a média foi 23%, o pior foi 134%
| desligado | |
| Ocioso | |
| Carga |
|
Key:
min: | |
| Dell Latitude 3189 Pentium N4200, HD Graphics 505, Liteonit CV3-8D128, IPS, 1366x768, 11.6" | Medion Akoya P3401T 2in1 6Y54, HD Graphics 515, , IPS, 1920x1080, 12.5" | HP Pavilion 11-k103ng x360 N3050, HD Graphics (Braswell), Hitachi Travelstar Z5K500 HTS545050A7E680, IPS, 1366x768, 11.6" | HP Pavilion x360 13-u102ng i5-7200U, HD Graphics 620, HGST Travelstar 5K1000 HTS541010A7E630, IPS, 1920x1080, 13.3" | Lenovo Yoga 700-11ISK 6Y30, HD Graphics 515, Samsung SSD PM871 MZNLN256HCHP, IPS, 1920x1080, 11.6" | Acer Aspire Switch Alpha 12 SA5-271-56HM 6200U, HD Graphics 520, Kingston RBU-SNS8152S3256GG2, IPS, 2160x1440, 12" | |
|---|---|---|---|---|---|---|
| Power Consumption | -37% | -45% | -66% | -29% | -105% | |
| Idle Minimum * (Watt) | 2.17 | 3.8 -75% | 5.3 -144% | 4.7 -117% | 4.3 -98% | 7.3 -236% |
| Idle Average * (Watt) | 4.31 | 7.1 -65% | 7.1 -65% | 7.2 -67% | 7.1 -65% | 10 -132% |
| Idle Maximum * (Watt) | 5.79 | 8.1 -40% | 8.2 -42% | 7.9 -36% | 7.2 -24% | 10.15 -75% |
| Load Average * (Watt) | 15.8 | 19.1 -21% | 15.5 2% | 30 -90% | 14.6 8% | 25.2 -59% |
| Load Maximum * (Watt) | 24.2 | 20.2 17% | 18.9 22% | 29 -20% | 15.7 35% | 29.3 -21% |
* ... menor é melhor

| Dell Latitude 3189 Pentium N4200, HD Graphics 505, 42 Wh | Medion Akoya P3401T 2in1 6Y54, HD Graphics 515, 51 Wh | HP Pavilion 11-k103ng x360 N3050, HD Graphics (Braswell), 32 Wh | HP Pavilion x360 13-u102ng i5-7200U, HD Graphics 620, 41 Wh | Lenovo Yoga 700-11ISK 6Y30, HD Graphics 515, 40 Wh | Acer Aspire Switch Alpha 12 SA5-271-56HM 6200U, HD Graphics 520, 37 Wh | |
|---|---|---|---|---|---|---|
| Duração da bateria | -28% | -52% | -52% | -21% | -40% | |
| Reader / Idle (h) | 22 | 9.3 -58% | 14.4 -35% | 10.7 -51% | ||
| H.264 (h) | 8.4 | 5.3 -37% | 7.7 -8% | 7.8 -7% | ||
| WiFi v1.3 (h) | 10.1 | 7.3 -28% | 4.8 -52% | 5.4 -47% | 7 -31% | 5.4 -47% |
| Load (h) | 4.2 | 1.4 -67% | 3.8 -10% | 1.9 -55% |
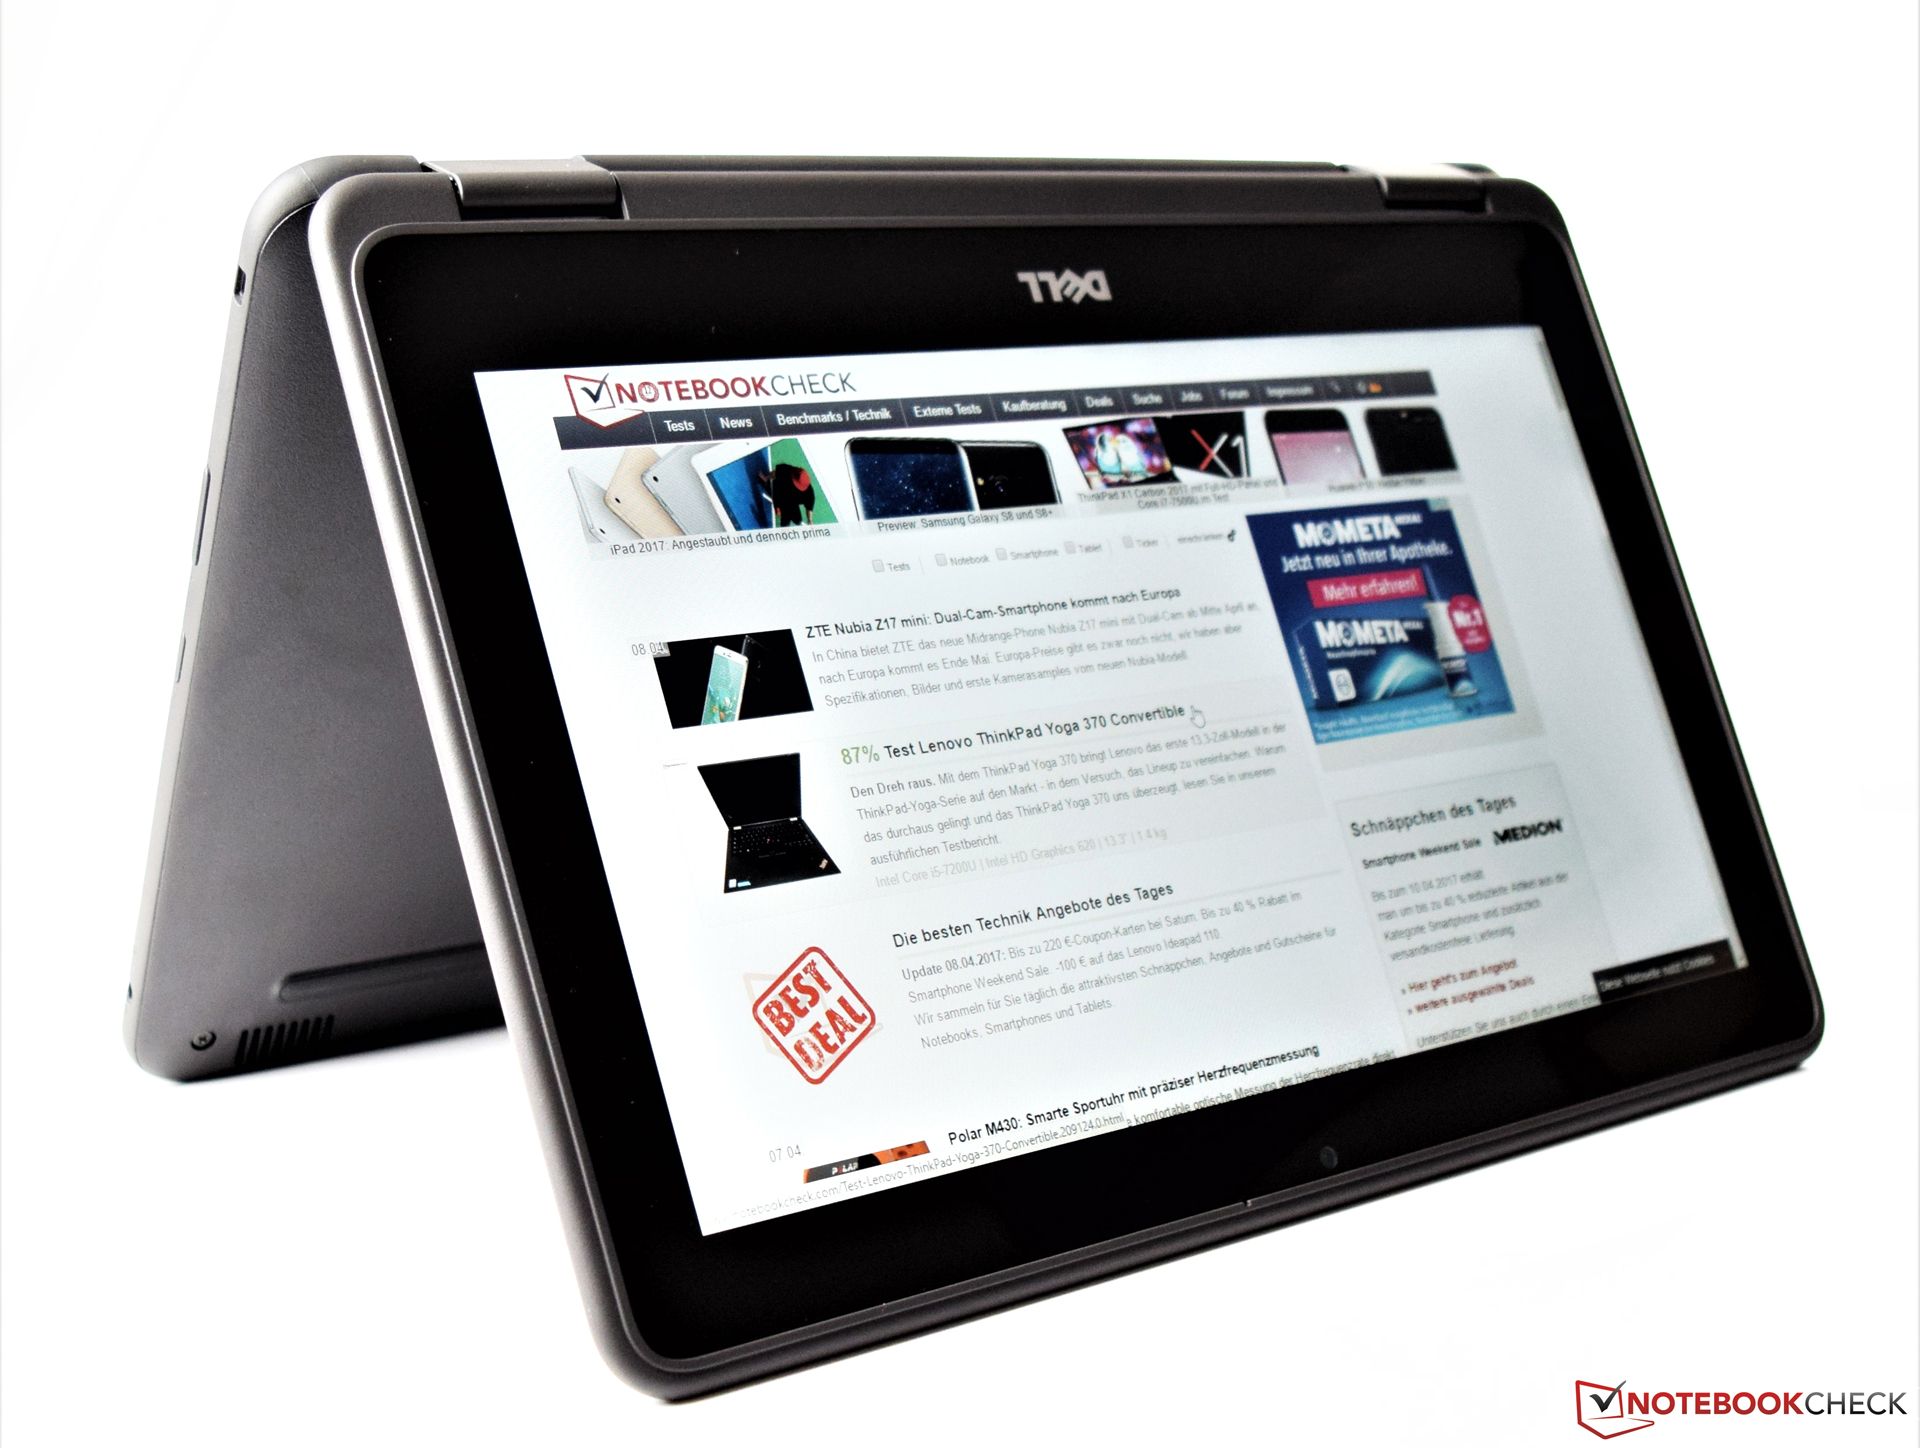
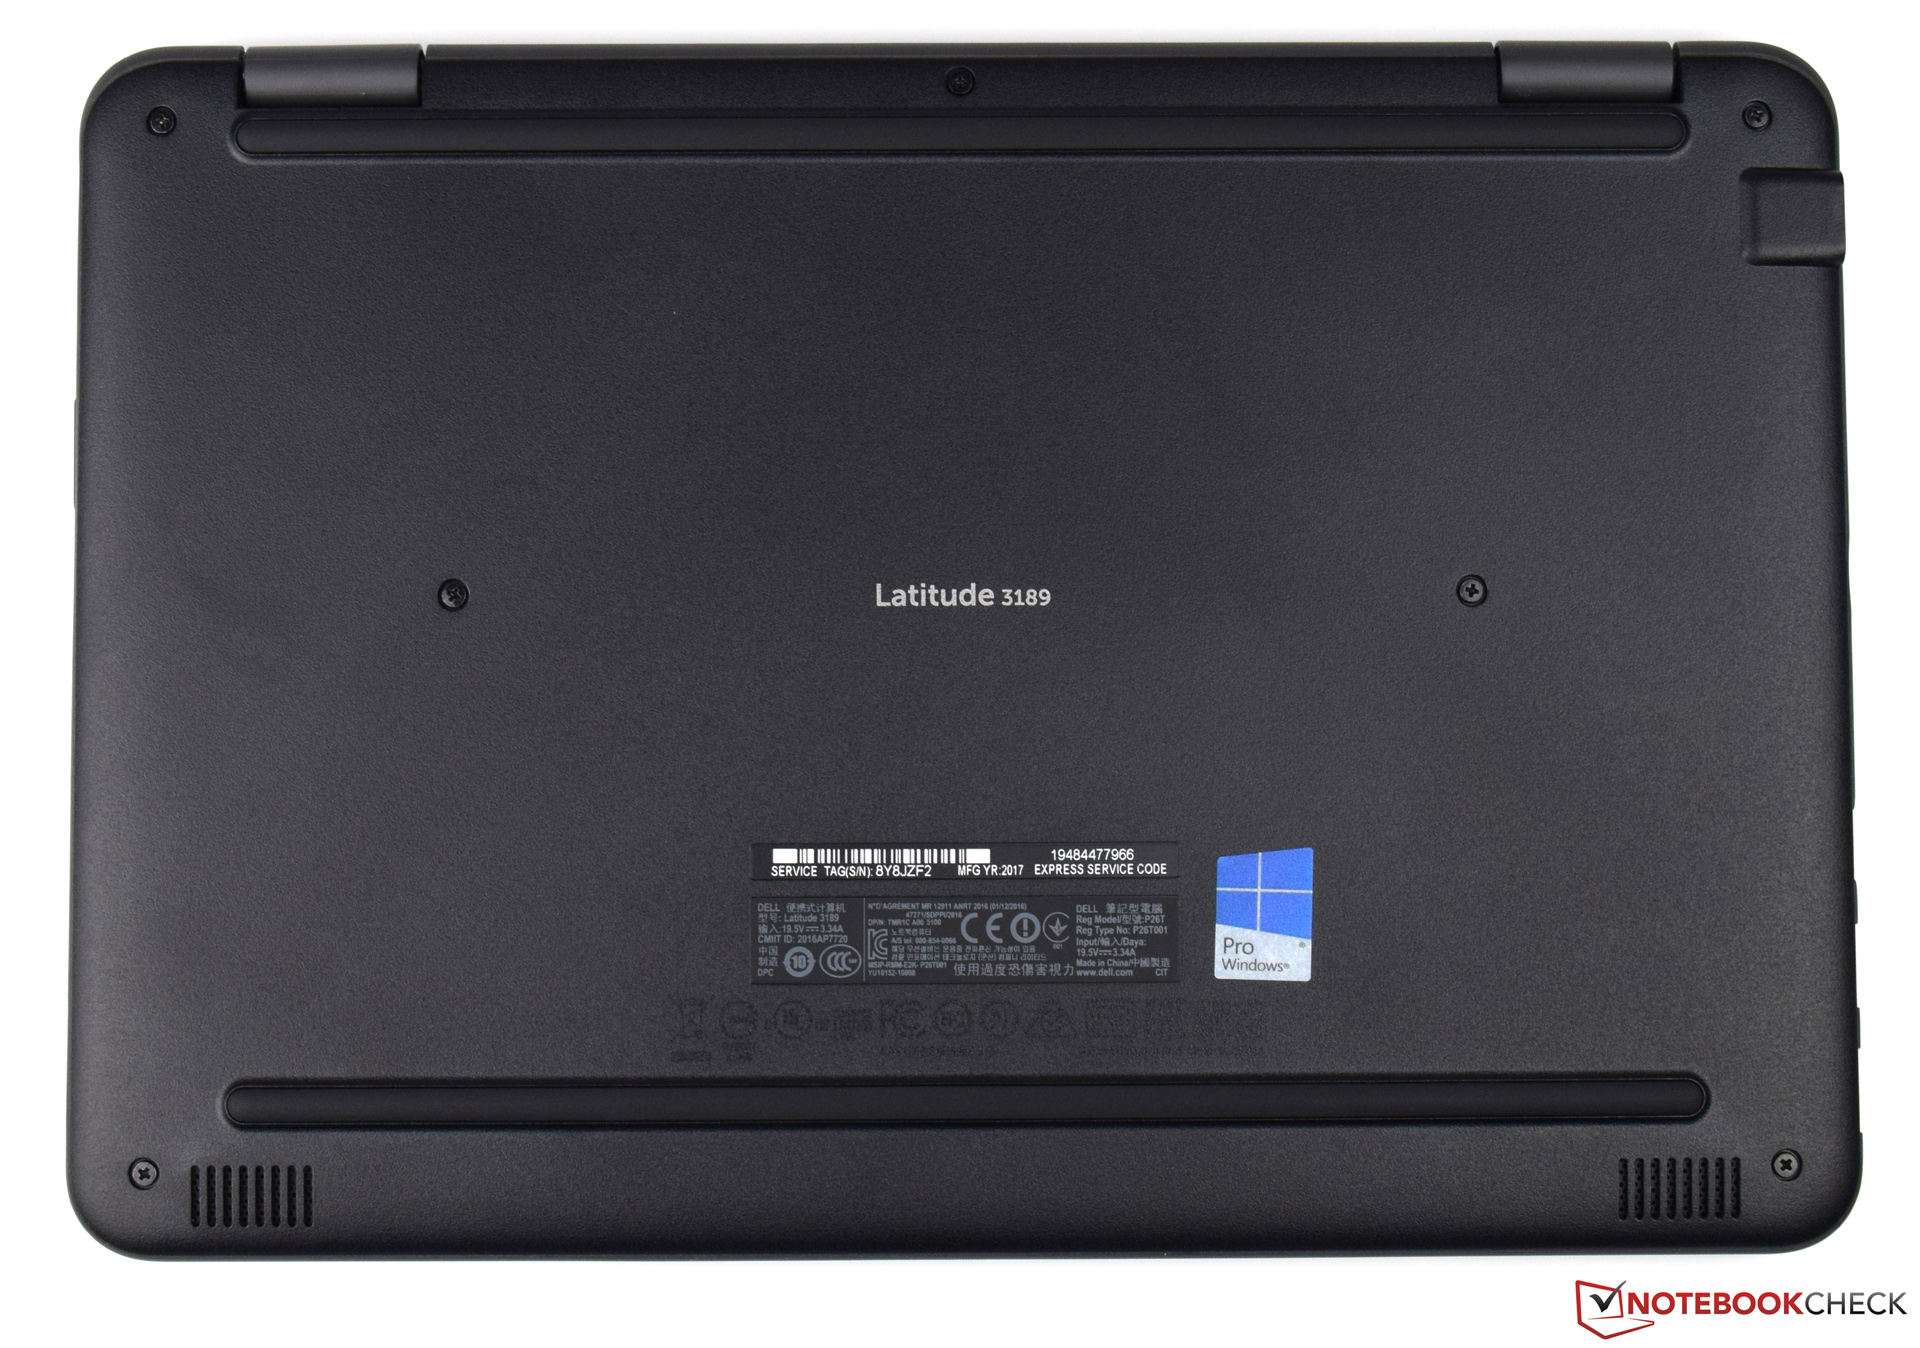
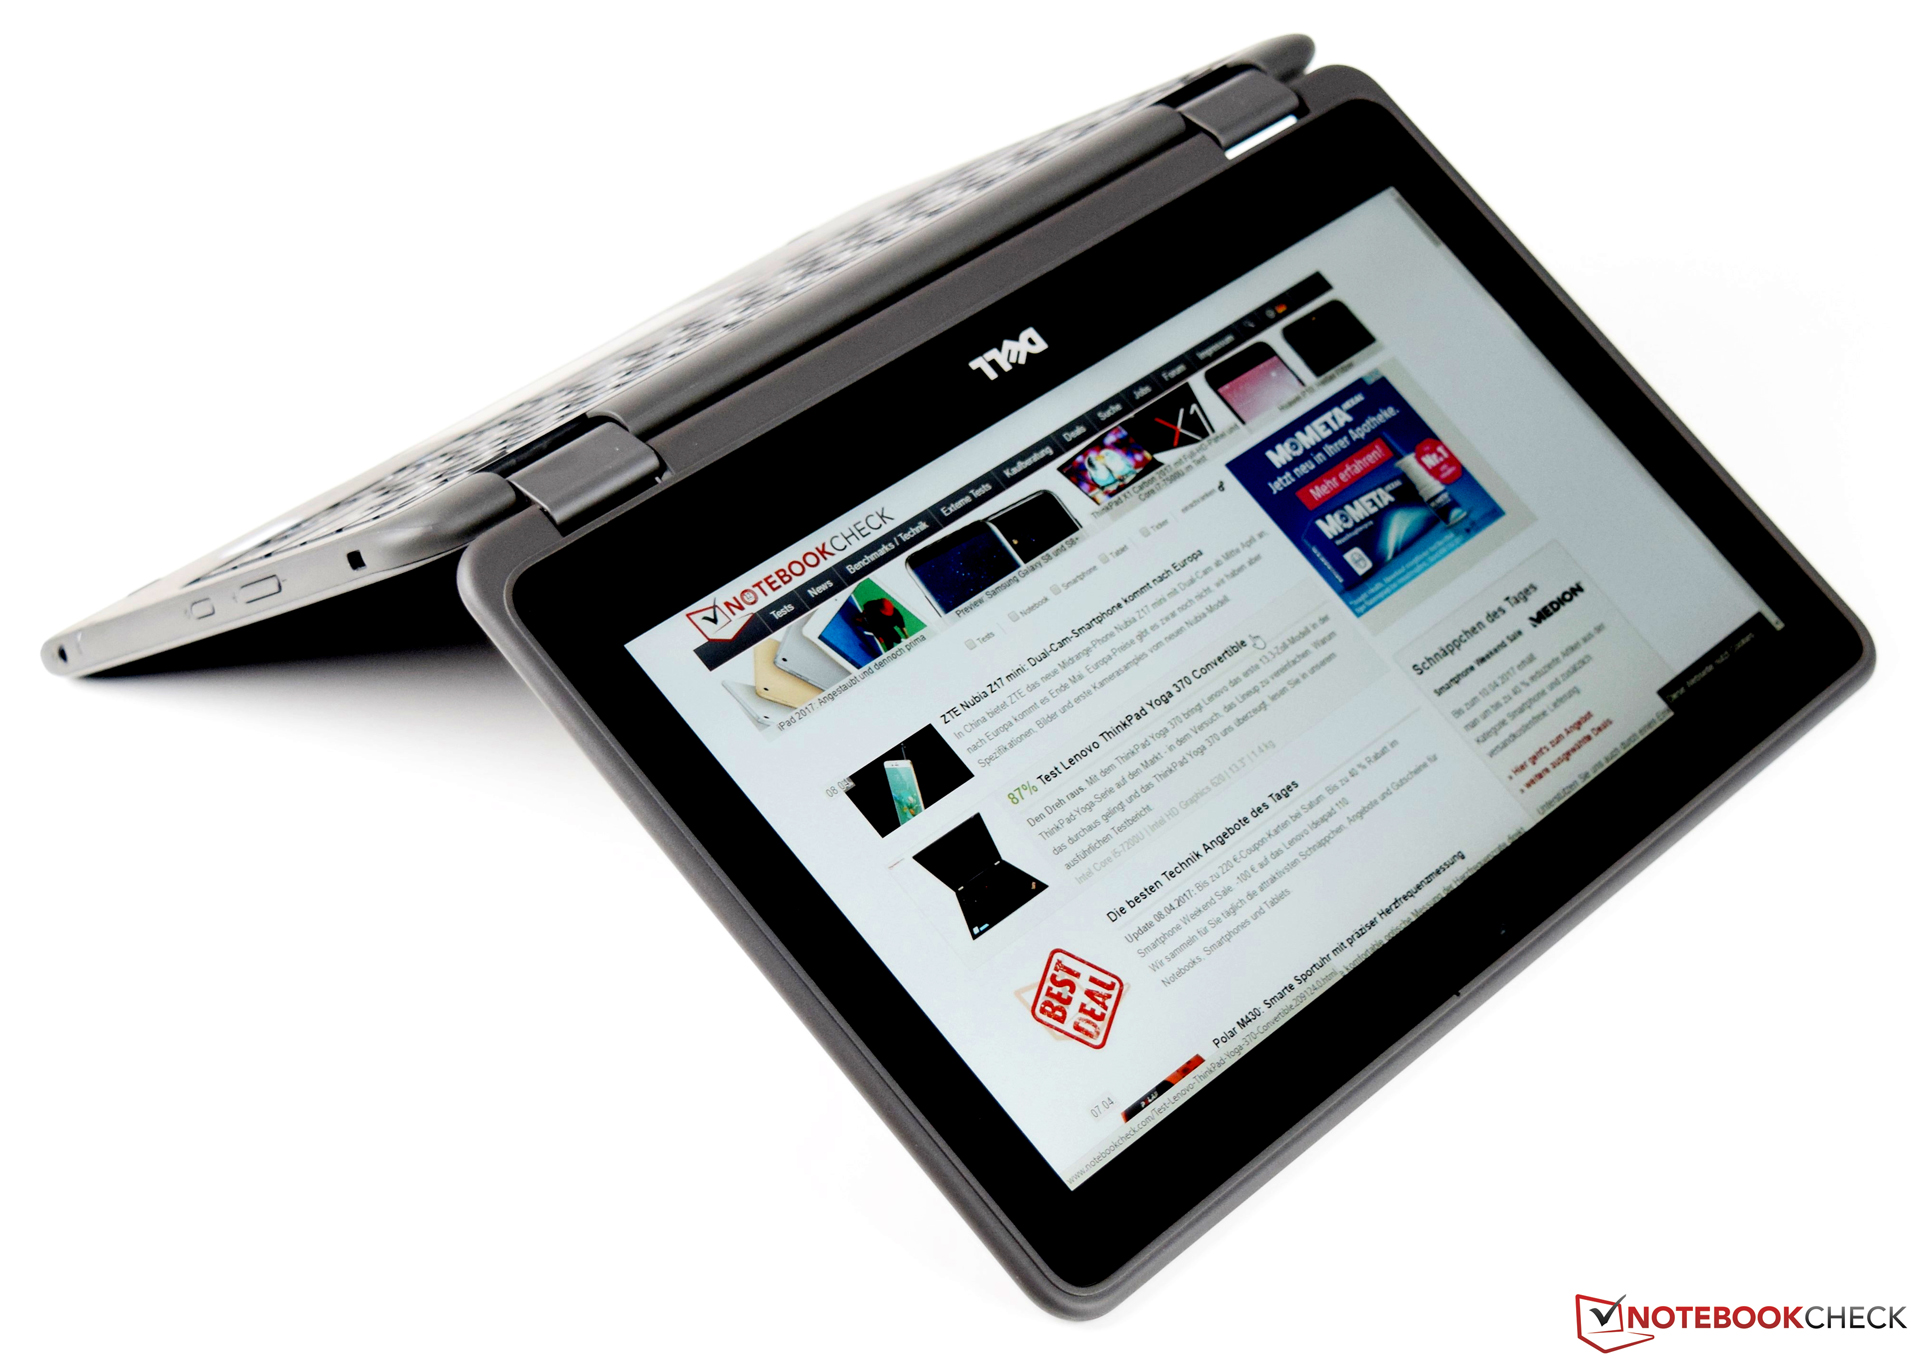
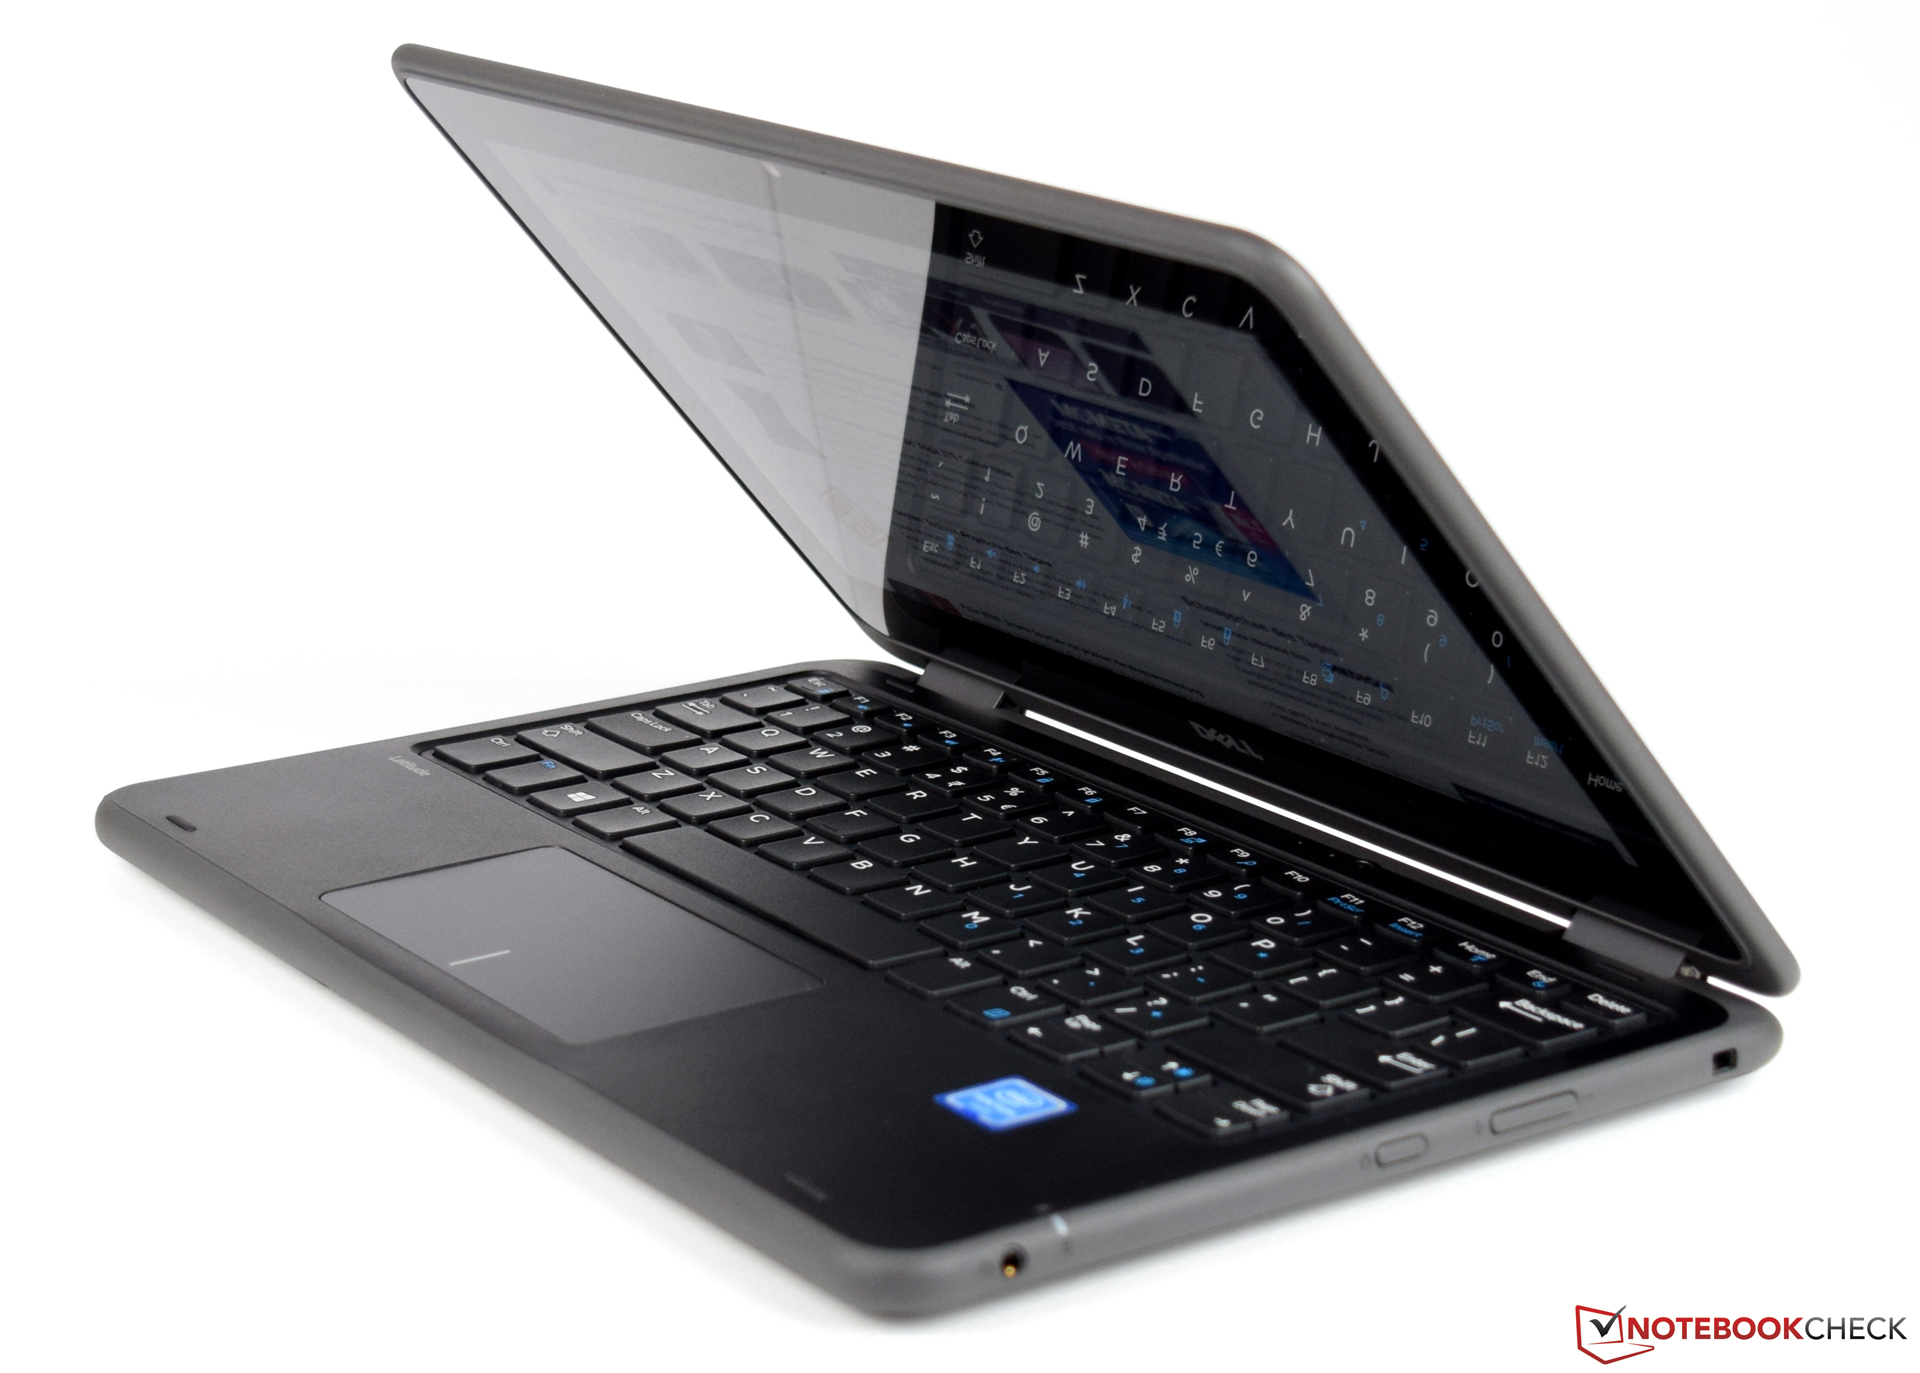
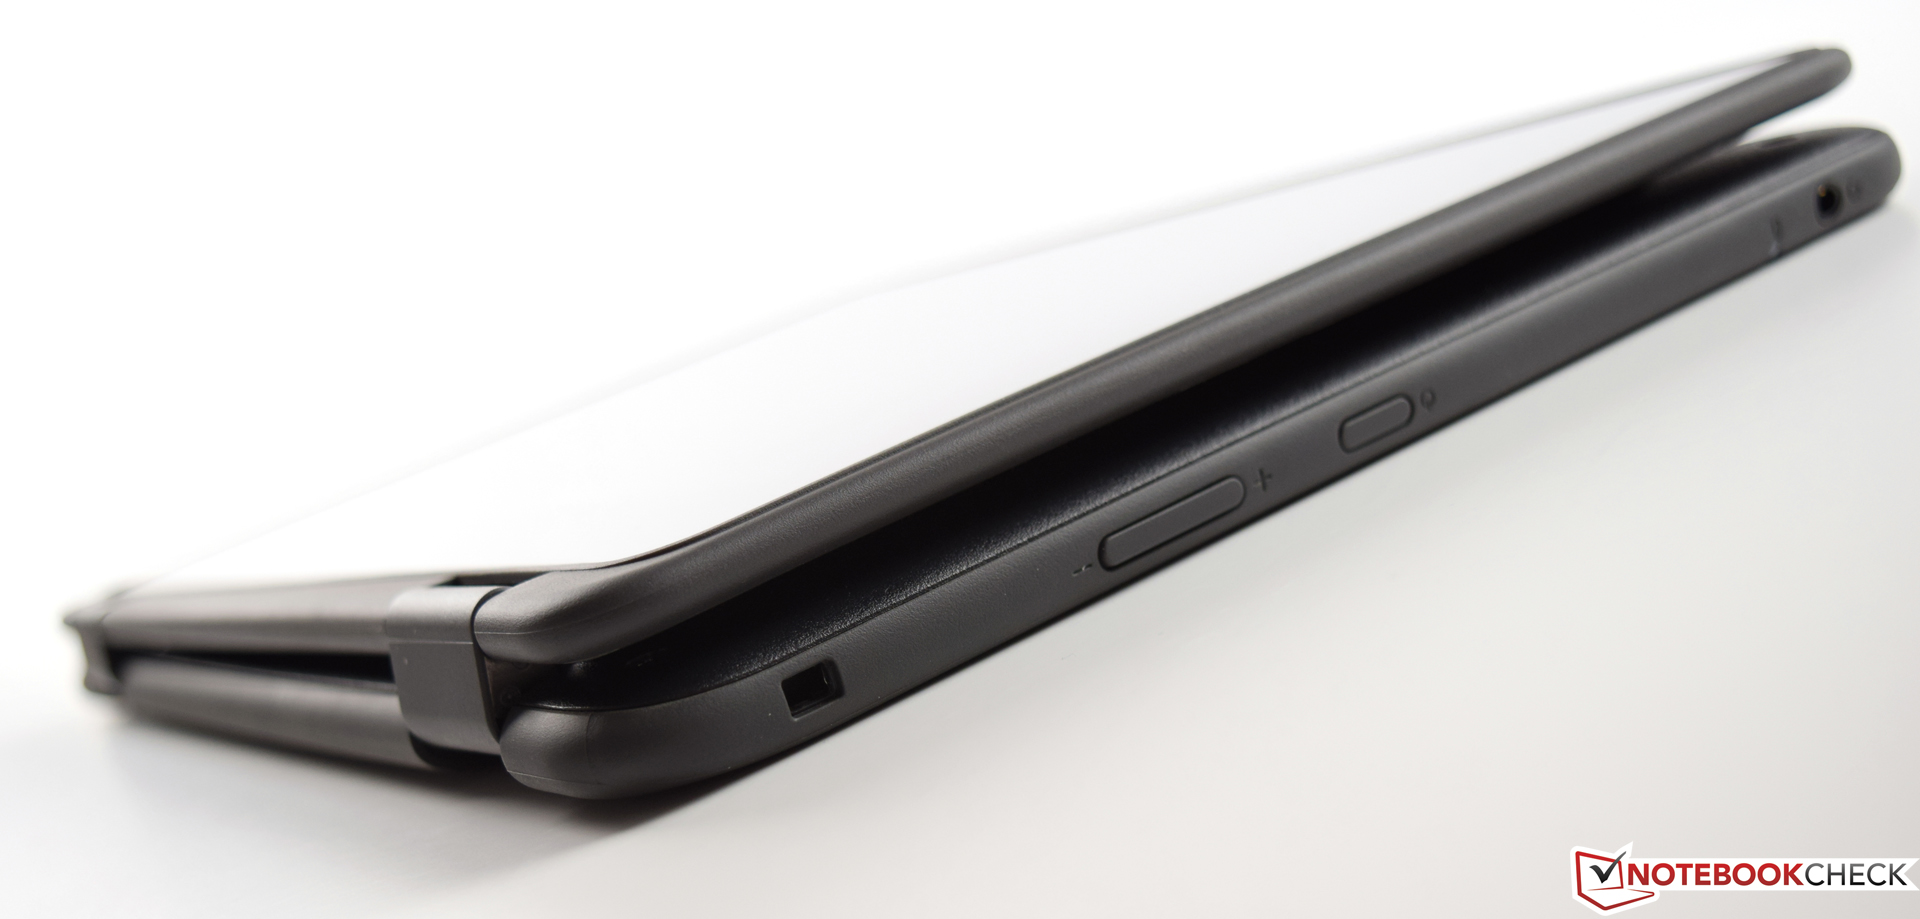
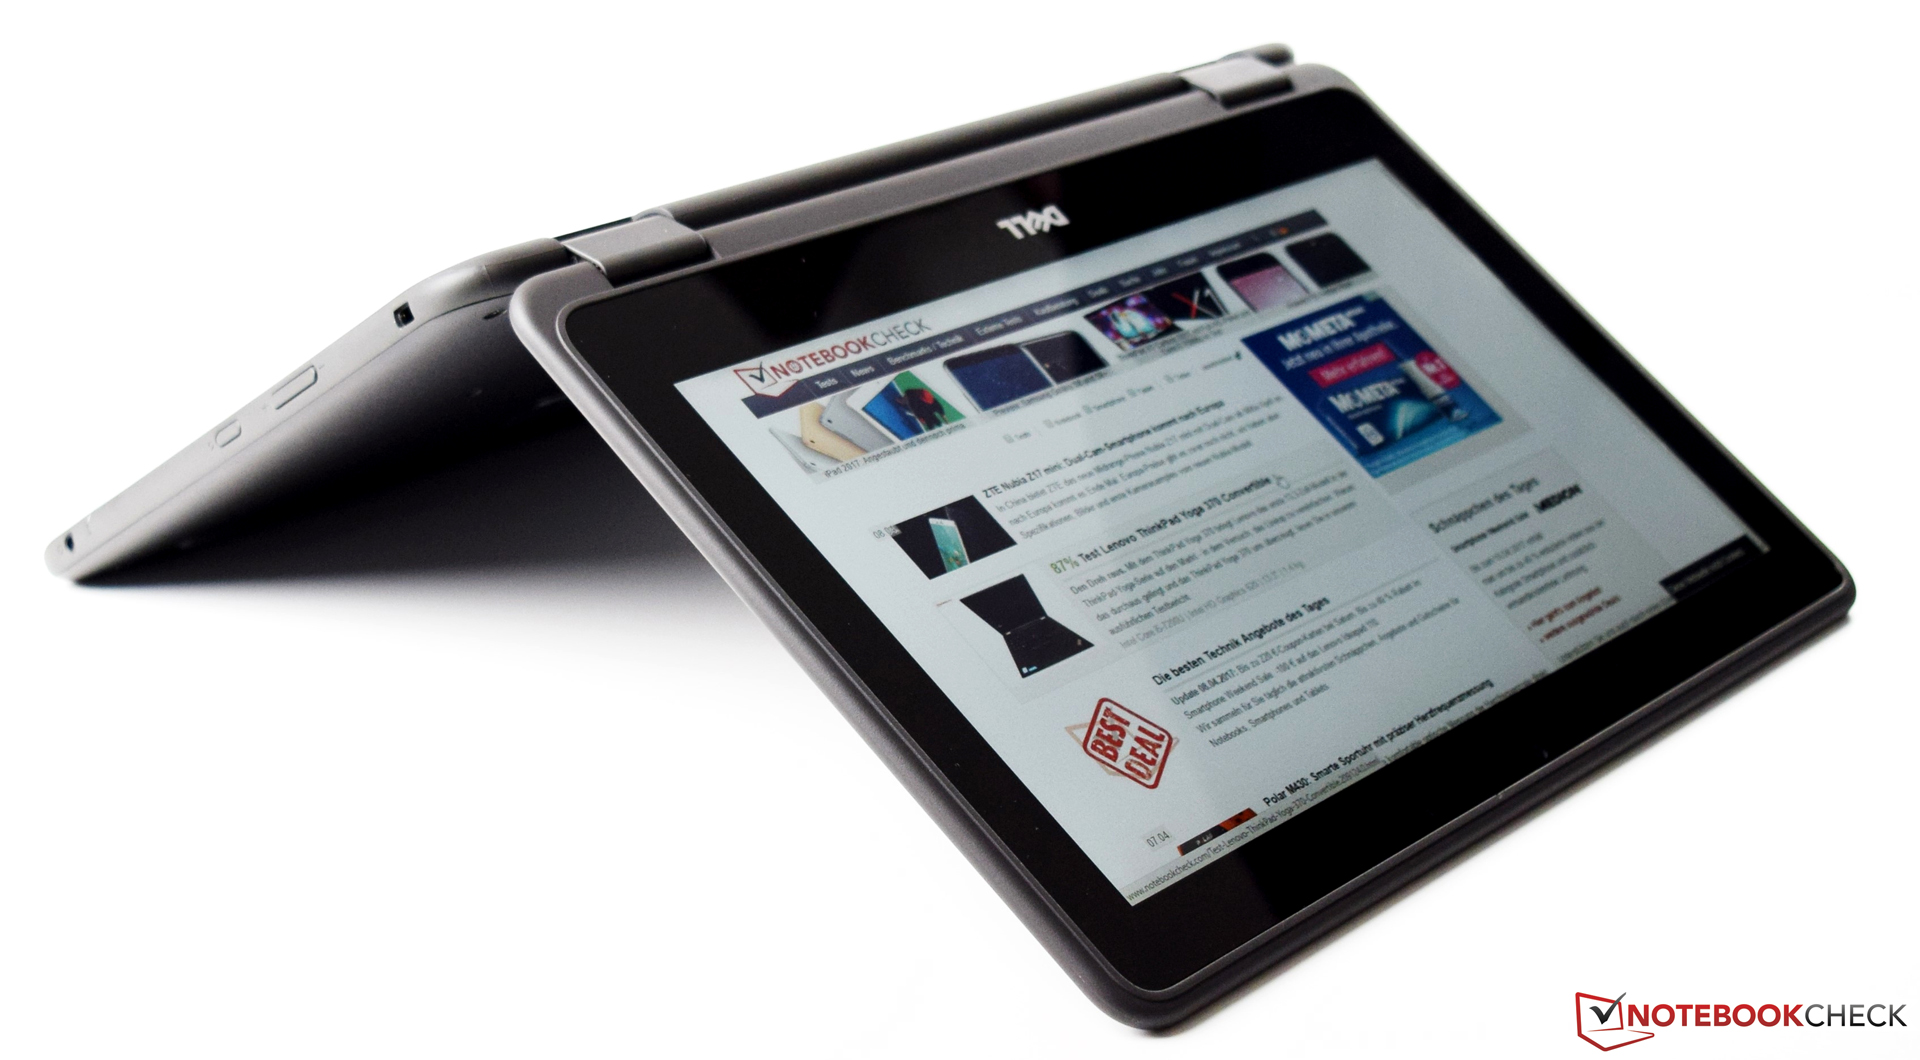
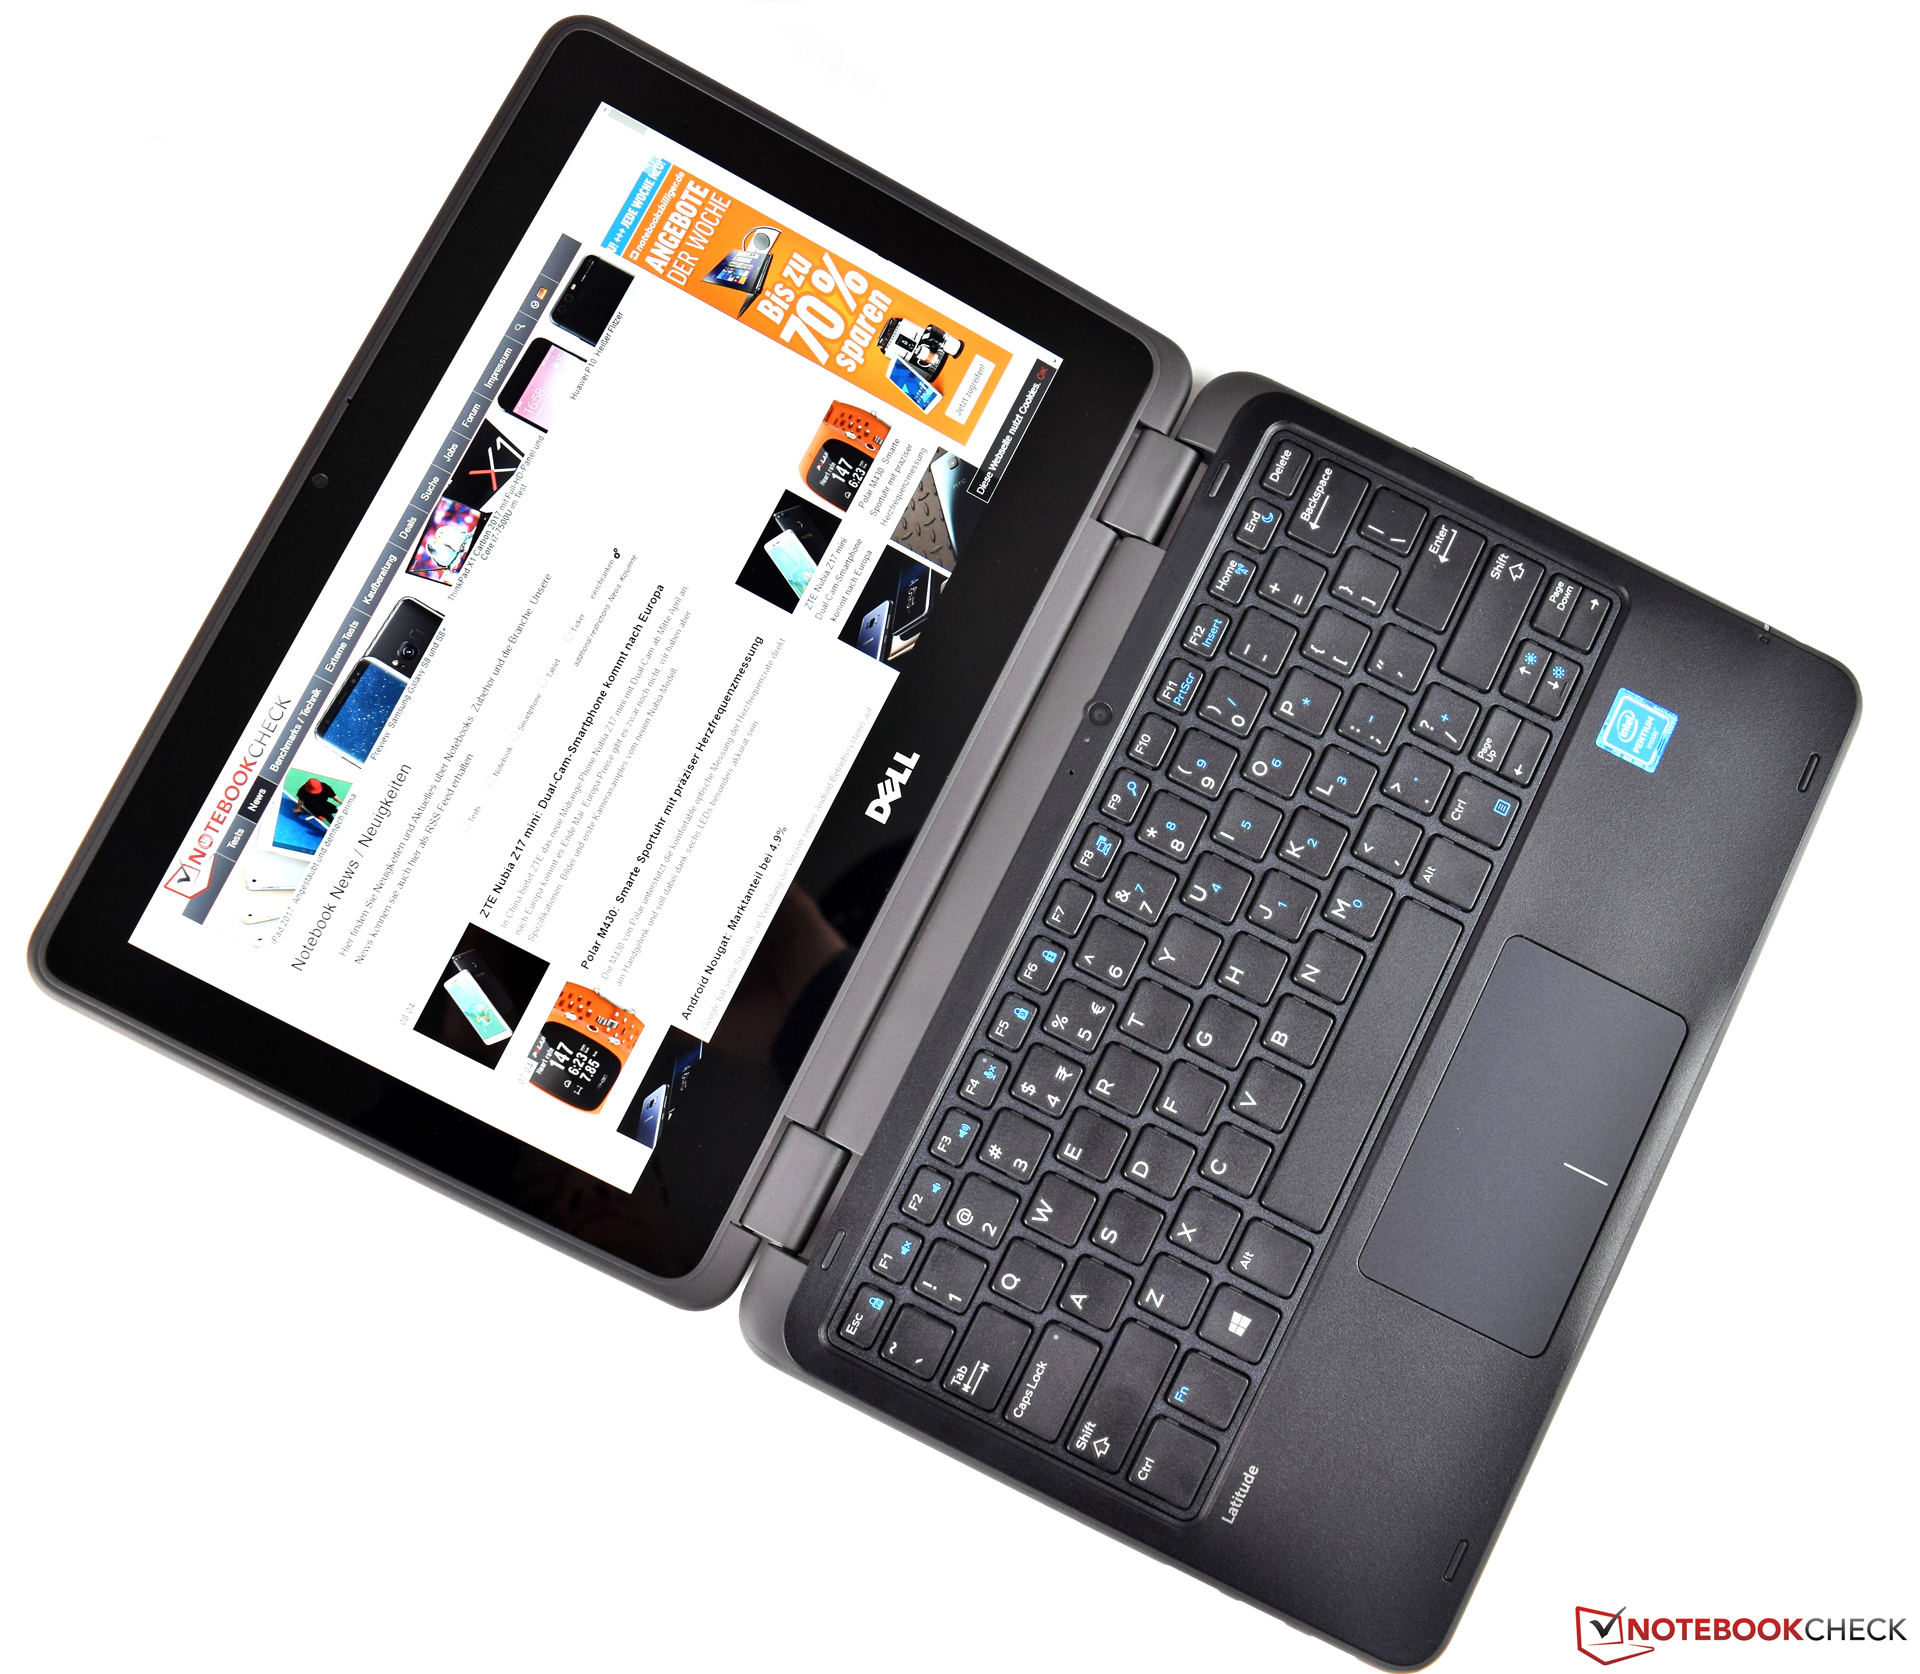
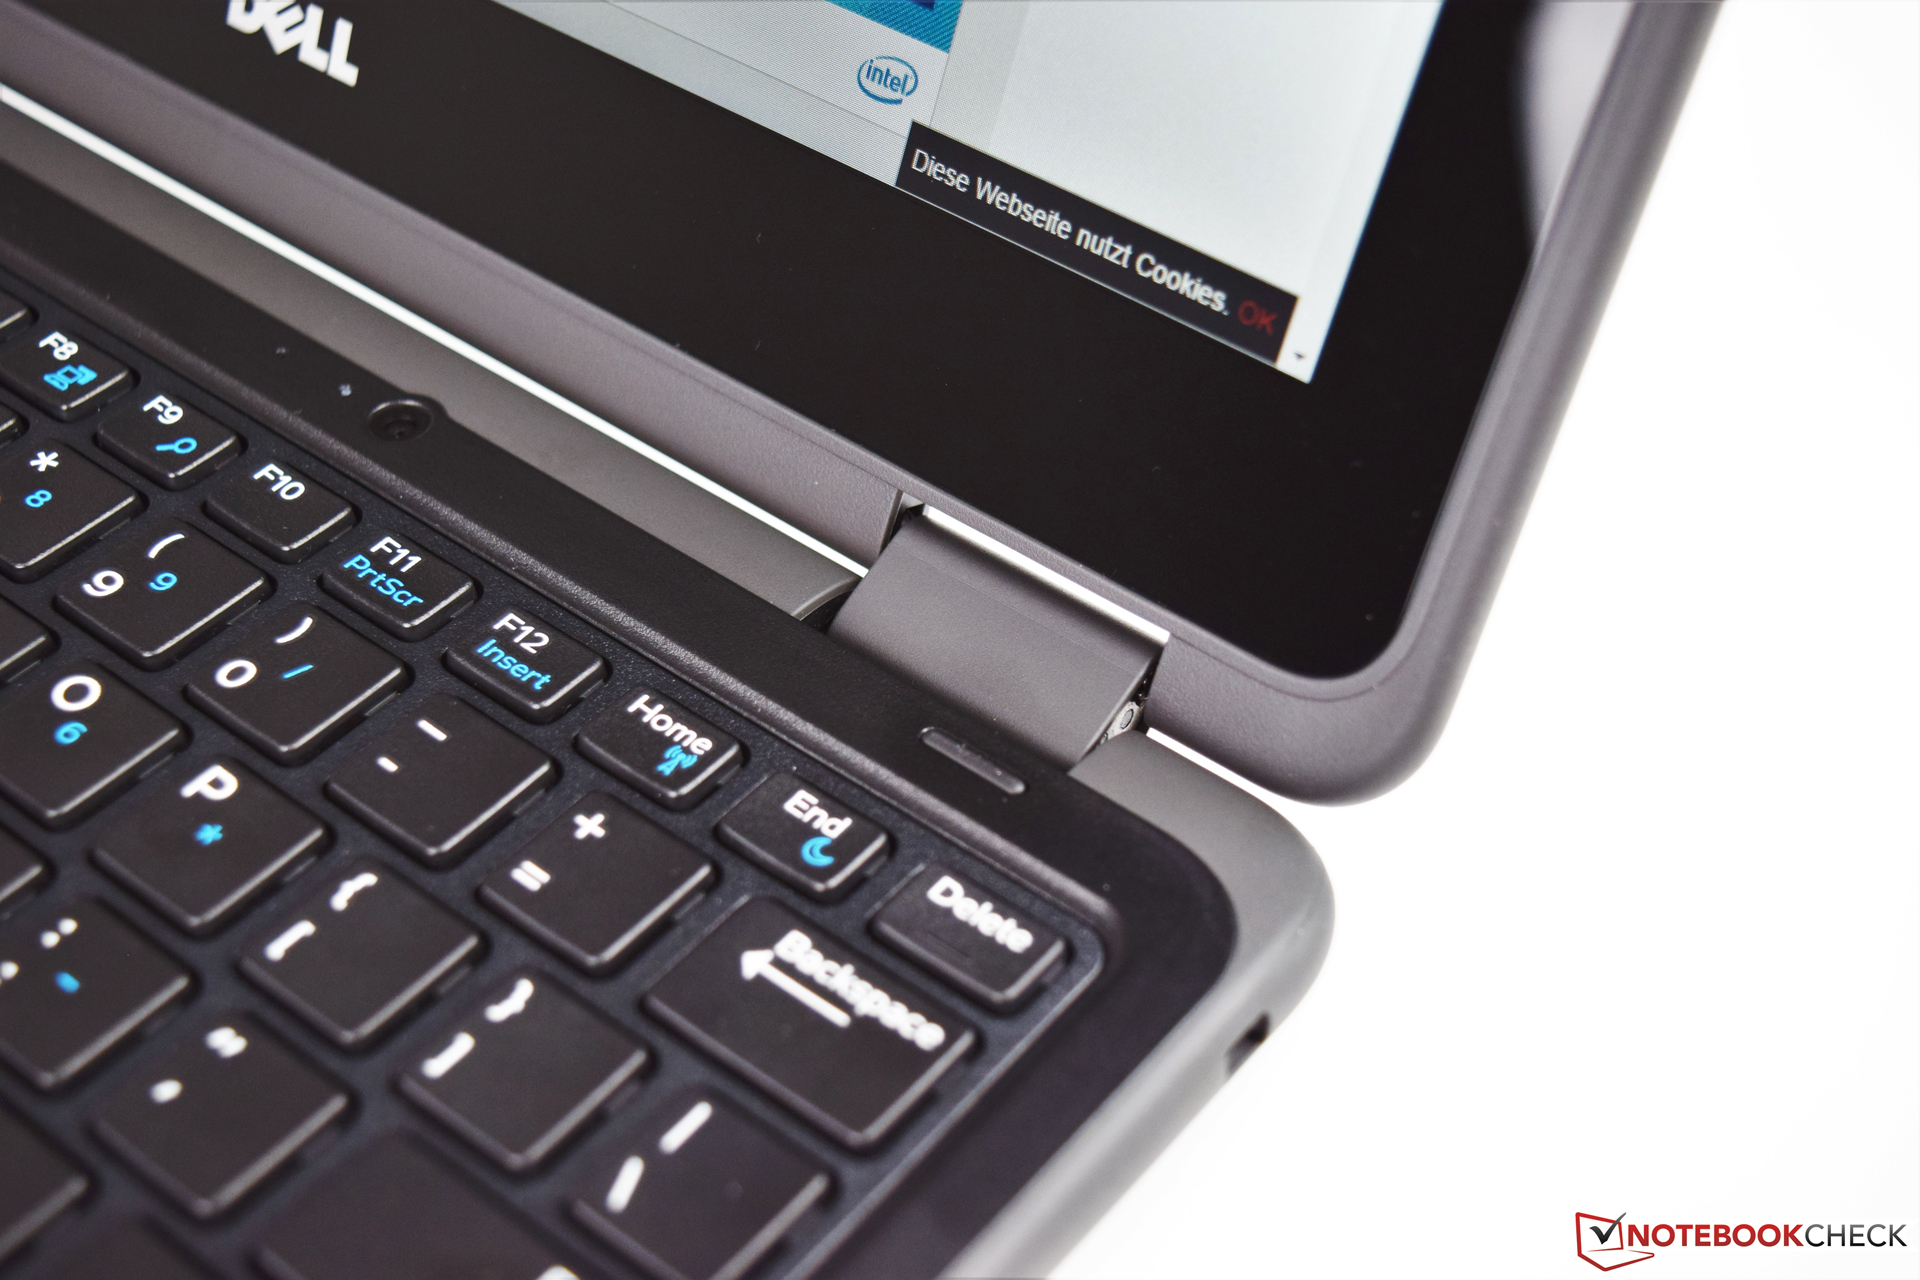
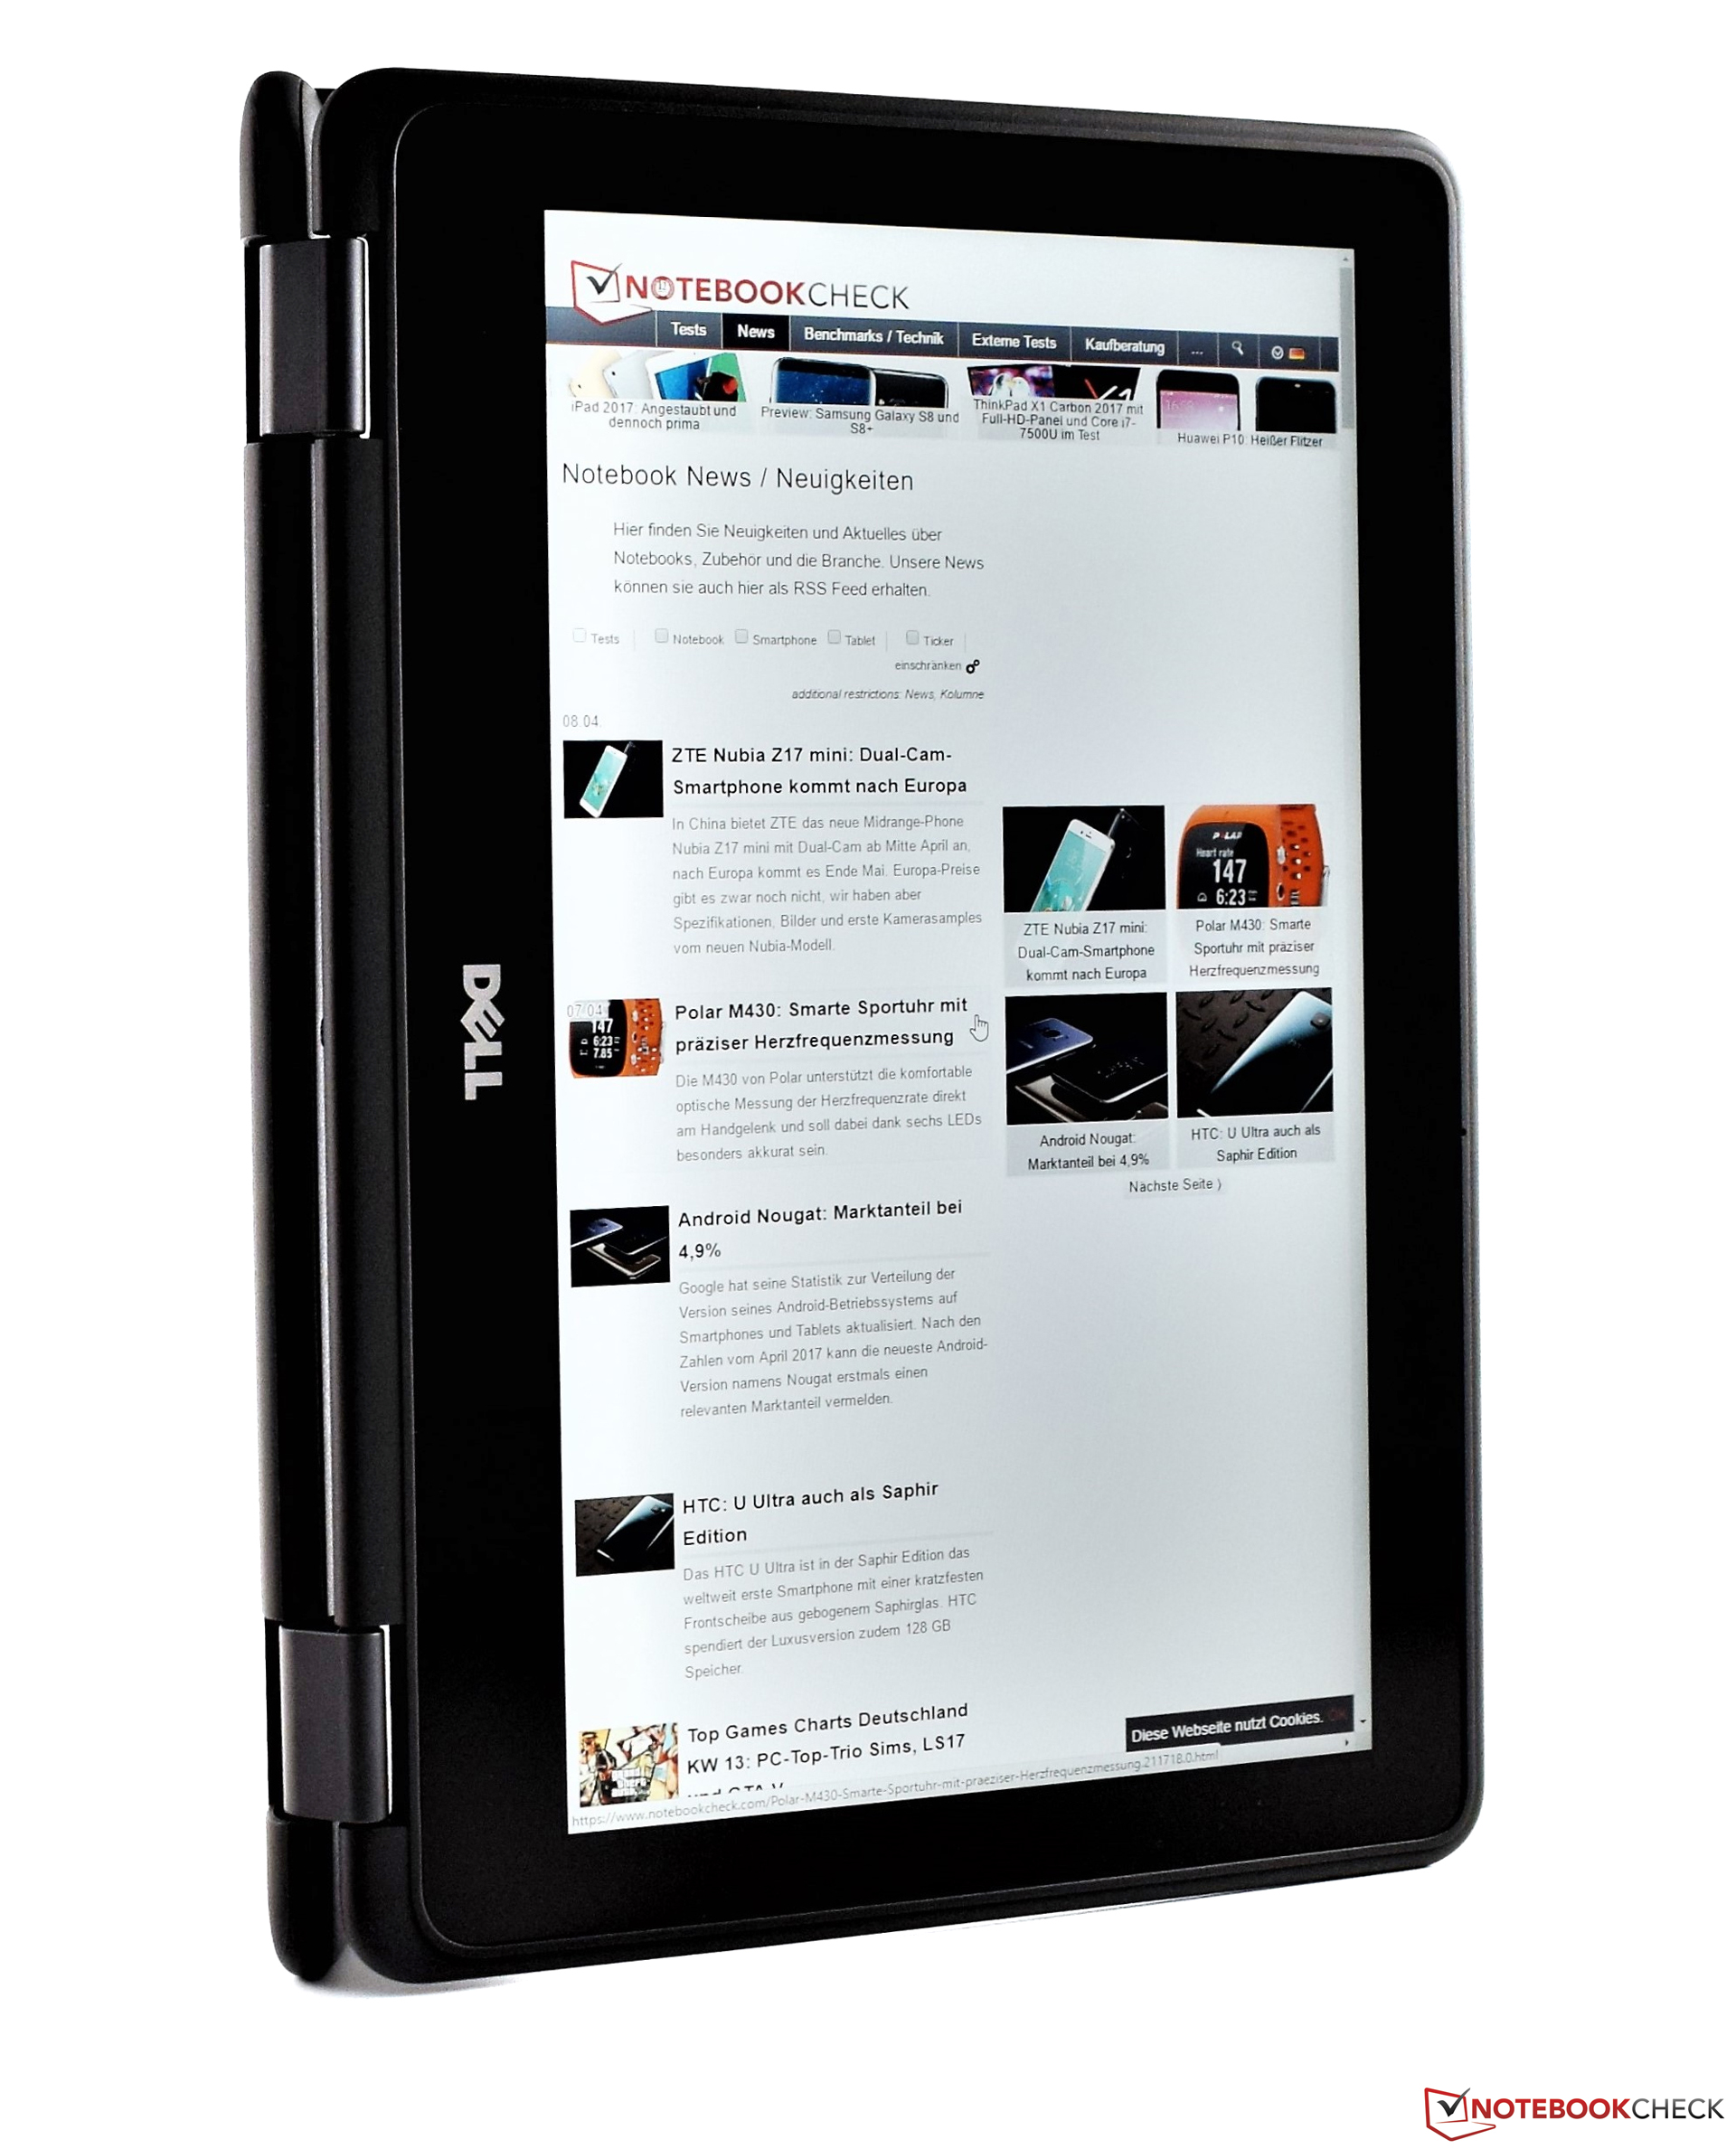
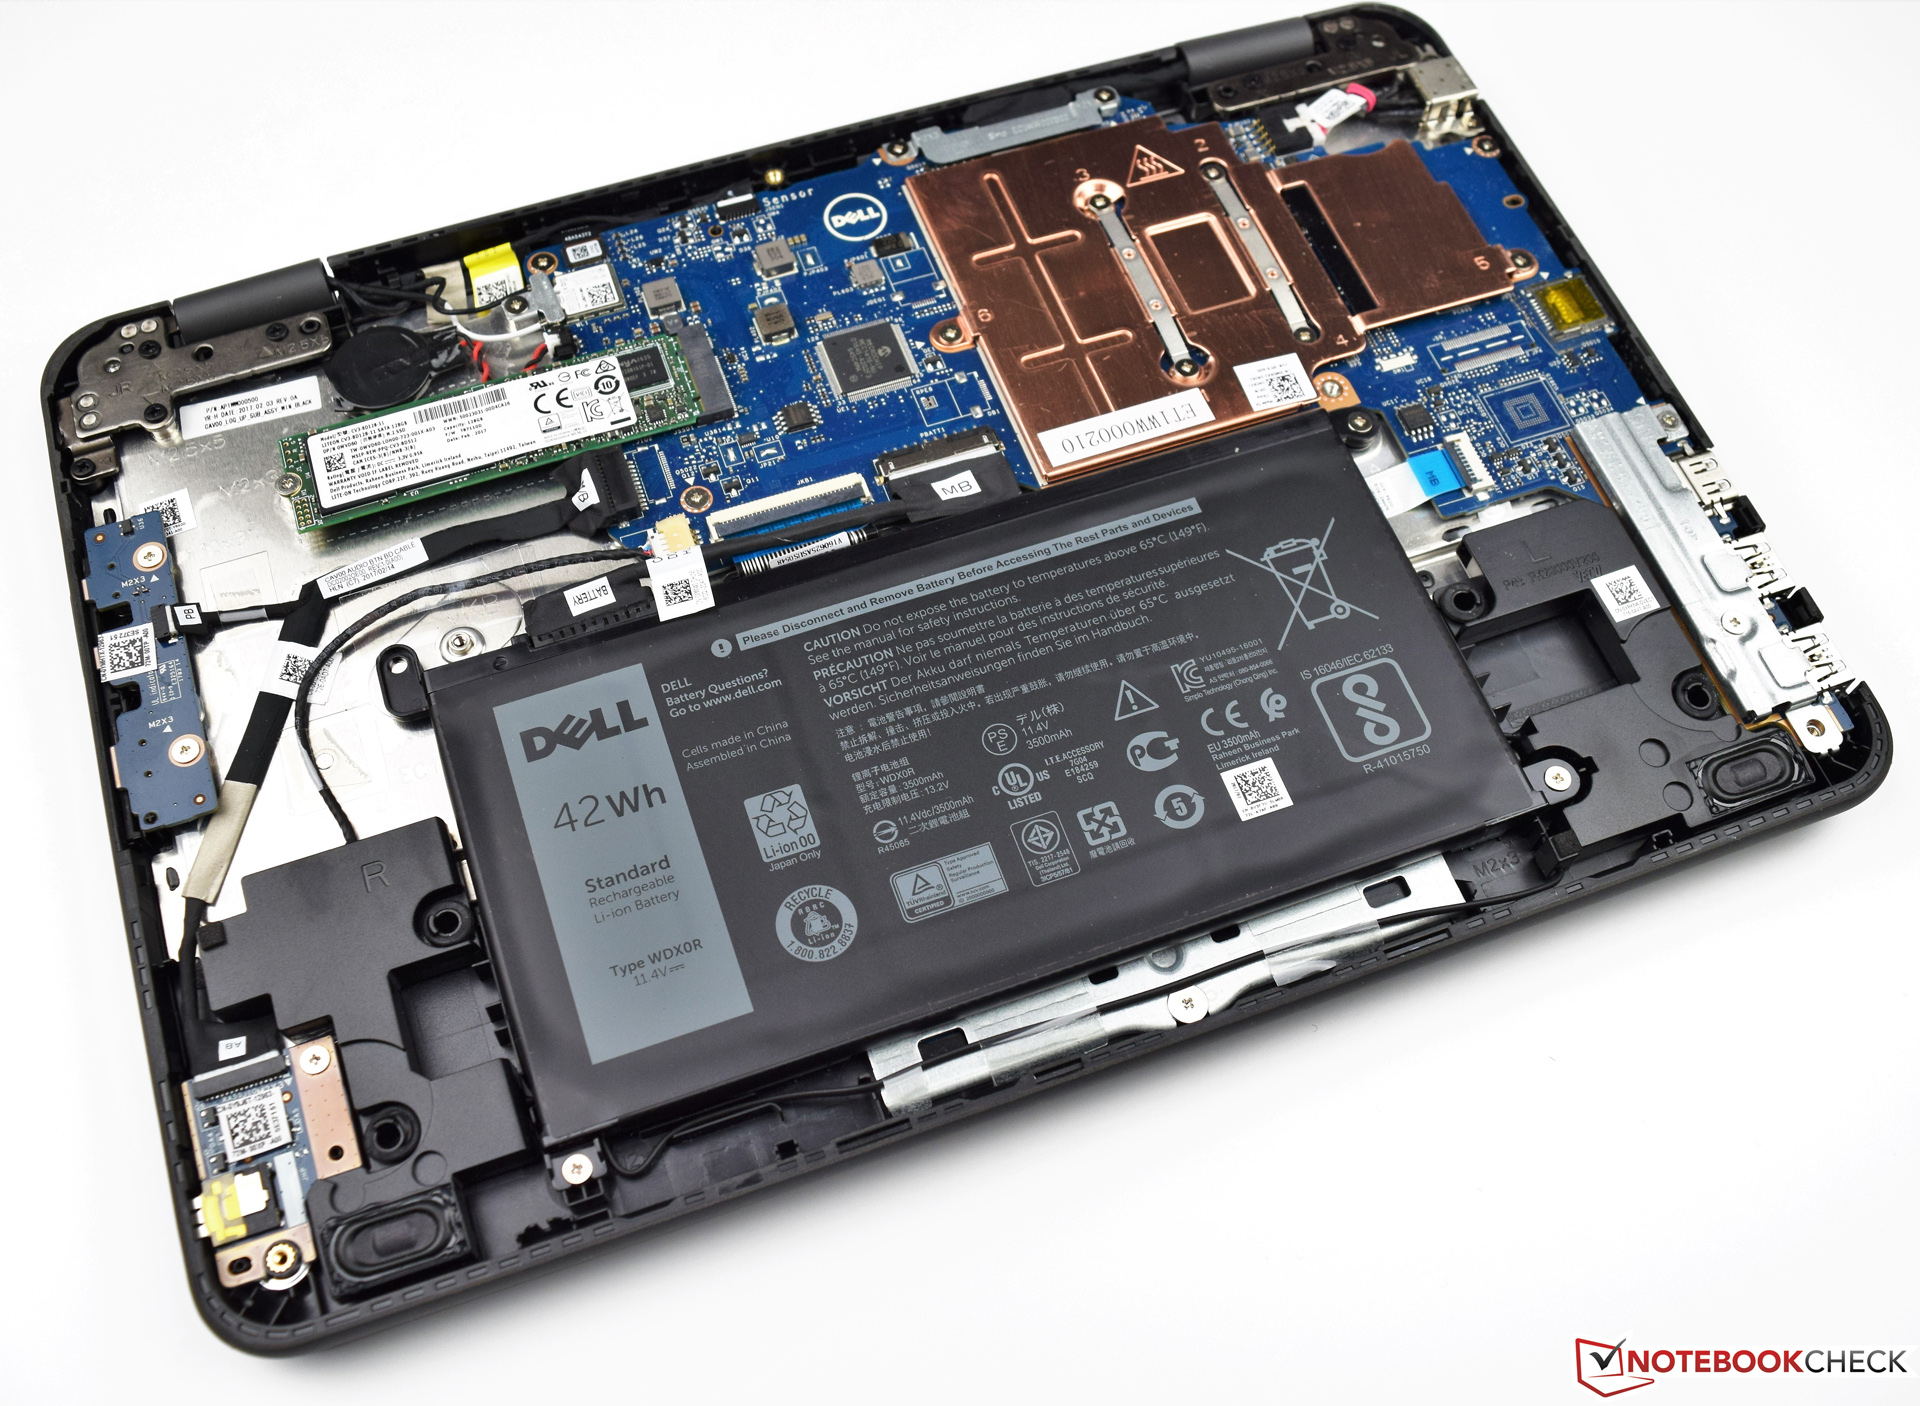
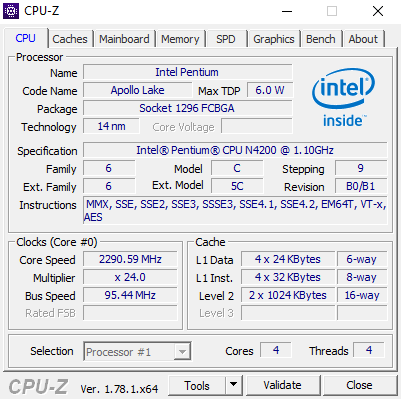
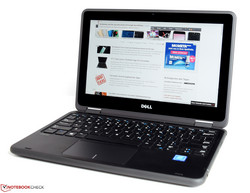
A Dell destinou o Latitude 3189 principalmente para o setor educativo. A base para isto foi estabelecido com o seu design robusto. Recursos adicionais como a tela táctil, são bons e fornecem um valor adicional para o aparelho. Isto também faz com que o aparelho seja muito mais versátil. O Intel Pentium N4200, que pode contar com 4 GB de RAM DDR3, é o máximo que o fabricante tem a a oferecer com relação ao desempenho. Não recomendaríamos a configuração de CPU alternativa com o Intel Celeron N3350. Nossa unidade de teste, que não é a mais barata, com 799 Euros (~$857), funciona bastante bem, mas com um Intel Celeron N3350 (processador dual core), o desempenho seria significantemente pior.
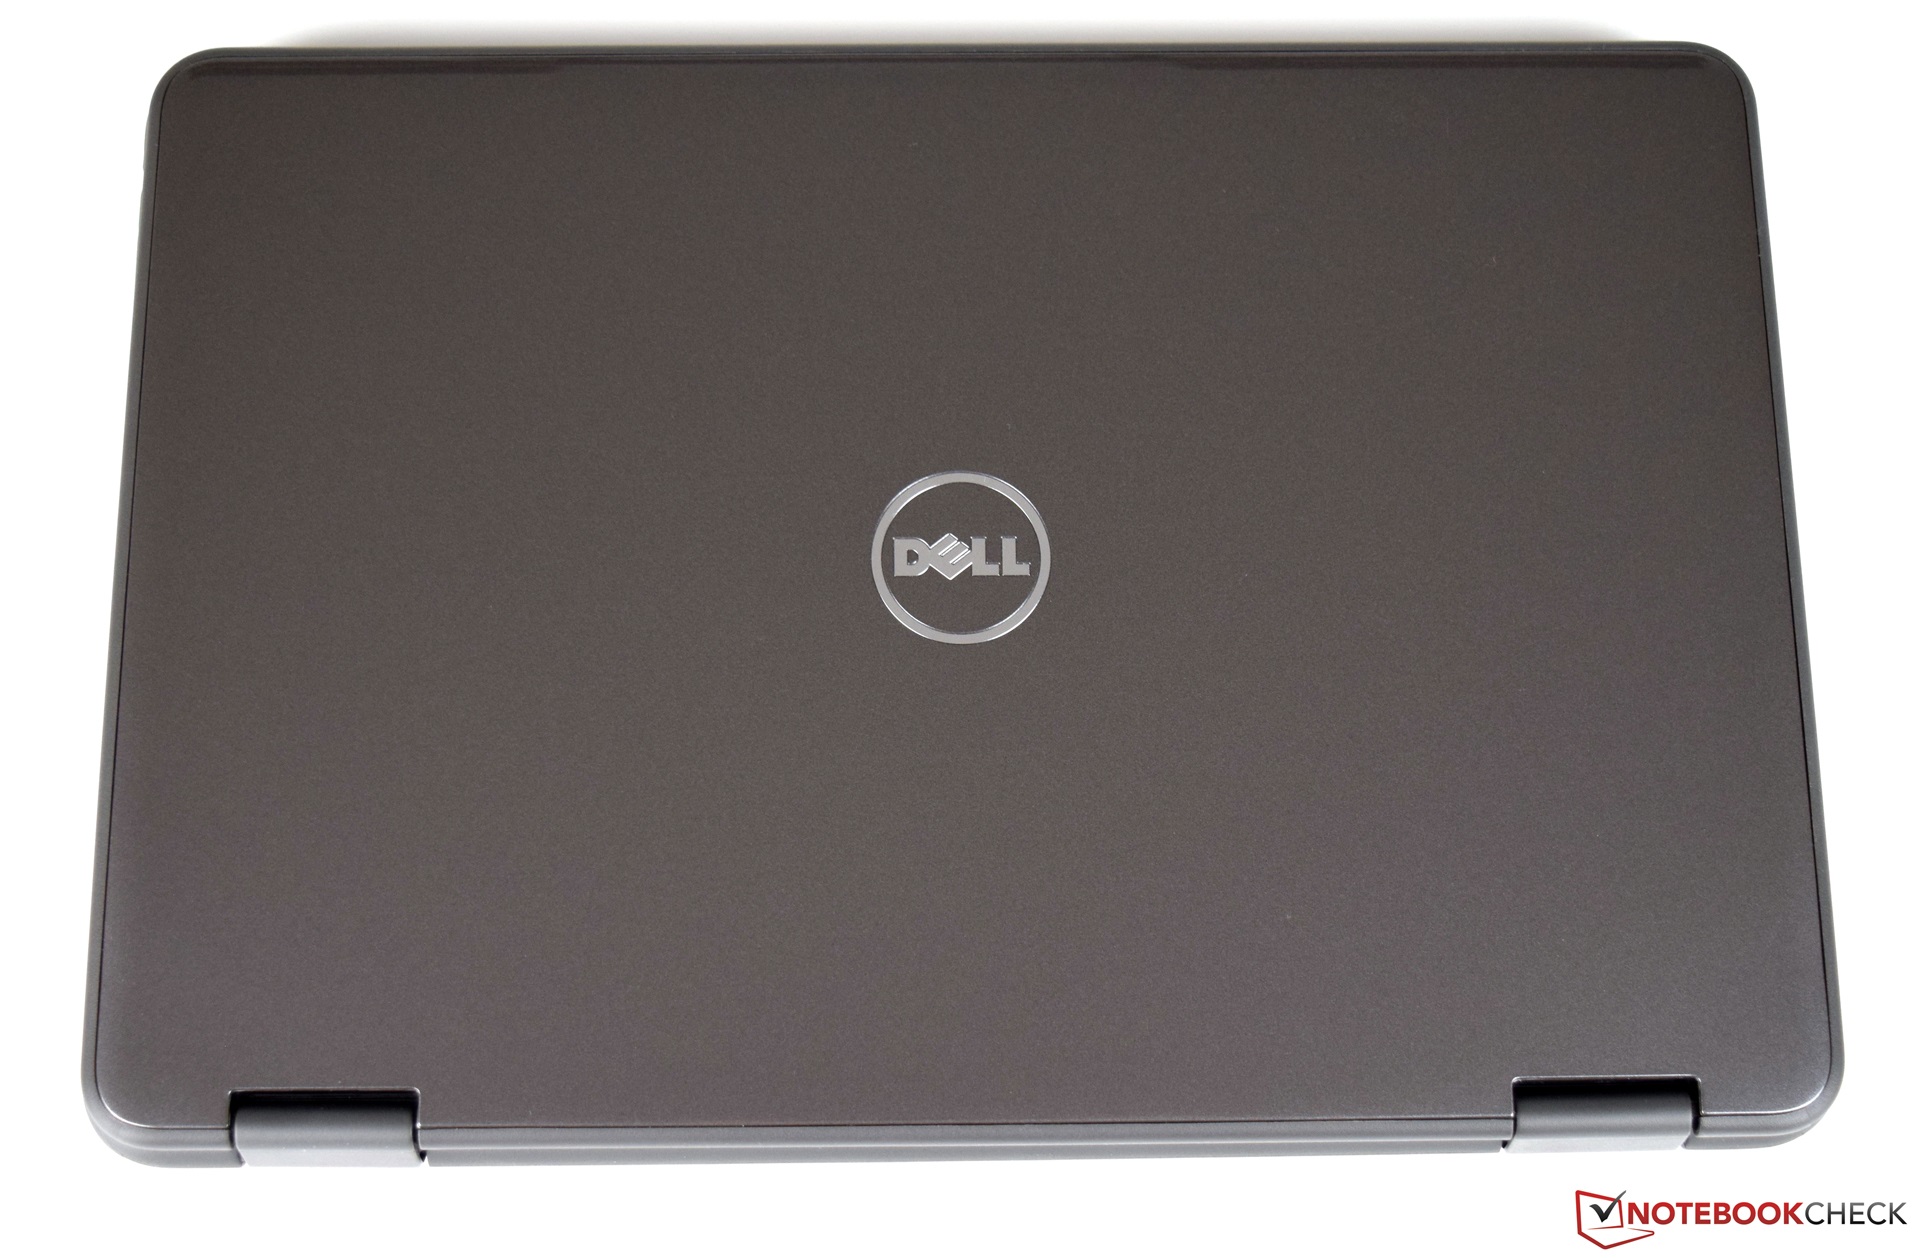
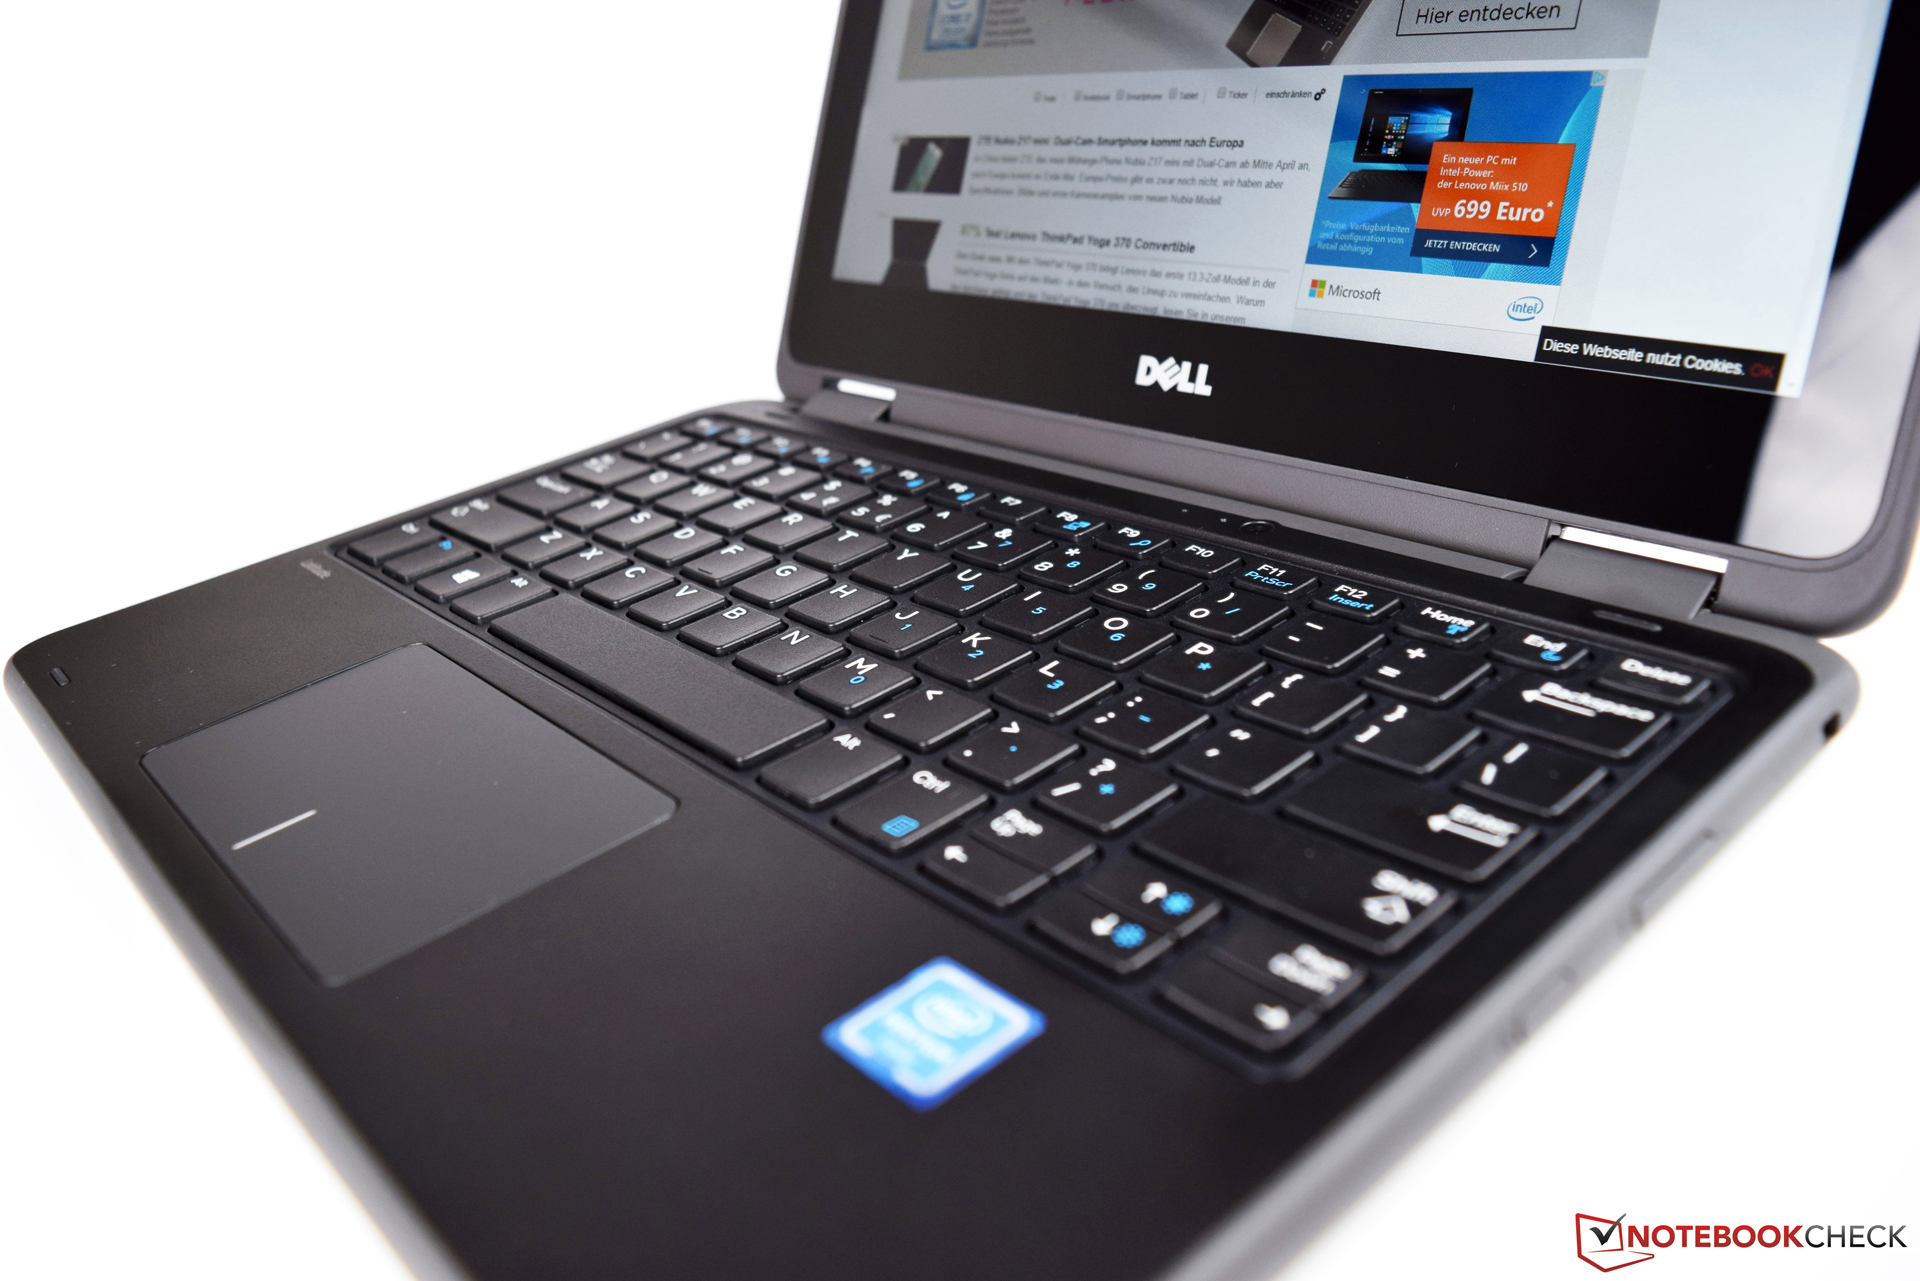
O Dell Latitude 3189 é um aparelho muito robusto, que ajuda às crianças a aprender como lidar com a nova mídia. A unidade base estável pode lidar com muito e graças a sua ótima duração da bateria. Uma carga de bateria pode durar facilmente todo um dia na escola.
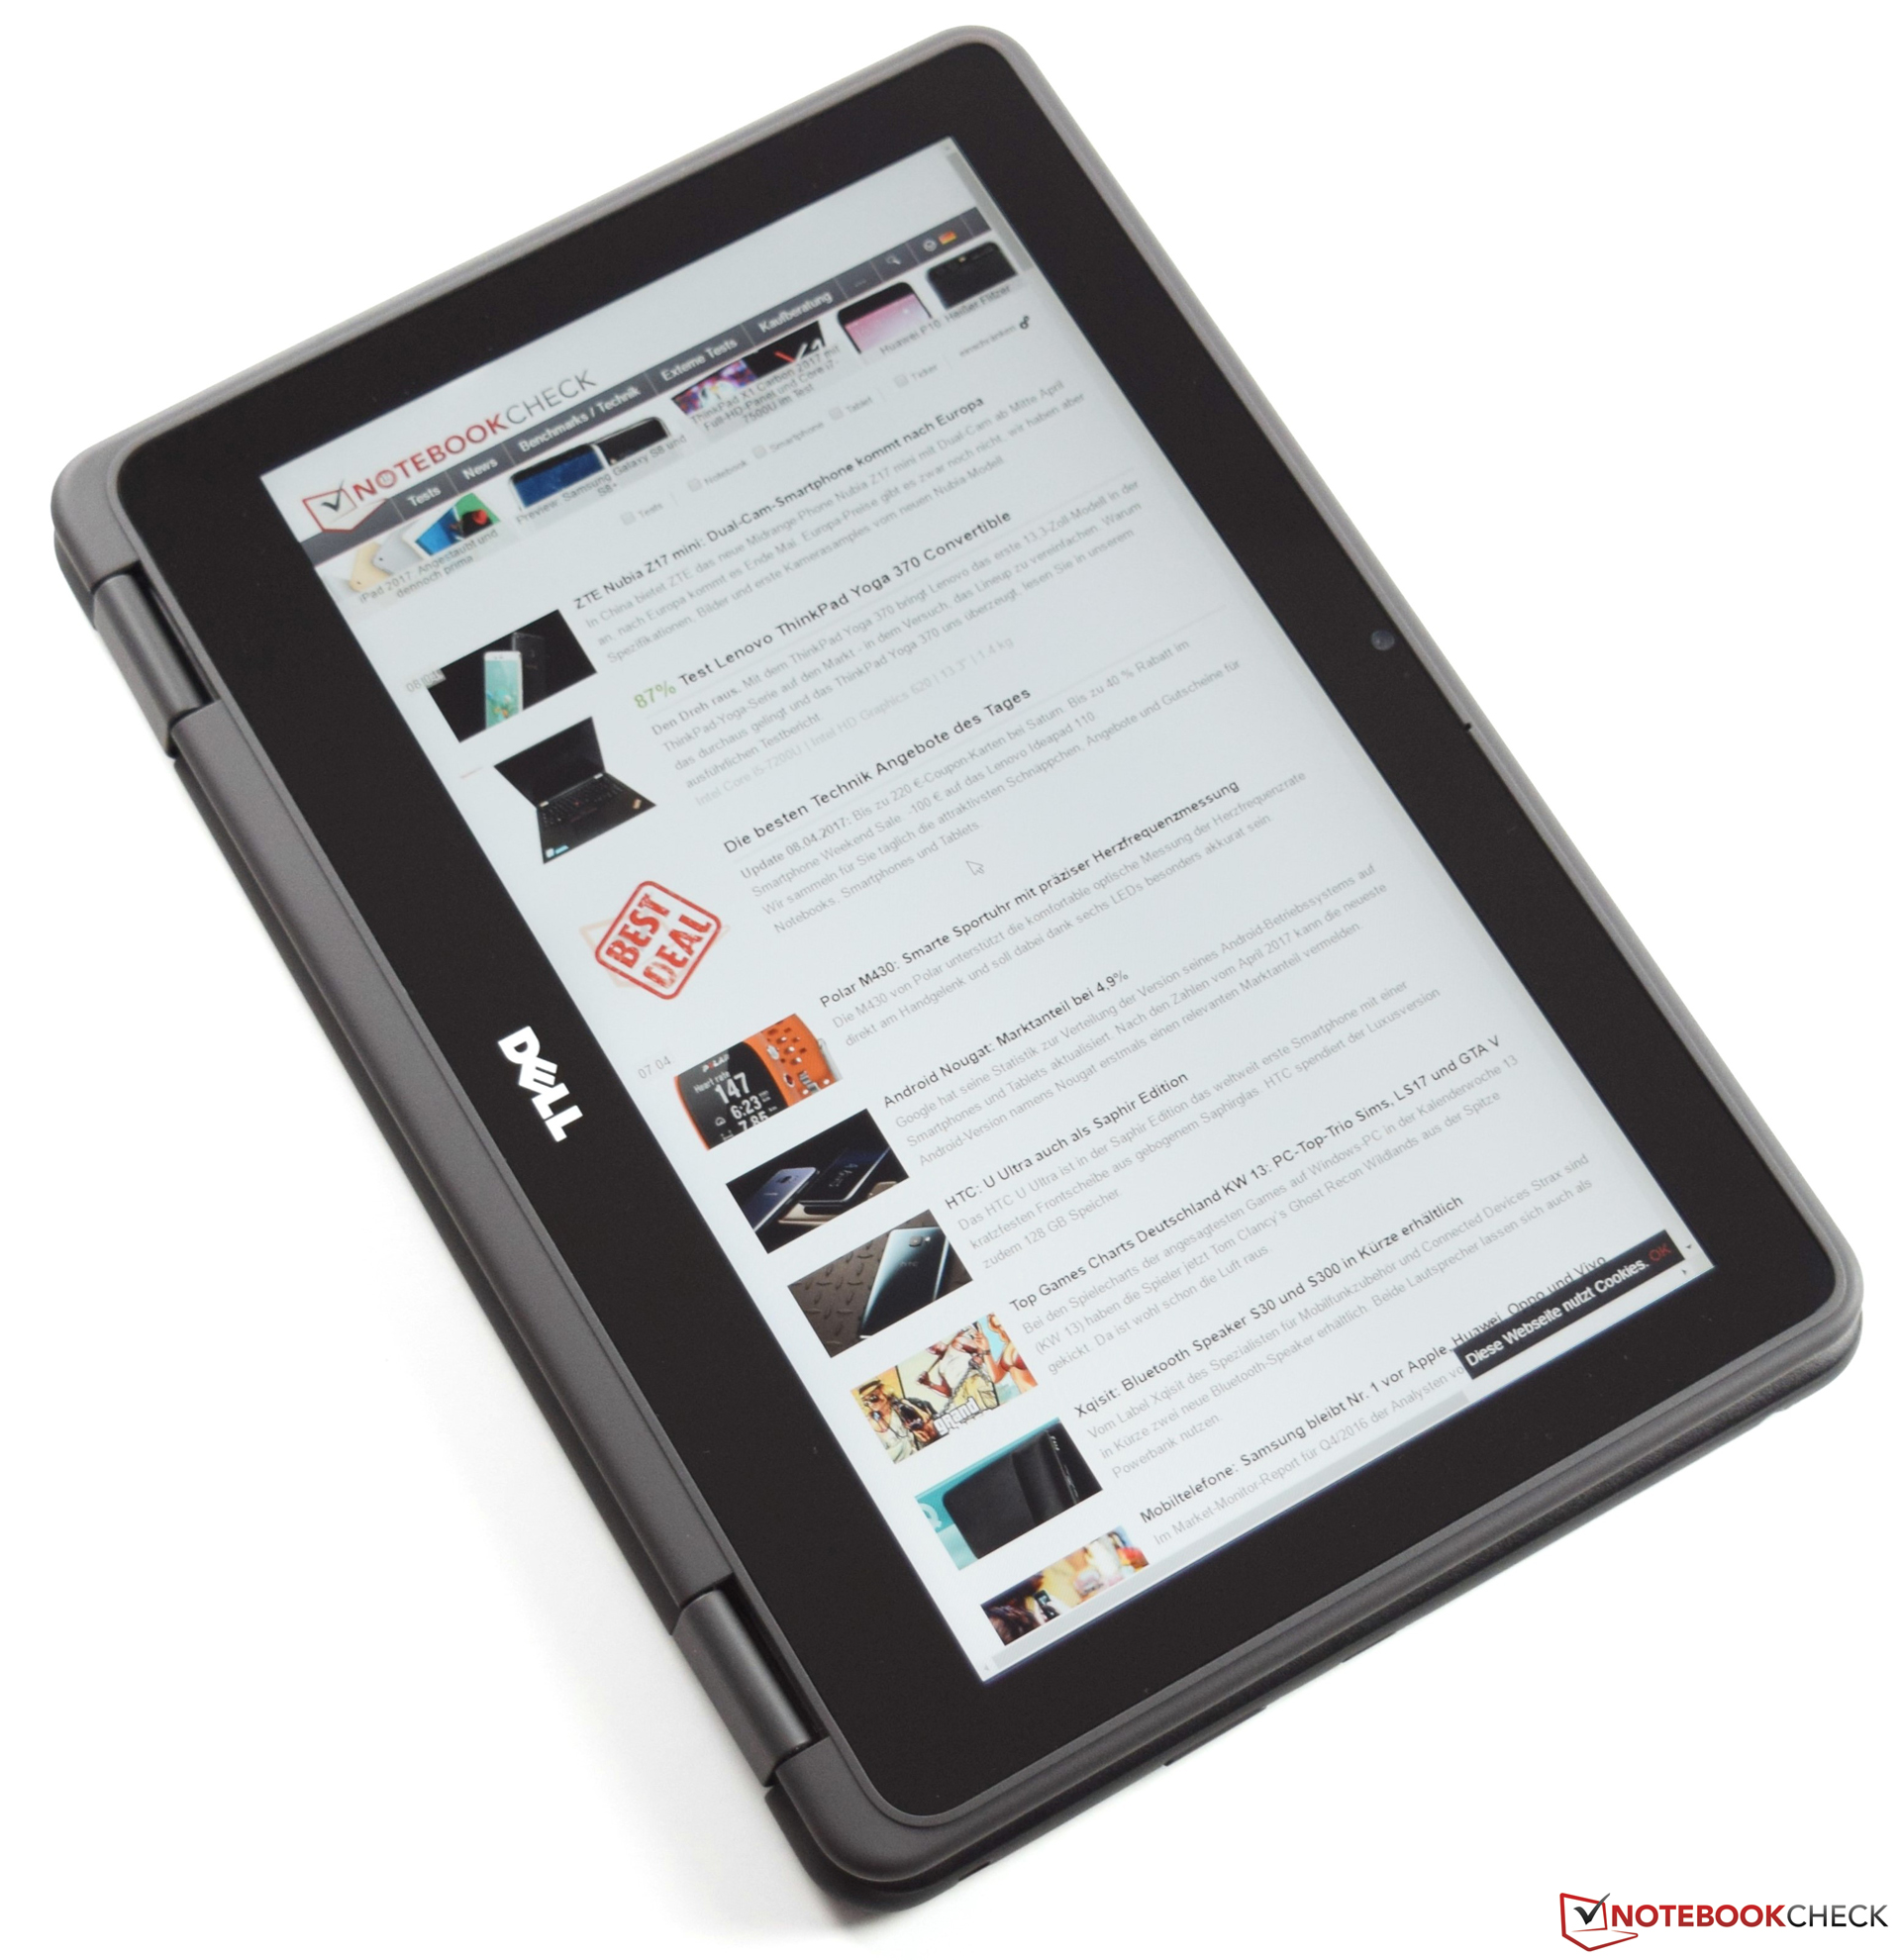
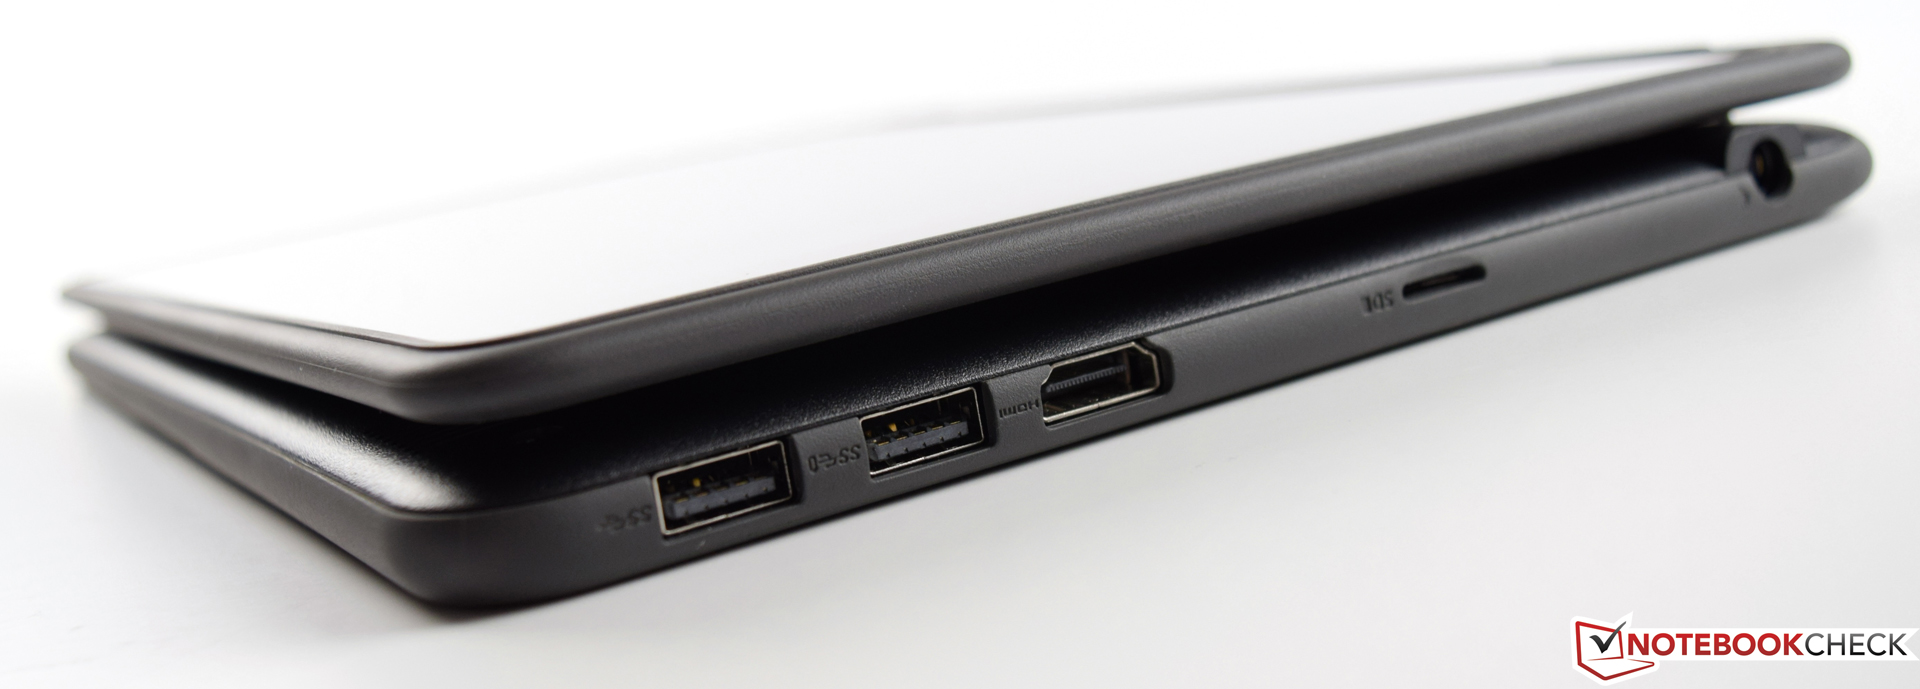
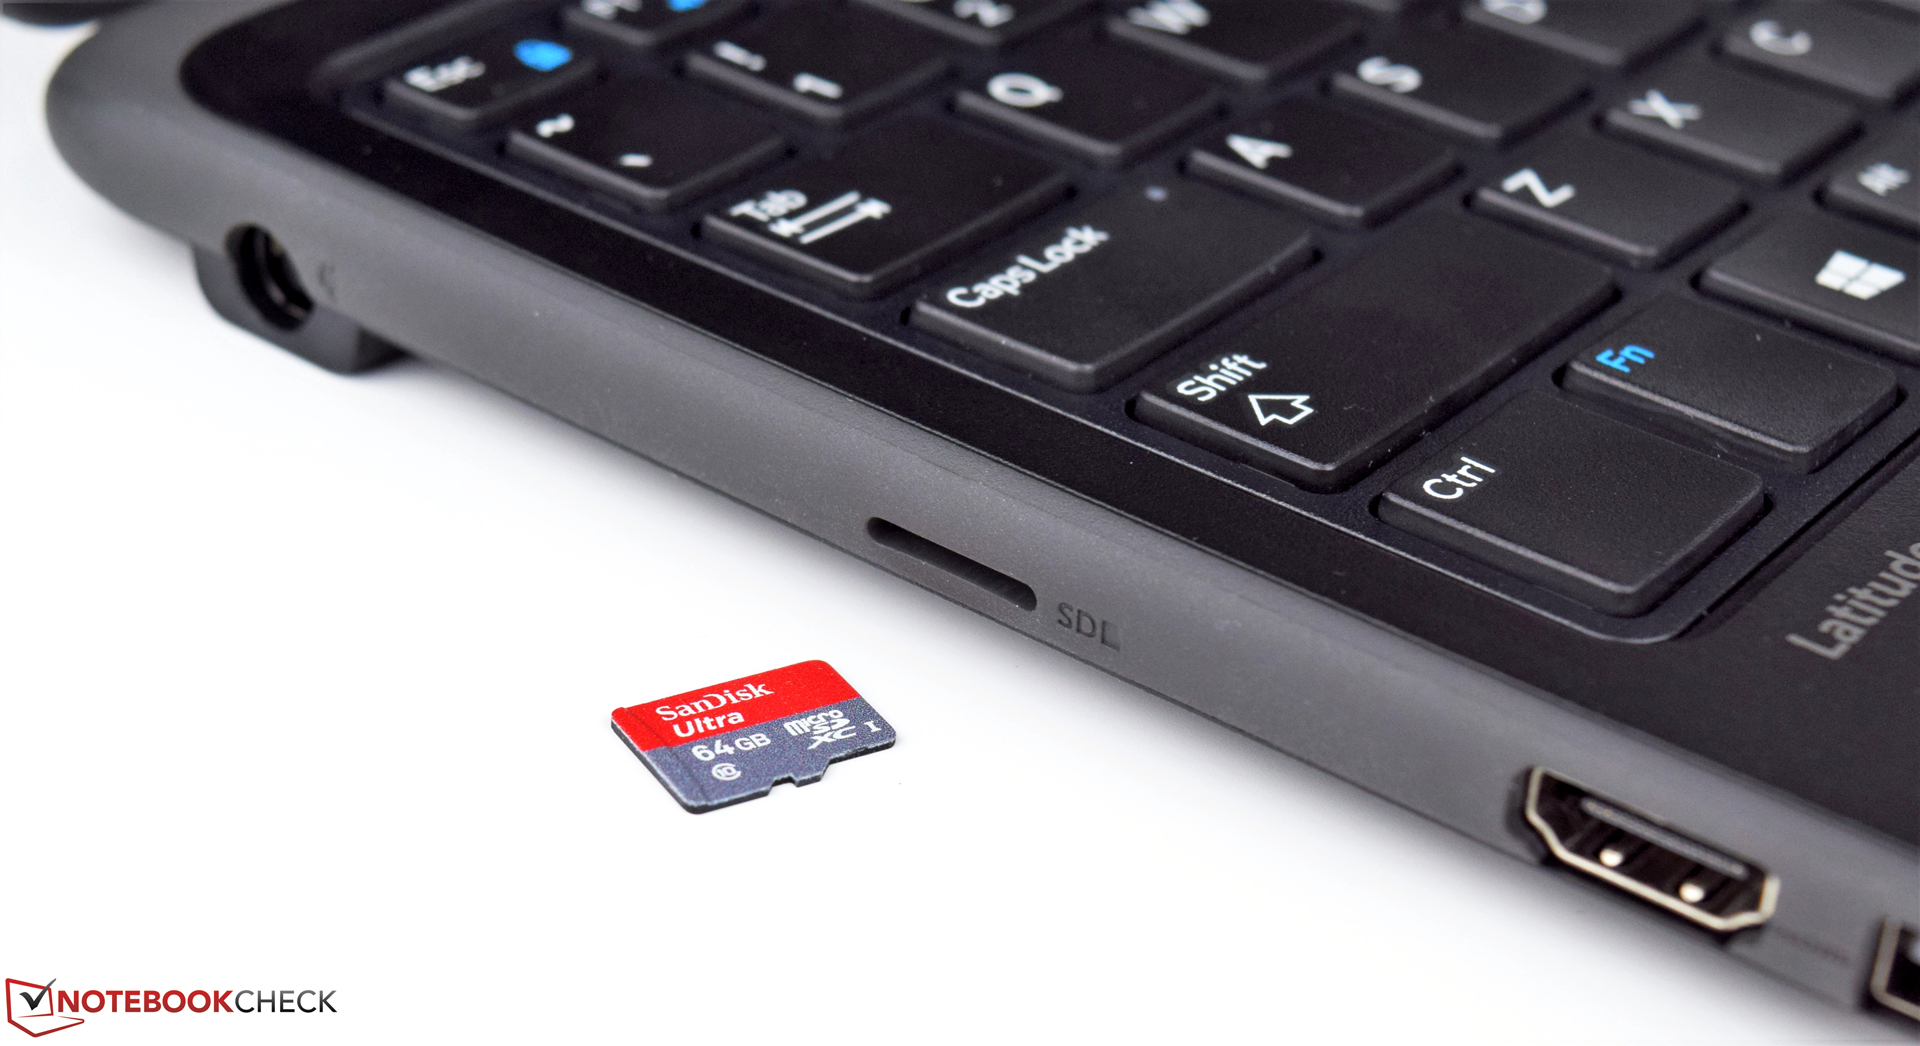
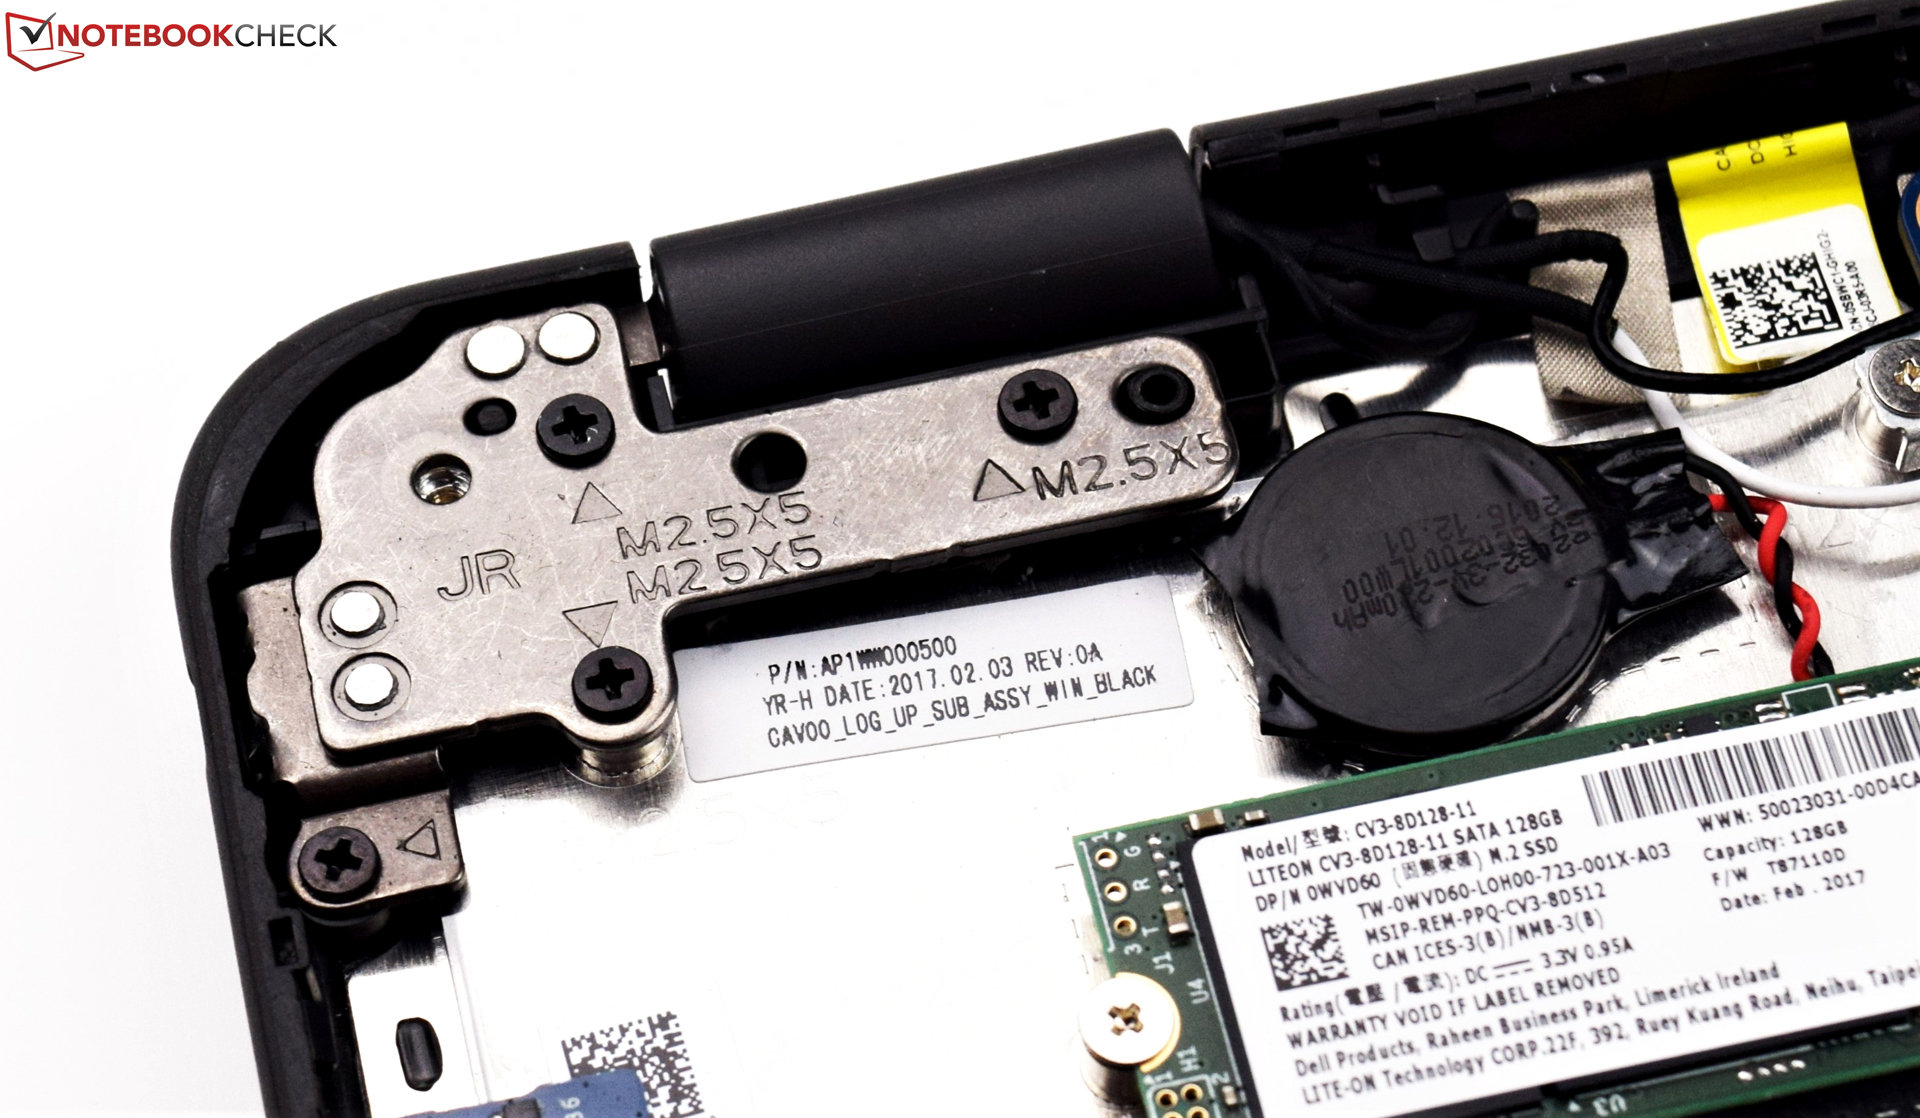
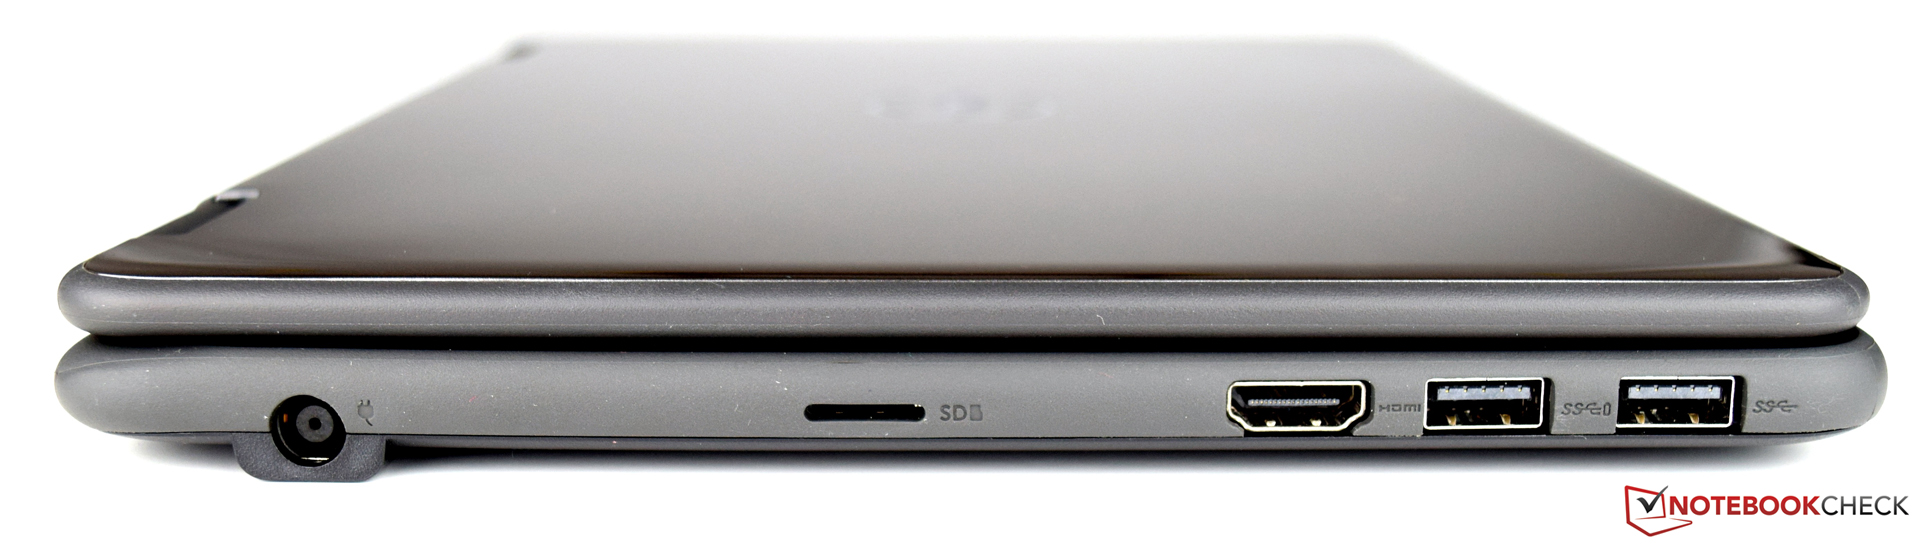
Temos algumas coisas a criticar sobre o Dell Latitude 3189: por exemplo, a porta USB Type-C ausente, que limitará o futuro do aparelho, e a tela muito refletiva, que pode ser irritante e dificulta o trabalho em ambientes claros. O aparelho de armazenamento tem vantagens e desvantagens. Uma vez que o sistema operacional e alguns programas são instalados, não resta muito da capacidade de armazenamento de 128 GB. No geral, podemos dizer que apesar de que não se saia tão bem em algumas áreas, em comparação com outras unidades de teste, o Dell Latitude 3189 faz um ótimo trabalho. O subjetivo desempenho do sistema foi definitivamente melhor que os resultados que mostraram os benchmarks.
Pro
Contra
Dell has aimed the Latitude 3189 mainly at the education sector. The basis for this has been established with its robust design. Additional features such as a touchscreen are good and add additional value to the device. This also makes the device a lot more versatile. The Intel Pentium N4200, which can rely on 4 GB of DDR3 RAM, is the maximum of what the manufacturer has to offer concerning performance. We would not recommend the alternative CPU configuration with the Intel Celeron N3350. Our test unit, which is not the cheapest at 799 Euros (~$857), runs quite well, but with an Intel Celeron N3350 (dual core processor), the performance would be significantly worse.
The Dell Latitude 3189 is a very robust device, which helps children learn how to handle the new media. The stable base unit can handle quite a lot and thanks to its great battery runtime, one battery charge easily lasts an entire day at school.
We have got a few things to criticize about the Dell Latitude 3189: for example the missing USB Type-C port, which would secure the device's future, and the very reflective display, which can be irritating and make it difficult to work in light spaces. The storage device has advantages and disadvantages. Once the operating system and some programs are installed, not much is left of the 128 GB storage capacity. Overall, we can say that despite it not doing so well in some areas compared with the other test units, the Dell Latitude 3189 does a solid job. The subjective system performance was definitely better than the results the benchmarks showed.
Dell Latitude 3189
- 04/25/2017 v6 (old)
Sebastian Bade