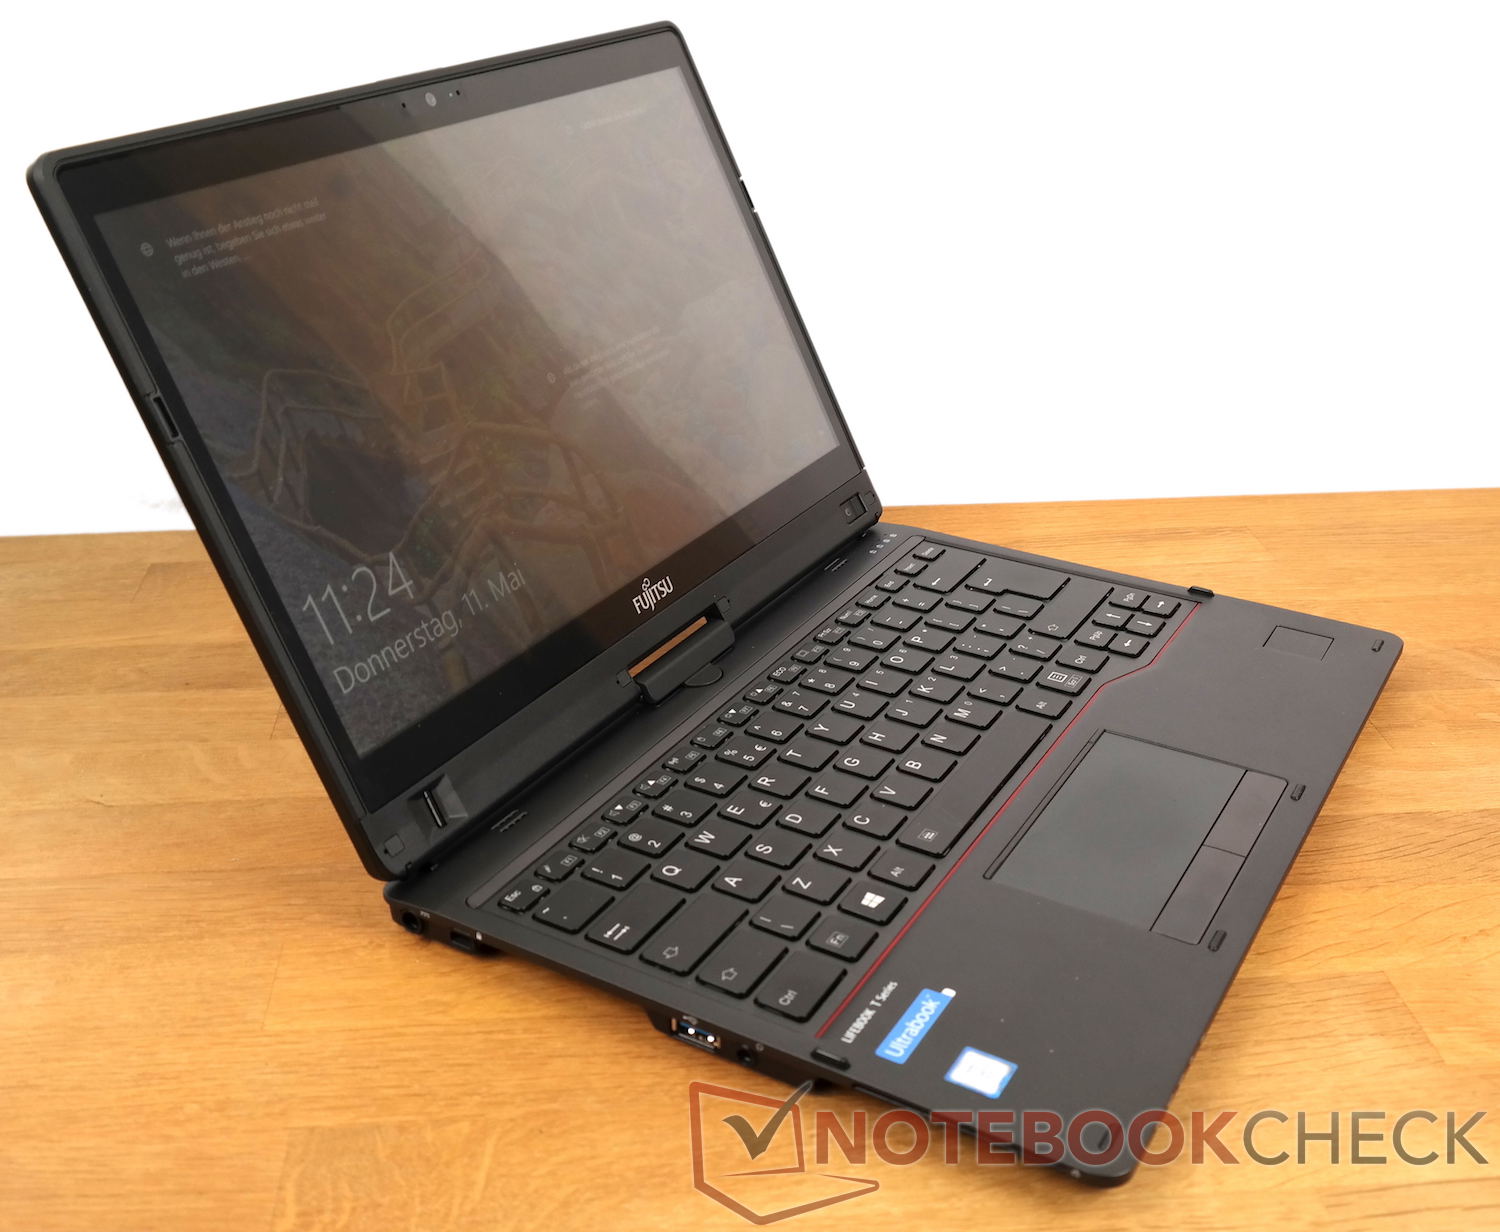
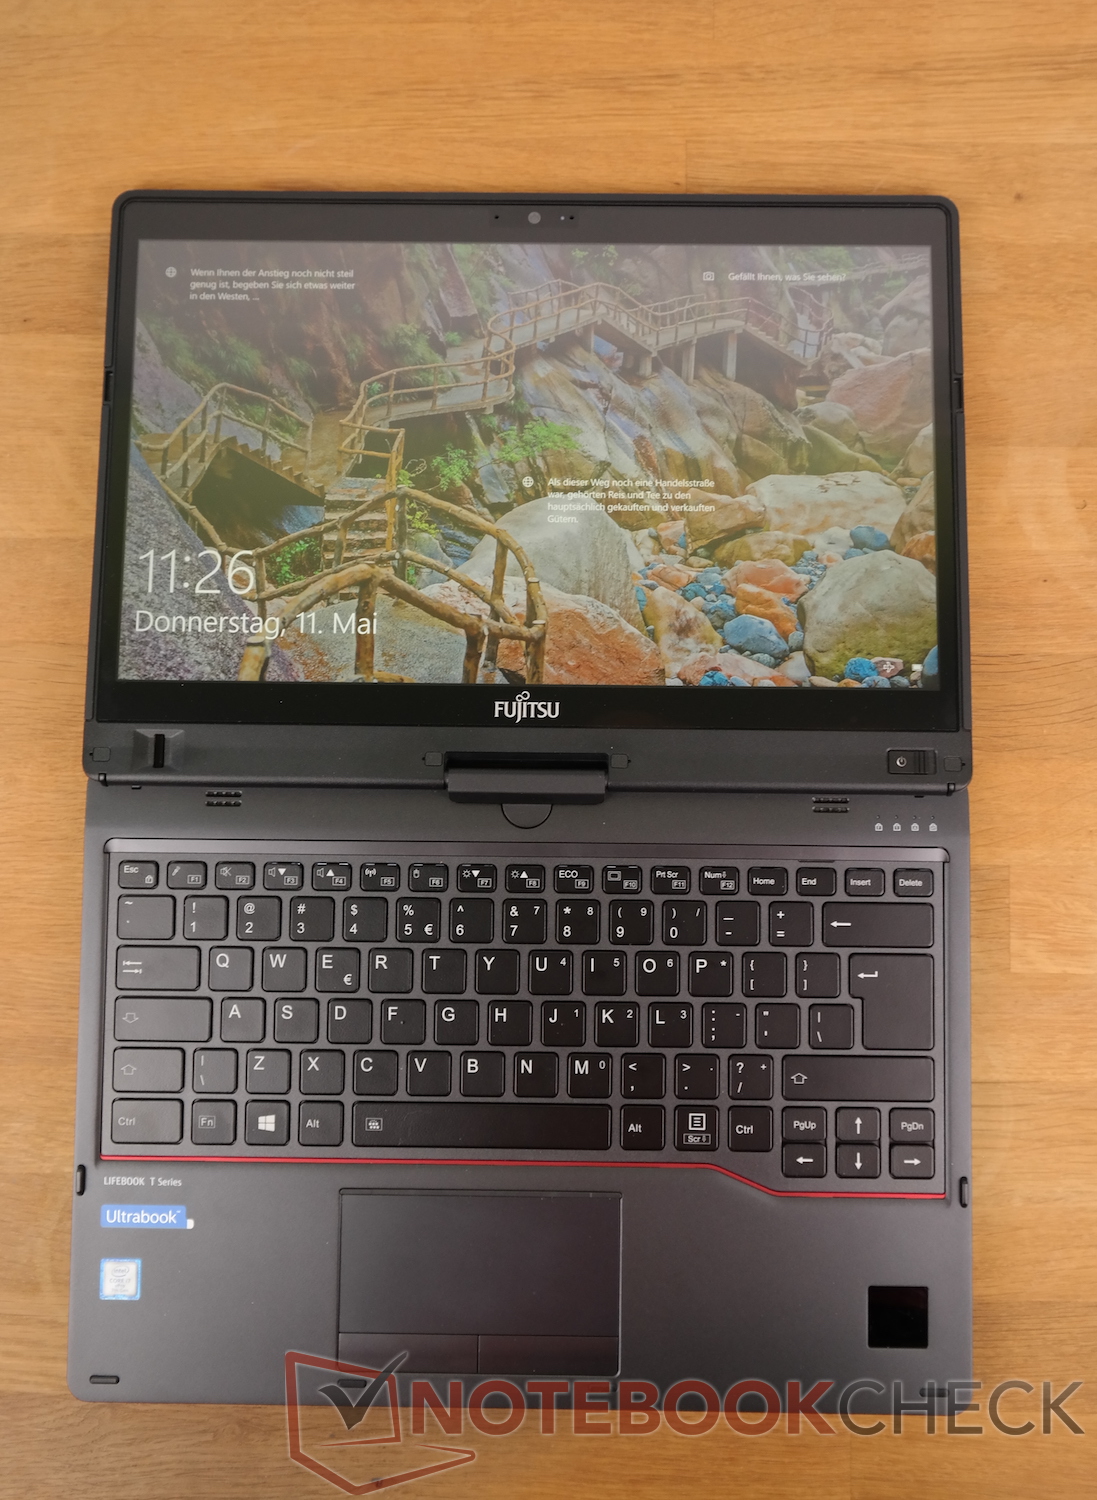
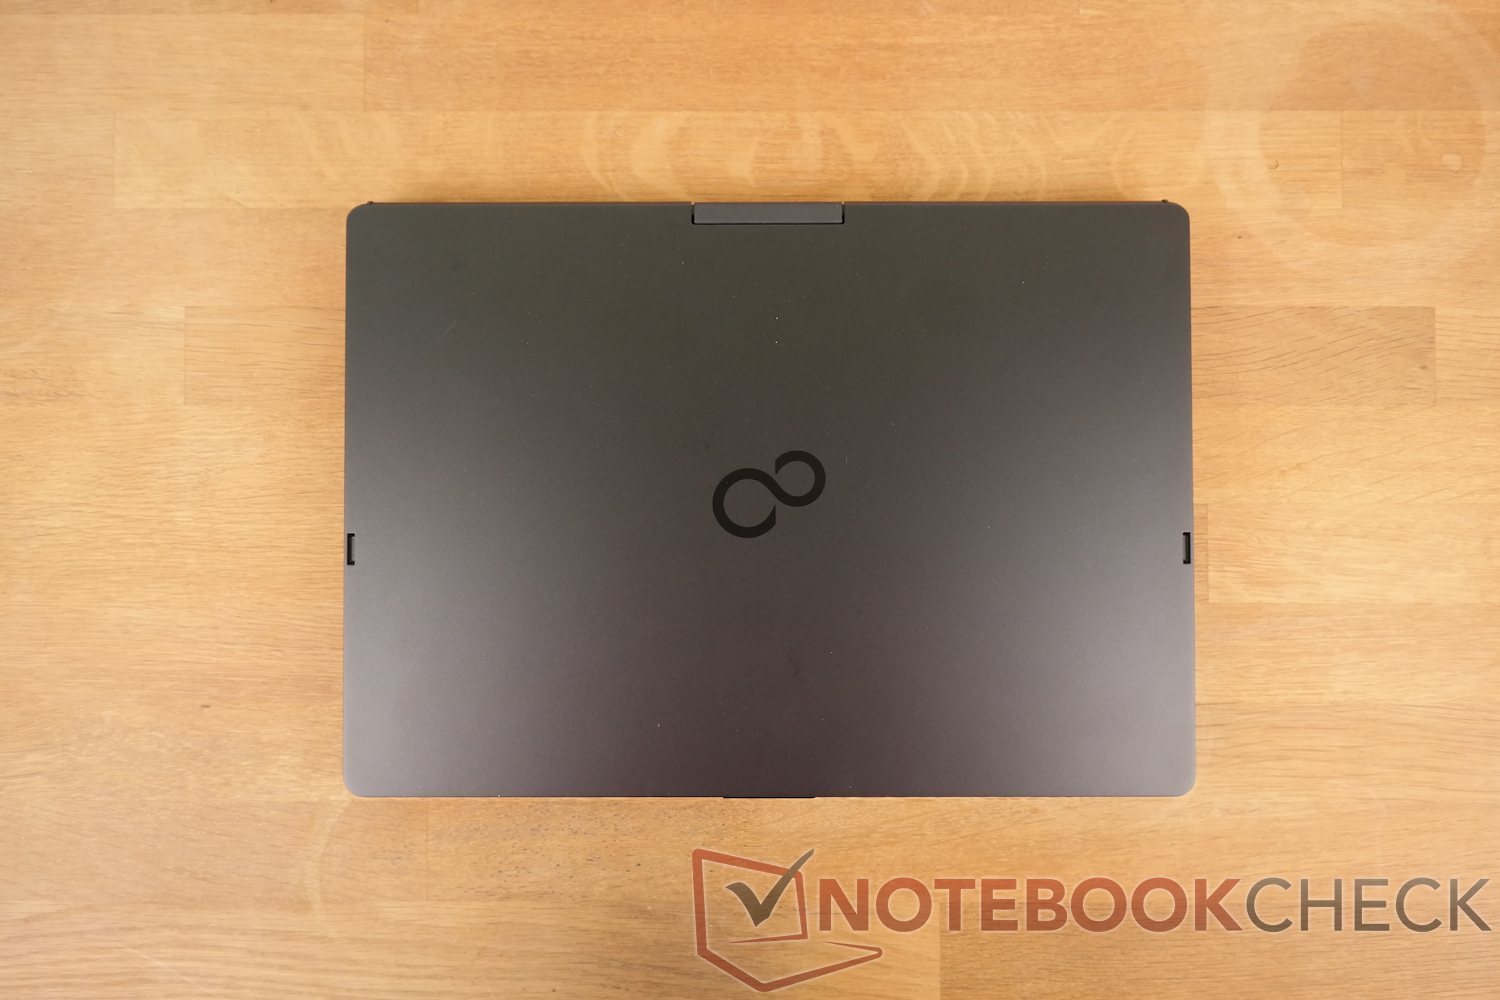
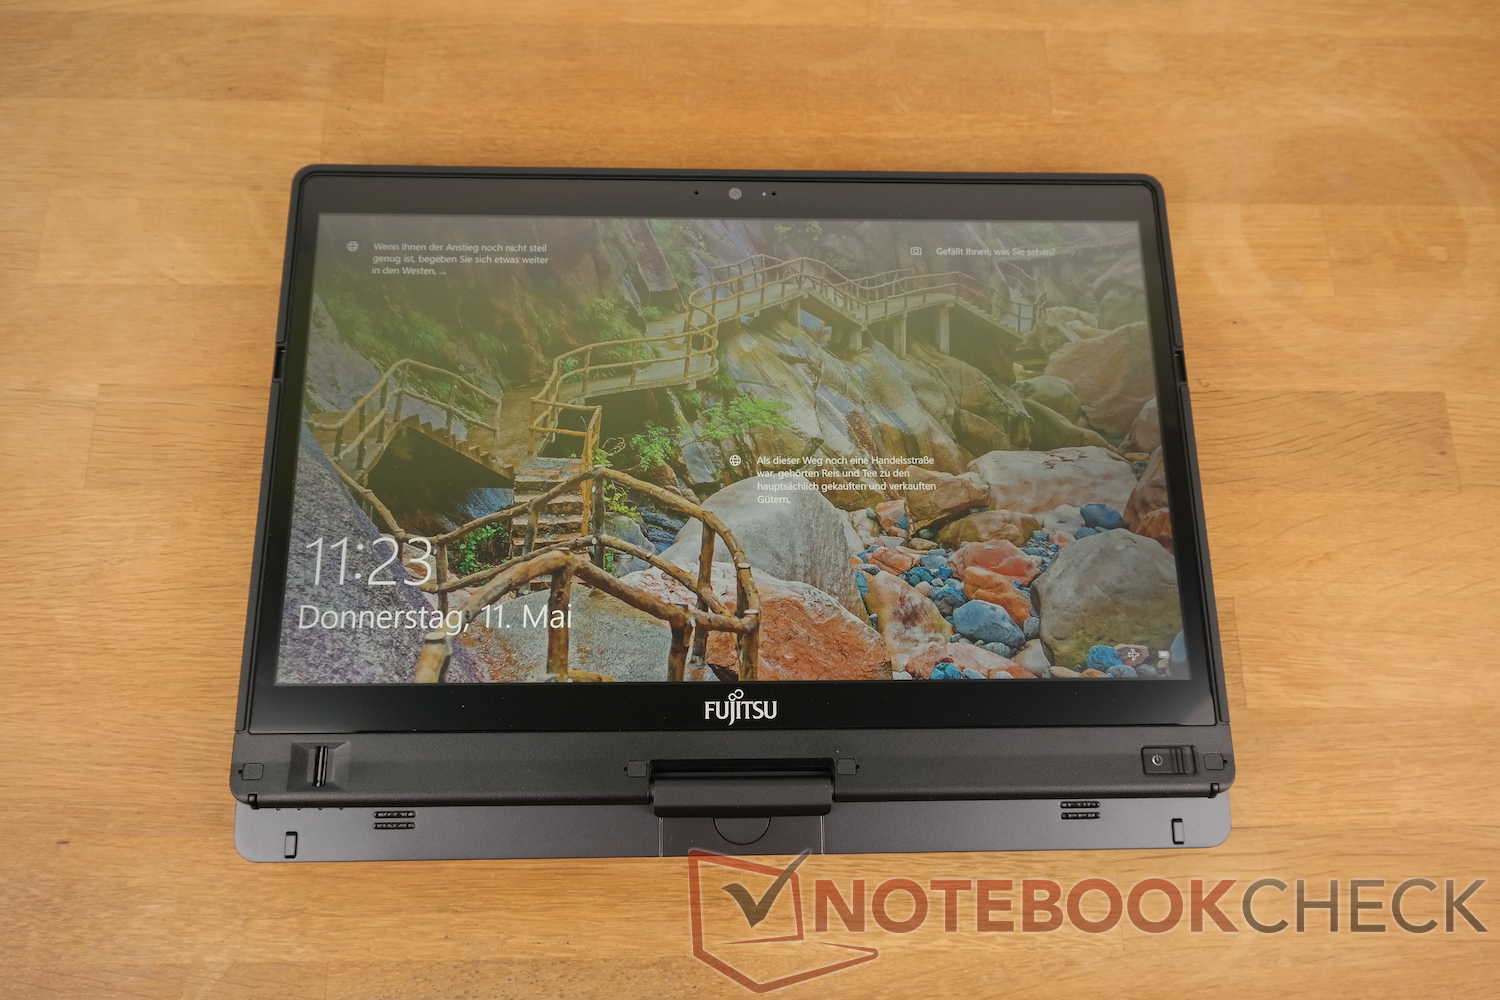
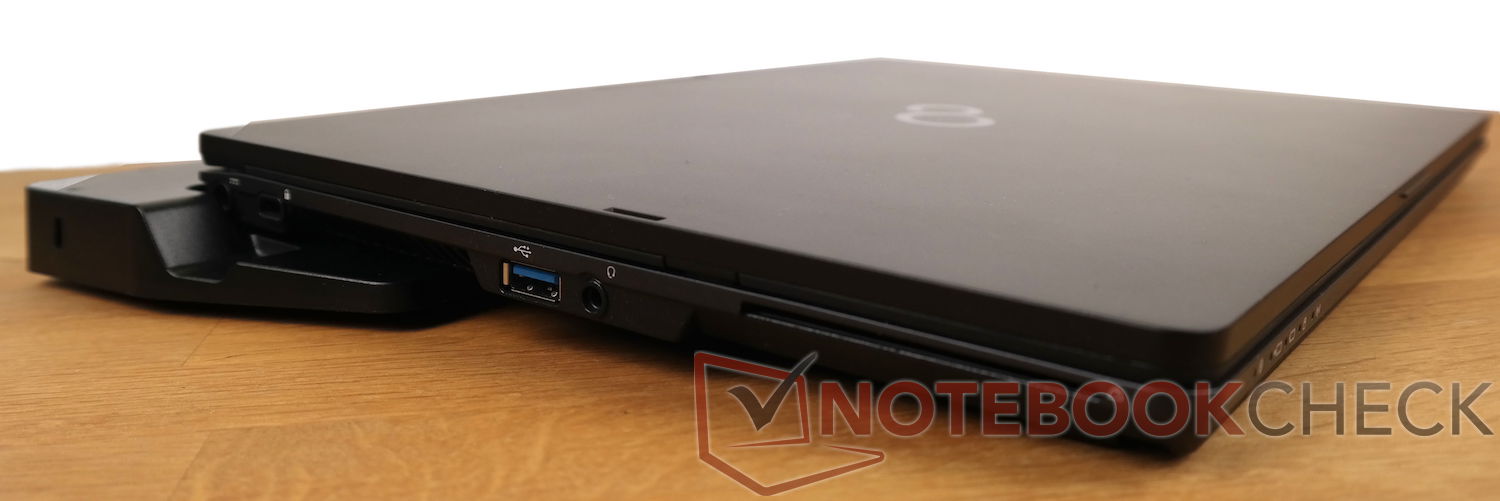
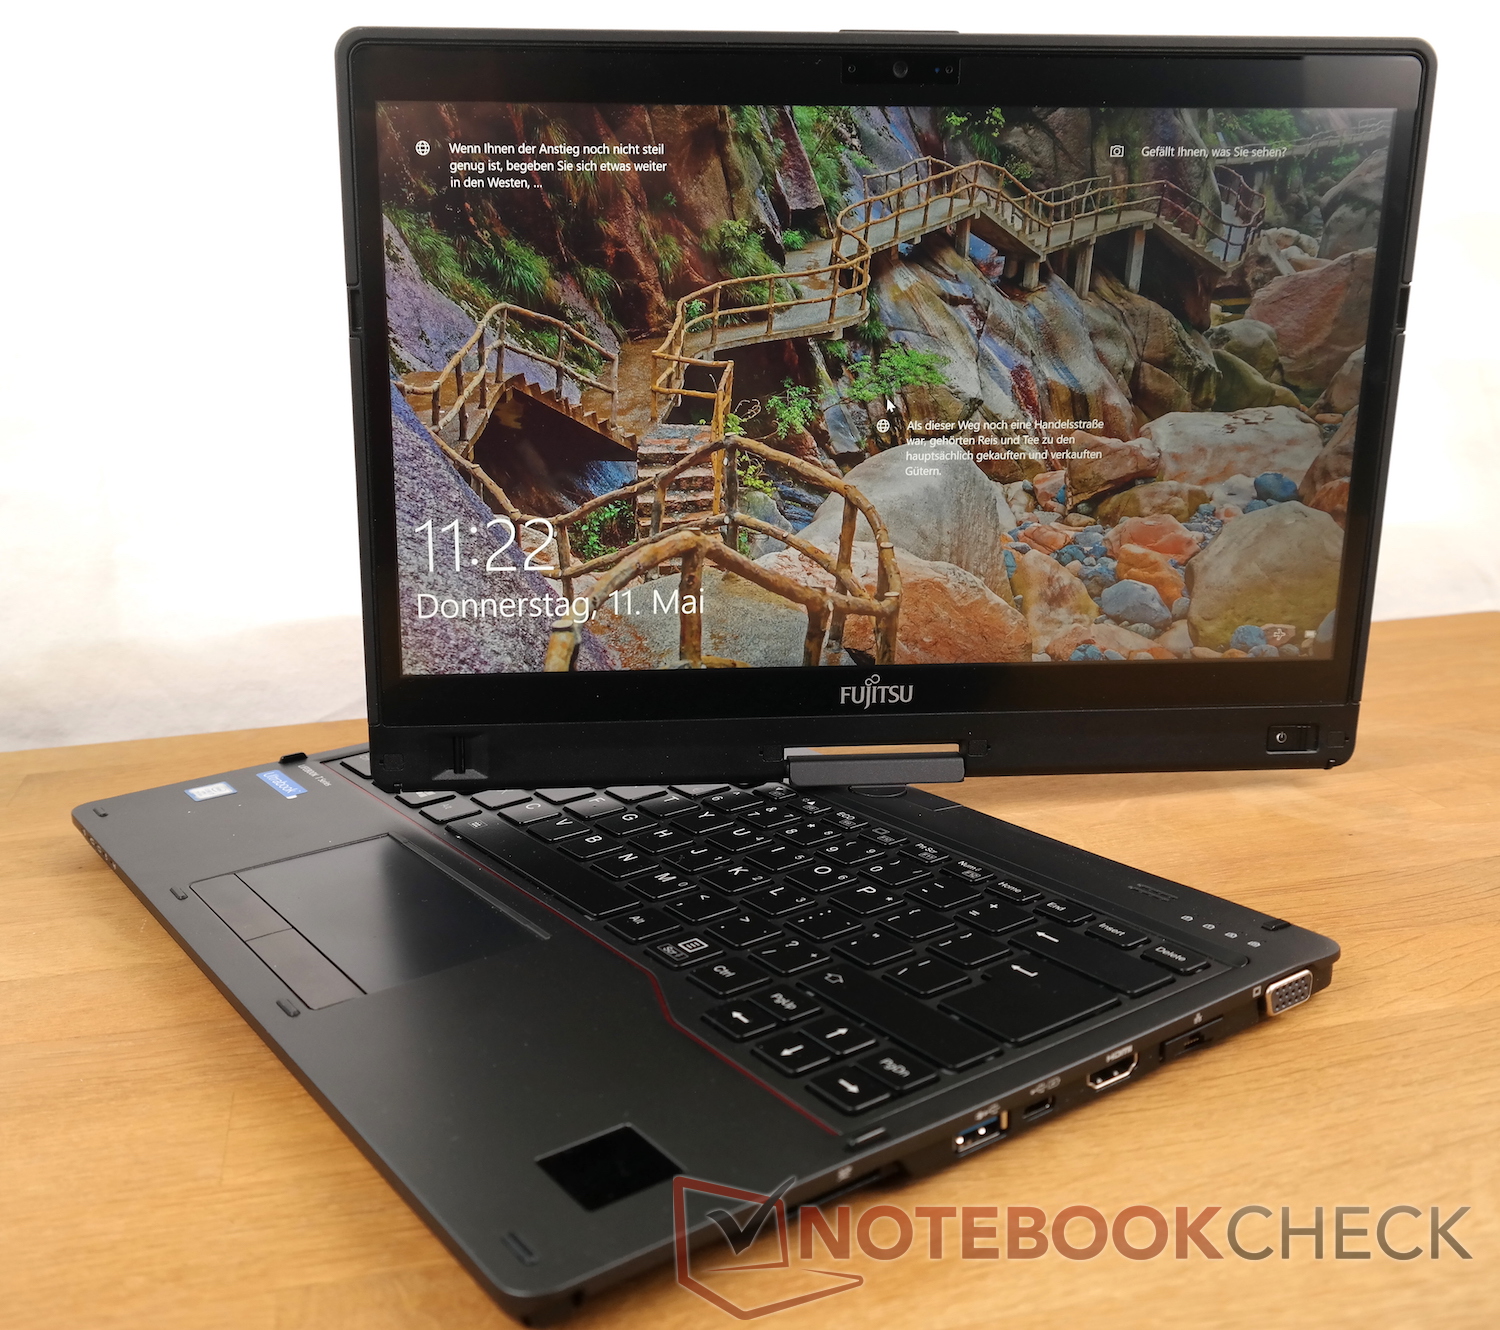
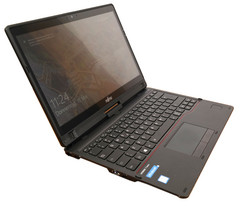
Breve Análise do Conversível Fujitsu Lifebook T937 (i7, 512 GB)
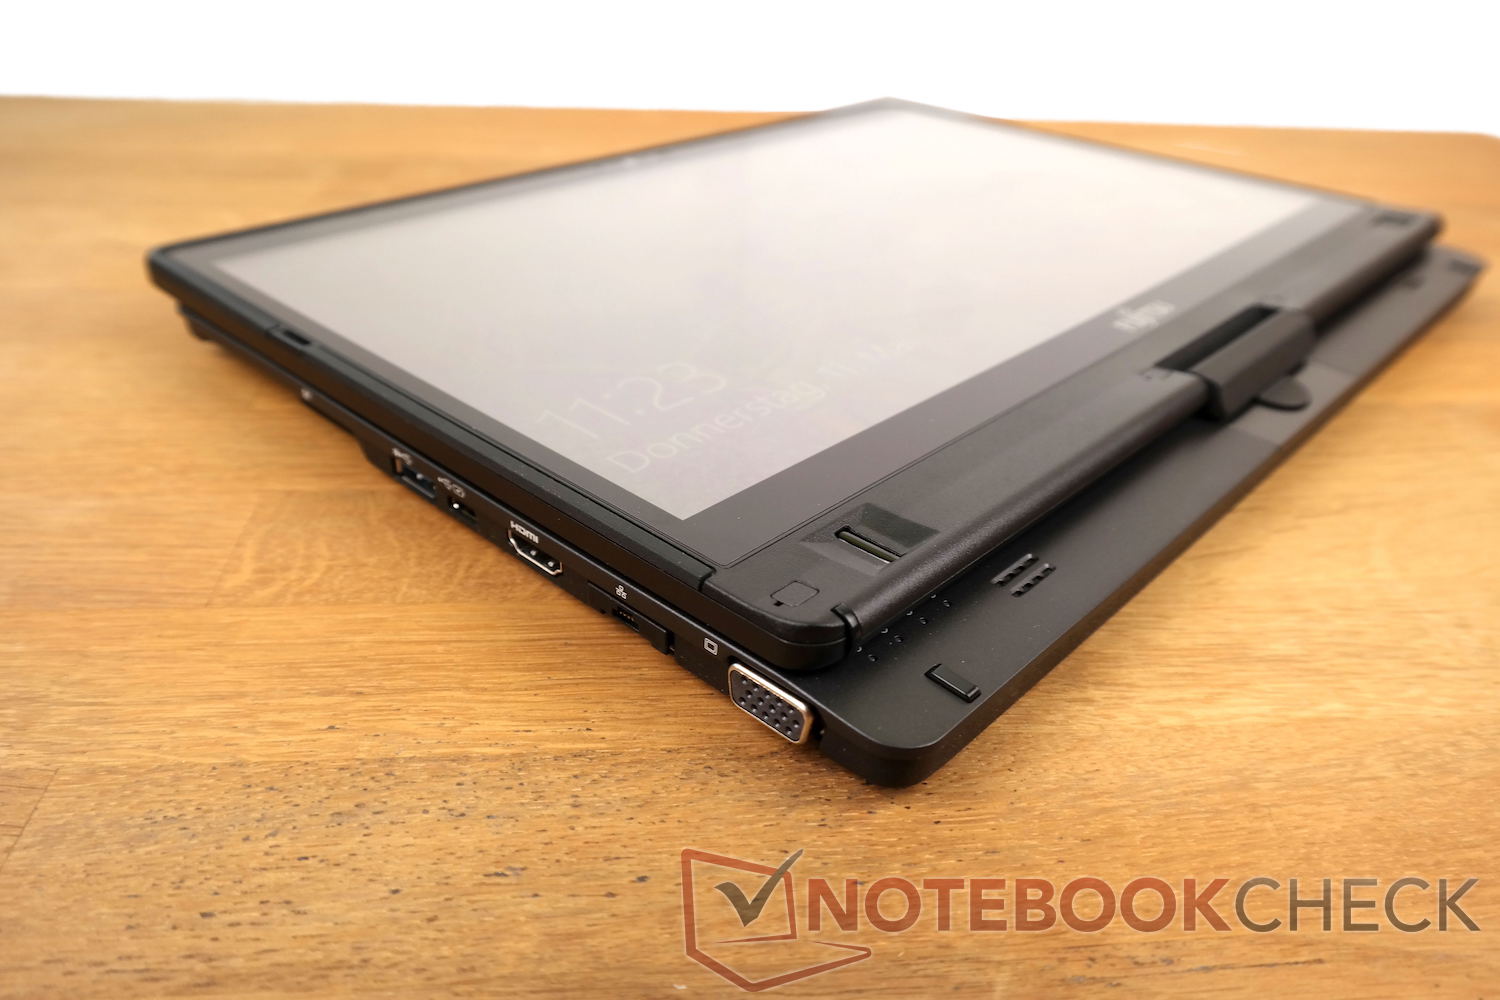

| SD Card Reader | |
| average JPG Copy Test (av. of 3 runs) | |
| Fujitsu Lifebook T937 | |
| HP EliteBook 820 G4 Z2V72ET | |
| Dell Latitude 12 5285 2-in-1 | |
| maximum AS SSD Seq Read Test (1GB) | |
| Fujitsu Lifebook T937 | |
| Dell Latitude 12 5285 2-in-1 | |
| HP EliteBook 820 G4 Z2V72ET | |
| Networking | |
| iperf3 transmit AX12 | |
| Asus Transformer 3 Pro T303UA-GN050T | |
| Fujitsu Lifebook T937 | |
| HP EliteBook 820 G4 Z2V72ET (jseb) | |
| Dell Latitude 12 5285 2-in-1 | |
| iperf3 receive AX12 | |
| Fujitsu Lifebook T937 | |
| Asus Transformer 3 Pro T303UA-GN050T | |
| HP EliteBook 820 G4 Z2V72ET (jseb) | |
| Dell Latitude 12 5285 2-in-1 | |
| |||||||||||||||||||||||||
iluminação: 87 %
iluminação com acumulador: 236 cd/m²
Contraste: 1311:1 (Preto: 0.18 cd/m²)
ΔE ColorChecker Calman: 4.25 | ∀{0.5-29.43 Ø4.72}
ΔE Greyscale Calman: 2.5 | ∀{0.09-98 Ø4.97}
62% sRGB (Argyll 1.6.3 3D)
39% AdobeRGB 1998 (Argyll 1.6.3 3D)
42.48% AdobeRGB 1998 (Argyll 3D)
61.6% sRGB (Argyll 3D)
41.08% Display P3 (Argyll 3D)
Gamma: 2.48
CCT: 7082 K
| Fujitsu Lifebook T937 Sharp SHP141B , , 1920x1080, 13.3" | Dell Latitude 12 5285 2-in-1 BOE06DC, , 1920x1280, 12.3" | Asus Transformer 3 Pro T303UA-GN050T BOE BOE06AC (NV126A1M-N51), , 2880x1920, 12.6" | Lenovo Thinkpad X1 Yoga 20FQ-000QUS VVX14T058J10, , 2560x1440, 14" | HP EliteBook 820 G4 Z2V72ET Chi Mei, , 1920x1080, 12.5" | |
|---|---|---|---|---|---|
| Display | 53% | 84% | 63% | 7% | |
| Display P3 Coverage (%) | 41.08 | 62.8 53% | 81.8 99% | 68.1 66% | 44.45 8% |
| sRGB Coverage (%) | 61.6 | 94 53% | 98.3 60% | 97.2 58% | 65.5 6% |
| AdobeRGB 1998 Coverage (%) | 42.48 | 64.7 52% | 82.2 94% | 70.2 65% | 46.04 8% |
| Response Times | 6% | 22% | 11% | 22% | |
| Response Time Grey 50% / Grey 80% * (ms) | 46 ? | 42.4 ? 8% | 30 ? 35% | 38 ? 17% | 35 ? 24% |
| Response Time Black / White * (ms) | 32 ? | 30.8 ? 4% | 29 ? 9% | 30.4 ? 5% | 26 ? 19% |
| PWM Frequency (Hz) | 212 ? | 210.1 ? | 200 ? | 219 ? | |
| Screen | 11% | 3% | -24% | -31% | |
| Brightness middle (cd/m²) | 236 | 523.2 122% | 316 34% | 284.7 21% | 326 38% |
| Brightness (cd/m²) | 219 | 522 138% | 307 40% | 272 24% | 304 39% |
| Brightness Distribution (%) | 87 | 88 1% | 91 5% | 89 2% | 81 -7% |
| Black Level * (cd/m²) | 0.18 | 0.42 -133% | 0.29 -61% | 0.383 -113% | 0.29 -61% |
| Contrast (:1) | 1311 | 1246 -5% | 1090 -17% | 743 -43% | 1124 -14% |
| Colorchecker dE 2000 * | 4.25 | 4 6% | 3.91 8% | 5.24 -23% | 6.49 -53% |
| Colorchecker dE 2000 max. * | 7.4 | 8.6 -16% | 7.9 -7% | 11.22 -52% | 15.95 -116% |
| Greyscale dE 2000 * | 2.5 | 5.5 -120% | 5.37 -115% | 7.32 -193% | 6.16 -146% |
| Gamma | 2.48 89% | 2.16 102% | 2.36 93% | 2.22 99% | 2.32 95% |
| CCT | 7082 92% | 7546 86% | 7812 83% | 6277 104% | 7575 86% |
| Color Space (Percent of AdobeRGB 1998) (%) | 39 | 64.86 66% | 72 85% | 70.17 80% | 42 8% |
| Color Space (Percent of sRGB) (%) | 62 | 93.97 52% | 98 58% | 94.68 53% | 65 5% |
| Média Total (Programa/Configurações) | 23% /
19% | 36% /
22% | 17% /
-2% | -1% /
-16% |
* ... menor é melhor
Exibir tempos de resposta
| ↔ Tempo de resposta preto para branco | ||
|---|---|---|
| 32 ms ... ascensão ↗ e queda ↘ combinadas | ↗ 18 ms ascensão | 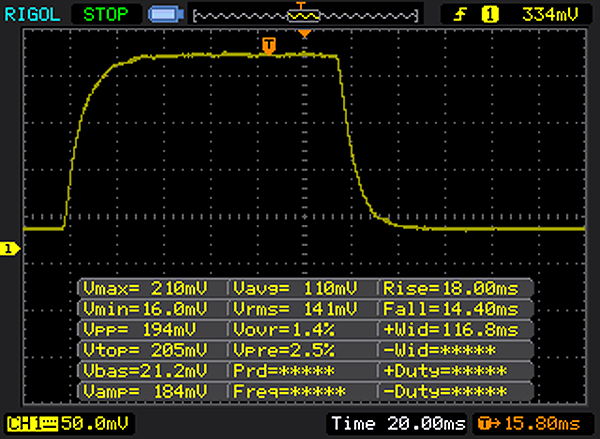 |
| ↘ 14 ms queda | ||
| A tela mostra taxas de resposta lentas em nossos testes e será insatisfatória para os jogadores. Em comparação, todos os dispositivos testados variam de 0.1 (mínimo) a 240 (máximo) ms. » 86 % de todos os dispositivos são melhores. Isso significa que o tempo de resposta medido é pior que a média de todos os dispositivos testados (19.8 ms). | ||
| ↔ Tempo de resposta 50% cinza a 80% cinza | ||
| 46 ms ... ascensão ↗ e queda ↘ combinadas | ↗ 22 ms ascensão | 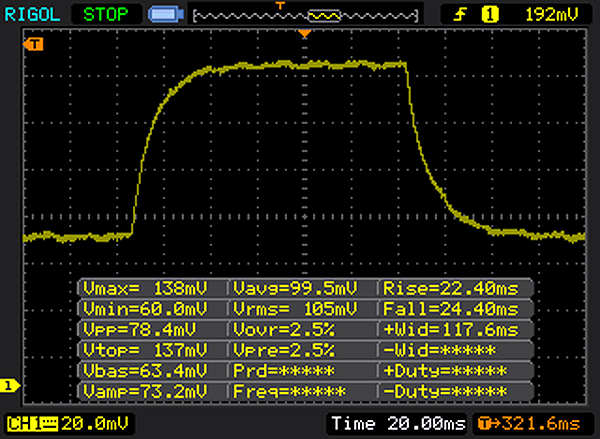 |
| ↘ 24 ms queda | ||
| A tela mostra taxas de resposta lentas em nossos testes e será insatisfatória para os jogadores. Em comparação, todos os dispositivos testados variam de 0.165 (mínimo) a 636 (máximo) ms. » 79 % de todos os dispositivos são melhores. Isso significa que o tempo de resposta medido é pior que a média de todos os dispositivos testados (31 ms). | ||
Cintilação da tela / PWM (modulação por largura de pulso)
| Tela tremeluzindo/PWM detectado | 212 Hz | ≤ 30 % configuração de brilho | 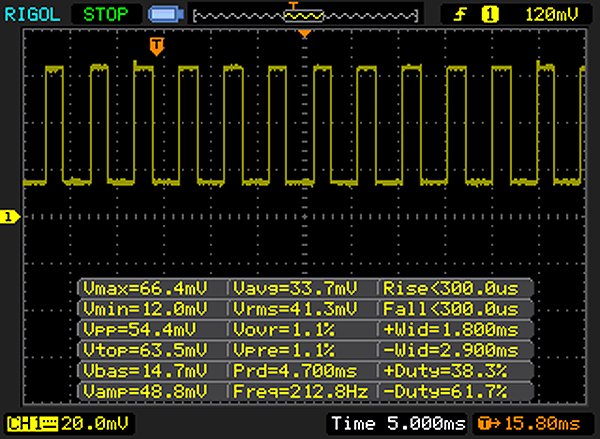 |
A luz de fundo da tela pisca em 212 Hz (pior caso, por exemplo, utilizando PWM) Cintilação detectada em uma configuração de brilho de 30 % e abaixo. Não deve haver cintilação ou PWM acima desta configuração de brilho. A frequência de 212 Hz é relativamente baixa, portanto, usuários sensíveis provavelmente notarão cintilação e sentirão fadiga ocular na configuração de brilho indicada e abaixo. [pwm_comparison] Em comparação: 52 % de todos os dispositivos testados não usam PWM para escurecer a tela. Se PWM foi detectado, uma média de 7781 (mínimo: 5 - máximo: 343500) Hz foi medida. | |||
| PCMark 8 Home Score Accelerated v2 | 3048 pontos | |
| PCMark 8 Creative Score Accelerated v2 | 4029 pontos | |
| PCMark 8 Work Score Accelerated v2 | 4286 pontos | |
Ajuda | ||
| Fujitsu Lifebook T937 | Dell Latitude 12 5285 2-in-1 Samsung PM961 MZVLW256HEHP | Asus Transformer 3 Pro T303UA-GN050T SK Hynix Canvas SC300 512GB M.2 (HFS512G39MND) | Lenovo Thinkpad X1 Yoga 20FQ-000QUS Samsung SSD PM871 MZNLN512HCJH | HP EliteBook 820 G4 Z2V72ET Samsung PM951 NVMe MZVLV512 | |
|---|---|---|---|---|---|
| CrystalDiskMark 3.0 | 53% | -21% | -7% | 74% | |
| Read Seq (MB/s) | 549 | 1294 136% | 398.9 -27% | 512 -7% | 1315 140% |
| Write Seq (MB/s) | 526 | 865 64% | 402 -24% | 443.8 -16% | 594 13% |
| Read 512 (MB/s) | 406 | 303.1 | 363.1 | 661 | |
| Write 512 (MB/s) | 589 | 320.3 | 377.8 | 594 | |
| Read 4k (MB/s) | 34.71 | 31.75 -9% | 26.11 -25% | 33.99 -2% | 42.87 24% |
| Write 4k (MB/s) | 89.6 | 72.2 -19% | 57.7 -36% | 81.9 -9% | 151.6 69% |
| Read 4k QD32 (MB/s) | 279.3 | 493.3 77% | 245.8 -12% | 327.4 17% | 568 103% |
| Write 4k QD32 (MB/s) | 255.8 | 434.5 70% | 253.8 -1% | 189.2 -26% | 491.7 92% |

| 3DMark Cloud Gate Standard Score | 3369 pontos | |
Ajuda | ||
| BioShock Infinite - 1280x720 Very Low Preset | |
| Dell Latitude 12 5285 2-in-1 | |
| Lenovo Thinkpad X1 Yoga 20FQ-000QUS | |
| Asus Transformer 3 Pro T303UA-GN050T | |
| HP EliteBook 820 G4 Z2V72ET | |
| Fujitsu Lifebook T937 | |
| baixo | média | alto | ultra | |
|---|---|---|---|---|
| BioShock Infinite (2013) | 33.72 | 10.98 | 9.52 | 7 |
Barulho
| Ocioso |
| 30 / 30 / 30 dB |
| Carga |
| 37.4 / 37.6 dB |
 | ||
30 dB silencioso 40 dB(A) audível 50 dB(A) ruidosamente alto |
||
min: | ||
(+) A temperatura máxima no lado superior é 35.2 °C / 95 F, em comparação com a média de 35.4 °C / 96 F , variando de 19.6 a 60 °C para a classe Convertible.
(+) A parte inferior aquece até um máximo de 33.9 °C / 93 F, em comparação com a média de 36.9 °C / 98 F
(+) Em uso inativo, a temperatura média para o lado superior é 22.1 °C / 72 F, em comparação com a média do dispositivo de 30.3 °C / ### class_avg_f### F.
(+) Os apoios para as mãos e o touchpad são mais frios que a temperatura da pele, com um máximo de 23.8 °C / 74.8 F e, portanto, são frios ao toque.
(+) A temperatura média da área do apoio para as mãos de dispositivos semelhantes foi 28 °C / 82.4 F (+4.2 °C / 7.6 F).
Fujitsu Lifebook T937 análise de áudio
(-) | alto-falantes não muito altos (###valor### dB)
Graves 100 - 315Hz
(-) | quase nenhum baixo - em média 20.9% menor que a mediana
(+) | o baixo é linear (3.3% delta para a frequência anterior)
Médios 400 - 2.000 Hz
(±) | médios reduzidos - em média 7% menor que a mediana
(±) | a linearidade dos médios é média (8.1% delta para frequência anterior)
Altos 2 - 16 kHz
(+) | agudos equilibrados - apenas 4.3% longe da mediana
(+) | os máximos são lineares (6.3% delta da frequência anterior)
Geral 100 - 16.000 Hz
(±) | a linearidade do som geral é média (26.5% diferença em relação à mediana)
Comparado com a mesma classe
» 82% de todos os dispositivos testados nesta classe foram melhores, 3% semelhantes, 15% piores
» O melhor teve um delta de 6%, a média foi 20%, o pior foi 57%
Comparado com todos os dispositivos testados
» 81% de todos os dispositivos testados foram melhores, 4% semelhantes, 15% piores
» O melhor teve um delta de 4%, a média foi 24%, o pior foi 134%
Apple MacBook 12 (Early 2016) 1.1 GHz análise de áudio
(+) | os alto-falantes podem tocar relativamente alto (###valor### dB)
Graves 100 - 315Hz
(±) | graves reduzidos - em média 11.3% menor que a mediana
(±) | a linearidade dos graves é média (14.2% delta para a frequência anterior)
Médios 400 - 2.000 Hz
(+) | médios equilibrados - apenas 2.4% longe da mediana
(+) | médios são lineares (5.5% delta para frequência anterior)
Altos 2 - 16 kHz
(+) | agudos equilibrados - apenas 2% longe da mediana
(+) | os máximos são lineares (4.5% delta da frequência anterior)
Geral 100 - 16.000 Hz
(+) | o som geral é linear (10.2% diferença em relação à mediana)
Comparado com a mesma classe
» 7% de todos os dispositivos testados nesta classe foram melhores, 2% semelhantes, 91% piores
» O melhor teve um delta de 5%, a média foi 18%, o pior foi 53%
Comparado com todos os dispositivos testados
» 5% de todos os dispositivos testados foram melhores, 1% semelhantes, 94% piores
» O melhor teve um delta de 4%, a média foi 24%, o pior foi 134%
| desligado | |
| Ocioso | |
| Carga |
|
Key:
min: | |
| Fujitsu Lifebook T937 i7-7600U, HD Graphics 620, , IPS, 1920x1080, 13.3" | Dell Latitude 12 5285 2-in-1 i7-7600U, HD Graphics 620, Samsung PM961 MZVLW256HEHP, IPS, 1920x1280, 12.3" | Asus Transformer 3 Pro T303UA-GN050T 6500U, HD Graphics 520, SK Hynix Canvas SC300 512GB M.2 (HFS512G39MND), IPS, 2880x1920, 12.6" | Lenovo Thinkpad X1 Yoga 20FQ-000QUS 6500U, HD Graphics 520, Samsung SSD PM871 MZNLN512HCJH, IPS, 2560x1440, 14" | HP EliteBook 820 G4 Z2V72ET i7-7500U, HD Graphics 620, Samsung PM951 NVMe MZVLV512, IPS, 1920x1080, 12.5" | |
|---|---|---|---|---|---|
| Power Consumption | -3% | -46% | -57% | 12% | |
| Idle Minimum * (Watt) | 3 | 2.85 5% | 6.7 -123% | 6.82 -127% | 2.7 10% |
| Idle Average * (Watt) | 6.8 | 6.76 1% | 10.3 -51% | 8.21 -21% | 4.8 29% |
| Idle Maximum * (Watt) | 7.7 | 6.91 10% | 13.5 -75% | 17.55 -128% | 6.6 14% |
| Load Average * (Watt) | 30 | 32.88 -10% | 26 13% | 28.81 4% | 28.5 5% |
| Load Maximum * (Watt) | 30.3 | 37.41 -23% | 28.8 5% | 34.07 -12% | 29 4% |
* ... menor é melhor
| Fujitsu Lifebook T937 i7-7600U, HD Graphics 620, 50 Wh | Dell Latitude 12 5285 2-in-1 i7-7600U, HD Graphics 620, 42 Wh | Asus Transformer 3 Pro T303UA-GN050T 6500U, HD Graphics 520, 39 Wh | Lenovo Thinkpad X1 Yoga 20FQ-000QUS 6500U, HD Graphics 520, 52 Wh | HP EliteBook 820 G4 Z2V72ET i7-7500U, HD Graphics 620, 49 Wh | |
|---|---|---|---|---|---|
| Duração da bateria | -15% | -53% | -25% | 17% | |
| Reader / Idle (h) | 17 | 17.9 5% | 7.1 -58% | 15.4 -9% | 22.4 32% |
| WiFi v1.3 (h) | 8.7 | 8.1 -7% | 3.7 -57% | 5.9 -32% | 9.4 8% |
| Load (h) | 3.1 | 1.8 -42% | 1.7 -45% | 2 -35% | 3.4 10% |
| H.264 (h) | 3.4 | 8.9 |
Pro
Contra
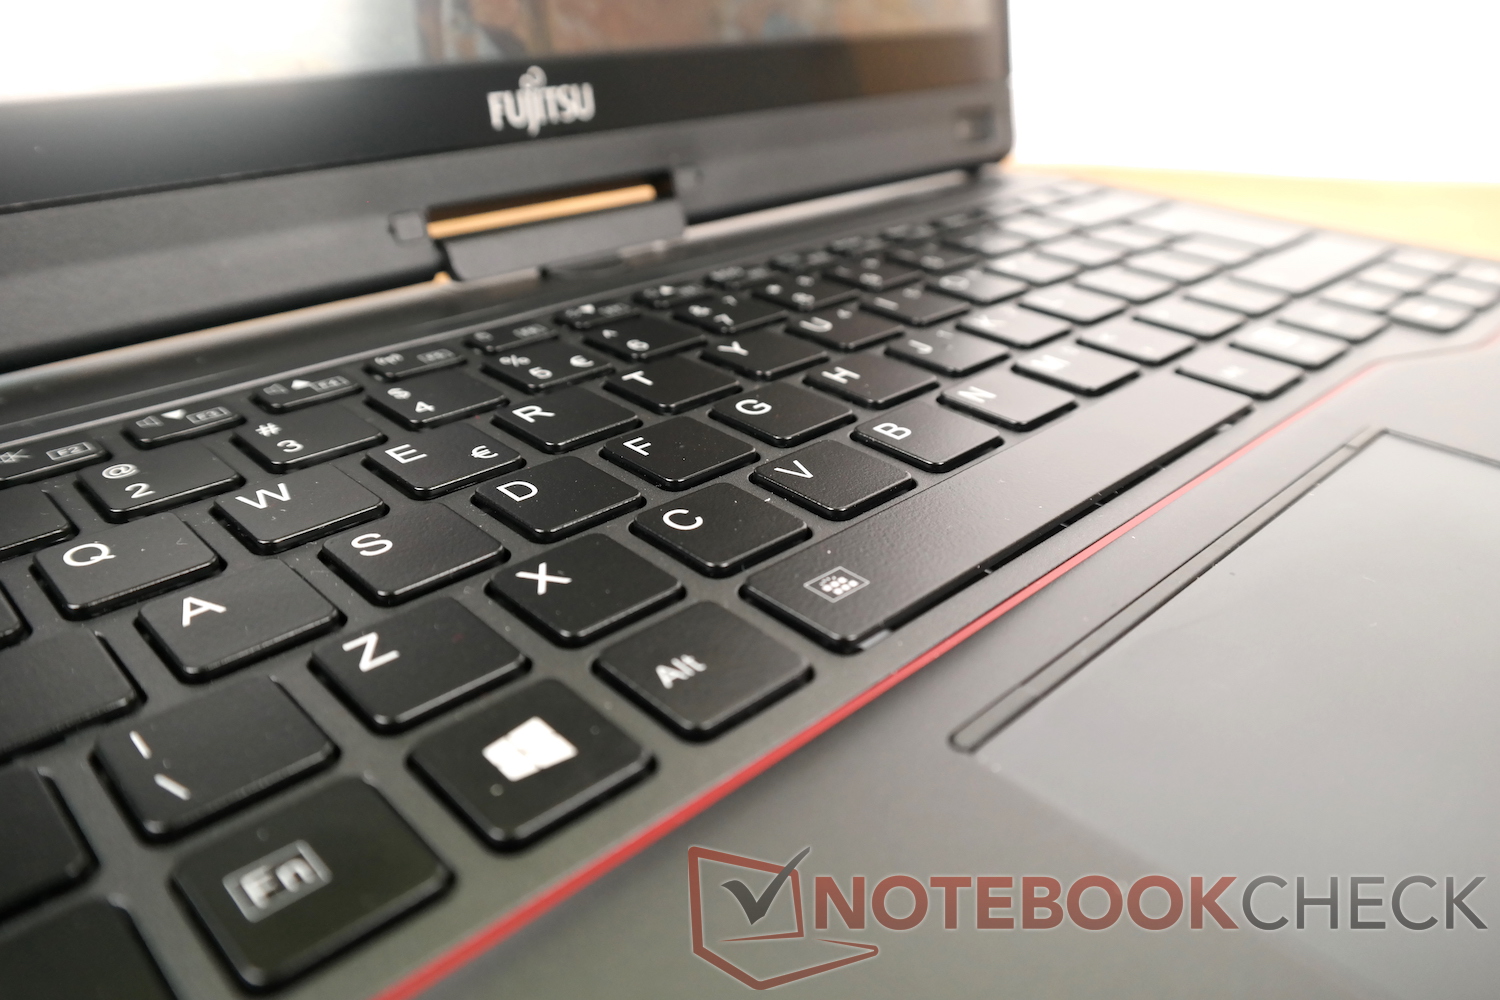
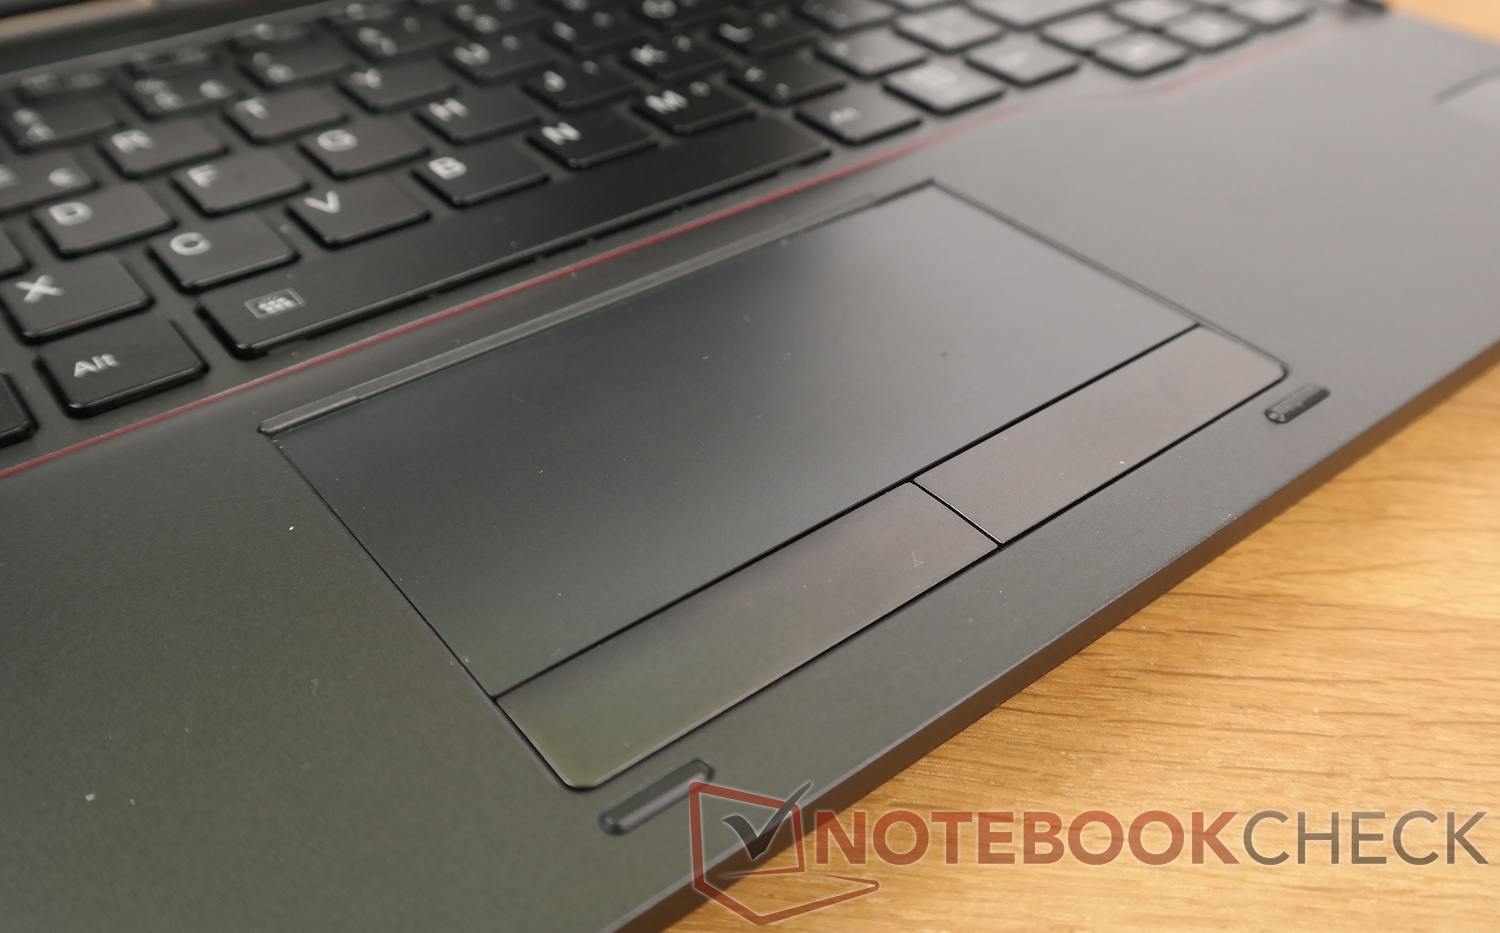
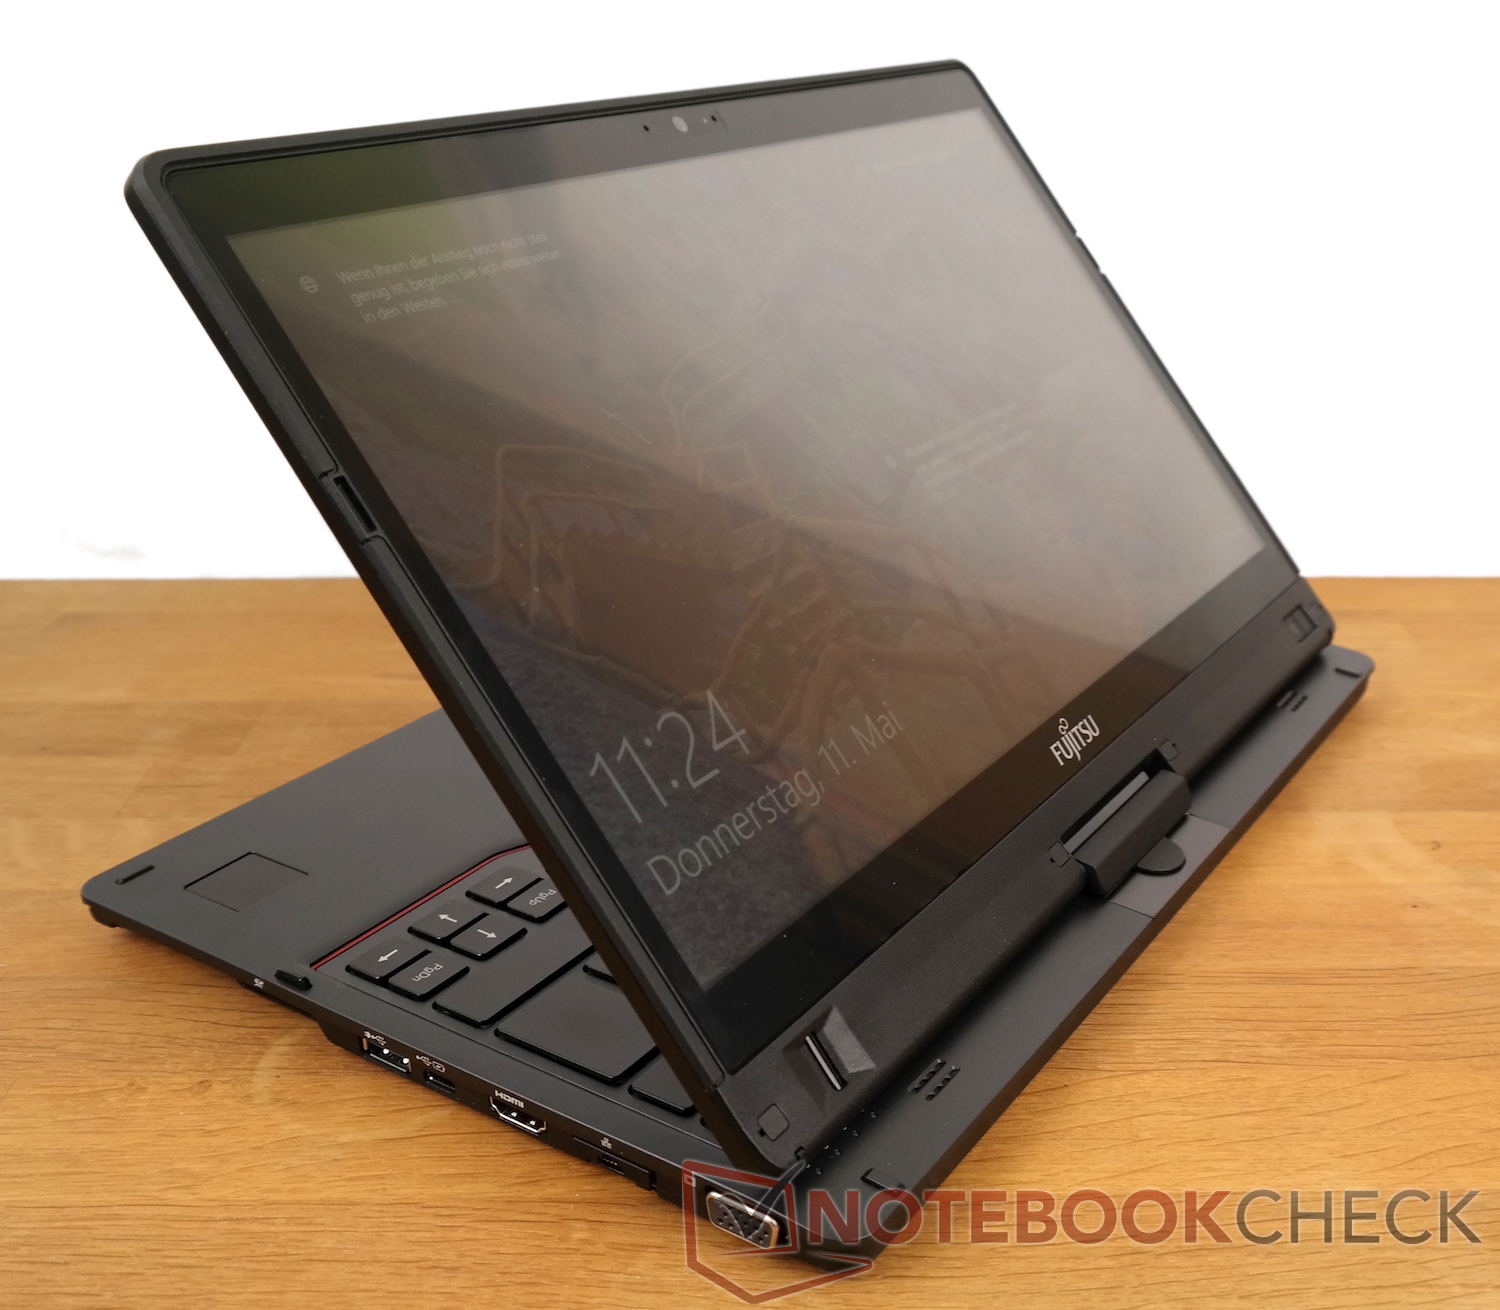
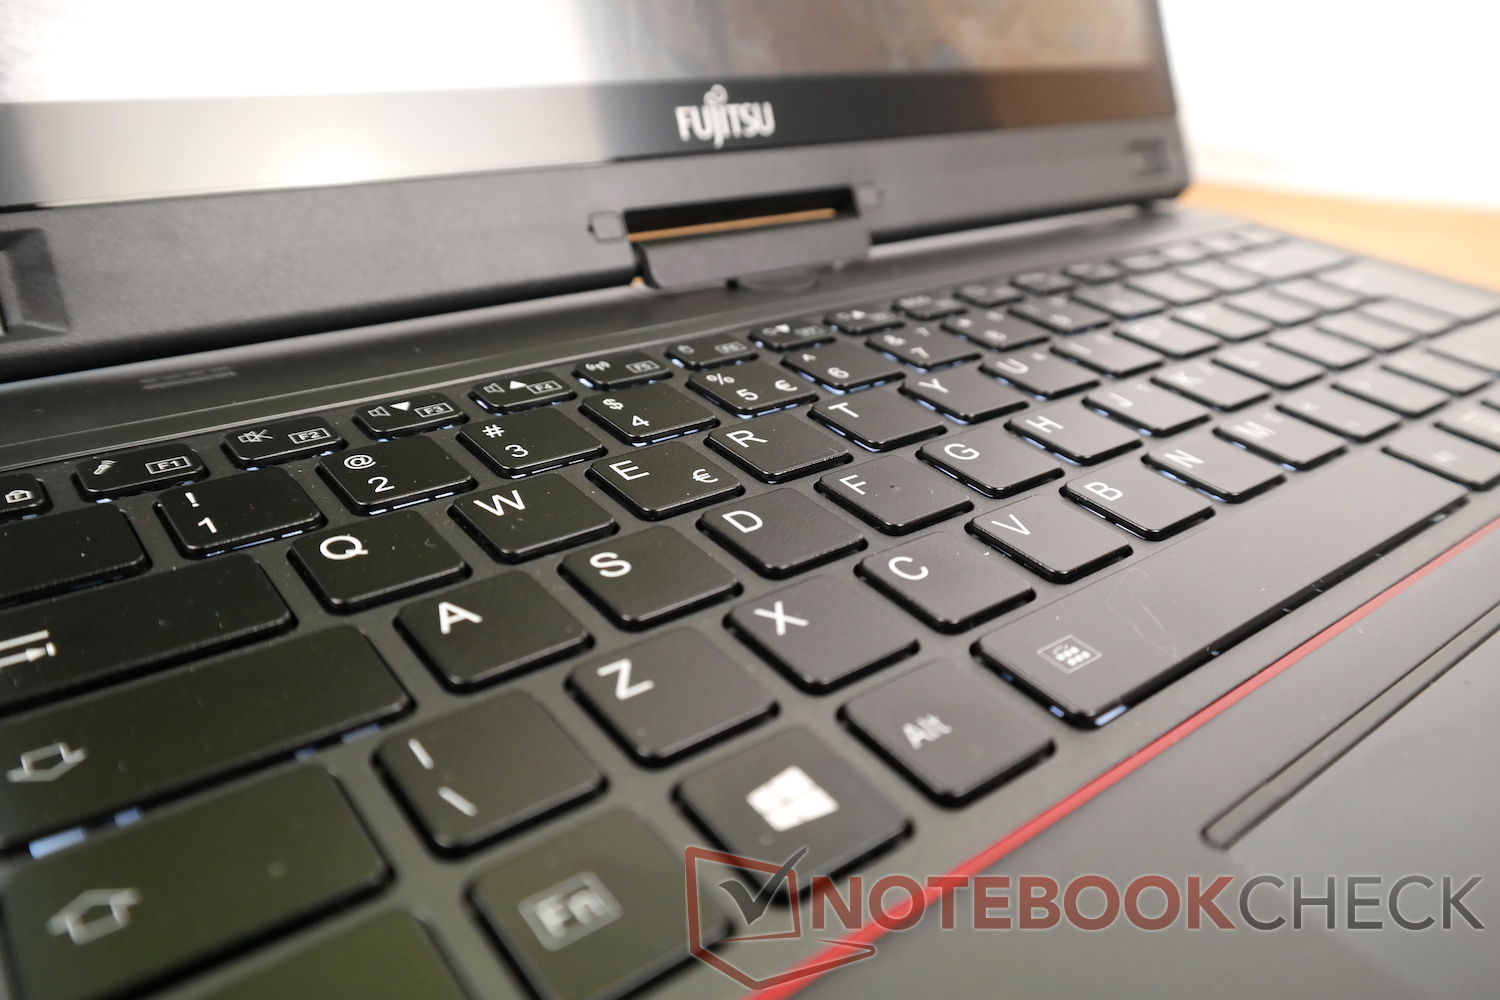
O Fujitsu Lifebook T937 deixa uma impressão mista no teste. Enquanto muitas características indicam um portátil sólido e com os pés no chão, sem experiências, ainda existem algumas fraquezas que não deveriam acontecer por esse preço. O aparelho não apenas se sai mal nos benchmarks, mas também tem algumas pausas inexplicáveis de tempos em tempos. Em combinação com o touchpad que aparece antiquado e o mecanismo rotativo da tela que parece antigo, você pode vê-lo como um aparelho para mais velhos e também para uma audiência que não é dissuadida pelo alto preço. No entanto, é questionável se sua visão, enfraquecida com a idade, pode compensar o baixo brilho da tela.
Um portátil sólido e nada emocionante, com fraquezas desagradáveis.
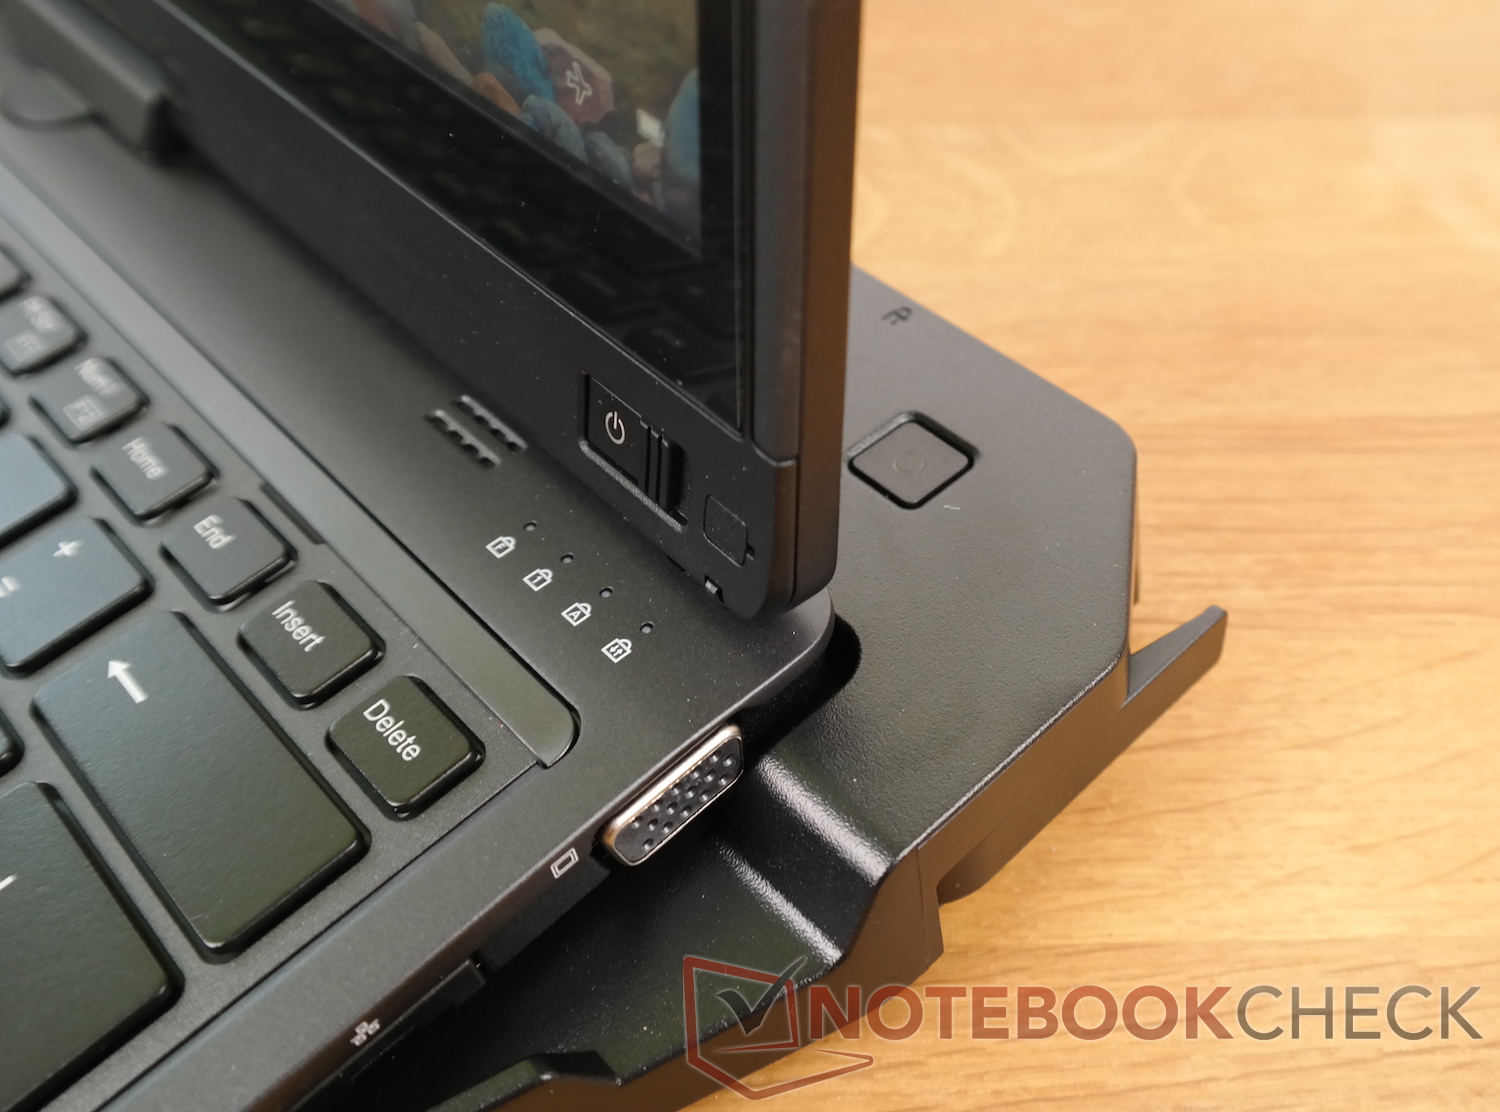
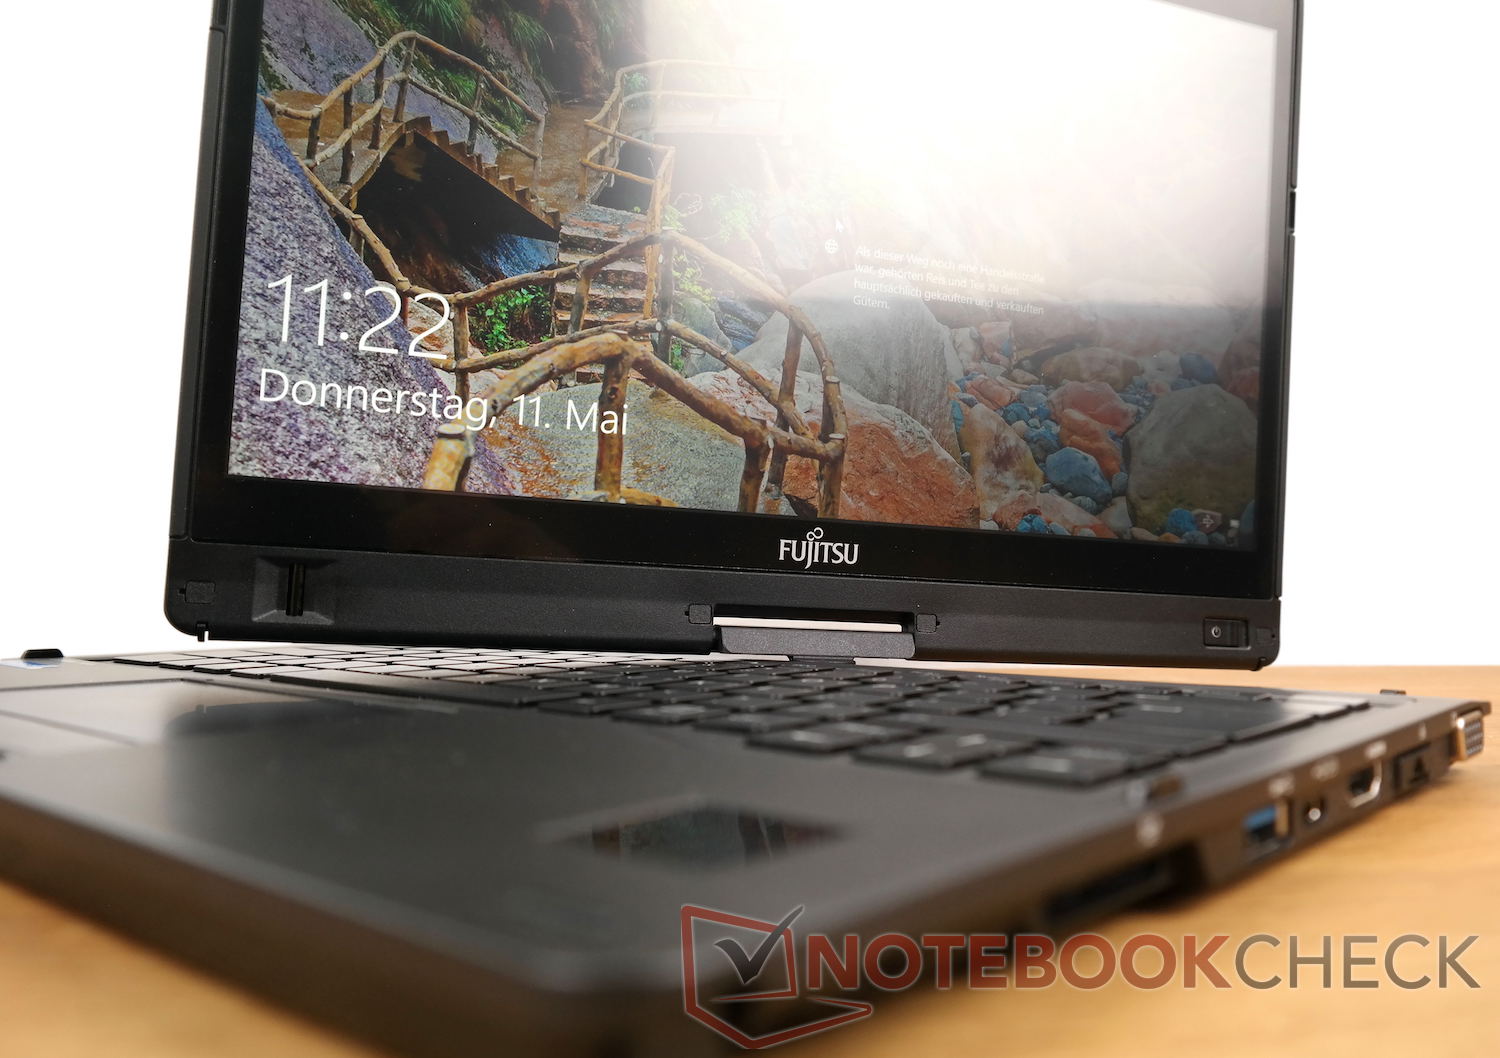
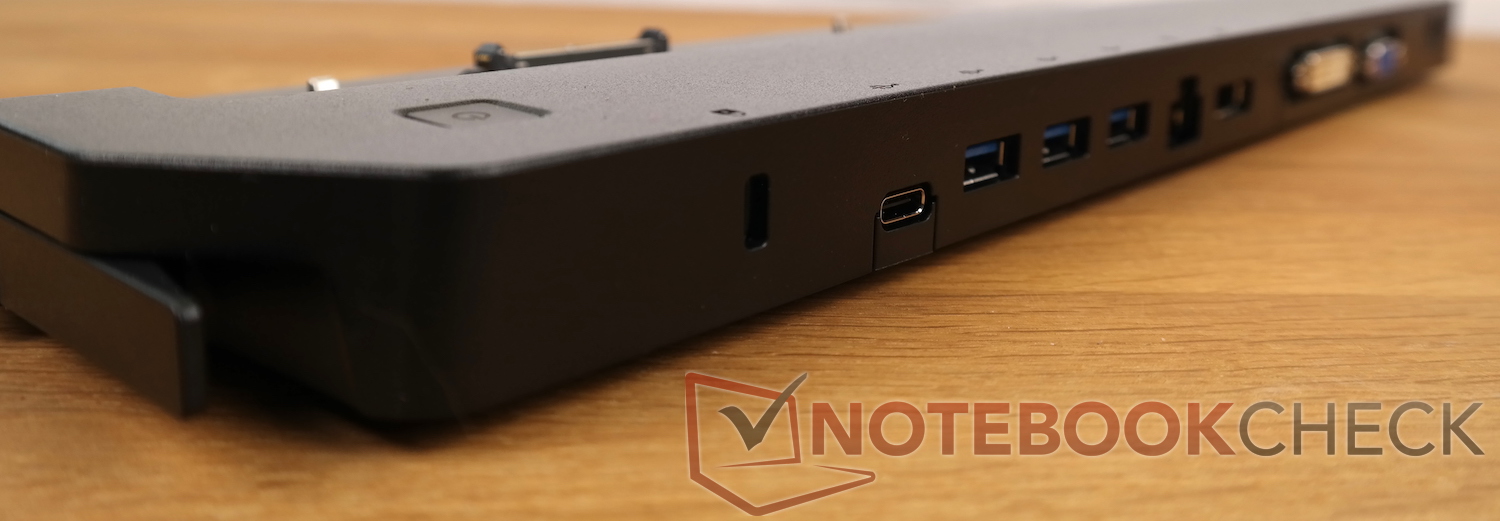
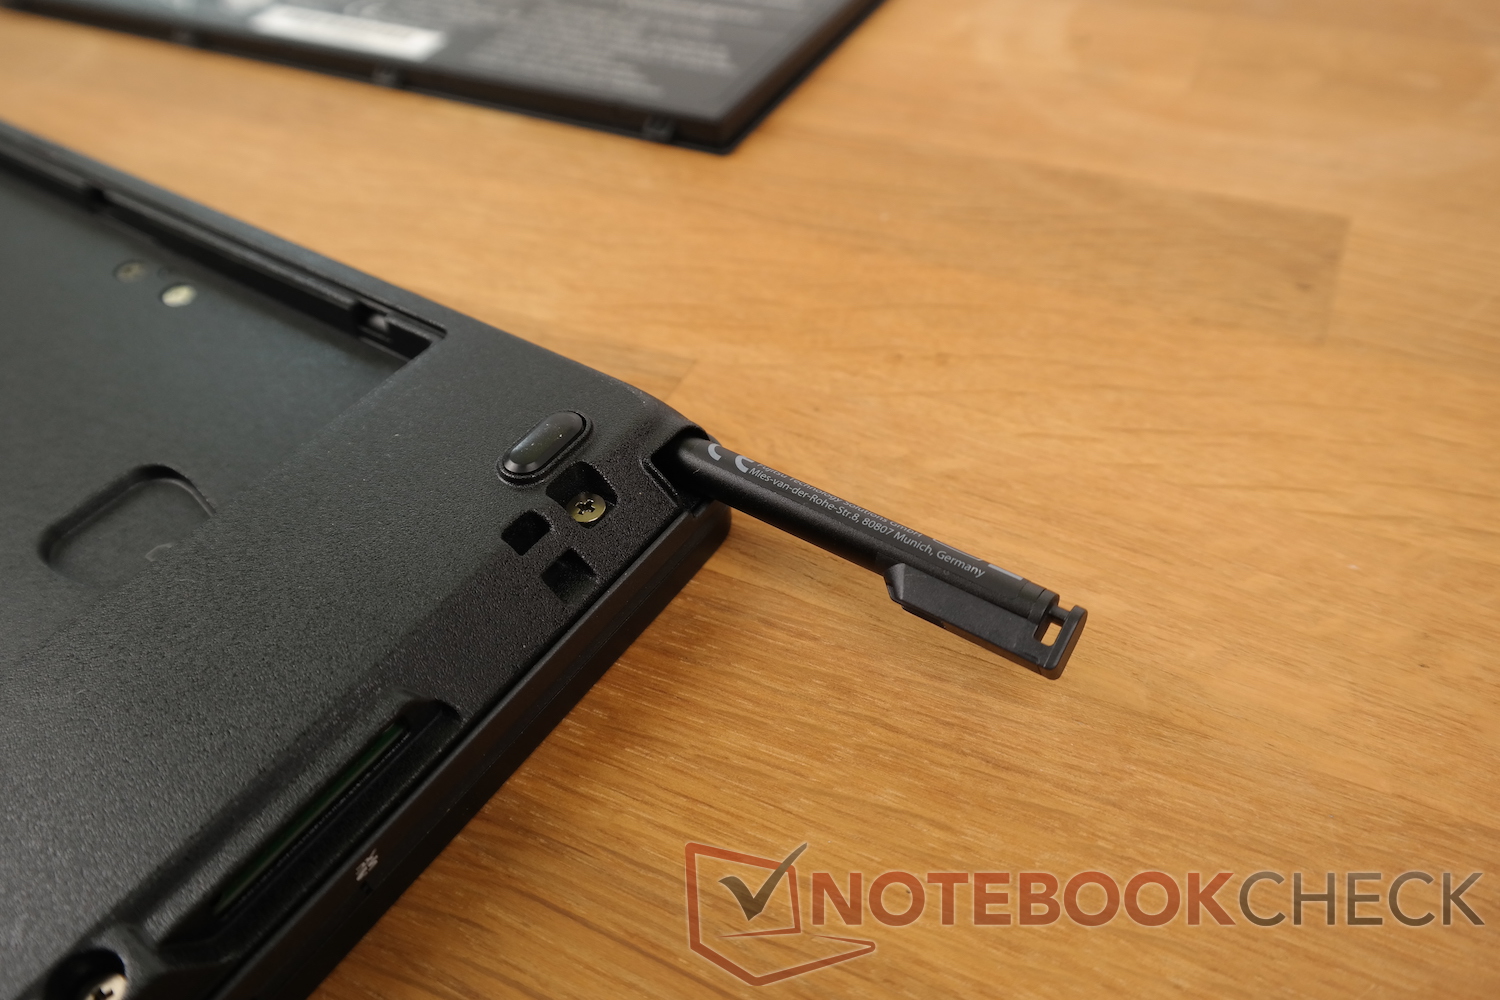
Além da tela ser muito escura e dos benchmarks fracos, há apenas pontos positivos para relatar: acabamento sólido, boa duração da bateria, muitas conexões e dispositivos de entrada, e a excelente adição de acessórios. Se você considerar o preço justificado, ainda pode ser o dispositivo ideal para o público-alvo.
Fujitsu Lifebook T937
- 11/13/2017 v6 (old)
Florian Schaar