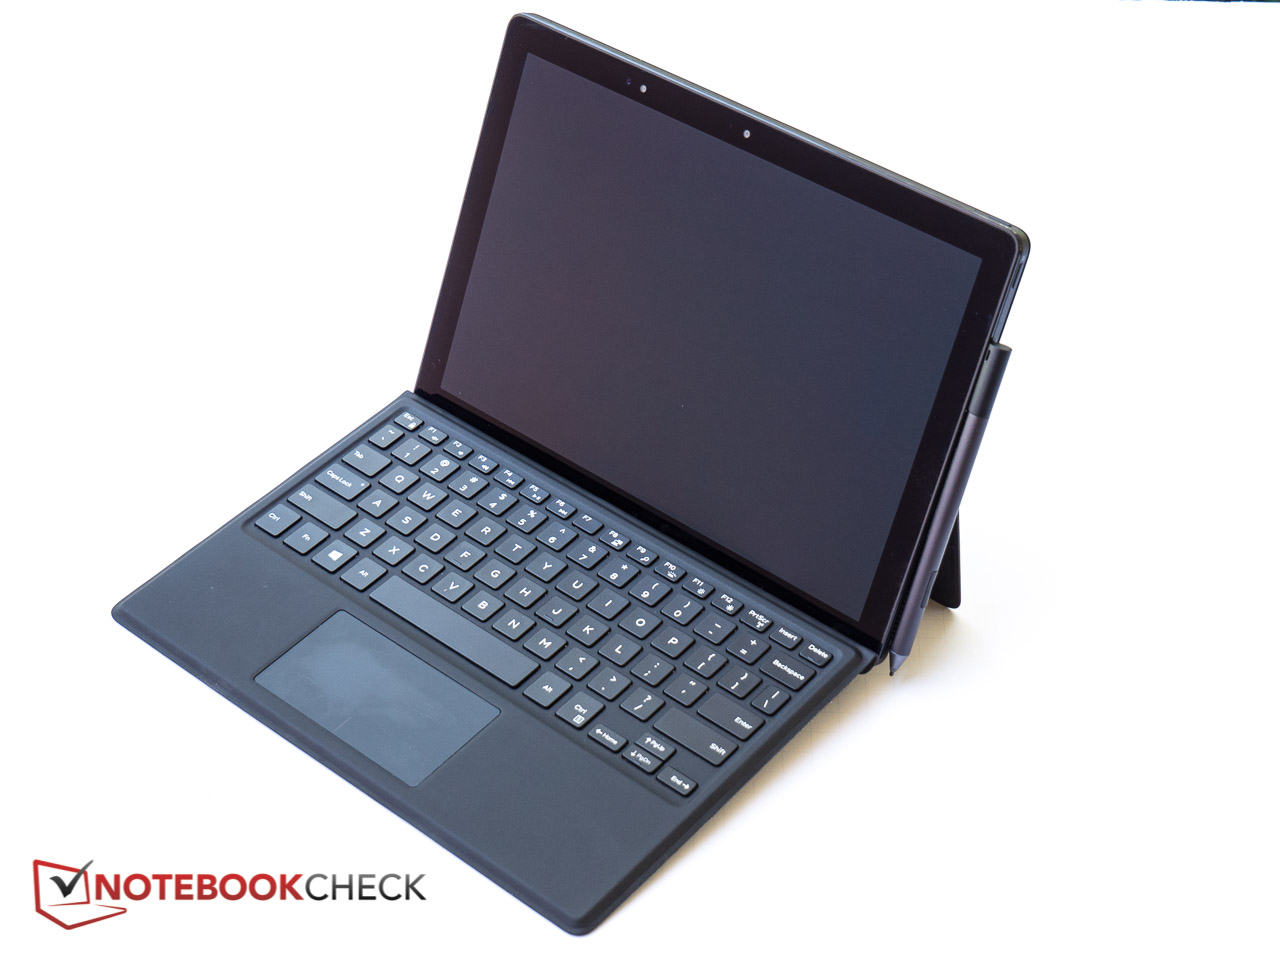
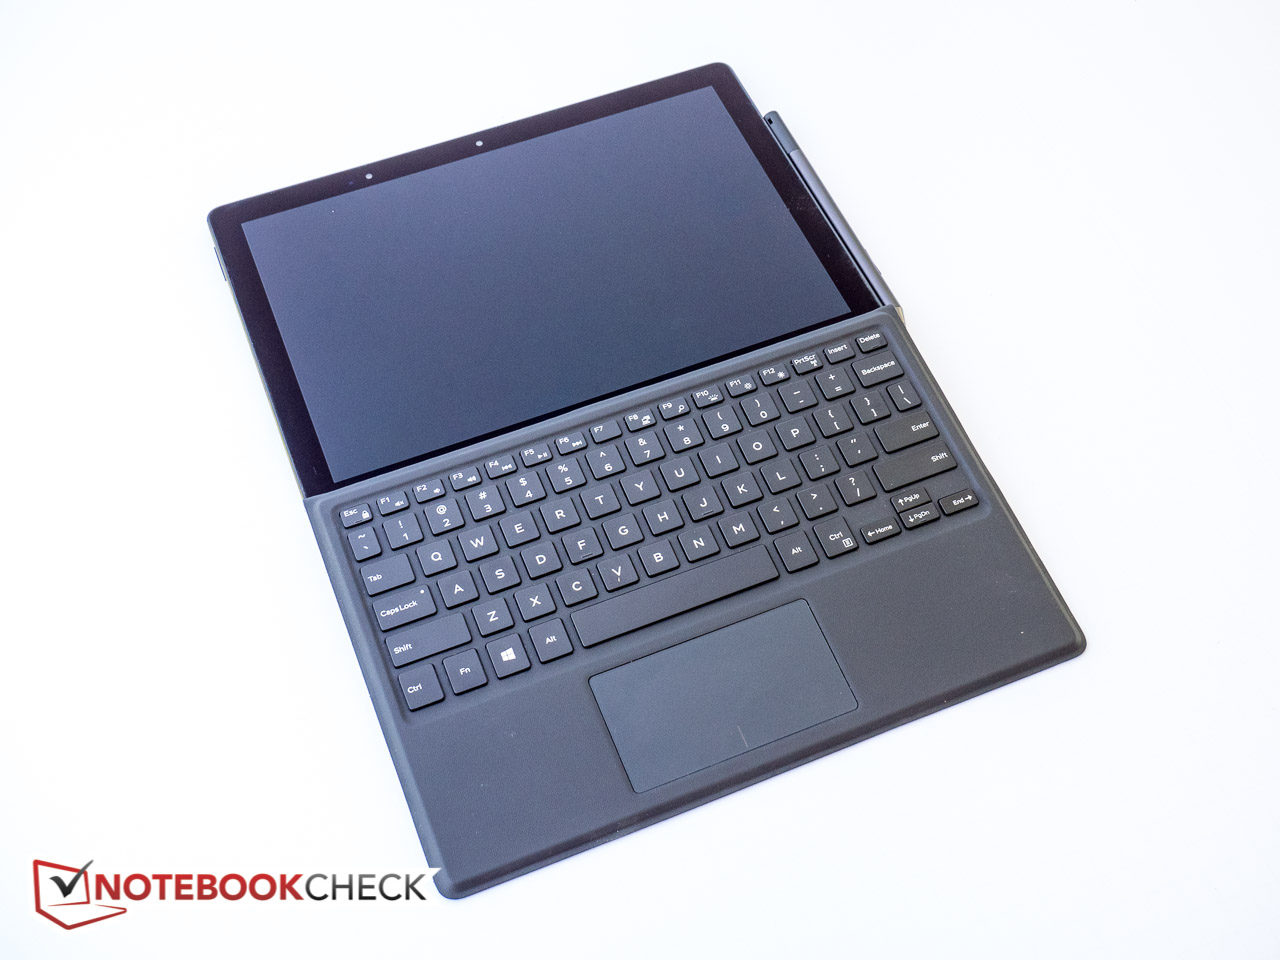
Breve Análise do Conversível 2-em-1 Dell Latitude 12 5285
| SD Card Reader | |
| average JPG Copy Test (av. of 3 runs) | |
| Dell Latitude 12 5285 2-in-1 | |
| maximum AS SSD Seq Read Test (1GB) | |
| Dell Latitude 12 5285 2-in-1 | |
| Networking | |
| iperf3 transmit AX12 | |
| Asus Transformer 3 Pro T303UA-GN050T | |
| Microsoft Surface Pro 4, Core i5, 128GB (Klaus I211) | |
| Dell Latitude 12 5285 2-in-1 | |
| iperf3 receive AX12 | |
| Asus Transformer 3 Pro T303UA-GN050T | |
| Microsoft Surface Pro 4, Core i5, 128GB (Klaus I211) | |
| Dell Latitude 12 5285 2-in-1 | |
| |||||||||||||||||||||||||
iluminação: 88 %
iluminação com acumulador: 523.2 cd/m²
Contraste: 1246:1 (Preto: 0.42 cd/m²)
ΔE ColorChecker Calman: 4 | ∀{0.5-29.43 Ø4.71}
ΔE Greyscale Calman: 5.5 | ∀{0.09-98 Ø4.96}
93.97% sRGB (Argyll 1.6.3 3D)
64.86% AdobeRGB 1998 (Argyll 1.6.3 3D)
64.7% AdobeRGB 1998 (Argyll 3D)
94% sRGB (Argyll 3D)
62.8% Display P3 (Argyll 3D)
Gamma: 2.16
CCT: 7546 K
| Dell Latitude 12 5285 2-in-1 BOE06DC, IPS, 12.3", 1920x1280 | Microsoft Surface Pro 4, Core i5, 128GB Samsung 123YL01-001 ID: SDC3853, IPS, 12.3", 2736x1824 | HP Elite x2 1012 G1 LG Philips, IPS, 12.1", 1920x1280 | Acer Aspire Switch Alpha 12 SA5-271-70EQ WST KL.1200W.002 WST2216, IPS, 12", 2160x1440 | Asus Transformer 3 Pro T303UA-GN050T BOE BOE06AC (NV126A1M-N51), IPS, 12.6", 2880x1920 | |
|---|---|---|---|---|---|
| Display | 4% | -18% | -12% | 21% | |
| Display P3 Coverage (%) | 62.8 | 65 4% | 53.8 -14% | 55.7 -11% | 81.8 30% |
| sRGB Coverage (%) | 94 | 96.5 3% | 73.7 -22% | 82.7 -12% | 98.3 5% |
| AdobeRGB 1998 Coverage (%) | 64.7 | 67 4% | 53.8 -17% | 56.9 -12% | 82.2 27% |
| Response Times | -5% | 24% | 30% | 18% | |
| Response Time Grey 50% / Grey 80% * (ms) | 42.4 ? | 46 ? -8% | 33.2 ? 22% | 21 ? 50% | 30 ? 29% |
| Response Time Black / White * (ms) | 30.8 ? | 31.2 ? -1% | 22.8 ? 26% | 28 ? 9% | 29 ? 6% |
| PWM Frequency (Hz) | 210.1 ? | 50 ? | 50 ? | 200 ? | |
| Screen | 1% | -24% | -33% | -3% | |
| Brightness middle (cd/m²) | 523.2 | 413 -21% | 322 -38% | 391 -25% | 316 -40% |
| Brightness (cd/m²) | 522 | 396 -24% | 319 -39% | 367 -30% | 307 -41% |
| Brightness Distribution (%) | 88 | 87 -1% | 97 10% | 87 -1% | 91 3% |
| Black Level * (cd/m²) | 0.42 | 0.36 14% | 0.42 -0% | 0.56 -33% | 0.29 31% |
| Contrast (:1) | 1246 | 1147 -8% | 767 -38% | 698 -44% | 1090 -13% |
| Colorchecker dE 2000 * | 4 | 3.09 23% | 6.02 -51% | 6.96 -74% | 3.91 2% |
| Colorchecker dE 2000 max. * | 8.6 | 10.06 -17% | 13.43 -56% | 7.9 8% | |
| Greyscale dE 2000 * | 5.5 | 3.92 29% | 6.29 -14% | 7.44 -35% | 5.37 2% |
| Gamma | 2.16 102% | 2.3 96% | 2.4 92% | 2.41 91% | 2.36 93% |
| CCT | 7546 86% | 7333 89% | 7712 84% | 8126 80% | 7812 83% |
| Color Space (Percent of AdobeRGB 1998) (%) | 64.86 | 61 -6% | 47.8 -26% | 53 -18% | 72 11% |
| Color Space (Percent of sRGB) (%) | 93.97 | 97 3% | 73.2 -22% | 83 -12% | 98 4% |
| Média Total (Programa/Configurações) | 0% /
1% | -6% /
-16% | -5% /
-20% | 12% /
4% |
* ... menor é melhor
Exibir tempos de resposta
| ↔ Tempo de resposta preto para branco | ||
|---|---|---|
| 30.8 ms ... ascensão ↗ e queda ↘ combinadas | ↗ 18 ms ascensão | 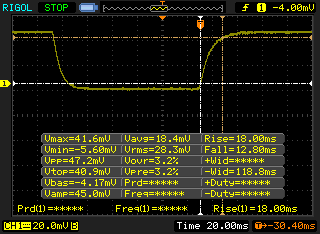 |
| ↘ 12.8 ms queda | ||
| A tela mostra taxas de resposta lentas em nossos testes e será insatisfatória para os jogadores. Em comparação, todos os dispositivos testados variam de 0.1 (mínimo) a 240 (máximo) ms. » 83 % de todos os dispositivos são melhores. Isso significa que o tempo de resposta medido é pior que a média de todos os dispositivos testados (19.8 ms). | ||
| ↔ Tempo de resposta 50% cinza a 80% cinza | ||
| 42.4 ms ... ascensão ↗ e queda ↘ combinadas | ↗ 20.4 ms ascensão | 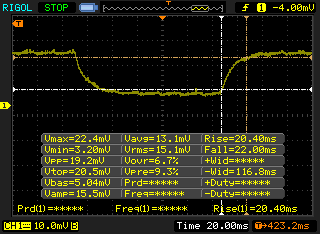 |
| ↘ 22 ms queda | ||
| A tela mostra taxas de resposta lentas em nossos testes e será insatisfatória para os jogadores. Em comparação, todos os dispositivos testados variam de 0.165 (mínimo) a 636 (máximo) ms. » 70 % de todos os dispositivos são melhores. Isso significa que o tempo de resposta medido é pior que a média de todos os dispositivos testados (31 ms). | ||
Cintilação da tela / PWM (modulação por largura de pulso)
| Tela tremeluzindo/PWM detectado | 210.1 Hz | ≤ 99 % configuração de brilho | 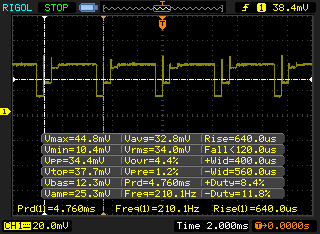 |
A luz de fundo da tela pisca em 210.1 Hz (pior caso, por exemplo, utilizando PWM) Cintilação detectada em uma configuração de brilho de 99 % e abaixo. Não deve haver cintilação ou PWM acima desta configuração de brilho. A frequência de 210.1 Hz é relativamente baixa, portanto, usuários sensíveis provavelmente notarão cintilação e sentirão fadiga ocular na configuração de brilho indicada e abaixo. [pwm_comparison] Em comparação: 52 % de todos os dispositivos testados não usam PWM para escurecer a tela. Se PWM foi detectado, uma média de 7754 (mínimo: 5 - máximo: 343500) Hz foi medida. | |||
| Cinebench R10 | |
| Rendering Multiple CPUs 32Bit | |
| Dell Latitude 12 5285 2-in-1 | |
| Microsoft Surface Pro 4, Core i5, 128GB | |
| HP Elite x2 1012 G1 | |
| Asus Transformer 3 Pro T303UA-GN050T | |
| Rendering Single 32Bit | |
| Asus Transformer 3 Pro T303UA-GN050T | |
| Dell Latitude 12 5285 2-in-1 | |
| Microsoft Surface Pro 4, Core i5, 128GB | |
| HP Elite x2 1012 G1 | |
| wPrime 2.10 - 1024m | |
| Dell Latitude 12 5285 2-in-1 | |
* ... menor é melhor
| PCMark 8 Home Score Accelerated v2 | 4741 pontos | |
| PCMark 8 Creative Score Accelerated v2 | 4602 pontos | |
| PCMark 8 Work Score Accelerated v2 | 3510 pontos | |
Ajuda | ||
| Dell Latitude 12 5285 2-in-1 Samsung PM961 MZVLW256HEHP | Microsoft Surface Pro 4, Core i5, 128GB Samsung MZFLV128 NVMe | HP Elite x2 1012 G1 Liteon L8H-256V2G | Acer Aspire Switch Alpha 12 SA5-271-70EQ Lite-On CV1-8B512 M.2 512 GB | Asus Transformer 3 Pro T303UA-GN050T SK Hynix Canvas SC300 512GB M.2 (HFS512G39MND) | Microsoft Surface Pro 4 Core i7 Samsung MZFLV256 NVMe | |
|---|---|---|---|---|---|---|
| CrystalDiskMark 3.0 | -37% | -32% | -29% | -41% | -16% | |
| Read Seq (MB/s) | 1294 | 666 -49% | 501 -61% | 496.6 -62% | 398.9 -69% | 834 -36% |
| Write Seq (MB/s) | 865 | 154.2 -82% | 297.2 -66% | 415.3 -52% | 402 -54% | 304 -65% |
| Read 512 (MB/s) | 406 | 266.3 -34% | 351.7 -13% | 335.9 -17% | 303.1 -25% | 396.7 -2% |
| Write 512 (MB/s) | 589 | 154.2 -74% | 295.7 -50% | 384 -35% | 320.3 -46% | 304.3 -48% |
| Read 4k (MB/s) | 31.75 | 28.51 -10% | 28.31 -11% | 32.38 2% | 26.11 -18% | 40.75 28% |
| Write 4k (MB/s) | 72.2 | 101.5 41% | 90.3 25% | 81.8 13% | 57.7 -20% | 106.3 47% |
| Read 4k QD32 (MB/s) | 493.3 | 368.3 -25% | 285 -42% | 296.3 -40% | 245.8 -50% | 393.1 -20% |
| Write 4k QD32 (MB/s) | 434.5 | 153.6 -65% | 268.4 -38% | 260.3 -40% | 253.8 -42% | 292.3 -33% |

| 3DMark 11 Performance | 1744 pontos | |
| 3DMark Ice Storm Standard Score | 12587 pontos | |
| 3DMark Cloud Gate Standard Score | 6652 pontos | |
| 3DMark Fire Strike Score | 985 pontos | |
| 3DMark Fire Strike Extreme Score | 457 pontos | |
Ajuda | ||
| baixo | média | alto | ultra | |
|---|---|---|---|---|
| Tomb Raider (2013) | 88.6 | 45.5 | 29.7 | 13.6 |
| BioShock Infinite (2013) | 56.5 | 32.8 | 28.6 | 9 |
Barulho
| Ocioso |
| 28.2 / 28.2 / 28.2 dB |
| Carga |
| 30.4 / 34 dB |
 | ||
30 dB silencioso 40 dB(A) audível 50 dB(A) ruidosamente alto |
||
min: | ||
| Dell Latitude 12 5285 2-in-1 HD Graphics 620, i7-7600U, Samsung PM961 MZVLW256HEHP | Microsoft Surface Pro 4, Core i5, 128GB HD Graphics 520, 6300U, Samsung MZFLV128 NVMe | Asus Transformer 3 Pro T303UA-GN050T HD Graphics 520, 6500U, SK Hynix Canvas SC300 512GB M.2 (HFS512G39MND) | Microsoft Surface Pro 4 Core i7 Iris Graphics 540, 6650U, Samsung MZFLV256 NVMe | |
|---|---|---|---|---|
| Noise | -18% | -11% | -12% | |
| desligado / ambiente * (dB) | 28.2 | 30.7 -9% | ||
| Idle Minimum * (dB) | 28.2 | 31.5 -12% | 30.7 -9% | 28.4 -1% |
| Idle Average * (dB) | 28.2 | 31.5 -12% | 30.7 -9% | 28.6 -1% |
| Idle Maximum * (dB) | 28.2 | 31.5 -12% | 30.7 -9% | 28.7 -2% |
| Load Average * (dB) | 30.4 | 40.5 -33% | 37 -22% | 40.8 -34% |
| Load Maximum * (dB) | 34 | 40.7 -20% | 37.1 -9% | 41.4 -22% |
* ... menor é melhor
(+) A temperatura máxima no lado superior é 38.2 °C / 101 F, em comparação com a média de 35.4 °C / 96 F , variando de 19.6 a 60 °C para a classe Convertible.
(-) A parte inferior aquece até um máximo de 48.6 °C / 119 F, em comparação com a média de 36.9 °C / 98 F
(+) Em uso inativo, a temperatura média para o lado superior é 28.4 °C / 83 F, em comparação com a média do dispositivo de 30.3 °C / ### class_avg_f### F.
(+) Os apoios para as mãos e o touchpad são mais frios que a temperatura da pele, com um máximo de 31.2 °C / 88.2 F e, portanto, são frios ao toque.
(-) A temperatura média da área do apoio para as mãos de dispositivos semelhantes foi 28 °C / 82.4 F (-3.2 °C / -5.8 F).
Dell Latitude 12 5285 2-in-1 análise de áudio
(±) | o volume do alto-falante é médio, mas bom (###valor### dB)
Graves 100 - 315Hz
(-) | quase nenhum baixo - em média 16.3% menor que a mediana
(±) | a linearidade dos graves é média (11% delta para a frequência anterior)
Médios 400 - 2.000 Hz
(+) | médios equilibrados - apenas 4.3% longe da mediana
(±) | a linearidade dos médios é média (11.3% delta para frequência anterior)
Altos 2 - 16 kHz
(+) | agudos equilibrados - apenas 2.6% longe da mediana
(±) | a linearidade dos máximos é média (8.2% delta para frequência anterior)
Geral 100 - 16.000 Hz
(±) | a linearidade do som geral é média (23.5% diferença em relação à mediana)
Comparado com a mesma classe
» 71% de todos os dispositivos testados nesta classe foram melhores, 5% semelhantes, 24% piores
» O melhor teve um delta de 6%, a média foi 20%, o pior foi 57%
Comparado com todos os dispositivos testados
» 70% de todos os dispositivos testados foram melhores, 6% semelhantes, 24% piores
» O melhor teve um delta de 4%, a média foi 23%, o pior foi 134%
Apple MacBook 12 (Early 2016) 1.1 GHz análise de áudio
(+) | os alto-falantes podem tocar relativamente alto (###valor### dB)
Graves 100 - 315Hz
(±) | graves reduzidos - em média 11.3% menor que a mediana
(±) | a linearidade dos graves é média (14.2% delta para a frequência anterior)
Médios 400 - 2.000 Hz
(+) | médios equilibrados - apenas 2.4% longe da mediana
(+) | médios são lineares (5.5% delta para frequência anterior)
Altos 2 - 16 kHz
(+) | agudos equilibrados - apenas 2% longe da mediana
(+) | os máximos são lineares (4.5% delta da frequência anterior)
Geral 100 - 16.000 Hz
(+) | o som geral é linear (10.2% diferença em relação à mediana)
Comparado com a mesma classe
» 7% de todos os dispositivos testados nesta classe foram melhores, 2% semelhantes, 90% piores
» O melhor teve um delta de 5%, a média foi 18%, o pior foi 53%
Comparado com todos os dispositivos testados
» 5% de todos os dispositivos testados foram melhores, 1% semelhantes, 94% piores
» O melhor teve um delta de 4%, a média foi 23%, o pior foi 134%
| desligado | |
| Ocioso | |
| Carga |
|
Key:
min: | |
| Dell Latitude 12 5285 2-in-1 i7-7600U, HD Graphics 620, Samsung PM961 MZVLW256HEHP, IPS, 1920x1280, 12.3" | Microsoft Surface Pro 4, Core i5, 128GB 6300U, HD Graphics 520, Samsung MZFLV128 NVMe, IPS, 2736x1824, 12.3" | HP Elite x2 1012 G1 6Y54, HD Graphics 515, Liteon L8H-256V2G, IPS, 1920x1280, 12.1" | Acer Aspire Switch Alpha 12 SA5-271-70EQ 6500U, HD Graphics 520, Lite-On CV1-8B512 M.2 512 GB, IPS, 2160x1440, 12" | Asus Transformer 3 Pro T303UA-GN050T 6500U, HD Graphics 520, SK Hynix Canvas SC300 512GB M.2 (HFS512G39MND), IPS, 2880x1920, 12.6" | Microsoft Surface Pro 4 Core i7 6650U, Iris Graphics 540, Samsung MZFLV256 NVMe, IPS, 2736x1824, 12.3" | |
|---|---|---|---|---|---|---|
| Power Consumption | -11% | -0% | -44% | -48% | ||
| Idle Minimum * (Watt) | 2.85 | 4.4 -54% | 3.7 -30% | 5.5 -93% | 6.7 -135% | |
| Idle Average * (Watt) | 6.76 | 9 -33% | 6.8 -1% | 9.8 -45% | 10.3 -52% | |
| Idle Maximum * (Watt) | 6.91 | 10.7 -55% | 7.6 -10% | 11.9 -72% | 13.5 -95% | |
| Load Average * (Watt) | 32.88 | 19.6 40% | 22.5 32% | 36.1 -10% | 26 21% | |
| Load Maximum * (Watt) | 37.41 | 19.9 47% | 34.5 8% | 36.7 2% | 28.8 23% |
* ... menor é melhor
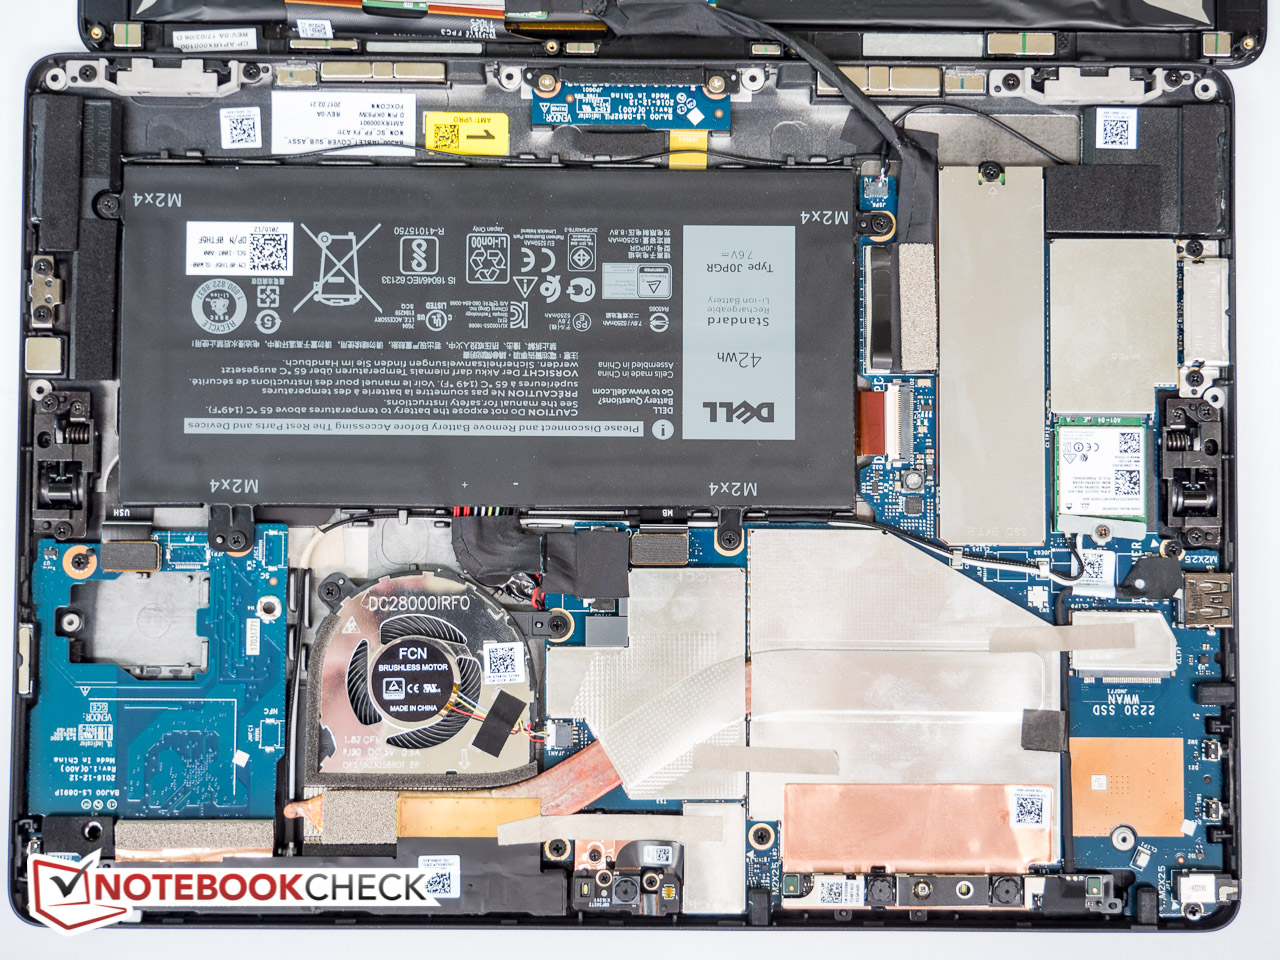
| Dell Latitude 12 5285 2-in-1 i7-7600U, HD Graphics 620, 42 Wh | Microsoft Surface Pro 4, Core i5, 128GB 6300U, HD Graphics 520, 38 Wh | HP Elite x2 1012 G1 6Y54, HD Graphics 515, 37 Wh | Acer Aspire Switch Alpha 12 SA5-271-70EQ 6500U, HD Graphics 520, 37 Wh | Asus Transformer 3 Pro T303UA-GN050T 6500U, HD Graphics 520, 39 Wh | Microsoft Surface Pro 4 Core i7 6650U, Iris Graphics 540, 38 Wh | |
|---|---|---|---|---|---|---|
| Duração da bateria | -7% | -6% | -25% | -40% | -36% | |
| Reader / Idle (h) | 17.9 | 15 -16% | 12.2 -32% | 10.7 -40% | 7.1 -60% | 10.9 -39% |
| WiFi v1.3 (h) | 8.1 | 7.1 -12% | 7.4 -9% | 4.9 -40% | 3.7 -54% | 4.9 -40% |
| Load (h) | 1.8 | 1.9 6% | 2.2 22% | 1.9 6% | 1.7 -6% | 1.3 -28% |
Pro
Contra
Verdict
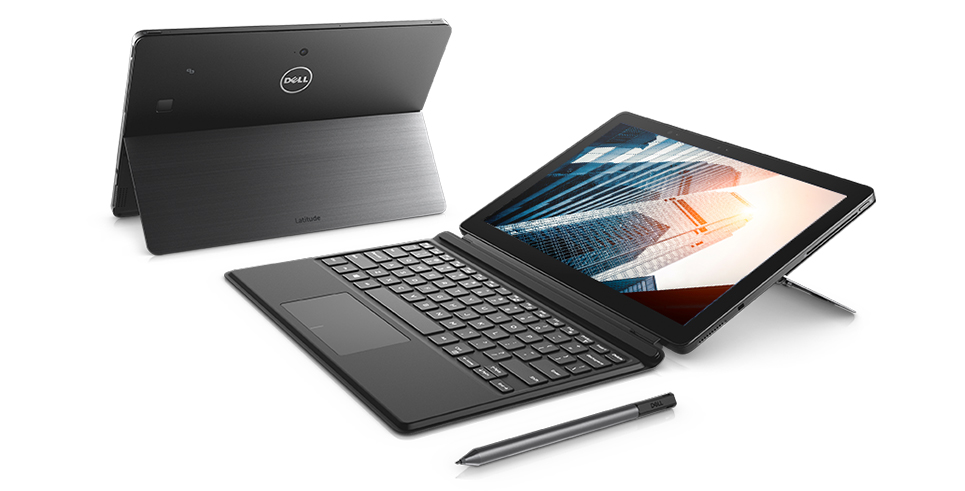
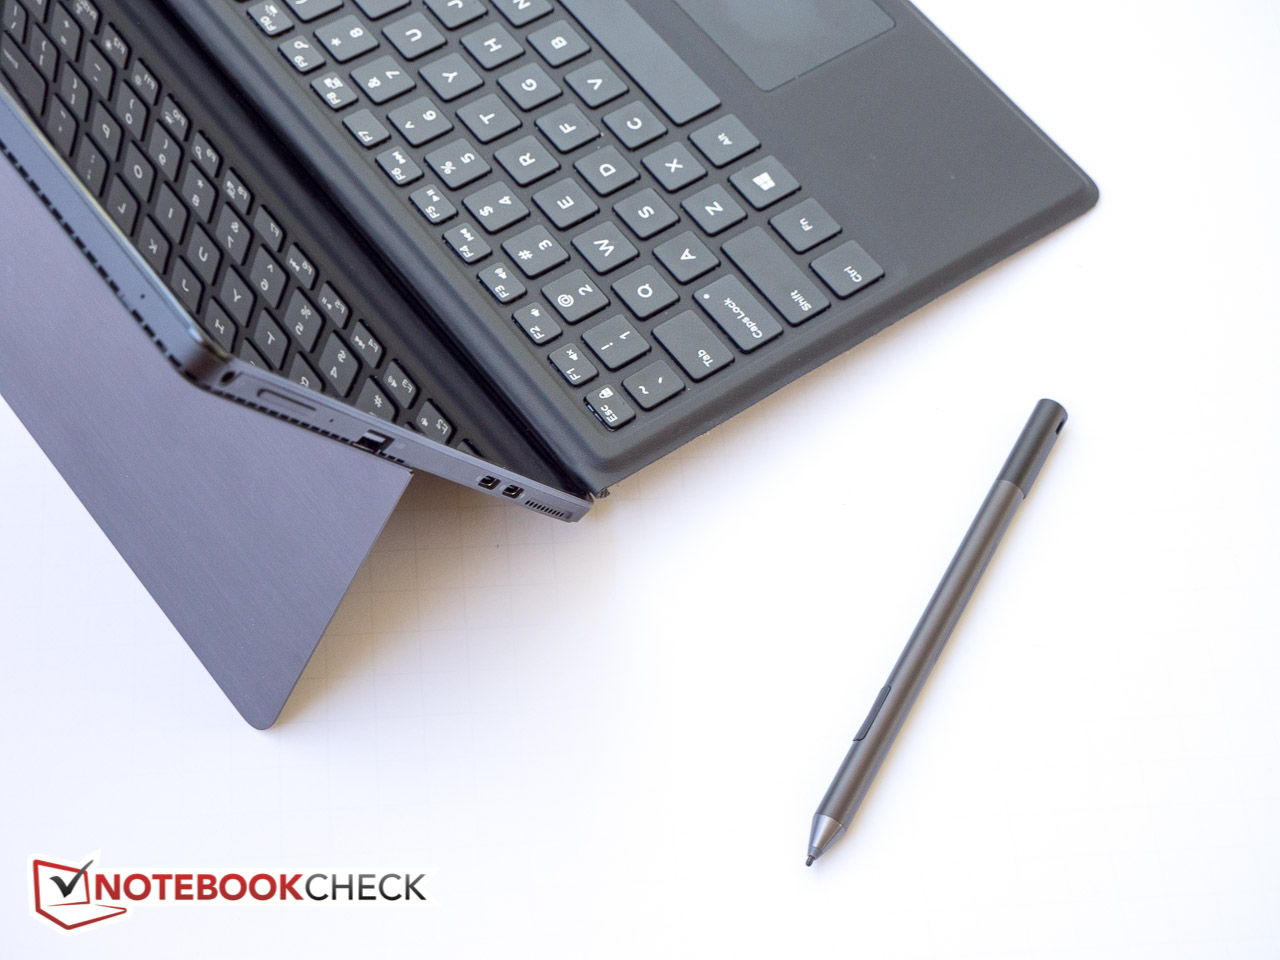
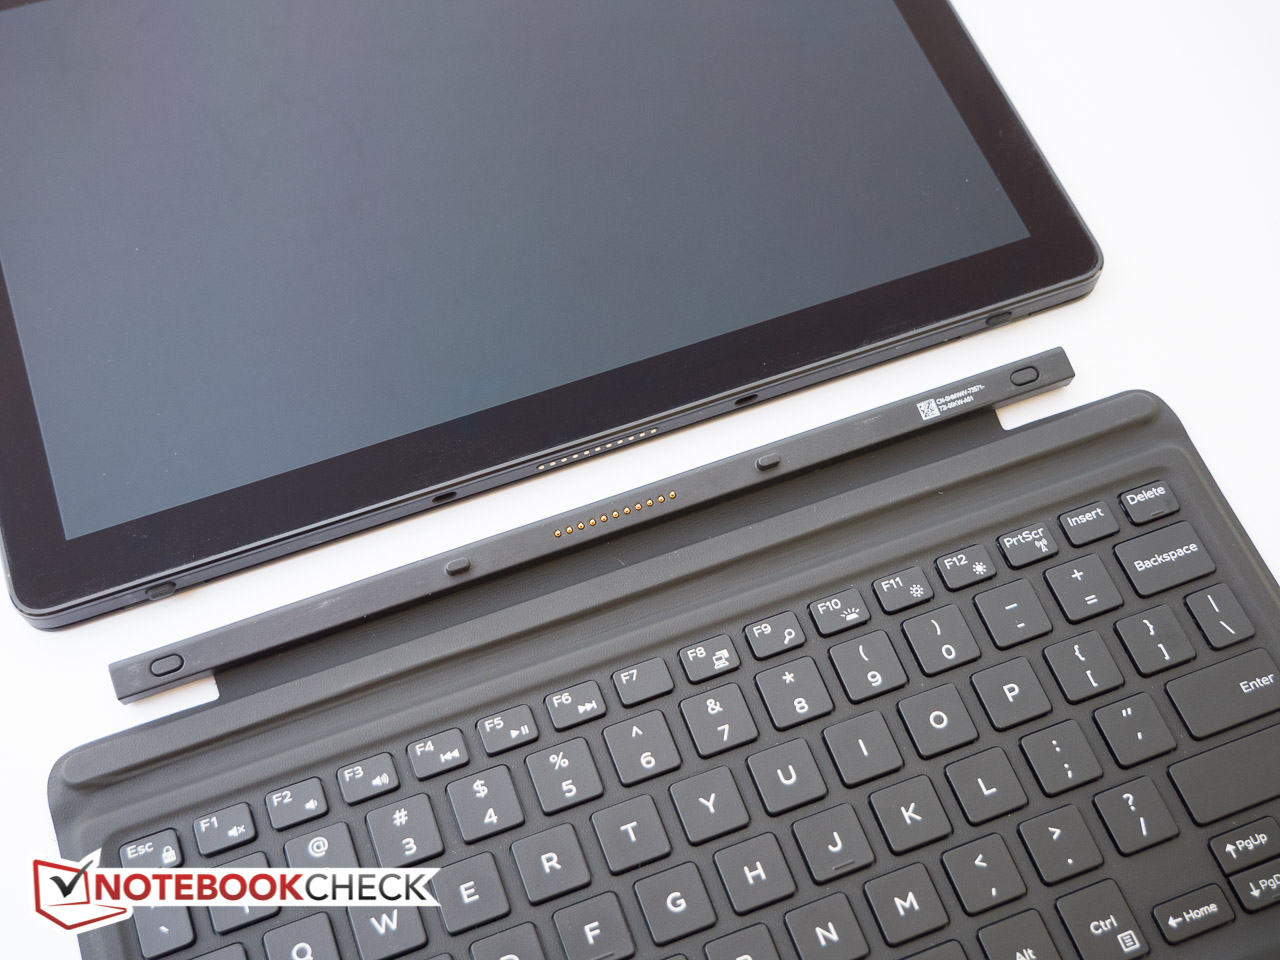
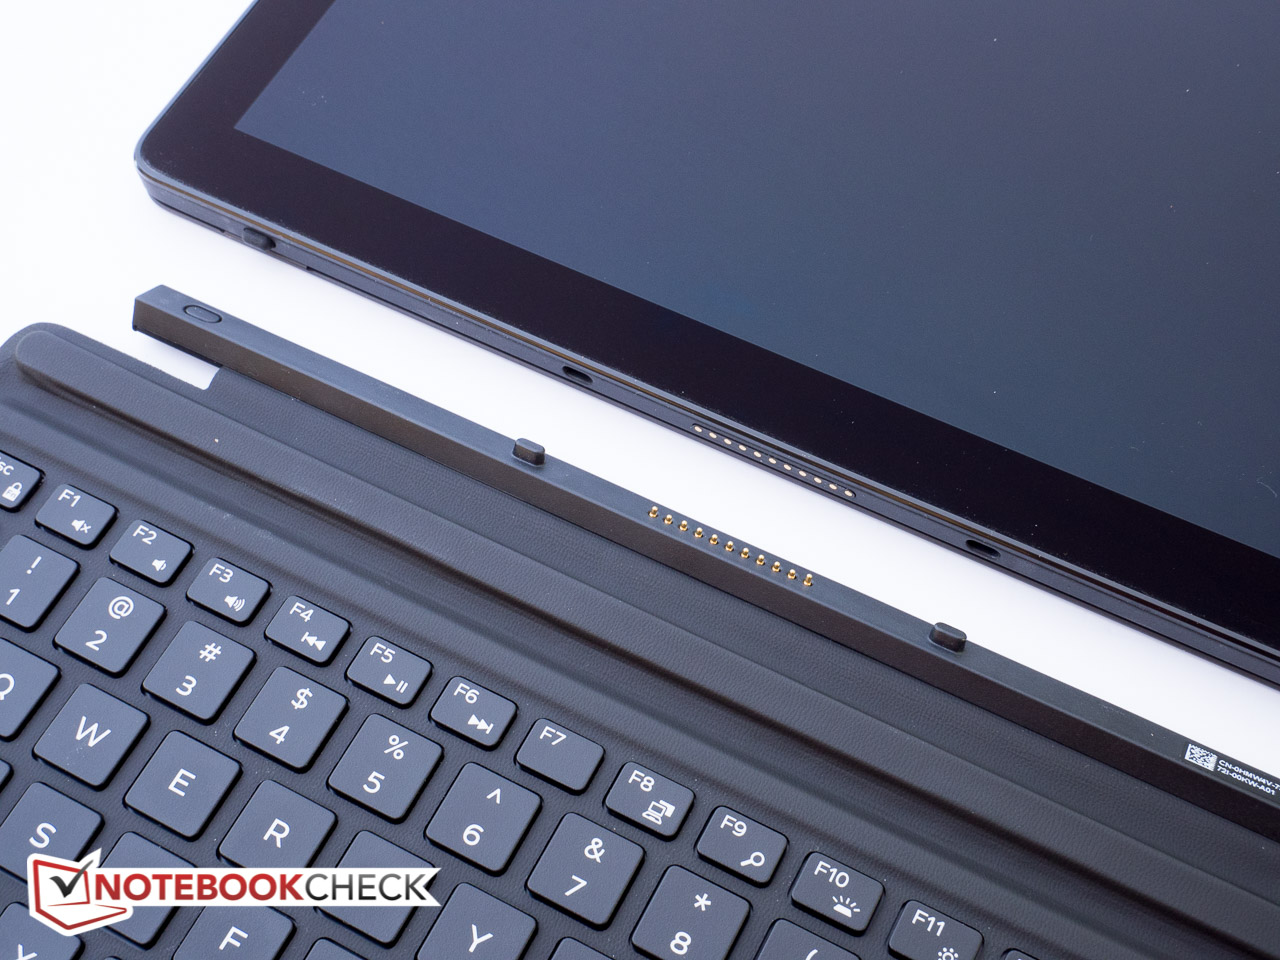
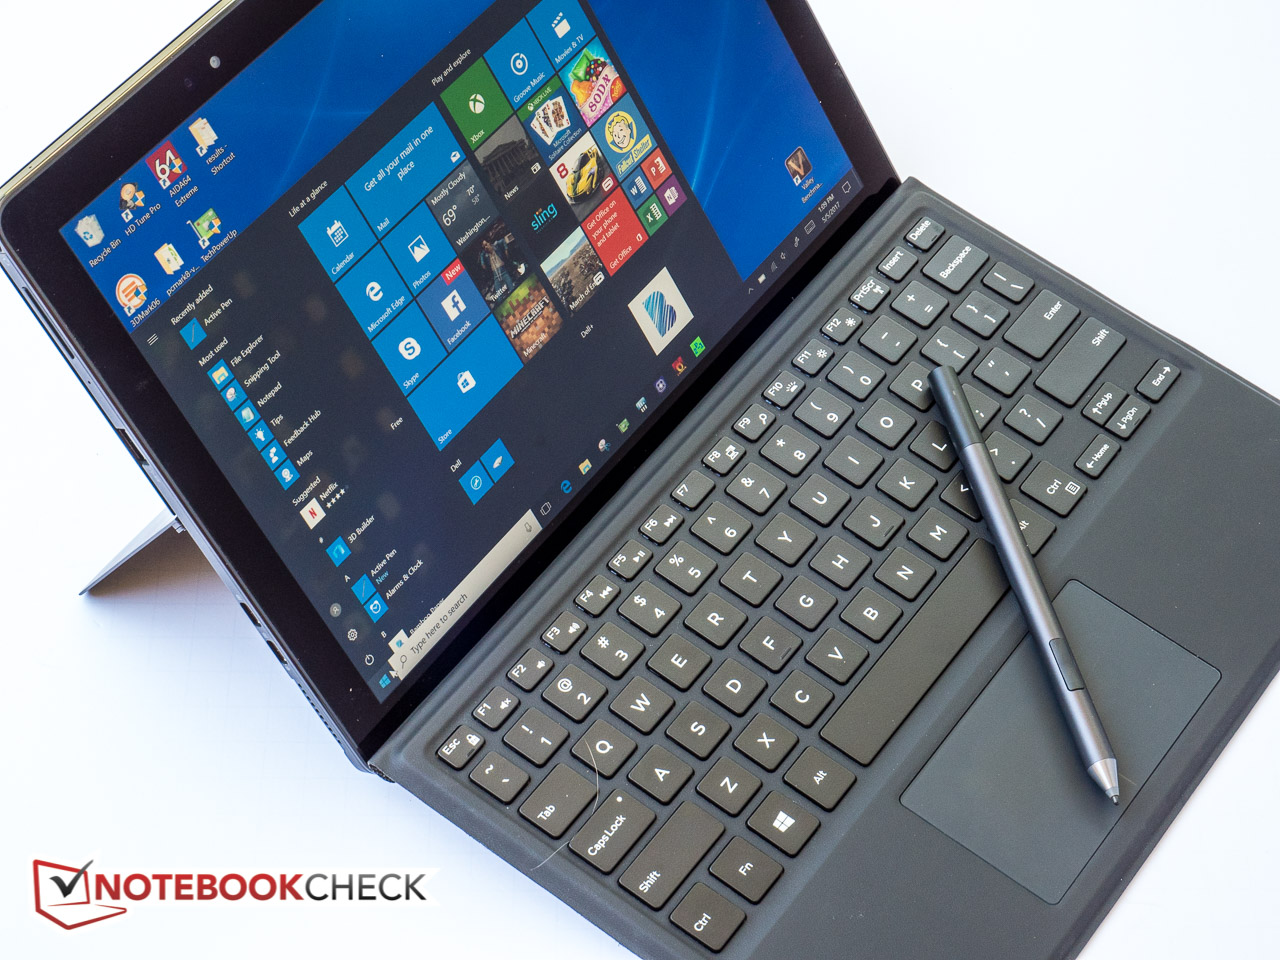
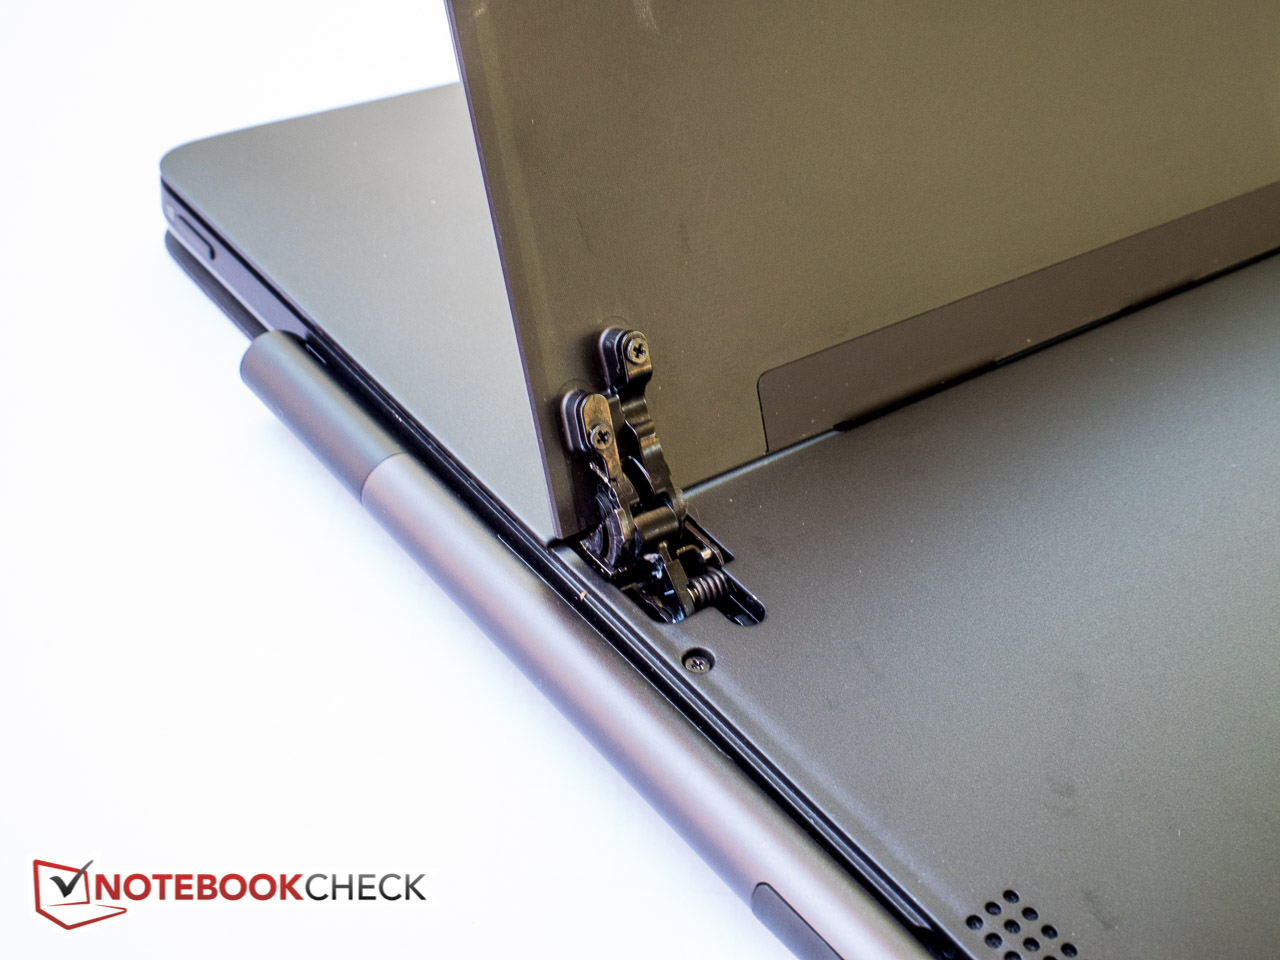
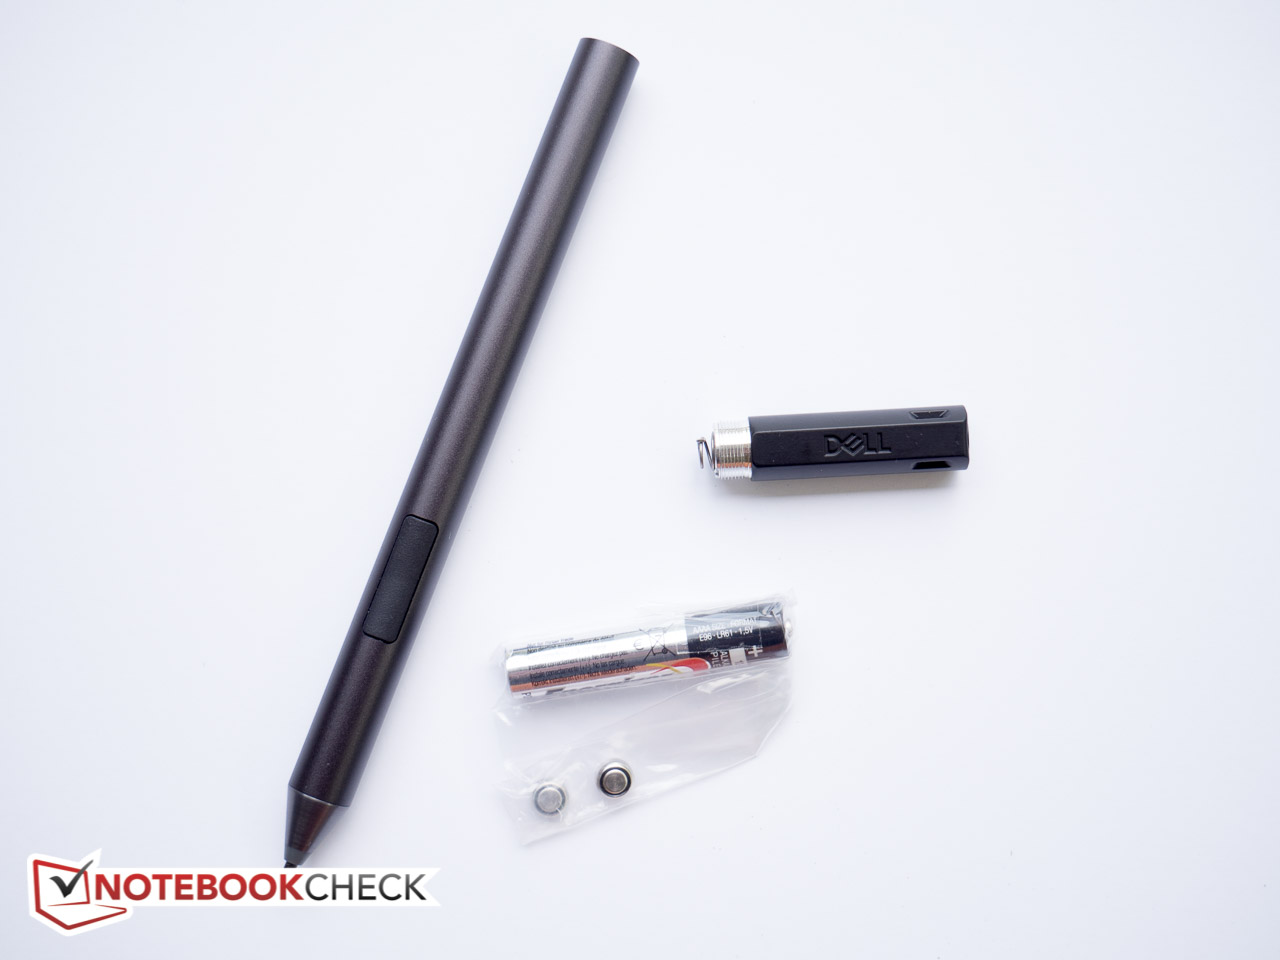
O Dell Latitude 12 5285 é um sólido conversível empresarial. O 2-em-1 combinas boa ergonomia, boa velocidade e muita duração em uma pacote compacto e atraente. Sim, parece muito com o Microsoft Surface Pro 4, mas nós honestamente não esperamos que a Dell aliene o que foi um conceito bem sucedido, apenas para quebrar o molde. O "Travel Keyboard" oferece uma resposta sólida e oferece uma iluminação de fundo de dois níveis, para começar. A Active Stylus funciona muito bem como um dispositivo de entrada adicional e oferece funcionalidades adicionais como inicializar o Microsoft OneNote ou outros aplicativos. Onde a Dell difere de sua concorrência é em duas áreas chave: primeiramente, embora a resolução da tela seja inferior - o qual não é algo que nós consideramos uma desvantagem significante, dada a orientação empresarial do Latitude - o painel é extremamente brilhante e supera facilmente a concorrência. Além disso, o hardware 2-em-1 é muito fácil de acessar e manter, o qual sempre foi um calcanhar de Aquiles para os conversíveis.
O recurso destacado do Latitude é, sem dúvida, a sua tela, que é incrivelmente brilhante com uma luminância média de mais de520 nits.
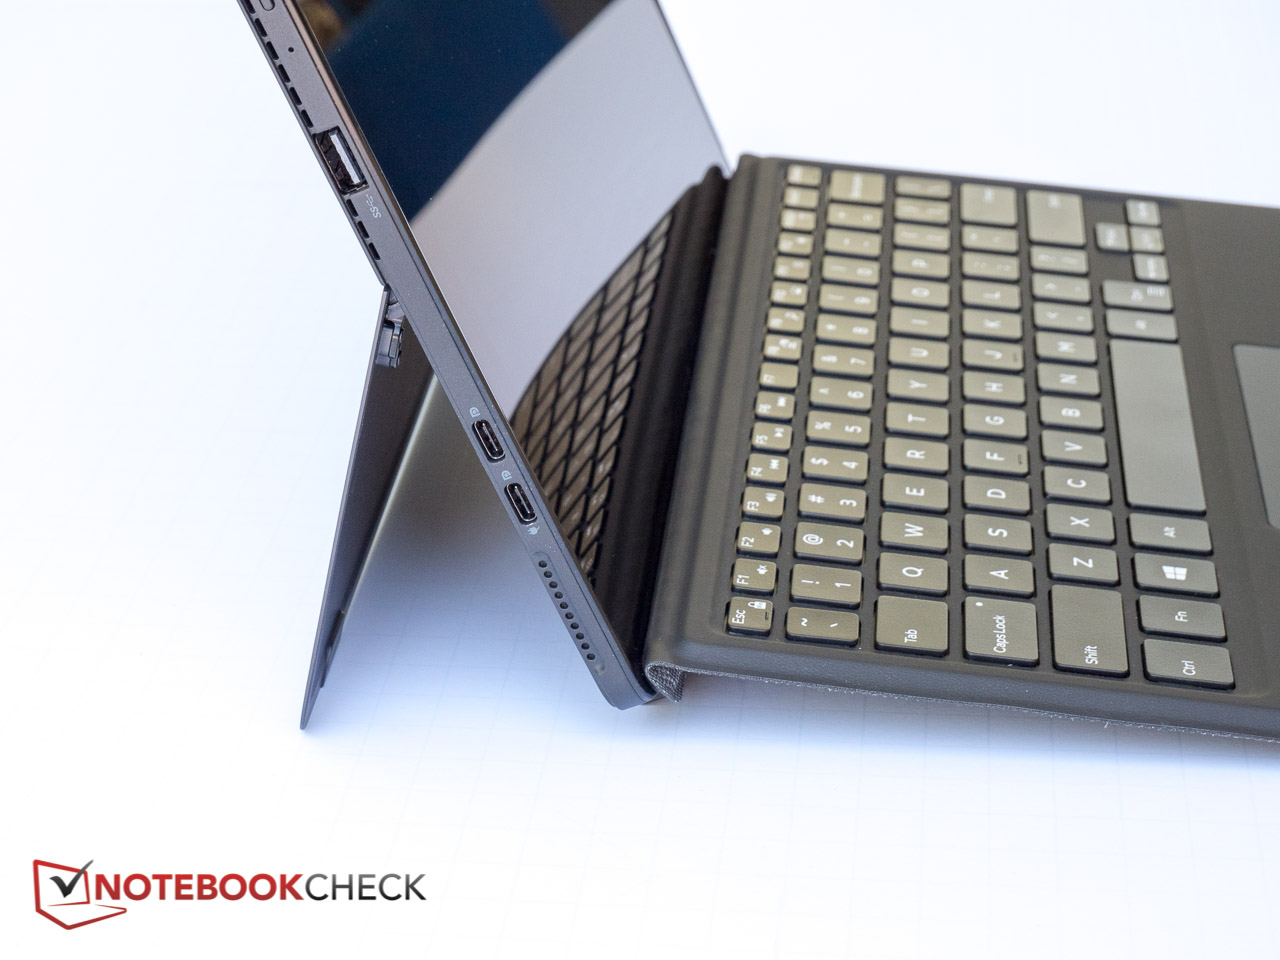
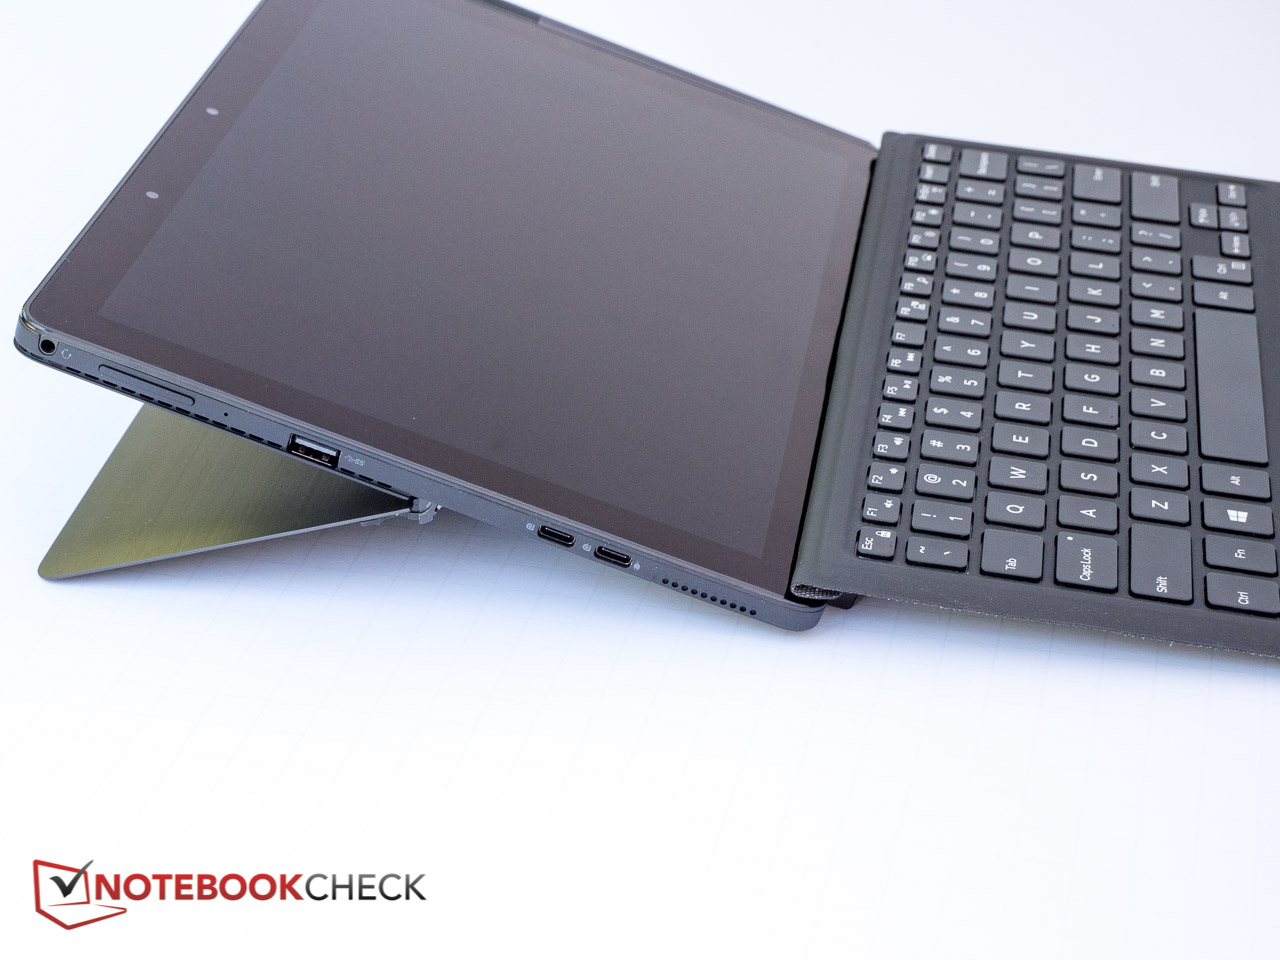
Do que menos gostamos: o 5285 esquenta bastante sob uso intenso e também é um pouco mais pesado que a concorrência. Também seria boa uma porta Thunderbolt 3. O Latitude também é bastante caro, o que para muito usuários poderia tornar outros conversíveis, como o Asus Transformer 3 Pro ou o Acer Aspire Switch Alpha 12, resfriado com líquido, mais atraentes, apesar de sua duração de bateria muito mais breve. O Microsoft Surface Pro 4 ainda é uma boa opção - particularmente a versão com Core i5 e SSD de 256 GB, que é vendida por pouco mais de $1300.
Dell Latitude 12 5285 2-in-1
- 05/06/2017 v6 (old)
Bernhard Pechlaner
Price comparison
