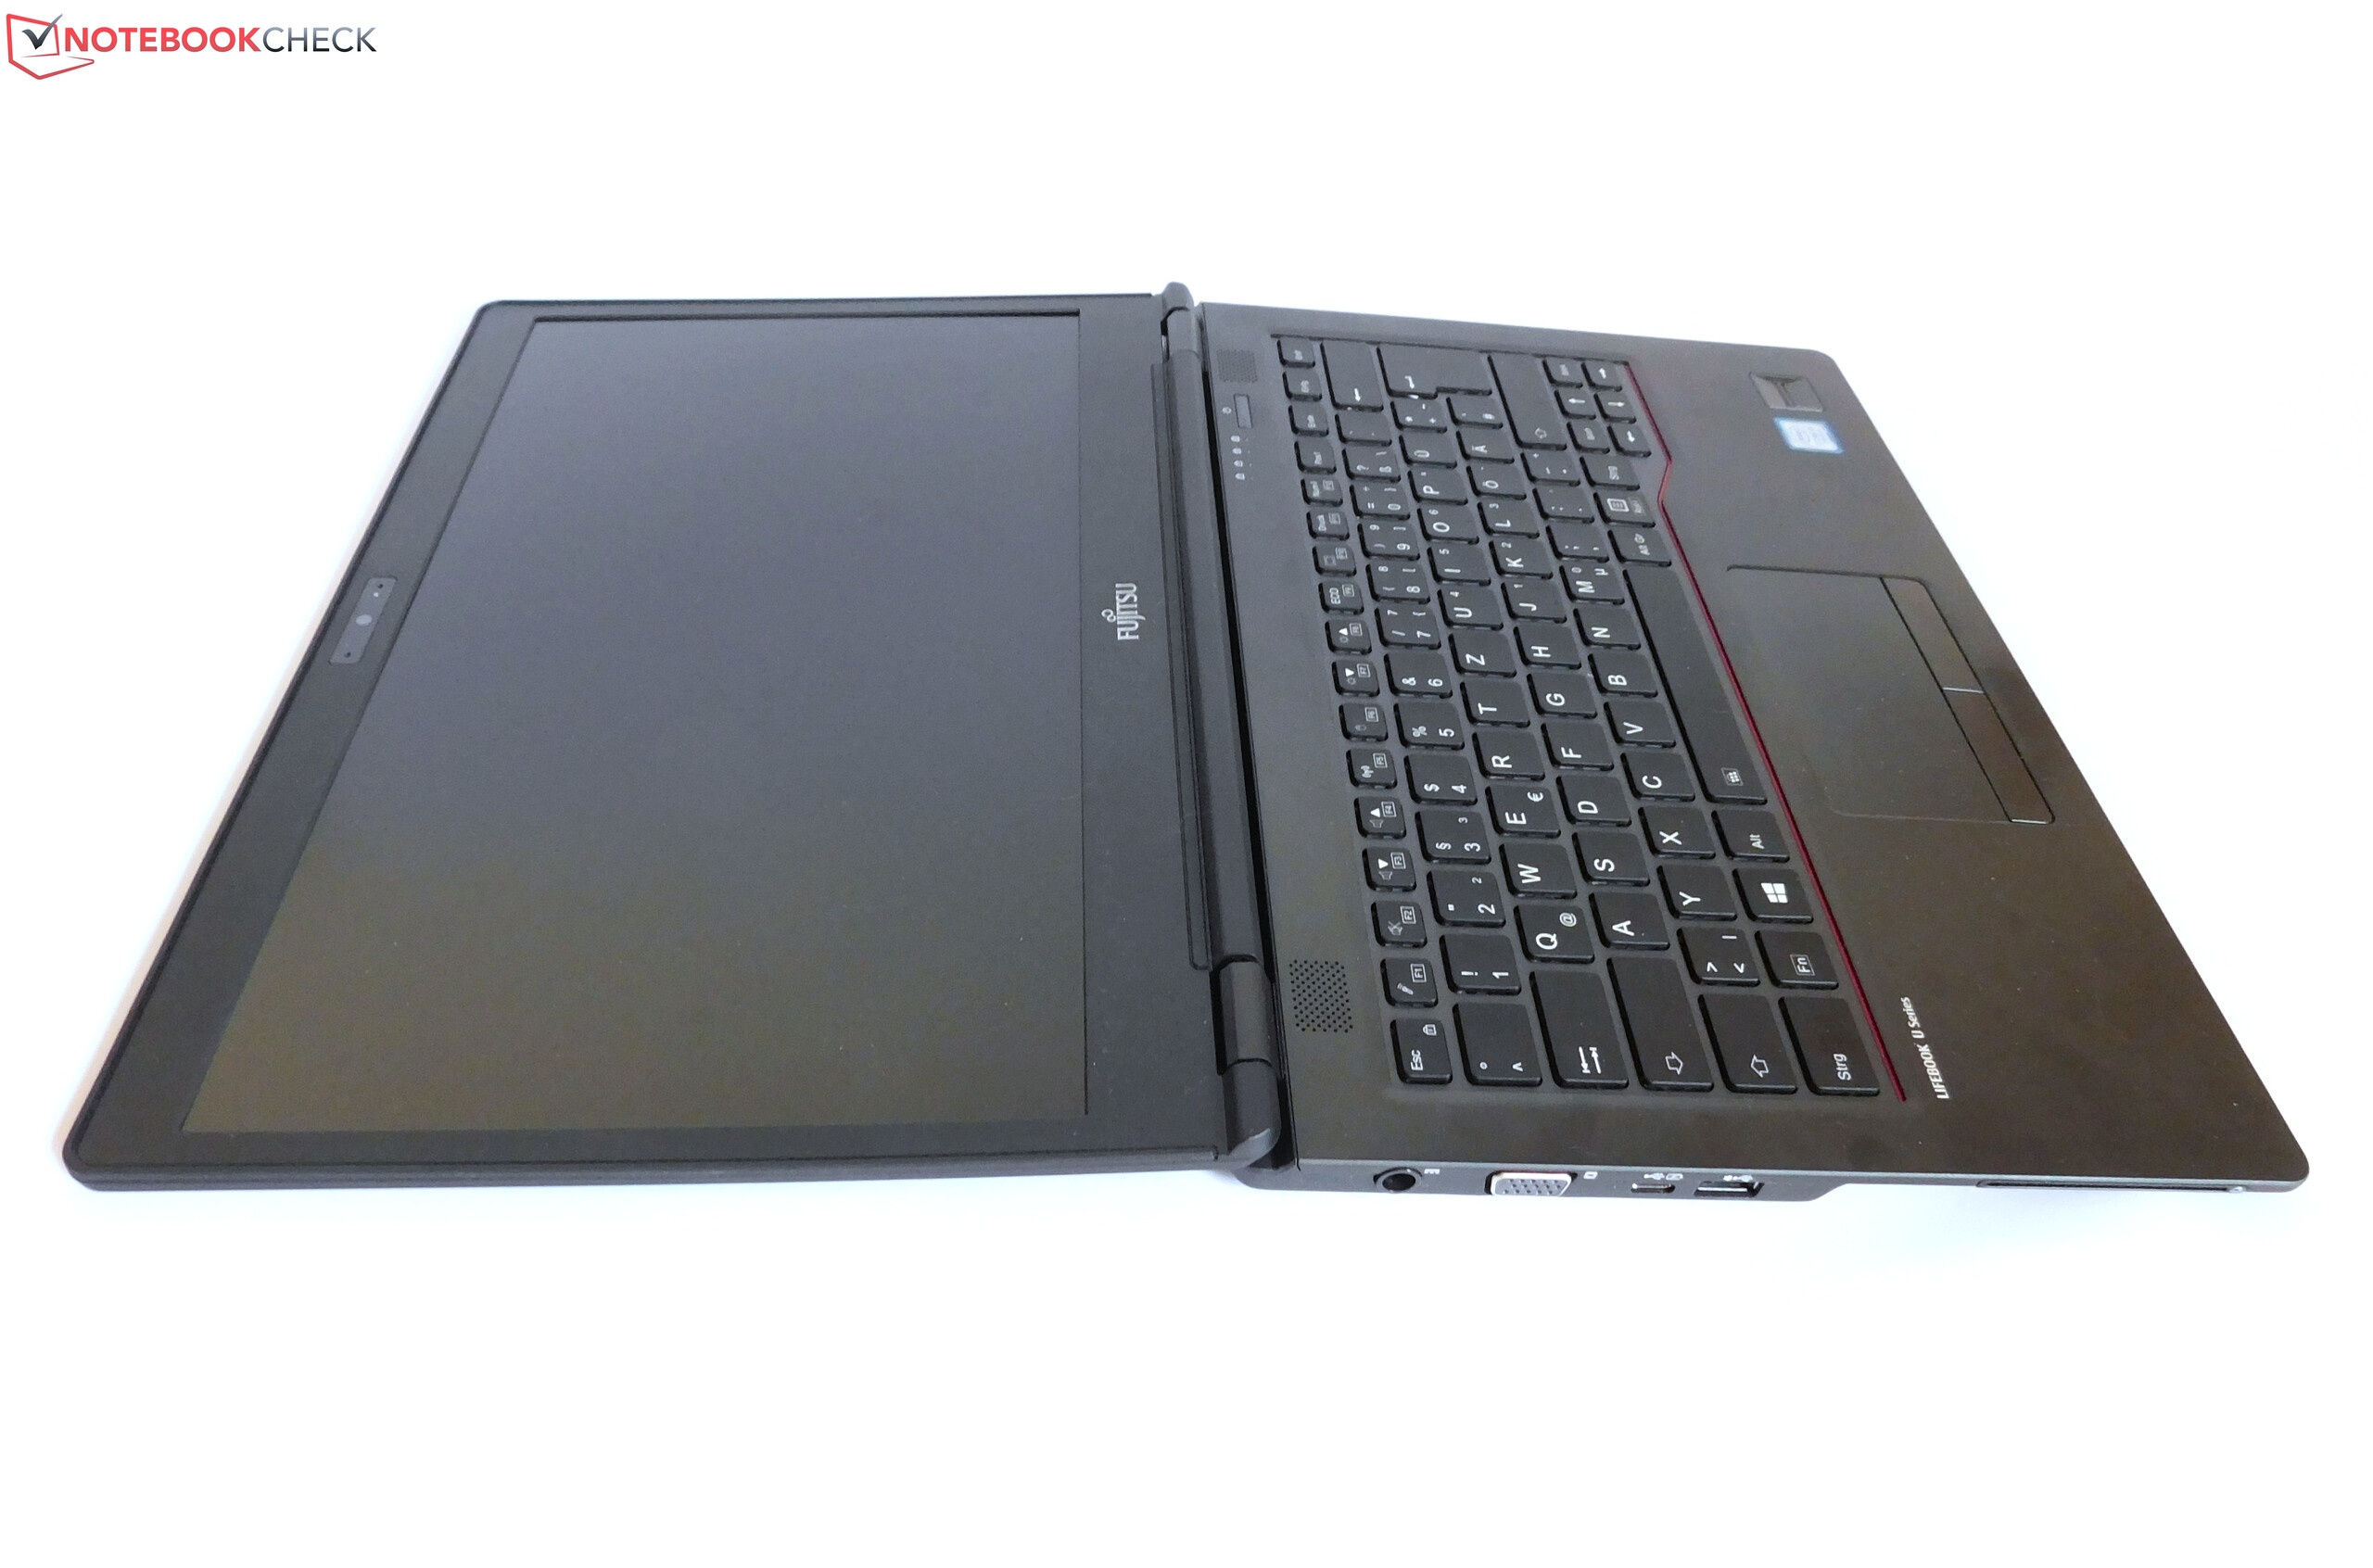
Breve Análise do Portátil Fujitsu LifeBook U747
| SD Card Reader | |
| average JPG Copy Test (av. of 3 runs) | |
| Dell XPS 13 9360 QHD+ i7 | |
| Lenovo ThinkPad T470-20HD002HGE | |
| Fujitsu LifeBook U747 | |
| maximum AS SSD Seq Read Test (1GB) | |
| Dell XPS 13 9360 QHD+ i7 | |
| Lenovo ThinkPad T470-20HD002HGE | |
| Fujitsu LifeBook U747 | |
| Networking | |
| iperf3 transmit AX12 | |
| Lenovo ThinkPad T470-20HD002HGE | |
| Fujitsu LifeBook U747 | |
| HP EliteBook 820 G4 Z2V72ET (jseb) | |
| iperf3 receive AX12 | |
| Lenovo ThinkPad T470-20HD002HGE | |
| Fujitsu LifeBook U747 | |
| HP EliteBook 820 G4 Z2V72ET (jseb) | |
| |||||||||||||||||||||||||
iluminação: 84 %
iluminação com acumulador: 296 cd/m²
Contraste: 909:1 (Preto: 0.32 cd/m²)
ΔE ColorChecker Calman: 4.3 | ∀{0.5-29.43 Ø4.71}
ΔE Greyscale Calman: 4.3 | ∀{0.09-98 Ø4.96}
84.77% sRGB (Argyll 1.6.3 3D)
55.46% AdobeRGB 1998 (Argyll 1.6.3 3D)
62% AdobeRGB 1998 (Argyll 3D)
84.8% sRGB (Argyll 3D)
66.1% Display P3 (Argyll 3D)
Gamma: 2.31
CCT: 6529 K
| Fujitsu LifeBook U747 LG LP140WF3, , 1920x1080, 14" | Lenovo ThinkPad T470-20HD002HGE N140HCA-EAB, , 1920x1080, 14" | Acer TravelMate P648-M-757N AU Optronics B140HAN02.1, , 1920x1080, 14" | Dell Latitude 14 7000 Series E7470 AUO B140QAN Dell PN F0WXVV, , 2560x1440, 14" | HP EliteBook 840 G3 T9X59ET#ABD Chi Mei CMN14C0, , 1920x1080, 14" | |
|---|---|---|---|---|---|
| Display | -32% | -41% | 9% | -19% | |
| Display P3 Coverage (%) | 66.1 | 41.6 -37% | 35.53 -46% | 67.2 2% | 48.93 -26% |
| sRGB Coverage (%) | 84.8 | 61.9 -27% | 53.3 -37% | 95.9 13% | 73.7 -13% |
| AdobeRGB 1998 Coverage (%) | 62 | 43.06 -31% | 36.72 -41% | 69.3 12% | 50.5 -19% |
| Response Times | -32% | -15% | -25% | -14% | |
| Response Time Grey 50% / Grey 80% * (ms) | 36 ? | 41.6 ? -16% | 44 ? -22% | 48 ? -33% | 43 ? -19% |
| Response Time Black / White * (ms) | 23.2 ? | 34 ? -47% | 25 ? -8% | 27 ? -16% | 25 ? -8% |
| PWM Frequency (Hz) | 204 ? | ||||
| Screen | -19% | -3% | 19% | -48% | |
| Brightness middle (cd/m²) | 291 | 306 5% | 254 -13% | 380 31% | 366 26% |
| Brightness (cd/m²) | 296 | 287 -3% | 243 -18% | 354 20% | 336 14% |
| Brightness Distribution (%) | 84 | 88 5% | 90 7% | 81 -4% | 87 4% |
| Black Level * (cd/m²) | 0.32 | 0.3 6% | 0.19 41% | 0.26 19% | 0.65 -103% |
| Contrast (:1) | 909 | 1020 12% | 1337 47% | 1462 61% | 563 -38% |
| Colorchecker dE 2000 * | 4.3 | 6.2 -44% | 4.93 -15% | 3.11 28% | 10.26 -139% |
| Colorchecker dE 2000 max. * | 7.5 | 13.6 -81% | 10.14 -35% | 6.73 10% | |
| Greyscale dE 2000 * | 4.3 | 5.8 -35% | 2.71 37% | 4.35 -1% | 11.51 -168% |
| Gamma | 2.31 95% | 2.04 108% | 2.36 93% | 2.37 93% | 2.4 92% |
| CCT | 6529 100% | 6277 104% | 6914 94% | 6771 96% | 12725 51% |
| Color Space (Percent of AdobeRGB 1998) (%) | 55.46 | 39.62 -29% | 34 -39% | 62 12% | 47 -15% |
| Color Space (Percent of sRGB) (%) | 84.77 | 61.44 -28% | 53 -37% | 96 13% | 74 -13% |
| Média Total (Programa/Configurações) | -28% /
-23% | -20% /
-12% | 1% /
11% | -27% /
-37% |
* ... menor é melhor
Exibir tempos de resposta
| ↔ Tempo de resposta preto para branco | ||
|---|---|---|
| 23.2 ms ... ascensão ↗ e queda ↘ combinadas | ↗ 12.4 ms ascensão | 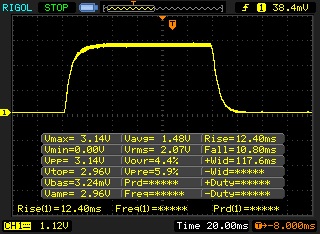 |
| ↘ 10.8 ms queda | ||
| A tela mostra boas taxas de resposta em nossos testes, mas pode ser muito lenta para jogadores competitivos. Em comparação, todos os dispositivos testados variam de 0.1 (mínimo) a 240 (máximo) ms. » 53 % de todos os dispositivos são melhores. Isso significa que o tempo de resposta medido é pior que a média de todos os dispositivos testados (19.8 ms). | ||
| ↔ Tempo de resposta 50% cinza a 80% cinza | ||
| 36 ms ... ascensão ↗ e queda ↘ combinadas | ↗ 16.4 ms ascensão | 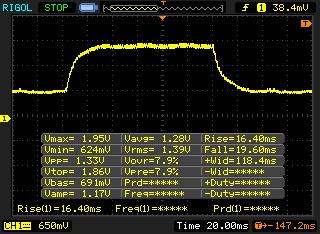 |
| ↘ 19.6 ms queda | ||
| A tela mostra taxas de resposta lentas em nossos testes e será insatisfatória para os jogadores. Em comparação, todos os dispositivos testados variam de 0.165 (mínimo) a 636 (máximo) ms. » 51 % de todos os dispositivos são melhores. Isso significa que o tempo de resposta medido é pior que a média de todos os dispositivos testados (31 ms). | ||
Cintilação da tela / PWM (modulação por largura de pulso)
| Tela tremeluzindo / PWM não detectado | ||
[pwm_comparison] Em comparação: 52 % de todos os dispositivos testados não usam PWM para escurecer a tela. Se PWM foi detectado, uma média de 7757 (mínimo: 5 - máximo: 343500) Hz foi medida. | ||
| PCMark 8 Home Score Accelerated v2 | 3506 pontos | |
| PCMark 8 Work Score Accelerated v2 | 4653 pontos | |
Ajuda | ||
| Fujitsu LifeBook U747 Samsung MZYTY256HDHP | Lenovo ThinkPad T470-20HD002HGE Samsung PM961 NVMe MZVLW512HMJP | Acer TravelMate P648-M-757N Lite-On CV1-8B256 | Dell Latitude 14 7000 Series E7470 Samsung SSD PM851 M.2 2280 256GB | HP EliteBook 840 G3 T9X59ET#ABD Samsung SSD PM851 256 GB MZNTE256HMHP | Lenovo ThinkPad T470s-20HGS00V00 Samsung SSD PM961 1TB M.2 PCIe 3.0 x4 NVMe (MZVLW1T0) | |
|---|---|---|---|---|---|---|
| CrystalDiskMark 3.0 | 94% | -9% | -5% | -13% | 148% | |
| Read Seq (MB/s) | 504 | 1155 129% | 531 5% | 518 3% | 497.8 -1% | 1760 249% |
| Write Seq (MB/s) | 497.8 | 1076 116% | 358.8 -28% | 300.7 -40% | 241.4 -52% | 1666 235% |
| Read 512 (MB/s) | 396.7 | 811 104% | 384.8 -3% | 470.8 19% | 396 0% | 832 110% |
| Write 512 (MB/s) | 283.4 | 862 204% | 363 28% | 214 -24% | 241.8 -15% | 1064 275% |
| Read 4k (MB/s) | 35.73 | 55.5 55% | 31.3 -12% | 36.32 2% | 27.02 -24% | 53.2 49% |
| Write 4k (MB/s) | 87.8 | 134.6 53% | 80.3 -9% | 110.9 26% | 82.6 -6% | 167.4 91% |
| Read 4k QD32 (MB/s) | 399.1 | 496.2 24% | 239.4 -40% | 400.9 0% | 388.5 -3% | 630 58% |
| Write 4k QD32 (MB/s) | 249.7 | 425.4 70% | 225.3 -10% | 191.7 -23% | 242.8 -3% | 533 113% |

| 3DMark 11 Performance | 1524 pontos | |
| 3DMark Cloud Gate Standard Score | 5656 pontos | |
| 3DMark Fire Strike Score | 738 pontos | |
Ajuda | ||
| baixo | média | alto | ultra | |
|---|---|---|---|---|
| BioShock Infinite (2013) | 42.35 | 24.15 | 19.85 | |
| Company of Heroes 2 (2013) | 21.04 | 16.04 | ||
| Rise of the Tomb Raider (2016) | 14.45 |
Barulho
| Ocioso |
| 28.2 / 28.2 / 28.2 dB |
| Carga |
| 31.2 / 33 dB |
 | ||
30 dB silencioso 40 dB(A) audível 50 dB(A) ruidosamente alto |
||
min: | ||
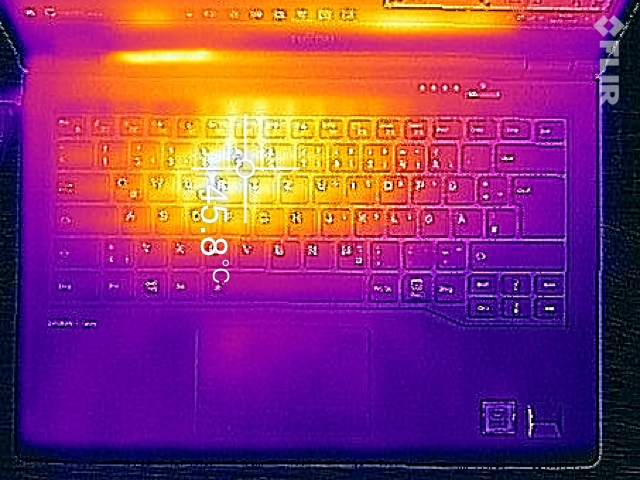
(±) A temperatura máxima no lado superior é 42.6 °C / 109 F, em comparação com a média de 34.3 °C / 94 F , variando de 21.2 a 62.5 °C para a classe Office.
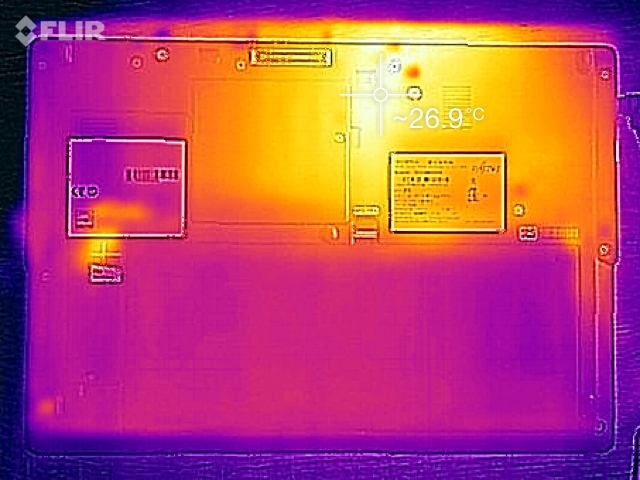
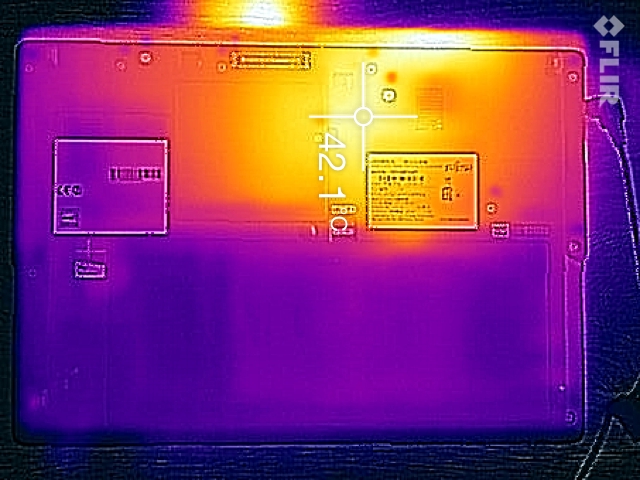
(+) A parte inferior aquece até um máximo de 34.4 °C / 94 F, em comparação com a média de 36.8 °C / 98 F
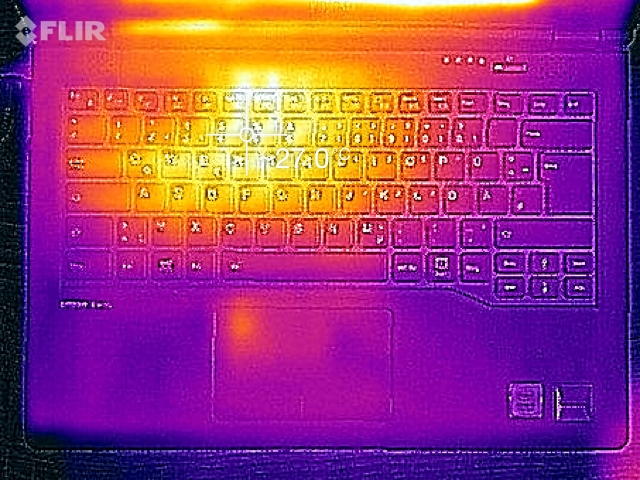
(+) Em uso inativo, a temperatura média para o lado superior é 22.8 °C / 73 F, em comparação com a média do dispositivo de 29.5 °C / ### class_avg_f### F.
(+) Os apoios para as mãos e o touchpad são mais frios que a temperatura da pele, com um máximo de 23.7 °C / 74.7 F e, portanto, são frios ao toque.
(+) A temperatura média da área do apoio para as mãos de dispositivos semelhantes foi 27.5 °C / 81.5 F (+3.8 °C / 6.8 F).
Fujitsu LifeBook U747 análise de áudio
(-) | alto-falantes não muito altos (###valor### dB)
Graves 100 - 315Hz
(-) | quase nenhum baixo - em média 15.2% menor que a mediana
(+) | o baixo é linear (6.6% delta para a frequência anterior)
Médios 400 - 2.000 Hz
(±) | médios mais altos - em média 6.1% maior que a mediana
(±) | a linearidade dos médios é média (8.4% delta para frequência anterior)
Altos 2 - 16 kHz
(+) | agudos equilibrados - apenas 4.4% longe da mediana
(±) | a linearidade dos máximos é média (10.4% delta para frequência anterior)
Geral 100 - 16.000 Hz
(±) | a linearidade do som geral é média (26.3% diferença em relação à mediana)
Comparado com a mesma classe
» 81% de todos os dispositivos testados nesta classe foram melhores, 7% semelhantes, 13% piores
» O melhor teve um delta de 7%, a média foi 21%, o pior foi 53%
Comparado com todos os dispositivos testados
» 81% de todos os dispositivos testados foram melhores, 4% semelhantes, 15% piores
» O melhor teve um delta de 4%, a média foi 23%, o pior foi 134%
Lenovo ThinkPad T470-20HD002HGE análise de áudio
(±) | o volume do alto-falante é médio, mas bom (###valor### dB)
Graves 100 - 315Hz
(-) | quase nenhum baixo - em média 16.6% menor que a mediana
(±) | a linearidade dos graves é média (8.8% delta para a frequência anterior)
Médios 400 - 2.000 Hz
(+) | médios equilibrados - apenas 4.3% longe da mediana
(+) | médios são lineares (6.7% delta para frequência anterior)
Altos 2 - 16 kHz
(±) | máximos mais altos - em média 5.4% maior que a mediana
(±) | a linearidade dos máximos é média (13.3% delta para frequência anterior)
Geral 100 - 16.000 Hz
(±) | a linearidade do som geral é média (18.7% diferença em relação à mediana)
Comparado com a mesma classe
» 35% de todos os dispositivos testados nesta classe foram melhores, 6% semelhantes, 59% piores
» O melhor teve um delta de 7%, a média foi 21%, o pior foi 53%
Comparado com todos os dispositivos testados
» 43% de todos os dispositivos testados foram melhores, 8% semelhantes, 49% piores
» O melhor teve um delta de 4%, a média foi 23%, o pior foi 134%
| desligado | |
| Ocioso | |
| Carga |
|
Key:
min: | |
| Fujitsu LifeBook U747 i5-7200U, HD Graphics 620, Samsung MZYTY256HDHP, IPS LED, 1920x1080, 14" | Lenovo ThinkPad T470-20HD002HGE i5-7200U, HD Graphics 620, Samsung PM961 NVMe MZVLW512HMJP, IPS, 1920x1080, 14" | Acer TravelMate P648-M-757N 6500U, HD Graphics 520, Lite-On CV1-8B256, IPS, 1920x1080, 14" | Dell Latitude 14 7000 Series E7470 6600U, HD Graphics 520, Samsung SSD PM851 M.2 2280 256GB, IPS, 2560x1440, 14" | HP EliteBook 840 G3 T9X59ET#ABD 6500U, HD Graphics 520, Samsung SSD PM851 256 GB MZNTE256HMHP, TN LED, 1920x1080, 14" | Lenovo ThinkPad T470s-20HGS00V00 i7-7600U, HD Graphics 620, Samsung SSD PM961 1TB M.2 PCIe 3.0 x4 NVMe (MZVLW1T0), IPS, 2560x1440, 14" | |
|---|---|---|---|---|---|---|
| Power Consumption | 13% | -16% | -12% | 10% | -23% | |
| Idle Minimum * (Watt) | 4.11 | 3.21 22% | 5.3 -29% | 5.1 -24% | 3.8 8% | 4.64 -13% |
| Idle Average * (Watt) | 7.87 | 6.15 22% | 9.3 -18% | 8.5 -8% | 6.3 20% | 8.93 -13% |
| Idle Maximum * (Watt) | 8.74 | 6.82 22% | 11.5 -32% | 10.1 -16% | 6.8 22% | 9.12 -4% |
| Load Average * (Watt) | 30.2 | 28.5 6% | 30.8 -2% | 35.2 -17% | 34.4 -14% | 42.2 -40% |
| Load Maximum * (Watt) | 32.4 | 34.5 -6% | 32 1% | 31 4% | 28.3 13% | 47.3 -46% |
* ... menor é melhor
| Fujitsu LifeBook U747 i5-7200U, HD Graphics 620, 50 Wh | Lenovo ThinkPad T470-20HD002HGE i5-7200U, HD Graphics 620, 48 Wh | Acer TravelMate P648-M-757N 6500U, HD Graphics 520, 54 Wh | Dell Latitude 14 7000 Series E7470 6600U, HD Graphics 520, 55 Wh | HP EliteBook 840 G3 T9X59ET#ABD 6500U, HD Graphics 520, 46 Wh | Lenovo ThinkPad T470s-20HGS00V00 i7-7600U, HD Graphics 620, 51 Wh | |
|---|---|---|---|---|---|---|
| Duração da bateria | 6% | 17% | -12% | 19% | -7% | |
| Reader / Idle (h) | 13 | 18.1 39% | 17 31% | 13.1 1% | ||
| H.264 (h) | 8.2 | 10.4 27% | 9.1 11% | 7.6 -7% | ||
| WiFi v1.3 (h) | 7.2 | 7.3 1% | 9.1 26% | 5.8 -19% | 7.6 6% | 7 -3% |
| Load (h) | 2 | 1.8 -10% | 1.8 -10% | 1.9 -5% | 2.4 20% | 1.6 -20% |
Pro
Contra

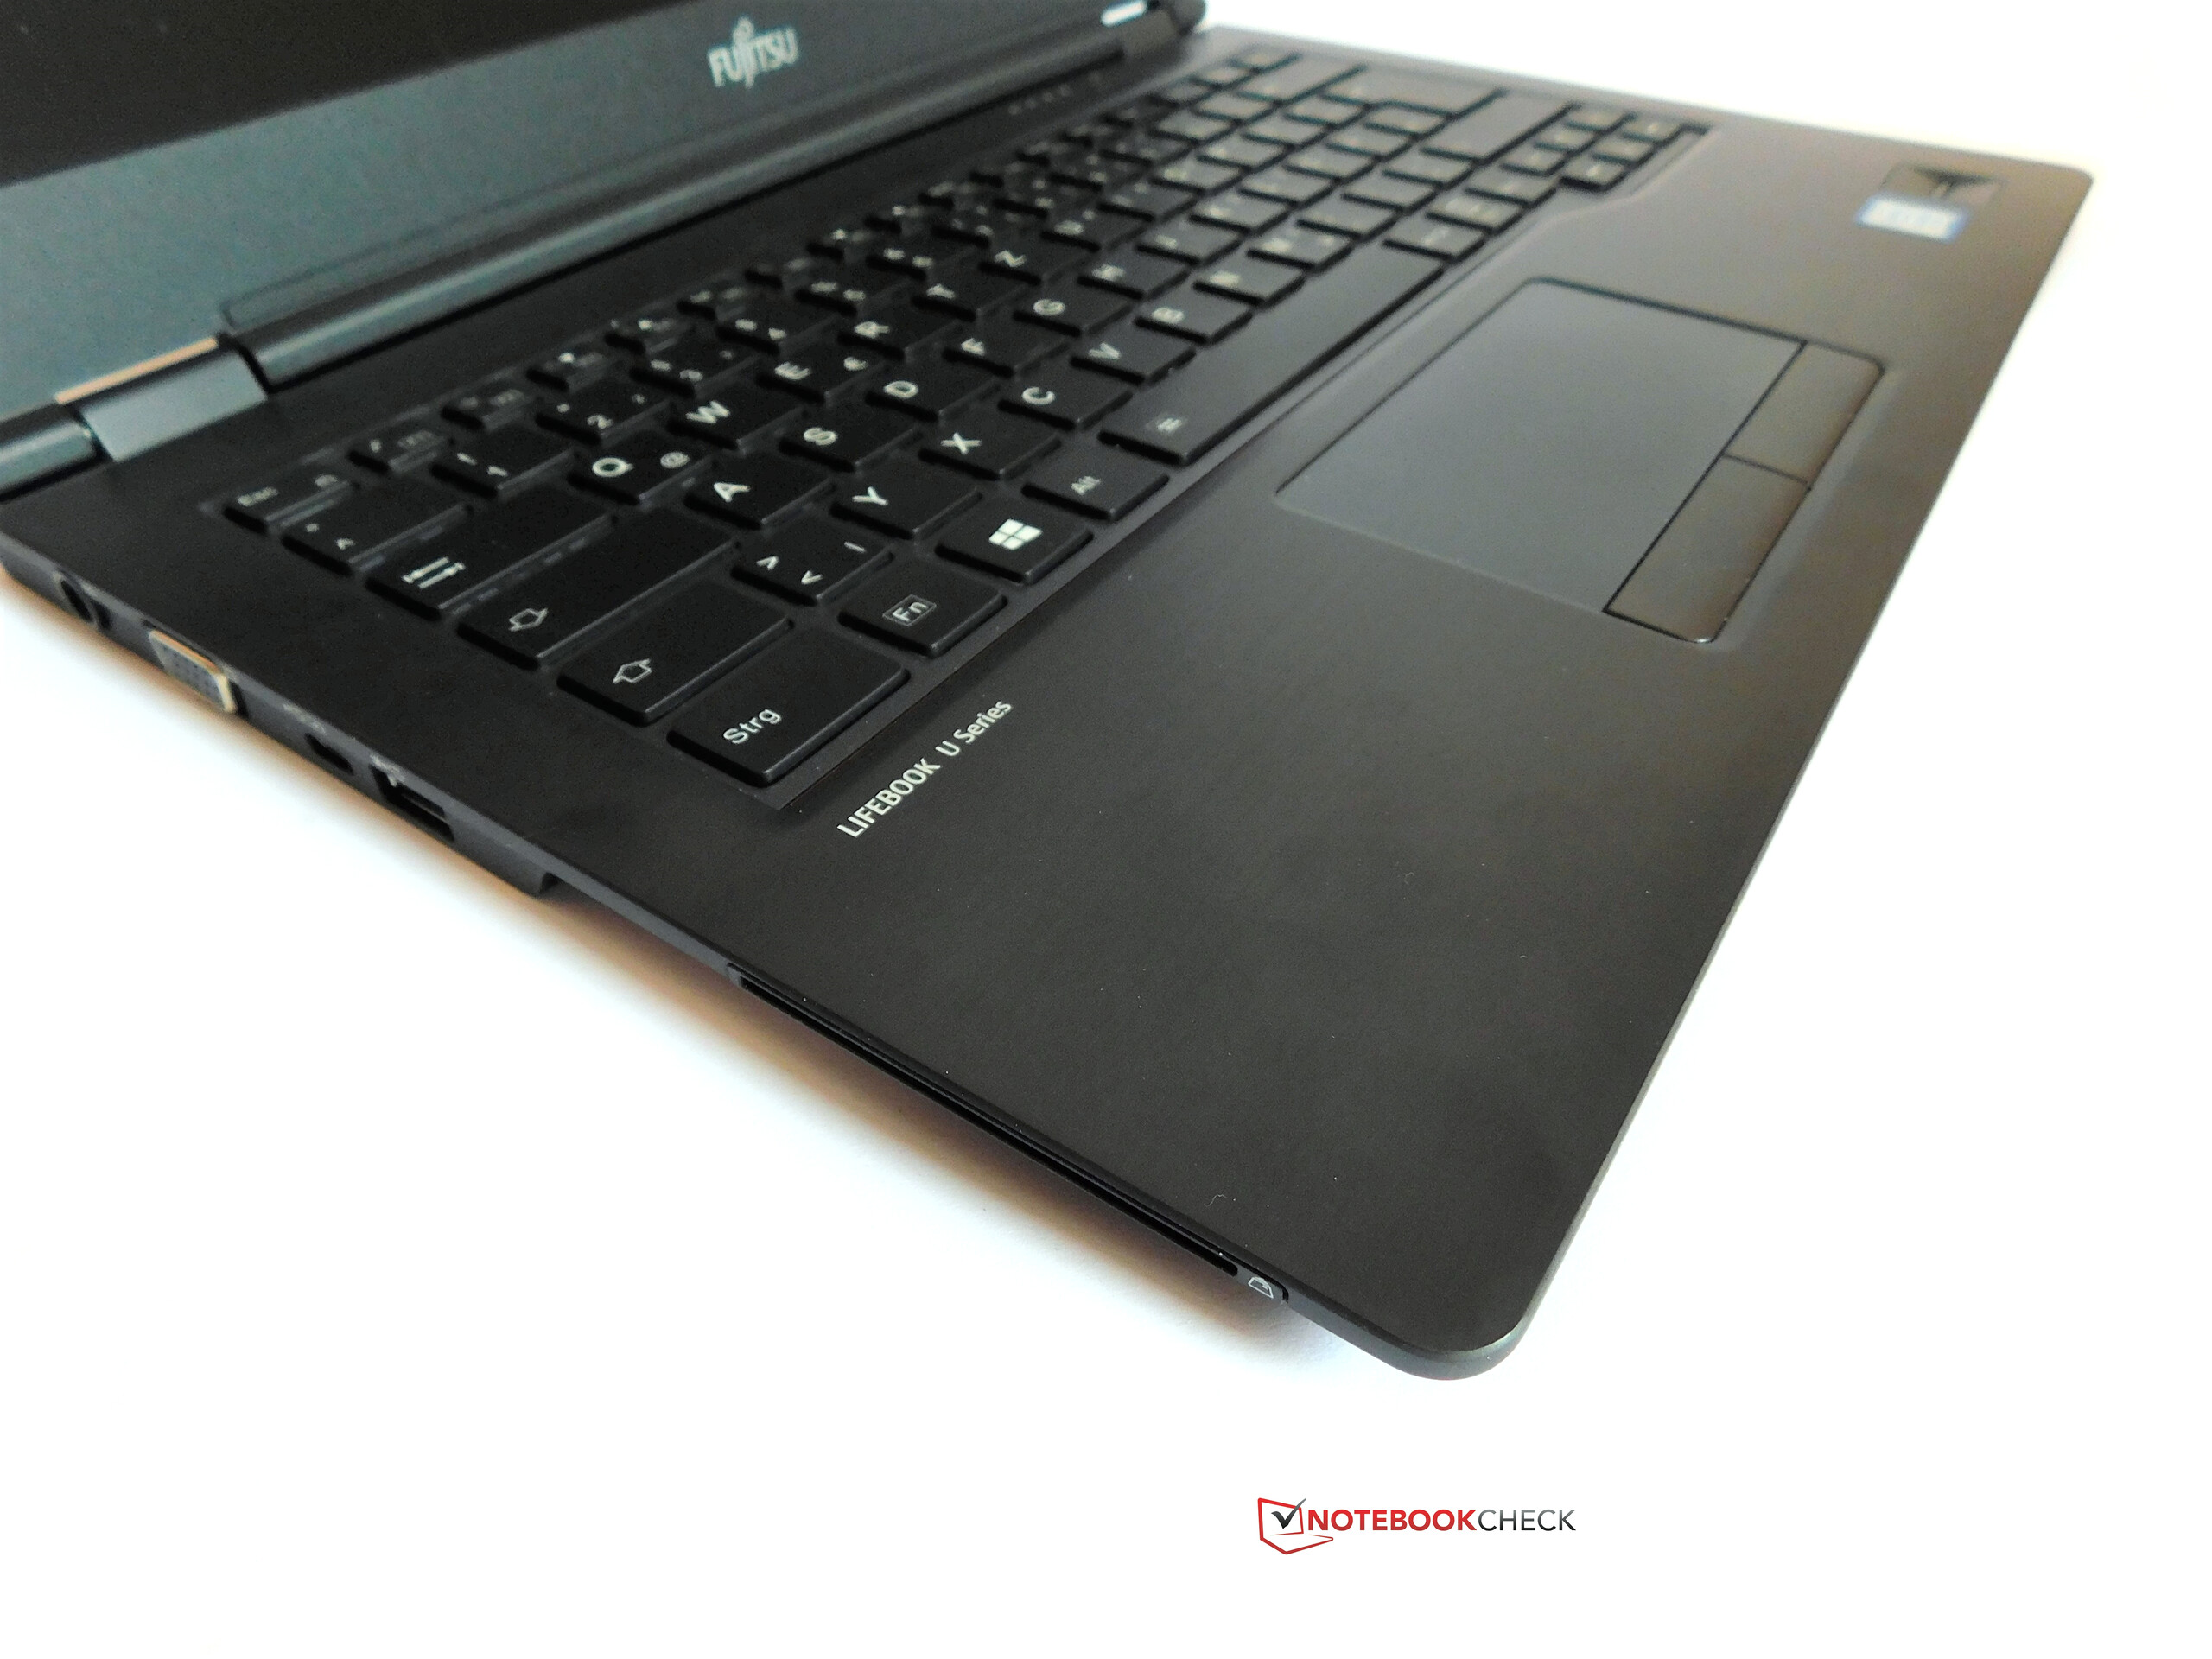
O Lifebook U747 é um bom portátil. A Fujitsu dificilmente comete erros. Ele oferece uma excelente tela, boas durações da bateria, e um teclado que permite uma digitação confortável. A carcaça é estável, bem construída, e o seu design combina com o campo empresarial. Isto também pode ser dito sobre a diversidade das interfaces. Embora o Thunderbolt 3 não esteja instalado, isto seria mais um problema de luxo do que um verdadeiro ponto negativo. As temperaturas do modelo de teste permanecem sempre baixas e a ventoinha quase sempre está inativa.
O qual resulta em uma breve lista de desvantagens: Embora a ventoinha seja relativamente silenciosa, ela produz um ruído de alta frequência quando começa a funcionar. Certamente, este não é um motivo para sua exclusão, mas é perturbante. O mesmo acontece com os alto falantes e a webcam instalada. No entanto, não é habitual que estes componentes sejam um pouco ignorados. A maior desvantagem é o substituto do mouse. A Fujitsu não instala um touchpad Precision e por isso é um pouco ultrapassado - e o touchpad, portanto, não é tão bom quanto poderia ser. Infelizmente, as teclas do touchpad também deixam uma impressão muito inferior e imprecisa. Um TrackPoint que poderia ter compensado pelo touchpad não é instalado no Lifebook. Finalmente, o período de garantia é um pouco curto, em comparação com os concorrentes.
A Fujitsu envia um forte participante para competir pela coroa empresarial com o seu Lifebook U747. Infelizmente, o touchpad nada ideal, estraga a boa apresentação do poli funcional empresarial.
Apesar do touchpad, o Lifebook recebe uma recomendação de compra, dado que, no geral, é um aparelho bem concebido. No entanto, a concorrência não facilitará as coisas para a Fujitsu, dado que este setor do mercado é muito competitivo. Um rical muito forte, certamente é o Lenovo ThinkPad T470 que se sai melhor que o Lifebook em muitos aspectos; apenas su atela poderia se considerar pior. O novo Dell Latitude e os novos modelos Elitebook da HP (Latitude 7480 e Elitebook 840 G4) com certeza serão rivais fortes. Os testes correspondentes serão publicados em breve.
Fujitsu LifeBook U747
- 03/09/2017 v6 (old)
Benjamin Herzig