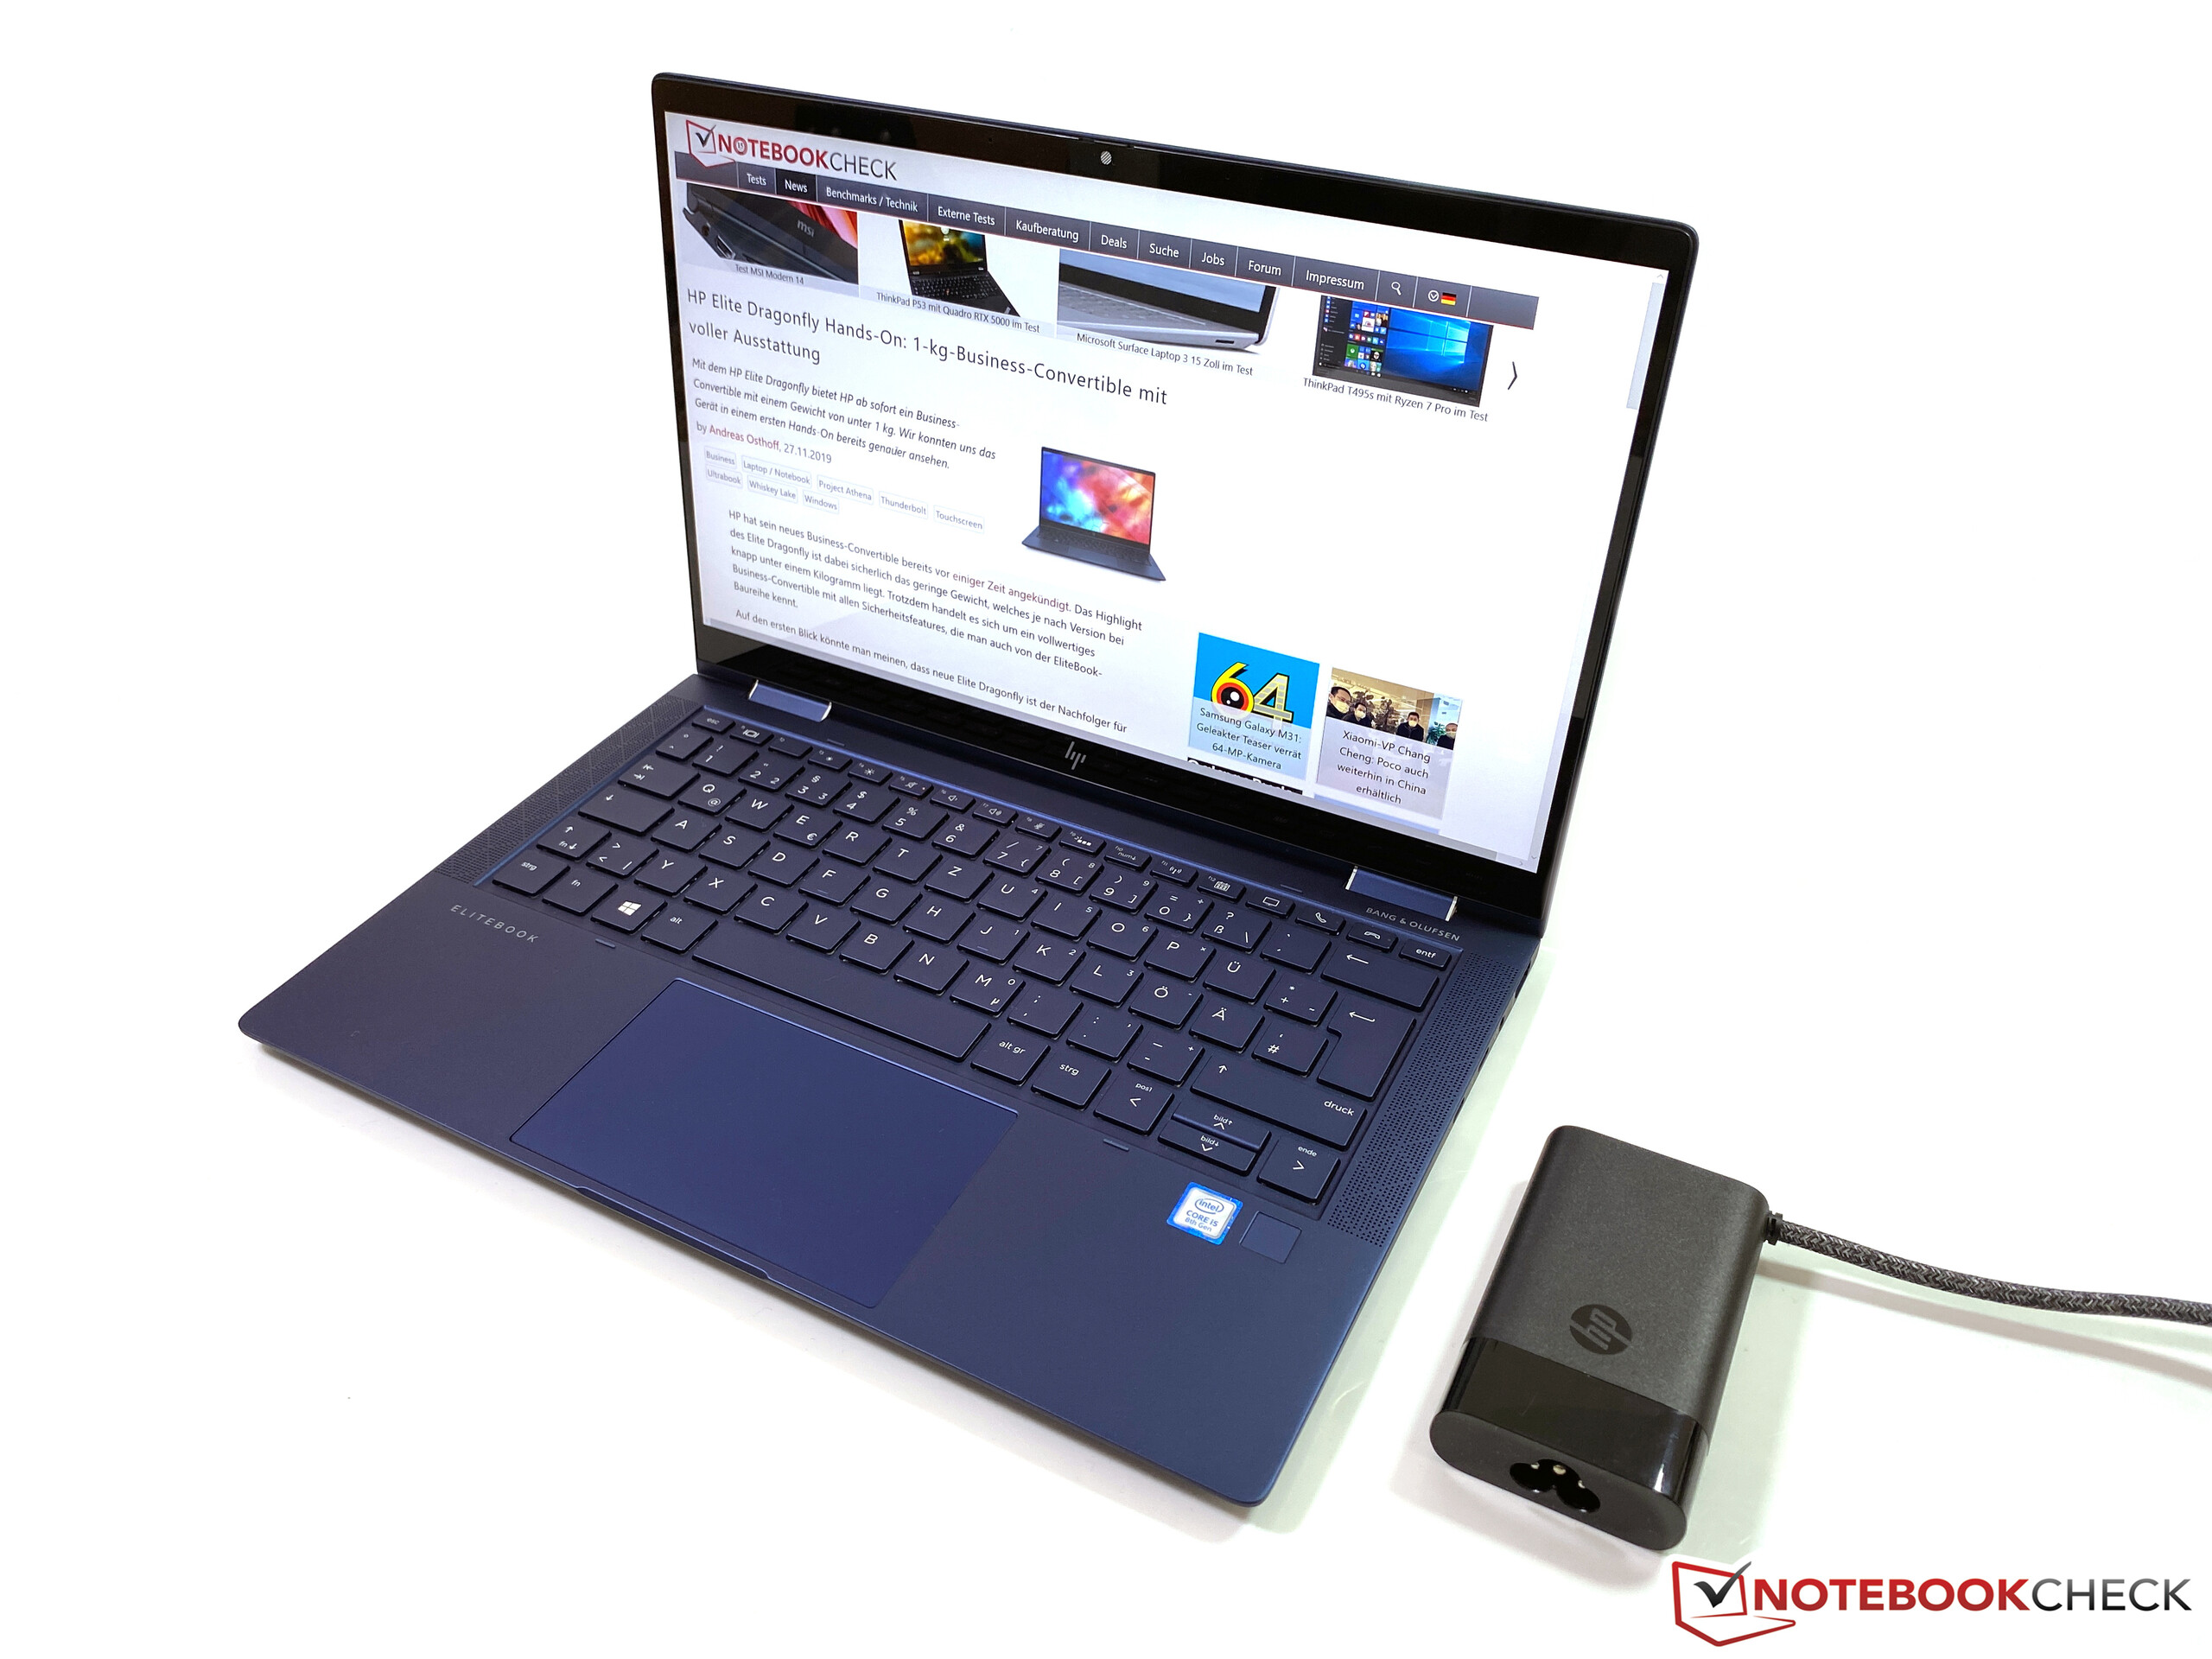
Breve Análise do Conversível HP Elite Dragonfly Business: Menos de 1 kg apenas com a bateria menor
Avaliação | Data | Modelo | Peso | Altura | Size | Resolução | Preço |
|---|---|---|---|---|---|---|---|
| 90.3 % v7 (old) | 04/2020 | HP Elite Dragonfly-8MK79EA i5-8265U, UHD Graphics 620 | 1.1 kg | 16.1 mm | 13.30" | 1920x1080 | |
| 88.4 % v7 (old) | 12/2019 | HP Spectre x360 13-aw0013dx i7-1065G7, Iris Plus Graphics G7 (Ice Lake 64 EU) | 1.2 kg | 16.9 mm | 13.30" | 1920x1080 | |
| 87.4 % v6 (old) | 06/2019 | Lenovo ThinkPad X390 Yoga-20NQS05R00 i7-8565U, UHD Graphics 620 | 1.3 kg | 15.95 mm | 13.30" | 1920x1080 | |
| 86.3 % v7 (old) | 10/2019 | Dell XPS 13 7390 2-in-1 Core i7 i7-1065G7, Iris Plus Graphics G7 (Ice Lake 64 EU) | 1.3 kg | 13 mm | 13.40" | 1920x1200 |
| Networking | |
| iperf3 transmit AX12 | |
| HP Elite Dragonfly-8MK79EA | |
| Lenovo ThinkPad X390 Yoga-20NQS05R00 | |
| Dell XPS 13 7390 2-in-1 Core i7 | |
| iperf3 receive AX12 | |
| HP Elite Dragonfly-8MK79EA | |
| Lenovo ThinkPad X390 Yoga-20NQS05R00 | |
| Dell XPS 13 7390 2-in-1 Core i7 | |

")
")
| |||||||||||||||||||||||||
iluminação: 87 %
iluminação com acumulador: 411 cd/m²
Contraste: 1868:1 (Preto: 0.22 cd/m²)
ΔE ColorChecker Calman: 1.8 | ∀{0.5-29.43 Ø4.73}
calibrated: 1
ΔE Greyscale Calman: 2.5 | ∀{0.09-98 Ø4.97}
99.3% sRGB (Argyll 1.6.3 3D)
64.7% AdobeRGB 1998 (Argyll 1.6.3 3D)
70.9% AdobeRGB 1998 (Argyll 3D)
99.4% sRGB (Argyll 3D)
69% Display P3 (Argyll 3D)
Gamma: 2.26
CCT: 6448 K
| HP Elite Dragonfly-8MK79EA AUO5E2D, IPS, 1920x1080, 13.3" | HP Spectre x360 13-aw0013dx AU Optronics AUO5E2D, IPS, 1920x1080, 13.3" | Lenovo ThinkPad X390 Yoga-20NQS05R00 LP133WF7-SPA1, IPS LED, 1920x1080, 13.3" | Dell XPS 13 7390 2-in-1 Core i7 Sharp LQ134N1, IPS, 1920x1200, 13.4" | |
|---|---|---|---|---|
| Display | 0% | -4% | 1% | |
| Display P3 Coverage (%) | 69 | 69.6 1% | 65.2 -6% | 69.9 1% |
| sRGB Coverage (%) | 99.4 | 98.9 -1% | 97 -2% | 99.2 0% |
| AdobeRGB 1998 Coverage (%) | 70.9 | 71.5 1% | 67.3 -5% | 71.5 1% |
| Response Times | -5% | 6% | 18% | |
| Response Time Grey 50% / Grey 80% * (ms) | 60.8 ? | 60.8 ? -0% | 59.2 ? 3% | 47.6 ? 22% |
| Response Time Black / White * (ms) | 33.8 ? | 36.8 ? -9% | 30.8 ? 9% | 29.2 ? 14% |
| PWM Frequency (Hz) | 2500 ? | |||
| Screen | -44% | -56% | -7% | |
| Brightness middle (cd/m²) | 411 | 447.4 9% | 319 -22% | 549.8 34% |
| Brightness (cd/m²) | 388 | 420 8% | 306 -21% | 520 34% |
| Brightness Distribution (%) | 87 | 85 -2% | 90 3% | 86 -1% |
| Black Level * (cd/m²) | 0.22 | 0.31 -41% | 0.15 32% | 0.39 -77% |
| Contrast (:1) | 1868 | 1443 -23% | 2127 14% | 1410 -25% |
| Colorchecker dE 2000 * | 1.8 | 4.23 -135% | 6.1 -239% | 2.12 -18% |
| Colorchecker dE 2000 max. * | 4.1 | 9.34 -128% | 9.7 -137% | 3.66 11% |
| Colorchecker dE 2000 calibrated * | 1 | 1.32 -32% | 1 -0% | 1.37 -37% |
| Greyscale dE 2000 * | 2.5 | 6.1 -144% | 8.6 -244% | 2.6 -4% |
| Gamma | 2.26 97% | 2.11 104% | 2.62 84% | 2.3 96% |
| CCT | 6448 101% | 6136 106% | 6613 98% | 6884 94% |
| Color Space (Percent of AdobeRGB 1998) (%) | 64.7 | 64.8 0% | 61.9 -4% | 65.4 1% |
| Color Space (Percent of sRGB) (%) | 99.3 | 98.9 0% | 96.8 -3% | 99.7 0% |
| Média Total (Programa/Configurações) | -16% /
-31% | -18% /
-39% | 4% /
-3% |
* ... menor é melhor
Exibir tempos de resposta
| ↔ Tempo de resposta preto para branco | ||
|---|---|---|
| 33.8 ms ... ascensão ↗ e queda ↘ combinadas | ↗ 17.2 ms ascensão | 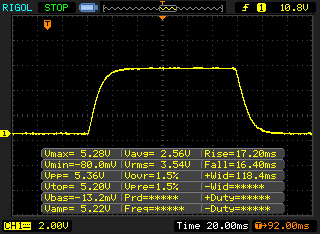 |
| ↘ 16.6 ms queda | ||
| A tela mostra taxas de resposta lentas em nossos testes e será insatisfatória para os jogadores. Em comparação, todos os dispositivos testados variam de 0.1 (mínimo) a 240 (máximo) ms. » 90 % de todos os dispositivos são melhores. Isso significa que o tempo de resposta medido é pior que a média de todos os dispositivos testados (19.9 ms). | ||
| ↔ Tempo de resposta 50% cinza a 80% cinza | ||
| 60.8 ms ... ascensão ↗ e queda ↘ combinadas | ↗ 30.8 ms ascensão | 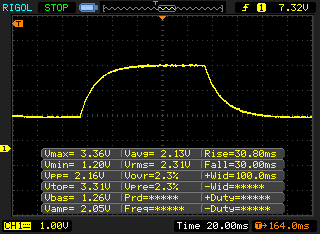 |
| ↘ 30 ms queda | ||
| A tela mostra taxas de resposta lentas em nossos testes e será insatisfatória para os jogadores. Em comparação, todos os dispositivos testados variam de 0.165 (mínimo) a 636 (máximo) ms. » 96 % de todos os dispositivos são melhores. Isso significa que o tempo de resposta medido é pior que a média de todos os dispositivos testados (31.1 ms). | ||
Cintilação da tela / PWM (modulação por largura de pulso)
| Tela tremeluzindo / PWM não detectado | 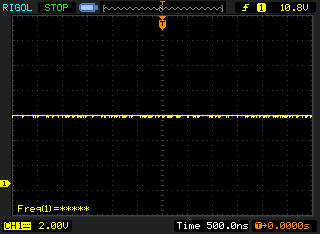 | ||
[pwm_comparison] Em comparação: 52 % de todos os dispositivos testados não usam PWM para escurecer a tela. Se PWM foi detectado, uma média de 7794 (mínimo: 5 - máximo: 343500) Hz foi medida. | |||

| PCMark 8 Home Score Accelerated v2 | 3563 pontos | |
| PCMark 8 Creative Score Accelerated v2 | 4647 pontos | |
| PCMark 8 Work Score Accelerated v2 | 4548 pontos | |
| PCMark 10 Score | 3636 pontos | |
Ajuda | ||

| 3DMark 11 Performance | 1956 pontos | |
| 3DMark Ice Storm Standard Score | 57515 pontos | |
| 3DMark Fire Strike Score | 1091 pontos | |
| 3DMark Time Spy Score | 417 pontos | |
Ajuda | ||
| baixo | média | alto | ultra | |
|---|---|---|---|---|
| BioShock Infinite (2013) | 55.6 | 32.3 | 27.7 | 9.5 |
| The Witcher 3 (2015) | 17.1 | |||
| Dota 2 Reborn (2015) | 66.4 | 40.2 | 18.7 | 16.9 |
| X-Plane 11.11 (2018) | 11.7 | 9.84 | 9.25 |
Barulho
| Ocioso |
| 29.5 / 30 / 30.3 dB |
| Carga |
| 31.6 / 31.6 dB |
 | ||
30 dB silencioso 40 dB(A) audível 50 dB(A) ruidosamente alto |
||
min: | ||
| HP Elite Dragonfly-8MK79EA UHD Graphics 620, i5-8265U, Intel Optane Memory H10 with Solid State Storage 32GB + 512GB HBRPEKNX0202A(L/H) | HP Spectre x360 13-aw0013dx Iris Plus Graphics G7 (Ice Lake 64 EU), i7-1065G7, Intel Optane Memory H10 with Solid State Storage 32GB + 512GB HBRPEKNX0202A(L/H) | Lenovo ThinkPad X390 Yoga-20NQS05R00 UHD Graphics 620, i7-8565U, Intel SSD Pro 7600p SSDPEKKF512G8L | Dell XPS 13 7390 2-in-1 Core i7 Iris Plus Graphics G7 (Ice Lake 64 EU), i7-1065G7, Toshiba BG4 KBG40ZPZ512G | |
|---|---|---|---|---|
| Noise | 3% | -2% | -2% | |
| desligado / ambiente * (dB) | 29.5 | 28.5 3% | 29.2 1% | 28.1 5% |
| Idle Minimum * (dB) | 29.5 | 28.5 3% | 29.2 1% | 28.1 5% |
| Idle Average * (dB) | 30 | 28.5 5% | 29.2 3% | 28.1 6% |
| Idle Maximum * (dB) | 30.3 | 28.5 6% | 29.2 4% | 28.1 7% |
| Load Average * (dB) | 31.6 | 28.5 10% | 35 -11% | 31.7 -0% |
| Load Maximum * (dB) | 31.6 | 35.3 -12% | 35 -11% | 43.4 -37% |
| Witcher 3 ultra * (dB) | 35.3 | 43.4 |
* ... menor é melhor
(±) A temperatura máxima no lado superior é 41.1 °C / 106 F, em comparação com a média de 35.4 °C / 96 F , variando de 19.6 a 60 °C para a classe Convertible.
(-) A parte inferior aquece até um máximo de 47.5 °C / 118 F, em comparação com a média de 36.9 °C / 98 F
(+) Em uso inativo, a temperatura média para o lado superior é 25.1 °C / 77 F, em comparação com a média do dispositivo de 30.3 °C / ### class_avg_f### F.
(+) Os apoios para as mãos e o touchpad são mais frios que a temperatura da pele, com um máximo de 30.4 °C / 86.7 F e, portanto, são frios ao toque.
(-) A temperatura média da área do apoio para as mãos de dispositivos semelhantes foi 28 °C / 82.4 F (-2.4 °C / -4.3 F).
HP Elite Dragonfly-8MK79EA análise de áudio
(+) | os alto-falantes podem tocar relativamente alto (###valor### dB)
Graves 100 - 315Hz
(±) | graves reduzidos - em média 7.8% menor que a mediana
(±) | a linearidade dos graves é média (9.6% delta para a frequência anterior)
Médios 400 - 2.000 Hz
(+) | médios equilibrados - apenas 4% longe da mediana
(+) | médios são lineares (4.5% delta para frequência anterior)
Altos 2 - 16 kHz
(±) | máximos mais altos - em média 5.8% maior que a mediana
(±) | a linearidade dos máximos é média (7.1% delta para frequência anterior)
Geral 100 - 16.000 Hz
(+) | o som geral é linear (14.1% diferença em relação à mediana)
Comparado com a mesma classe
» 20% de todos os dispositivos testados nesta classe foram melhores, 4% semelhantes, 76% piores
» O melhor teve um delta de 6%, a média foi 20%, o pior foi 57%
Comparado com todos os dispositivos testados
» 17% de todos os dispositivos testados foram melhores, 4% semelhantes, 80% piores
» O melhor teve um delta de 4%, a média foi 24%, o pior foi 134%
Dell XPS 13 7390 2-in-1 Core i7 análise de áudio
(±) | o volume do alto-falante é médio, mas bom (###valor### dB)
Graves 100 - 315Hz
(±) | graves reduzidos - em média 7.8% menor que a mediana
(±) | a linearidade dos graves é média (12.5% delta para a frequência anterior)
Médios 400 - 2.000 Hz
(+) | médios equilibrados - apenas 4.5% longe da mediana
(+) | médios são lineares (6.2% delta para frequência anterior)
Altos 2 - 16 kHz
(+) | agudos equilibrados - apenas 3.4% longe da mediana
(±) | a linearidade dos máximos é média (10.5% delta para frequência anterior)
Geral 100 - 16.000 Hz
(+) | o som geral é linear (14.8% diferença em relação à mediana)
Comparado com a mesma classe
» 23% de todos os dispositivos testados nesta classe foram melhores, 4% semelhantes, 72% piores
» O melhor teve um delta de 6%, a média foi 20%, o pior foi 57%
Comparado com todos os dispositivos testados
» 20% de todos os dispositivos testados foram melhores, 4% semelhantes, 76% piores
» O melhor teve um delta de 4%, a média foi 24%, o pior foi 134%
| desligado | |
| Ocioso | |
| Carga |
|
Key:
min: | |
| HP Elite Dragonfly-8MK79EA i5-8265U, UHD Graphics 620, Intel Optane Memory H10 with Solid State Storage 32GB + 512GB HBRPEKNX0202A(L/H), IPS, 1920x1080, 13.3" | HP Spectre x360 13-aw0013dx i7-1065G7, Iris Plus Graphics G7 (Ice Lake 64 EU), Intel Optane Memory H10 with Solid State Storage 32GB + 512GB HBRPEKNX0202A(L/H), IPS, 1920x1080, 13.3" | Lenovo ThinkPad X390 Yoga-20NQS05R00 i7-8565U, UHD Graphics 620, Intel SSD Pro 7600p SSDPEKKF512G8L, IPS LED, 1920x1080, 13.3" | Dell XPS 13 7390 2-in-1 Core i7 i7-1065G7, Iris Plus Graphics G7 (Ice Lake 64 EU), Toshiba BG4 KBG40ZPZ512G, IPS, 1920x1200, 13.4" | Média Intel UHD Graphics 620 | Média da turma Convertible | |
|---|---|---|---|---|---|---|
| Power Consumption | -9% | -20% | 1% | -11% | -28% | |
| Idle Minimum * (Watt) | 3.5 | 3.9 -11% | 3.46 1% | 2.6 26% | 3.81 ? -9% | 4.24 ? -21% |
| Idle Average * (Watt) | 5.1 | 6.3 -24% | 5.88 -15% | 5.3 -4% | 6.94 ? -36% | 7.03 ? -38% |
| Idle Maximum * (Watt) | 8.1 | 6.8 16% | 9.12 -13% | 7 14% | 8.75 ? -8% | 8.61 ? -6% |
| Load Average * (Watt) | 35.6 | 32.6 8% | 45.6 -28% | 43.1 -21% | 35 ? 2% | 43.9 ? -23% |
| Load Maximum * (Watt) | 44.7 | 59 -32% | 65.9 -47% | 49 -10% | 47.5 ? -6% | 67.2 ? -50% |
| Witcher 3 ultra * (Watt) | 25.6 | 43.1 |
* ... menor é melhor
| HP Elite Dragonfly-8MK79EA i5-8265U, UHD Graphics 620, 56.2 Wh | HP Spectre x360 13-aw0013dx i7-1065G7, Iris Plus Graphics G7 (Ice Lake 64 EU), 60 Wh | Lenovo ThinkPad X390 Yoga-20NQS05R00 i7-8565U, UHD Graphics 620, 50 Wh | Dell XPS 13 7390 2-in-1 Core i7 i7-1065G7, Iris Plus Graphics G7 (Ice Lake 64 EU), 51 Wh | Média da turma Convertible | |
|---|---|---|---|---|---|
| Duração da bateria | -3% | -27% | -11% | 4% | |
| H.264 (h) | 12 | 10 -17% | 15.3 ? 28% | ||
| WiFi v1.3 (h) | 10.1 | 9.9 -2% | 8.2 -19% | 9 -11% | 12.1 ? 20% |
| Load (h) | 2.8 | 2.7 -4% | 1.5 -46% | 1.779 ? -36% | |
| Reader / Idle (h) | 37.1 | 27.7 ? |
Pro
Contra
Veredicto – O Elite Dragonfly é um conversível empresarial muito bom
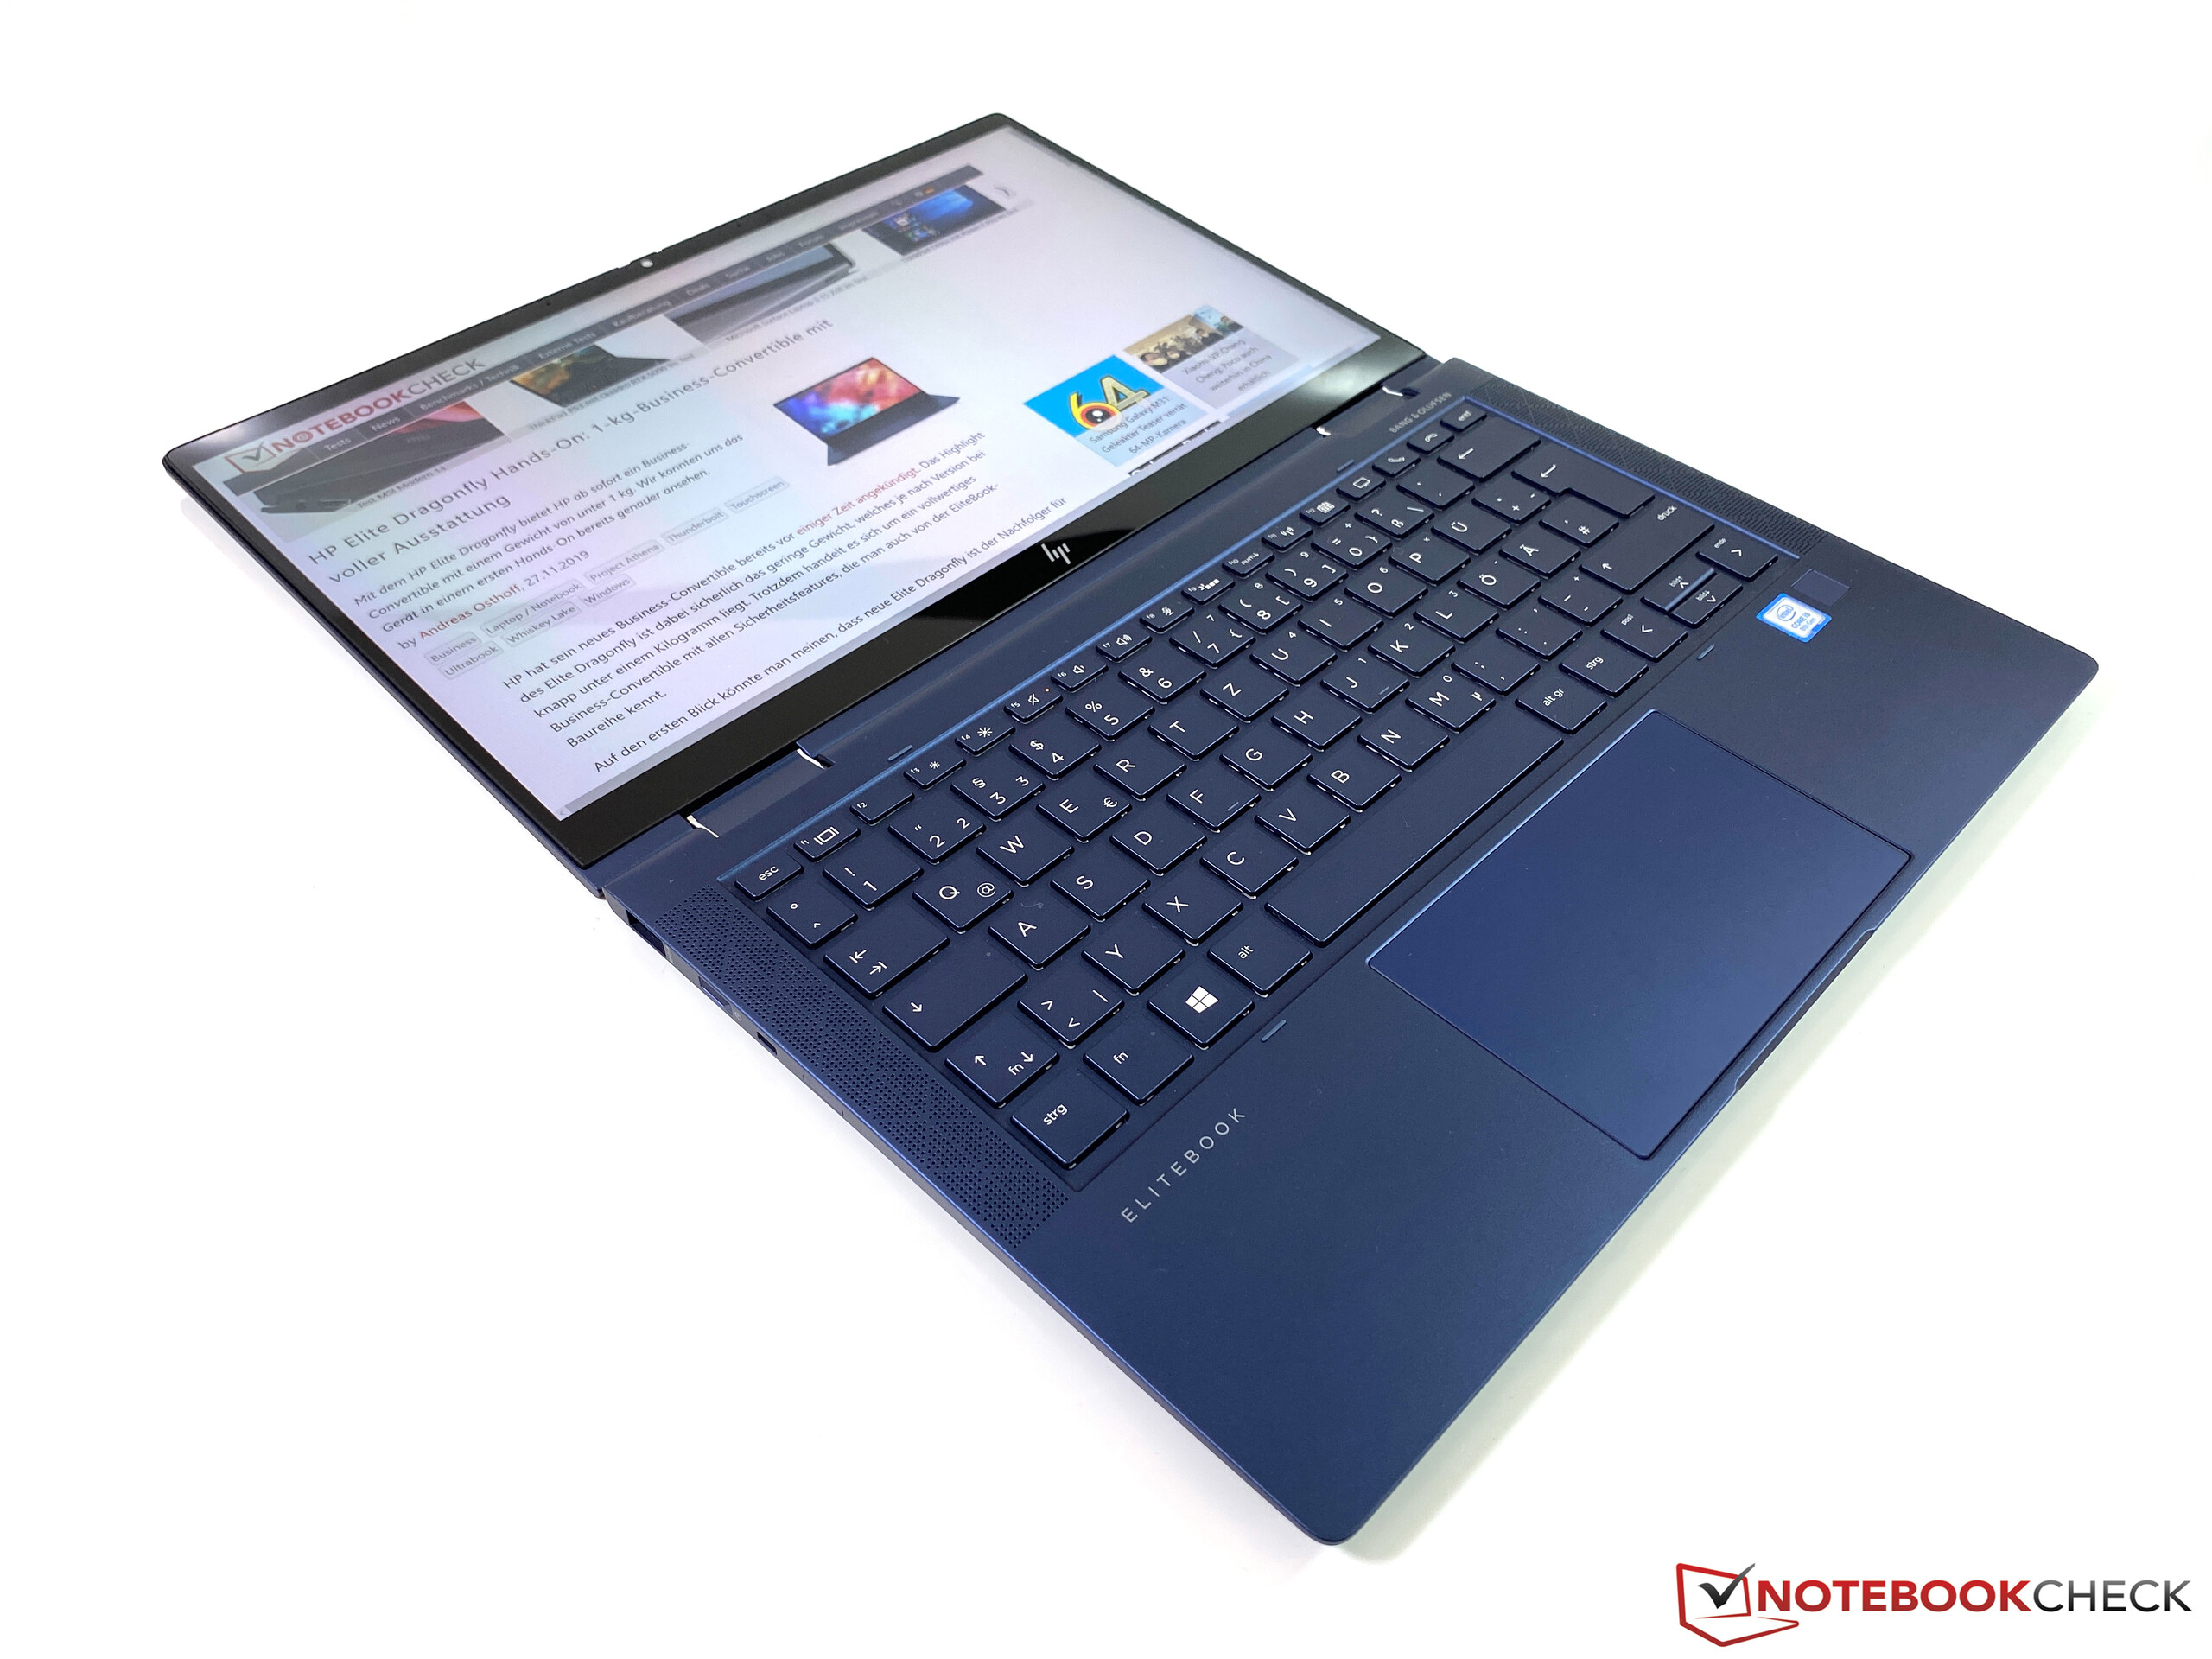
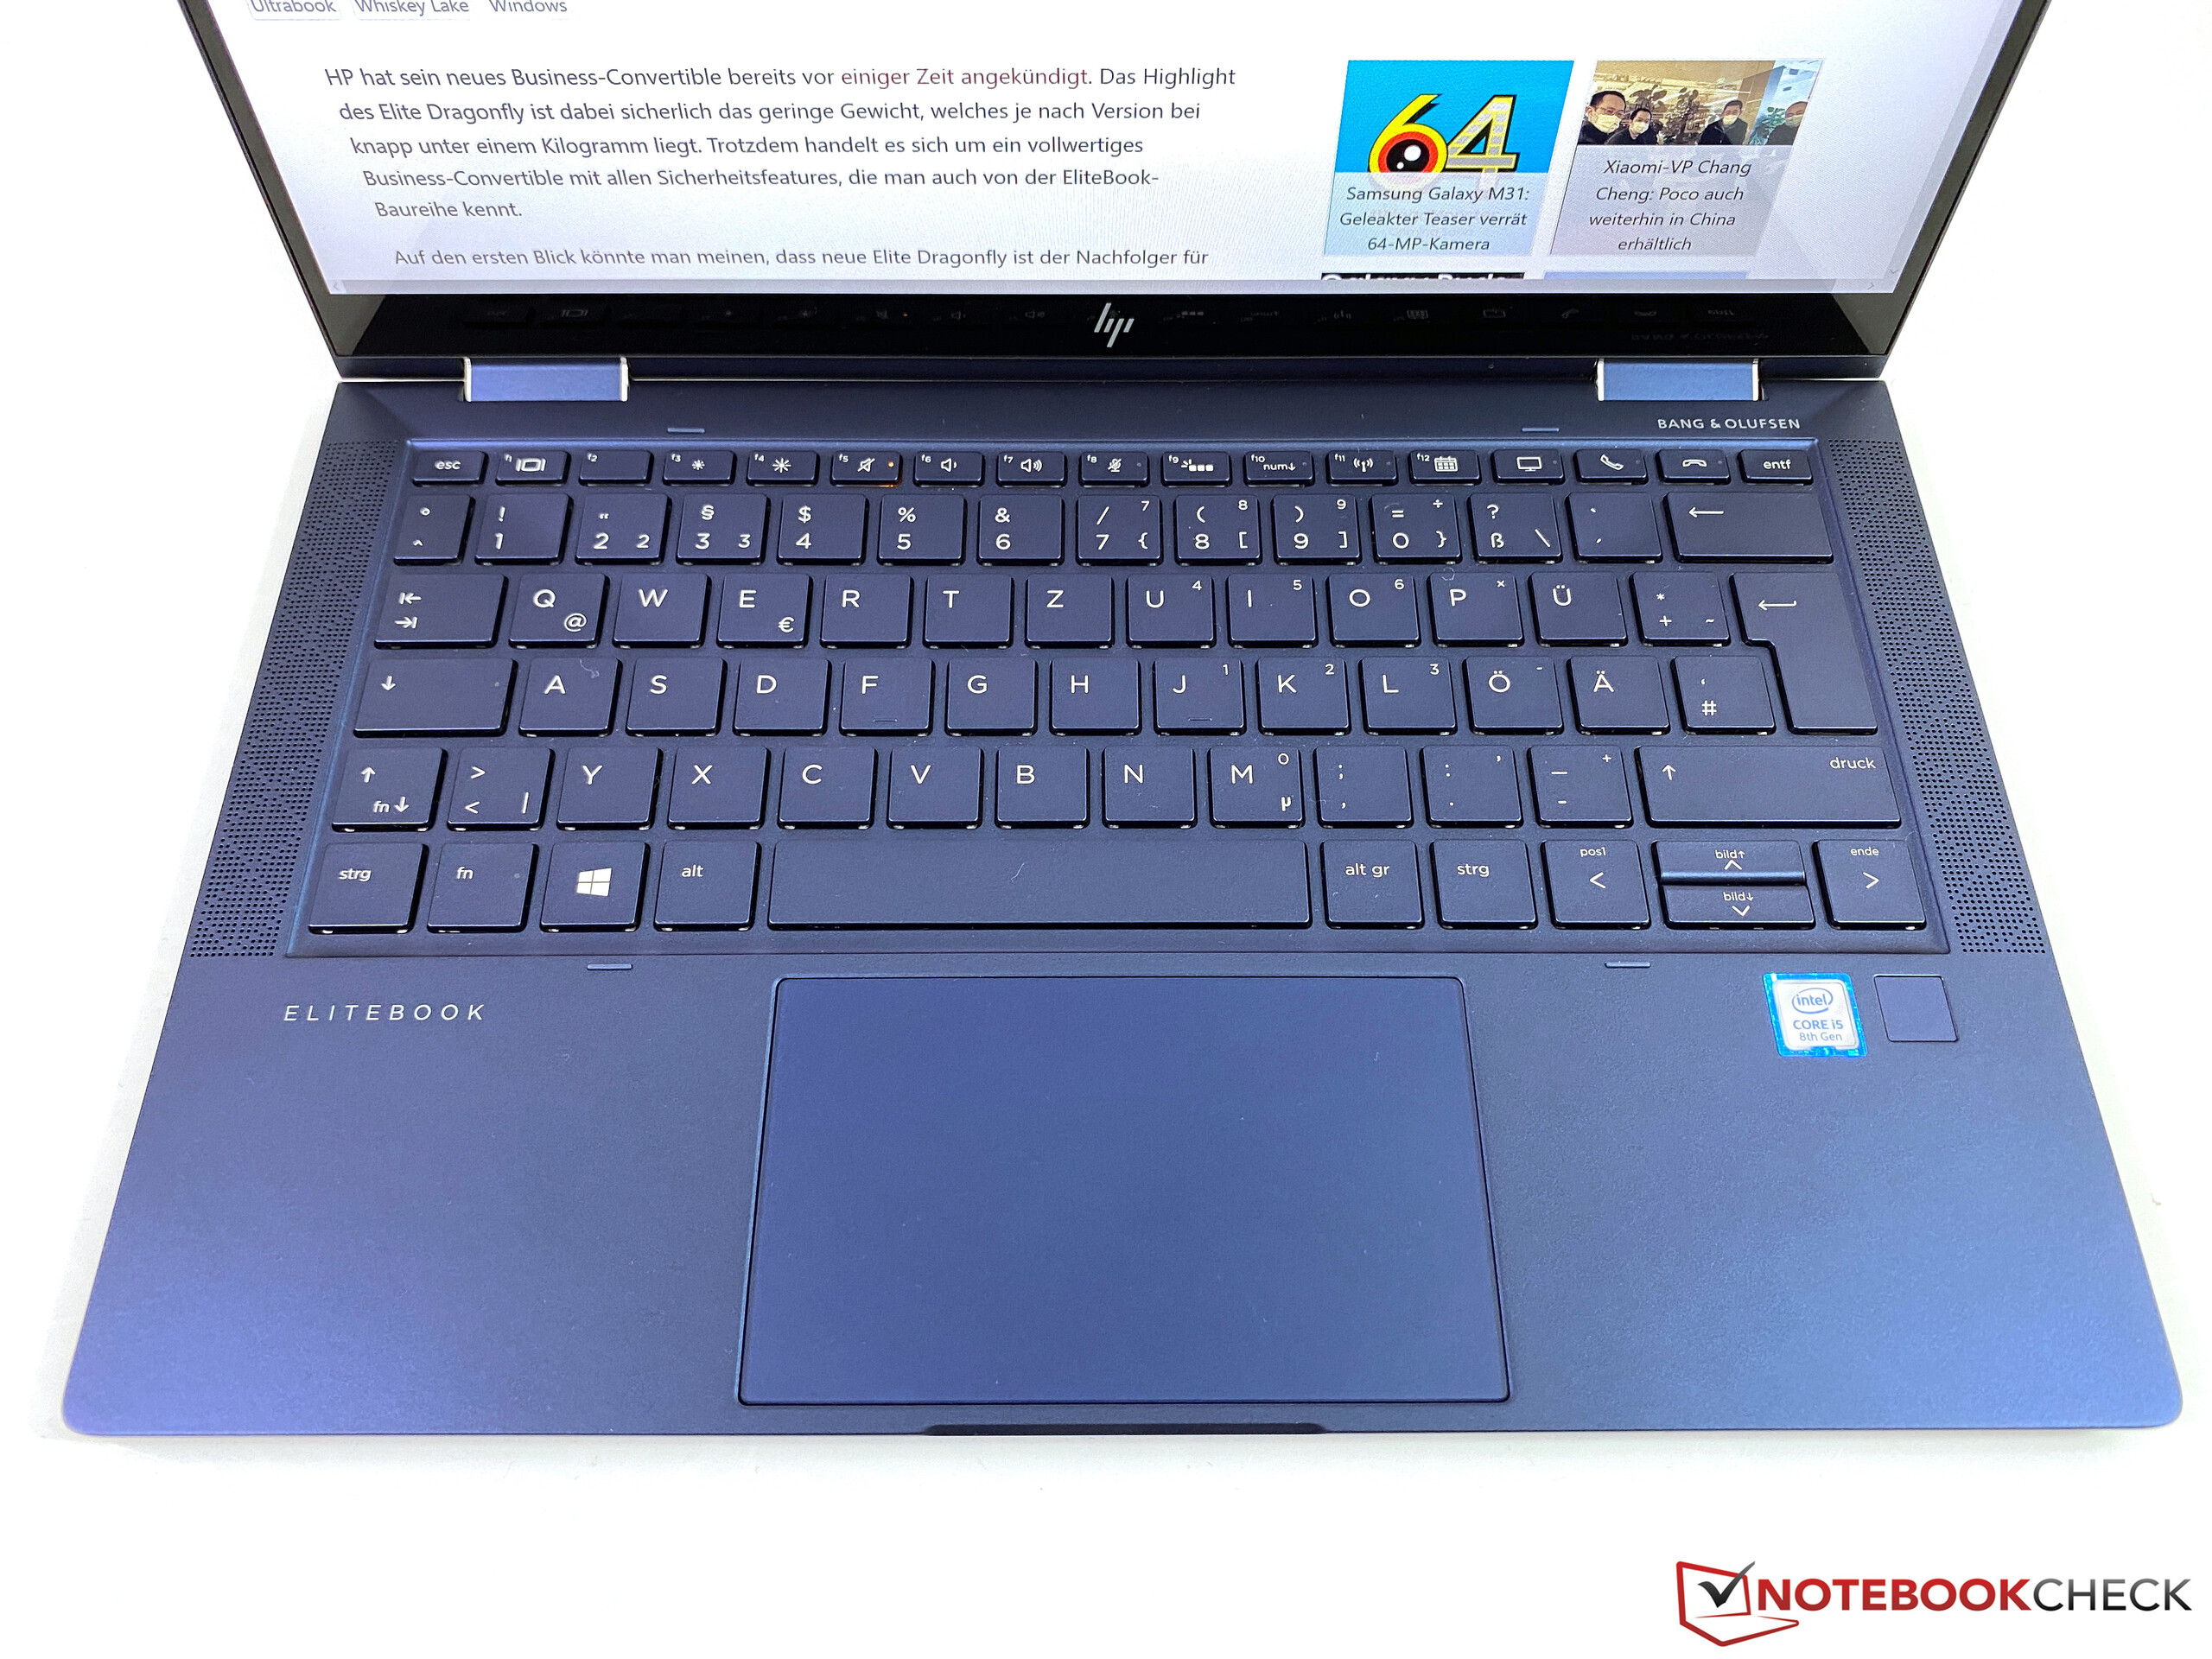
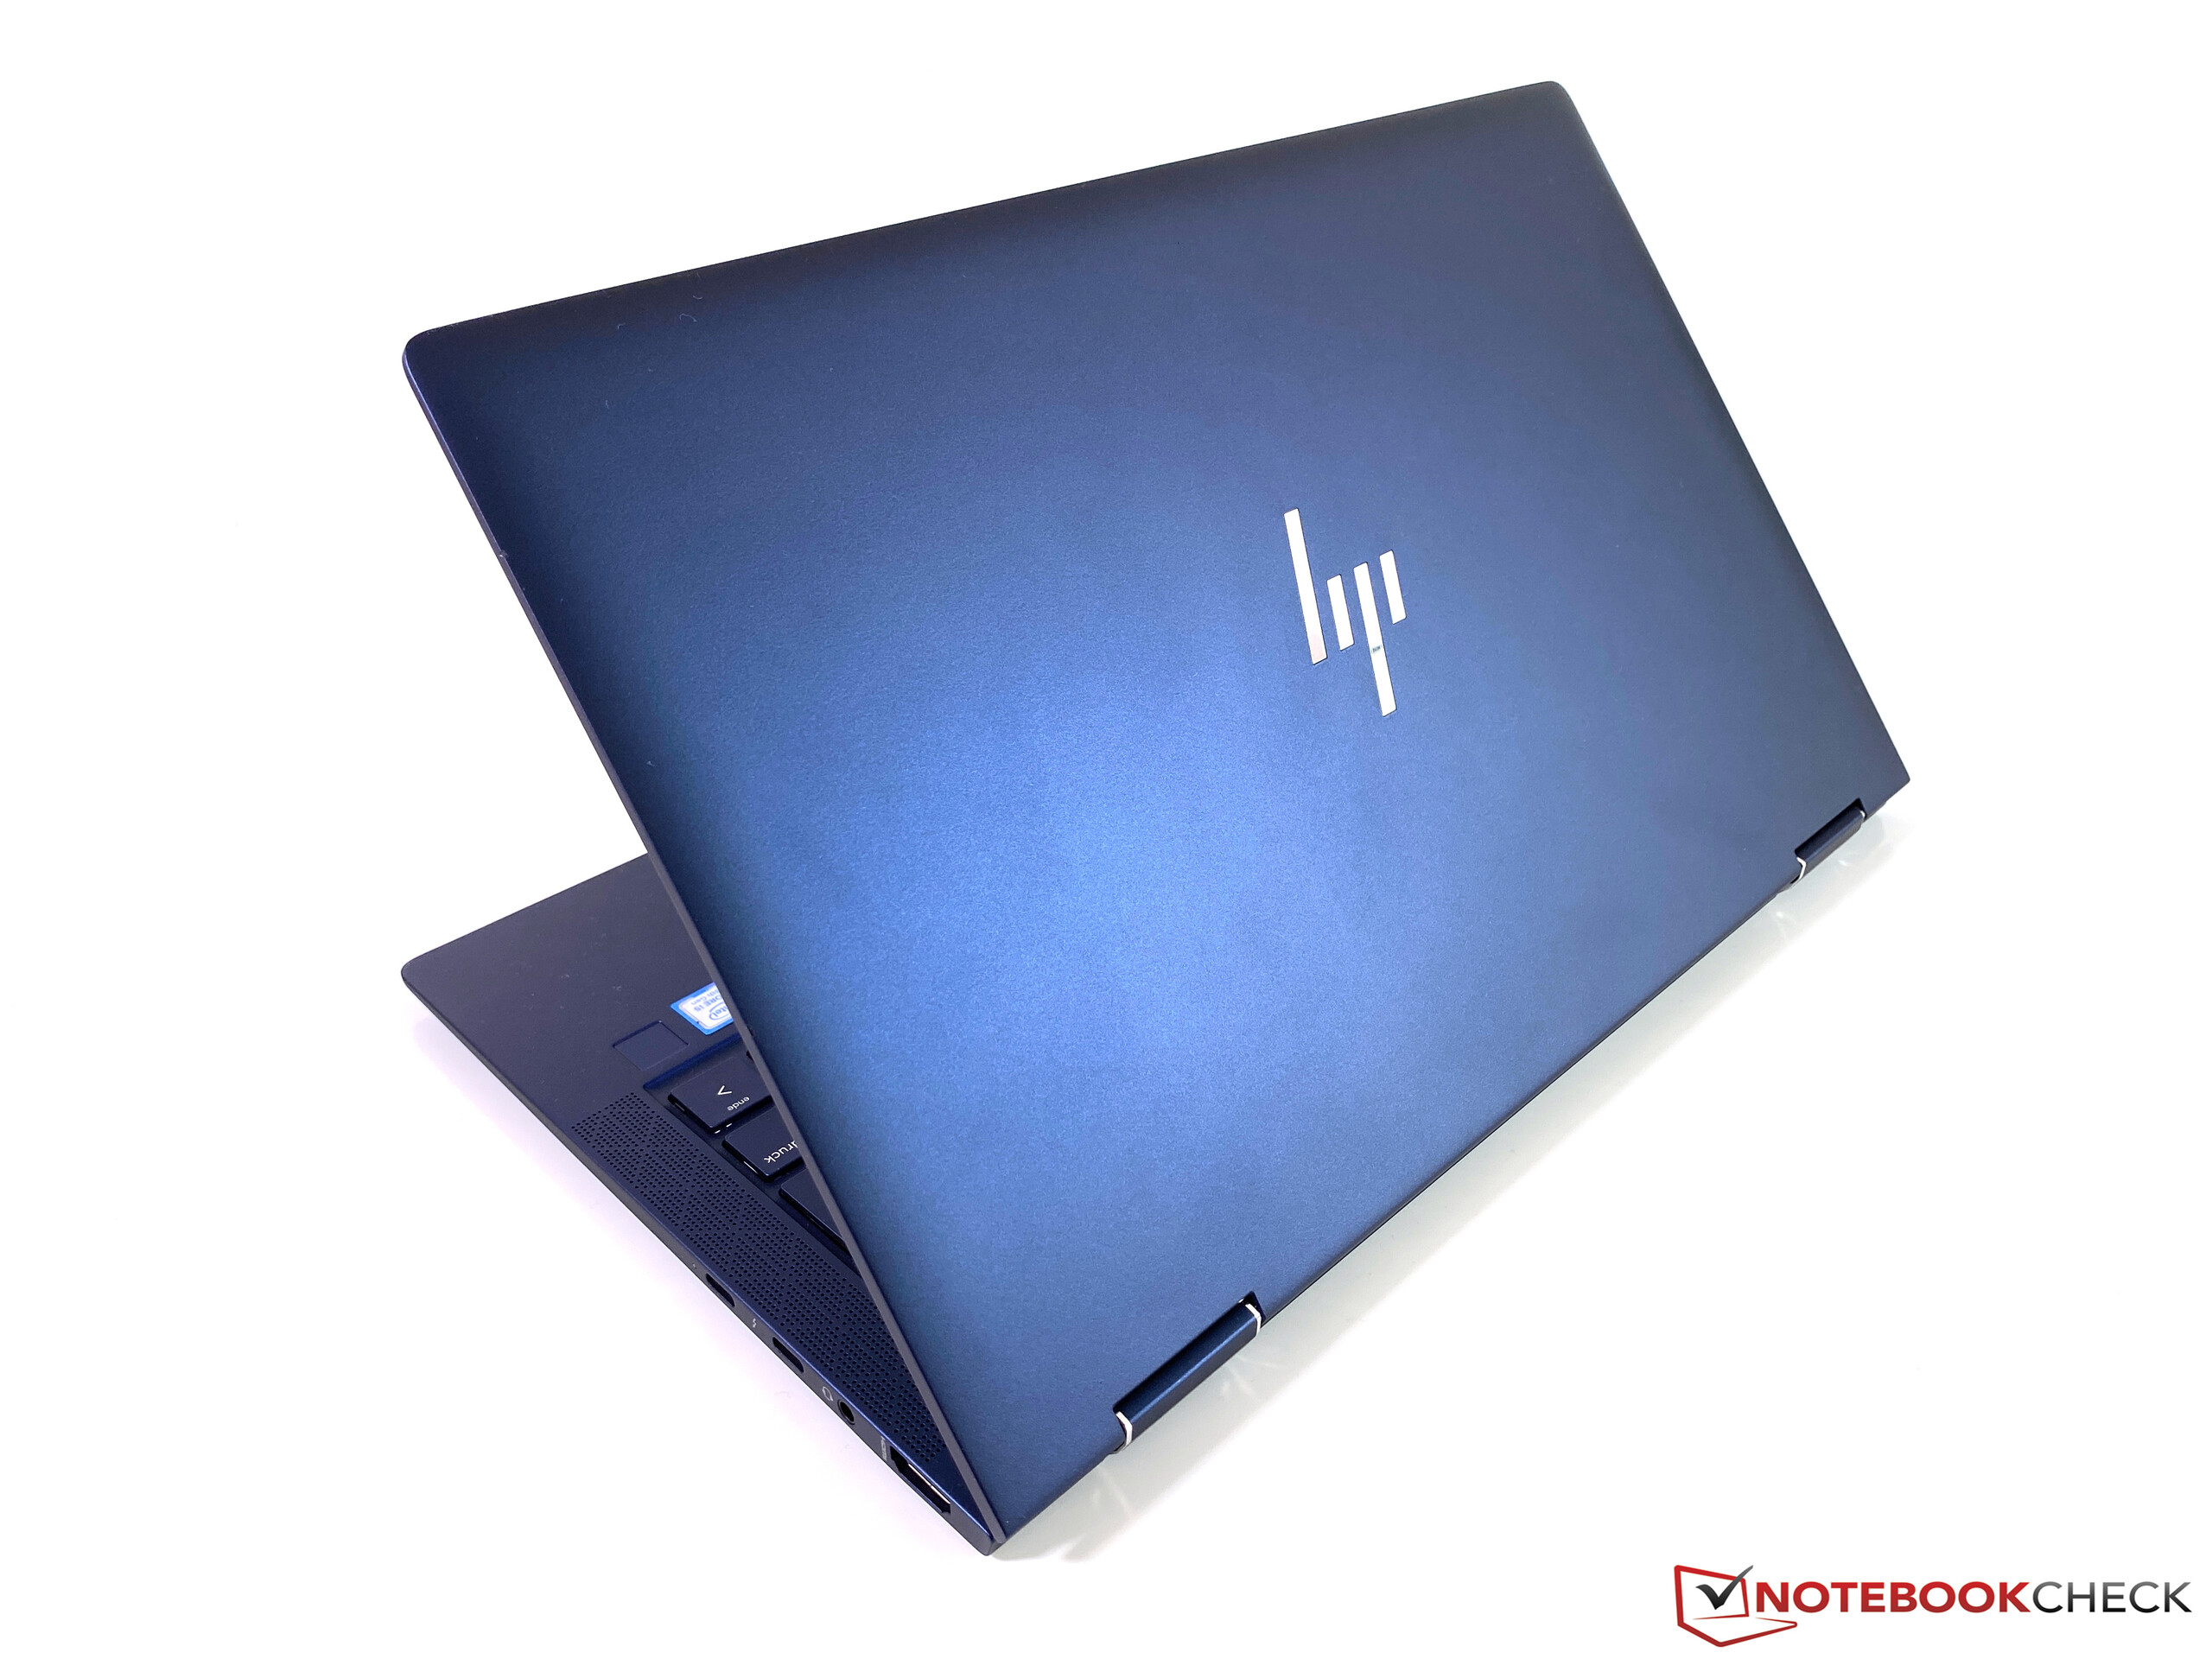
O Elite Dragonfly é um verddeiro EliteBook? Após nossa análise abrangente, podemos responder a essa pergunta com um "sim" definitivo. Você obtém um chassi de alta qualidade e robusto, recursos abrangentes de segurança, bem como opções familiares de serviços, incluindo longa disponibilidade de peças de reposição. O conversível premium da HP também pode convencer em muitos outros aspectos, começando com excelentes dispositivos de entrada, módulos de comunicação rápidos, incluindo LTE e bateria de longa duração. No entanto, este último é reservado para o modelo com bateria maior, o que aumenta o peso para mais de 1 kg. Ainda assim, achamos que esse é um bom compromisso.
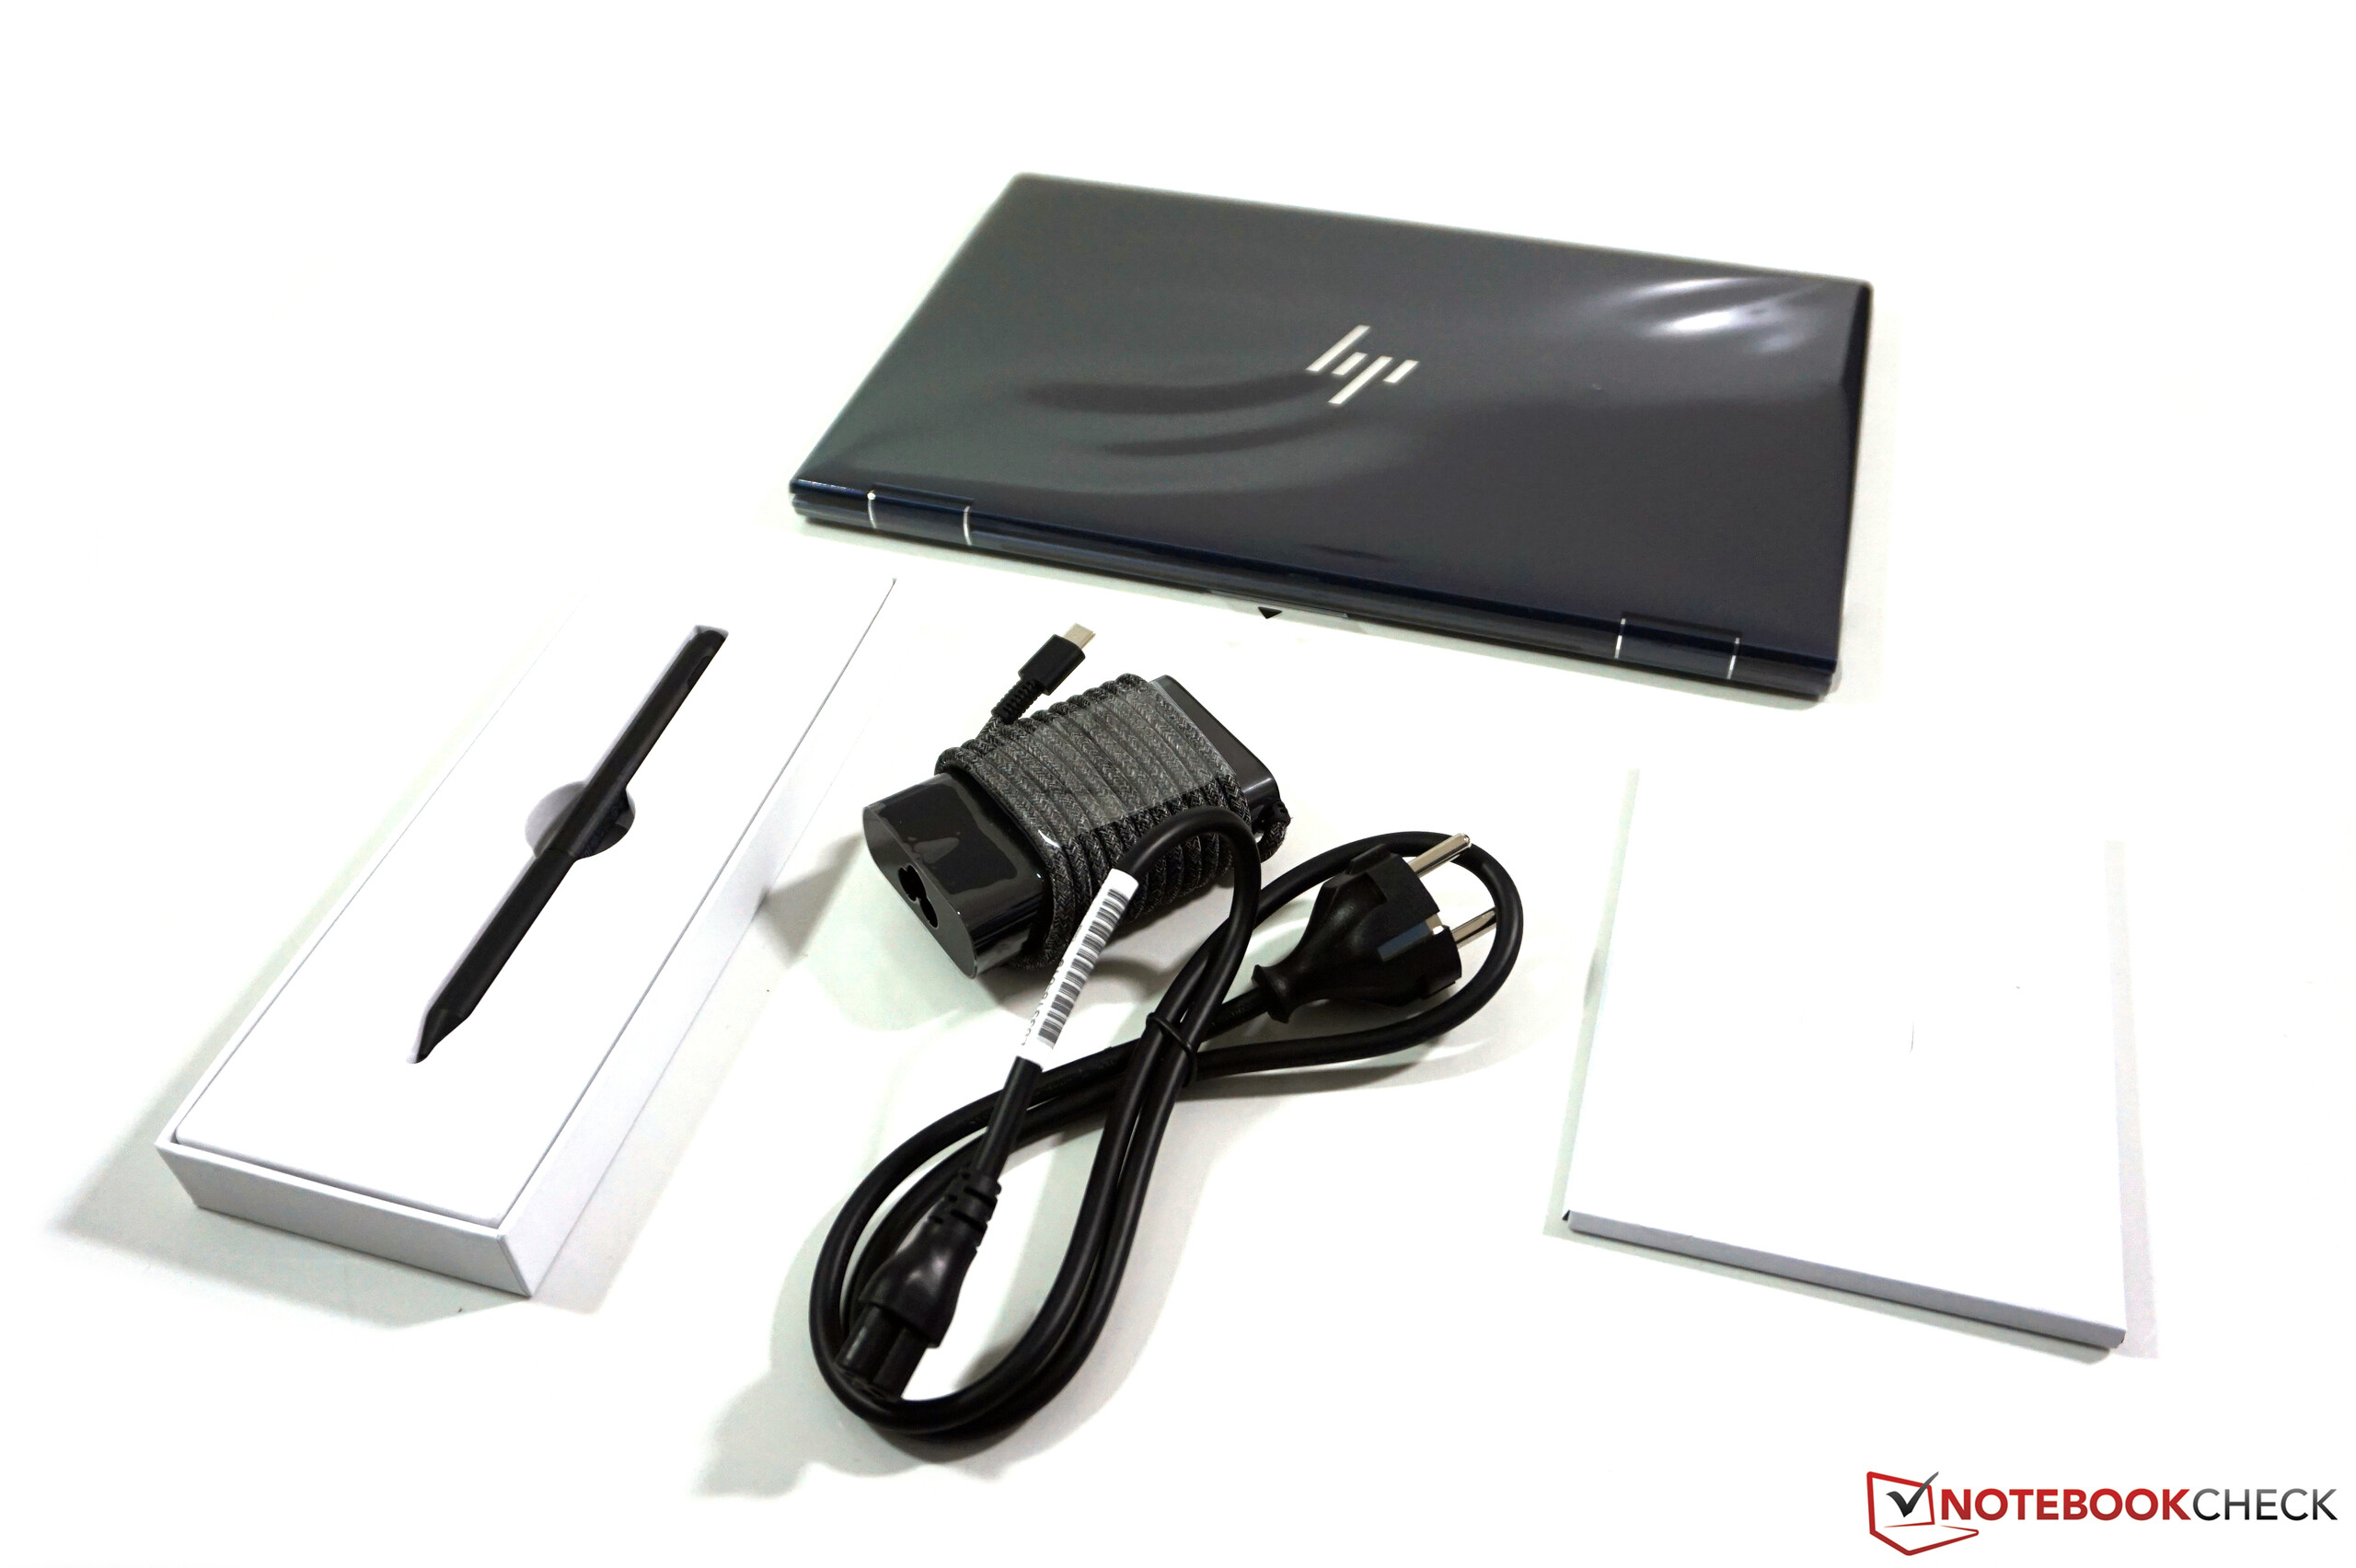
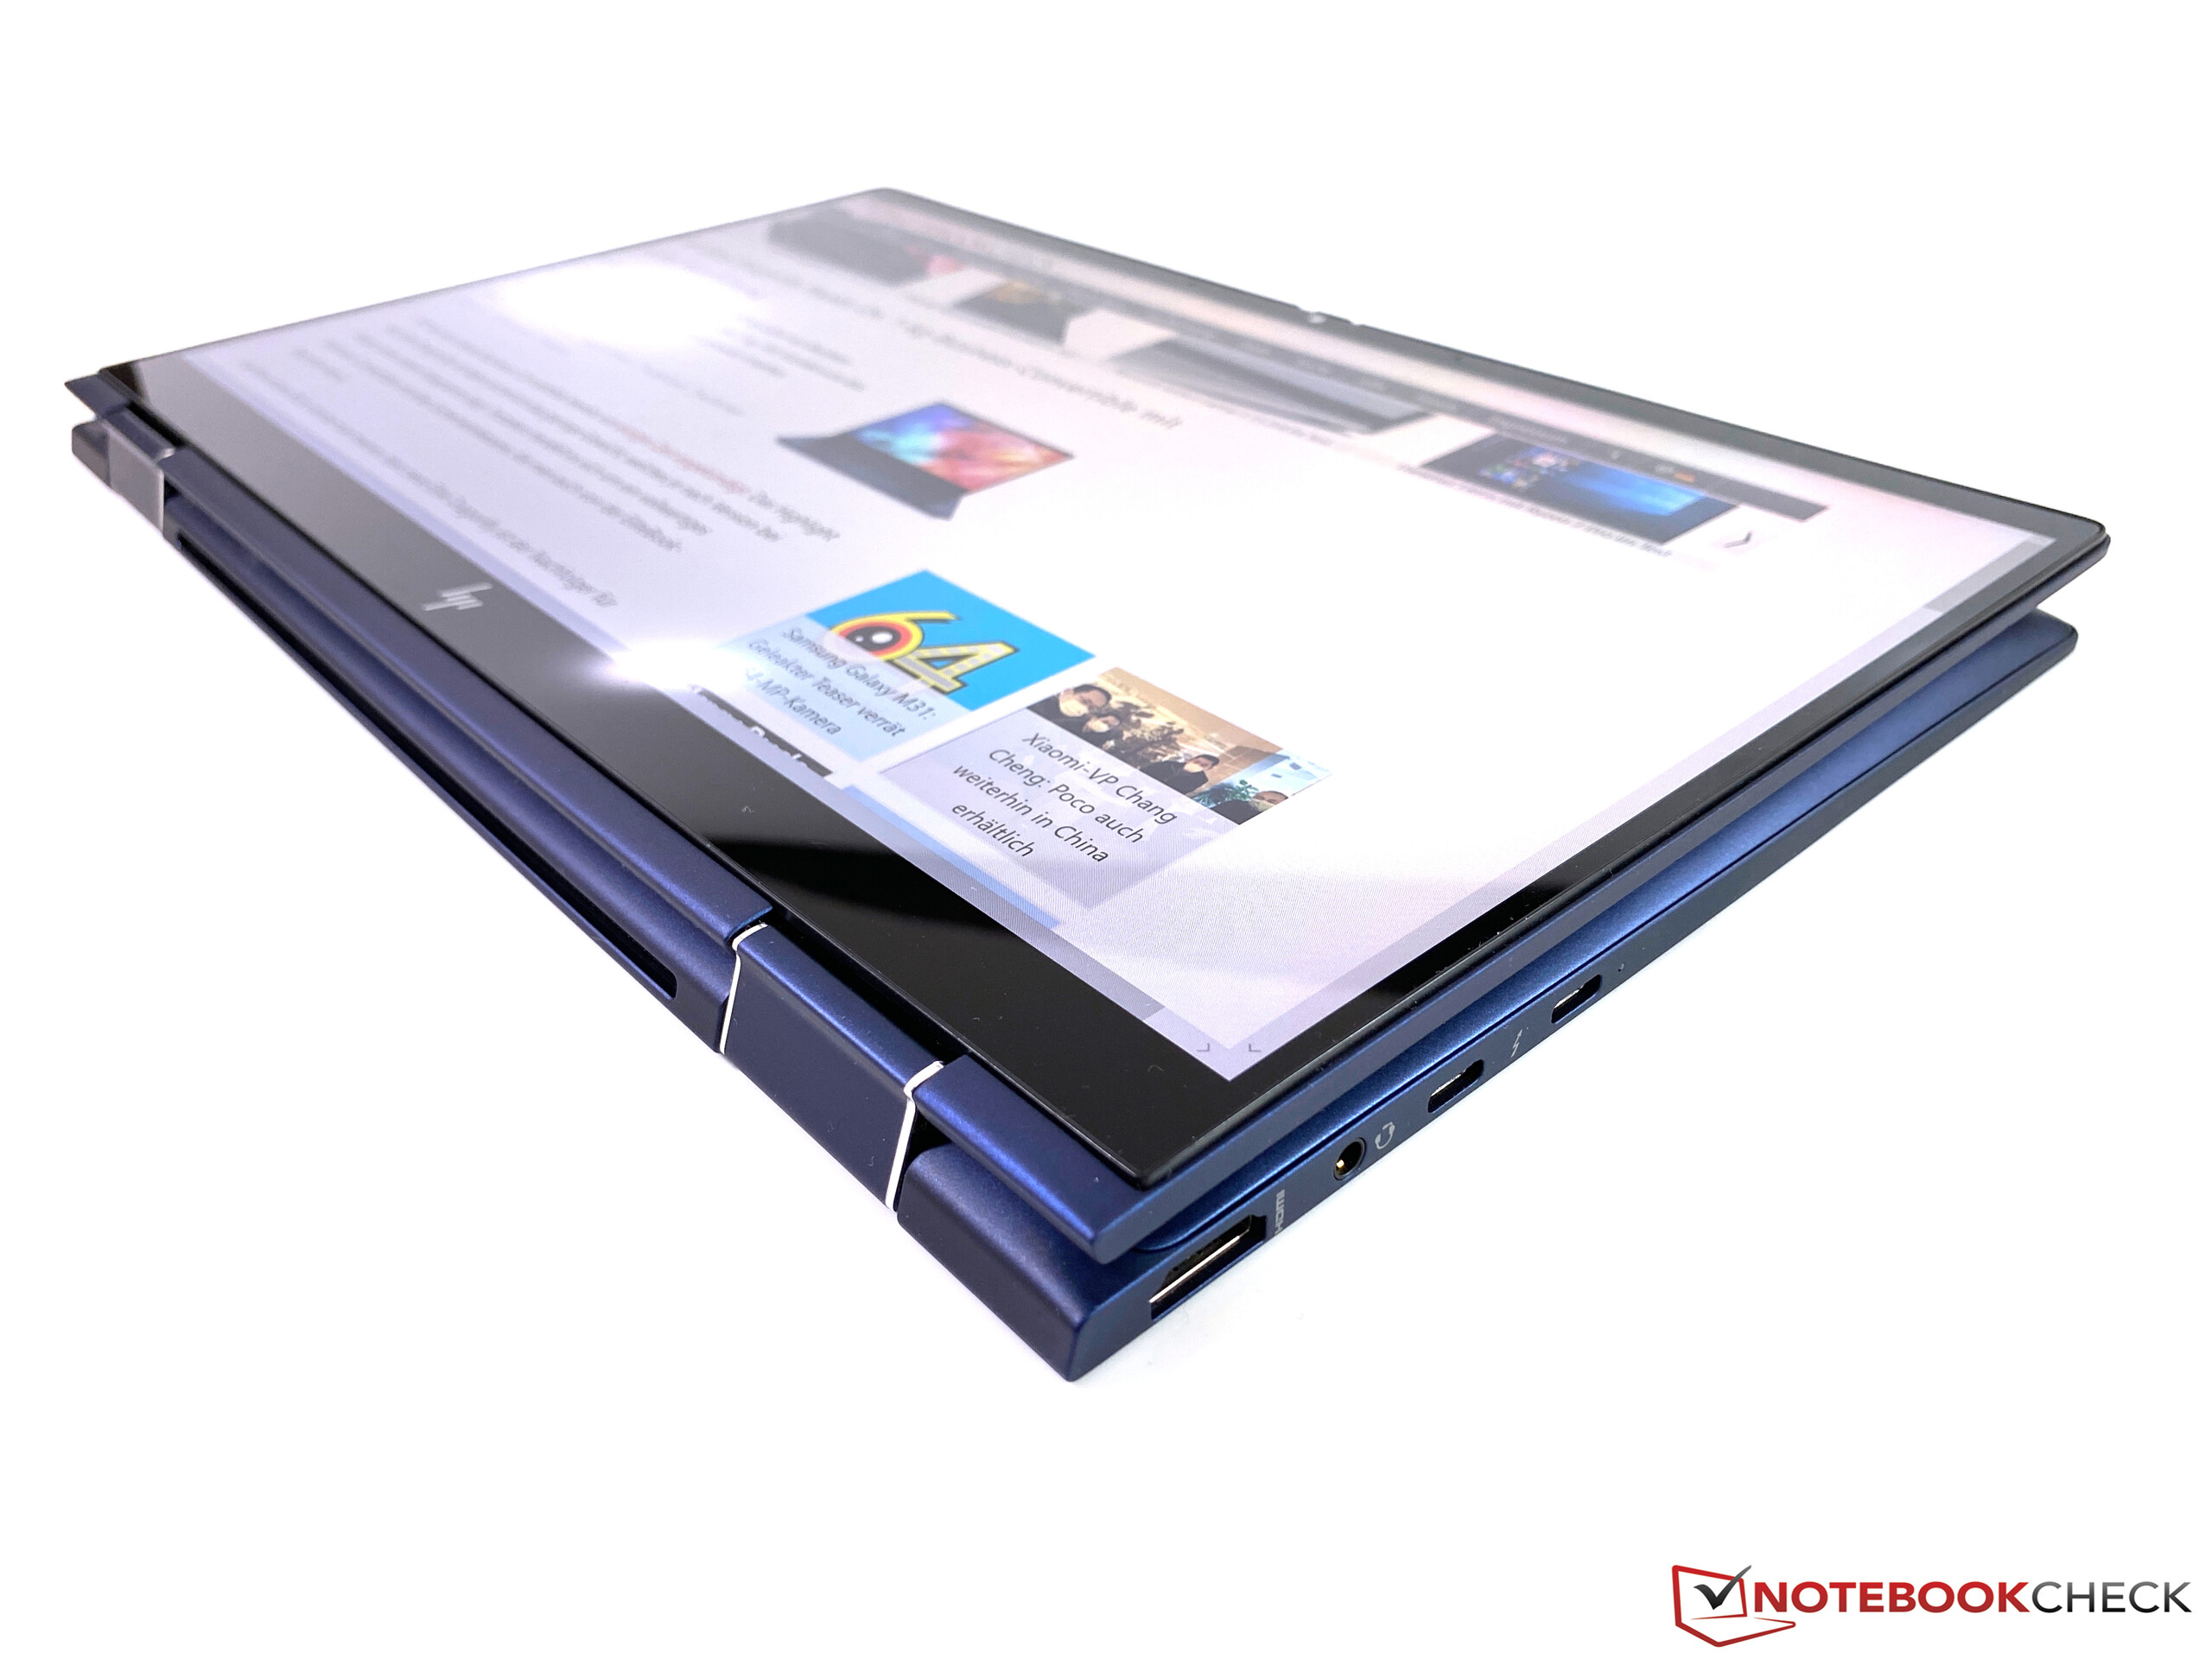
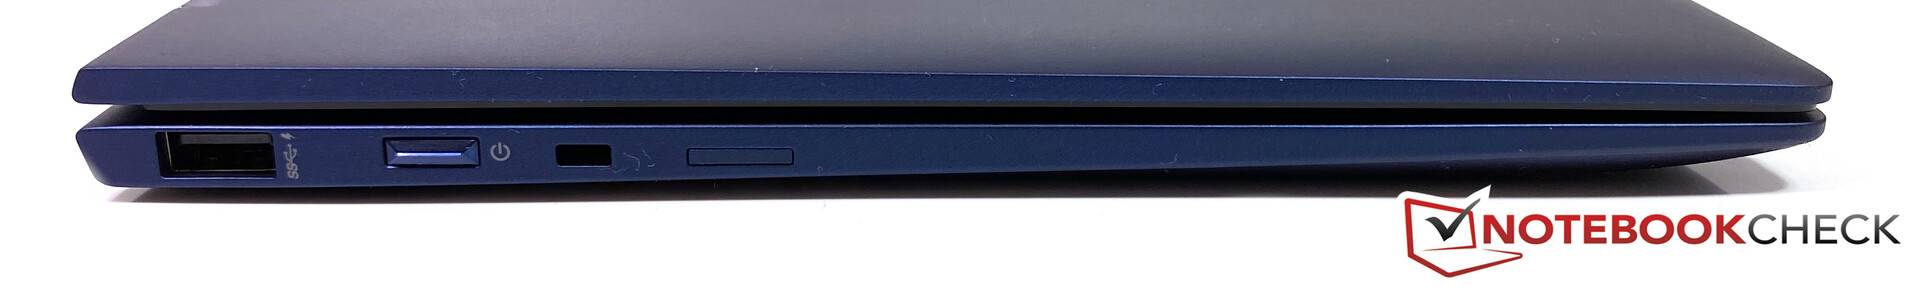
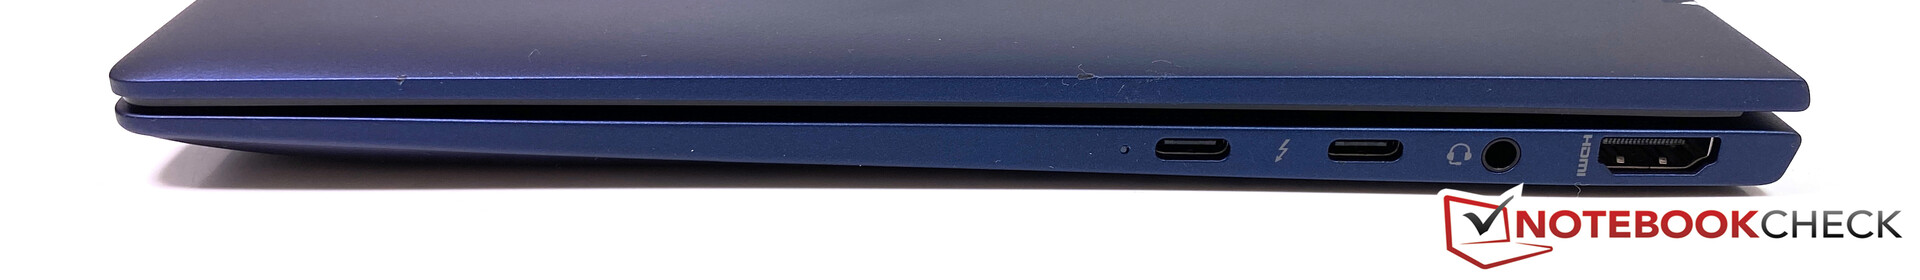
Também não há muitas críticas para as portas, porque você também recebe uma porta USB tipo A normal e uma saída HDMI em tamanho real, além dos conectores USB-C finos. Ainda achamos que existem maneiras de otimizar a situação das portas: O layout (USB-C mais para trás e ideal para os dois lados) e um leitor SD, pelo menos para cartões microSD.
O HP Elite Dragonfly é um conversível empresarial muito bom Definitivamente, existem algumas desvantagens, mas elas não são realmente importantes. Portanto, recomendamos o Elite Dragonfly se você estiver procurando por um conversível empresarial.
Existem outras desvantagens, incluindo a configuração TDP muito conservadora do processador. O desempenho é reduzido após alguns segundos, mas isso ainda é completamente suficiente para tarefas comuns do escritório. Você deve saber que existem dispositivos melhores se precisar de muito desempenho da CPU. O ventilador é muito silencioso em troca, mesmo que pensemos que ele reage à carga muito rapidamente.
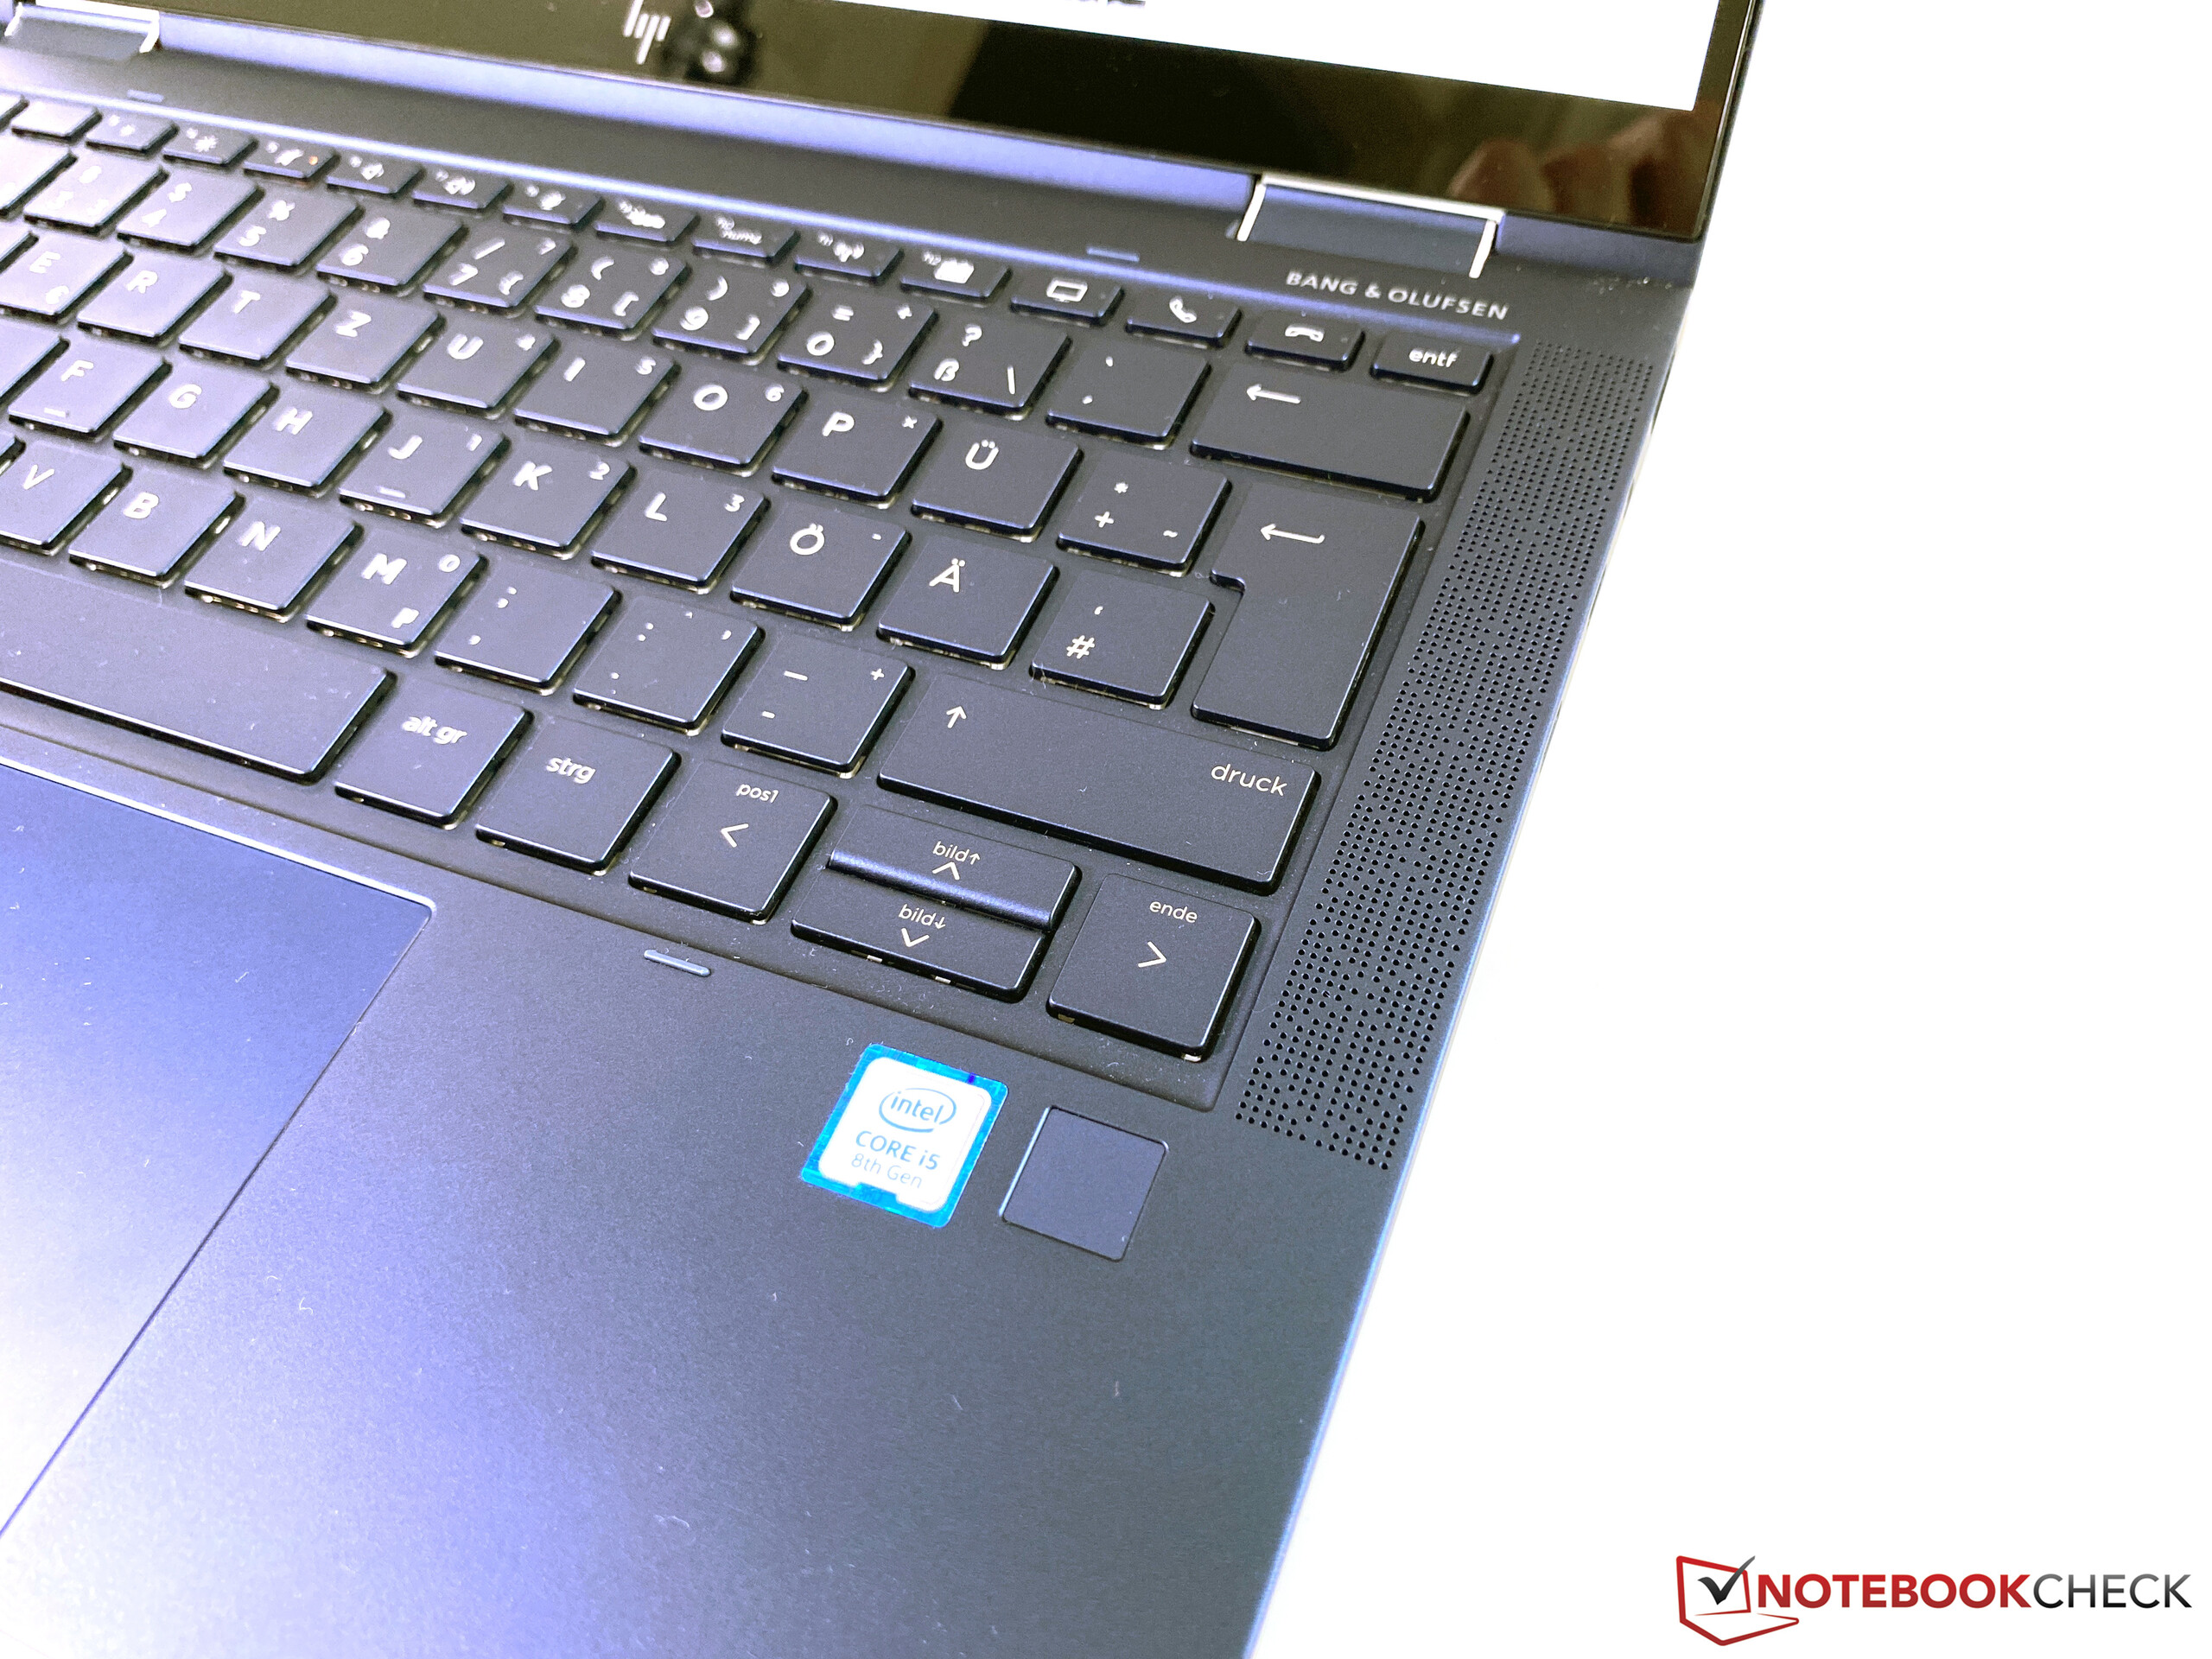
Nossa recomendação é principalmente para nossa configuração de teste com o Core i5, a tela táctil padrão de 1080p e a bateria maior. Você pode reduzir o peso com a bateria menor, mas preferimos tempos de duração de bateria mais longos em um dispositivo móvel. Esse também é um problema da tela 4K opcional, pois consumirá muito mais energia. Também estamos muito felizes com a tela táctil padrão de 1080p, apenas os tempos de resposta lentos (você se acostumará com eles) e as superfícies refletivas são desvantagens.
HP Elite Dragonfly-8MK79EA
- 04/03/2020 v7 (old)
Andreas Osthoff
Price comparison
