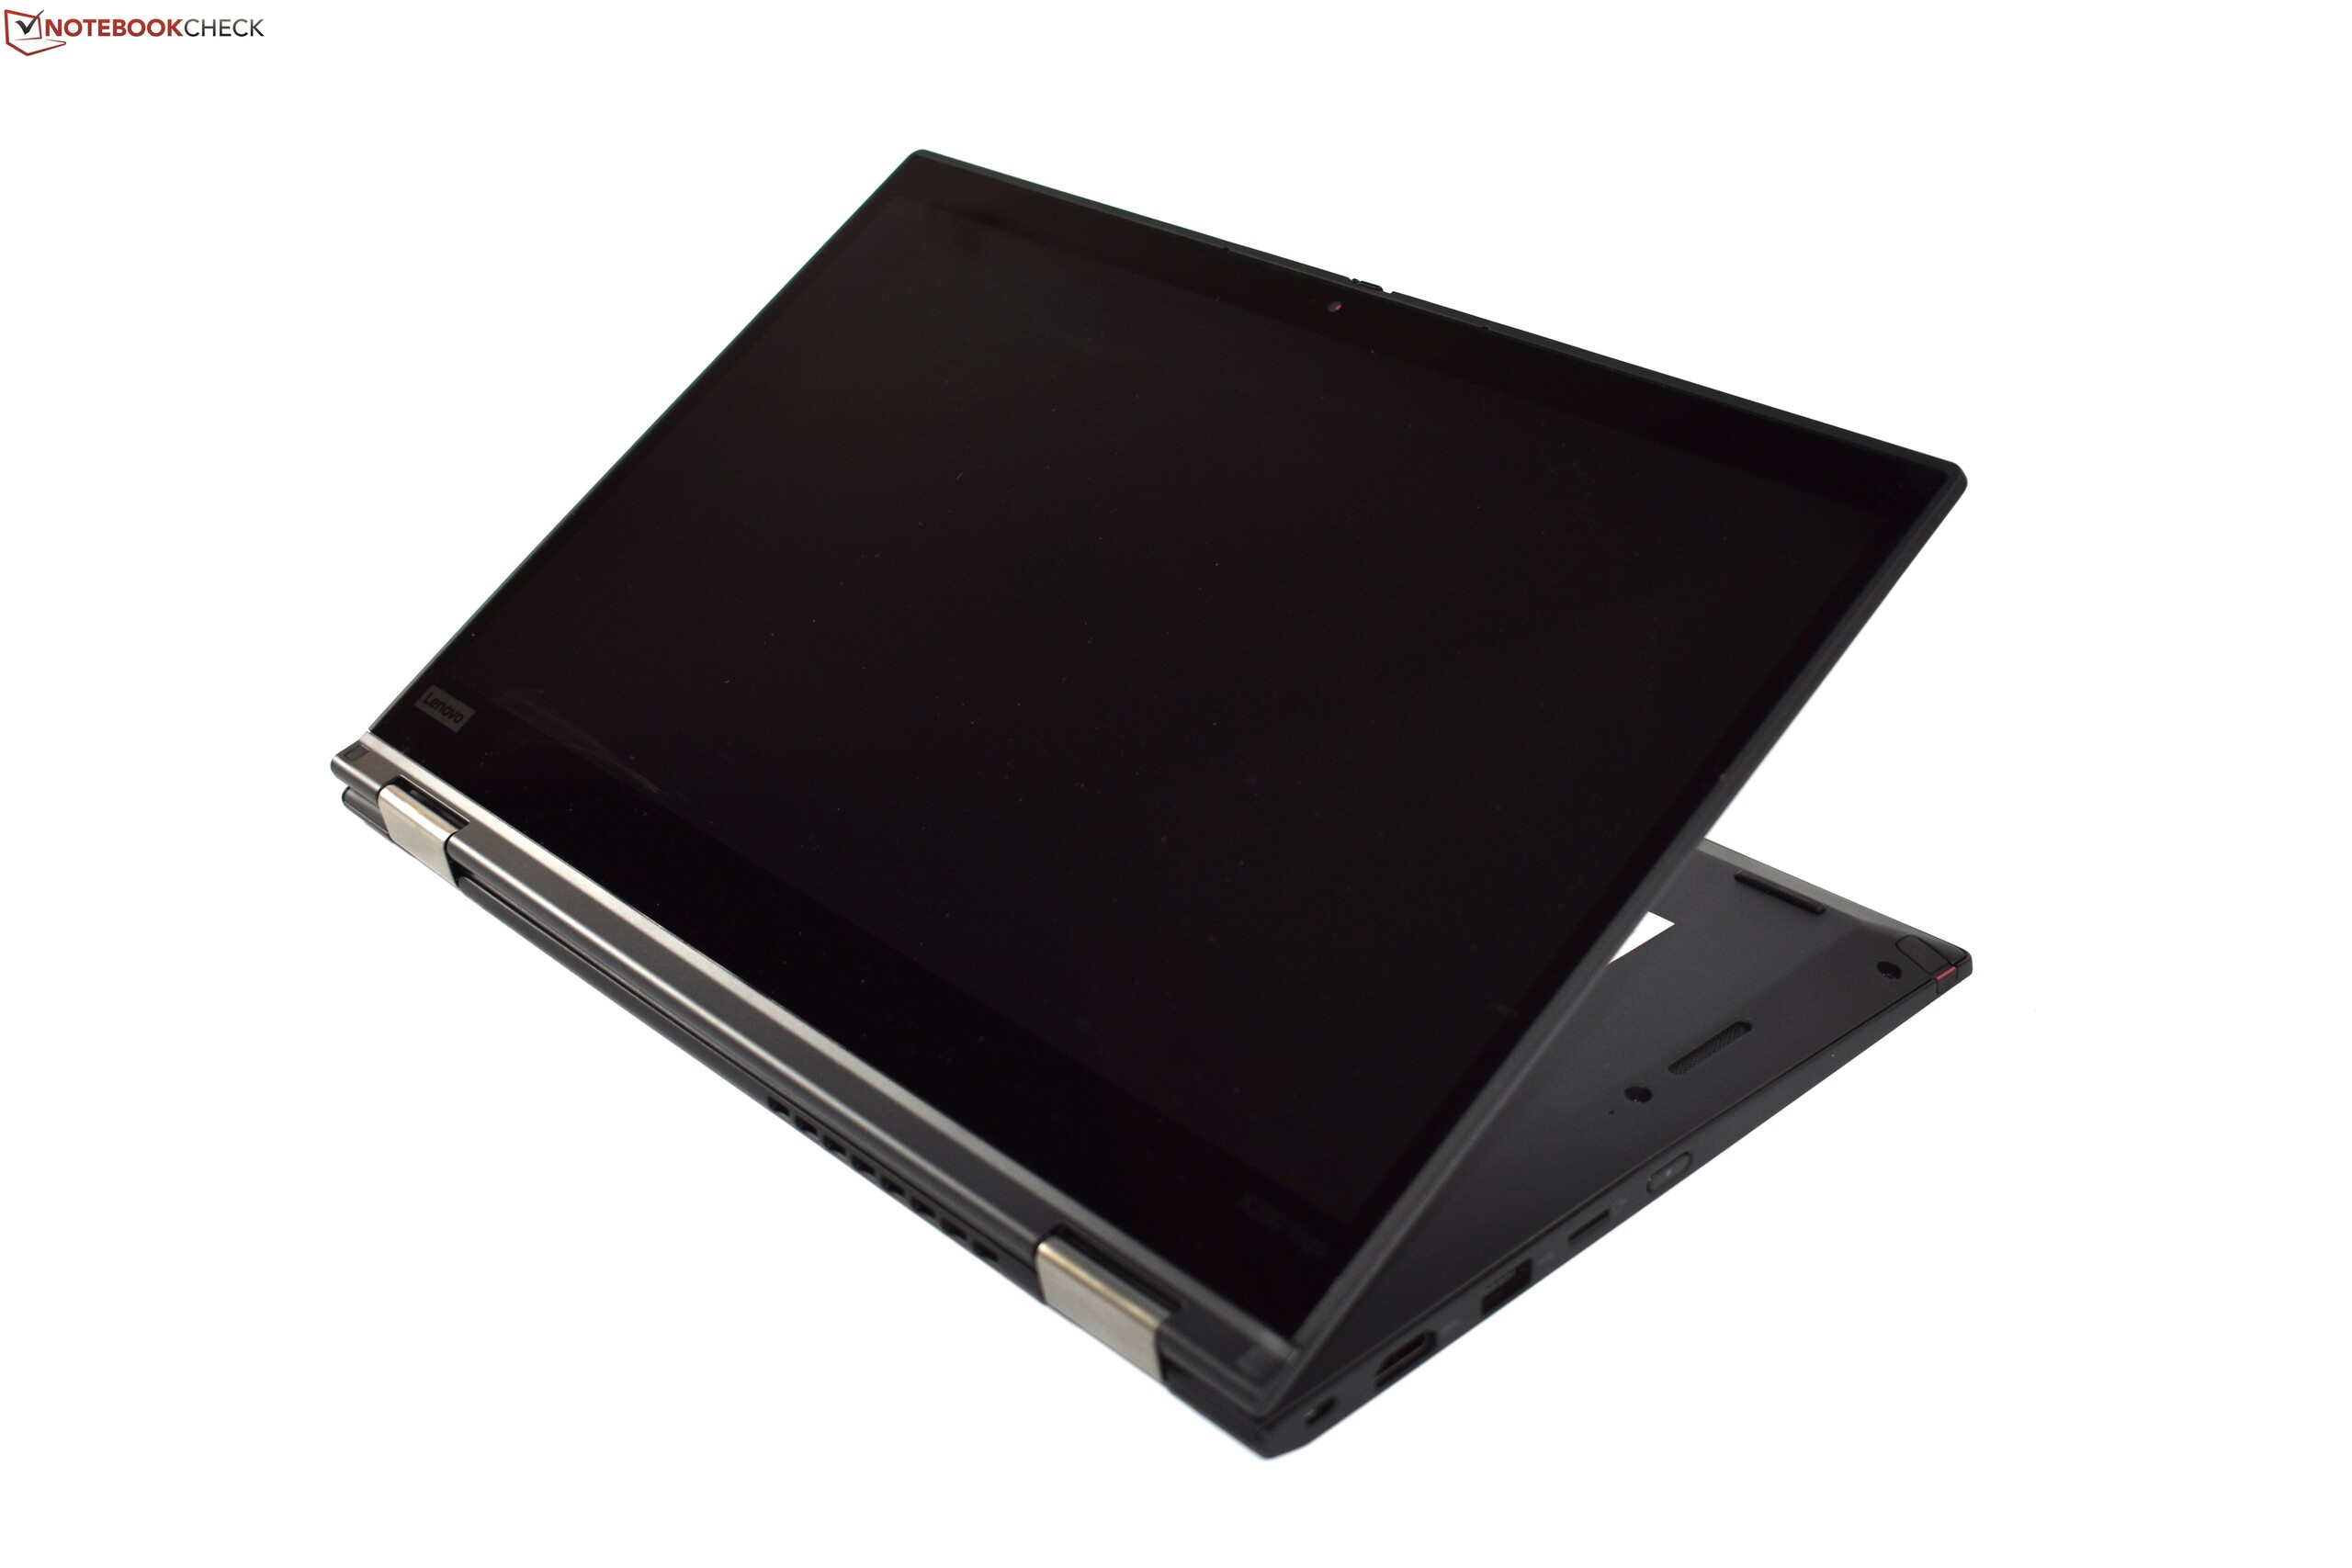
Breve Análise do Conversível Lenovo ThinkPad X390 Yoga (i7, FHD)

| SD Card Reader | |
| average JPG Copy Test (av. of 3 runs) | |
| Lenovo ThinkPad X1 Yoga 2018-20LES01W00 (Toshiba Exceria Pro M501) | |
| Dell Latitude 7390 2-in-1 (Toshiba Exceria Pro M501 UHS-II) | |
| Lenovo ThinkPad X390 Yoga-20NQS05R00 (Toshiba Exceria Pro M501) | |
| Média da turma Convertible (29.4 - 186, n=21, últimos 2 anos) | |
| Lenovo ThinkPad X380 Yoga 20LJS02W00 (Toshiba Exceria Pro SDXC 64 GB UHS-II) | |
| maximum AS SSD Seq Read Test (1GB) | |
| Dell Latitude 7390 2-in-1 (Toshiba Exceria Pro M501 UHS-II) | |
| Lenovo ThinkPad X1 Yoga 2018-20LES01W00 (Toshiba Exceria Pro M501) | |
| Média da turma Convertible (67.5 - 254, n=20, últimos 2 anos) | |
| Lenovo ThinkPad X380 Yoga 20LJS02W00 (Toshiba Exceria Pro SDXC 64 GB UHS-II) | |
| Lenovo ThinkPad X390 Yoga-20NQS05R00 (Toshiba Exceria Pro M501) | |
| |||||||||||||||||||||||||
iluminação: 90 %
iluminação com acumulador: 318 cd/m²
Contraste: 2127:1 (Preto: 0.15 cd/m²)
ΔE ColorChecker Calman: 6.1 | ∀{0.5-29.43 Ø4.71}
calibrated: 1
ΔE Greyscale Calman: 8.6 | ∀{0.09-98 Ø4.96}
96.8% sRGB (Argyll 1.6.3 3D)
61.9% AdobeRGB 1998 (Argyll 1.6.3 3D)
67.3% AdobeRGB 1998 (Argyll 3D)
97% sRGB (Argyll 3D)
65.2% Display P3 (Argyll 3D)
Gamma: 2.62
CCT: 6613 K
| Lenovo ThinkPad X390 Yoga-20NQS05R00 LP133WF7-SPA1, , 1920x1080, 13.3" | Lenovo ThinkPad X380 Yoga 20LJS02W00 Lenovo M133NWF4 R3, , 1920x1080, 13.3" | HP EliteBook x360 1030 G3 Chi Mei CMN1380, , 1920x1080, 13.3" | Dell Latitude 7390 2-in-1 AUO462D, , 1920x1080, 13.3" | Lenovo ThinkPad X390-20Q1S02M00 LP133WF7-SPB1, , 1920x1080, 13.3" | Lenovo ThinkPad X1 Yoga 2018-20LD0015US Lenovo LEN40A9, , 1920x1080, 14" | |
|---|---|---|---|---|---|---|
| Display | 0% | 1% | -7% | -1% | -9% | |
| Display P3 Coverage (%) | 65.2 | 65.9 1% | 66.1 1% | 62.5 -4% | 65.3 0% | 60.9 -7% |
| sRGB Coverage (%) | 97 | 95.8 -1% | 97.8 1% | 86.1 -11% | 95.9 -1% | 86.4 -11% |
| AdobeRGB 1998 Coverage (%) | 67.3 | 67.8 1% | 67.8 1% | 62.9 -7% | 66.6 -1% | 61.9 -8% |
| Response Times | 11% | 26% | 10% | -4% | 19% | |
| Response Time Grey 50% / Grey 80% * (ms) | 59.2 ? | 50 ? 16% | 39.2 ? 34% | 48.8 ? 18% | 57.6 ? 3% | 40.4 ? 32% |
| Response Time Black / White * (ms) | 30.8 ? | 29 ? 6% | 25.6 ? 17% | 30.4 ? 1% | 34 ? -10% | 28.8 ? 6% |
| PWM Frequency (Hz) | 1000 ? | 26040 ? | ||||
| Screen | -2% | 0% | -37% | 12% | -30% | |
| Brightness middle (cd/m²) | 319 | 314 -2% | 470.1 47% | 318.2 0% | 356 12% | 267.2 -16% |
| Brightness (cd/m²) | 306 | 302 -1% | 443 45% | 312 2% | 336 10% | 239 -22% |
| Brightness Distribution (%) | 90 | 84 -7% | 88 -2% | 83 -8% | 88 -2% | 75 -17% |
| Black Level * (cd/m²) | 0.15 | 0.16 -7% | 0.38 -153% | 0.3 -100% | 0.16 -7% | 0.27 -80% |
| Contrast (:1) | 2127 | 1963 -8% | 1237 -42% | 1061 -50% | 2225 5% | 990 -53% |
| Colorchecker dE 2000 * | 6.1 | 5.73 6% | 2.47 60% | 4.25 30% | 3.6 41% | 3.5 43% |
| Colorchecker dE 2000 max. * | 9.7 | 10.43 -8% | 5.73 41% | 9.49 2% | 5.5 43% | 6.4 34% |
| Colorchecker dE 2000 calibrated * | 1 | 1.52 -52% | 4.38 -338% | 1.1 -10% | 3.81 -281% | |
| Greyscale dE 2000 * | 8.6 | 7.39 14% | 3.7 57% | 2.1 76% | 4.7 45% | 1.3 85% |
| Gamma | 2.62 84% | 2.14 103% | 2.35 94% | 2.311 95% | 2.48 89% | 2.146 103% |
| CCT | 6613 98% | 6351 102% | 7373 88% | 6588 99% | 6374 102% | 6523 100% |
| Color Space (Percent of AdobeRGB 1998) (%) | 61.9 | 61 -1% | 62 0% | 56 -10% | 61.3 -1% | 56 -10% |
| Color Space (Percent of sRGB) (%) | 96.8 | 96 -1% | 98.2 1% | 85 -12% | 95.7 -1% | 86 -11% |
| Média Total (Programa/Configurações) | 3% /
1% | 9% /
4% | -11% /
-26% | 2% /
8% | -7% /
-20% |
* ... menor é melhor
Exibir tempos de resposta
| ↔ Tempo de resposta preto para branco | ||
|---|---|---|
| 30.8 ms ... ascensão ↗ e queda ↘ combinadas | ↗ 16.8 ms ascensão | 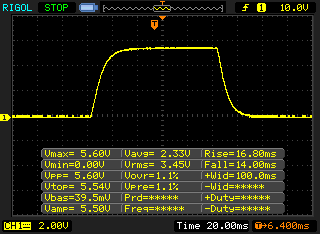 |
| ↘ 14 ms queda | ||
| A tela mostra taxas de resposta lentas em nossos testes e será insatisfatória para os jogadores. Em comparação, todos os dispositivos testados variam de 0.1 (mínimo) a 240 (máximo) ms. » 83 % de todos os dispositivos são melhores. Isso significa que o tempo de resposta medido é pior que a média de todos os dispositivos testados (19.8 ms). | ||
| ↔ Tempo de resposta 50% cinza a 80% cinza | ||
| 59.2 ms ... ascensão ↗ e queda ↘ combinadas | ↗ 30 ms ascensão | 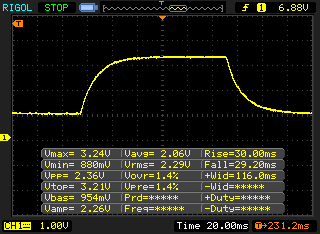 |
| ↘ 29.2 ms queda | ||
| A tela mostra taxas de resposta lentas em nossos testes e será insatisfatória para os jogadores. Em comparação, todos os dispositivos testados variam de 0.165 (mínimo) a 636 (máximo) ms. » 95 % de todos os dispositivos são melhores. Isso significa que o tempo de resposta medido é pior que a média de todos os dispositivos testados (30.9 ms). | ||
Cintilação da tela / PWM (modulação por largura de pulso)
| Tela tremeluzindo / PWM não detectado |  | ||
[pwm_comparison] Em comparação: 52 % de todos os dispositivos testados não usam PWM para escurecer a tela. Se PWM foi detectado, uma média de 7748 (mínimo: 5 - máximo: 343500) Hz foi medida. | |||
| PCMark 8 Home Score Accelerated v2 | 3668 pontos | |
| PCMark 8 Work Score Accelerated v2 | 5071 pontos | |
| PCMark 10 Score | 4134 pontos | |
Ajuda | ||
| Lenovo ThinkPad X390 Yoga-20NQS05R00 Intel SSD Pro 7600p SSDPEKKF512G8L | Lenovo ThinkPad X380 Yoga 20LJS02W00 Samsung SSD PM981 MZVLB512HAJQ | HP EliteBook x360 1030 G3 Samsung PM871b MZNLN128HAHQ | Dell Latitude 7390 2-in-1 SK hynix PC401 NVMe 500 GB | Lenovo ThinkPad X1 Yoga 2018-20LES01W00 Samsung SSD PM981 MZVLB512HAJQ | Lenovo ThinkPad X390-20Q1S02M00 Intel SSD Pro 7600p SSDPEKKF512G8L | Lenovo ThinkPad X1 Yoga 2018-20LD0015US Samsung SSD PM981 MZVLB512HAJQ | Média Intel SSD Pro 7600p SSDPEKKF512G8L | |
|---|---|---|---|---|---|---|---|---|
| CrystalDiskMark 5.2 / 6 | 3% | -65% | -8% | 6% | -11% | -20% | -8% | |
| Write 4K (MB/s) | 144.1 | 135.9 -6% | 64.3 -55% | 131.7 -9% | 138.8 -4% | 120.7 -16% | 122.1 -15% | 133.9 ? -7% |
| Read 4K (MB/s) | 63.5 | 34.13 -46% | 46.01 -28% | 45.21 -29% | 58.5 -8% | 44.38 -30% | 59.1 ? -7% | |
| Write Seq (MB/s) | 1496 | 1683 13% | 466.4 -69% | 1256 -16% | 1896 27% | 1491 0% | 1253 -16% | 1378 ? -8% |
| Read Seq (MB/s) | 2677 | 2195 -18% | 498.3 -81% | 1852 -31% | 2070 -23% | 2760 3% | 1232 -54% | 2341 ? -13% |
| Write 4K Q32T1 (MB/s) | 357.4 | 437.3 22% | 193.3 -46% | 600 68% | 483.3 35% | 237.5 -34% | 198.2 -45% | 355 ? -1% |
| Read 4K Q32T1 (MB/s) | 482.3 | 338.8 -30% | 179.7 -63% | 387.7 -20% | 451.8 -6% | 336.1 -30% | 288.8 -40% | 429 ? -11% |
| Write Seq Q32T1 (MB/s) | 1558 | 1994 28% | 396.8 -75% | 1374 -12% | 2066 33% | 1512 -3% | 2007 29% | 1514 ? -3% |
| Read Seq Q32T1 (MB/s) | 3021 | 3407 13% | 547 -82% | 2585 -14% | 3423 13% | 3154 4% | 3409 13% | 2677 ? -11% |

| 3DMark 11 Performance | 2020 pontos | |
| 3DMark Cloud Gate Standard Score | 8504 pontos | |
| 3DMark Fire Strike Score | 1152 pontos | |
Ajuda | ||
| baixo | média | alto | ultra | |
|---|---|---|---|---|
| BioShock Infinite (2013) | 73.8 | 37.47 | 31.25 | 10.51 |
| The Witcher 3 (2015) | 17.7 | |||
| Dota 2 Reborn (2015) | 70 | 47.9 | 20.5 | 18.7 |
| Rise of the Tomb Raider (2016) | 23.3 | 14.2 | ||
| X-Plane 11.11 (2018) | 26.8 | 17.4 | 15.8 |
Barulho
| Ocioso |
| 29.2 / 29.2 / 29.2 dB |
| Carga |
| 35 / 35 dB |
 | ||
30 dB silencioso 40 dB(A) audível 50 dB(A) ruidosamente alto |
||
min: | ||
(±) A temperatura máxima no lado superior é 41.7 °C / 107 F, em comparação com a média de 35.4 °C / 96 F , variando de 19.6 a 60 °C para a classe Convertible.
(-) A parte inferior aquece até um máximo de 50.1 °C / 122 F, em comparação com a média de 36.9 °C / 98 F
(+) Em uso inativo, a temperatura média para o lado superior é 25.3 °C / 78 F, em comparação com a média do dispositivo de 30.3 °C / ### class_avg_f### F.
(+) Os apoios para as mãos e o touchpad são mais frios que a temperatura da pele, com um máximo de 26 °C / 78.8 F e, portanto, são frios ao toque.
(±) A temperatura média da área do apoio para as mãos de dispositivos semelhantes foi 28 °C / 82.4 F (+2 °C / 3.6 F).
Lenovo ThinkPad X390 Yoga-20NQS05R00 análise de áudio
(±) | o volume do alto-falante é médio, mas bom (###valor### dB)
Graves 100 - 315Hz
(-) | quase nenhum baixo - em média 15.8% menor que a mediana
(±) | a linearidade dos graves é média (10.6% delta para a frequência anterior)
Médios 400 - 2.000 Hz
(±) | médios mais altos - em média 6.5% maior que a mediana
(±) | a linearidade dos médios é média (10.3% delta para frequência anterior)
Altos 2 - 16 kHz
(+) | agudos equilibrados - apenas 2.8% longe da mediana
(±) | a linearidade dos máximos é média (11% delta para frequência anterior)
Geral 100 - 16.000 Hz
(±) | a linearidade do som geral é média (24% diferença em relação à mediana)
Comparado com a mesma classe
» 73% de todos os dispositivos testados nesta classe foram melhores, 5% semelhantes, 22% piores
» O melhor teve um delta de 6%, a média foi 20%, o pior foi 57%
Comparado com todos os dispositivos testados
» 72% de todos os dispositivos testados foram melhores, 6% semelhantes, 22% piores
» O melhor teve um delta de 4%, a média foi 23%, o pior foi 134%
HP EliteBook x360 1030 G3 análise de áudio
(±) | o volume do alto-falante é médio, mas bom (###valor### dB)
Graves 100 - 315Hz
(±) | graves reduzidos - em média 9.6% menor que a mediana
(-) | graves não são lineares (15% delta para frequência anterior)
Médios 400 - 2.000 Hz
(+) | médios equilibrados - apenas 1.8% longe da mediana
(+) | médios são lineares (4.8% delta para frequência anterior)
Altos 2 - 16 kHz
(±) | máximos mais altos - em média 6% maior que a mediana
(±) | a linearidade dos máximos é média (11.7% delta para frequência anterior)
Geral 100 - 16.000 Hz
(+) | o som geral é linear (12.6% diferença em relação à mediana)
Comparado com a mesma classe
» 15% de todos os dispositivos testados nesta classe foram melhores, 3% semelhantes, 83% piores
» O melhor teve um delta de 6%, a média foi 20%, o pior foi 57%
Comparado com todos os dispositivos testados
» 11% de todos os dispositivos testados foram melhores, 3% semelhantes, 86% piores
» O melhor teve um delta de 4%, a média foi 23%, o pior foi 134%
| desligado | |
| Ocioso | |
| Carga |
|
Key:
min: | |
| Lenovo ThinkPad X390 Yoga-20NQS05R00 i7-8565U, UHD Graphics 620, Intel SSD Pro 7600p SSDPEKKF512G8L, IPS LED, 1920x1080, 13.3" | Lenovo ThinkPad X380 Yoga 20LJS02W00 i5-8550U, UHD Graphics 620, Samsung SSD PM981 MZVLB512HAJQ, IPS, 1920x1080, 13.3" | HP EliteBook x360 1030 G3 i5-8250U, UHD Graphics 620, Samsung PM871b MZNLN128HAHQ, IPS, 1920x1080, 13.3" | Dell Latitude 7390 2-in-1 i7-8650U, UHD Graphics 620, SK hynix PC401 NVMe 500 GB, IPS, 1920x1080, 13.3" | Lenovo ThinkPad X390-20Q1S02M00 i5-8265U, UHD Graphics 620, Intel SSD Pro 7600p SSDPEKKF512G8L, IPS LED, 1920x1080, 13.3" | Lenovo ThinkPad X1 Yoga 2018-20LD0015US i5-8250U, UHD Graphics 620, Samsung SSD PM981 MZVLB512HAJQ, IPS, 1920x1080, 14" | Média Intel UHD Graphics 620 | Média da turma Convertible | |
|---|---|---|---|---|---|---|---|---|
| Power Consumption | 19% | 9% | 28% | 3% | 13% | 5% | -8% | |
| Idle Minimum * (Watt) | 3.46 | 4 -16% | 3.8 -10% | 2.6 25% | 3.4 2% | 3 13% | 3.81 ? -10% | 4.28 ? -24% |
| Idle Average * (Watt) | 5.88 | 4.9 17% | 7.5 -28% | 5.7 3% | 5.6 5% | 5.4 8% | 6.94 ? -18% | 6.96 ? -18% |
| Idle Maximum * (Watt) | 9.12 | 6.9 24% | 8.6 6% | 6 34% | 8.7 5% | 7.5 18% | 8.75 ? 4% | 8.67 ? 5% |
| Load Average * (Watt) | 45.6 | 36 21% | 33.1 27% | 29.2 36% | 43.6 4% | 40.1 12% | 35 ? 23% | 45.1 ? 1% |
| Load Maximum * (Watt) | 65.9 | 34.4 48% | 31.8 52% | 38.8 41% | 65 1% | 57.1 13% | 47.5 ? 28% | 67.7 ? -3% |
* ... menor é melhor
| Lenovo ThinkPad X390 Yoga-20NQS05R00 i7-8565U, UHD Graphics 620, 50 Wh | Lenovo ThinkPad X380 Yoga 20LJS02W00 i5-8550U, UHD Graphics 620, 51 Wh | HP EliteBook x360 1030 G3 i5-8250U, UHD Graphics 620, 56.2 Wh | Dell Latitude 7390 2-in-1 i7-8650U, UHD Graphics 620, 60 Wh | Lenovo ThinkPad X390-20Q1S02M00 i5-8265U, UHD Graphics 620, 48 Wh | Lenovo ThinkPad X1 Yoga 2018-20LD0015US i5-8250U, UHD Graphics 620, 54 Wh | Média da turma Convertible | |
|---|---|---|---|---|---|---|---|
| Duração da bateria | 16% | 68% | 33% | 12% | 43% | 37% | |
| H.264 (h) | 10 | 9.2 -8% | 12.7 27% | 15 ? 50% | |||
| WiFi v1.3 (h) | 8.2 | 8.5 4% | 10 22% | 9.2 12% | 8.3 1% | 10.9 33% | 12 ? 46% |
| Load (h) | 1.5 | 2.3 53% | 3.2 113% | 2.3 53% | 1.6 7% | 2.3 53% | 1.713 ? 14% |
| Reader / Idle (h) | 20.8 | 23 | 20.3 | 26.7 ? |
Pro
Contra
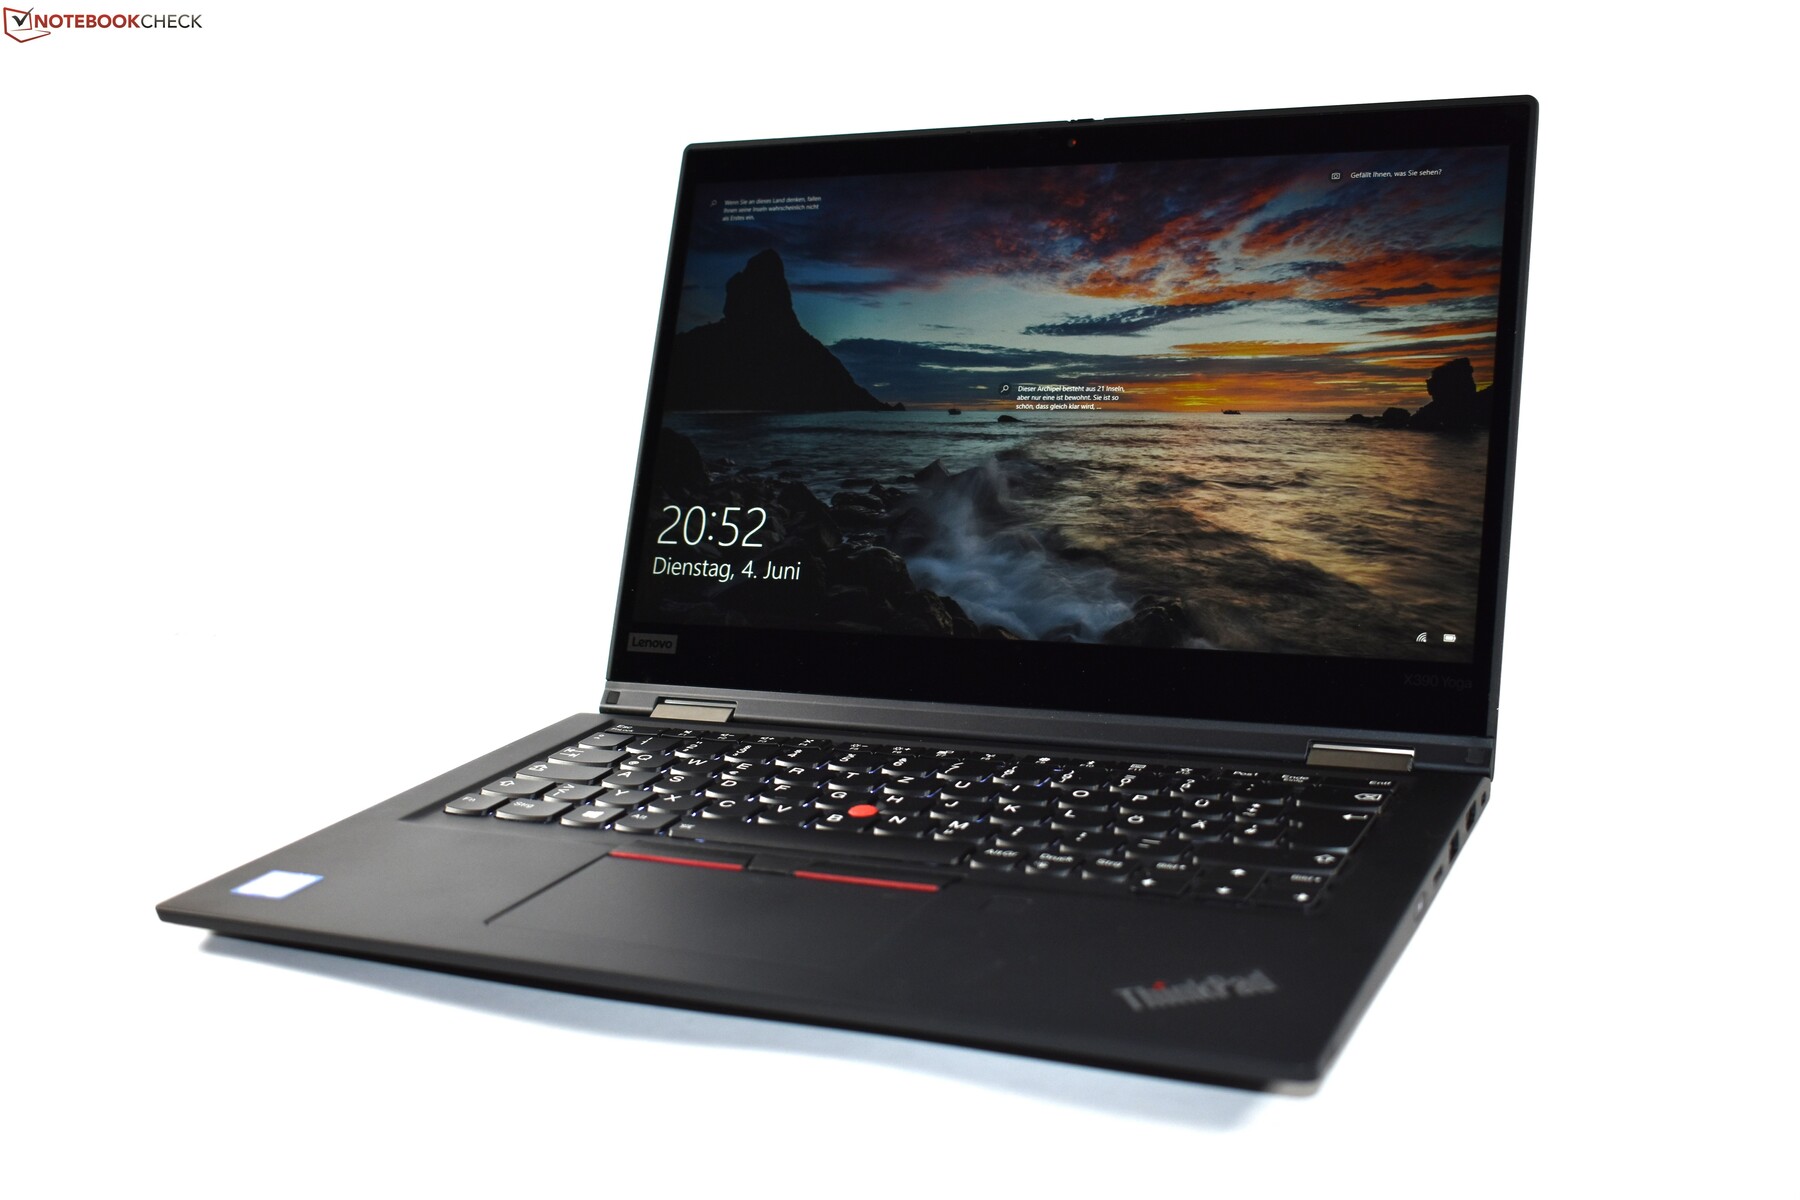
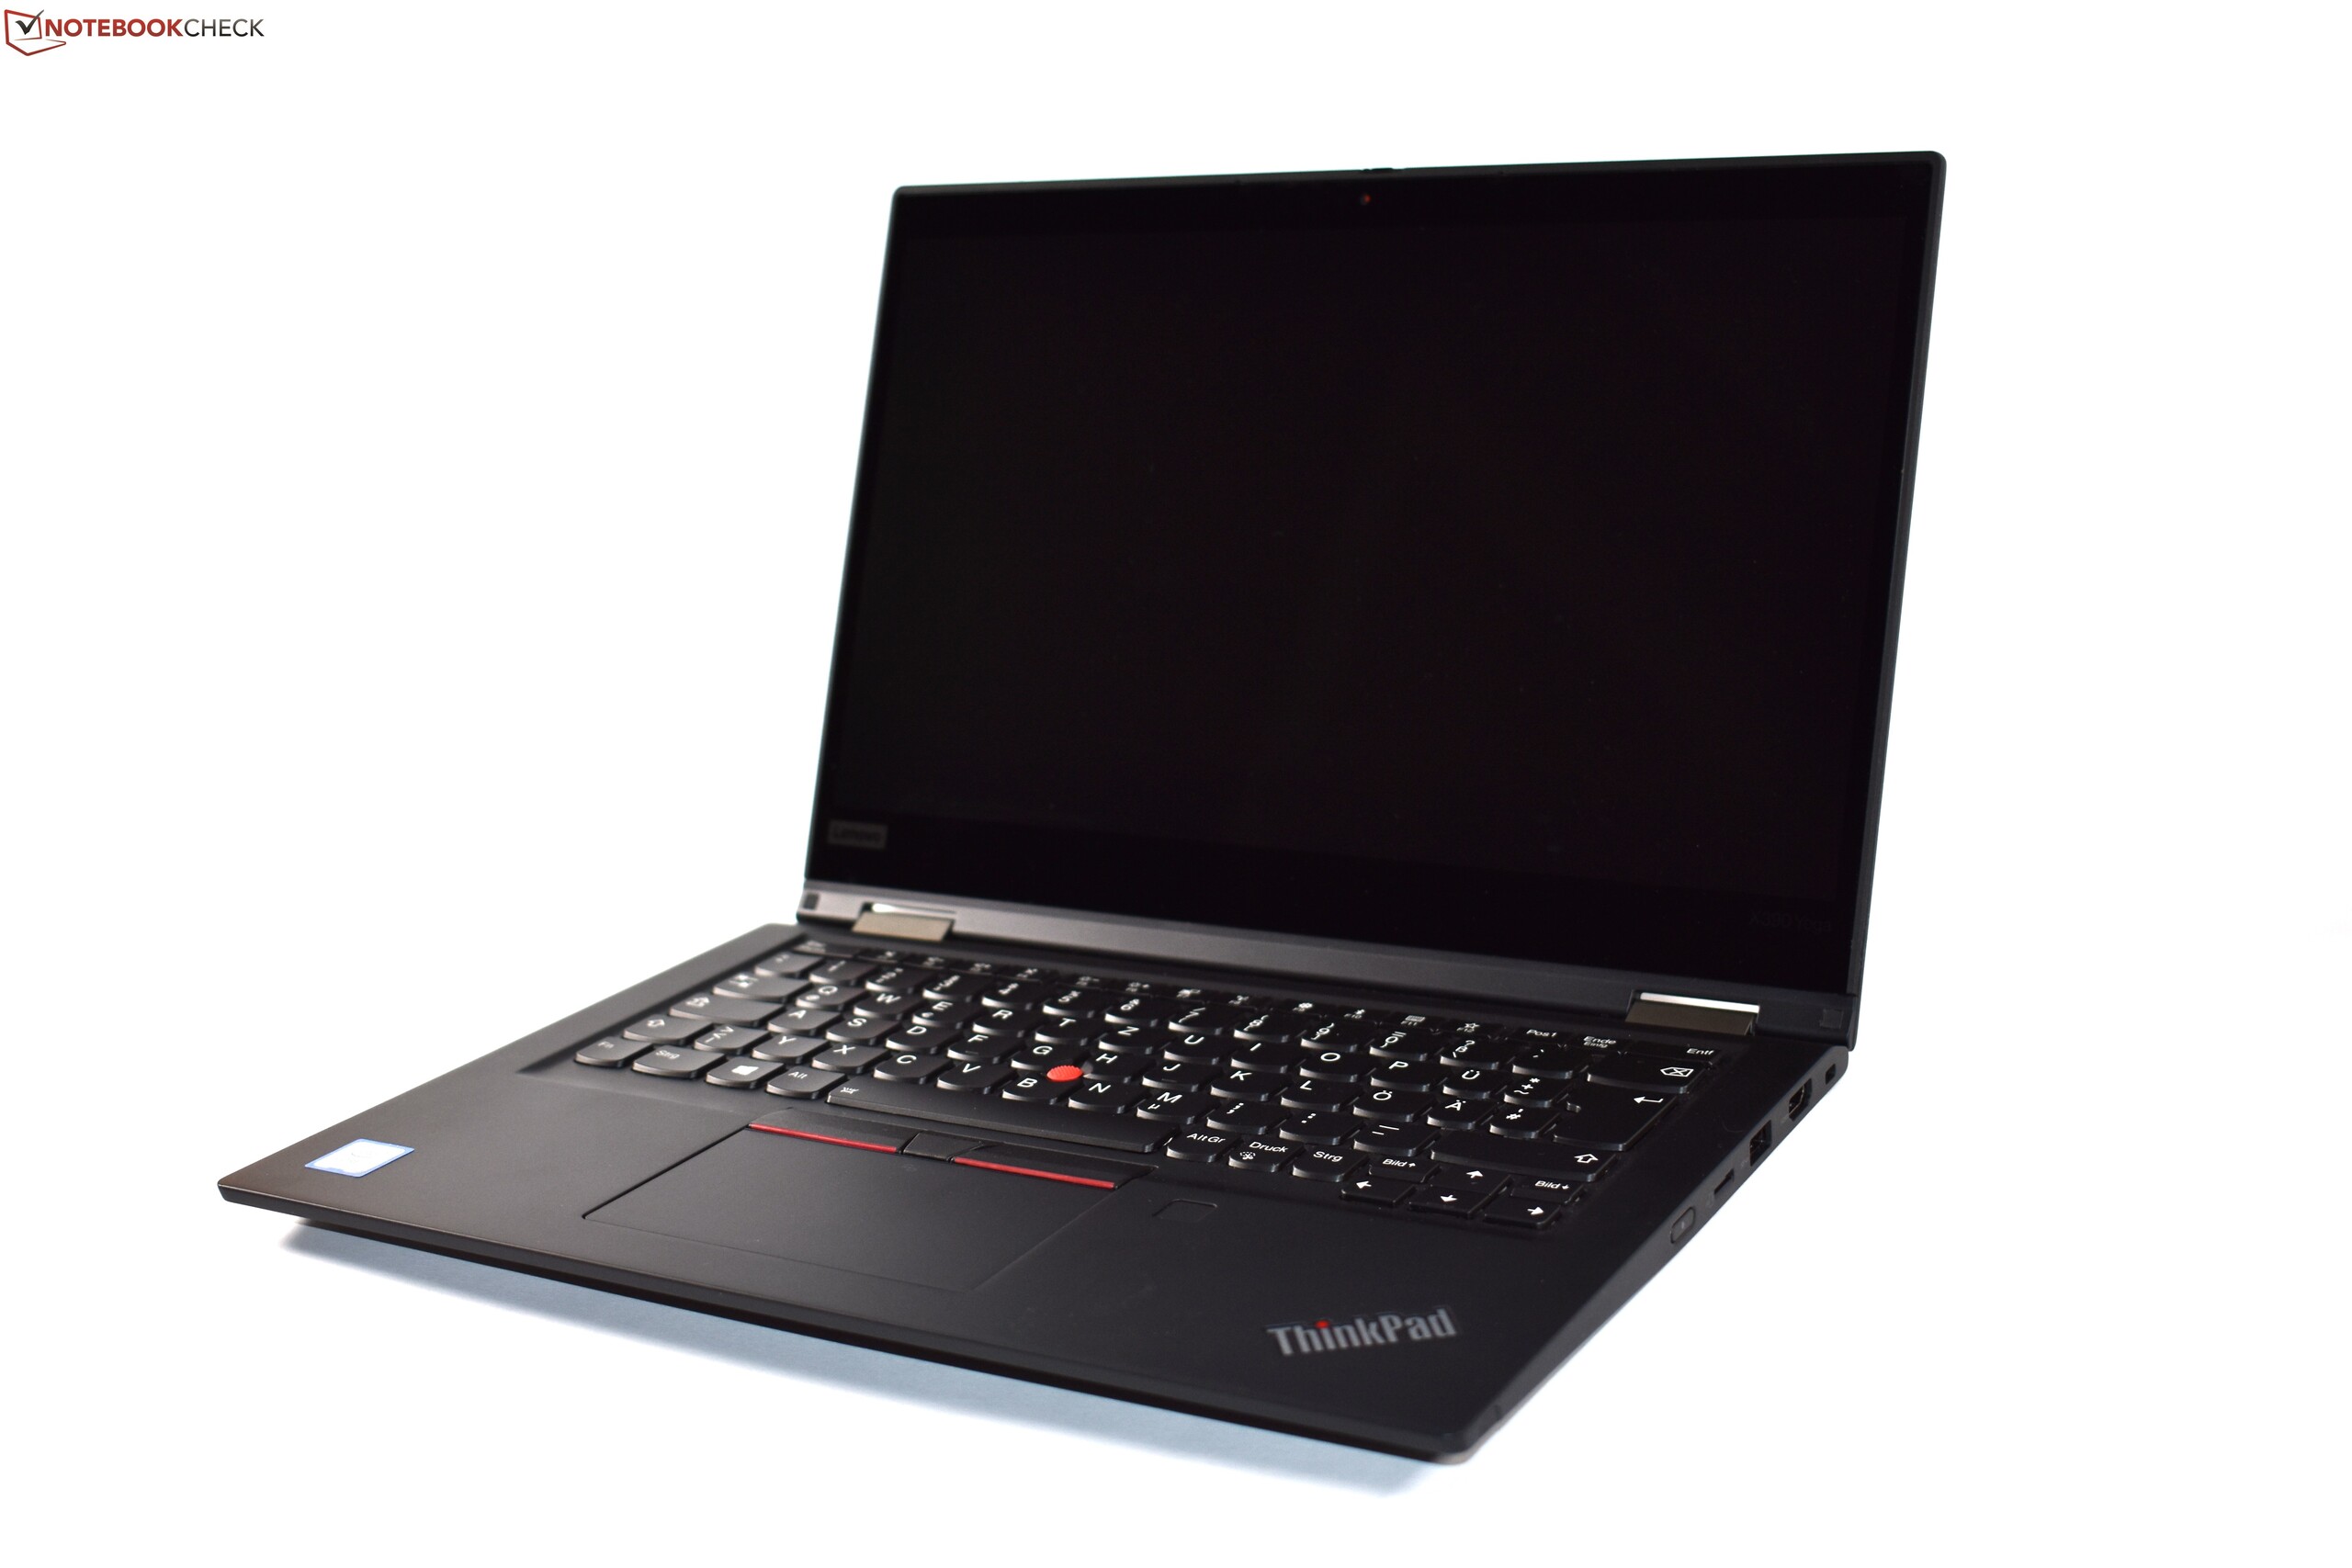
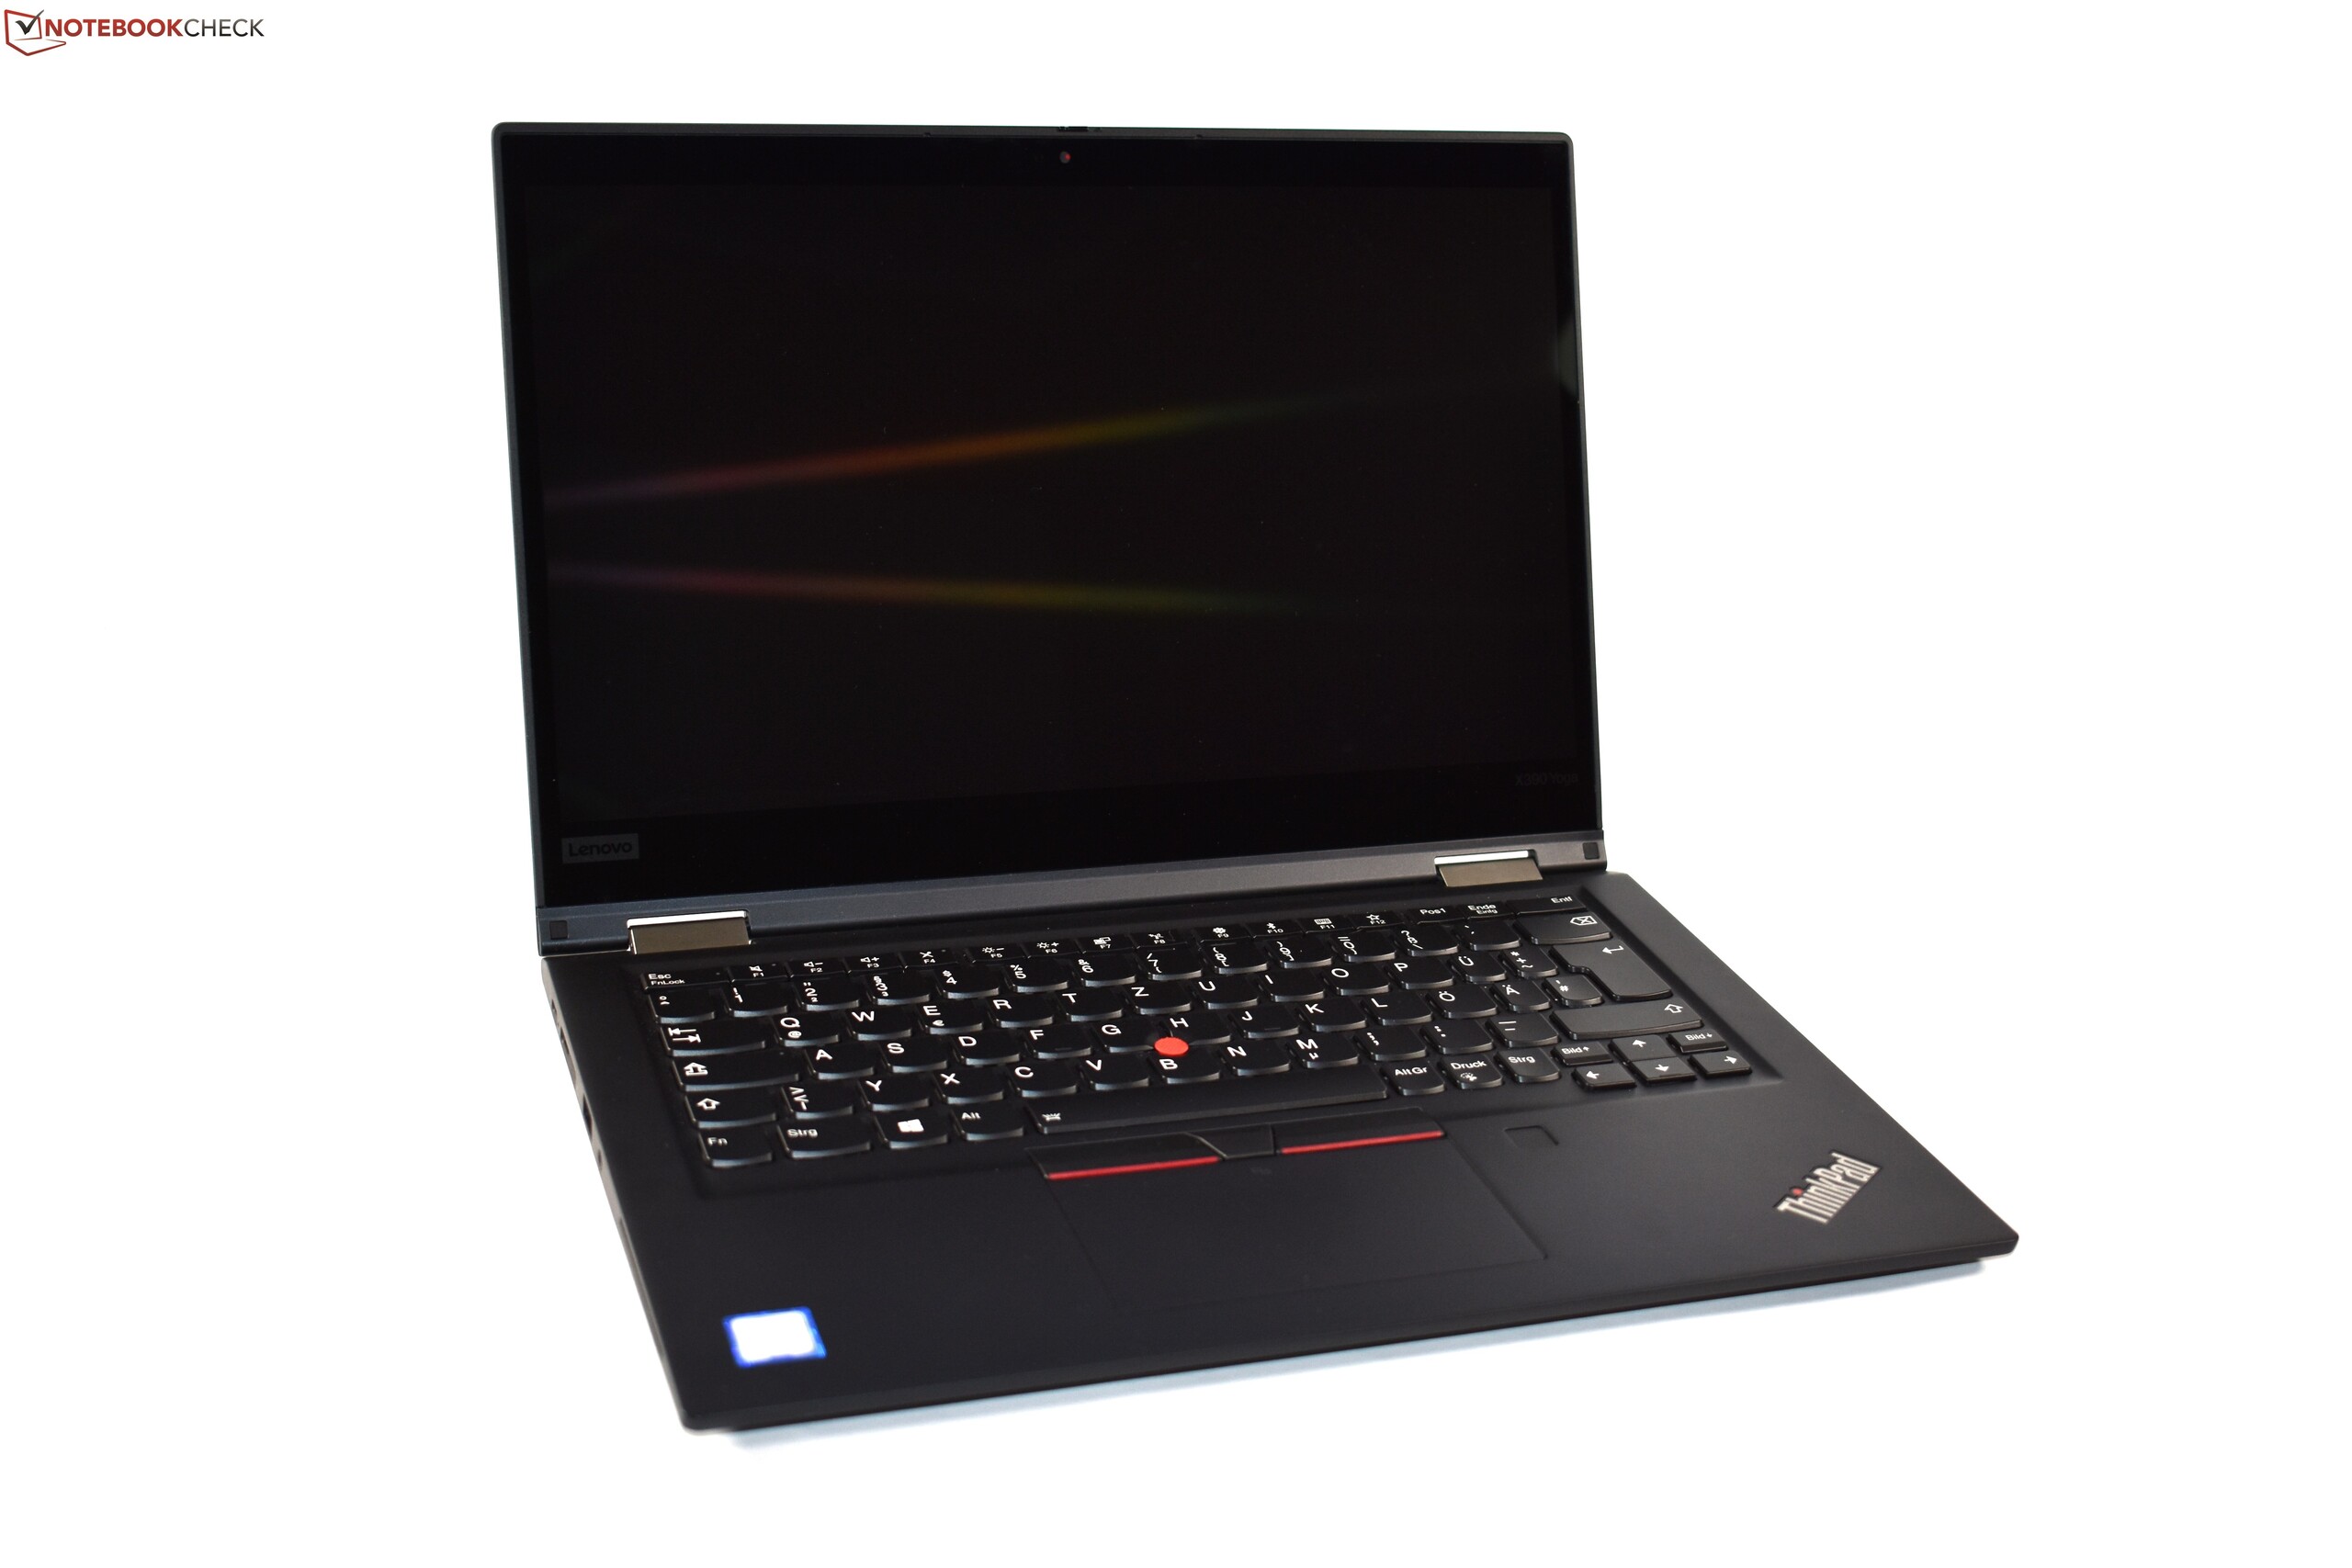
O ThinkPad X390 Yoga continua a valiosa tradição dos portáteis ThinkPad conversíveis. O ultrabook de 13,3 polegadas tem muito a oferecer. No entanto, também devemos mencionar algumas fraquezas.
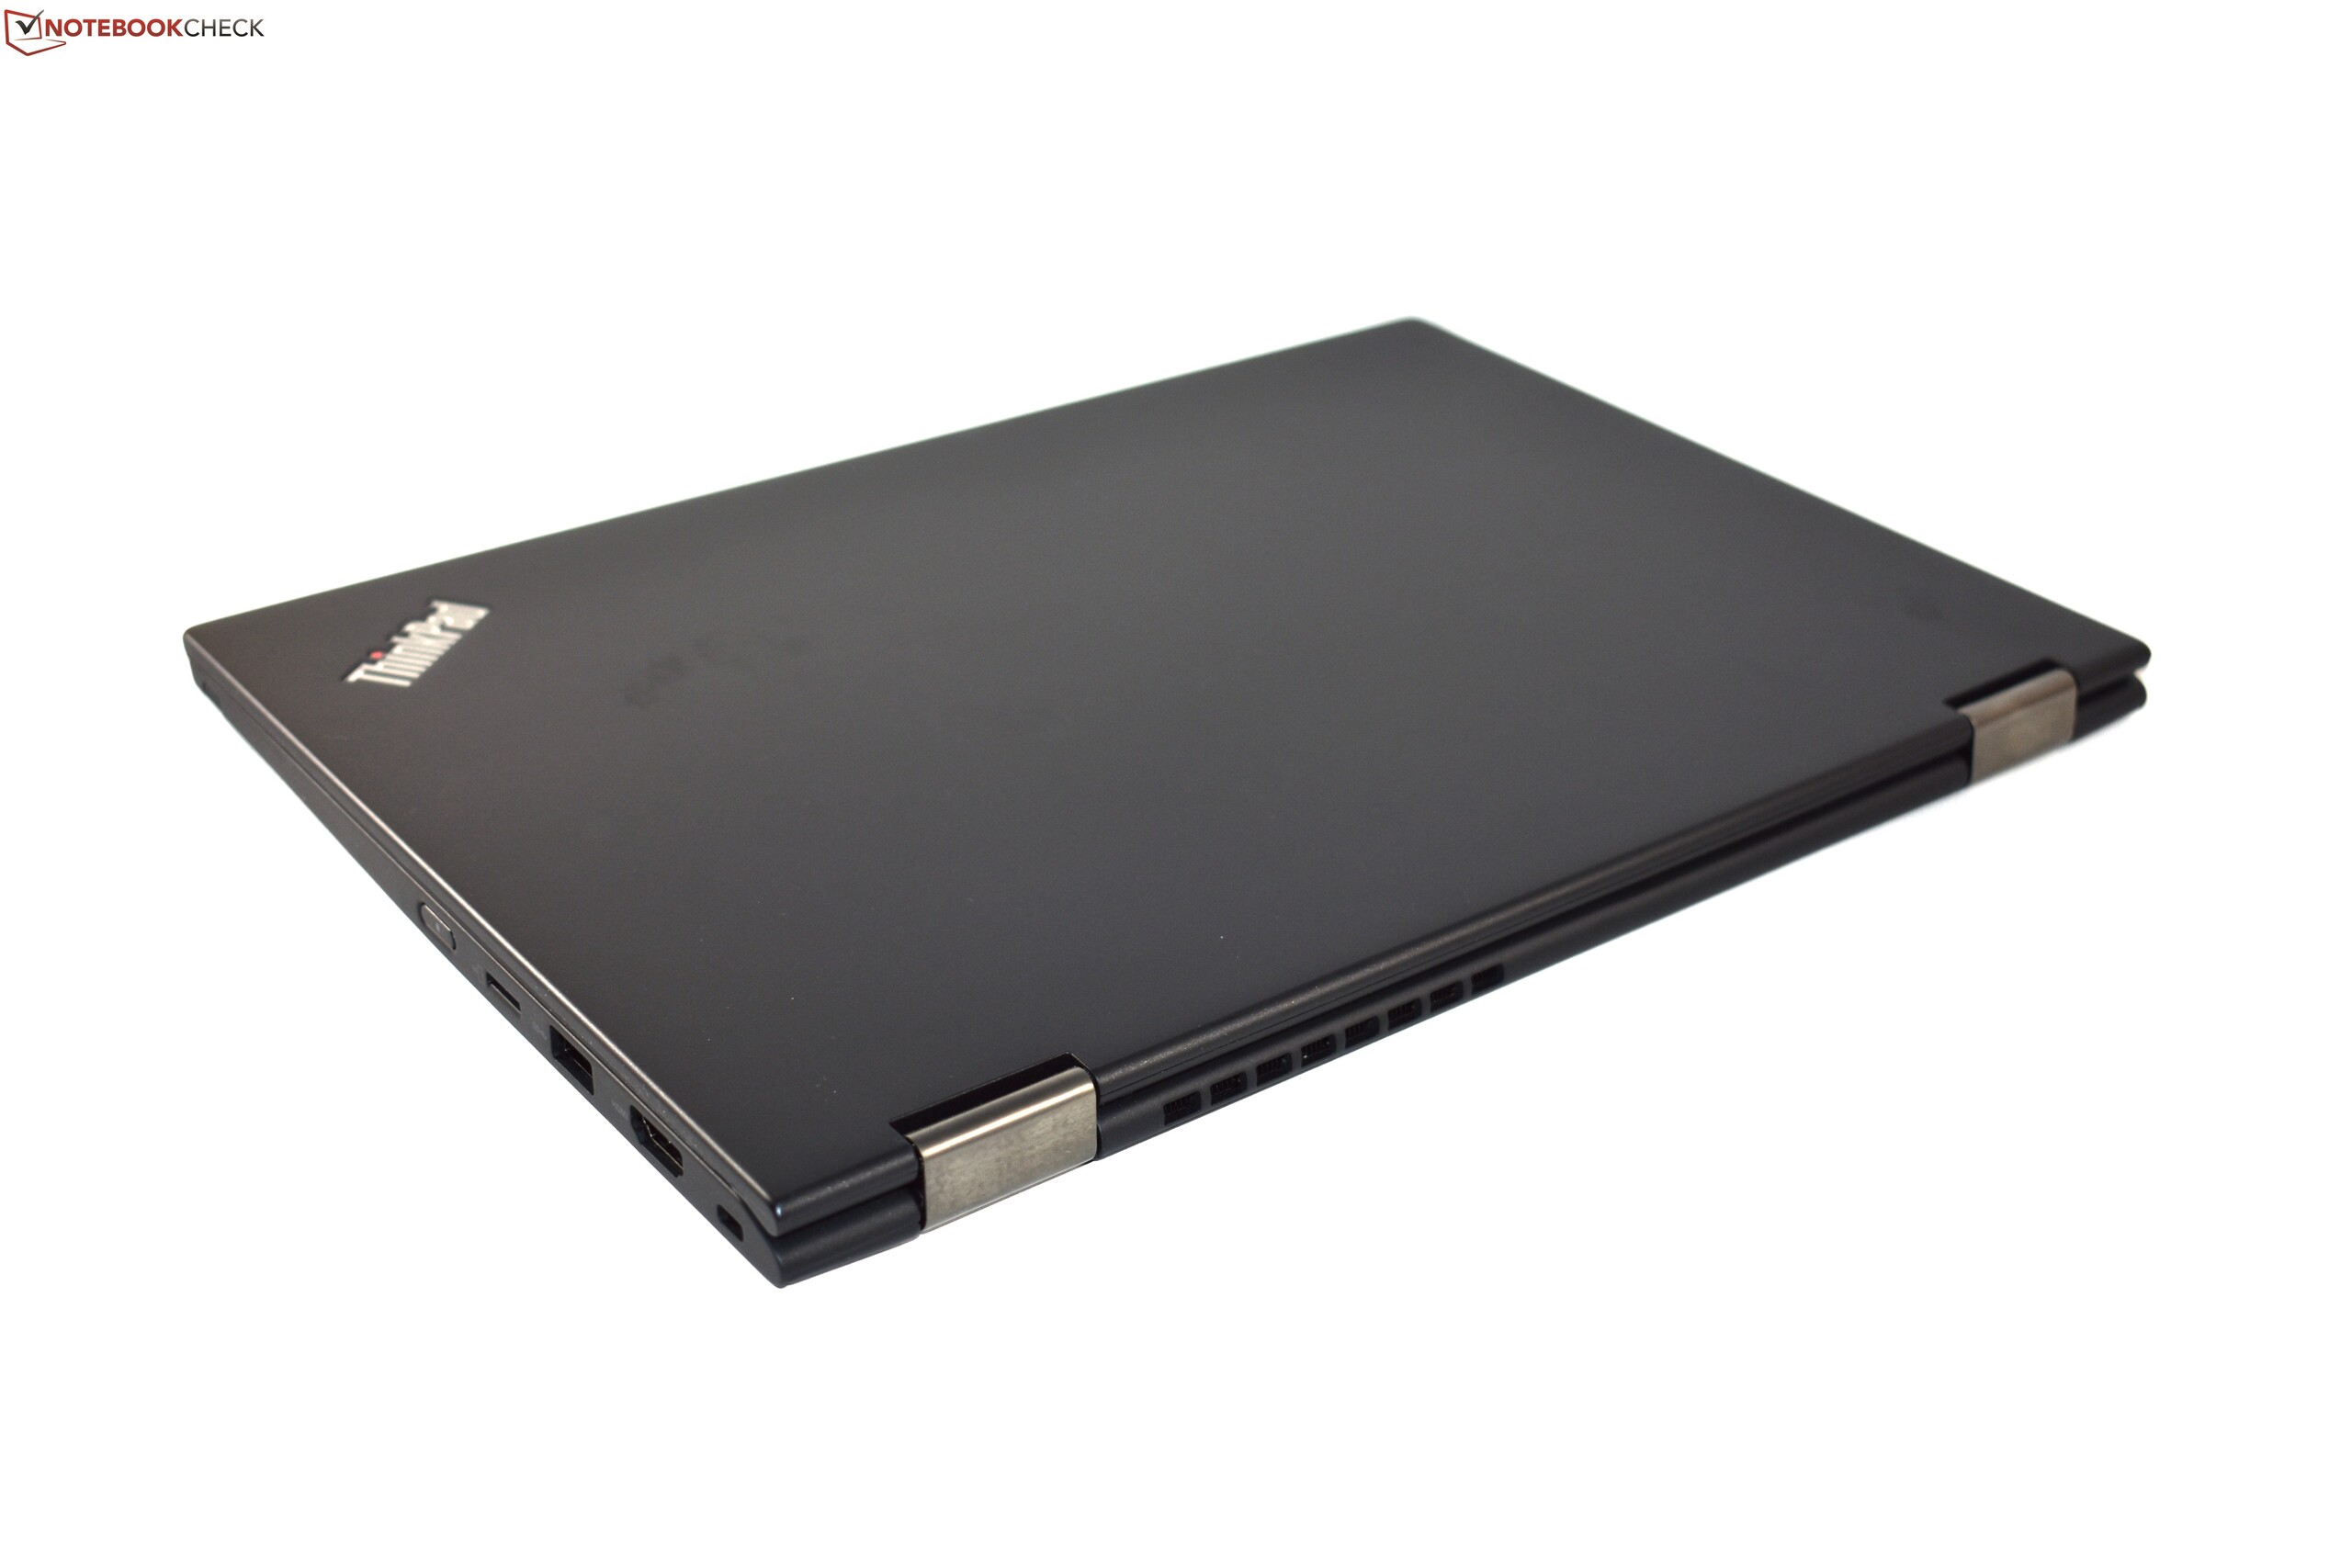
Por exemplo, o teclado "Lift & Lock" ausente, que costumava proteger as teclas no modo tablet. Isso é uma pena, pois era único entre os conversíveis. Também não é mais possível atualizar o WWAN. Também notamos um ruído irritante da bobina e desejamos que a Lenovo tenha incluído uma tela mais brilhante - particularmente considerando sua superfície reflexiva. Aparentemente, não haverá uma opção com 32 GB de RAM, ao contrário do ThinkPad X390 normal. Isso é particularmente incômodo, já que a memória RAM está firmemente soldada e não pode ser expandida ou substituída. O tempo de resposta do painel LCD também é decepcionante.
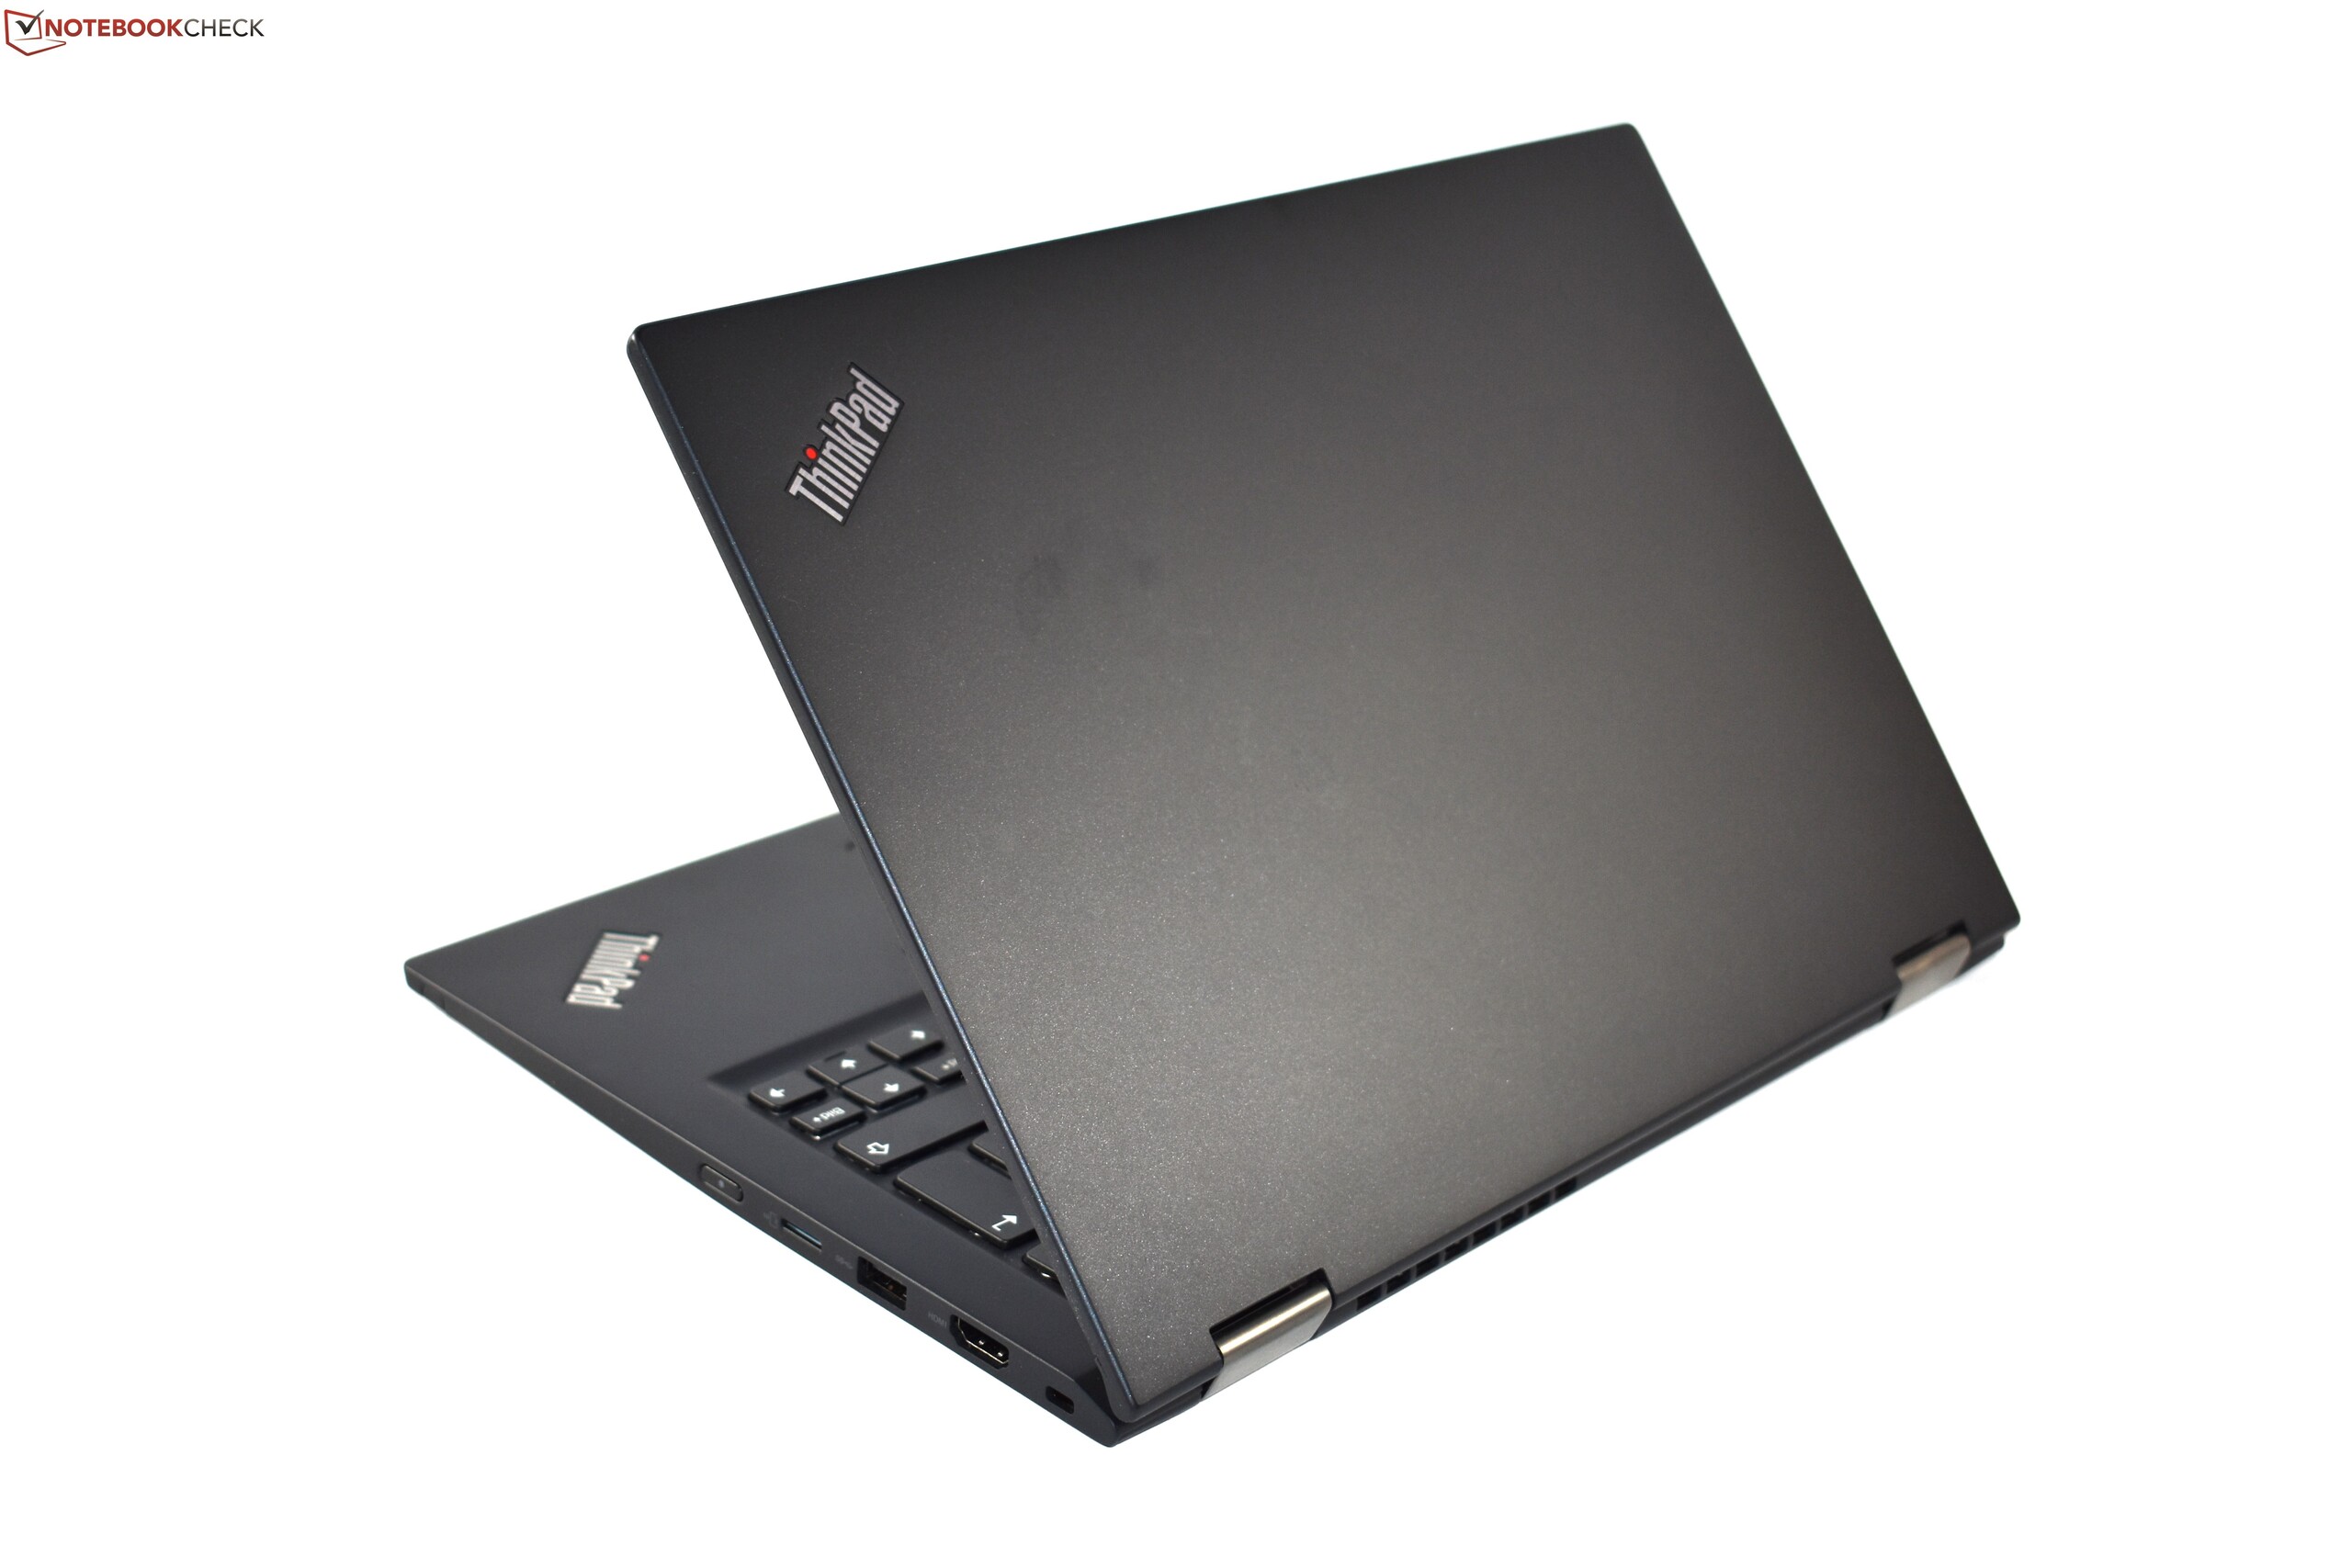
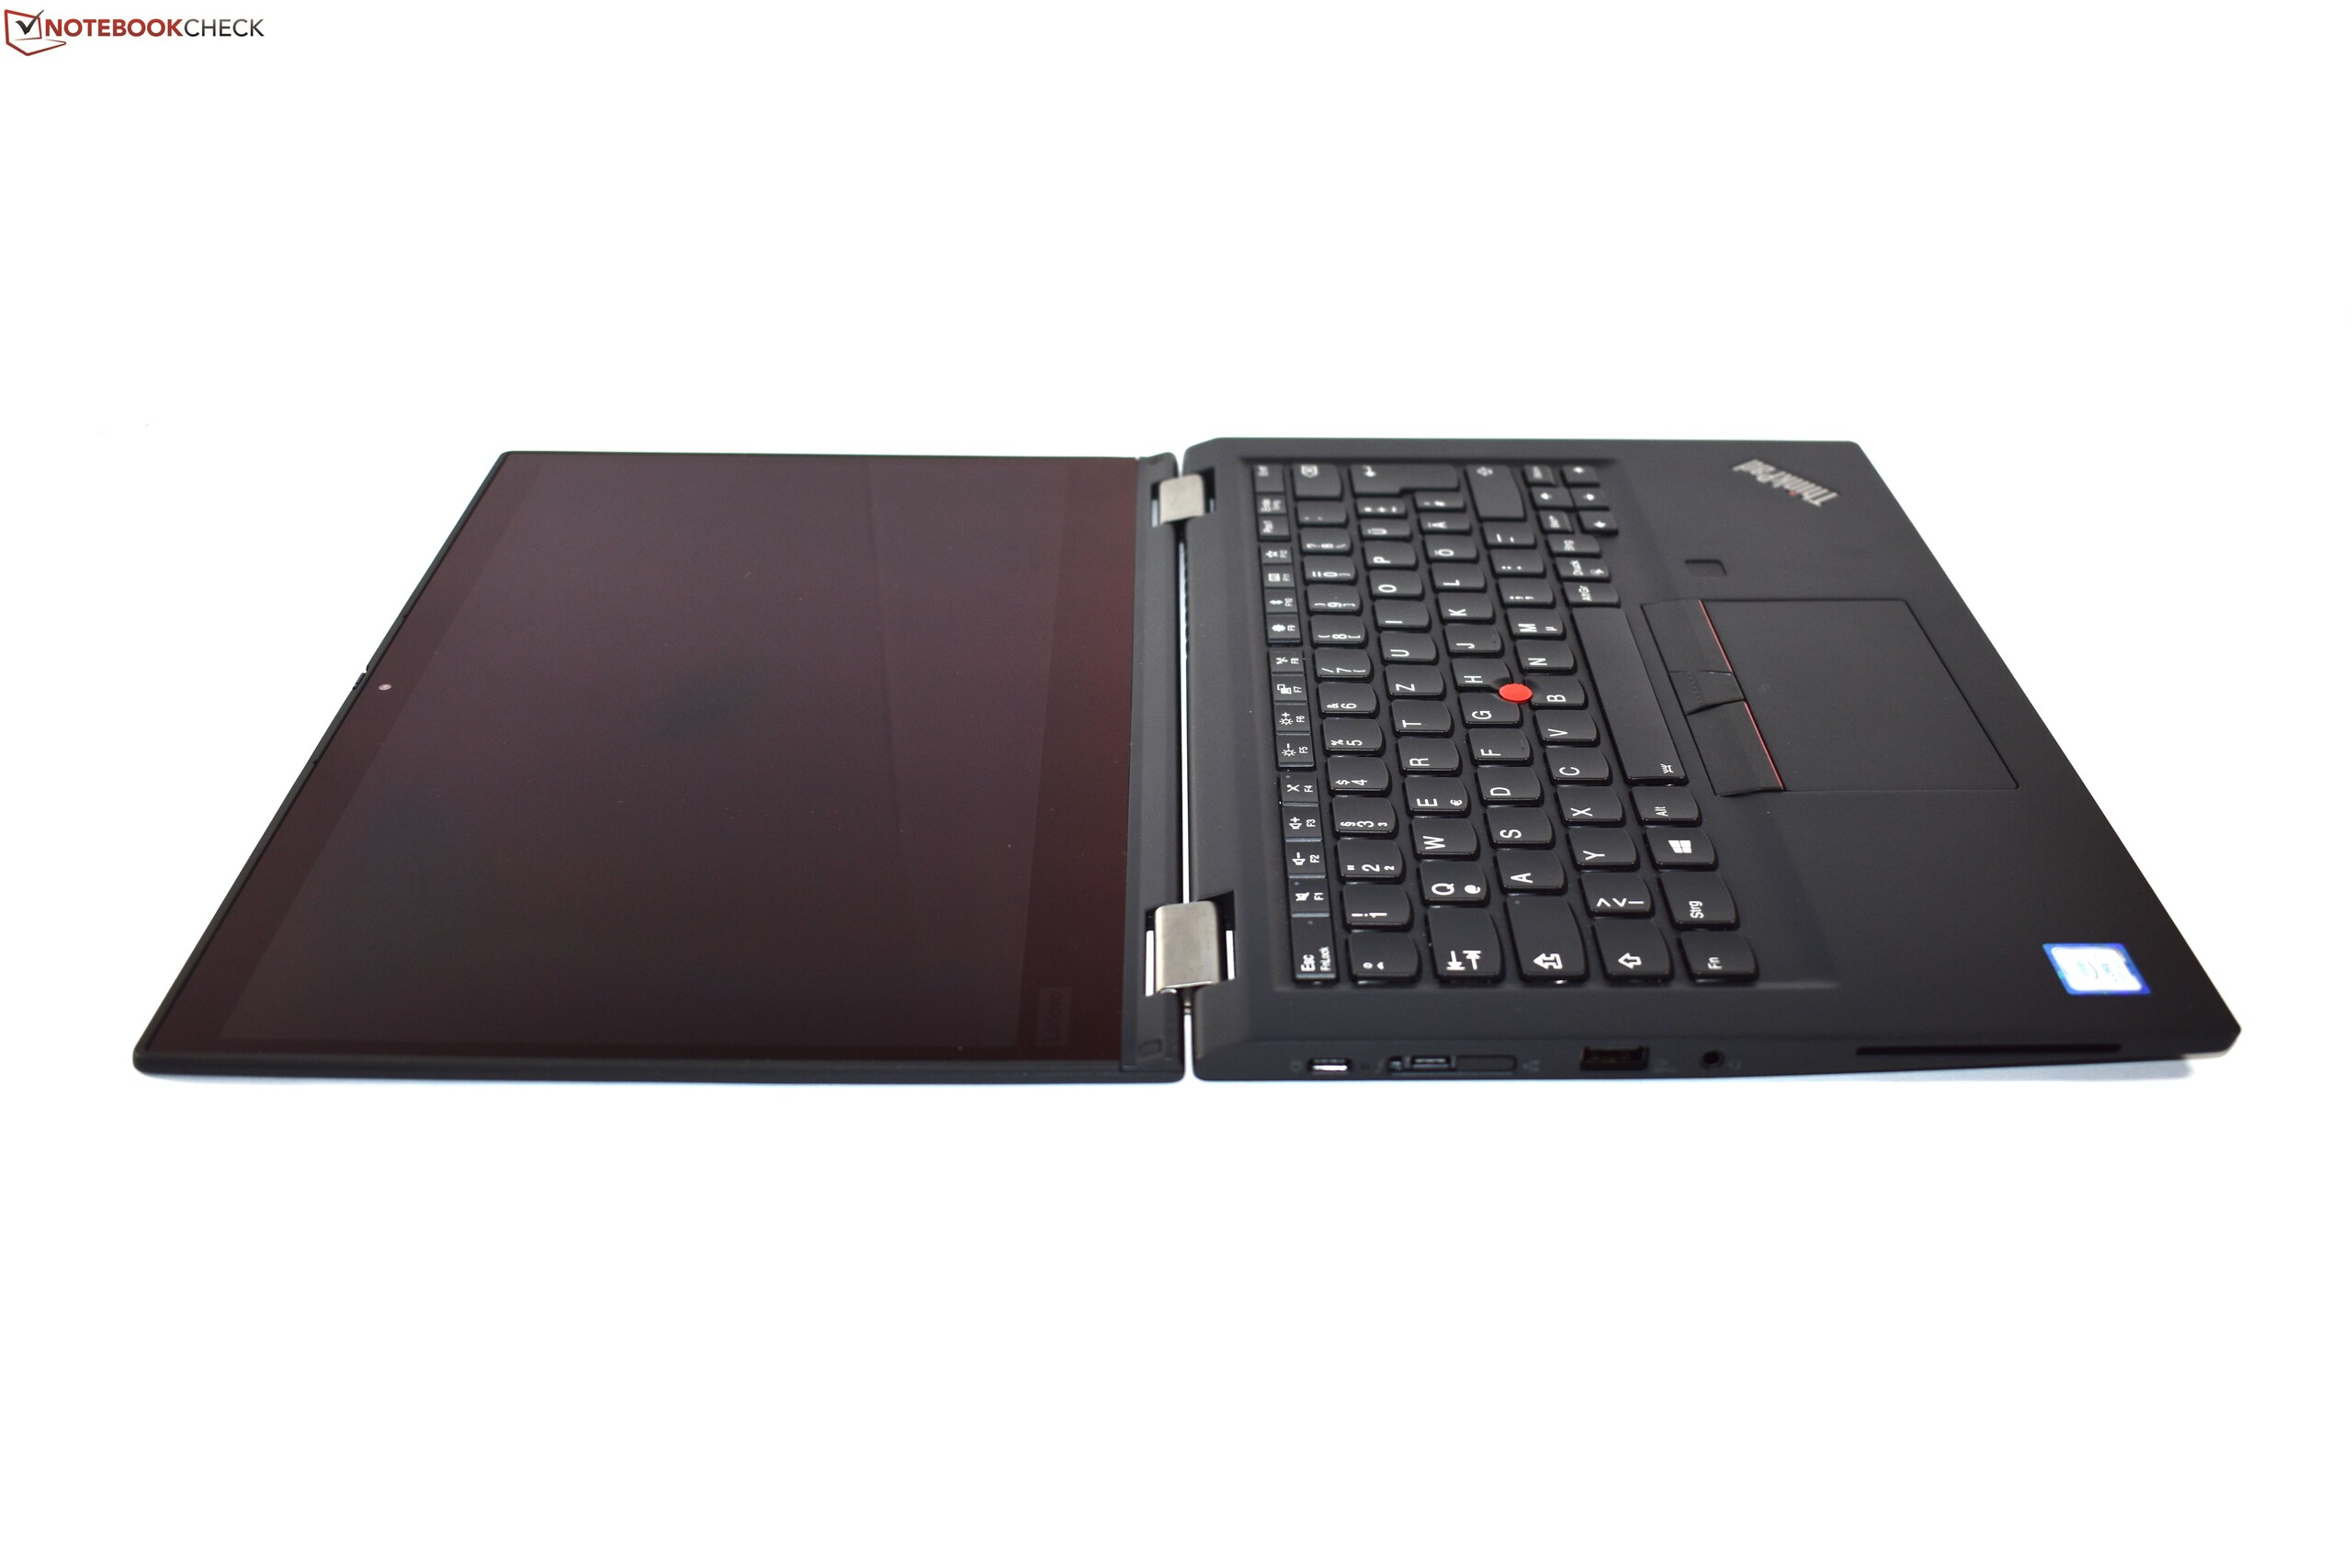
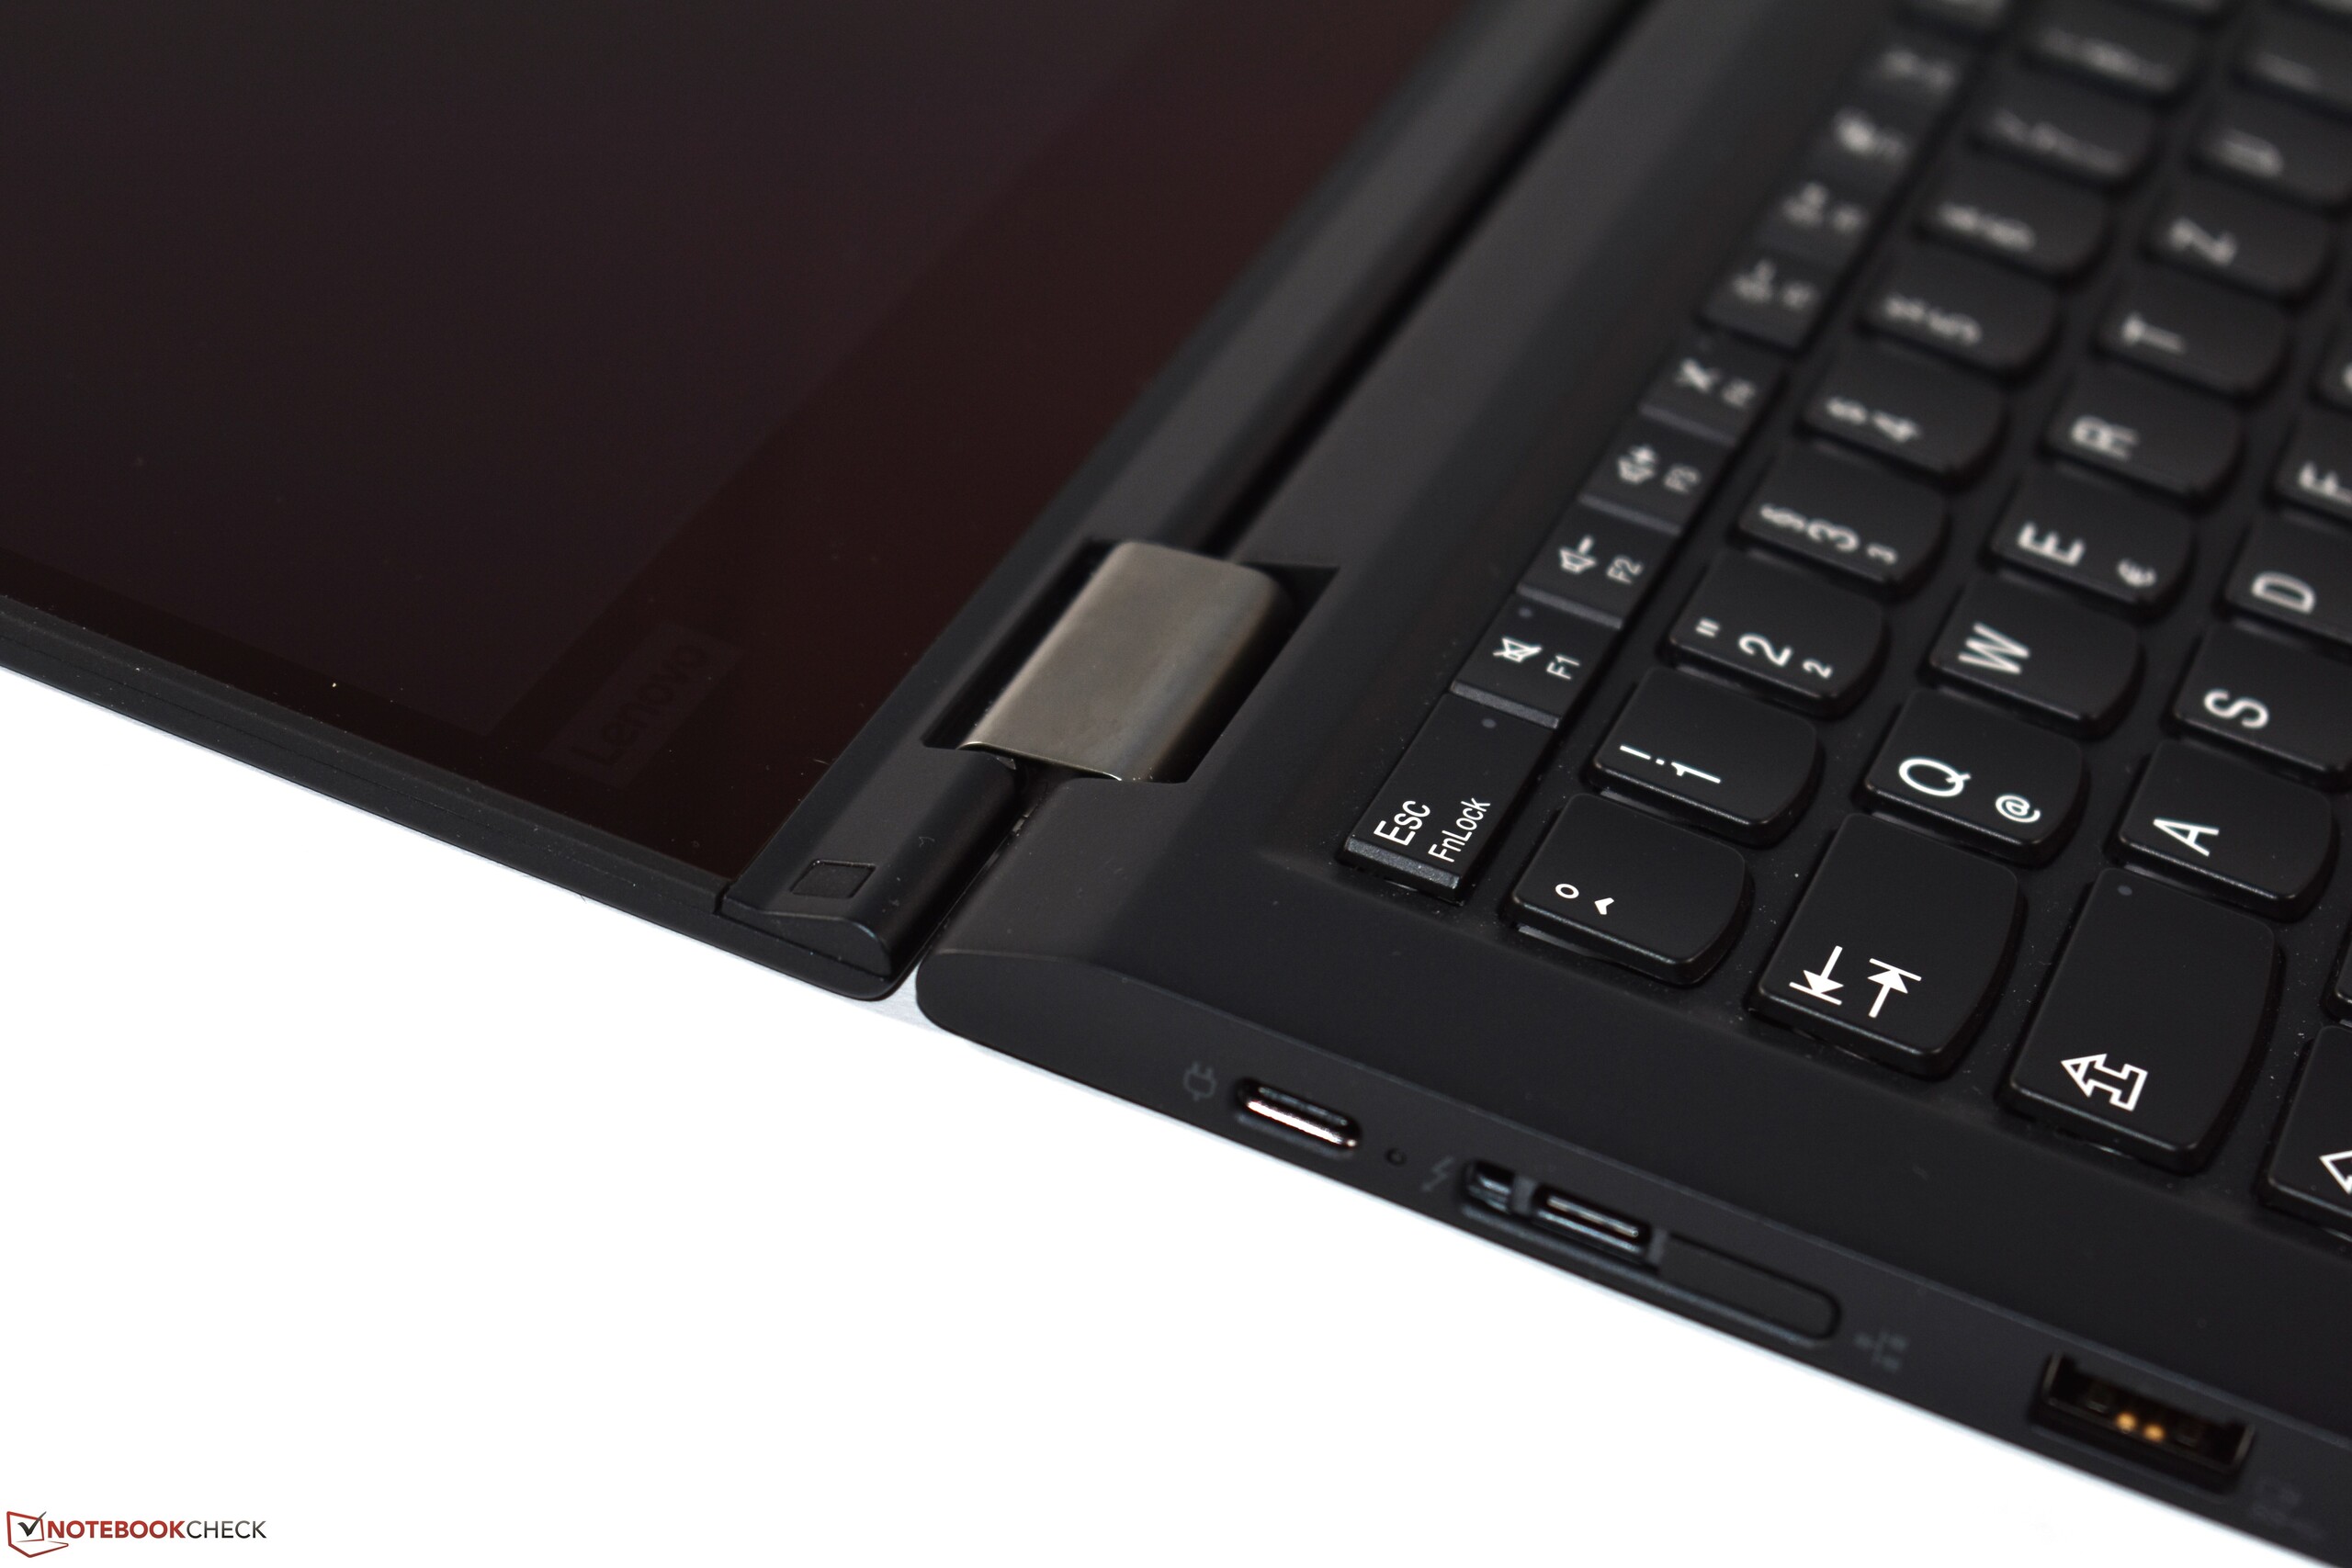
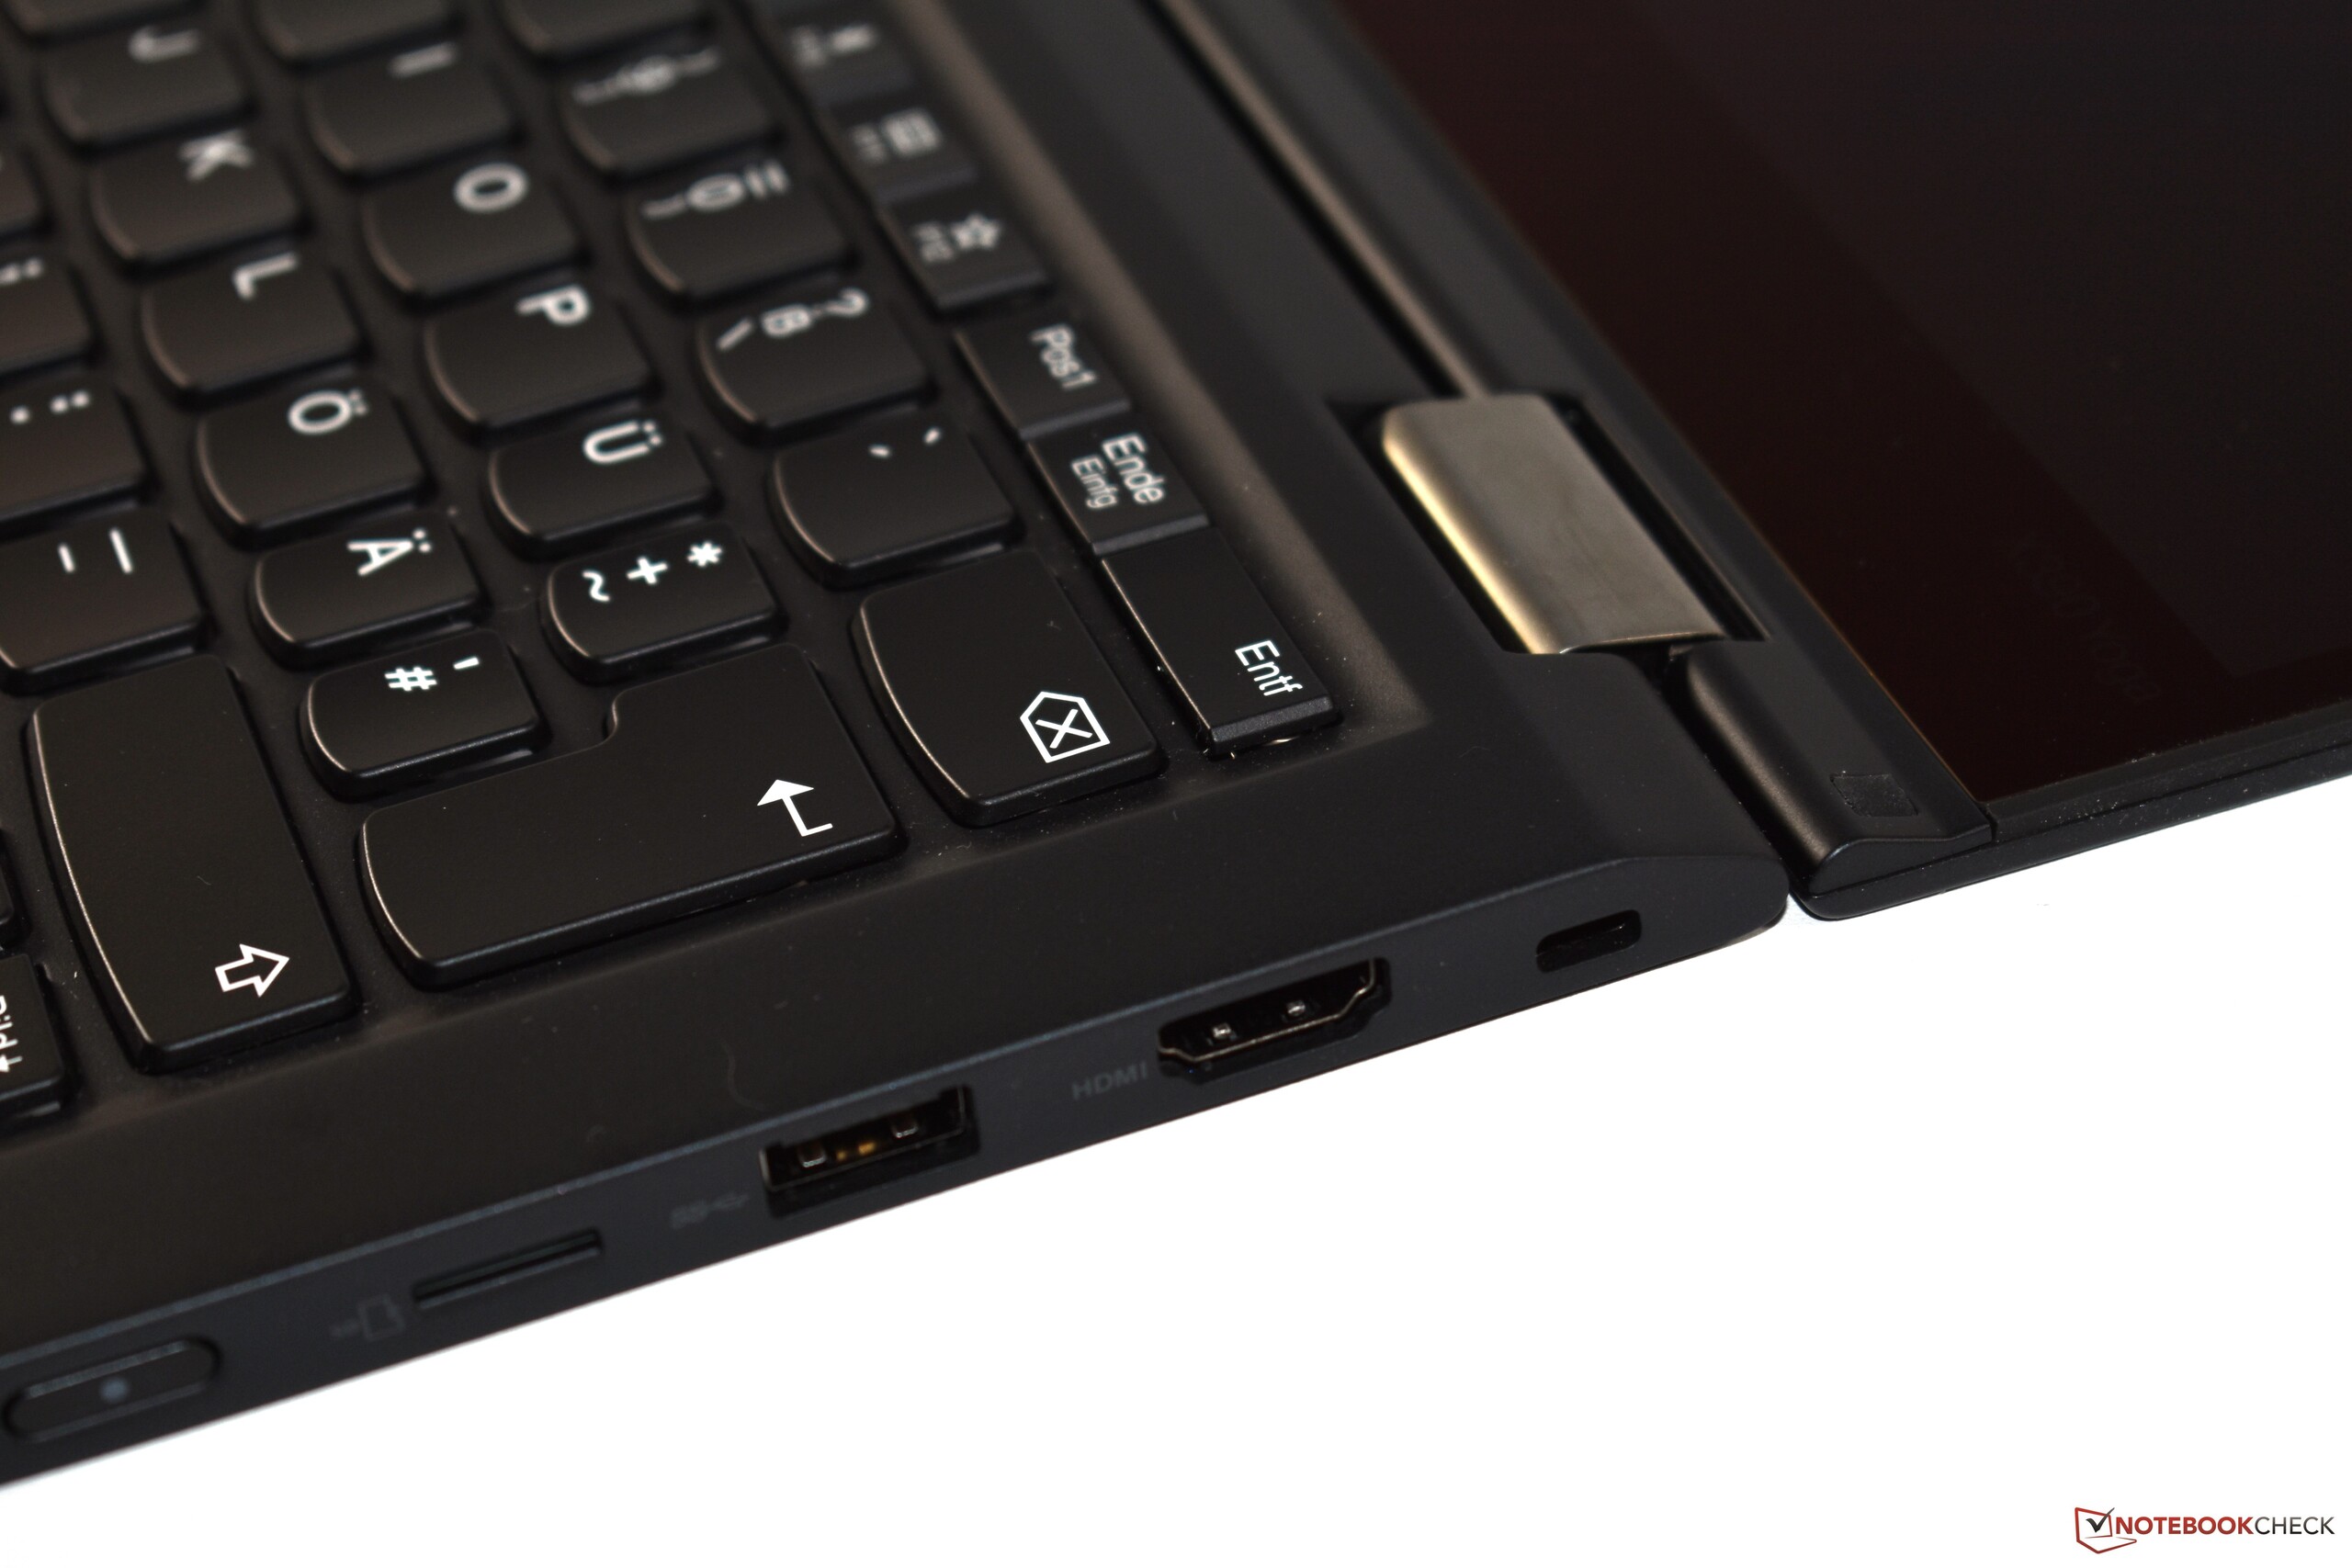
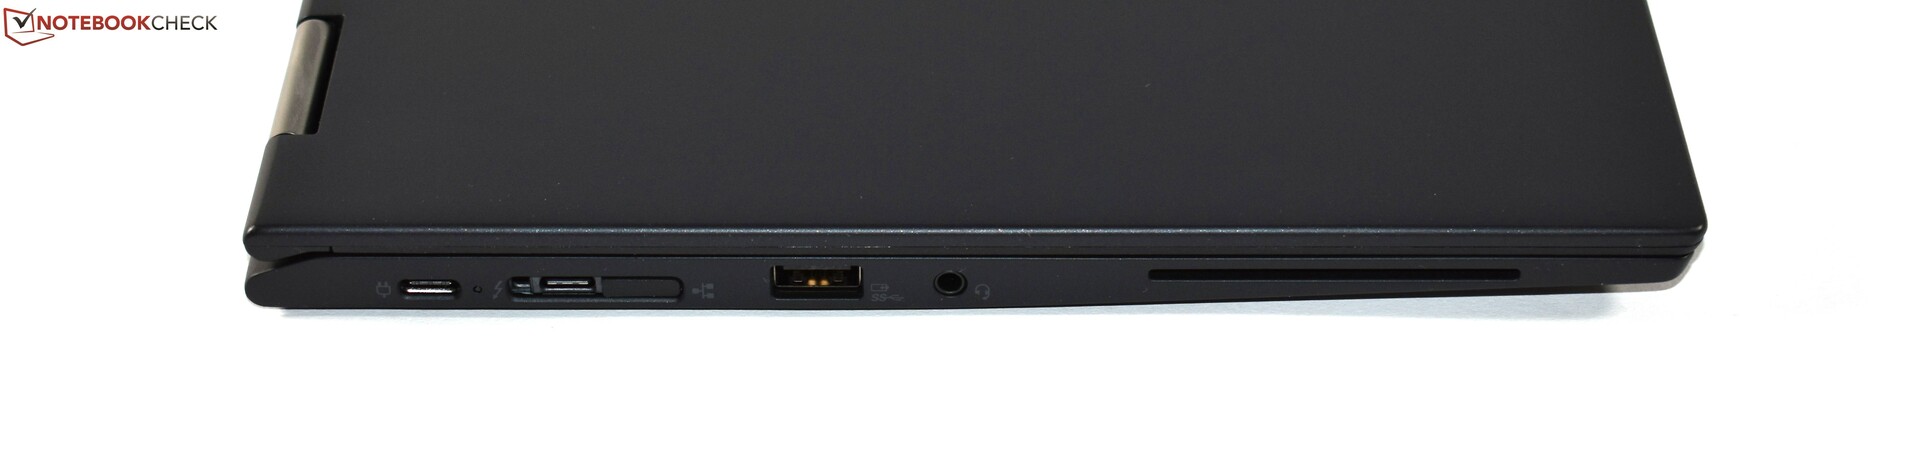
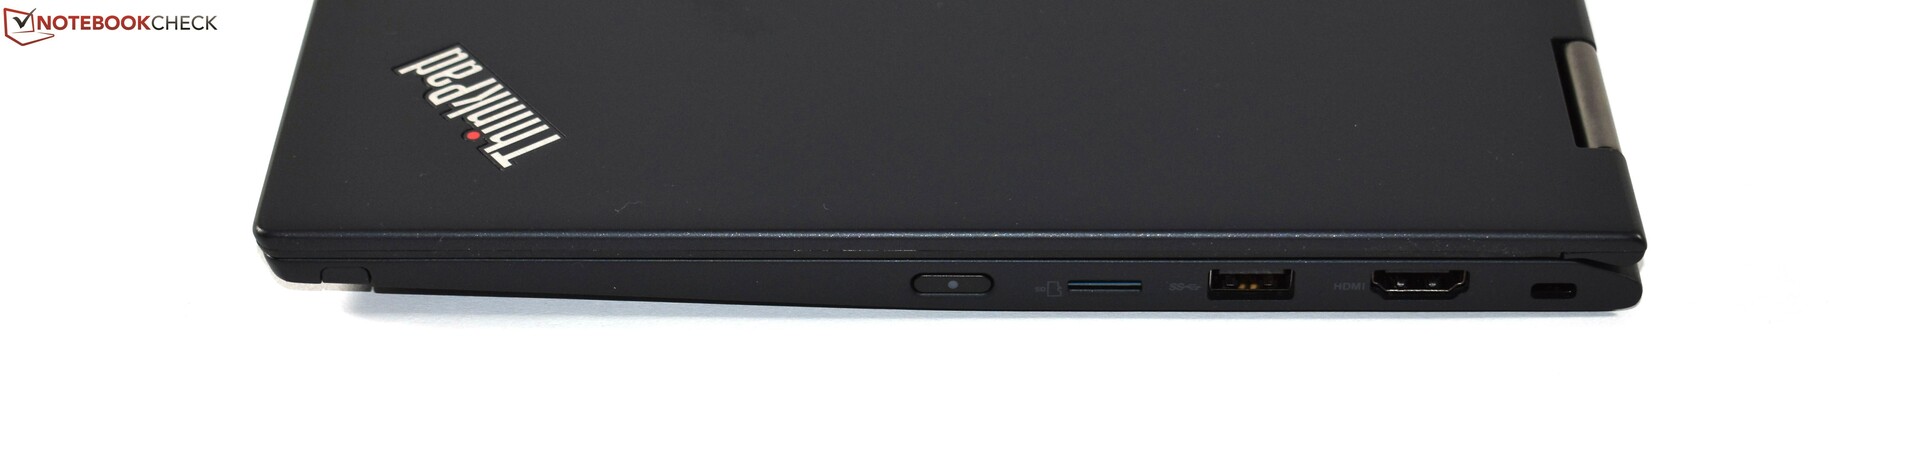
Em uma nota mais positiva, temos a carcaça recém-atualizada, que continua estável e robusta ao mesmo tempo em que é mais fina e mais leve do que a do seu predecessor. Embora falte o mecanismo "Lift & Lock” do seu teclado, é sem dúvida de excelente qualidade - pelo menos se você ignorar o fato de que é um pouco menor do que o habitual. As várias opções de substituto de mouse (touchpad, TrackPoint, tela táctil e caneta digitalizadora) são muito fáceis de usar. Outro aspecto flexível do ThinkPad conversível é sua seleção de portas. Ele agora possui uma porta USB C adicional em comparação com seu antecessor. Isso permite que os usuários conectem estações de acoplamento mecânicas que também são compatíveis com os outros ThinkPads - um fator importante para grandes empresas. Além da superfície reflexiva, a tela do X390 Yoga pode oferecer uma alta taxa de contraste e boa cobertura do espaço de cores. O desempenho da CPU também foi melhorado. Ainda não é particularmente impressionante e não consegue acompanhar outros ThinkPads, mas agora ele pode continuar por mais tempo sob uso intenso do que seu predecessor, o X380 Yoga. Outras vantagens do X390 Yoga são os ventiladores calmos e a garantia generosa.
O ThinkPad X390 Yoga é um conversível de alta qualidade feito para o ambiente empresariais. Seus bons dispositivos de entrada, em particular, são muito atraentes.
No geral, os aspectos positivos do Lenovo ThinkPad X390 Yoga claramente superam suas deficiências e podemos recomendá-lo. Seu concorrente Dell Latitude 7390 2-em-1 e o HP EliteBook x360 1030 G3 também tem muito a oferecer, e pode até superar o ThinkPad em certas áreas. O HP EliteBook, por exemplo, tem uma tela mais brilhante e um melhor tempo de duração da bateria. O ThinkPad Yoga prevalece quando se trata de dispositivos de entrada e também oferece recursos empresariais, como um slot para cartão inteligente ou a porta de acoplamento mecânico, o que deve torná-lo particularmente interessante para as empresas.
Lenovo ThinkPad X390 Yoga-20NQS05R00
- 06/11/2019 v6 (old)
Benjamin Herzig
Price comparison
