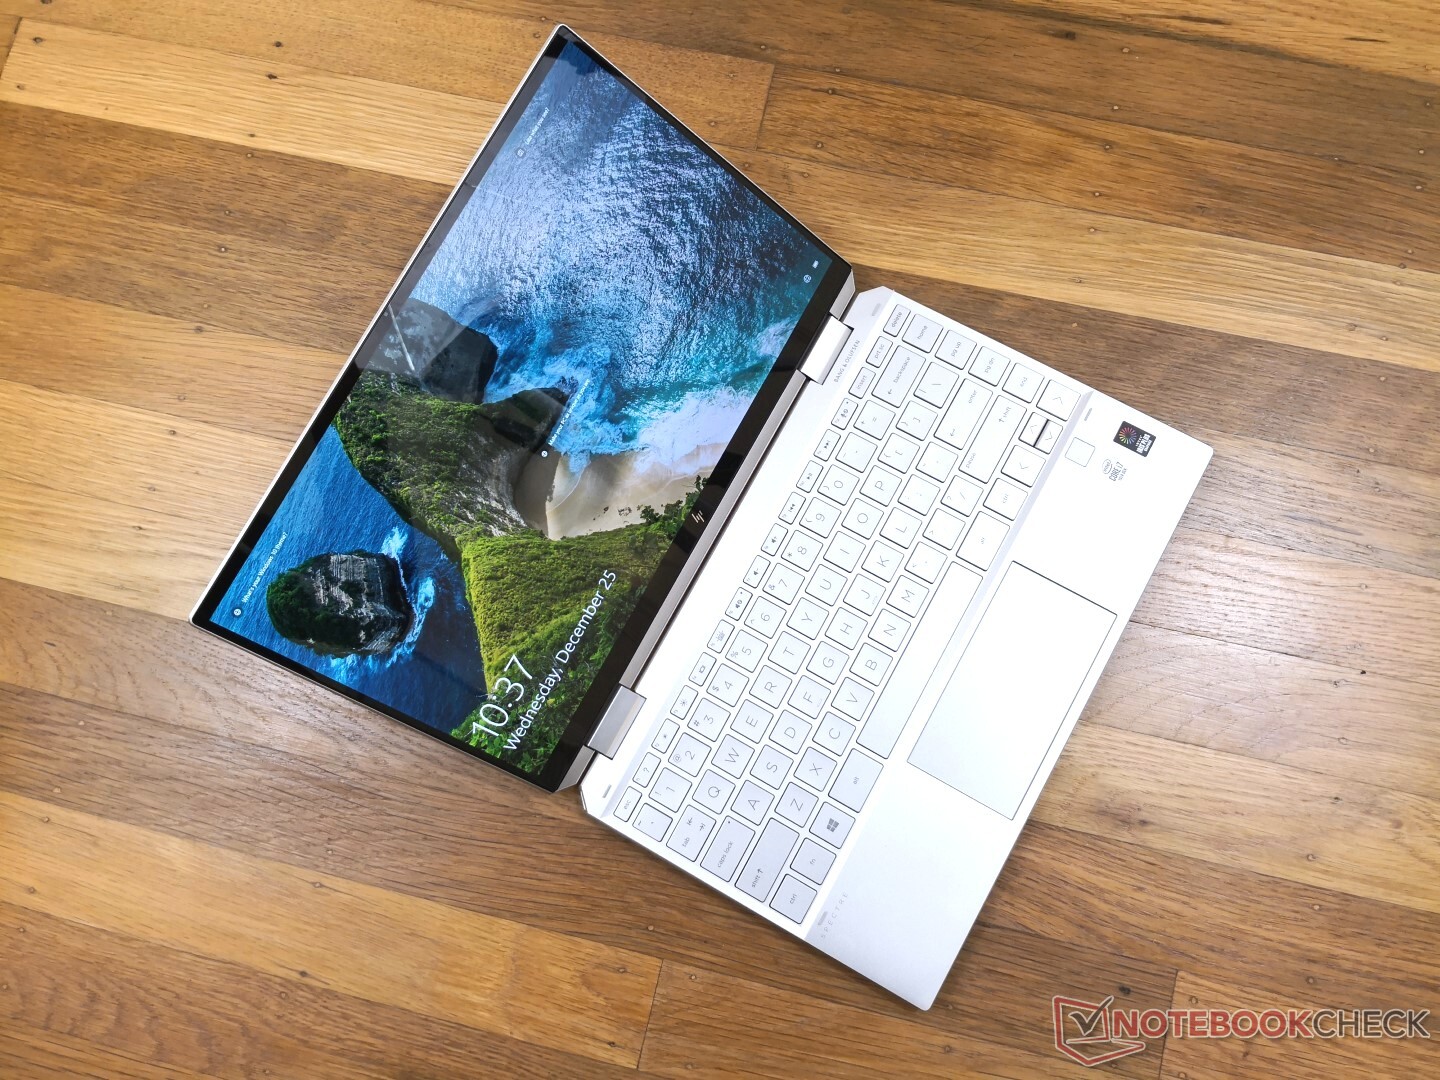
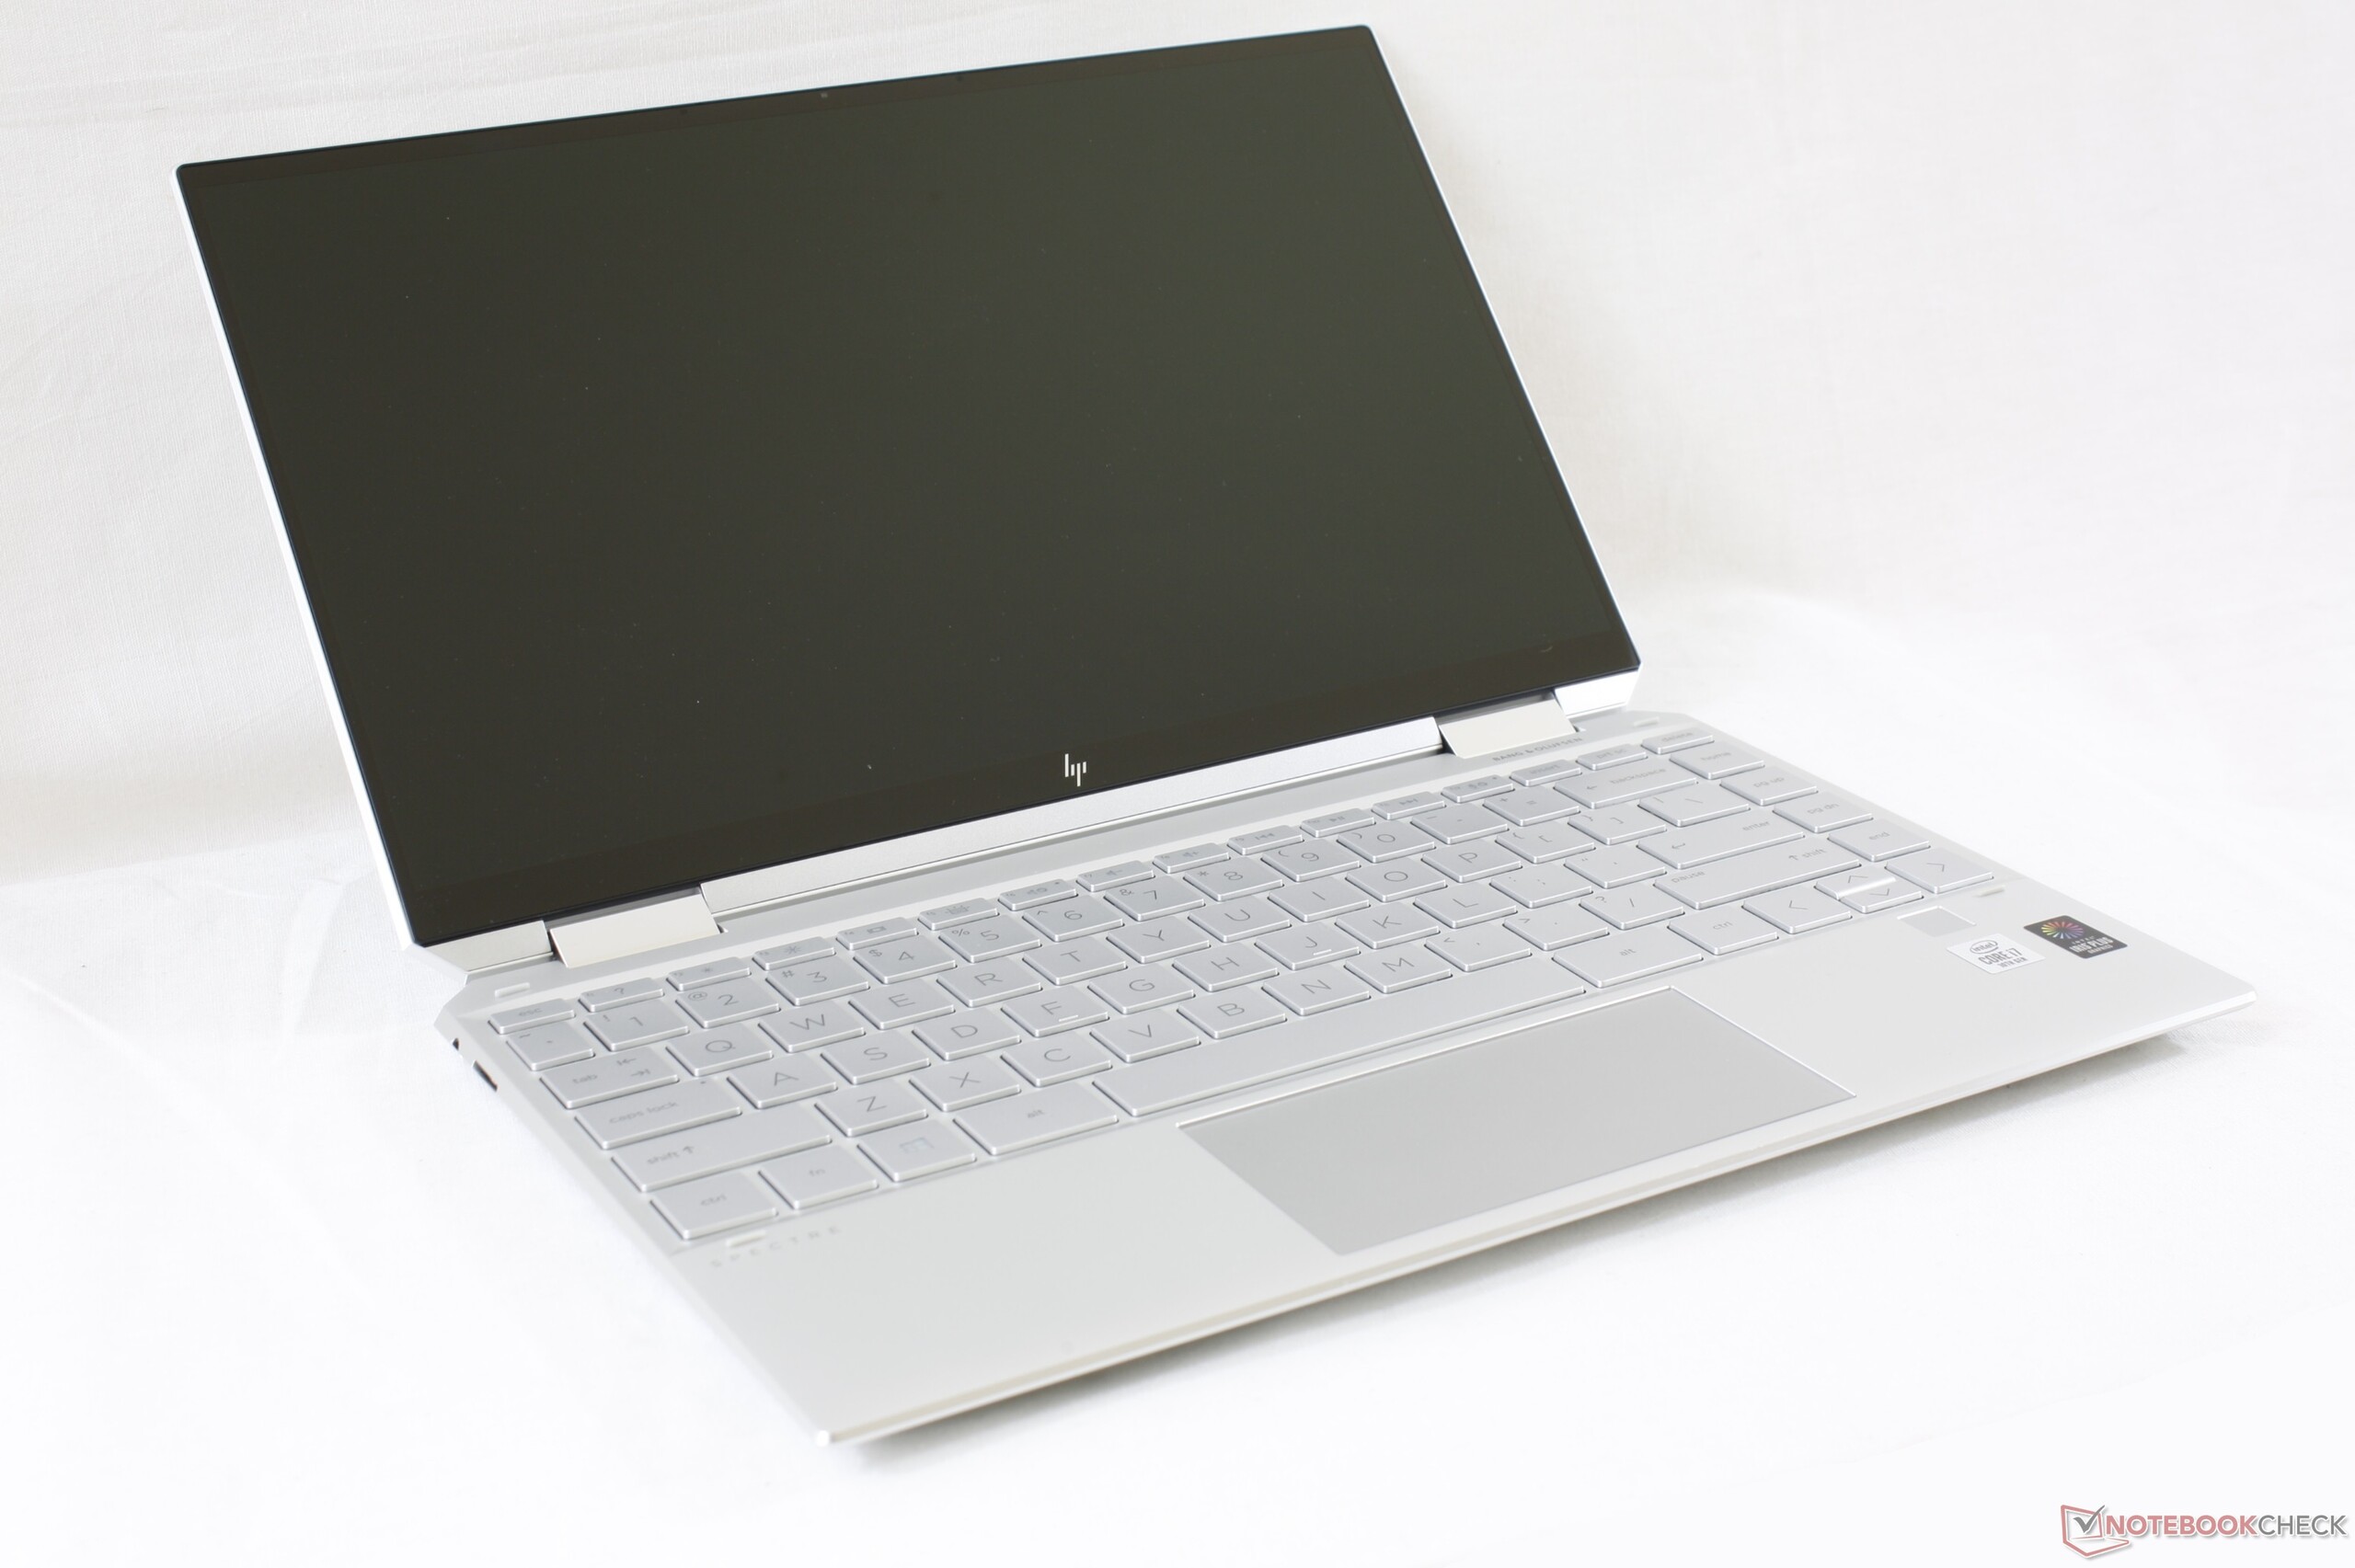
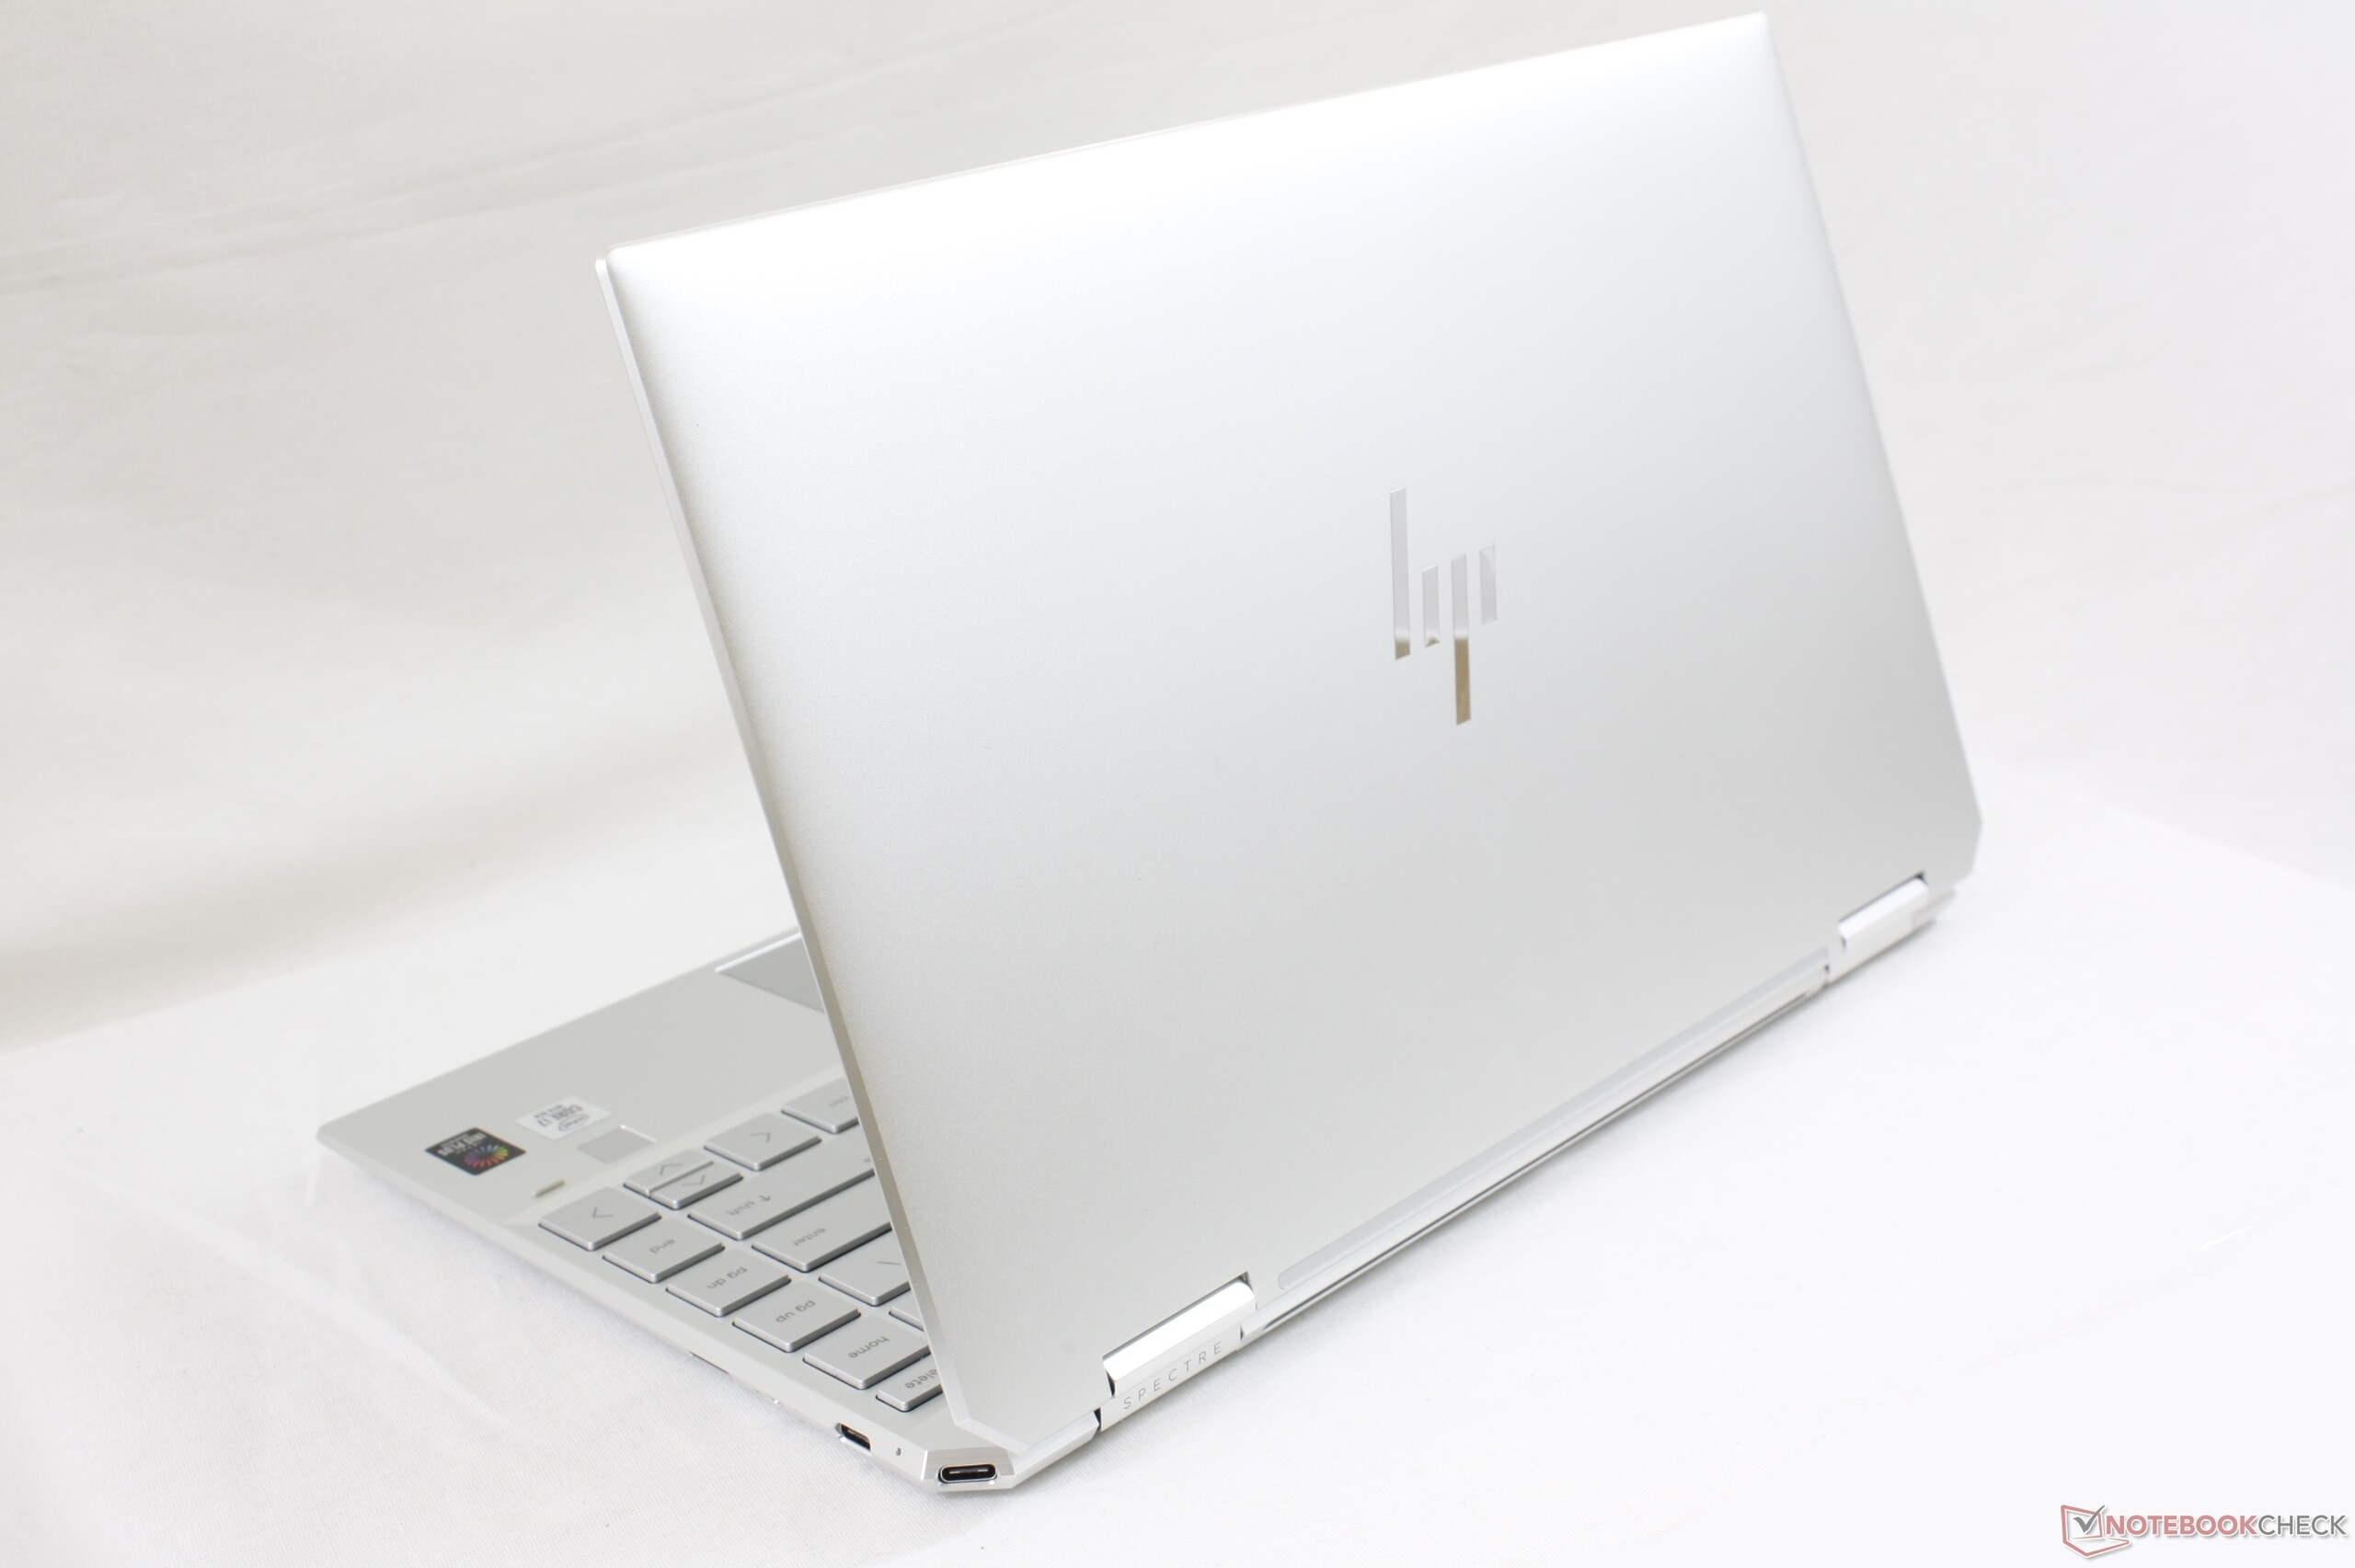
Breve Análise do Conversível HP Spectre x360 13-aw0013dx: Impulsionado pelo Intel Ice Lake
Avaliação | Data | Modelo | Peso | Altura | Size | Resolução | Preço |
|---|---|---|---|---|---|---|---|
| 88.4 % v7 (old) | 12/2019 | HP Spectre x360 13-aw0013dx i7-1065G7, Iris Plus Graphics G7 (Ice Lake 64 EU) | 1.2 kg | 16.9 mm | 13.30" | 1920x1080 | |
| 86.3 % v7 (old) | 10/2019 | Dell XPS 13 7390 2-in-1 Core i7 i7-1065G7, Iris Plus Graphics G7 (Ice Lake 64 EU) | 1.3 kg | 13 mm | 13.40" | 1920x1200 | |
| 81.2 % v7 (old) | 03/2020 | Asus ZenBook Flip 14 UM462DA-AI023T R7 3700U, Vega 10 | 1.6 kg | 18.9 mm | 14.00" | 1920x1080 | |
| 86.3 % v7 (old) | 10/2019 | Razer Blade Stealth i7-1065G7 Iris Plus i7-1065G7, Iris Plus Graphics G7 (Ice Lake 64 EU) | 1.4 kg | 15.3 mm | 13.30" | 1920x1080 | |
| 87 % v7 (old) | 01/2020 | Lenovo Yoga C940-14IIL 81Q9 i7-1065G7, Iris Plus Graphics G7 (Ice Lake 64 EU) | 1.4 kg | 15.7 mm | 14.00" | 3840x2160 |
| SD Card Reader | |
| average JPG Copy Test (av. of 3 runs) | |
| HP Spectre x360 13-ap0312ng (Toshiba Exceria Pro M501 64 GB UHS-II) | |
| HP Spectre x360 13-aw0013dx (Toshiba Exceria Pro M501 microSDXC 64GB) | |
| Dell XPS 13 7390 2-in-1 Core i7 (Toshiba Exceria Pro M501 64 GB UHS-II) | |
| Asus ZenBook Flip 14 UM462DA-AI023T (Toshiba Exceria Pro M501 microSDXC 64GB) | |
| maximum AS SSD Seq Read Test (1GB) | |
| HP Spectre x360 13-ap0312ng (Toshiba Exceria Pro M501 64 GB UHS-II) | |
| Dell XPS 13 7390 2-in-1 Core i7 (Toshiba Exceria Pro M501 64 GB UHS-II) | |
| HP Spectre x360 13-aw0013dx (Toshiba Exceria Pro M501 microSDXC 64GB) | |
| Asus ZenBook Flip 14 UM462DA-AI023T (Toshiba Exceria Pro M501 microSDXC 64GB) | |
| Networking | |
| iperf3 transmit AX12 | |
| MSI Prestige 15 A10SC | |
| HP Spectre x360 13-ap0312ng | |
| Asus ZenBook Flip 14 UM462DA-AI023T | |
| iperf3 receive AX12 | |
| MSI Prestige 15 A10SC | |
| HP Spectre x360 13-ap0312ng | |
| Asus ZenBook Flip 14 UM462DA-AI023T | |
| |||||||||||||||||||||||||
iluminação: 85 %
iluminação com acumulador: 447.4 cd/m²
Contraste: 1443:1 (Preto: 0.31 cd/m²)
ΔE ColorChecker Calman: 4.23 | ∀{0.5-29.43 Ø4.72}
calibrated: 1.32
ΔE Greyscale Calman: 6.1 | ∀{0.09-98 Ø4.97}
98.9% sRGB (Argyll 1.6.3 3D)
64.8% AdobeRGB 1998 (Argyll 1.6.3 3D)
71.5% AdobeRGB 1998 (Argyll 3D)
98.9% sRGB (Argyll 3D)
69.6% Display P3 (Argyll 3D)
Gamma: 2.11
CCT: 6136 K
| HP Spectre x360 13-aw0013dx AU Optronics AUO5E2D, IPS, 13.3", 1920x1080 | HP Spectre x360 13-ap0312ng M133NVF3, IPS, 13.3", 1920x1080 | Dell XPS 13 7390 2-in-1 Core i7 Sharp LQ134N1, IPS, 13.4", 1920x1200 | Razer Blade Stealth i7-1065G7 Iris Plus Sharp LQ133M1JW41, IPS, 13.3", 1920x1080 | Lenovo Yoga C940-14IIL 81Q9 BOE HF NV140QUM-N54, IPS, 14", 3840x2160 | Asus ZenBook Flip 14 UM462DA-AI023T IPS, 14", 1920x1080 | |
|---|---|---|---|---|---|---|
| Display | -9% | 0% | -4% | 13% | -11% | |
| Display P3 Coverage (%) | 69.6 | 63 -9% | 69.9 0% | 66.2 -5% | 83.8 20% | 65.5 -6% |
| sRGB Coverage (%) | 98.9 | 89.8 -9% | 99.2 0% | 97.2 -2% | 99.9 1% | 85.2 -14% |
| AdobeRGB 1998 Coverage (%) | 71.5 | 64.1 -10% | 71.5 0% | 67.1 -6% | 83.3 17% | 62.2 -13% |
| Response Times | 49% | 22% | 18% | 27% | 20% | |
| Response Time Grey 50% / Grey 80% * (ms) | 60.8 ? | 29.2 ? 52% | 47.6 ? 22% | 45.2 ? 26% | 44.4 ? 27% | 42 ? 31% |
| Response Time Black / White * (ms) | 36.8 ? | 20 ? 46% | 29.2 ? 21% | 33.2 ? 10% | 27.2 ? 26% | 34 ? 8% |
| PWM Frequency (Hz) | 1000 ? | 2500 ? | 22730 ? | |||
| Screen | -20% | 17% | 19% | -8% | -29% | |
| Brightness middle (cd/m²) | 447.4 | 272 -39% | 549.8 23% | 422.6 -6% | 501.7 12% | 306 -32% |
| Brightness (cd/m²) | 420 | 298 -29% | 520 24% | 404 -4% | 501 19% | 294 -30% |
| Brightness Distribution (%) | 85 | 84 -1% | 86 1% | 87 2% | 82 -4% | 81 -5% |
| Black Level * (cd/m²) | 0.31 | 0.39 -26% | 0.39 -26% | 0.35 -13% | 0.32 -3% | 0.39 -26% |
| Contrast (:1) | 1443 | 697 -52% | 1410 -2% | 1207 -16% | 1568 9% | 785 -46% |
| Colorchecker dE 2000 * | 4.23 | 4.3 -2% | 2.12 50% | 1.02 76% | 5.48 -30% | 5.16 -22% |
| Colorchecker dE 2000 max. * | 9.34 | 9 4% | 3.66 61% | 3.06 67% | 10.03 -7% | 9.9 -6% |
| Colorchecker dE 2000 calibrated * | 1.32 | 2.4 -82% | 1.37 -4% | 0.95 28% | 2.22 -68% | 3.07 -133% |
| Greyscale dE 2000 * | 6.1 | 4.4 28% | 2.6 57% | 1 84% | 8.1 -33% | 5.86 4% |
| Gamma | 2.11 104% | 1.97 112% | 2.3 96% | 2.21 100% | 2.07 106% | 2.31 95% |
| CCT | 6136 106% | 5825 112% | 6884 94% | 6502 100% | 6730 97% | 6349 102% |
| Color Space (Percent of AdobeRGB 1998) (%) | 64.8 | 58.9 -9% | 65.4 1% | 62.1 -4% | 74.1 14% | 56 -14% |
| Color Space (Percent of sRGB) (%) | 98.9 | 89.8 -9% | 99.7 1% | 97.1 -2% | 100 1% | 85 -14% |
| Média Total (Programa/Configurações) | 7% /
-9% | 13% /
14% | 11% /
15% | 11% /
0% | -7% /
-20% |
* ... menor é melhor
Exibir tempos de resposta
| ↔ Tempo de resposta preto para branco | ||
|---|---|---|
| 36.8 ms ... ascensão ↗ e queda ↘ combinadas | ↗ 15.6 ms ascensão | 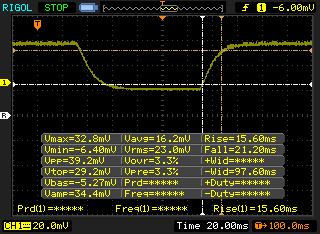 |
| ↘ 21.2 ms queda | ||
| A tela mostra taxas de resposta lentas em nossos testes e será insatisfatória para os jogadores. Em comparação, todos os dispositivos testados variam de 0.1 (mínimo) a 240 (máximo) ms. » 95 % de todos os dispositivos são melhores. Isso significa que o tempo de resposta medido é pior que a média de todos os dispositivos testados (19.8 ms). | ||
| ↔ Tempo de resposta 50% cinza a 80% cinza | ||
| 60.8 ms ... ascensão ↗ e queda ↘ combinadas | ↗ 26 ms ascensão | 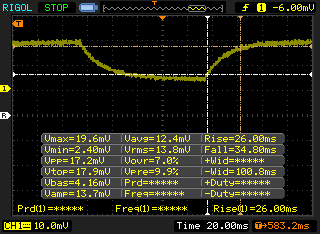 |
| ↘ 34.8 ms queda | ||
| A tela mostra taxas de resposta lentas em nossos testes e será insatisfatória para os jogadores. Em comparação, todos os dispositivos testados variam de 0.165 (mínimo) a 636 (máximo) ms. » 96 % de todos os dispositivos são melhores. Isso significa que o tempo de resposta medido é pior que a média de todos os dispositivos testados (31 ms). | ||
Cintilação da tela / PWM (modulação por largura de pulso)
| Tela tremeluzindo / PWM não detectado | 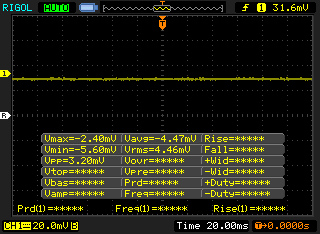 | ||
[pwm_comparison] Em comparação: 52 % de todos os dispositivos testados não usam PWM para escurecer a tela. Se PWM foi detectado, uma média de 7772 (mínimo: 5 - máximo: 343500) Hz foi medida. | |||
| PCMark 8 Home Score Accelerated v2 | 3911 pontos | |
| PCMark 8 Work Score Accelerated v2 | 5227 pontos | |
| PCMark 10 Score | 4522 pontos | |
Ajuda | ||
| HP Spectre x360 13-aw0013dx Intel Optane Memory H10 with Solid State Storage 32GB + 512GB HBRPEKNX0202A(L/H) | HP Spectre x360 13-ap0312ng Toshiba XG5 KXG50ZNV512G | Dell XPS 13 7390 2-in-1 Core i7 Toshiba BG4 KBG40ZPZ512G | Asus ZenBook Flip 14 UM462DA-AI023T | Razer Blade Stealth i7-1065G7 Iris Plus Samsung SSD PM981 MZVLB256HAHQ | Lenovo Yoga C940-14IIL 81Q9 Samsung PM981a MZVLB1T0HBLR | |
|---|---|---|---|---|---|---|
| AS SSD | 27% | 28% | -25% | 21% | 115% | |
| Seq Read (MB/s) | 1039 | 2197 111% | 1801 73% | 424.5 -59% | 1989 91% | 2213 113% |
| Seq Write (MB/s) | 310.1 | 493 59% | 1125 263% | 374.5 21% | 827 167% | 1401 352% |
| 4K Read (MB/s) | 76 | 31.4 -59% | 39.7 -48% | 19.38 -74% | 40.12 -47% | 55.2 -27% |
| 4K Write (MB/s) | 118 | 123.9 5% | 67 -43% | 34.69 -71% | 135.1 14% | 130.3 10% |
| 4K-64 Read (MB/s) | 371.8 | 674 81% | 1253 237% | 430.2 16% | 531 43% | 878 136% |
| 4K-64 Write (MB/s) | 469.5 | 479.3 2% | 209 -55% | 377.2 -20% | 309.9 -34% | 1478 215% |
| Access Time Read * (ms) | 0.067 | 0.117 -75% | 0.069 -3% | 0.13 -94% | 0.085 -27% | 0.036 46% |
| Access Time Write * (ms) | 0.138 | 0.049 64% | 0.625 -353% | 0.084 39% | 0.09 35% | 0.086 38% |
| Score Read (Points) | 552 | 925 68% | 1472 167% | 492 -11% | 770 39% | 1154 109% |
| Score Write (Points) | 618 | 653 6% | 388 -37% | 449 -27% | 528 -15% | 1748 183% |
| Score Total (Points) | 1448 | 1971 36% | 2583 78% | 1194 -18% | 1644 14% | 3467 139% |
| Copy ISO MB/s (MB/s) | 764 | 1293 69% | 1024 34% | 1418 86% | 2161 183% | |
| Copy Program MB/s (MB/s) | 465.8 | 560 20% | 203.6 -56% | 382.7 -18% | 572 23% | |
| Copy Game MB/s (MB/s) | 764 | 927 21% | 552 -28% | 334.2 -56% | 1433 88% | |
| CrystalDiskMark 5.2 / 6 | -1% | 24% | -12% | 43% | 75% | |
| Write 4K (MB/s) | 112.6 | 105.1 -7% | 106.7 -5% | 142.1 26% | 176.8 57% | 128.6 14% |
| Read 4K (MB/s) | 131 | 42.3 -68% | 49.94 -62% | 44.75 -66% | 48.38 -63% | 45.25 -65% |
| Write Seq (MB/s) | 458.9 | 677 48% | 1223 167% | 1332 190% | 1949 325% | |
| Read Seq (MB/s) | 1355 | 2092 54% | 1801 33% | 1644 21% | 2359 74% | |
| Write 4K Q32T1 (MB/s) | 341.3 | 378.8 11% | 325.3 -5% | 252.4 -26% | 440.6 29% | 445 30% |
| Read 4K Q32T1 (MB/s) | 320.6 | 271.3 -15% | 551 72% | 340.9 6% | 559 74% | 404.5 26% |
| Write Seq Q32T1 (MB/s) | 1219 | 527 -57% | 1224 0% | 1457 20% | 1104 -9% | 3019 148% |
| Read Seq Q32T1 (MB/s) | 2462 | 3175 29% | 2350 -5% | 1723 -30% | 3481 41% | 3564 45% |
| Write 4K Q8T8 (MB/s) | 1164 | |||||
| Read 4K Q8T8 (MB/s) | 1103 | |||||
| Média Total (Programa/Configurações) | 13% /
15% | 26% /
27% | -19% /
-21% | 32% /
29% | 95% /
100% |
* ... menor é melhor

| 3DMark 11 | |
| 1280x720 Performance GPU | |
| Asus FX504GD | |
| Dell XPS 13 7390 2-in-1 Core i7 | |
| HP Spectre x360 13-aw0013dx | |
| Huawei MateBook 14 KLV-W29 | |
| Dell Inspiron 15 5000 5585 | |
| Lenovo Yoga 530-14ARR-81H9000VGE | |
| Média Intel Iris Plus Graphics G7 (Ice Lake 64 EU) (2112 - 4630, n=28) | |
| Asus Zenbook 14 UX433FN-A6023T | |
| Dell XPS 13 7390 Core i7-10710U | |
| 1280x720 Performance Combined | |
| Asus FX504GD | |
| Huawei MateBook 14 KLV-W29 | |
| Dell XPS 13 7390 2-in-1 Core i7 | |
| HP Spectre x360 13-aw0013dx | |
| Asus Zenbook 14 UX433FN-A6023T | |
| Dell Inspiron 15 5000 5585 | |
| Média Intel Iris Plus Graphics G7 (Ice Lake 64 EU) (1319 - 4163, n=28) | |
| Lenovo Yoga 530-14ARR-81H9000VGE | |
| Dell XPS 13 7390 Core i7-10710U | |
| 3DMark 11 Performance | 4777 pontos | |
| 3DMark Ice Storm Standard Score | 70068 pontos | |
| 3DMark Cloud Gate Standard Score | 13766 pontos | |
| 3DMark Fire Strike Score | 2673 pontos | |
| 3DMark Time Spy Score | 771 pontos | |
Ajuda | ||
| Shadow of the Tomb Raider - 1280x720 Lowest Preset | |
| Asus GL753VD | |
| MSI PE60 2QD | |
| Acer Aspire 5 A515-52G-723L | |
| Acer Aspire 5 A515-52G-53PU | |
| Dell Inspiron 15 5000 5585 | |
| Média Intel Iris Plus Graphics G7 (Ice Lake 64 EU) (15.6 - 33, n=13) | |
| Acer Nitro 5 | |
| HP Spectre x360 13-aw0013dx | |
| Dell XPS 13 7390 Core i7-10710U | |
| Dell Inspiron 14 5000 5482 2-in-1 | |
| baixo | média | alto | ultra | |
|---|---|---|---|---|
| BioShock Infinite (2013) | 89.4 | 47.9 | 47.3 | 17.3 |
| The Witcher 3 (2015) | 43.9 | 28.9 | 13.8 | 7.2 |
| Rocket League (2017) | 87.9 | 44 | 29.7 | |
| Shadow of the Tomb Raider (2018) | 21 |
| HP Spectre x360 13-aw0013dx Iris Plus Graphics G7 (Ice Lake 64 EU), i7-1065G7, Intel Optane Memory H10 with Solid State Storage 32GB + 512GB HBRPEKNX0202A(L/H) | HP Spectre x360 13-ap0312ng UHD Graphics 620, i7-8565U, Toshiba XG5 KXG50ZNV512G | Dell XPS 13 7390 2-in-1 Core i7 Iris Plus Graphics G7 (Ice Lake 64 EU), i7-1065G7, Toshiba BG4 KBG40ZPZ512G | Asus ZenBook Flip 14 UM462DA-AI023T Vega 10, R7 3700U | Razer Blade Stealth i7-1065G7 Iris Plus Iris Plus Graphics G7 (Ice Lake 64 EU), i7-1065G7, Samsung SSD PM981 MZVLB256HAHQ | Lenovo Yoga C940-14IIL 81Q9 Iris Plus Graphics G7 (Ice Lake 64 EU), i7-1065G7, Samsung PM981a MZVLB1T0HBLR | |
|---|---|---|---|---|---|---|
| Noise | -2% | -8% | -8% | -7% | -6% | |
| desligado / ambiente * (dB) | 28.5 | 29.2 -2% | 28.1 1% | 30 -5% | 28.3 1% | 28.5 -0% |
| Idle Minimum * (dB) | 28.5 | 29.2 -2% | 28.1 1% | 30 -5% | 28.3 1% | 28.5 -0% |
| Idle Average * (dB) | 28.5 | 29.2 -2% | 28.1 1% | 30 -5% | 28.3 1% | 28.5 -0% |
| Idle Maximum * (dB) | 28.5 | 30.4 -7% | 28.1 1% | 30 -5% | 28.3 1% | 29 -2% |
| Load Average * (dB) | 28.5 | 31 -9% | 31.7 -11% | 34.2 -20% | 33.5 -18% | 33 -16% |
| Witcher 3 ultra * (dB) | 35.3 | 43.4 -23% | 34.5 2% | 40.7 -15% | ||
| Load Maximum * (dB) | 35.3 | 32.1 9% | 43.4 -23% | 37.5 -6% | 49.4 -40% | 39.5 -12% |
* ... menor é melhor
Barulho
| Ocioso |
| 28.5 / 28.5 / 28.5 dB |
| HDD |
| 28.5 dB |
| Carga |
| 28.5 / 35.3 dB |
 | ||
30 dB silencioso 40 dB(A) audível 50 dB(A) ruidosamente alto |
||
min: | ||
(+) A temperatura máxima no lado superior é 37.2 °C / 99 F, em comparação com a média de 35.4 °C / 96 F , variando de 19.6 a 60 °C para a classe Convertible.
(±) A parte inferior aquece até um máximo de 42.2 °C / 108 F, em comparação com a média de 36.9 °C / 98 F
(+) Em uso inativo, a temperatura média para o lado superior é 23.5 °C / 74 F, em comparação com a média do dispositivo de 30.3 °C / ### class_avg_f### F.
(+) Os apoios para as mãos e o touchpad são mais frios que a temperatura da pele, com um máximo de 24.6 °C / 76.3 F e, portanto, são frios ao toque.
(+) A temperatura média da área do apoio para as mãos de dispositivos semelhantes foi 28 °C / 82.4 F (+3.4 °C / 6.1 F).
HP Spectre x360 13-aw0013dx análise de áudio
(±) | o volume do alto-falante é médio, mas bom (###valor### dB)
Graves 100 - 315Hz
(±) | graves reduzidos - em média 13.2% menor que a mediana
(±) | a linearidade dos graves é média (12.8% delta para a frequência anterior)
Médios 400 - 2.000 Hz
(+) | médios equilibrados - apenas 2.3% longe da mediana
(+) | médios são lineares (3.6% delta para frequência anterior)
Altos 2 - 16 kHz
(+) | agudos equilibrados - apenas 2.7% longe da mediana
(+) | os máximos são lineares (6.9% delta da frequência anterior)
Geral 100 - 16.000 Hz
(±) | a linearidade do som geral é média (16.7% diferença em relação à mediana)
Comparado com a mesma classe
» 31% de todos os dispositivos testados nesta classe foram melhores, 5% semelhantes, 64% piores
» O melhor teve um delta de 6%, a média foi 20%, o pior foi 57%
Comparado com todos os dispositivos testados
» 29% de todos os dispositivos testados foram melhores, 7% semelhantes, 64% piores
» O melhor teve um delta de 4%, a média foi 24%, o pior foi 134%
Apple MacBook 12 (Early 2016) 1.1 GHz análise de áudio
(+) | os alto-falantes podem tocar relativamente alto (###valor### dB)
Graves 100 - 315Hz
(±) | graves reduzidos - em média 11.3% menor que a mediana
(±) | a linearidade dos graves é média (14.2% delta para a frequência anterior)
Médios 400 - 2.000 Hz
(+) | médios equilibrados - apenas 2.4% longe da mediana
(+) | médios são lineares (5.5% delta para frequência anterior)
Altos 2 - 16 kHz
(+) | agudos equilibrados - apenas 2% longe da mediana
(+) | os máximos são lineares (4.5% delta da frequência anterior)
Geral 100 - 16.000 Hz
(+) | o som geral é linear (10.2% diferença em relação à mediana)
Comparado com a mesma classe
» 7% de todos os dispositivos testados nesta classe foram melhores, 2% semelhantes, 91% piores
» O melhor teve um delta de 5%, a média foi 18%, o pior foi 53%
Comparado com todos os dispositivos testados
» 5% de todos os dispositivos testados foram melhores, 1% semelhantes, 94% piores
» O melhor teve um delta de 4%, a média foi 24%, o pior foi 134%
| desligado | |
| Ocioso | |
| Carga |
|
Key:
min: | |
| HP Spectre x360 13-aw0013dx i7-1065G7, Iris Plus Graphics G7 (Ice Lake 64 EU), Intel Optane Memory H10 with Solid State Storage 32GB + 512GB HBRPEKNX0202A(L/H), IPS, 1920x1080, 13.3" | HP Spectre x360 13-ap0312ng i7-8565U, UHD Graphics 620, Toshiba XG5 KXG50ZNV512G, IPS, 1920x1080, 13.3" | Dell XPS 13 7390 2-in-1 Core i7 i7-1065G7, Iris Plus Graphics G7 (Ice Lake 64 EU), Toshiba BG4 KBG40ZPZ512G, IPS, 1920x1200, 13.4" | Asus ZenBook Flip 14 UM462DA-AI023T R7 3700U, Vega 10, , IPS, 1920x1080, 14" | Razer Blade Stealth i7-1065G7 Iris Plus i7-1065G7, Iris Plus Graphics G7 (Ice Lake 64 EU), Samsung SSD PM981 MZVLB256HAHQ, IPS, 1920x1080, 13.3" | Lenovo Yoga C940-14IIL 81Q9 i7-1065G7, Iris Plus Graphics G7 (Ice Lake 64 EU), Samsung PM981a MZVLB1T0HBLR, IPS, 3840x2160, 14" | |
|---|---|---|---|---|---|---|
| Power Consumption | -7% | -6% | -4% | -38% | -57% | |
| Idle Minimum * (Watt) | 3.9 | 4.32 -11% | 2.6 33% | 3.7 5% | 5.9 -51% | 5.6 -44% |
| Idle Average * (Watt) | 6.3 | 6.84 -9% | 5.3 16% | 6.9 -10% | 8.1 -29% | 10.5 -67% |
| Idle Maximum * (Watt) | 6.8 | 8.64 -27% | 7 -3% | 9.4 -38% | 11.2 -65% | 12 -76% |
| Load Average * (Watt) | 32.6 | 31.8 2% | 43.1 -32% | 34 -4% | 44.3 -36% | 53.3 -63% |
| Witcher 3 ultra * (Watt) | 25.6 | 43.1 -68% | 41.9 -64% | 46.9 -83% | ||
| Load Maximum * (Watt) | 59 | 53 10% | 49 17% | 44 25% | 50.2 15% | 64.6 -9% |
* ... menor é melhor
| HP Spectre x360 13-aw0013dx i7-1065G7, Iris Plus Graphics G7 (Ice Lake 64 EU), 60 Wh | HP Spectre x360 13-ap0312ng i7-8565U, UHD Graphics 620, 61 Wh | Dell XPS 13 7390 2-in-1 Core i7 i7-1065G7, Iris Plus Graphics G7 (Ice Lake 64 EU), 51 Wh | Asus ZenBook Flip 14 UM462DA-AI023T R7 3700U, Vega 10, 42 Wh | Razer Blade Stealth i7-1065G7 Iris Plus i7-1065G7, Iris Plus Graphics G7 (Ice Lake 64 EU), 53.1 Wh | Lenovo Yoga C940-14IIL 81Q9 i7-1065G7, Iris Plus Graphics G7 (Ice Lake 64 EU), 60 Wh | |
|---|---|---|---|---|---|---|
| Duração da bateria | -13% | -9% | -24% | -2% | -26% | |
| Reader / Idle (h) | 37.1 | |||||
| WiFi v1.3 (h) | 9.9 | 8.9 -10% | 9 -9% | 7.5 -24% | 9.7 -2% | 7.3 -26% |
| Load (h) | 2.7 | 2.3 -15% |
Pro
Contra
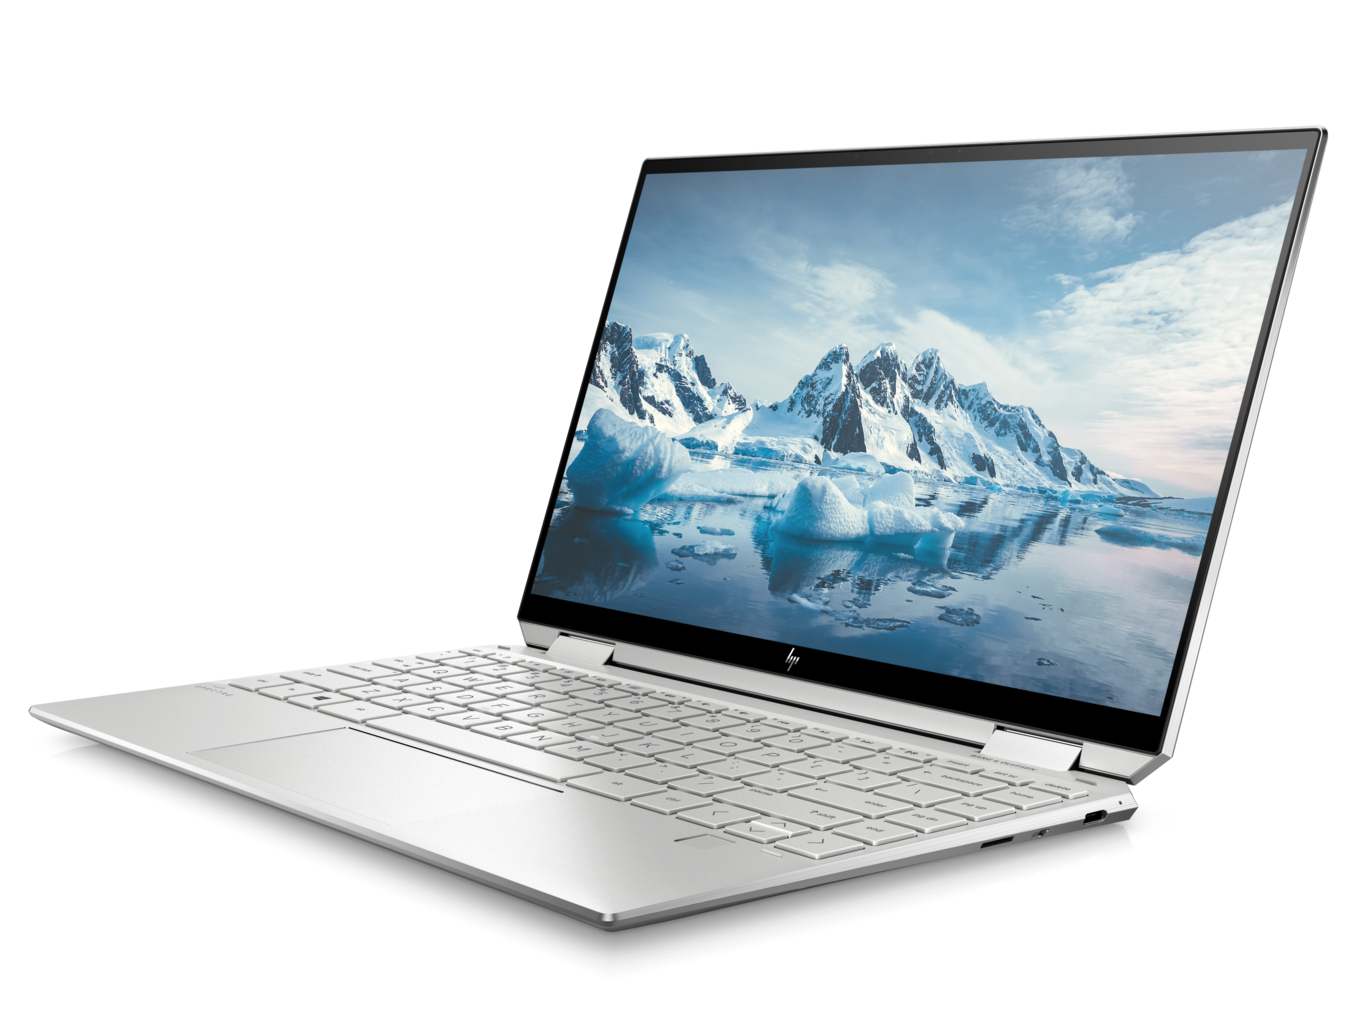
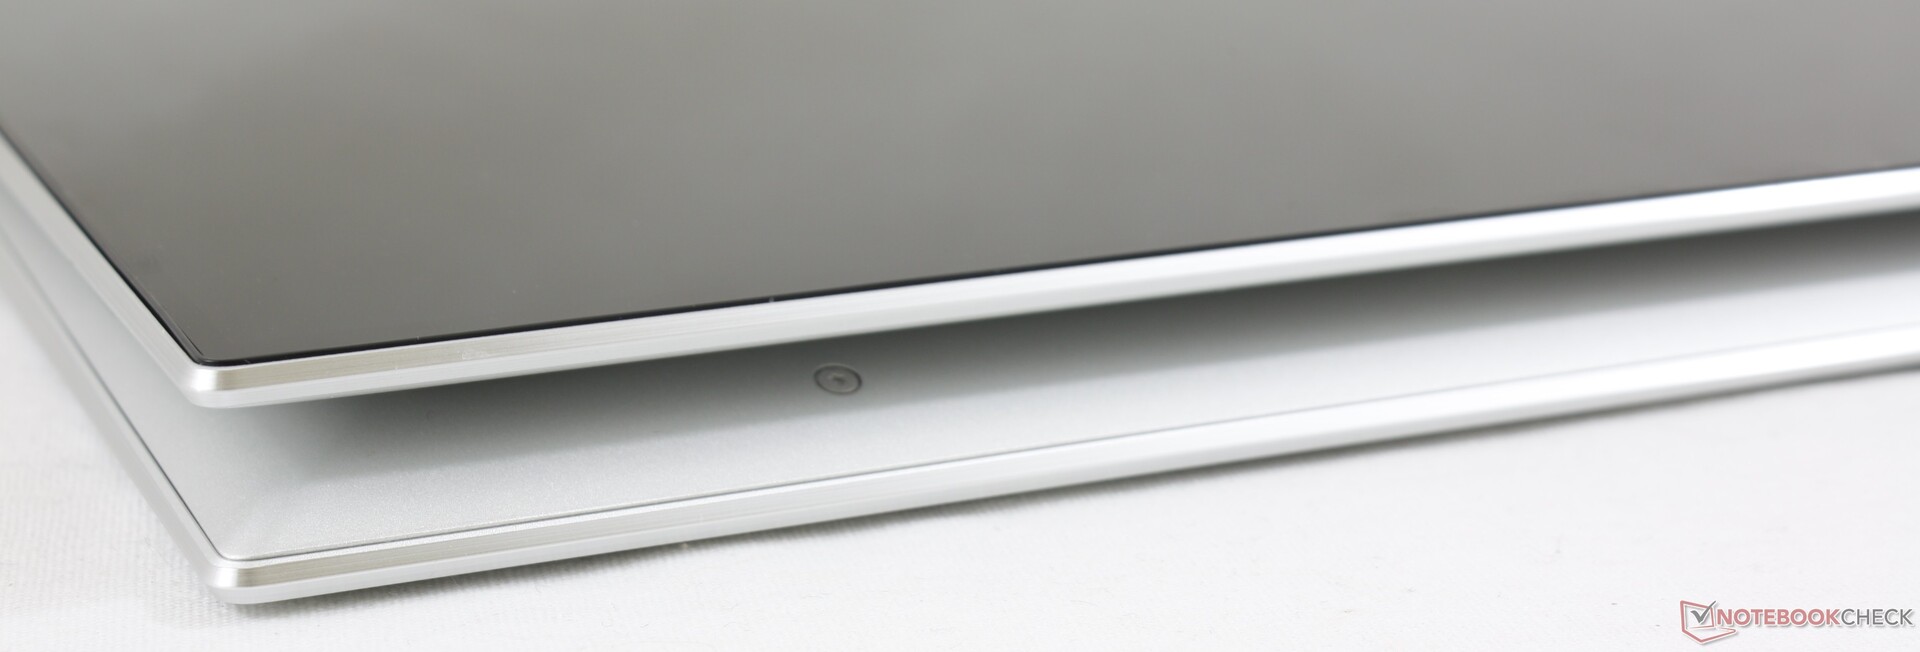
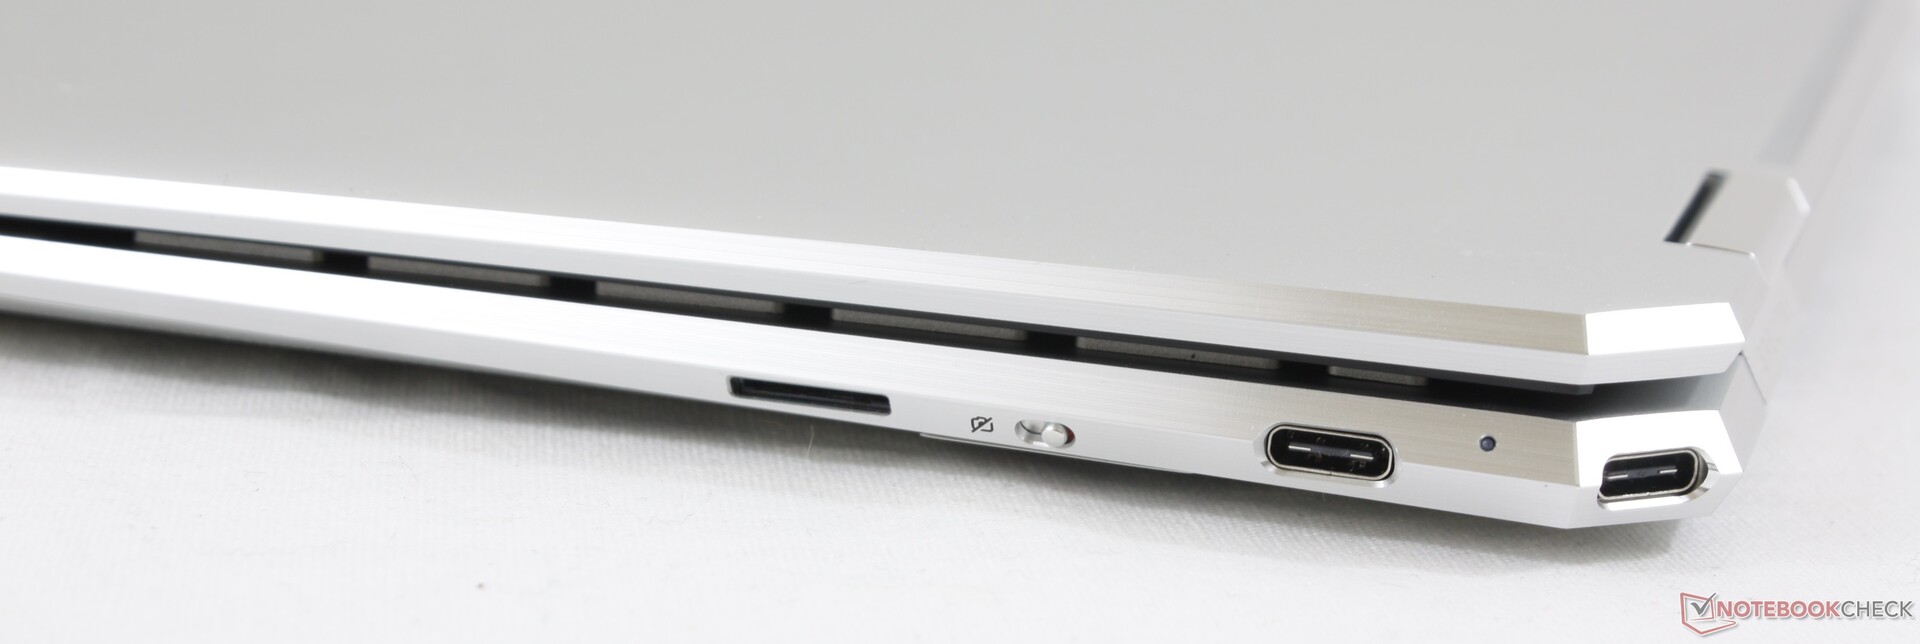
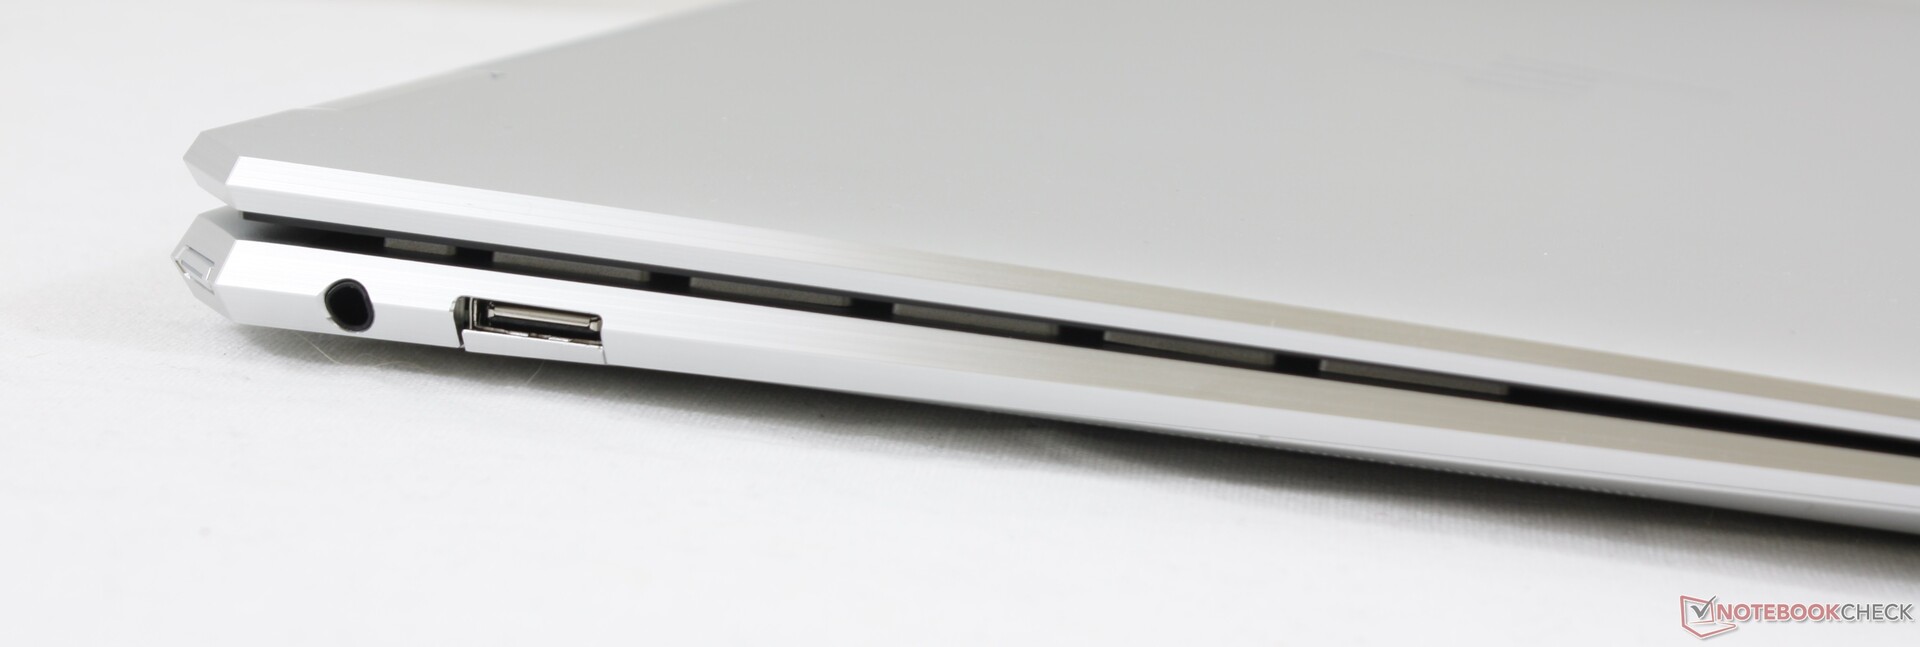
Se você está procurando um portátil conversível de 13 polegadas de gama alta, com a mais recente CPU Intel de 10a geração, atualmente você tem duas opções principais: o HP Spectre x360 13 ou o Dell XPS 13 7390 2-em-1. O dispositivo HP se sente mais forte na mão, com armazenamento M.2 removível, bateria maior, WWAN opcional e uma porta USB tipo A em tamanho normal - recursos que estão ausentes na alternativa da Dell. Se você valoriza mais esses extras, encontrará mais valor no Spectre x360 13.
O portátil HP cai de cara quando se trata de explorar o máximo de desempenho possível do processador Ice Lake. As velocidades flutuantes da CPU, as velocidades da GPU, o ruído do ventilador, o consumo de energia e as taxas de quadros durante os jogos são representações ruins do que o Intel Ice Lake é capaz. Sabemos que o Core i7-1065G7 pode ter um desempenho melhor, como exemplificado pelo XPS 13 7390 2-em-1 ou Yoga C940 e seus números de desempenho mais consistentes. Ainda é uma atualização sobre o Whiskey Lake-U Spectre x360 13 especialmente em termos de portabilidade e brilho da tela, mas a diferença de desempenho entre eles é menor do que esperávamos.
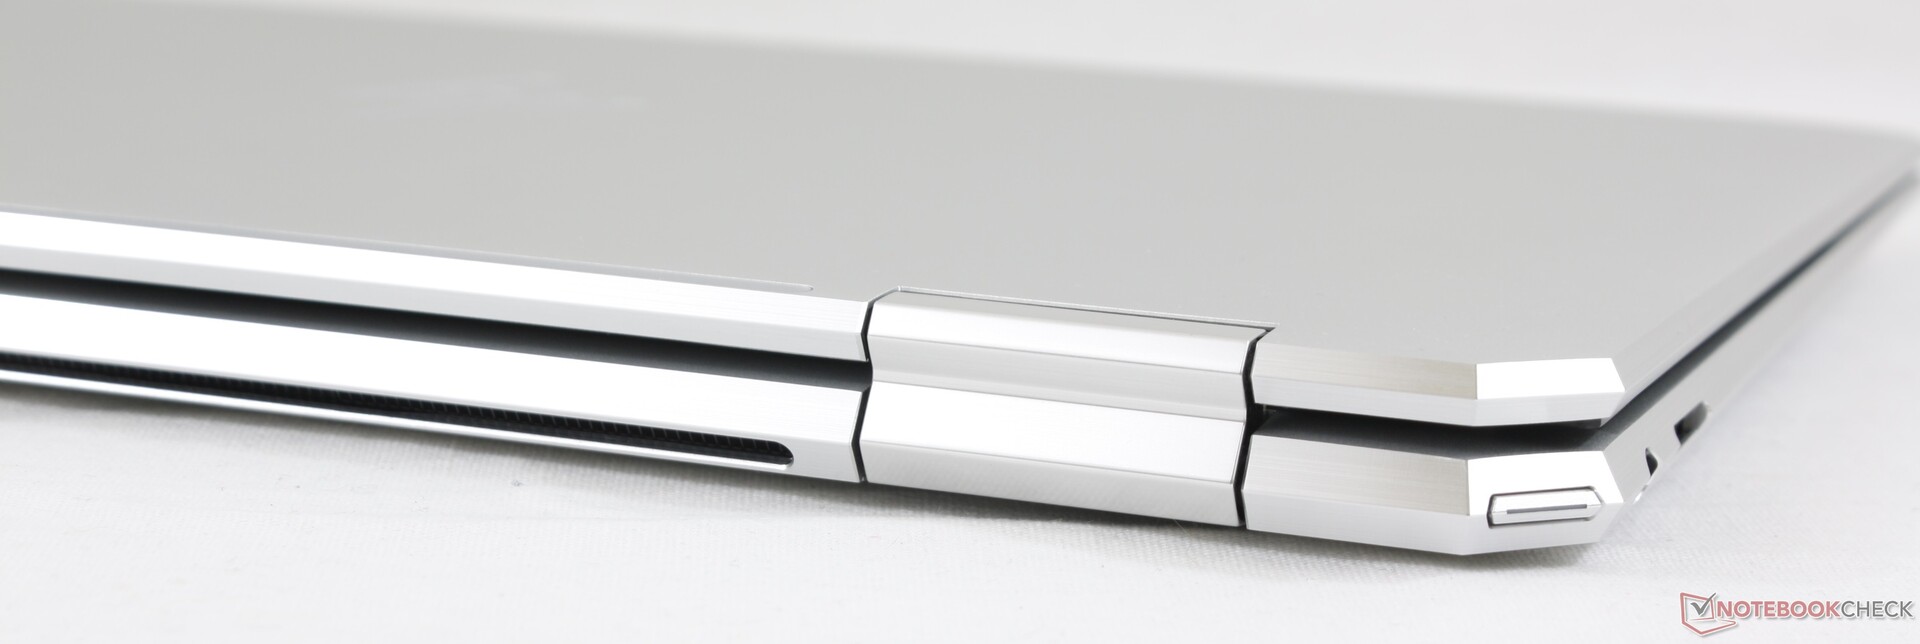
Excelente chassi agora menor do que antes e com mais recursos do que a maioria dos outros conversíveis de consumo. No entanto, a implementação do Ice Lake pela HP está abaixo da média e é definitivamente uma a evitar se você for um jogador casual.
HP Spectre x360 13-aw0013dx
- 12/27/2019 v7 (old)
Allen Ngo
Price comparison
