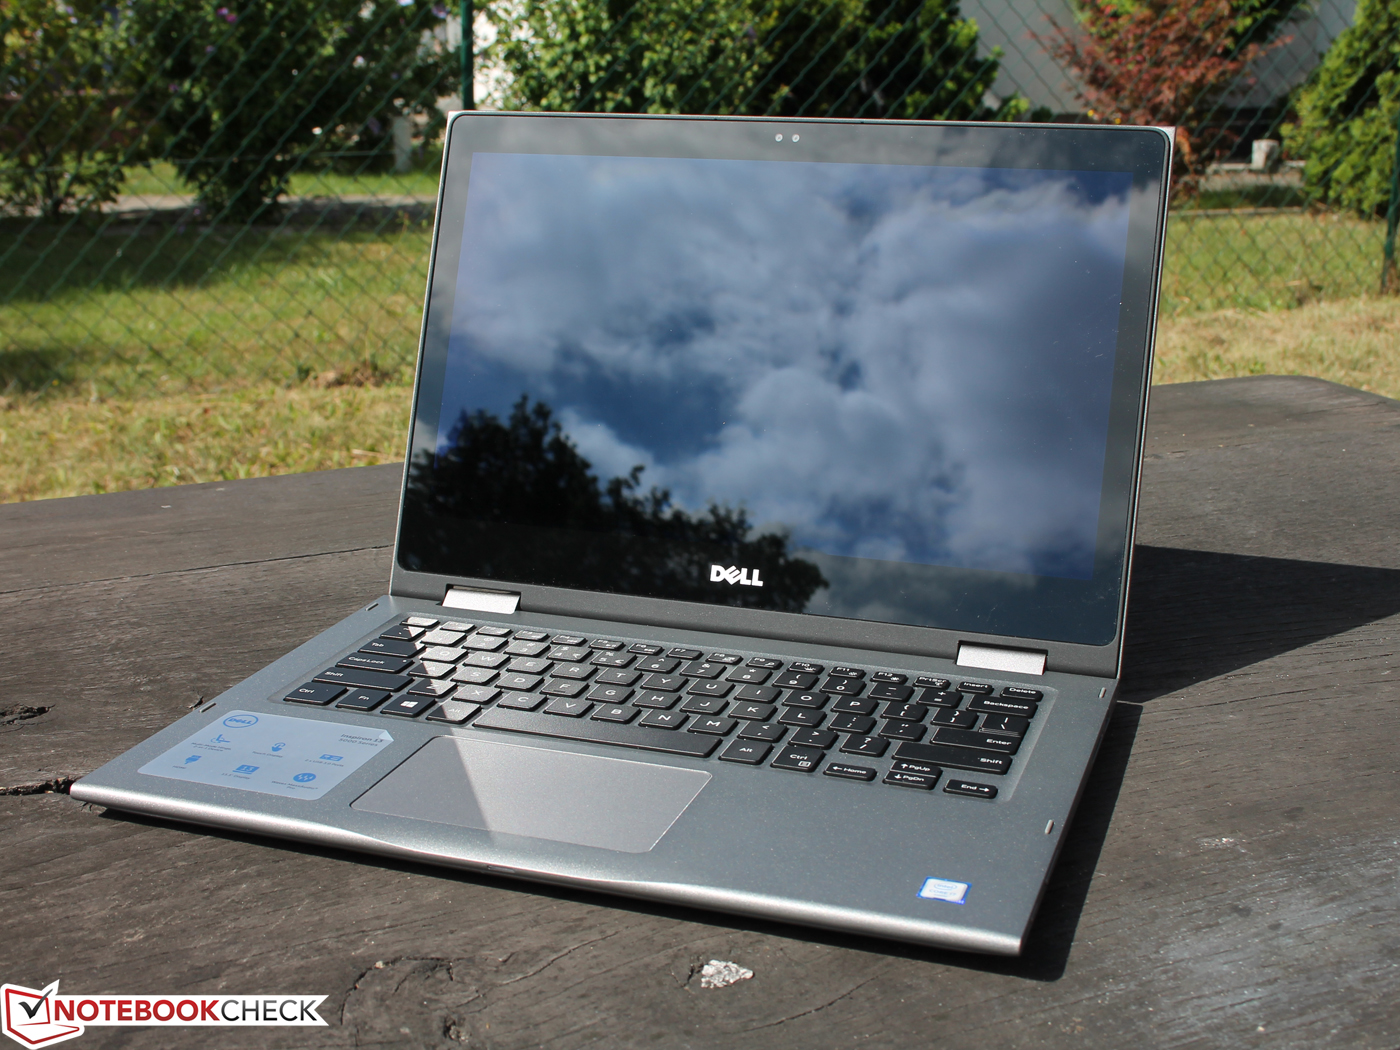
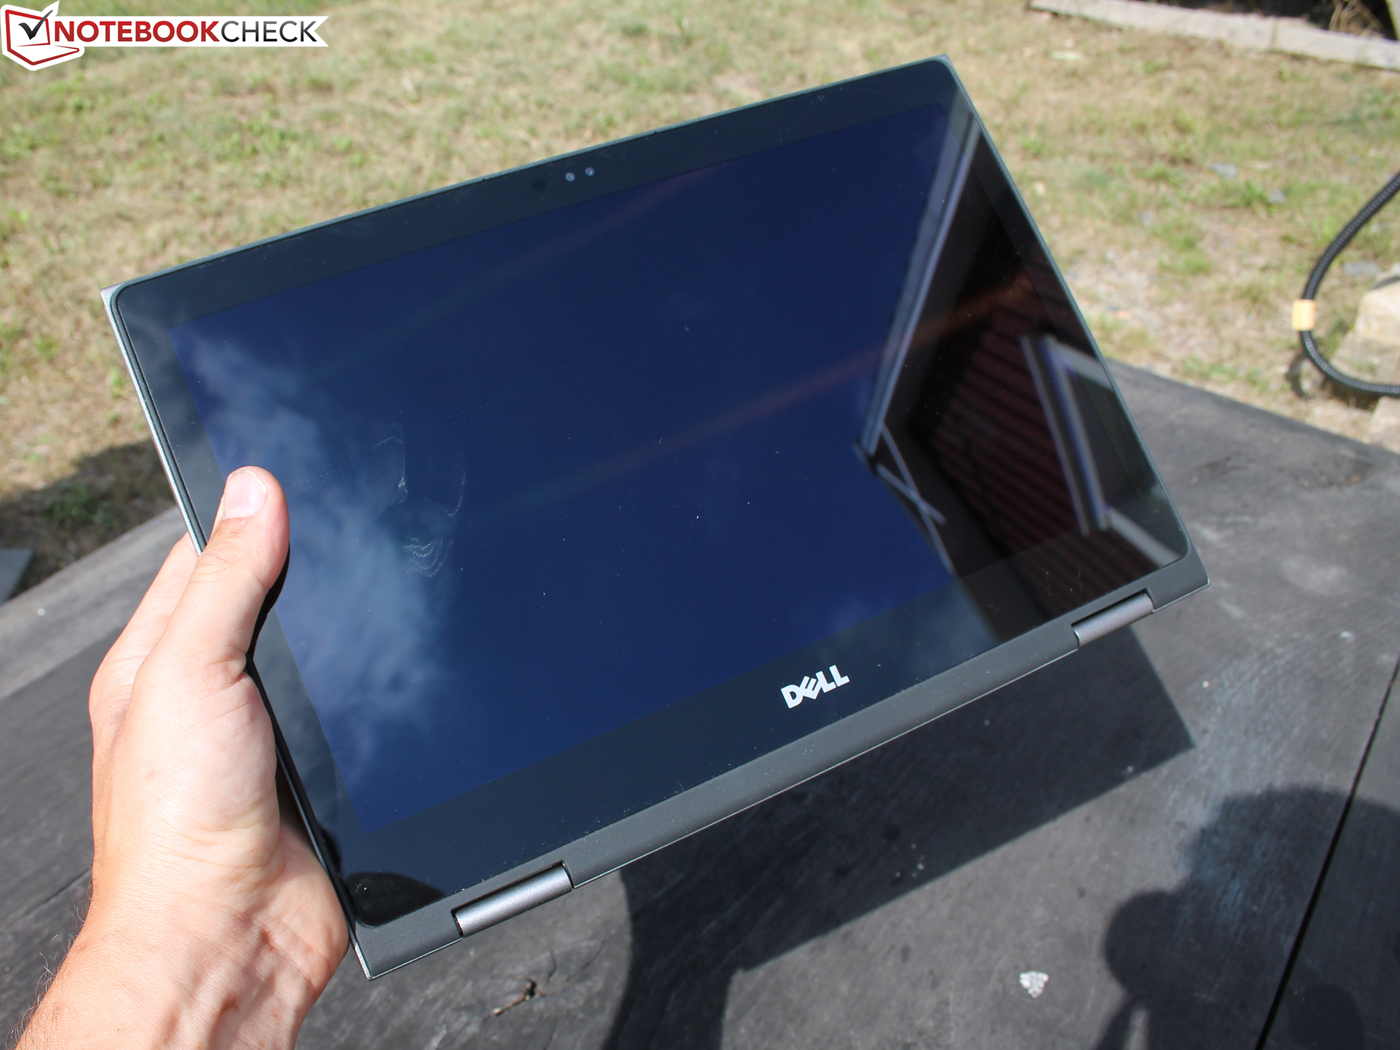
Breve Análise do Conversível Dell Inspiron 13 5379 (i5-8250U, UHD 620)

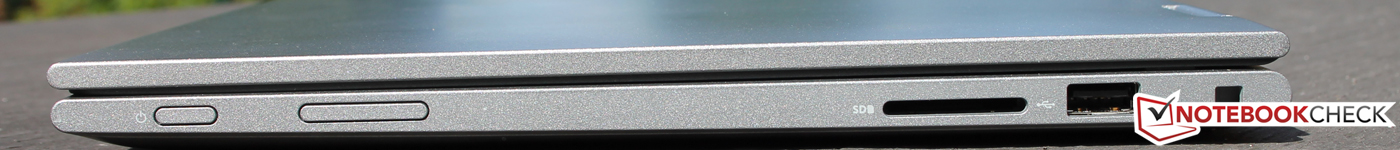
| SD Card Reader | |
| average JPG Copy Test (av. of 3 runs) | |
| Lenovo Miix 520-12IKB 81CG | |
| Dell Inspiron 13-5379-9573 (Toshiba Exceria Pro SDXC 64 GB UHS-II) | |
| Acer Spin 5 SP513-52N-54SF (Toshiba Exceria Pro SDXC 64 GB UHS-II) | |
| Dell Inspiron 13 5368 (Toshiba Exceria Pro SDXC 64 GB UHS-II) | |
| maximum AS SSD Seq Read Test (1GB) | |
| Lenovo Miix 520-12IKB 81CG | |
| Dell Inspiron 13-5379-9573 (Toshiba Exceria Pro SDXC 64 GB UHS-II) | |
| Acer Spin 5 SP513-52N-54SF (Toshiba Exceria Pro SDXC 64 GB UHS-II) | |
| Dell Inspiron 13 5368 (Toshiba Exceria Pro SDXC 64 GB UHS-II) | |
| Networking | |
| iperf3 transmit AX12 | |
| Lenovo Yoga 720-13IKB | |
| Dell Inspiron 13-5379-9573 | |
| Acer Spin 5 SP513-52N-54SF | |
| Lenovo Miix 520-12IKB 81CG | |
| iperf3 receive AX12 | |
| Dell Inspiron 13-5379-9573 | |
| Lenovo Yoga 720-13IKB | |
| Lenovo Miix 520-12IKB 81CG | |
| Acer Spin 5 SP513-52N-54SF | |
| |||||||||||||||||||||||||
iluminação: 81 %
iluminação com acumulador: 276 cd/m²
Contraste: 856:1 (Preto: 0.32 cd/m²)
ΔE ColorChecker Calman: 5.57 | ∀{0.5-29.43 Ø4.71}
ΔE Greyscale Calman: 4.66 | ∀{0.09-98 Ø4.96}
61% sRGB (Argyll 1.6.3 3D)
39% AdobeRGB 1998 (Argyll 1.6.3 3D)
42.6% AdobeRGB 1998 (Argyll 3D)
61.7% sRGB (Argyll 3D)
41.2% Display P3 (Argyll 3D)
Gamma: 2.53
CCT: 7010 K
| Dell Inspiron 13-5379-9573 BOE BOE06A7, , 1920x1080, 13.3" | Lenovo Yoga 720-13IKB BOE CQ NV133FHM-N61, , 1920x1080, 13.3" | Acer Spin 5 SP513-52N-54SF LC133LF102, , 1920x1080, 13.3" | Lenovo Miix 520-12IKB 81CG Unknown, , 1920x1200, 12.2" | Dell Inspiron 13 5368 AUO B133HAB, , 1920x1080, 13.3" | |
|---|---|---|---|---|---|
| Display | 53% | 62% | 52% | -6% | |
| Display P3 Coverage (%) | 41.2 | 67.8 65% | 69.8 69% | 64.4 56% | 38.88 -6% |
| sRGB Coverage (%) | 61.7 | 88.2 43% | 94.6 53% | 90.8 47% | 57.7 -6% |
| AdobeRGB 1998 Coverage (%) | 42.6 | 64.4 51% | 69.3 63% | 65.4 54% | 40.17 -6% |
| Response Times | -7% | 5% | 18% | 4% | |
| Response Time Grey 50% / Grey 80% * (ms) | 45 ? | 48 ? -7% | 49 ? -9% | 35.6 ? 21% | 44 ? 2% |
| Response Time Black / White * (ms) | 33 ? | 35 ? -6% | 27 ? 18% | 28 ? 15% | 31 ? 6% |
| PWM Frequency (Hz) | 192 ? | 350 ? | 1000 ? | 198.4 ? | |
| Screen | 16% | 31% | -3% | 7% | |
| Brightness middle (cd/m²) | 274 | 297 8% | 295 8% | 348.8 27% | 240 -12% |
| Brightness (cd/m²) | 272 | 277 2% | 276 1% | 339 25% | 229 -16% |
| Brightness Distribution (%) | 81 | 87 7% | 88 9% | 87 7% | 92 14% |
| Black Level * (cd/m²) | 0.32 | 0.33 -3% | 0.27 16% | 0.4 -25% | 0.24 25% |
| Contrast (:1) | 856 | 900 5% | 1093 28% | 872 2% | 1000 17% |
| Colorchecker dE 2000 * | 5.57 | 4.93 11% | 2.97 47% | 7 -26% | 4.75 15% |
| Colorchecker dE 2000 max. * | 13.48 | 8.39 38% | 5.67 58% | 16.2 -20% | 9.09 33% |
| Greyscale dE 2000 * | 4.66 | 4.84 -4% | 3.12 33% | 10.1 -117% | 4.3 8% |
| Gamma | 2.53 87% | 2.5 88% | 2.45 90% | 2.22 99% | 2.5 88% |
| CCT | 7010 93% | 6894 94% | 6676 97% | 9065 72% | 5893 110% |
| Color Space (Percent of AdobeRGB 1998) (%) | 39 | 58 49% | 62 59% | 58.7 51% | 36.79 -6% |
| Color Space (Percent of sRGB) (%) | 61 | 88 44% | 94 54% | 90.9 49% | 57.39 -6% |
| Média Total (Programa/Configurações) | 21% /
20% | 33% /
34% | 22% /
11% | 2% /
4% |
* ... menor é melhor
Exibir tempos de resposta
| ↔ Tempo de resposta preto para branco | ||
|---|---|---|
| 33 ms ... ascensão ↗ e queda ↘ combinadas | ↗ 20 ms ascensão | 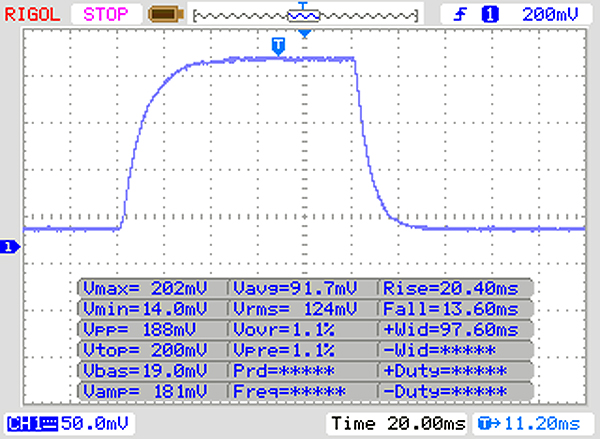 |
| ↘ 13 ms queda | ||
| A tela mostra taxas de resposta lentas em nossos testes e será insatisfatória para os jogadores. Em comparação, todos os dispositivos testados variam de 0.1 (mínimo) a 240 (máximo) ms. » 89 % de todos os dispositivos são melhores. Isso significa que o tempo de resposta medido é pior que a média de todos os dispositivos testados (19.8 ms). | ||
| ↔ Tempo de resposta 50% cinza a 80% cinza | ||
| 45 ms ... ascensão ↗ e queda ↘ combinadas | ↗ 24 ms ascensão | 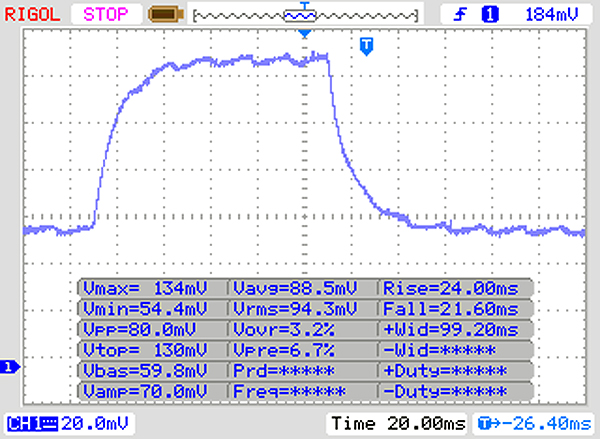 |
| ↘ 21 ms queda | ||
| A tela mostra taxas de resposta lentas em nossos testes e será insatisfatória para os jogadores. Em comparação, todos os dispositivos testados variam de 0.165 (mínimo) a 636 (máximo) ms. » 77 % de todos os dispositivos são melhores. Isso significa que o tempo de resposta medido é pior que a média de todos os dispositivos testados (31 ms). | ||
Cintilação da tela / PWM (modulação por largura de pulso)
| Tela tremeluzindo/PWM detectado | 192 Hz | ≤ 90 % configuração de brilho | 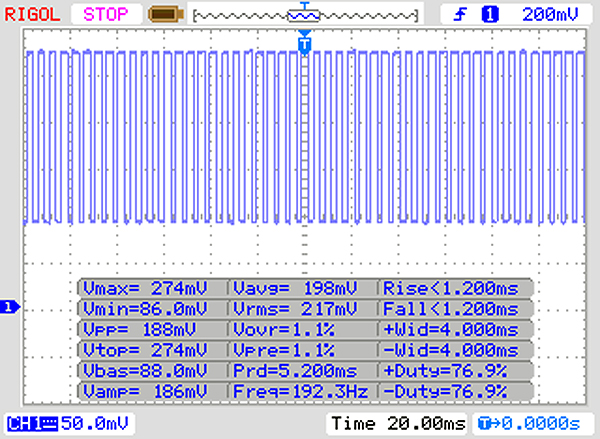 |
A luz de fundo da tela pisca em 192 Hz (pior caso, por exemplo, utilizando PWM) Cintilação detectada em uma configuração de brilho de 90 % e abaixo. Não deve haver cintilação ou PWM acima desta configuração de brilho. A frequência de 192 Hz é relativamente baixa, portanto, usuários sensíveis provavelmente notarão cintilação e sentirão fadiga ocular na configuração de brilho indicada e abaixo. [pwm_comparison] Em comparação: 52 % de todos os dispositivos testados não usam PWM para escurecer a tela. Se PWM foi detectado, uma média de 7754 (mínimo: 5 - máximo: 343500) Hz foi medida. | |||
| Cinebench R15 | |
| CPU Single 64Bit | |
| Acer Spin 5 SP513-52N-54SF | |
| Lenovo Miix 520-12IKB 81CG | |
| Dell Inspiron 13-5379-9573 | |
| Dell Inspiron 13 5368 | |
| Lenovo Yoga 720-13IKB | |
| CPU Multi 64Bit | |
| Dell Inspiron 13-5379-9573 | |
| Lenovo Miix 520-12IKB 81CG | |
| Acer Spin 5 SP513-52N-54SF | |
| Lenovo Yoga 720-13IKB | |
| Dell Inspiron 13 5368 | |
| PCMark 8 | |
| Home Score Accelerated v2 | |
| Lenovo Yoga 720-13IKB | |
| Lenovo Miix 520-12IKB 81CG | |
| Dell Inspiron 13 5368 | |
| Dell Inspiron 13-5379-9573 | |
| Acer Spin 5 SP513-52N-54SF | |
| Work Score Accelerated v2 | |
| Lenovo Yoga 720-13IKB | |
| Dell Inspiron 13-5379-9573 | |
| Dell Inspiron 13 5368 | |
| Acer Spin 5 SP513-52N-54SF | |
| Lenovo Miix 520-12IKB 81CG | |
| PCMark 8 Home Score Accelerated v2 | 3592 pontos | |
| PCMark 8 Work Score Accelerated v2 | 4621 pontos | |
Ajuda | ||
| Dell Inspiron 13-5379-9573 Micron 1100 MTFDDAV256TBN | Lenovo Yoga 720-13IKB Toshiba XG4 NVMe (THNSN5512GPUK) | Acer Spin 5 SP513-52N-54SF Micron 1100 MTFDDAV256TBN | Dell Inspiron 13 5368 Toshiba THNSNK256GCS8 | |
|---|---|---|---|---|
| CrystalDiskMark 3.0 | 167% | 58% | 43% | |
| Read Seq (MB/s) | 447.9 | 1345 200% | 462.7 3% | 479 7% |
| Write Seq (MB/s) | 304.8 | 569 87% | 439.9 44% | 270.1 -11% |
| Read 512 (MB/s) | 293.7 | 1041 254% | 325.2 11% | 428.3 46% |
| Write 512 (MB/s) | 157 | 547 248% | 361.9 131% | 267.9 71% |
| Read 4k (MB/s) | 14.03 | 38.42 174% | 27.52 96% | 23.77 69% |
| Write 4k (MB/s) | 63.3 | 127.1 101% | 91.6 45% | 81.4 29% |
| Read 4k QD32 (MB/s) | 165.9 | 416.4 151% | 247.3 49% | 333.6 101% |
| Write 4k QD32 (MB/s) | 155.1 | 337.5 118% | 292 88% | 200.9 30% |

| 3DMark 11 - 1280x720 Performance GPU | |
| Lenovo Yoga 720-13IKB | |
| Lenovo Miix 520-12IKB 81CG | |
| Acer Spin 5 SP513-52N-54SF | |
| Dell Inspiron 13-5379-9573 | |
| Dell Inspiron 13 5368 | |
| 3DMark | |
| 1280x720 Cloud Gate Standard Graphics | |
| Lenovo Yoga 720-13IKB | |
| Acer Spin 5 SP513-52N-54SF | |
| Lenovo Miix 520-12IKB 81CG | |
| Dell Inspiron 13-5379-9573 | |
| Dell Inspiron 13 5368 | |
| 1920x1080 Fire Strike Graphics | |
| Lenovo Yoga 720-13IKB | |
| Acer Spin 5 SP513-52N-54SF | |
| Lenovo Miix 520-12IKB 81CG | |
| Dell Inspiron 13-5379-9573 | |
| 3DMark 11 Performance | 1643 pontos | |
| 3DMark Cloud Gate Standard Score | 7244 pontos | |
| 3DMark Fire Strike Score | 876 pontos | |
Ajuda | ||
| BioShock Infinite | |
| 1920x1080 Ultra Preset, DX11 (DDOF) | |
| Lenovo Yoga 720-13IKB | |
| Acer Spin 5 SP513-52N-54SF | |
| Dell Inspiron 13-5379-9573 | |
| Lenovo Miix 520-12IKB 81CG | |
| 1366x768 High Preset | |
| Dell Inspiron 13 5368 | |
| Lenovo Yoga 720-13IKB | |
| Acer Spin 5 SP513-52N-54SF | |
| Lenovo Miix 520-12IKB 81CG | |
| Dell Inspiron 13-5379-9573 | |
| 1366x768 Medium Preset | |
| Dell Inspiron 13 5368 | |
| Lenovo Yoga 720-13IKB | |
| Acer Spin 5 SP513-52N-54SF | |
| Lenovo Miix 520-12IKB 81CG | |
| Dell Inspiron 13-5379-9573 | |
| 1280x720 Very Low Preset | |
| Lenovo Yoga 720-13IKB | |
| Dell Inspiron 13 5368 | |
| Acer Spin 5 SP513-52N-54SF | |
| Lenovo Miix 520-12IKB 81CG | |
| Dell Inspiron 13-5379-9573 | |
| Thief | |
| 1366x768 High Preset AA:FXAA & Low SS AF:4x | |
| Dell Inspiron 13 5368 | |
| 1366x768 Normal Preset AA:FX | |
| Dell Inspiron 13 5368 | |
| Dell Inspiron 13-5379-9573 | |
| 1024x768 Very Low Preset | |
| Dell Inspiron 13 5368 | |
| Dell Inspiron 13-5379-9573 | |
| Rise of the Tomb Raider | |
| 1366x768 Medium Preset AF:2x | |
| Dell Inspiron 13-5379-9573 | |
| Dell Inspiron 13 5368 | |
| Lenovo Miix 520-12IKB 81CG | |
| 1024x768 Lowest Preset | |
| Lenovo Miix 520-12IKB 81CG | |
| Dell Inspiron 13-5379-9573 | |
| Dell Inspiron 13 5368 | |
| baixo | média | alto | ultra | |
|---|---|---|---|---|
| BioShock Infinite (2013) | 49.4 | 27.1 | 21.8 | 7.6 |
| Thief (2014) | 22.8 | 11.5 | ||
| Rise of the Tomb Raider (2016) | 20.8 | 11.7 |
Barulho
| Ocioso |
| 30.1 / 30.1 / 30.1 dB |
| Carga |
| 33 / 35 dB |
 | ||
30 dB silencioso 40 dB(A) audível 50 dB(A) ruidosamente alto |
||
min: | ||
(±) A temperatura máxima no lado superior é 43.2 °C / 110 F, em comparação com a média de 35.4 °C / 96 F , variando de 19.6 a 60 °C para a classe Convertible.
(-) A parte inferior aquece até um máximo de 57.8 °C / 136 F, em comparação com a média de 36.9 °C / 98 F
(+) Em uso inativo, a temperatura média para o lado superior é 29.9 °C / 86 F, em comparação com a média do dispositivo de 30.3 °C / ### class_avg_f### F.
(+) Os apoios para as mãos e o touchpad são mais frios que a temperatura da pele, com um máximo de 28.7 °C / 83.7 F e, portanto, são frios ao toque.
(±) A temperatura média da área do apoio para as mãos de dispositivos semelhantes foi 28 °C / 82.4 F (-0.7 °C / -1.3 F).
Dell Inspiron 13-5379-9573 análise de áudio
(-) | alto-falantes não muito altos (###valor### dB)
Graves 100 - 315Hz
(±) | graves reduzidos - em média 10.2% menor que a mediana
(±) | a linearidade dos graves é média (7.6% delta para a frequência anterior)
Médios 400 - 2.000 Hz
(±) | médios mais altos - em média 5.3% maior que a mediana
(±) | a linearidade dos médios é média (7.7% delta para frequência anterior)
Altos 2 - 16 kHz
(±) | máximos mais altos - em média 5.1% maior que a mediana
(+) | os máximos são lineares (6% delta da frequência anterior)
Geral 100 - 16.000 Hz
(±) | a linearidade do som geral é média (21.3% diferença em relação à mediana)
Comparado com a mesma classe
» 57% de todos os dispositivos testados nesta classe foram melhores, 12% semelhantes, 32% piores
» O melhor teve um delta de 6%, a média foi 20%, o pior foi 57%
Comparado com todos os dispositivos testados
» 59% de todos os dispositivos testados foram melhores, 7% semelhantes, 33% piores
» O melhor teve um delta de 4%, a média foi 23%, o pior foi 134%
Apple MacBook 12 (Early 2016) 1.1 GHz análise de áudio
(+) | os alto-falantes podem tocar relativamente alto (###valor### dB)
Graves 100 - 315Hz
(±) | graves reduzidos - em média 11.3% menor que a mediana
(±) | a linearidade dos graves é média (14.2% delta para a frequência anterior)
Médios 400 - 2.000 Hz
(+) | médios equilibrados - apenas 2.4% longe da mediana
(+) | médios são lineares (5.5% delta para frequência anterior)
Altos 2 - 16 kHz
(+) | agudos equilibrados - apenas 2% longe da mediana
(+) | os máximos são lineares (4.5% delta da frequência anterior)
Geral 100 - 16.000 Hz
(+) | o som geral é linear (10.2% diferença em relação à mediana)
Comparado com a mesma classe
» 7% de todos os dispositivos testados nesta classe foram melhores, 2% semelhantes, 90% piores
» O melhor teve um delta de 5%, a média foi 18%, o pior foi 53%
Comparado com todos os dispositivos testados
» 5% de todos os dispositivos testados foram melhores, 1% semelhantes, 94% piores
» O melhor teve um delta de 4%, a média foi 23%, o pior foi 134%
| desligado | |
| Ocioso | |
| Carga |
|
Key:
min: | |
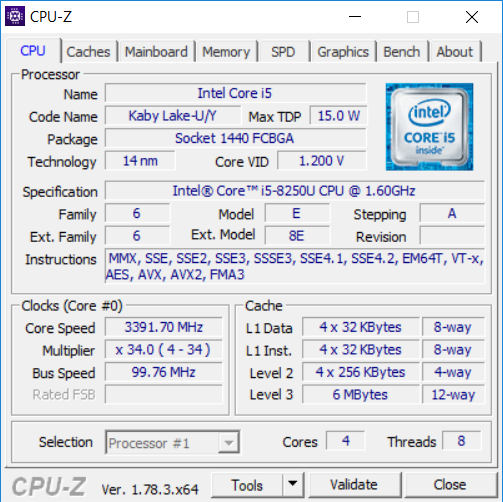
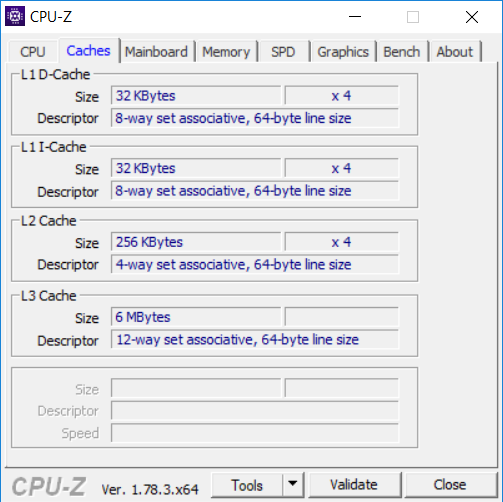
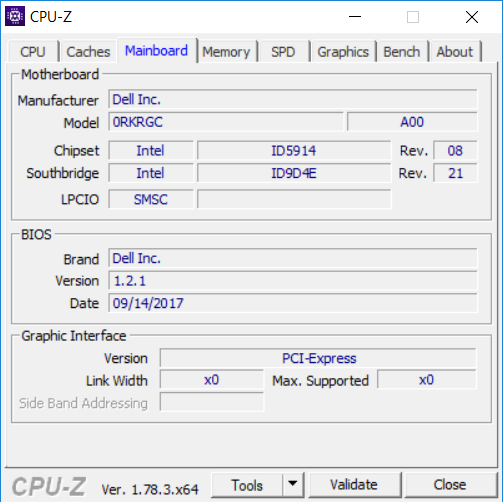
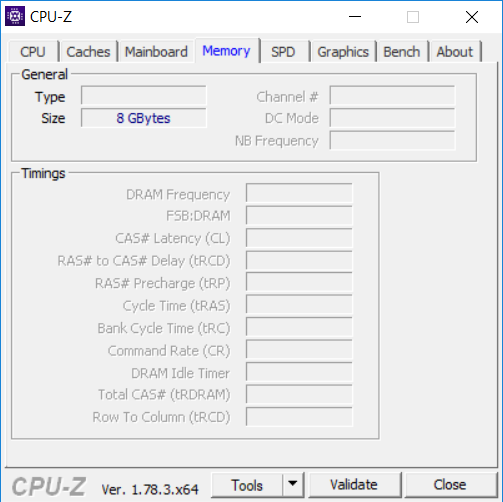
| Dell Inspiron 13-5379-9573 i5-8250U, UHD Graphics 620, Micron 1100 MTFDDAV256TBN, IPS, 1920x1080, 13.3" | Lenovo Yoga 720-13IKB i5-8550U, UHD Graphics 620, Toshiba XG4 NVMe (THNSN5512GPUK), IPS, 1920x1080, 13.3" | Acer Spin 5 SP513-52N-54SF i5-8250U, UHD Graphics 620, Micron 1100 MTFDDAV256TBN, IPS, 1920x1080, 13.3" | Lenovo Miix 520-12IKB 81CG i5-8250U, UHD Graphics 620, Samsung PM961 MZVLW256HEHP, IPS, 1920x1200, 12.2" | Dell Inspiron 13 5368 6500U, HD Graphics 520, Toshiba THNSNK256GCS8, IPS, 1920x1080, 13.3" | |
|---|---|---|---|---|---|
| Power Consumption | -14% | -5% | -31% | 3% | |
| Idle Minimum * (Watt) | 3.2 | 3.8 -19% | 3.9 -22% | 5.5 -72% | 4.4 -38% |
| Idle Average * (Watt) | 5.9 | 8.4 -42% | 8.2 -39% | 8.3 -41% | 6.1 -3% |
| Idle Maximum * (Watt) | 8.8 | 9.7 -10% | 8.8 -0% | 11.5 -31% | 6.8 23% |
| Load Average * (Watt) | 31.2 | 36 -15% | 28.5 9% | 38.3 -23% | 29 7% |
| Load Maximum * (Watt) | 42.2 | 36 15% | 30.7 27% | 37.7 11% | 31.9 24% |
* ... menor é melhor
| Dell Inspiron 13-5379-9573 i5-8250U, UHD Graphics 620, 42 Wh | Lenovo Yoga 720-13IKB i5-8550U, UHD Graphics 620, 48 Wh | Acer Spin 5 SP513-52N-54SF i5-8250U, UHD Graphics 620, 53.9 Wh | Lenovo Miix 520-12IKB 81CG i5-8250U, UHD Graphics 620, 38 Wh | Dell Inspiron 13 5368 6500U, HD Graphics 520, 42 Wh | |
|---|---|---|---|---|---|
| Duração da bateria | 44% | 54% | -16% | -22% | |
| Reader / Idle (h) | 15.3 | 12.3 -20% | 11.2 -27% | ||
| WiFi v1.3 (h) | 5.4 | 7.8 44% | 8.3 54% | 5.6 4% | 4 -26% |
| Load (h) | 1.6 | 1.1 -31% | 1.4 -13% |
Pro
Contra
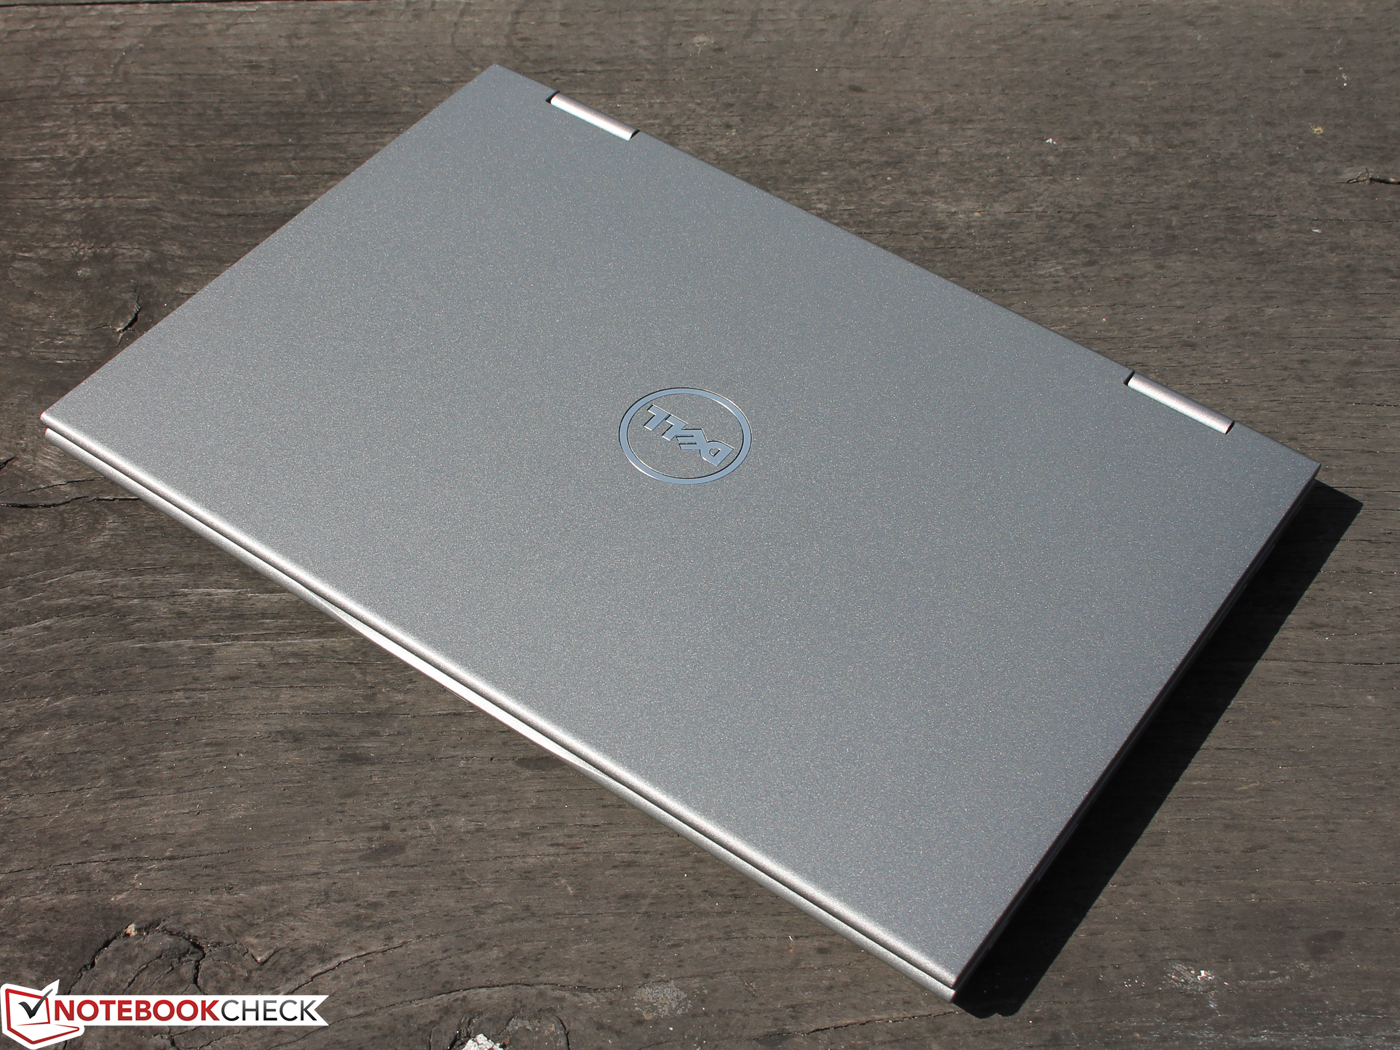
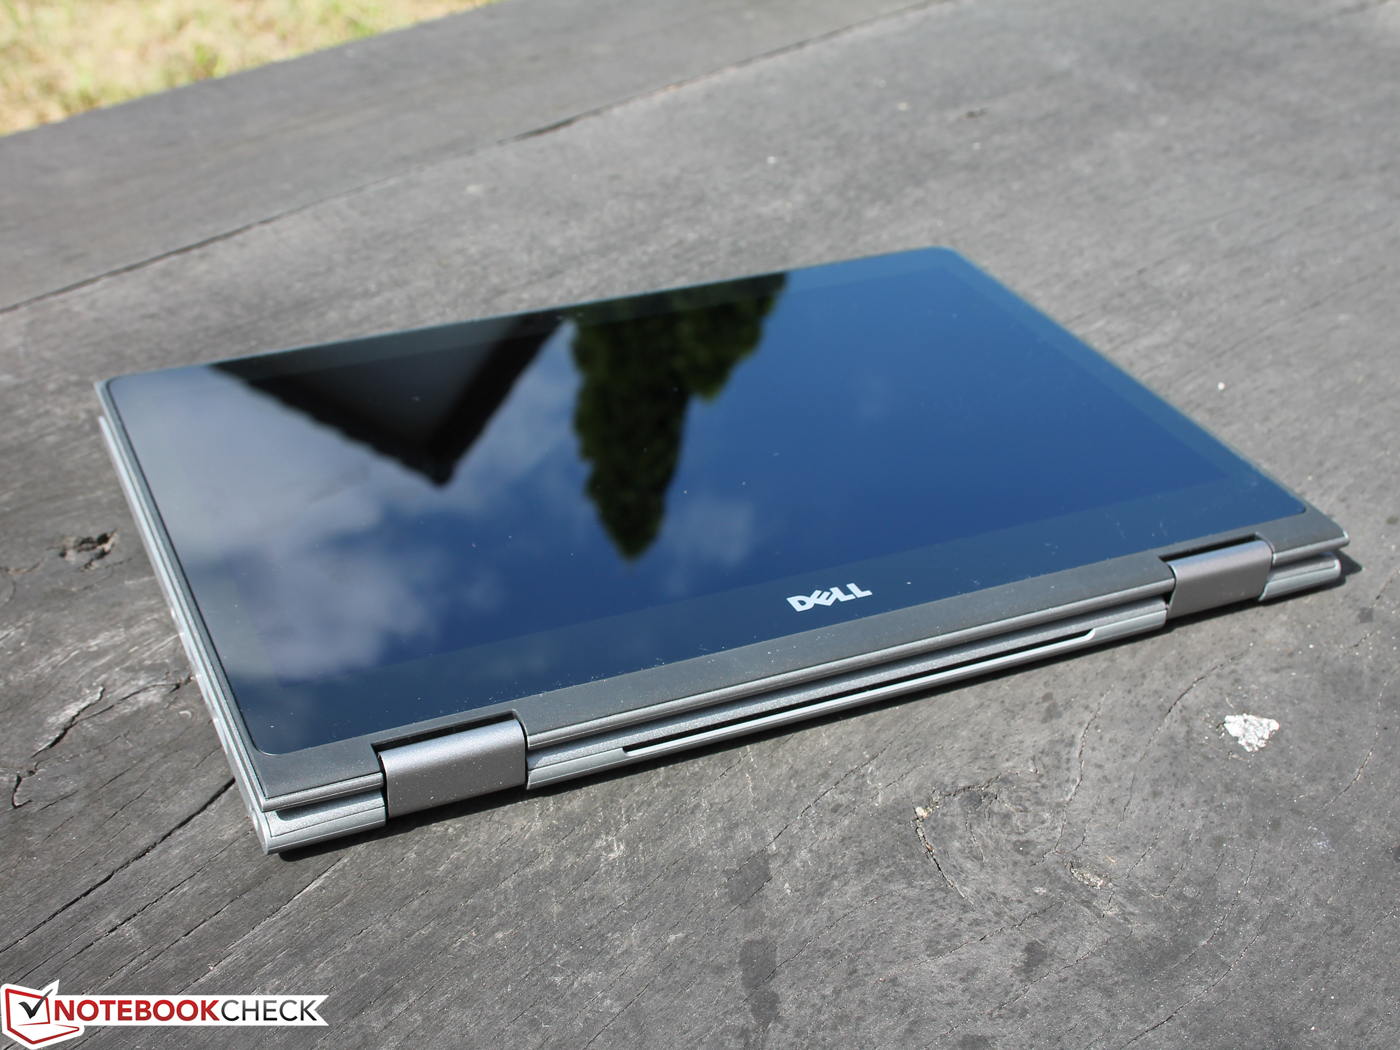
O Inspiron 13 5379 é mais um portátil do que um tablet. As dimensões do Inspiron aumentam essa impressão. Dobrar a tela em 360 ° cria um tablet extremamente grosso, cujo uso é frequentemente perturbado pelo espaço entre a tela e a base. Enquanto o nosso modelo de teste parece desatualizado, tudo está atualizado internamente.
"Se você usar o modo tablet apenas ocasionalmente, ou você gostaria de usar um portátil complementado por uma tela sensível ao toque, o Inspiron 13 5379 seria uma boa escolha. No geral, um conversível poderoso e com opção de manutenção com um processador da série Intel Kaby Lake da 8ª geração ".
O Inspiron 13 5379 é um dispositivo capaz que executa todas as tarefas de escritório sem problemas. Também é adequado para jogos ocasionais, mas apenas aqueles que são mais antigos ou da Loja Windows. A facilidade com que o dispositivo pode receber manutenção ou pode ser reparado garante um bom desempenho do sistema a longo prazo.
Dell Inspiron 13-5379-9573
- 02/12/2018 v6 (old)
Mike Wobker
Price comparison
