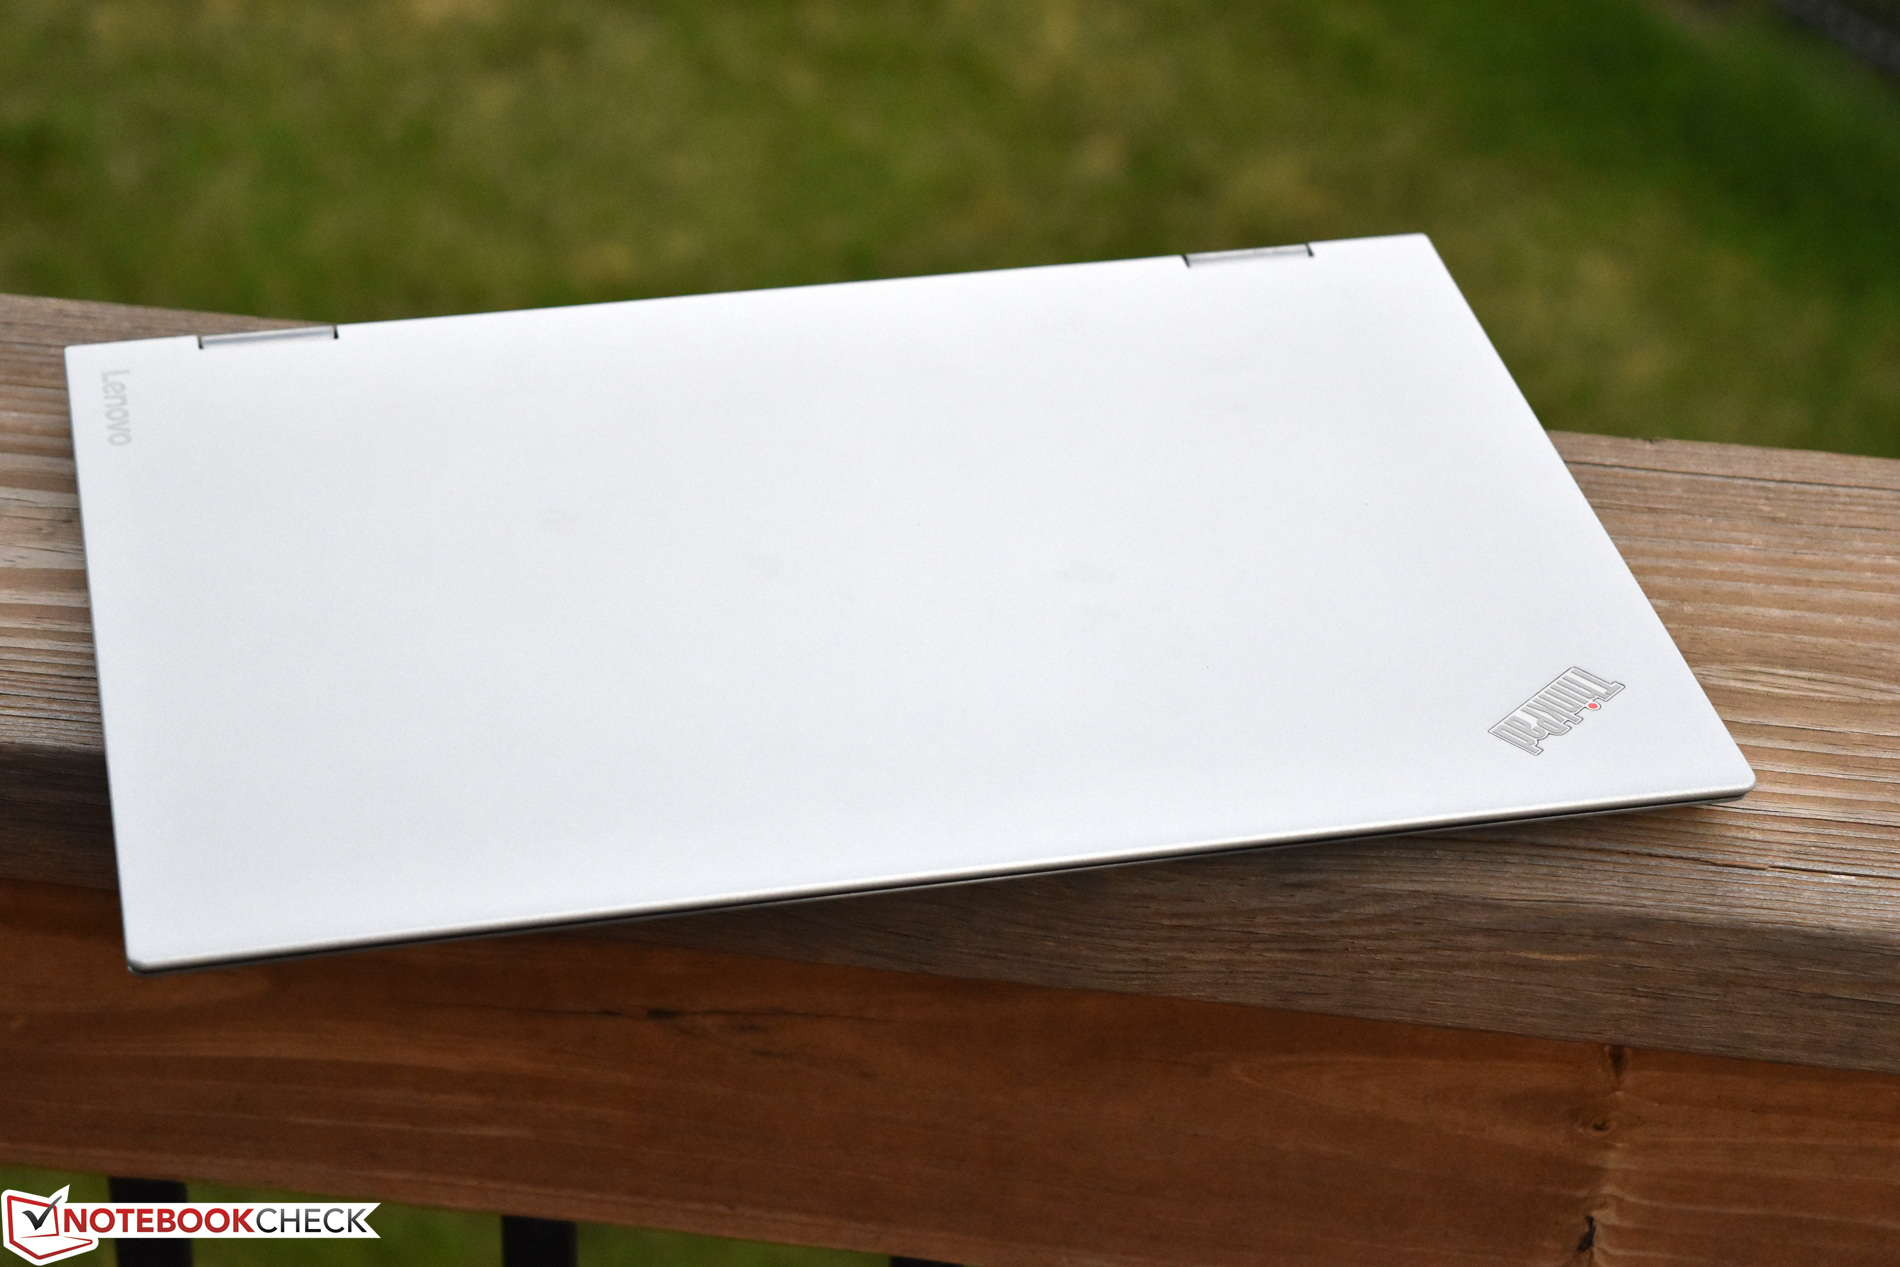
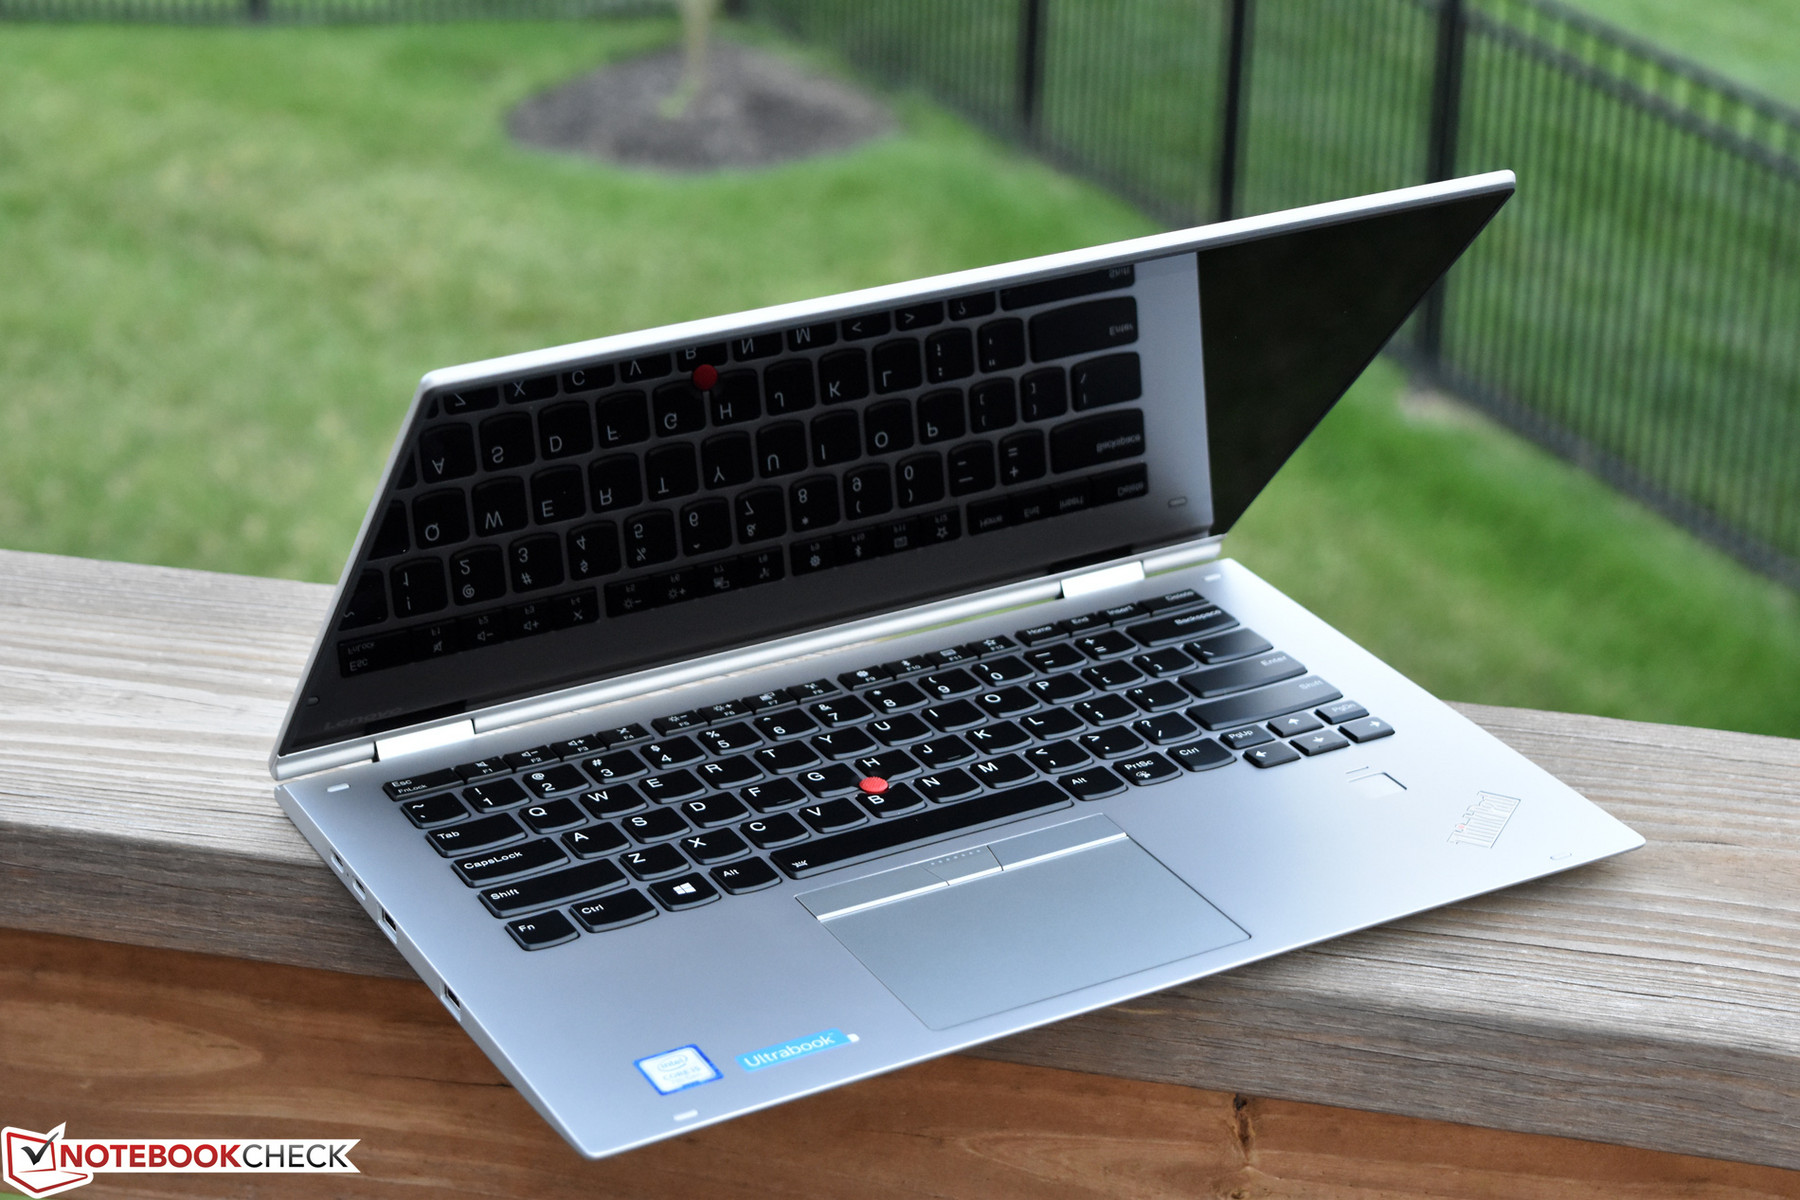
Breve Análise do Conversível Lenovo ThinkPad X1 Yoga 2017 20JD0015US (i5-7200U, FHD)


| |||||||||||||||||||||||||
iluminação: 83 %
iluminação com acumulador: 336.5 cd/m²
Contraste: 1346:1 (Preto: 0.25 cd/m²)
ΔE ColorChecker Calman: 4 | ∀{0.5-29.43 Ø4.71}
ΔE Greyscale Calman: 2.9 | ∀{0.09-98 Ø4.96}
58.8% sRGB (Argyll 1.6.3 3D)
37.4% AdobeRGB 1998 (Argyll 1.6.3 3D)
58.9% AdobeRGB 1998 (Argyll 3D)
84.4% sRGB (Argyll 3D)
57.9% Display P3 (Argyll 3D)
Gamma: 2.22
CCT: 6487 K
| Lenovo ThinkPad X1 Yoga 2017 20JD0015US B140HAN03.6, IPS, 14", 1920x1080 | Lenovo ThinkPad X1 Yoga 2017 20JES03T00 LEN4140, OLED, 14", 2560x1440 | Dell Latitude 12 5285 2-in-1 BOE06DC, IPS, 12.3", 1920x1280 | Toshiba Portege X20W-D-10R Toshiba TOS508F, IPS, 12.5", 1920x1080 | HP EliteBook x360 1030 G2 CMN1374, IPS, 13.3", 1920x1080 | |
|---|---|---|---|---|---|
| Display | 10% | 18% | 9% | ||
| Display P3 Coverage (%) | 57.9 | 62.8 8% | 68.7 19% | 65.5 13% | |
| sRGB Coverage (%) | 84.4 | 94 11% | 96.8 15% | 88.8 5% | |
| AdobeRGB 1998 Coverage (%) | 58.9 | 64.7 10% | 70.4 20% | 64.9 10% | |
| Response Times | 91% | 4% | -36% | -4% | |
| Response Time Grey 50% / Grey 80% * (ms) | 45.6 ? | 3.6 ? 92% | 42.4 ? 7% | 67 ? -47% | 55.2 ? -21% |
| Response Time Black / White * (ms) | 31.2 ? | 3.2 ? 90% | 30.8 ? 1% | 39 ? -25% | 27.2 ? 13% |
| PWM Frequency (Hz) | 240.4 ? | 210.1 ? | |||
| Screen | 8% | 7% | -2% | -14% | |
| Brightness middle (cd/m²) | 336.5 | 243 -28% | 523.2 55% | 442 31% | 262 -22% |
| Brightness (cd/m²) | 305 | 240 -21% | 522 71% | 410 34% | 256 -16% |
| Brightness Distribution (%) | 83 | 95 14% | 88 6% | 86 4% | 83 0% |
| Black Level * (cd/m²) | 0.25 | 0.42 -68% | 0.22 12% | 0.25 -0% | |
| Contrast (:1) | 1346 | 1246 -7% | 2009 49% | 1048 -22% | |
| Colorchecker dE 2000 * | 4 | 5.3 -33% | 4 -0% | 5.22 -31% | 5.13 -28% |
| Colorchecker dE 2000 max. * | 6.5 | 8.9 -37% | 8.6 -32% | 11.84 -82% | 9.46 -46% |
| Greyscale dE 2000 * | 2.9 | 3.7 -28% | 5.5 -90% | 7.88 -172% | 6.23 -115% |
| Gamma | 2.22 99% | 1.78 124% | 2.16 102% | 2.51 88% | 2.45 90% |
| CCT | 6487 100% | 6202 105% | 7546 86% | 6756 96% | 6413 101% |
| Color Space (Percent of AdobeRGB 1998) (%) | 37.4 | 84.8 127% | 64.86 73% | 64 71% | 57.84 55% |
| Color Space (Percent of sRGB) (%) | 58.8 | 100 70% | 93.97 60% | 97 65% | 88.57 51% |
| Média Total (Programa/Configurações) | 50% /
25% | 7% /
7% | -7% /
-2% | -3% /
-8% |
* ... menor é melhor
Exibir tempos de resposta
| ↔ Tempo de resposta preto para branco | ||
|---|---|---|
| 31.2 ms ... ascensão ↗ e queda ↘ combinadas | ↗ 18 ms ascensão | 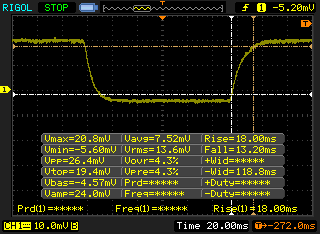 |
| ↘ 13.2 ms queda | ||
| A tela mostra taxas de resposta lentas em nossos testes e será insatisfatória para os jogadores. Em comparação, todos os dispositivos testados variam de 0.1 (mínimo) a 240 (máximo) ms. » 84 % de todos os dispositivos são melhores. Isso significa que o tempo de resposta medido é pior que a média de todos os dispositivos testados (19.8 ms). | ||
| ↔ Tempo de resposta 50% cinza a 80% cinza | ||
| 45.6 ms ... ascensão ↗ e queda ↘ combinadas | ↗ 22.4 ms ascensão | 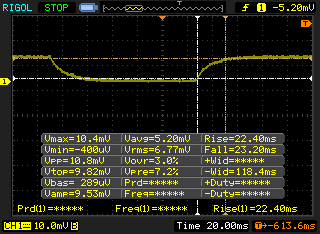 |
| ↘ 23.2 ms queda | ||
| A tela mostra taxas de resposta lentas em nossos testes e será insatisfatória para os jogadores. Em comparação, todos os dispositivos testados variam de 0.165 (mínimo) a 636 (máximo) ms. » 78 % de todos os dispositivos são melhores. Isso significa que o tempo de resposta medido é pior que a média de todos os dispositivos testados (30.9 ms). | ||
Cintilação da tela / PWM (modulação por largura de pulso)
| Tela tremeluzindo / PWM não detectado | 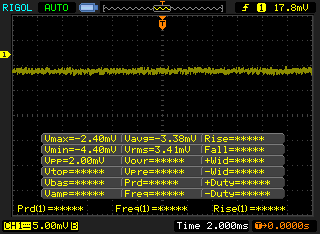 | ||
[pwm_comparison] Em comparação: 52 % de todos os dispositivos testados não usam PWM para escurecer a tela. Se PWM foi detectado, uma média de 7744 (mínimo: 5 - máximo: 343500) Hz foi medida. | |||
| wPrime 2.10 - 1024m | |
| Dell Latitude 12 5285 2-in-1 | |
| Lenovo ThinkPad X1 Yoga 2017 20JD0015US | |
* ... menor é melhor
| PCMark 8 Home Score Accelerated v2 | 3817 pontos | |
| PCMark 8 Creative Score Accelerated v2 | 4599 pontos | |
| PCMark 8 Work Score Accelerated v2 | 4687 pontos | |
| PCMark 10 Score | 3311 pontos | |
Ajuda | ||
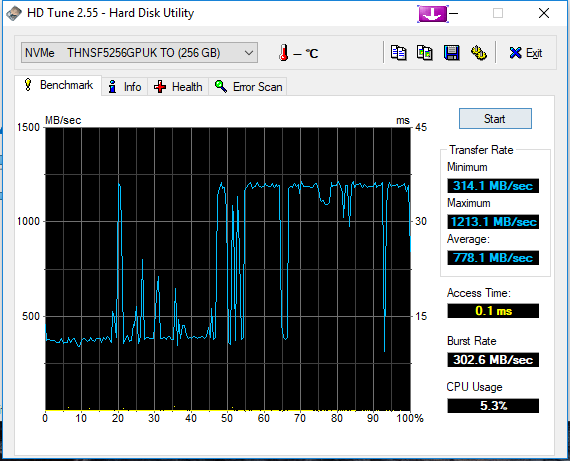
| Lenovo ThinkPad X1 Yoga 2017 20JD0015US Toshiba THNSF5256GPUK | Lenovo ThinkPad X1 Yoga 2017 20JES03T00 Samsung SSD PM961 1TB M.2 PCIe 3.0 x4 NVMe (MZVLW1T0) | Dell Latitude 12 5285 2-in-1 Samsung PM961 MZVLW256HEHP | Toshiba Portege X20W-D-10R Toshiba SG5 THNSNK512GVN8 | HP EliteBook x360 1030 G2 Sandisk SD8TN8U-256G-1006 | |
|---|---|---|---|---|---|
| AS SSD | 221% | 16% | -38% | -47% | |
| Seq Read (MB/s) | 1493 | 2783 86% | 1328 -11% | 485.8 -67% | 486.9 -67% |
| Seq Write (MB/s) | 286.2 | 1734 506% | 223.1 -22% | 243.6 -15% | 201.9 -29% |
| 4K Read (MB/s) | 31.96 | 56.4 76% | 27.6 -14% | 23.06 -28% | 27.37 -14% |
| 4K Write (MB/s) | 91.9 | 158.1 72% | 1.23 -99% | 76.7 -17% | 52.6 -43% |
| 4K-64 Read (MB/s) | 551 | 2140 288% | 1607 192% | 358 -35% | 286.2 -48% |
| 4K-64 Write (MB/s) | 340.4 | 1196 251% | 126.1 -63% | 160.9 -53% | 120.9 -64% |
| Score Read (Points) | 732 | 2475 238% | 1768 142% | 430 -41% | 362 -51% |
| Score Write (Points) | 461 | 1527 231% | 150 -67% | 262 -43% | 194 -58% |
| Score Total (Points) | 1515 | 5215 244% | 2760 82% | 906 -40% | 736 -51% |

| 3DMark | |
| 1280x720 Cloud Gate Standard Graphics | |
| Dell Latitude 12 5285 2-in-1 | |
| Lenovo ThinkPad X1 Yoga 2017 20JD0015US | |
| HP EliteBook x360 1030 G2 | |
| Lenovo ThinkPad X1 Yoga 2017 20JES03T00 | |
| Toshiba Portege X20W-D-10R | |
| 1920x1080 Fire Strike Graphics | |
| Dell Latitude 12 5285 2-in-1 | |
| Lenovo ThinkPad X1 Yoga 2017 20JD0015US | |
| Lenovo ThinkPad X1 Yoga 2017 20JES03T00 | |
| HP EliteBook x360 1030 G2 | |
| 1920x1080 Ice Storm Extreme Graphics | |
| Lenovo ThinkPad X1 Yoga 2017 20JD0015US | |
| HP EliteBook x360 1030 G2 | |
| Dell Latitude 12 5285 2-in-1 | |
| 3DMark 06 Standard Score | 10136 pontos | |
| 3DMark 11 Performance | 1732 pontos | |
| 3DMark Ice Storm Standard Score | 49899 pontos | |
| 3DMark Cloud Gate Standard Score | 6530 pontos | |
| 3DMark Fire Strike Score | 933 pontos | |
| 3DMark Time Spy Score | 374 pontos | |
Ajuda | ||
| baixo | média | alto | ultra | |
|---|---|---|---|---|
| BioShock Infinite (2013) | 61 | 33 | 27 | 8 |
Barulho
| Ocioso |
| 27.9 / 27.9 / 27.9 dB |
| Carga |
| 33.6 / 33.6 dB |
 | ||
30 dB silencioso 40 dB(A) audível 50 dB(A) ruidosamente alto |
||
min: | ||
| Lenovo ThinkPad X1 Yoga 2017 20JD0015US HD Graphics 620, i5-7200U, Toshiba THNSF5256GPUK | Lenovo ThinkPad X1 Yoga 2017 20JES03T00 HD Graphics 620, i7-7600U, Samsung SSD PM961 1TB M.2 PCIe 3.0 x4 NVMe (MZVLW1T0) | Dell Latitude 12 5285 2-in-1 HD Graphics 620, i7-7600U, Samsung PM961 MZVLW256HEHP | Toshiba Portege X20W-D-10R HD Graphics 620, i7-7600U, Toshiba SG5 THNSNK512GVN8 | HP EliteBook x360 1030 G2 HD Graphics 620, i5-7300U, Sandisk SD8TN8U-256G-1006 | |
|---|---|---|---|---|---|
| Noise | -9% | 1% | -4% | -4% | |
| desligado / ambiente * (dB) | 27.9 | 29.3 -5% | 28.2 -1% | 30.4 -9% | 29 -4% |
| Idle Minimum * (dB) | 27.9 | 29.3 -5% | 28.2 -1% | 30.5 -9% | 29 -4% |
| Idle Average * (dB) | 27.9 | 31.1 -11% | 28.2 -1% | 30.5 -9% | 29 -4% |
| Idle Maximum * (dB) | 27.9 | 33.3 -19% | 28.2 -1% | 30.5 -9% | 29 -4% |
| Load Average * (dB) | 33.6 | 33.3 1% | 30.4 10% | 31.2 7% | 33.6 -0% |
| Load Maximum * (dB) | 33.6 | 38.9 -16% | 34 -1% | 31.3 7% | 35.8 -7% |
* ... menor é melhor
(-) A temperatura máxima no lado superior é 45.4 °C / 114 F, em comparação com a média de 35.4 °C / 96 F , variando de 19.6 a 60 °C para a classe Convertible.
(±) A parte inferior aquece até um máximo de 40 °C / 104 F, em comparação com a média de 36.9 °C / 98 F
(+) Em uso inativo, a temperatura média para o lado superior é 27.2 °C / 81 F, em comparação com a média do dispositivo de 30.3 °C / ### class_avg_f### F.
(+) Os apoios para as mãos e o touchpad são mais frios que a temperatura da pele, com um máximo de 26.8 °C / 80.2 F e, portanto, são frios ao toque.
(±) A temperatura média da área do apoio para as mãos de dispositivos semelhantes foi 28 °C / 82.4 F (+1.2 °C / 2.2 F).
Lenovo ThinkPad X1 Yoga 2017 20JD0015US análise de áudio
(±) | o volume do alto-falante é médio, mas bom (###valor### dB)
Graves 100 - 315Hz
(-) | quase nenhum baixo - em média 16.8% menor que a mediana
(±) | a linearidade dos graves é média (11.5% delta para a frequência anterior)
Médios 400 - 2.000 Hz
(+) | médios equilibrados - apenas 2.6% longe da mediana
(±) | a linearidade dos médios é média (11.6% delta para frequência anterior)
Altos 2 - 16 kHz
(+) | agudos equilibrados - apenas 4.1% longe da mediana
(-) | os máximos não são lineares (15.1% delta da frequência anterior)
Geral 100 - 16.000 Hz
(±) | a linearidade do som geral é média (25.5% diferença em relação à mediana)
Comparado com a mesma classe
» 78% de todos os dispositivos testados nesta classe foram melhores, 5% semelhantes, 17% piores
» O melhor teve um delta de 6%, a média foi 20%, o pior foi 57%
Comparado com todos os dispositivos testados
» 78% de todos os dispositivos testados foram melhores, 4% semelhantes, 17% piores
» O melhor teve um delta de 4%, a média foi 23%, o pior foi 134%
Toshiba Portege X20W-D-10R análise de áudio
(-) | alto-falantes não muito altos (###valor### dB)
Graves 100 - 315Hz
(-) | quase nenhum baixo - em média 24.3% menor que a mediana
(±) | a linearidade dos graves é média (11.3% delta para a frequência anterior)
Médios 400 - 2.000 Hz
(+) | médios equilibrados - apenas 3.5% longe da mediana
(±) | a linearidade dos médios é média (7.9% delta para frequência anterior)
Altos 2 - 16 kHz
(+) | agudos equilibrados - apenas 4.8% longe da mediana
(+) | os máximos são lineares (6.2% delta da frequência anterior)
Geral 100 - 16.000 Hz
(±) | a linearidade do som geral é média (27% diferença em relação à mediana)
Comparado com a mesma classe
» 83% de todos os dispositivos testados nesta classe foram melhores, 3% semelhantes, 14% piores
» O melhor teve um delta de 6%, a média foi 20%, o pior foi 57%
Comparado com todos os dispositivos testados
» 83% de todos os dispositivos testados foram melhores, 4% semelhantes, 14% piores
» O melhor teve um delta de 4%, a média foi 23%, o pior foi 134%
| desligado | |
| Ocioso | |
| Carga |
|
Key:
min: | |
| Lenovo ThinkPad X1 Yoga 2017 20JD0015US i5-7200U, HD Graphics 620, Toshiba THNSF5256GPUK, IPS, 1920x1080, 14" | Lenovo ThinkPad X1 Yoga 2017 20JES03T00 i7-7600U, HD Graphics 620, Samsung SSD PM961 1TB M.2 PCIe 3.0 x4 NVMe (MZVLW1T0), OLED, 2560x1440, 14" | Dell Latitude 12 5285 2-in-1 i7-7600U, HD Graphics 620, Samsung PM961 MZVLW256HEHP, IPS, 1920x1280, 12.3" | Toshiba Portege X20W-D-10R i7-7600U, HD Graphics 620, Toshiba SG5 THNSNK512GVN8, IPS, 1920x1080, 12.5" | HP EliteBook x360 1030 G2 i5-7300U, HD Graphics 620, Sandisk SD8TN8U-256G-1006, IPS, 1920x1080, 13.3" | |
|---|---|---|---|---|---|
| Power Consumption | -28% | 8% | 25% | 10% | |
| Idle Minimum * (Watt) | 4.4 | 4.9 -11% | 2.85 35% | 3.4 23% | 3.2 27% |
| Idle Average * (Watt) | 7.4 | 7.6 -3% | 6.76 9% | 5.8 22% | 5.5 26% |
| Idle Maximum * (Watt) | 7.6 | 13.8 -82% | 6.91 9% | 6.7 12% | 6.5 14% |
| Load Average * (Watt) | 31.3 | 33.4 -7% | 32.88 -5% | 21.4 32% | 29.7 5% |
| Load Maximum * (Watt) | 34.4 | 46.5 -35% | 37.41 -9% | 21.6 37% | 41.3 -20% |
* ... menor é melhor
| Lenovo ThinkPad X1 Yoga 2017 20JD0015US i5-7200U, HD Graphics 620, 56 Wh | Lenovo ThinkPad X1 Yoga 2017 20JES03T00 i7-7600U, HD Graphics 620, 56 Wh | Dell Latitude 12 5285 2-in-1 i7-7600U, HD Graphics 620, 42 Wh | Toshiba Portege X20W-D-10R i7-7600U, HD Graphics 620, 44 Wh | HP EliteBook x360 1030 G2 i5-7300U, HD Graphics 620, 57 Wh | |
|---|---|---|---|---|---|
| Duração da bateria | -18% | -2% | 18% | 53% | |
| Reader / Idle (h) | 12.6 | 13.1 4% | 17.9 42% | 16.7 33% | 23.1 83% |
| WiFi v1.3 (h) | 10.8 | 6.1 -44% | 8.1 -25% | 12 11% | 10.5 -3% |
| Load (h) | 2.3 | 2 -13% | 1.8 -22% | 2.5 9% | 4.1 78% |
Pro
Contra
O ThinkPad X1 Yoga não é uma máquina barata, sem importar como esteja equipada, com preços acima de $2.000 para a maioria das configurações (hoje: $2.267). No entanto, com um custo de mais de $1.500 a manos que que o nosso candidado de teste Core i7/OLED, esta unidade provavelmente parece muito mais alcançável para o usuário comercial médio. E essa não é a única coisa que torna potencialmente ainda mais atraente do que o seu par WQHD: também não há uma redução de desempenho sustentada pela CPU, é mais silencioso, a duração da bateria é consideravelmente mais longa na maioria dos casos, e as termais estão muito mais na linha. Também não há PWM em jogo, ao contrário do que descobrimos na nossa unidade de revisão OLED.
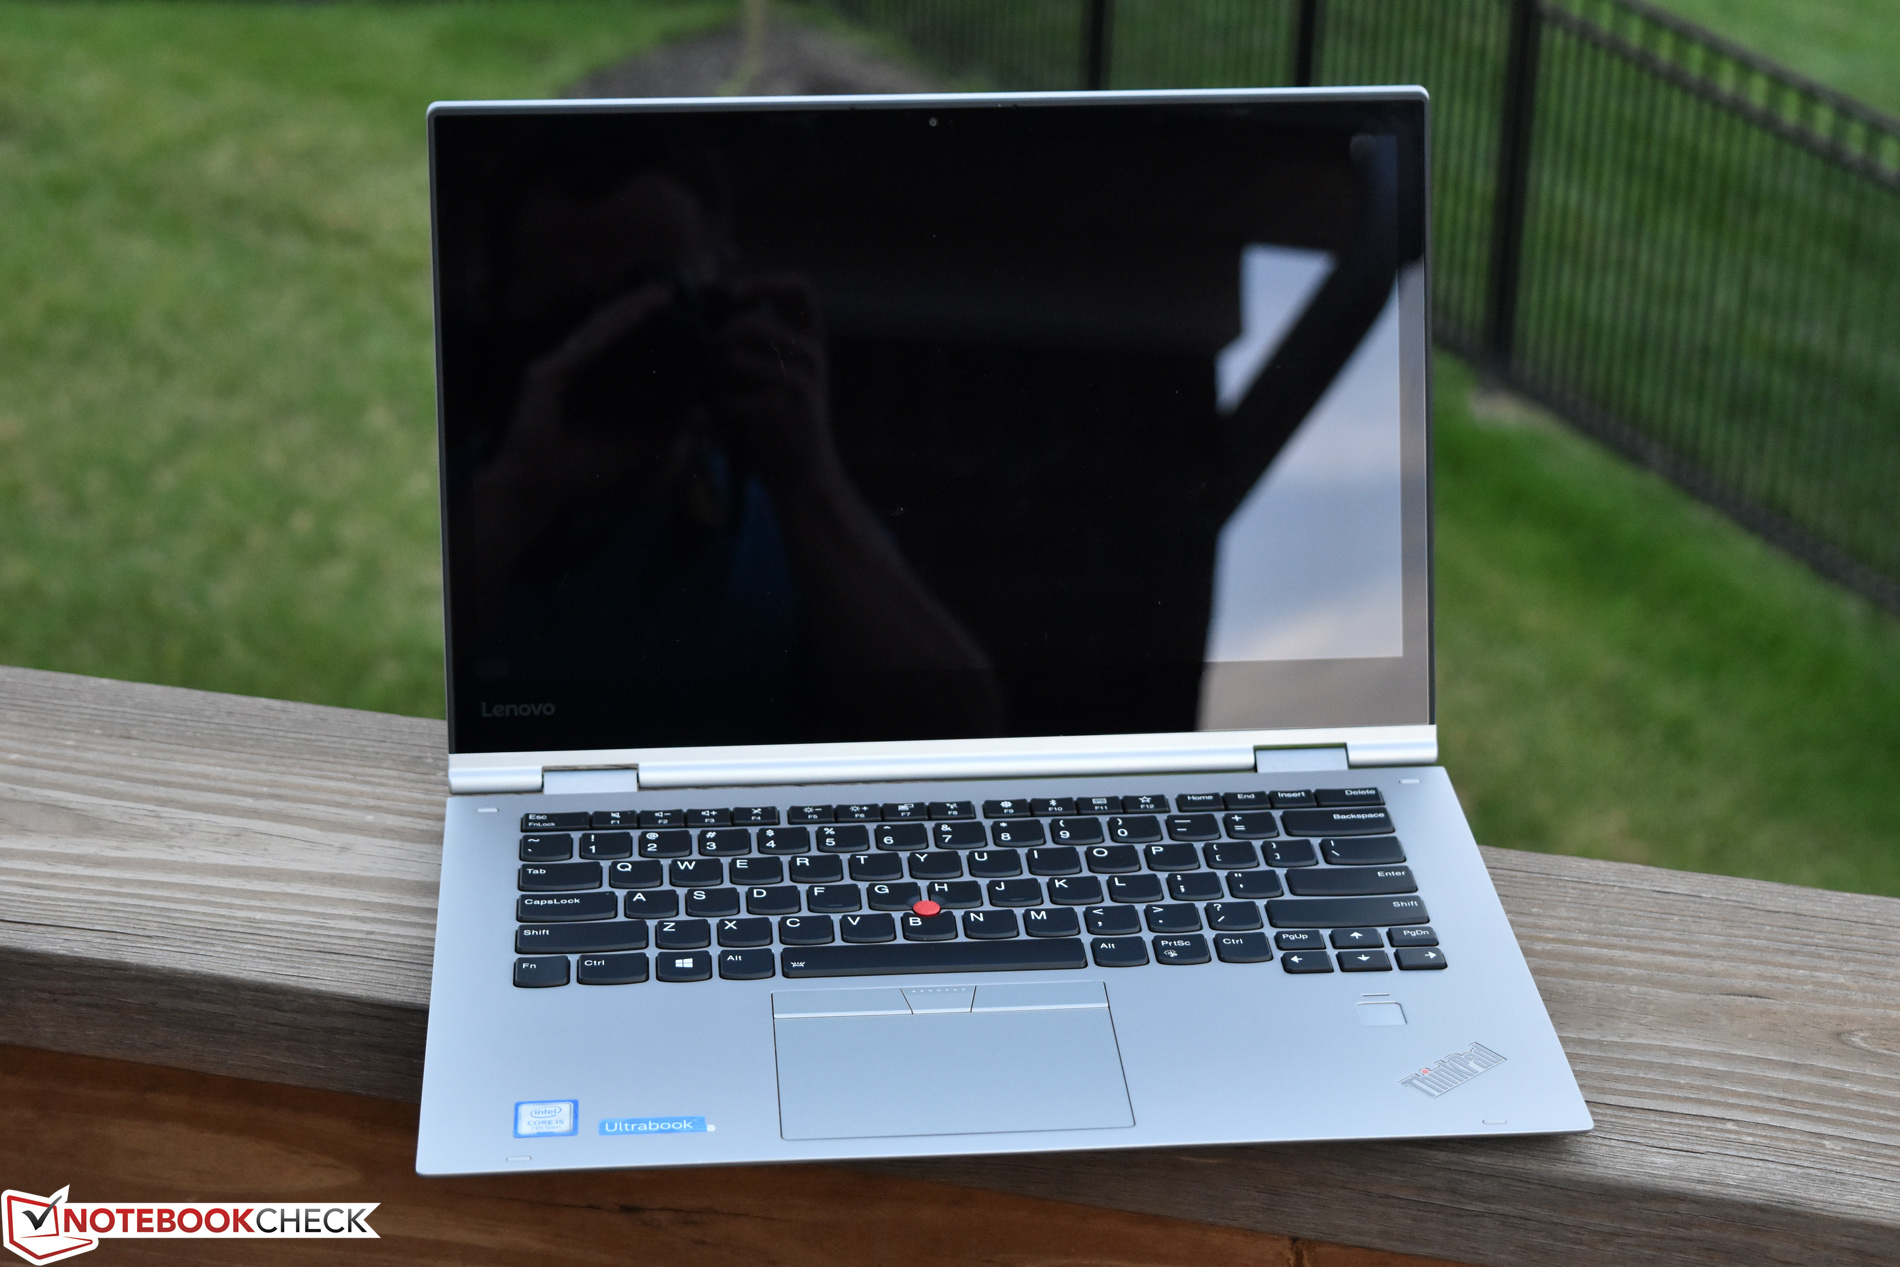
Não há realmente algo muito errado com o ThinkPad X1 Yoga; se o conversível em com dobradiça de 360 graus é o que você está procurando, realmente deve estar em sua lista de desejos.
Na verdade, além da falta de OLED e resolução WQHD (Este é Full HD), CPU ligeiramente menos capaz e SSD mais lento, estes são praticamente a mesma máquina. E por isso, não há muito errado com o ThinkPad X1 Yoga: é uma peça de tecnologia completa, silenciosa, legal, ágil e atraente. Se um conversível com dobradiça de 360 graus é o que você está procurando, ele realmente deve estar em sua lista de desejos.
Lenovo ThinkPad X1 Yoga 2017 20JD0015US
- 07/29/2017 v6 (old)
Steve Schardein
Price comparison
