Breve Análise do Conversível Lenovo ThinkPad X1 Yoga 2018 (i7-8550U, HDR WQHD)


| SD Card Reader | |
| average JPG Copy Test (av. of 3 runs) | |
| Lenovo ThinkPad X1 Yoga 2018-20LES01W00 (Toshiba Exceria Pro M501) | |
| Microsoft Surface Book 2 (Toshiba Exceria Pro SDXC 64 GB UHS-II) | |
| Lenovo ThinkPad X1 Yoga 2017 20JES03T00 (Toshiba Exceria Pro M401) | |
| Média da turma Convertible (28.1 - 197, n=23, últimos 2 anos) | |
| maximum AS SSD Seq Read Test (1GB) | |
| Microsoft Surface Book 2 (Toshiba Exceria Pro SDXC 64 GB UHS-II) | |
| Lenovo ThinkPad X1 Yoga 2018-20LES01W00 (Toshiba Exceria Pro M501) | |
| Média da turma Convertible (28.9 - 254, n=22, últimos 2 anos) | |
| Lenovo ThinkPad X1 Yoga 2017 20JES03T00 (Toshiba Exceria Pro M401) | |
| |||||||||||||||||||||||||
iluminação: 86 %
iluminação com acumulador: 567 cd/m²
Contraste: 1873:1 (Preto: 0.3 cd/m²)
ΔE ColorChecker Calman: 2.8 | ∀{0.5-29.43 Ø4.72}
ΔE Greyscale Calman: 4.5 | ∀{0.09-98 Ø4.97}
100% sRGB (Argyll 1.6.3 3D)
88.9% AdobeRGB 1998 (Argyll 1.6.3 3D)
99.4% AdobeRGB 1998 (Argyll 3D)
100% sRGB (Argyll 3D)
86.5% Display P3 (Argyll 3D)
Gamma: 2.16
CCT: 7205 K
| Lenovo ThinkPad X1 Yoga 2018-20LES01W00 Lenovo 40AE / B140QAN02.0, , 2560x1440, 14" | Lenovo ThinkPad X1 Yoga 2017 20JES03T00 LEN4140, , 2560x1440, 14" | HP EliteBook x360 1030 G2 CMN1374, , 1920x1080, 13.3" | Microsoft Surface Book 2 Panasonic MEI96A2 , , 3000x2000, 13.5" | Toshiba Portege X20W-D-10R Toshiba TOS508F, , 1920x1080, 12.5" | |
|---|---|---|---|---|---|
| Display | -23% | -19% | -18% | ||
| Display P3 Coverage (%) | 86.5 | 65.5 -24% | 67.9 -22% | 68.7 -21% | |
| sRGB Coverage (%) | 100 | 88.8 -11% | 95.7 -4% | 96.8 -3% | |
| AdobeRGB 1998 Coverage (%) | 99.4 | 64.9 -35% | 69.4 -30% | 70.4 -29% | |
| Response Times | 91% | -5% | -9% | -41% | |
| Response Time Grey 50% / Grey 80% * (ms) | 56.8 ? | 3.6 ? 94% | 55.2 ? 3% | 52.8 ? 7% | 67 ? -18% |
| Response Time Black / White * (ms) | 24 ? | 3.2 ? 87% | 27.2 ? -13% | 30 ? -25% | 39 ? -63% |
| PWM Frequency (Hz) | 240.4 ? | ||||
| Screen | -29% | -36% | 7% | -30% | |
| Brightness middle (cd/m²) | 562 | 243 -57% | 262 -53% | 385 -31% | 442 -21% |
| Brightness (cd/m²) | 522 | 240 -54% | 256 -51% | 372 -29% | 410 -21% |
| Brightness Distribution (%) | 86 | 95 10% | 83 -3% | 89 3% | 86 0% |
| Black Level * (cd/m²) | 0.3 | 0.25 17% | 0.21 30% | 0.22 27% | |
| Contrast (:1) | 1873 | 1048 -44% | 1833 -2% | 2009 7% | |
| Colorchecker dE 2000 * | 2.8 | 5.3 -89% | 5.13 -83% | 1.6 43% | 5.22 -86% |
| Colorchecker dE 2000 max. * | 5.8 | 8.9 -53% | 9.46 -63% | 4.5 22% | 11.84 -104% |
| Greyscale dE 2000 * | 4.5 | 3.7 18% | 6.23 -38% | 1.5 67% | 7.88 -75% |
| Gamma | 2.16 102% | 1.78 124% | 2.45 90% | 2.22 99% | 2.51 88% |
| CCT | 7205 90% | 6202 105% | 6413 101% | 6502 100% | 6756 96% |
| Color Space (Percent of AdobeRGB 1998) (%) | 88.9 | 84.8 -5% | 57.84 -35% | 64 -28% | 64 -28% |
| Color Space (Percent of sRGB) (%) | 100 | 100 0% | 88.57 -11% | 95.9 -4% | 97 -3% |
| Média Total (Programa/Configurações) | 31% /
-5% | -21% /
-30% | -7% /
-0% | -30% /
-29% |
* ... menor é melhor
Exibir tempos de resposta
| ↔ Tempo de resposta preto para branco | ||
|---|---|---|
| 24 ms ... ascensão ↗ e queda ↘ combinadas | ↗ 6.8 ms ascensão | 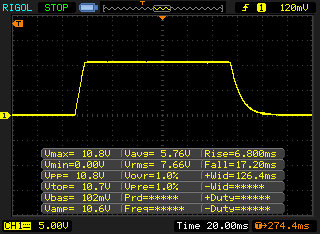 |
| ↘ 17.2 ms queda | ||
| A tela mostra boas taxas de resposta em nossos testes, mas pode ser muito lenta para jogadores competitivos. Em comparação, todos os dispositivos testados variam de 0.1 (mínimo) a 240 (máximo) ms. » 54 % de todos os dispositivos são melhores. Isso significa que o tempo de resposta medido é pior que a média de todos os dispositivos testados (19.8 ms). | ||
| ↔ Tempo de resposta 50% cinza a 80% cinza | ||
| 56.8 ms ... ascensão ↗ e queda ↘ combinadas | ↗ 21.2 ms ascensão | 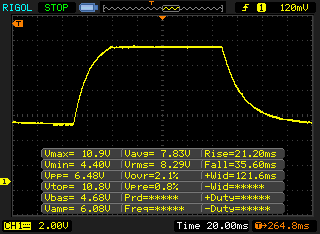 |
| ↘ 35.6 ms queda | ||
| A tela mostra taxas de resposta lentas em nossos testes e será insatisfatória para os jogadores. Em comparação, todos os dispositivos testados variam de 0.165 (mínimo) a 636 (máximo) ms. » 94 % de todos os dispositivos são melhores. Isso significa que o tempo de resposta medido é pior que a média de todos os dispositivos testados (31 ms). | ||
Cintilação da tela / PWM (modulação por largura de pulso)
| Tela tremeluzindo / PWM não detectado | 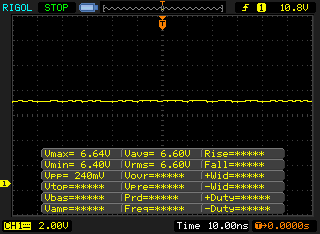 | ||
[pwm_comparison] Em comparação: 52 % de todos os dispositivos testados não usam PWM para escurecer a tela. Se PWM foi detectado, uma média de 7769 (mínimo: 5 - máximo: 343500) Hz foi medida. | |||
| PCMark 8 Home Score Accelerated v2 | 3824 pontos | |
| PCMark 8 Work Score Accelerated v2 | 4719 pontos | |
| PCMark 10 Score | 3829 pontos | |
Ajuda | ||
| Lenovo ThinkPad X1 Yoga 2018-20LES01W00 Samsung SSD PM981 MZVLB512HAJQ | Lenovo ThinkPad X1 Yoga 2017 20JES03T00 Samsung SSD PM961 1TB M.2 PCIe 3.0 x4 NVMe (MZVLW1T0) | HP EliteBook x360 1030 G2 Sandisk SD8TN8U-256G-1006 | Microsoft Surface Book 2 Samsung PM961 MZVLW256HEHP | Toshiba Portege X20W-D-10R Toshiba SG5 THNSNK512GVN8 | Média Samsung SSD PM981 MZVLB512HAJQ | |
|---|---|---|---|---|---|---|
| CrystalDiskMark 3.0 | 12% | -60% | -31% | -58% | 4% | |
| Read Seq (MB/s) | 2317 | 2004 -14% | 467.1 -80% | 1370 -41% | 469 -80% | 2002 ? -14% |
| Write Seq (MB/s) | 1889 | 1693 -10% | 443.6 -77% | 341.2 -82% | 277.3 -85% | 1656 ? -12% |
| Read 512 (MB/s) | 719 | 1040 45% | 312.3 -57% | 654 -9% | 404.4 -44% | 1213 ? 69% |
| Write 512 (MB/s) | 1413 | 1292 -9% | 372.5 -74% | 337.9 -76% | 266.6 -81% | 1641 ? 16% |
| Read 4k (MB/s) | 61.4 | 58.2 -5% | 29.43 -52% | 43.64 -29% | 25.24 -59% | 61.4 ? 0% |
| Write 4k (MB/s) | 140 | 182.2 30% | 56.5 -60% | 148.5 6% | 89.4 -36% | 131.3 ? -6% |
| Read 4k QD32 (MB/s) | 425.4 | 632 49% | 311.3 -27% | 465.5 9% | 322.5 -24% | 407 ? -4% |
| Write 4k QD32 (MB/s) | 474.5 | 507 7% | 225.2 -53% | 337.1 -29% | 208.1 -56% | 402 ? -15% |

| 3DMark 11 Performance | 2081 pontos | |
| 3DMark Cloud Gate Standard Score | 9415 pontos | |
| 3DMark Fire Strike Score | 1178 pontos | |
Ajuda | ||
| baixo | média | alto | ultra | |
|---|---|---|---|---|
| Rise of the Tomb Raider (2016) | 21.3 | |||
| Battlefield 1 (2016) | 29.7 | 18.9 | ||
| Farming Simulator 17 (2016) | 45.6 | 25.2 |
Barulho
| Ocioso |
| 29.1 / 29.1 / 31.3 dB |
| Carga |
| 37.6 / 37.6 dB |
 | ||
30 dB silencioso 40 dB(A) audível 50 dB(A) ruidosamente alto |
||
min: | ||
(±) A temperatura máxima no lado superior é 43.4 °C / 110 F, em comparação com a média de 35.4 °C / 96 F , variando de 19.6 a 60 °C para a classe Convertible.
(±) A parte inferior aquece até um máximo de 42.1 °C / 108 F, em comparação com a média de 36.9 °C / 98 F
(+) Em uso inativo, a temperatura média para o lado superior é 21.8 °C / 71 F, em comparação com a média do dispositivo de 30.3 °C / ### class_avg_f### F.
(+) Os apoios para as mãos e o touchpad são mais frios que a temperatura da pele, com um máximo de 26 °C / 78.8 F e, portanto, são frios ao toque.
(±) A temperatura média da área do apoio para as mãos de dispositivos semelhantes foi 28 °C / 82.4 F (+2 °C / 3.6 F).
Lenovo ThinkPad X1 Yoga 2018-20LES01W00 análise de áudio
(±) | o volume do alto-falante é médio, mas bom (###valor### dB)
Graves 100 - 315Hz
(-) | quase nenhum baixo - em média 20.5% menor que a mediana
(-) | graves não são lineares (15.1% delta para frequência anterior)
Médios 400 - 2.000 Hz
(+) | médios equilibrados - apenas 4% longe da mediana
(±) | a linearidade dos médios é média (9.3% delta para frequência anterior)
Altos 2 - 16 kHz
(+) | agudos equilibrados - apenas 2.3% longe da mediana
(+) | os máximos são lineares (6% delta da frequência anterior)
Geral 100 - 16.000 Hz
(±) | a linearidade do som geral é média (22.9% diferença em relação à mediana)
Comparado com a mesma classe
» 69% de todos os dispositivos testados nesta classe foram melhores, 5% semelhantes, 26% piores
» O melhor teve um delta de 6%, a média foi 20%, o pior foi 57%
Comparado com todos os dispositivos testados
» 68% de todos os dispositivos testados foram melhores, 6% semelhantes, 26% piores
» O melhor teve um delta de 4%, a média foi 24%, o pior foi 134%
Lenovo ThinkPad X1 Yoga 2017 20JES03T00 análise de áudio
(±) | o volume do alto-falante é médio, mas bom (###valor### dB)
Graves 100 - 315Hz
(-) | quase nenhum baixo - em média 19.1% menor que a mediana
(±) | a linearidade dos graves é média (8.6% delta para a frequência anterior)
Médios 400 - 2.000 Hz
(+) | médios equilibrados - apenas 2.6% longe da mediana
(±) | a linearidade dos médios é média (8% delta para frequência anterior)
Altos 2 - 16 kHz
(+) | agudos equilibrados - apenas 2.6% longe da mediana
(+) | os máximos são lineares (6.6% delta da frequência anterior)
Geral 100 - 16.000 Hz
(±) | a linearidade do som geral é média (21.7% diferença em relação à mediana)
Comparado com a mesma classe
» 60% de todos os dispositivos testados nesta classe foram melhores, 9% semelhantes, 31% piores
» O melhor teve um delta de 6%, a média foi 20%, o pior foi 57%
Comparado com todos os dispositivos testados
» 61% de todos os dispositivos testados foram melhores, 7% semelhantes, 31% piores
» O melhor teve um delta de 4%, a média foi 24%, o pior foi 134%
HP EliteBook x360 1030 G2 análise de áudio
(+) | os alto-falantes podem tocar relativamente alto (###valor### dB)
Analysis not possible as minimum curve is missing or too high
Microsoft Surface Book 2 análise de áudio
(±) | o volume do alto-falante é médio, mas bom (###valor### dB)
Graves 100 - 315Hz
(±) | graves reduzidos - em média 12.4% menor que a mediana
(±) | a linearidade dos graves é média (12.3% delta para a frequência anterior)
Médios 400 - 2.000 Hz
(+) | médios equilibrados - apenas 1.9% longe da mediana
(+) | médios são lineares (3.6% delta para frequência anterior)
Altos 2 - 16 kHz
(+) | agudos equilibrados - apenas 4.8% longe da mediana
(±) | a linearidade dos máximos é média (9.3% delta para frequência anterior)
Geral 100 - 16.000 Hz
(±) | a linearidade do som geral é média (18.2% diferença em relação à mediana)
Comparado com a mesma classe
» 40% de todos os dispositivos testados nesta classe foram melhores, 7% semelhantes, 53% piores
» O melhor teve um delta de 6%, a média foi 20%, o pior foi 57%
Comparado com todos os dispositivos testados
» 39% de todos os dispositivos testados foram melhores, 8% semelhantes, 53% piores
» O melhor teve um delta de 4%, a média foi 24%, o pior foi 134%
Toshiba Portege X20W-D-10R análise de áudio
(-) | alto-falantes não muito altos (###valor### dB)
Graves 100 - 315Hz
(-) | quase nenhum baixo - em média 24.3% menor que a mediana
(±) | a linearidade dos graves é média (11.3% delta para a frequência anterior)
Médios 400 - 2.000 Hz
(+) | médios equilibrados - apenas 3.5% longe da mediana
(±) | a linearidade dos médios é média (7.9% delta para frequência anterior)
Altos 2 - 16 kHz
(+) | agudos equilibrados - apenas 4.8% longe da mediana
(+) | os máximos são lineares (6.2% delta da frequência anterior)
Geral 100 - 16.000 Hz
(±) | a linearidade do som geral é média (27% diferença em relação à mediana)
Comparado com a mesma classe
» 83% de todos os dispositivos testados nesta classe foram melhores, 3% semelhantes, 14% piores
» O melhor teve um delta de 6%, a média foi 20%, o pior foi 57%
Comparado com todos os dispositivos testados
» 83% de todos os dispositivos testados foram melhores, 4% semelhantes, 14% piores
» O melhor teve um delta de 4%, a média foi 24%, o pior foi 134%
| desligado | |
| Ocioso | |
| Carga |
|
Key:
min: | |
| Lenovo ThinkPad X1 Yoga 2018-20LES01W00 i5-8550U, UHD Graphics 620, Samsung SSD PM981 MZVLB512HAJQ, IPS Dolby Vision HDR, 2560x1440, 14" | Lenovo ThinkPad X1 Yoga 2017 20JES03T00 i7-7600U, HD Graphics 620, Samsung SSD PM961 1TB M.2 PCIe 3.0 x4 NVMe (MZVLW1T0), OLED, 2560x1440, 14" | HP EliteBook x360 1030 G2 i5-7300U, HD Graphics 620, Sandisk SD8TN8U-256G-1006, IPS, 1920x1080, 13.3" | Microsoft Surface Book 2 i7-8650U, GeForce GTX 1050 Mobile, Samsung PM961 MZVLW256HEHP, IPS, 3000x2000, 13.5" | Toshiba Portege X20W-D-10R i7-7600U, HD Graphics 620, Toshiba SG5 THNSNK512GVN8, IPS, 1920x1080, 12.5" | |
|---|---|---|---|---|---|
| Power Consumption | 5% | 34% | -33% | 41% | |
| Idle Minimum * (Watt) | 3.4 | 4.9 -44% | 3.2 6% | 4.7 -38% | 3.4 -0% |
| Idle Average * (Watt) | 8.8 | 7.6 14% | 5.5 37% | 10.6 -20% | 5.8 34% |
| Idle Maximum * (Watt) | 11.9 | 13.8 -16% | 6.5 45% | 12.3 -3% | 6.7 44% |
| Load Average * (Watt) | 50.4 | 33.4 34% | 29.7 41% | 81 -61% | 21.4 58% |
| Load Maximum * (Watt) | 71.2 | 46.5 35% | 41.3 42% | 100.3 -41% | 21.6 70% |
| Witcher 3 ultra * (Watt) | 97 |
* ... menor é melhor
| Lenovo ThinkPad X1 Yoga 2018-20LES01W00 i5-8550U, UHD Graphics 620, 54 Wh | Lenovo ThinkPad X1 Yoga 2017 20JES03T00 i7-7600U, HD Graphics 620, 56 Wh | HP EliteBook x360 1030 G2 i5-7300U, HD Graphics 620, 57 Wh | Microsoft Surface Book 2 i7-8650U, GeForce GTX 1050 Mobile, 75 Wh | Toshiba Portege X20W-D-10R i7-7600U, HD Graphics 620, 44 Wh | Média da turma Convertible | |
|---|---|---|---|---|---|---|
| Duração da bateria | -15% | 57% | 58% | 30% | 40% | |
| Reader / Idle (h) | 20.1 | 13.1 -35% | 23.1 15% | 24.5 22% | 16.7 -17% | 27.7 ? 38% |
| H.264 (h) | 9.4 | 6.8 -28% | 11 17% | 15.6 66% | 15.3 ? 63% | |
| WiFi v1.3 (h) | 8.6 | 6.1 -29% | 10.5 22% | 11.1 29% | 12 40% | 12.1 ? 41% |
| Load (h) | 1.5 | 2 33% | 4.1 173% | 3.2 113% | 2.5 67% | 1.779 ? 19% |
| Witcher 3 ultra (h) | 3.8 |
Pro
Contra
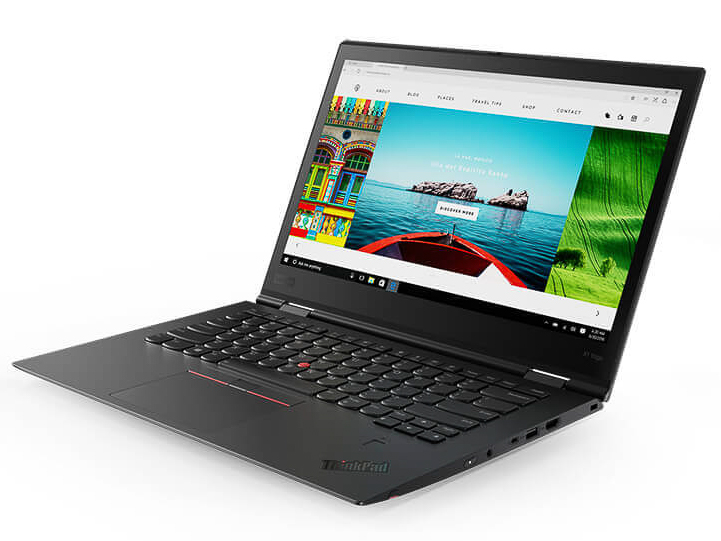
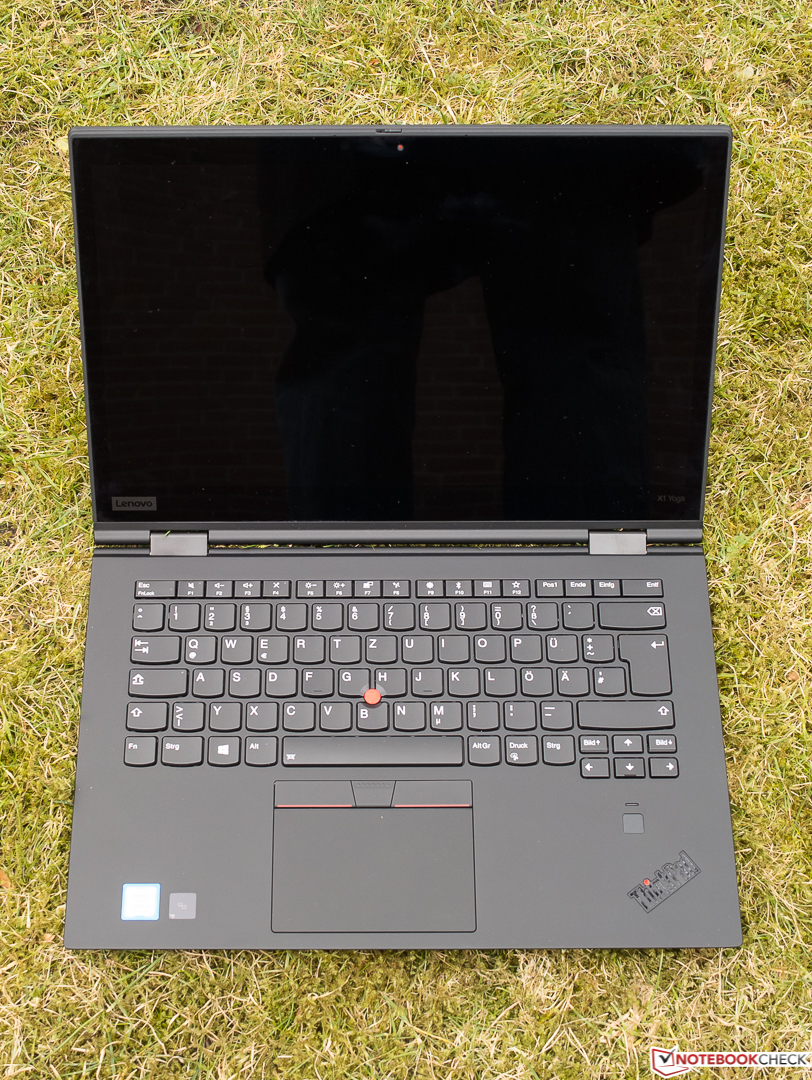
Nosso modelo Campuspoint do novo Lenovo ThinkPad X1 Yoga está disponível por 1800 Euros no momento da compra. Nos EUA, o aparelho é vendido por pouco menos de $2.000 - você pode obter um portátil para jogos rápido por esse preço. Se você tem o dinheiro extra para este dispositivo, será recompensado com um conversível de boa aparência, flexível, rápido e particularmente bem equipado com uma tela inovadora que preenche todos os requisitos e uma seleção de portas luxuosa e moderna que é difícil encontrar em outros dispositivos e deve satisfazer todas as suas necessidades. Detalhes como o teclado retrátil, a tampa da webcam ThinkShutter e os adaptadores incluídos, mostram que a Lenovo está fazendo um esforço para melhorar constantemente a série ThinkPad.
Se a nossa versão incluísse o Windows 10 Pro com o recurso de criptografia de disco rígido do BitLocker, os recursos de segurança estariam completos. Os usuários de negócios em constante movimento apreciarão a garantia de três anos no local, bem como os excelentes dispositivos de entrada, que são típicos dos ThinkPads. Se você é novo na série, primeiro terá que se acostumar com as particularidades do layout do teclado.
A única desvantagem é que os tempos de duração da bateria não são tão bons. Este é o preço que você tem que pagar por quatro núcleos "reais" - embora estes dificilmente ofereçam vantagens reais para usuários de escritório em comparação com os dual-cores hyper-threading antigos, como o i5-7200U.
Um conversível com Dolby Vision HDR e uma seleção de portas incluindo 2 Thunderbolt 3 sobre portas USB Type-C - esses componentes fazem do Lenovo ThinkPad X1 Yoga 2018 um dispositivo único.
É claro que podemos recomendar este dispositivo apesar do problema do alto-falante, já que isso é certamente uma questão única da nossa unidade de teste.
Lenovo ThinkPad X1 Yoga 2018-20LES01W00
- 10/17/2019 v7 (old)
Sven Kloevekorn
Price comparison
