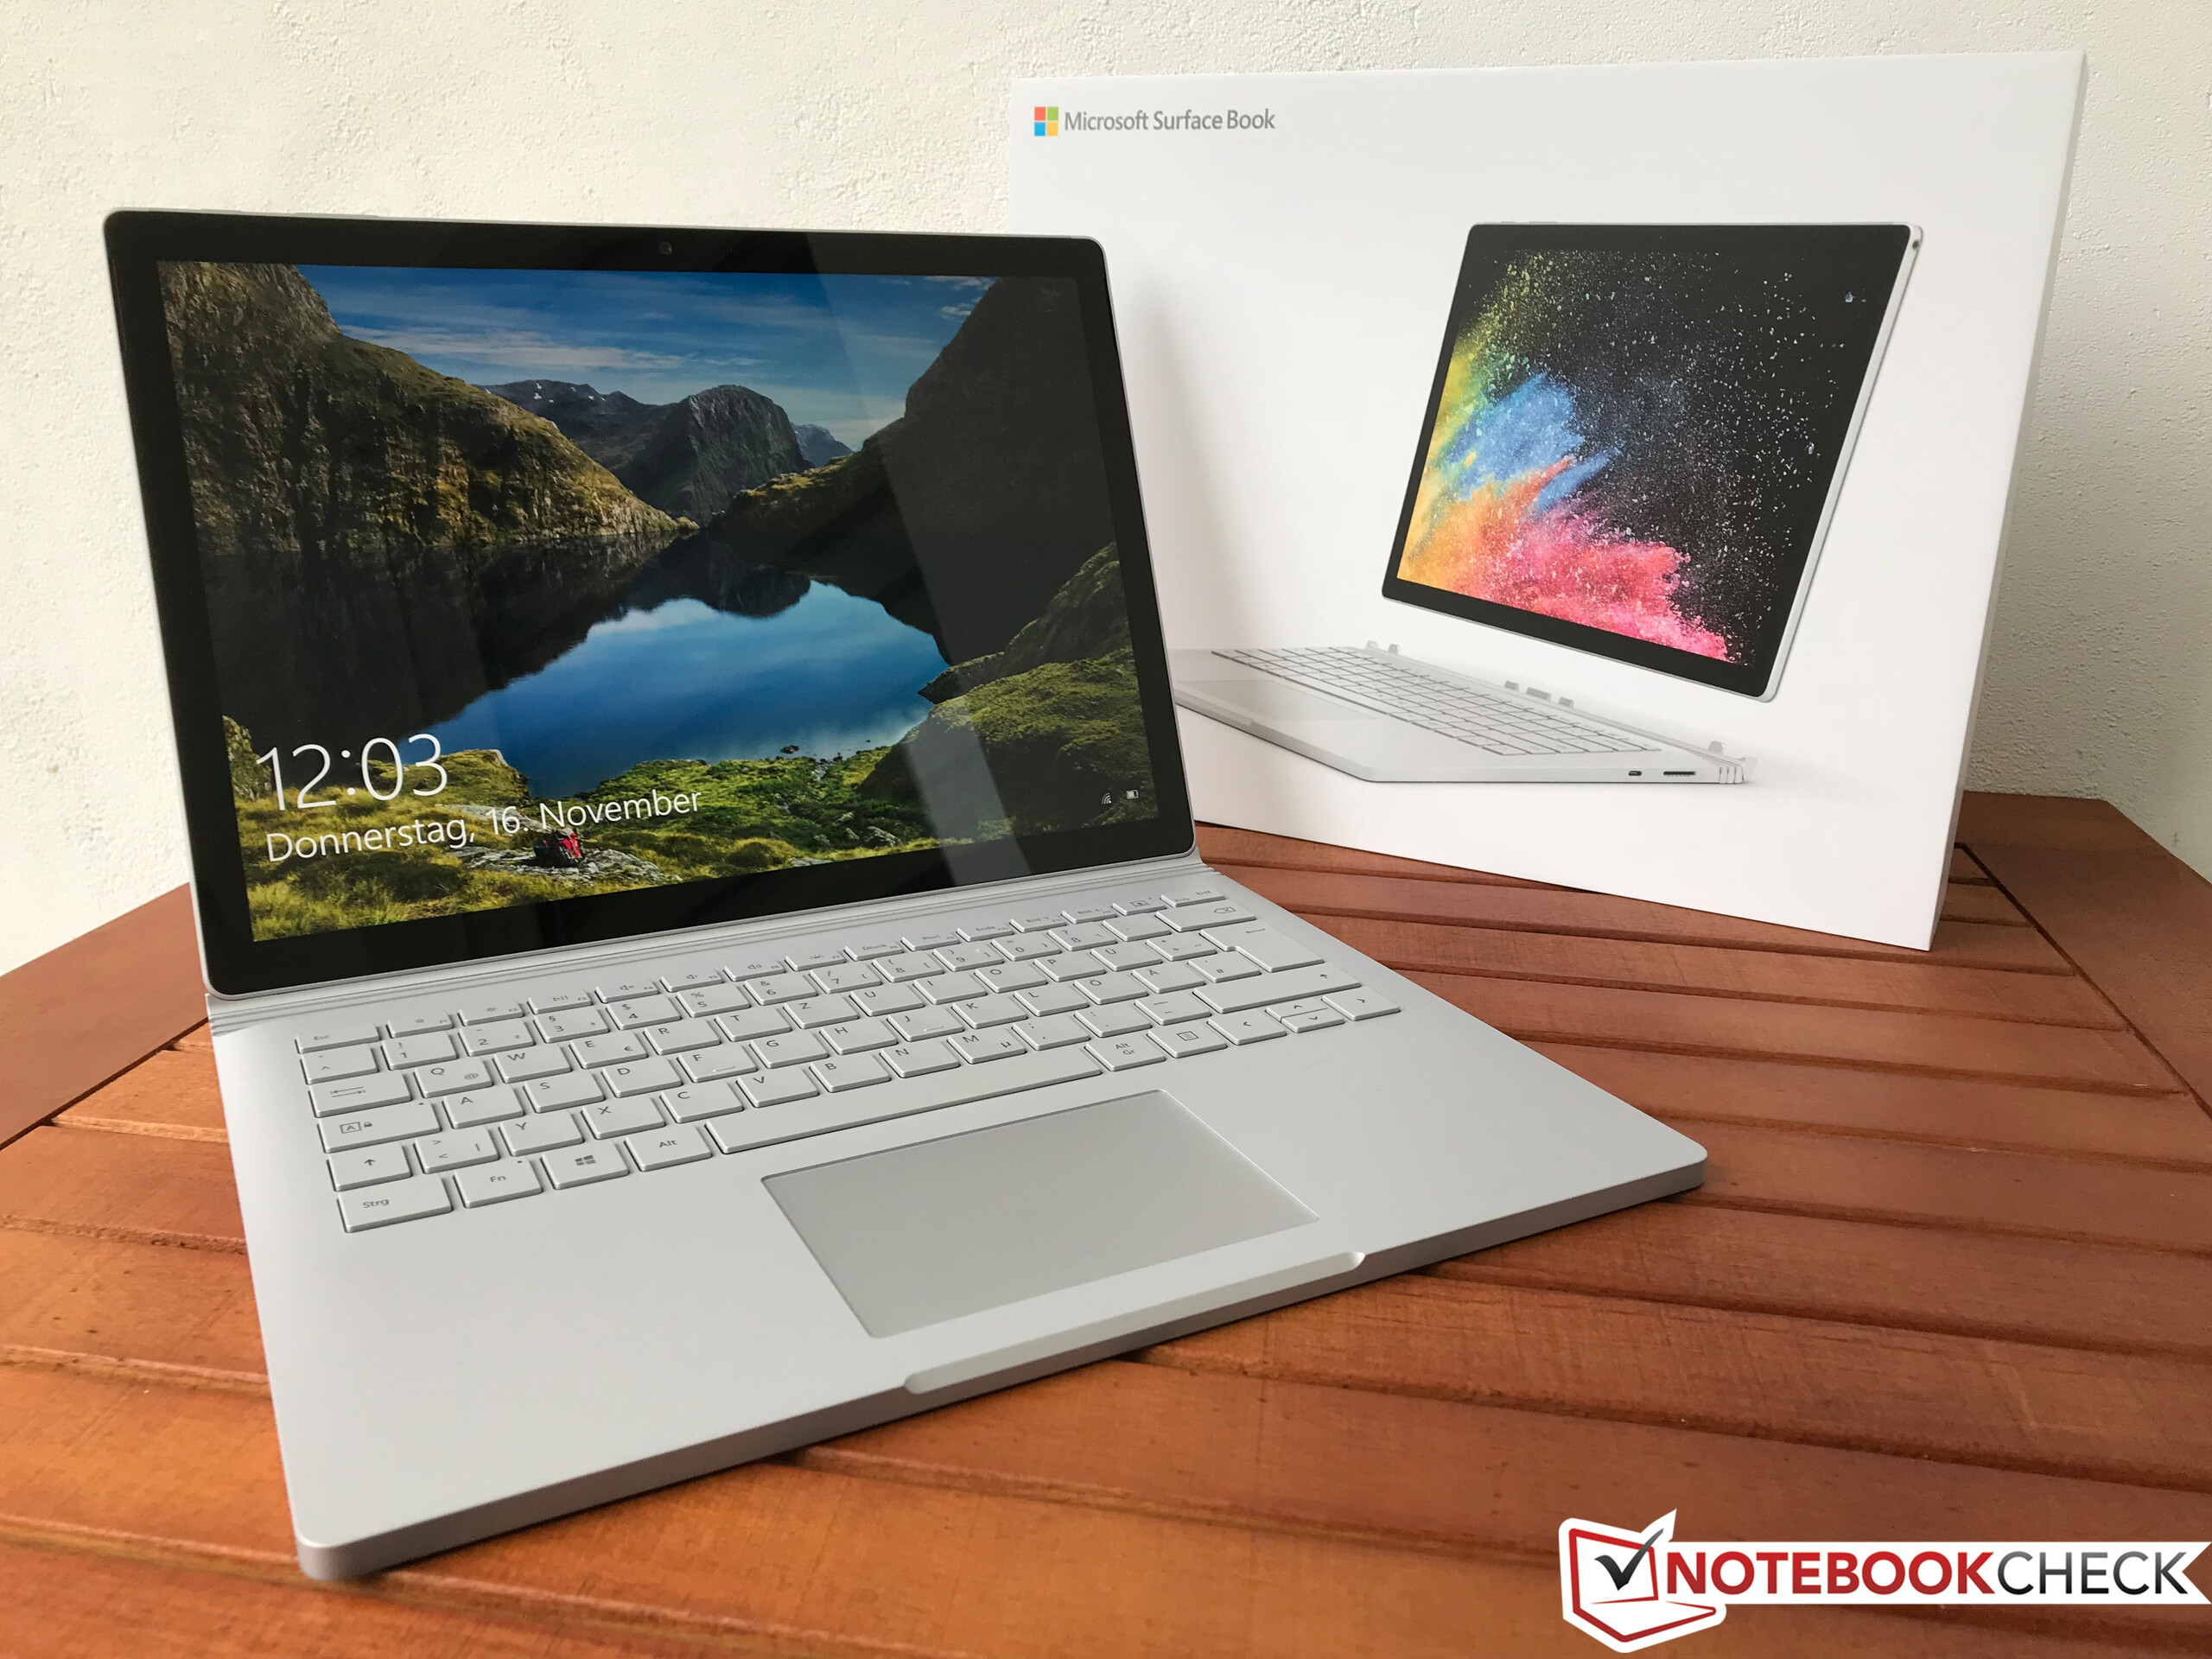
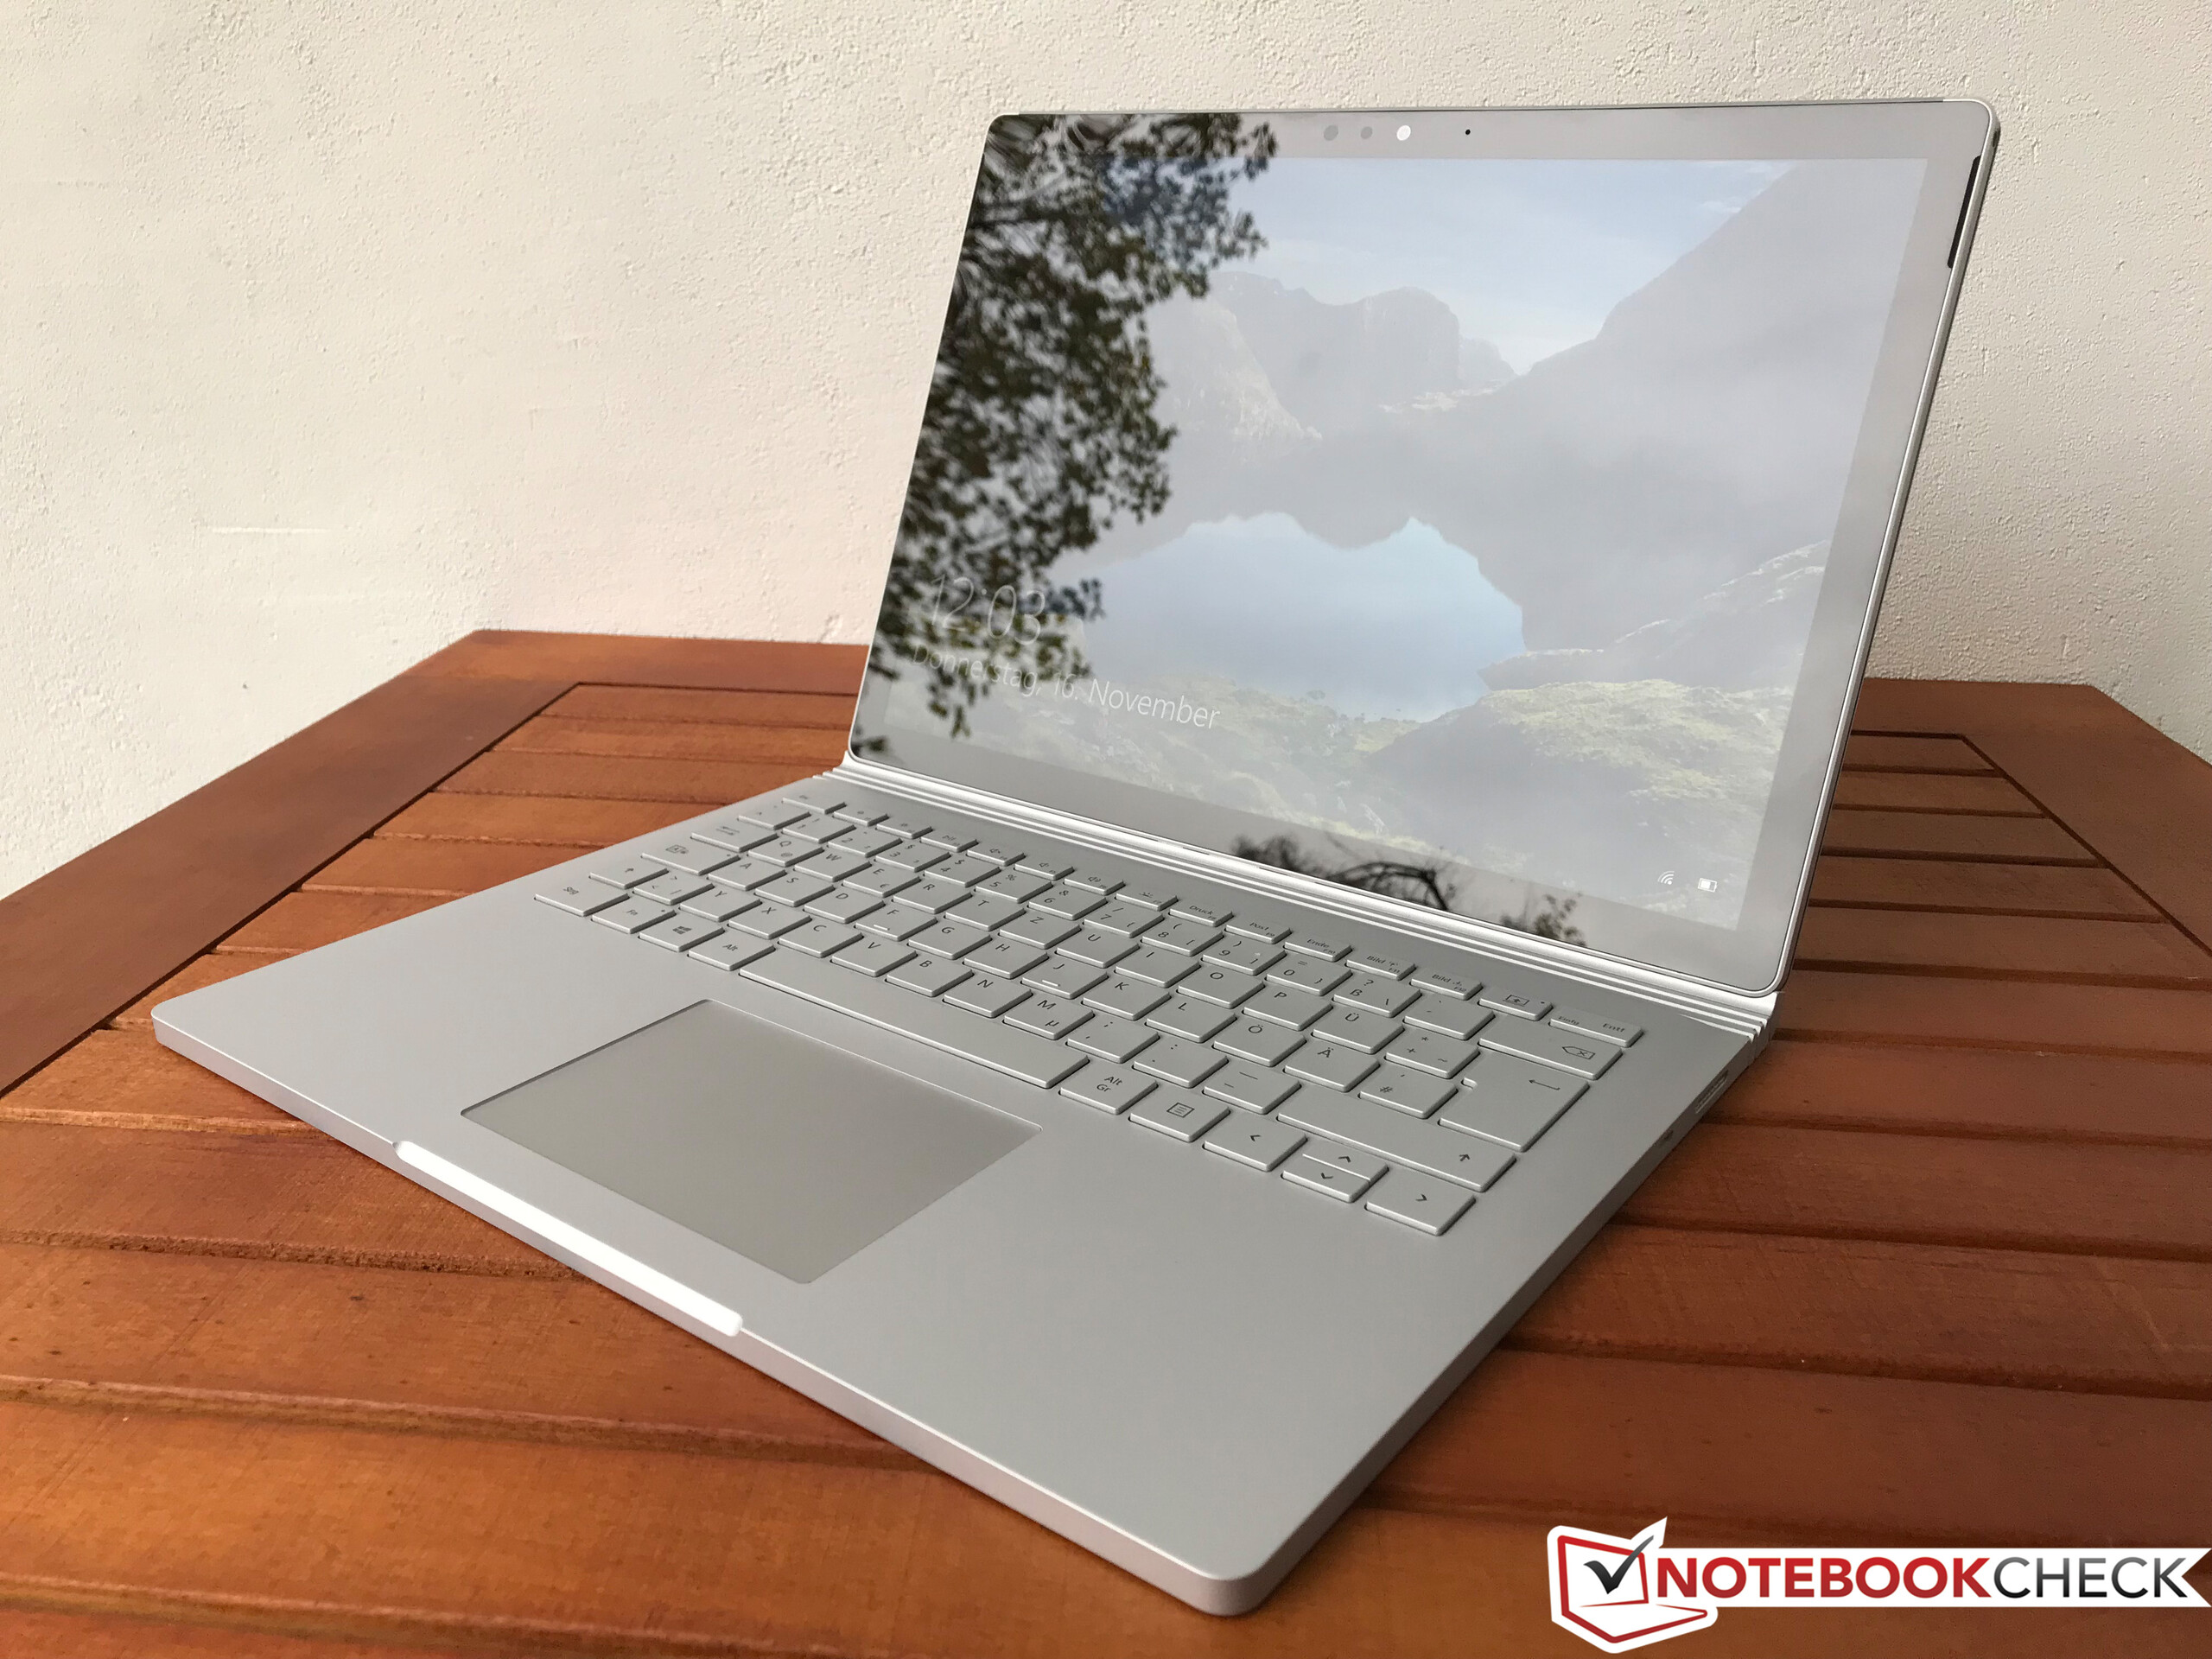
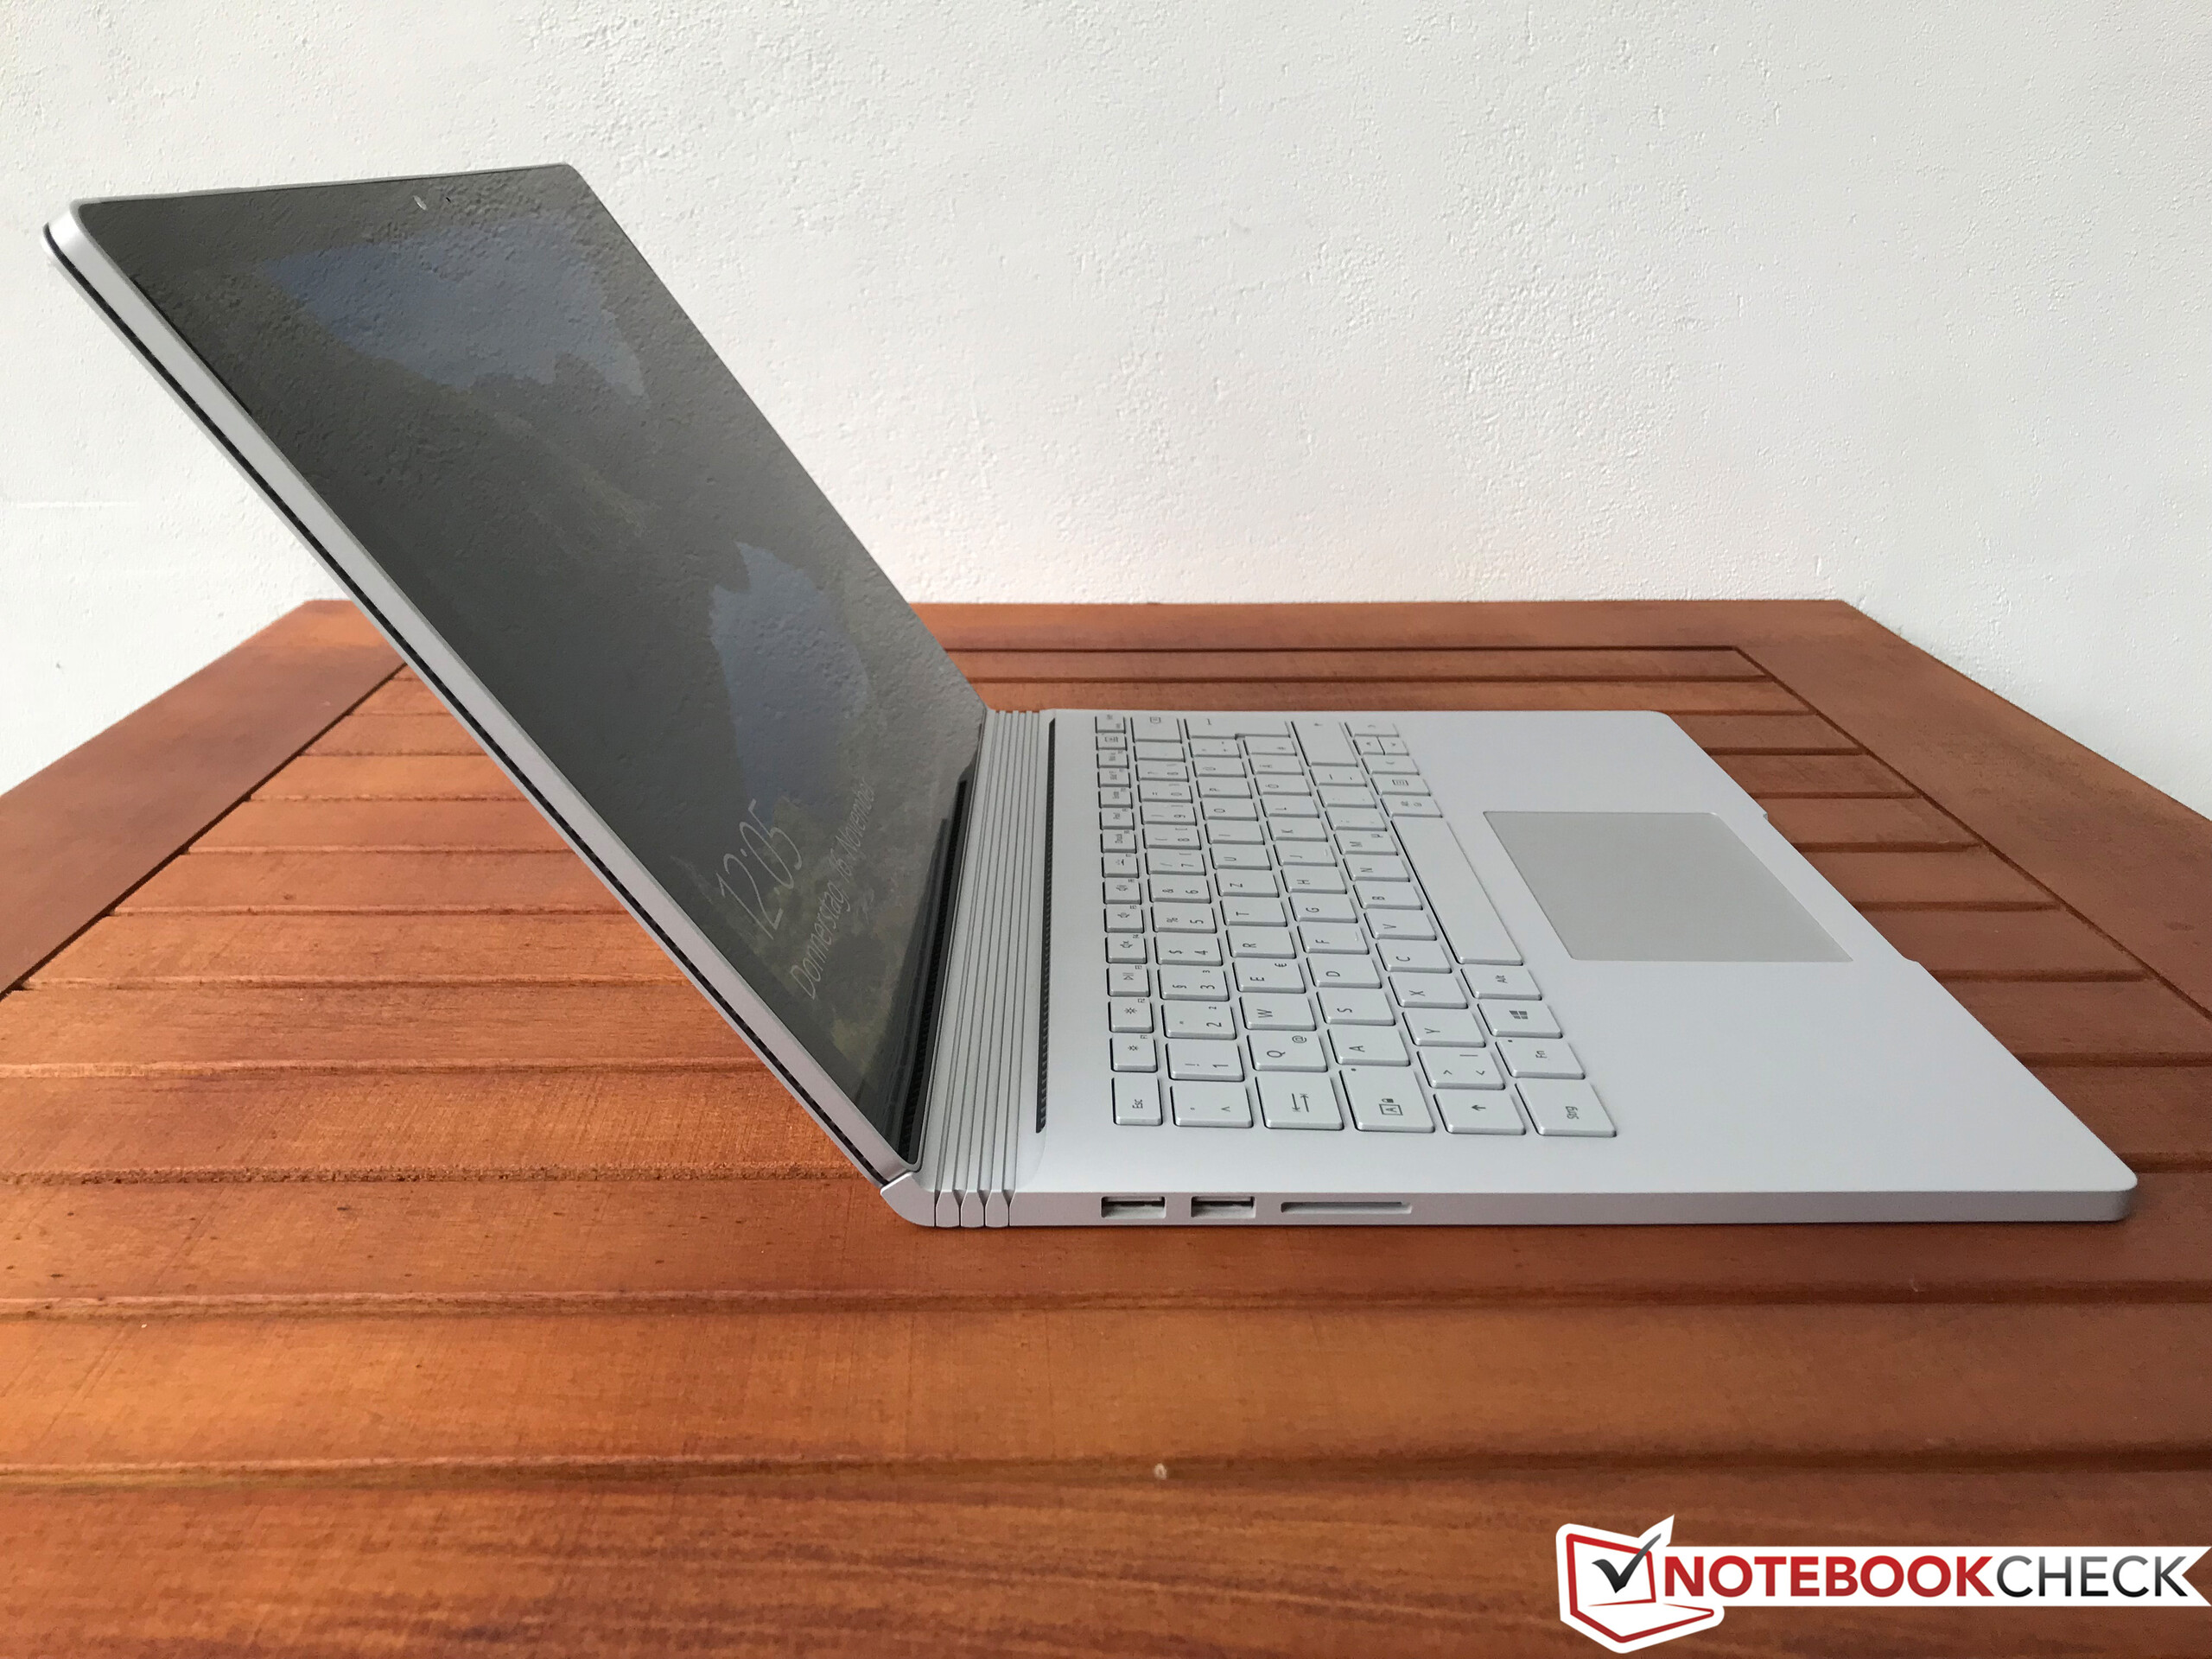
Breve Análise do Conversível Microsoft Surface Book 2 (13.5", i7, GTX 1050)
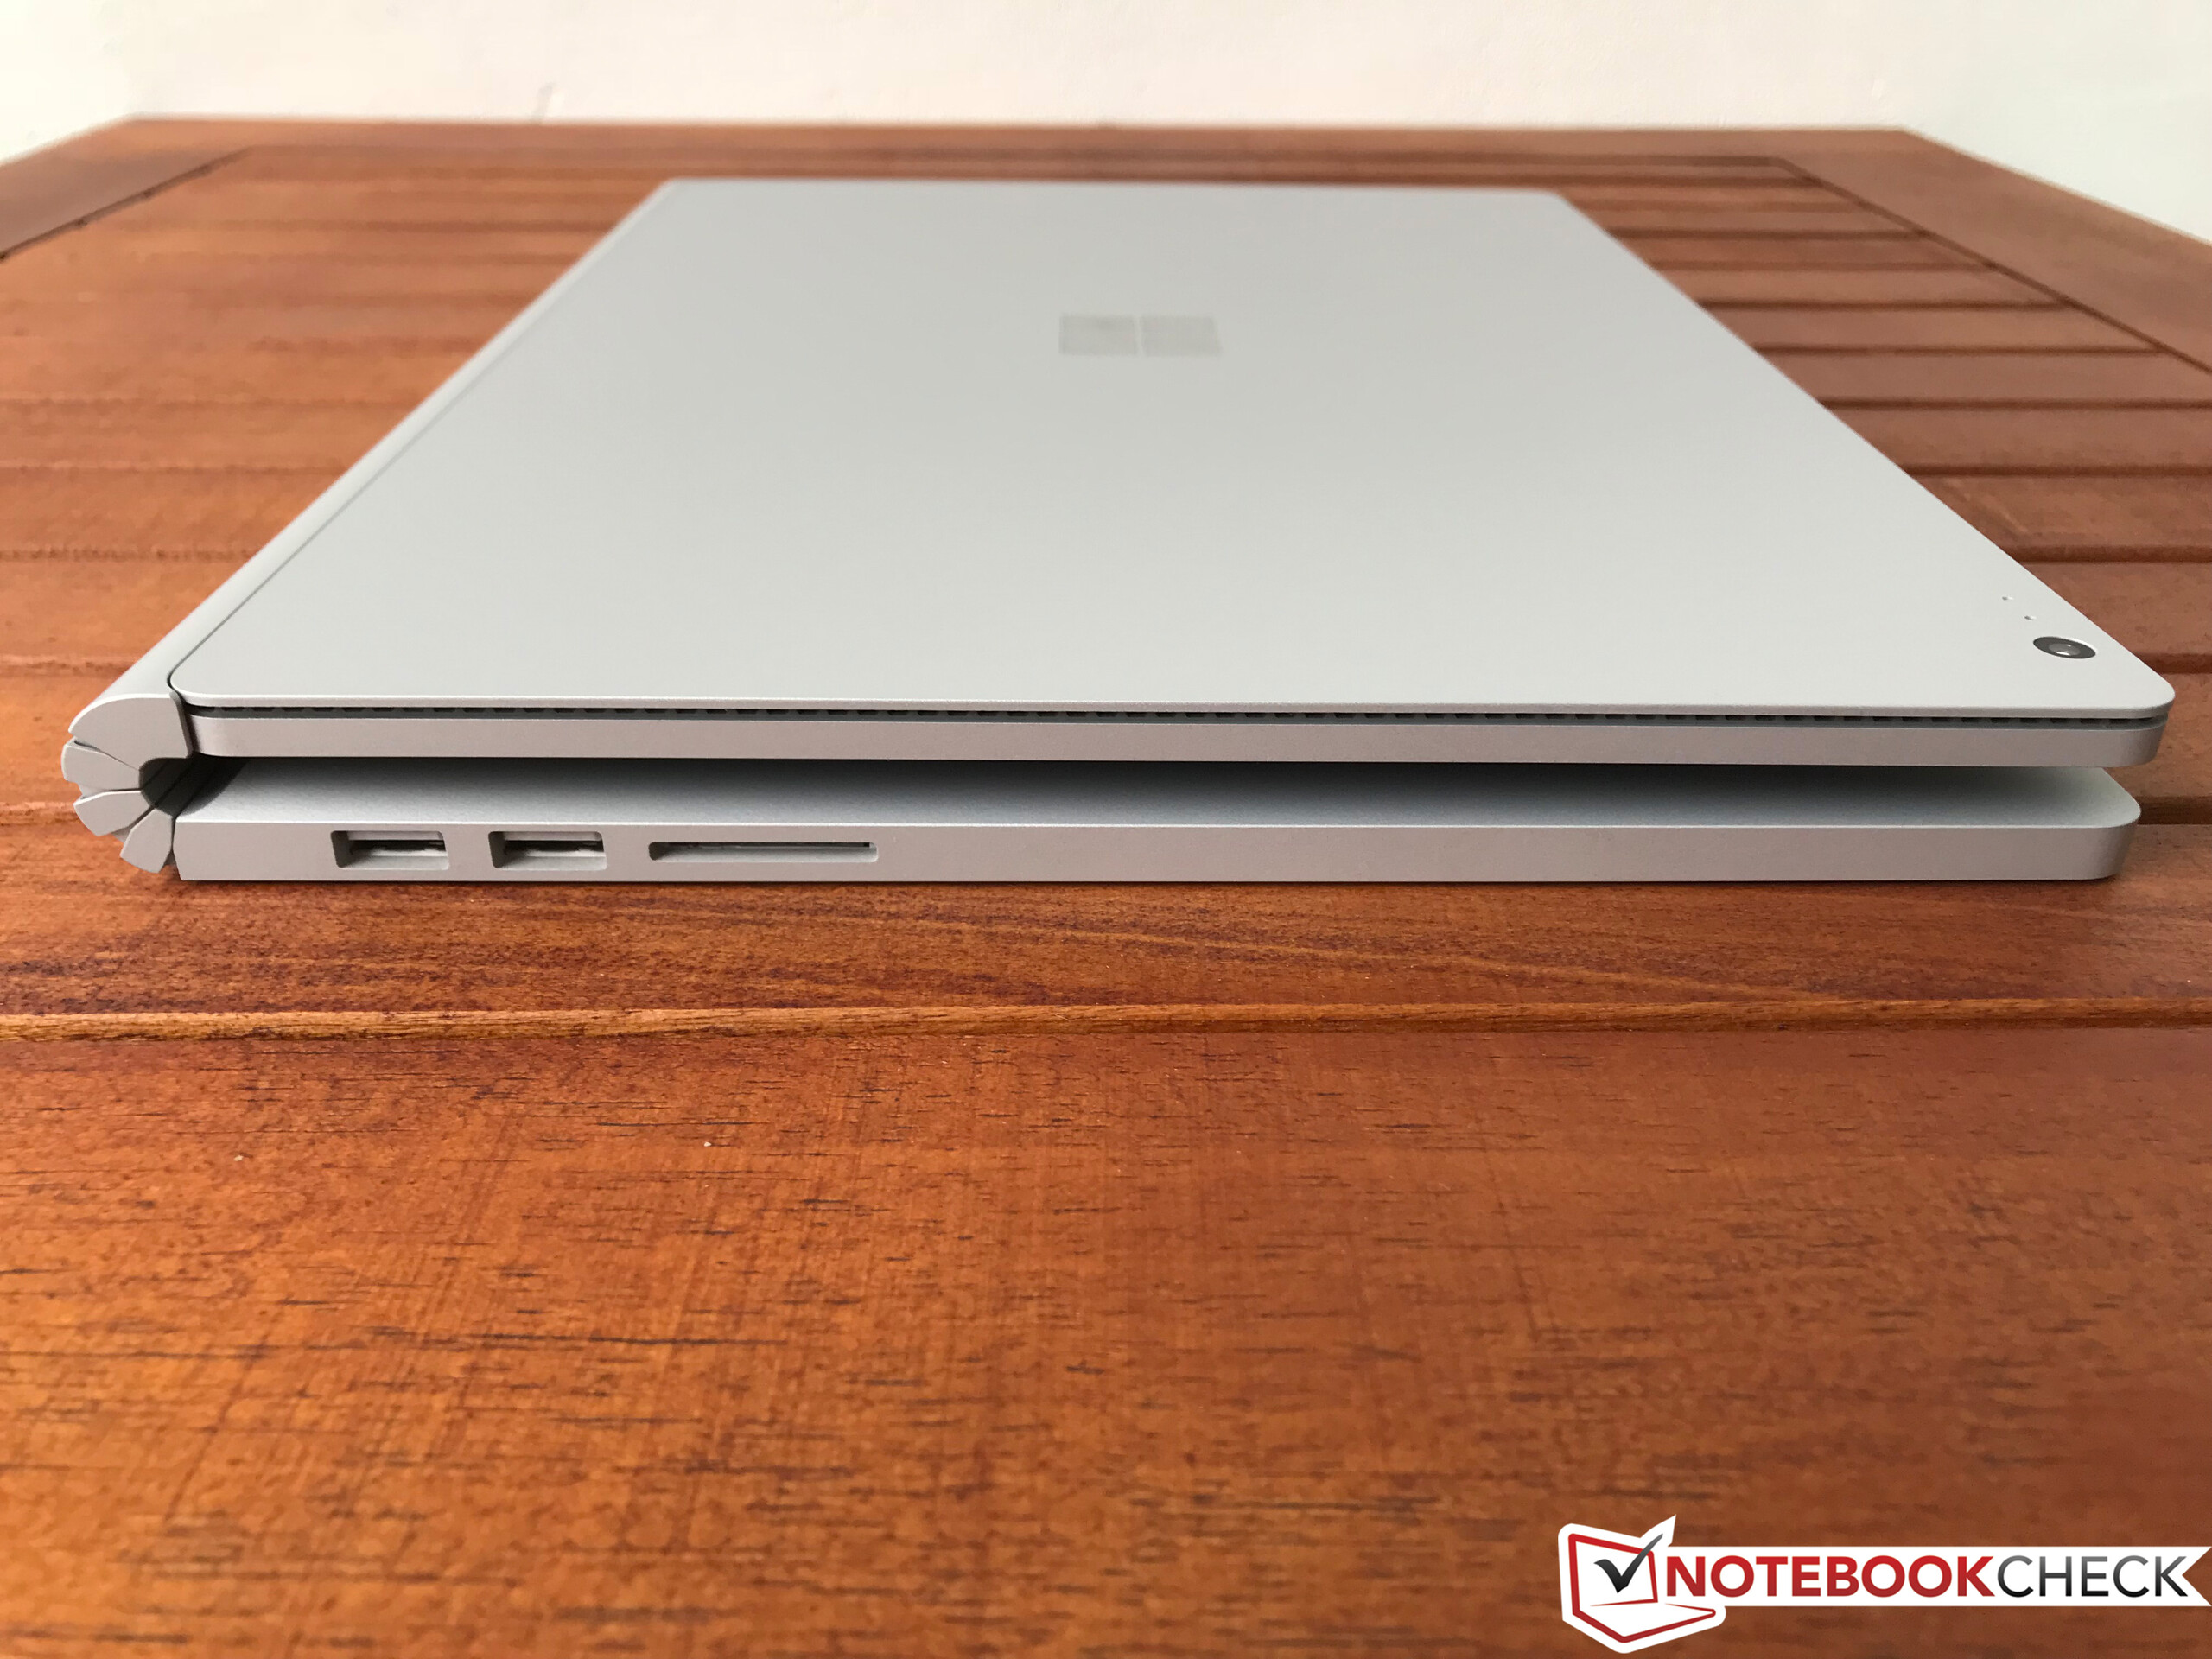
| SD Card Reader | |
| average JPG Copy Test (av. of 3 runs) | |
| Microsoft Surface Book 2 (Toshiba Exceria Pro SDXC 64 GB UHS-II) | |
| Dell XPS 13 i5-8250U (Toshiba Exceria Pro SDXC 64 GB UHS-II) | |
| Eve-Tech Eve V i5 (Toshiba Exceria microSDHC 32GB UHS-I) | |
| maximum AS SSD Seq Read Test (1GB) | |
| Microsoft Surface Book 2 (Toshiba Exceria Pro SDXC 64 GB UHS-II) | |
| Dell XPS 13 i5-8250U (Toshiba Exceria Pro SDXC 64 GB UHS-II) | |
| Eve-Tech Eve V i5 (Toshiba Exceria microSDHC 32GB UHS-I) | |
Cintilação da tela / PWM (modulação por largura de pulso)
| Tela tremeluzindo / PWM não detectado | 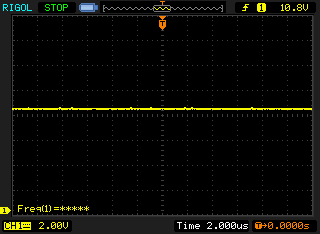 | ||
[pwm_comparison] Em comparação: 52 % de todos os dispositivos testados não usam PWM para escurecer a tela. Se PWM foi detectado, uma média de 7794 (mínimo: 5 - máximo: 343500) Hz foi medida. | |||
| |||||||||||||||||||||||||
iluminação: 89 %
iluminação com acumulador: 385 cd/m²
Contraste: 1833:1 (Preto: 0.21 cd/m²)
ΔE ColorChecker Calman: 1.6 | ∀{0.5-29.43 Ø4.73}
ΔE Greyscale Calman: 1.5 | ∀{0.09-98 Ø4.97}
95.9% sRGB (Argyll 1.6.3 3D)
64% AdobeRGB 1998 (Argyll 1.6.3 3D)
69.4% AdobeRGB 1998 (Argyll 3D)
95.7% sRGB (Argyll 3D)
67.9% Display P3 (Argyll 3D)
Gamma: 2.22
CCT: 6502 K
| Microsoft Surface Book 2 Panasonic MEI96A2 , , 3000x2000, 13.5" | Microsoft Surface Book with Performance Base Panasonic MEI96A2, , 3000x2000, 13.5" | Lenovo Yoga 920-13IKB-80Y7 AU Optronics B139HAN03.0, , 1920x1080, 13.9" | Microsoft Surface Pro 4 Core i7 Samsung 123YL01-001 ID: SDC3853, , 2736x1824, 12.3" | Microsoft Surface Laptop i5 ID: MEI96A2, Name: Panasonic VVX14T092N00, , 2256x1504, 13.5" | Apple MacBook Pro 13 2017 Touchbar i5 APPA034, , 2560x1600, 13.3" | Razer Blade (2017) LP140WF3-SPD1, , 1920x1080, 14" | Gigabyte Aero 14-K7 LG Philips LP140QH1-SPF1 (LGD049A), , 2560x1440, 14" | Eve-Tech Eve V i5 Sharp LQ123Z1JX3X, , 2880x1920, 12.3" | |
|---|---|---|---|---|---|---|---|---|---|
| Display | -2% | -7% | 0% | -0% | 25% | -5% | 2% | ||
| Display P3 Coverage (%) | 67.9 | 66.4 -2% | 62.5 -8% | 66.9 -1% | 67.8 0% | 98.6 45% | 65.1 -4% | 68.2 0% | |
| sRGB Coverage (%) | 95.7 | 95.4 0% | 91.7 -4% | 97.5 2% | 94.3 -1% | 100 4% | 91.2 -5% | 99.8 4% | |
| AdobeRGB 1998 Coverage (%) | 69.4 | 67.6 -3% | 64.1 -8% | 68.6 -1% | 69.5 0% | 86.5 25% | 65.9 -5% | 70 1% | |
| Response Times | -20% | 4% | -6% | -10% | -2% | 35% | 20% | -3% | |
| Response Time Grey 50% / Grey 80% * (ms) | 52.8 ? | 61 ? -16% | 46 ? 13% | 48.4 ? 8% | 50.8 ? 4% | 48 ? 9% | 25.2 ? 52% | 40 ? 24% | 49.1 ? 7% |
| Response Time Black / White * (ms) | 30 ? | 37 ? -23% | 31.6 ? -5% | 35.6 ? -19% | 37.2 ? -24% | 33.6 ? -12% | 24.8 ? 17% | 25.2 ? 16% | 33.6 ? -12% |
| PWM Frequency (Hz) | 10420 | 119000 ? | 21370 | 130 ? | 985 ? | ||||
| Screen | -17% | -94% | -7% | -10% | 8% | -62% | -59% | -22% | |
| Brightness middle (cd/m²) | 385 | 459 19% | 297.9 -23% | 436.7 13% | 384.2 0% | 551 43% | 272 -29% | 277 -28% | 471 22% |
| Brightness (cd/m²) | 372 | 423 14% | 278 -25% | 433 16% | 378 2% | 514 38% | 277 -26% | 252 -32% | 433 16% |
| Brightness Distribution (%) | 89 | 86 -3% | 81 -9% | 87 -2% | 90 1% | 88 -1% | 84 -6% | 84 -6% | 85 -4% |
| Black Level * (cd/m²) | 0.21 | 0.37 -76% | 0.44 -110% | 0.326 -55% | 0.36 -71% | 0.48 -129% | 0.26 -24% | 0.27 -29% | 0.32 -52% |
| Contrast (:1) | 1833 | 1241 -32% | 677 -63% | 1340 -27% | 1067 -42% | 1148 -37% | 1046 -43% | 1026 -44% | 1472 -20% |
| Colorchecker dE 2000 * | 1.6 | 2.28 -42% | 5.1 -219% | 1.82 -14% | 1.8 -13% | 0.8 50% | 4.59 -187% | 4.26 -166% | 2.2 -38% |
| Colorchecker dE 2000 max. * | 4.5 | 3.61 20% | 11 -144% | 4.2 7% | 1.4 69% | 8.49 -89% | 8.37 -86% | 5.6 -24% | |
| Greyscale dE 2000 * | 1.5 | 2.48 -65% | 6.7 -347% | 1.44 4% | 1.2 20% | 1 33% | 4.28 -185% | 4.32 -188% | 3.4 -127% |
| Gamma | 2.22 99% | 2.5 88% | 2.9 76% | 2.1 105% | 2.21 100% | 2.16 102% | 2.23 99% | 2.37 93% | 2.2 100% |
| CCT | 6502 100% | 8602 76% | 6839 95% | 6560 99% | 6708 97% | 6672 97% | 6848 95% | 7298 89% | 6270 104% |
| Color Space (Percent of AdobeRGB 1998) (%) | 64 | 62 -3% | 64.1 0% | 62.3 -3% | 63.7 0% | 55 -14% | 59 -8% | 70 9% | |
| Color Space (Percent of sRGB) (%) | 95.9 | 96 0% | 91.7 -4% | 97.5 2% | 94.2 -2% | 83 -13% | 91 -5% | 92.99 -3% | |
| Média Total (Programa/Configurações) | -13% /
-14% | -32% /
-64% | -4% /
-6% | -7% /
-8% | 10% /
11% | -14% /
-46% | -15% /
-38% | -8% /
-15% |
* ... menor é melhor
Exibir tempos de resposta
| ↔ Tempo de resposta preto para branco | ||
|---|---|---|
| 30 ms ... ascensão ↗ e queda ↘ combinadas | ↗ 16.4 ms ascensão | 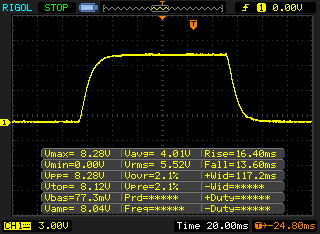 |
| ↘ 13.6 ms queda | ||
| A tela mostra taxas de resposta lentas em nossos testes e será insatisfatória para os jogadores. Em comparação, todos os dispositivos testados variam de 0.1 (mínimo) a 240 (máximo) ms. » 80 % de todos os dispositivos são melhores. Isso significa que o tempo de resposta medido é pior que a média de todos os dispositivos testados (19.9 ms). | ||
| ↔ Tempo de resposta 50% cinza a 80% cinza | ||
| 52.8 ms ... ascensão ↗ e queda ↘ combinadas | ↗ 25.2 ms ascensão | 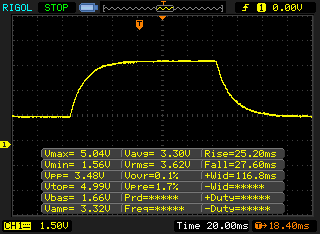 |
| ↘ 27.6 ms queda | ||
| A tela mostra taxas de resposta lentas em nossos testes e será insatisfatória para os jogadores. Em comparação, todos os dispositivos testados variam de 0.165 (mínimo) a 636 (máximo) ms. » 89 % de todos os dispositivos são melhores. Isso significa que o tempo de resposta medido é pior que a média de todos os dispositivos testados (31.1 ms). | ||
| PCMark 8 Home Score Accelerated v2 | 3694 pontos | |
| PCMark 8 Creative Score Accelerated v2 | 6165 pontos | |
| PCMark 8 Work Score Accelerated v2 | 4522 pontos | |
| PCMark 10 Score | 4119 pontos | |
Ajuda | ||
| Microsoft Surface Book 2 Samsung PM961 MZVLW256HEHP | Lenovo Yoga 920-13IKB-80Y7 Samsung PM961 MZVLW256HEHP | Microsoft Surface Laptop i7 Samsung PM971 KUS040202M | Dell XPS 13 i5-8250U Toshiba XG5 KXG50ZNV256G | Eve-Tech Eve V i7 Intel SSD 600p SSDPEKKW512G7 | Apple MacBook Pro 13 2017 Touchbar i5 Apple SSD AP0256 | |
|---|---|---|---|---|---|---|
| CrystalDiskMark 5.2 / 6 | 82% | 37% | -19% | 4% | 61% | |
| Write 4K (MB/s) | 140.6 | 142.1 1% | 129.6 -8% | 114 -19% | 152 8% | 32.94 -77% |
| Read 4K (MB/s) | 43.62 | 44.19 1% | 42.74 -2% | 25.45 -42% | 21 -52% | 23.77 -46% |
| Write Seq (MB/s) | 343.3 | 1112 224% | 971 183% | 319.4 -7% | 559 63% | 1345 292% |
| Read Seq (MB/s) | 1452 | 1884 30% | 989 -32% | 1151 -21% | 1066 -27% | 1509 4% |
| Write 4K Q32T1 (MB/s) | 344.4 | 747 117% | 384.4 12% | 349.8 2% | 444 29% | 365.5 6% |
| Read 4K Q32T1 (MB/s) | 457.2 | 446.8 -2% | 466.7 2% | 341.2 -25% | 457 0% | 528 15% |
| Write Seq Q32T1 (MB/s) | 344.3 | 1255 265% | 977 184% | 352.2 2% | 559 62% | 1354 293% |
| Read Seq Q32T1 (MB/s) | 2885 | 3400 18% | 1682 -42% | 1787 -38% | 1404 -51% | 2963 3% |

| 3DMark 06 Standard Score | 28314 pontos | |
| 3DMark 11 Performance | 7645 pontos | |
| 3DMark Ice Storm Standard Score | 32414 pontos | |
| 3DMark Cloud Gate Standard Score | 17718 pontos | |
| 3DMark Fire Strike Score | 5293 pontos | |
| 3DMark Time Spy Score | 1783 pontos | |
Ajuda | ||
| The Witcher 3 | |
| 1920x1080 Ultra Graphics & Postprocessing (HBAO+) | |
| Razer Blade (2017) | |
| Gigabyte Aero 14-K7 | |
| Asus ROG Strix GL703VD-DB74 | |
| Microsoft Surface Book 2 | |
| Asus ZenBook Pro UX550VD | |
| Asus VivoBook Pro 15 N580VD-DM028T | |
| Microsoft Surface Book with Performance Base | |
| 1920x1080 High Graphics & Postprocessing (Nvidia HairWorks Off) | |
| Razer Blade (2017) | |
| Gigabyte Aero 14-K7 | |
| Asus ROG Strix GL703VD-DB74 | |
| Microsoft Surface Book 2 | |
| Asus ZenBook Pro UX550VD | |
| Microsoft Surface Book with Performance Base | |
| Asus VivoBook Pro 15 N580VD-DM028T | |
| HP Envy x360 15m-bq121dx | |
| For Honor | |
| 1920x1080 Extreme Preset AA:T AF:16x | |
| Razer Blade (2017) | |
| Microsoft Surface Book 2 | |
| Asus ZenBook Pro UX550VD | |
| 1920x1080 High Preset AA:T AF:8x | |
| Razer Blade (2017) | |
| Microsoft Surface Book 2 | |
| Asus ZenBook Pro UX550VD | |
| Ghost Recon Wildlands | |
| 1920x1080 Ultra Preset AA:T AF:16x | |
| Microsoft Surface Book 2 | |
| Asus ZenBook Pro UX550VD | |
| 1920x1080 High Preset AA:T AF:4x | |
| Asus ZenBook Pro UX550VD | |
| Microsoft Surface Book 2 | |
| baixo | média | alto | ultra | |
|---|---|---|---|---|
| BioShock Infinite (2013) | 246.6 | 168.3 | 149.1 | 59.4 |
| Dota 2 (2013) | 116.6 | 97.3 | 87.5 | |
| The Witcher 3 (2015) | 110.6 | 67.1 | 38.3 | 21 |
| Rise of the Tomb Raider (2016) | 95.3 | 66.4 | 37.8 | 32.4 |
| For Honor (2017) | 147.9 | 54.9 | 51.6 | 39 |
| Ghost Recon Wildlands (2017) | 73.8 | 35.9 | 28.8 | 26.2 |
| Assassin´s Creed Origins (2017) | 55 | 30 | 22 | 15 |
Barulho
| Ocioso |
| 29.4 / 29.4 / 29.4 dB |
| Carga |
| 31.4 / 49 dB |
 | ||
30 dB silencioso 40 dB(A) audível 50 dB(A) ruidosamente alto |
||
min: | ||
(±) A temperatura máxima no lado superior é 40.8 °C / 105 F, em comparação com a média de 35.4 °C / 96 F , variando de 19.6 a 60 °C para a classe Convertible.
(±) A parte inferior aquece até um máximo de 43.7 °C / 111 F, em comparação com a média de 36.9 °C / 98 F
(+) Em uso inativo, a temperatura média para o lado superior é 23.8 °C / 75 F, em comparação com a média do dispositivo de 30.3 °C / ### class_avg_f### F.
(±) Jogando The Witcher 3, a temperatura média para o lado superior é 37.1 °C / 99 F, em comparação com a média do dispositivo de 30.3 °C / ## #class_avg_f### F.
(-) Os apoios para as mãos e o touchpad podem ficar muito quentes ao toque, com um máximo de 40.8 °C / 105.4 F.
(-) A temperatura média da área do apoio para as mãos de dispositivos semelhantes foi 28 °C / 82.4 F (-12.8 °C / -23 F).
(+) A temperatura máxima no lado superior é 38.5 °C / 101 F, em comparação com a média de 35.4 °C / 96 F , variando de 19.6 a 60 °C para a classe Convertible.
(+) A parte inferior aquece até um máximo de 39.7 °C / 103 F, em comparação com a média de 36.9 °C / 98 F
(+) Em uso inativo, a temperatura média para o lado superior é 21.3 °C / 70 F, em comparação com a média do dispositivo de 30.3 °C / ### class_avg_f### F.
(+) Jogando The Witcher 3, a temperatura média para o lado superior é 31.6 °C / 89 F, em comparação com a média do dispositivo de 30.3 °C / ## #class_avg_f### F.
(+) Os apoios para as mãos e o touchpad são mais frios que a temperatura da pele, com um máximo de 26.1 °C / 79 F e, portanto, são frios ao toque.
(±) A temperatura média da área do apoio para as mãos de dispositivos semelhantes foi 28 °C / 82.4 F (+1.9 °C / 3.4 F).
Microsoft Surface Book 2 análise de áudio
(±) | o volume do alto-falante é médio, mas bom (###valor### dB)
Graves 100 - 315Hz
(±) | graves reduzidos - em média 12.4% menor que a mediana
(±) | a linearidade dos graves é média (12.3% delta para a frequência anterior)
Médios 400 - 2.000 Hz
(+) | médios equilibrados - apenas 1.9% longe da mediana
(+) | médios são lineares (3.6% delta para frequência anterior)
Altos 2 - 16 kHz
(+) | agudos equilibrados - apenas 4.8% longe da mediana
(±) | a linearidade dos máximos é média (9.3% delta para frequência anterior)
Geral 100 - 16.000 Hz
(±) | a linearidade do som geral é média (18.2% diferença em relação à mediana)
Comparado com a mesma classe
» 39% de todos os dispositivos testados nesta classe foram melhores, 7% semelhantes, 54% piores
» O melhor teve um delta de 6%, a média foi 20%, o pior foi 57%
Comparado com todos os dispositivos testados
» 39% de todos os dispositivos testados foram melhores, 8% semelhantes, 53% piores
» O melhor teve um delta de 4%, a média foi 24%, o pior foi 134%
Lenovo Yoga 920-13IKB-80Y7 análise de áudio
(-) | alto-falantes não muito altos (###valor### dB)
Graves 100 - 315Hz
(±) | graves reduzidos - em média 14.7% menor que a mediana
(-) | graves não são lineares (15.7% delta para frequência anterior)
Médios 400 - 2.000 Hz
(+) | médios equilibrados - apenas 2.3% longe da mediana
(+) | médios são lineares (5.5% delta para frequência anterior)
Altos 2 - 16 kHz
(+) | agudos equilibrados - apenas 2.9% longe da mediana
(+) | os máximos são lineares (6.8% delta da frequência anterior)
Geral 100 - 16.000 Hz
(±) | a linearidade do som geral é média (18.5% diferença em relação à mediana)
Comparado com a mesma classe
» 41% de todos os dispositivos testados nesta classe foram melhores, 8% semelhantes, 51% piores
» O melhor teve um delta de 6%, a média foi 20%, o pior foi 57%
Comparado com todos os dispositivos testados
» 41% de todos os dispositivos testados foram melhores, 8% semelhantes, 51% piores
» O melhor teve um delta de 4%, a média foi 24%, o pior foi 134%
| desligado | |
| Ocioso | |
| Carga |
|
Key:
min: | |
| Microsoft Surface Book 2 i7-8650U, GeForce GTX 1050 Mobile, Samsung PM961 MZVLW256HEHP, IPS, 3000x2000, 13.5" | Microsoft Surface Book with Performance Base 6600U, GeForce GTX 965M, Toshiba NVMe THNSN5256GPU7, IPS, 3000x2000, 13.5" | Lenovo Yoga 920-13IKB-80Y7 i5-8550U, UHD Graphics 620, Samsung PM961 MZVLW256HEHP, IPS, 1920x1080, 13.9" | Microsoft Surface Laptop i7 i7-7660U, Iris Plus Graphics 640, Samsung PM971 KUS040202M, IPS, 2256x1504, 13.5" | Apple MacBook Pro 13 2017 Touchbar i5 i5-7267U, Iris Plus Graphics 650, Apple SSD AP0256, IPS, 2560x1600, 13.3" | Razer Blade (2017) i7-7700HQ, GeForce GTX 1060 Mobile, Samsung PM951 NVMe MZVLV256, IPS, 1920x1080, 14" | Gigabyte Aero 14-K7 i7-7700HQ, GeForce GTX 1050 Ti Mobile, Samsung SM961 MZVPW256HEGL, IPS, 2560x1440, 14" | Eve-Tech Eve V i7 i7-7Y75, HD Graphics 615, Intel SSD 600p SSDPEKKW512G7, IPS, 2880x1920, 12.3" | |
|---|---|---|---|---|---|---|---|---|
| Power Consumption | 20% | 48% | 48% | 24% | -17% | -38% | 41% | |
| Idle Minimum * (Watt) | 4.7 | 4.15 12% | 3.1 34% | 2.7 43% | 2.8 40% | 7.5 -60% | 9 -91% | 4.5 4% |
| Idle Average * (Watt) | 10.6 | 8 25% | 6.6 38% | 7.6 28% | 10.9 -3% | 12.1 -14% | 14 -32% | 7.6 28% |
| Idle Maximum * (Watt) | 12.3 | 11.9 3% | 7 43% | 7.8 37% | 11.4 7% | 14.3 -16% | 19 -54% | 8.1 34% |
| Load Average * (Watt) | 81 | 67 17% | 35.2 57% | 37.5 54% | 55.4 32% | 73.5 9% | 84 -4% | 22 73% |
| Witcher 3 ultra * (Watt) | 97 | 58 40% | 31.7 67% | 108 -11% | 95 2% | |||
| Load Maximum * (Watt) | 100.3 | 76 24% | 34.6 66% | 41.6 59% | 57.5 43% | 110.2 -10% | 149 -49% | 33.1 67% |
* ... menor é melhor
| Microsoft Surface Book 2 i7-8650U, GeForce GTX 1050 Mobile, 75 Wh | Microsoft Surface Book with Performance Base 6600U, GeForce GTX 965M, 78 Wh | Lenovo Yoga 920-13IKB-80Y7 i5-8550U, UHD Graphics 620, 70 Wh | Microsoft Surface Pro 4 Core i7 6650U, Iris Graphics 540, 38 Wh | Microsoft Surface Laptop i7 i7-7660U, Iris Plus Graphics 640, 45 Wh | Apple MacBook Pro 13 2017 Touchbar i5 i5-7267U, Iris Plus Graphics 650, 49.2 Wh | Razer Blade (2017) i7-7700HQ, GeForce GTX 1060 Mobile, 70 Wh | Gigabyte Aero 14-K7 i7-7700HQ, GeForce GTX 1050 Ti Mobile, 94.24 Wh | |
|---|---|---|---|---|---|---|---|---|
| Duração da bateria | -21% | -4% | -57% | -30% | -47% | -18% | -33% | |
| Reader / Idle (h) | 24.5 | 25.5 4% | 27.6 13% | 10.9 -56% | 15.9 -35% | |||
| H.264 (h) | 15.6 | 12.8 -18% | 6.9 -56% | 7.8 -50% | ||||
| WiFi v1.3 (h) | 11.1 | 9.6 -14% | 11.4 3% | 4.9 -56% | 7.6 -32% | 8.7 -22% | 9.1 -18% | 8.9 -20% |
| Witcher 3 ultra (h) | 3.8 | |||||||
| Load (h) | 3.2 | 1.5 -53% | 2.3 -28% | 1.3 -59% | 1.9 -41% | 1.2 -63% | 2.4 -25% |
Pro
Contra
Microsoft Surface Book 2
- 11/28/2017 v6 (old)
Andreas Osthoff
Price comparison
