Breve Análise do Portátil Acer Aspire VX5-591G (7700HQ, FHD, GTX 1050 Ti)

| SD Card Reader | |
| average JPG Copy Test (av. of 3 runs) | |
| Dell XPS 15 2017 9560 (7300HQ, Full-HD) | |
| Acer Aspire VX5-591G-75C4 VX15 | |
| Acer Aspire VN7-593G-73HP V15 Nitro BE | |
| Asus Zenbook UX510UW-CN044T | |
| maximum AS SSD Seq Read Test (1GB) | |
| Dell XPS 15 2017 9560 (7300HQ, Full-HD) | |
| Acer Aspire VX5-591G-75C4 VX15 | |
| Acer Aspire VN7-593G-73HP V15 Nitro BE | |
| Asus Zenbook UX510UW-CN044T | |
| |||||||||||||||||||||||||
iluminação: 85 %
iluminação com acumulador: 281 cd/m²
Contraste: 878:1 (Preto: 0.32 cd/m²)
ΔE ColorChecker Calman: 5.16 | ∀{0.5-29.43 Ø4.71}
ΔE Greyscale Calman: 4.57 | ∀{0.09-98 Ø4.96}
58% sRGB (Argyll 1.6.3 3D)
37% AdobeRGB 1998 (Argyll 1.6.3 3D)
40.2% AdobeRGB 1998 (Argyll 3D)
58.2% sRGB (Argyll 3D)
38.88% Display P3 (Argyll 3D)
Gamma: 2.59
CCT: 6931 K
| Acer Aspire VX5-591G-75C4 VX15 LG Philips LGD0550 / LP156WF6-SPK4, , 1920x1080, 15.6" | Acer Aspire VN7-593G-73HP V15 Nitro BE LG Display LP156WF6-SPP1, , 1920x1080, 15.6" | Dell XPS 15 2017 9560 (7300HQ, Full-HD) Sharp SHP1453 LQ156M1, , 1920x1080, 15.6" | Asus Zenbook UX510UW-CN044T LG Philips LP156WF6-SPB6, , 1920x1080, 15.6" | |
|---|---|---|---|---|
| Display | 57% | 74% | 47% | |
| Display P3 Coverage (%) | 38.88 | 65.8 69% | 68.9 77% | 61.5 58% |
| sRGB Coverage (%) | 58.2 | 85.1 46% | 98.9 70% | 80.4 38% |
| AdobeRGB 1998 Coverage (%) | 40.2 | 62.2 55% | 70.9 76% | 58.8 46% |
| Response Times | -67% | -137% | -48% | |
| Response Time Grey 50% / Grey 80% * (ms) | 22 ? | 41 ? -86% | 54 ? -145% | 40 ? -82% |
| Response Time Black / White * (ms) | 23 ? | 34 ? -48% | 52.4 ? -128% | 26 ? -13% |
| PWM Frequency (Hz) | ||||
| Screen | 16% | 27% | 7% | |
| Brightness middle (cd/m²) | 281 | 322 15% | 400 42% | 326 16% |
| Brightness (cd/m²) | 257 | 297 16% | 392 53% | 316 23% |
| Brightness Distribution (%) | 85 | 86 1% | 89 5% | 80 -6% |
| Black Level * (cd/m²) | 0.32 | 0.31 3% | 0.26 19% | 0.35 -9% |
| Contrast (:1) | 878 | 1039 18% | 1538 75% | 931 6% |
| Colorchecker dE 2000 * | 5.16 | 4.73 8% | 4.9 5% | 5.49 -6% |
| Colorchecker dE 2000 max. * | 9.09 | 12.37 -36% | 11 -21% | 11.36 -25% |
| Greyscale dE 2000 * | 4.57 | 2.99 35% | 7.2 -58% | 4.84 -6% |
| Gamma | 2.59 85% | 2.32 95% | 2.11 104% | 2.23 99% |
| CCT | 6931 94% | 6905 94% | 6911 94% | 5971 109% |
| Color Space (Percent of AdobeRGB 1998) (%) | 37 | 56 51% | 64.2 74% | 53 43% |
| Color Space (Percent of sRGB) (%) | 58 | 85 47% | 98.9 71% | 80 38% |
| Média Total (Programa/Configurações) | 2% /
13% | -12% /
14% | 2% /
8% |
* ... menor é melhor
Exibir tempos de resposta
| ↔ Tempo de resposta preto para branco | ||
|---|---|---|
| 23 ms ... ascensão ↗ e queda ↘ combinadas | ↗ 13 ms ascensão | 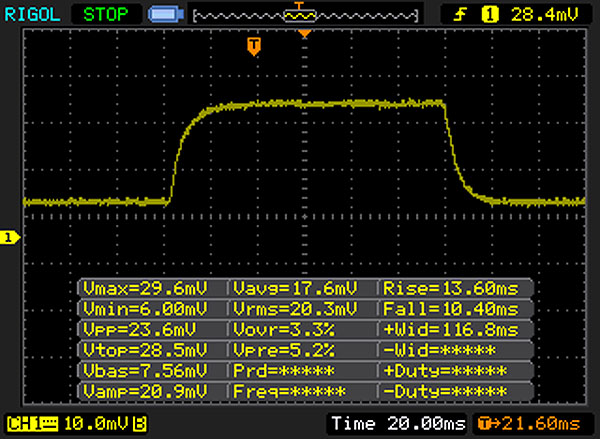 |
| ↘ 10 ms queda | ||
| A tela mostra boas taxas de resposta em nossos testes, mas pode ser muito lenta para jogadores competitivos. Em comparação, todos os dispositivos testados variam de 0.1 (mínimo) a 240 (máximo) ms. » 52 % de todos os dispositivos são melhores. Isso significa que o tempo de resposta medido é pior que a média de todos os dispositivos testados (19.8 ms). | ||
| ↔ Tempo de resposta 50% cinza a 80% cinza | ||
| 22 ms ... ascensão ↗ e queda ↘ combinadas | ↗ 10 ms ascensão | 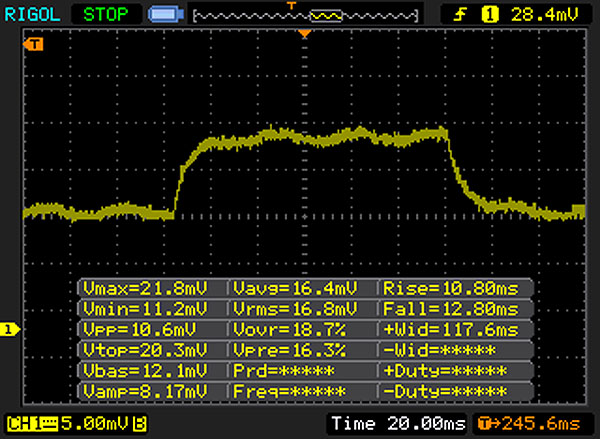 |
| ↘ 12 ms queda | ||
| A tela mostra boas taxas de resposta em nossos testes, mas pode ser muito lenta para jogadores competitivos. Em comparação, todos os dispositivos testados variam de 0.165 (mínimo) a 636 (máximo) ms. » 34 % de todos os dispositivos são melhores. Isso significa que o tempo de resposta medido é melhor que a média de todos os dispositivos testados (31 ms). | ||
Cintilação da tela / PWM (modulação por largura de pulso)
| Tela tremeluzindo / PWM não detectado | ||
[pwm_comparison] Em comparação: 52 % de todos os dispositivos testados não usam PWM para escurecer a tela. Se PWM foi detectado, uma média de 7757 (mínimo: 5 - máximo: 343500) Hz foi medida. | ||
| PCMark 8 | |
| Home Score Accelerated v2 | |
| Dell XPS 15 2017 9560 (7300HQ, Full-HD) | |
| Acer Aspire VX5-591G-75C4 VX15 | |
| Asus Zenbook UX510UW-CN044T | |
| Work Score Accelerated v2 | |
| Dell XPS 15 2017 9560 (7300HQ, Full-HD) | |
| Acer Aspire VX5-591G-75C4 VX15 | |
| Asus Zenbook UX510UW-CN044T | |
| PCMark 8 Home Score Accelerated v2 | 3565 pontos | |
| PCMark 8 Work Score Accelerated v2 | 4442 pontos | |
Ajuda | ||
| Acer Aspire VX5-591G-75C4 VX15 Toshiba MQ01ABD100 | Acer Aspire VN7-593G-73HP V15 Nitro BE Seagate Mobile HDD 1TB ST1000LM035 | Dell XPS 15 2017 9560 (7300HQ, Full-HD) WDC WD10SPCX-75KHST0 + SanDisk Z400s M.2 2242 32 GB Cache | Asus Zenbook UX510UW-CN044T SanDisk SD8SNAT256G1002 | |
|---|---|---|---|---|
| CrystalDiskMark 3.0 | 28% | 1647% | 8078% | |
| Read Seq (MB/s) | 101.5 | 120.9 19% | 123 21% | 459.3 353% |
| Write Seq (MB/s) | 100.6 | 101.8 1% | 74.2 -26% | 325.5 224% |
| Read 512 (MB/s) | 28.33 | 37.83 34% | 101.7 259% | 279.2 886% |
| Write 512 (MB/s) | 28.31 | 84.4 198% | 42.51 50% | 280.1 889% |
| Read 4k (MB/s) | 0.327 | 0.473 45% | 10.84 3215% | 22.43 6759% |
| Write 4k (MB/s) | 0.846 | 0.313 -63% | 1.021 21% | 74.9 8753% |
| Read 4k QD32 (MB/s) | 0.718 | 1.133 58% | 69.8 9621% | 149 20652% |
| Write 4k QD32 (MB/s) | 0.893 | 0.274 -69% | 1.057 18% | 234 26104% |

| 3DMark 11 - 1280x720 Performance GPU | |
| Acer Aspire VN7-593G-73HP V15 Nitro BE | |
| Acer Aspire VX5-591G-75C4 VX15 | |
| Dell XPS 15 2017 9560 (7300HQ, Full-HD) | |
| Asus Zenbook UX510UW-CN044T | |
| 3DMark | |
| 1280x720 Cloud Gate Standard Graphics | |
| Acer Aspire VN7-593G-73HP V15 Nitro BE | |
| Acer Aspire VX5-591G-75C4 VX15 | |
| Dell XPS 15 2017 9560 (7300HQ, Full-HD) | |
| Asus Zenbook UX510UW-CN044T | |
| 1920x1080 Fire Strike Graphics | |
| Acer Aspire VN7-593G-73HP V15 Nitro BE | |
| Acer Aspire VX5-591G-75C4 VX15 | |
| Dell XPS 15 2017 9560 (7300HQ, Full-HD) | |
| Asus Zenbook UX510UW-CN044T | |
| 3DMark 11 Performance | 8674 pontos | |
| 3DMark Cloud Gate Standard Score | 20791 pontos | |
| 3DMark Fire Strike Score | 6774 pontos | |
Ajuda | ||
| The Witcher 3 - 1920x1080 Ultra Graphics & Postprocessing (HBAO+) | |
| Acer Aspire VN7-593G-73HP V15 Nitro BE | |
| Acer Aspire VX5-591G-75C4 VX15 | |
| Dell XPS 15 2017 9560 (7300HQ, Full-HD) | |
| baixo | média | alto | ultra | |
|---|---|---|---|---|
| The Witcher 3 (2015) | 45.8 | 25.2 | ||
| The Division (2016) | 0 | 42.6 | 34.9 | |
| For Honor (2017) | 44.8 | 40.9 | 21.2 | |
| Ghost Recon Wildlands (2017) | 40.9 | 21.2 |
Barulho
| Ocioso |
| 31.4 / 31.4 / 31.4 dB |
| HDD |
| 31.8 dB |
| Carga |
| 36.8 / 41.3 dB |
 | ||
30 dB silencioso 40 dB(A) audível 50 dB(A) ruidosamente alto |
||
min: | ||
(-) A temperatura máxima no lado superior é 47 °C / 117 F, em comparação com a média de 36.8 °C / 98 F , variando de 21 a 71 °C para a classe Multimedia.
(-) A parte inferior aquece até um máximo de 47 °C / 117 F, em comparação com a média de 39.1 °C / 102 F
(+) Em uso inativo, a temperatura média para o lado superior é 24.6 °C / 76 F, em comparação com a média do dispositivo de 31.3 °C / ### class_avg_f### F.
(+) Os apoios para as mãos e o touchpad são mais frios que a temperatura da pele, com um máximo de 29.3 °C / 84.7 F e, portanto, são frios ao toque.
(±) A temperatura média da área do apoio para as mãos de dispositivos semelhantes foi 28.7 °C / 83.7 F (-0.6 °C / -1 F).
Acer Aspire VX5-591G-75C4 VX15 análise de áudio
(±) | o volume do alto-falante é médio, mas bom (###valor### dB)
Graves 100 - 315Hz
(-) | quase nenhum baixo - em média 15% menor que a mediana
(±) | a linearidade dos graves é média (10.7% delta para a frequência anterior)
Médios 400 - 2.000 Hz
(+) | médios equilibrados - apenas 1.9% longe da mediana
(+) | médios são lineares (5.9% delta para frequência anterior)
Altos 2 - 16 kHz
(+) | agudos equilibrados - apenas 4.8% longe da mediana
(+) | os máximos são lineares (2.2% delta da frequência anterior)
Geral 100 - 16.000 Hz
(+) | o som geral é linear (14.8% diferença em relação à mediana)
Comparado com a mesma classe
» 35% de todos os dispositivos testados nesta classe foram melhores, 4% semelhantes, 61% piores
» O melhor teve um delta de 5%, a média foi 17%, o pior foi 45%
Comparado com todos os dispositivos testados
» 20% de todos os dispositivos testados foram melhores, 4% semelhantes, 76% piores
» O melhor teve um delta de 4%, a média foi 23%, o pior foi 134%
Acer Aspire VN7-593G-73HP V15 Nitro BE análise de áudio
(±) | o volume do alto-falante é médio, mas bom (###valor### dB)
Graves 100 - 315Hz
(±) | graves reduzidos - em média 11.8% menor que a mediana
(±) | a linearidade dos graves é média (13.5% delta para a frequência anterior)
Médios 400 - 2.000 Hz
(±) | médios mais altos - em média 5.5% maior que a mediana
(+) | médios são lineares (6.6% delta para frequência anterior)
Altos 2 - 16 kHz
(+) | agudos equilibrados - apenas 1.1% longe da mediana
(+) | os máximos são lineares (4% delta da frequência anterior)
Geral 100 - 16.000 Hz
(+) | o som geral é linear (14.6% diferença em relação à mediana)
Comparado com a mesma classe
» 35% de todos os dispositivos testados nesta classe foram melhores, 4% semelhantes, 61% piores
» O melhor teve um delta de 5%, a média foi 17%, o pior foi 45%
Comparado com todos os dispositivos testados
» 19% de todos os dispositivos testados foram melhores, 4% semelhantes, 77% piores
» O melhor teve um delta de 4%, a média foi 23%, o pior foi 134%
Dell XPS 15 2017 9560 (7300HQ, Full-HD) análise de áudio
(+) | os alto-falantes podem tocar relativamente alto (###valor### dB)
Graves 100 - 315Hz
(-) | quase nenhum baixo - em média 15.8% menor que a mediana
(±) | a linearidade dos graves é média (13.9% delta para a frequência anterior)
Médios 400 - 2.000 Hz
(+) | médios equilibrados - apenas 4.3% longe da mediana
(±) | a linearidade dos médios é média (7.1% delta para frequência anterior)
Altos 2 - 16 kHz
(+) | agudos equilibrados - apenas 3.1% longe da mediana
(±) | a linearidade dos máximos é média (7.9% delta para frequência anterior)
Geral 100 - 16.000 Hz
(+) | o som geral é linear (13.5% diferença em relação à mediana)
Comparado com a mesma classe
» 29% de todos os dispositivos testados nesta classe foram melhores, 4% semelhantes, 67% piores
» O melhor teve um delta de 5%, a média foi 17%, o pior foi 45%
Comparado com todos os dispositivos testados
» 14% de todos os dispositivos testados foram melhores, 4% semelhantes, 82% piores
» O melhor teve um delta de 4%, a média foi 23%, o pior foi 134%
Asus Zenbook UX510UW-CN044T análise de áudio
(±) | o volume do alto-falante é médio, mas bom (###valor### dB)
Graves 100 - 315Hz
(±) | graves reduzidos - em média 14.8% menor que a mediana
(±) | a linearidade dos graves é média (7.2% delta para a frequência anterior)
Médios 400 - 2.000 Hz
(+) | médios equilibrados - apenas 3% longe da mediana
(+) | médios são lineares (6.3% delta para frequência anterior)
Altos 2 - 16 kHz
(±) | máximos mais altos - em média 6% maior que a mediana
(+) | os máximos são lineares (4.6% delta da frequência anterior)
Geral 100 - 16.000 Hz
(±) | a linearidade do som geral é média (16.6% diferença em relação à mediana)
Comparado com a mesma classe
» 44% de todos os dispositivos testados nesta classe foram melhores, 7% semelhantes, 50% piores
» O melhor teve um delta de 5%, a média foi 17%, o pior foi 45%
Comparado com todos os dispositivos testados
» 29% de todos os dispositivos testados foram melhores, 6% semelhantes, 65% piores
» O melhor teve um delta de 4%, a média foi 23%, o pior foi 134%
| desligado | |
| Ocioso | |
| Carga |
|
Key:
min: | |
| Acer Aspire VX5-591G-75C4 VX15 i7-7700HQ, GeForce GTX 1050 Ti Mobile, Toshiba MQ01ABD100, IPS, 1920x1080, 15.6" | Acer Aspire VN7-593G-73HP V15 Nitro BE i7-7700HQ, GeForce GTX 1060 Mobile, Seagate Mobile HDD 1TB ST1000LM035, AH-IPS, Normally Black, Transmissive, 1920x1080, 15.6" | Dell XPS 15 2017 9560 (7300HQ, Full-HD) i5-7300HQ, GeForce GTX 1050 Mobile, WDC WD10SPCX-75KHST0 + SanDisk Z400s M.2 2242 32 GB Cache, LED IGZO IPS InfinityEdge, 1920x1080, 15.6" | Asus Zenbook UX510UW-CN044T 6500U, GeForce GTX 960M, SanDisk SD8SNAT256G1002, IPS, 1920x1080, 15.6" | |
|---|---|---|---|---|
| Power Consumption | -9% | 8% | 23% | |
| Idle Minimum * (Watt) | 7 | 7.2 -3% | 6.6 6% | 5 29% |
| Idle Average * (Watt) | 10.2 | 10.5 -3% | 9 12% | 8.9 13% |
| Idle Maximum * (Watt) | 14 | 16 -14% | 10.7 24% | 11.8 16% |
| Load Average * (Watt) | 78 | 82 -5% | 77.5 1% | 55 29% |
| Load Maximum * (Watt) | 127 | 155 -22% | 130 -2% | 93 27% |
| Witcher 3 ultra * (Watt) | 124 |
* ... menor é melhor
| Acer Aspire VX5-591G-75C4 VX15 i7-7700HQ, GeForce GTX 1050 Ti Mobile, 52.5 Wh | Acer Aspire VN7-593G-73HP V15 Nitro BE i7-7700HQ, GeForce GTX 1060 Mobile, 69 Wh | Dell XPS 15 2017 9560 (7300HQ, Full-HD) i5-7300HQ, GeForce GTX 1050 Mobile, 56 Wh | Asus Zenbook UX510UW-CN044T 6500U, GeForce GTX 960M, 48 Wh | |
|---|---|---|---|---|
| Duração da bateria | 49% | 29% | 70% | |
| Reader / Idle (h) | 5.4 | 8.4 56% | 9.4 74% | 13.6 152% |
| WiFi v1.3 (h) | 5 | 6 20% | 5.6 12% | 7.2 44% |
| Load (h) | 1.4 | 2.4 71% | 1.4 0% | 1.6 14% |
| H.264 (h) | 7.1 |
Pro
Contra
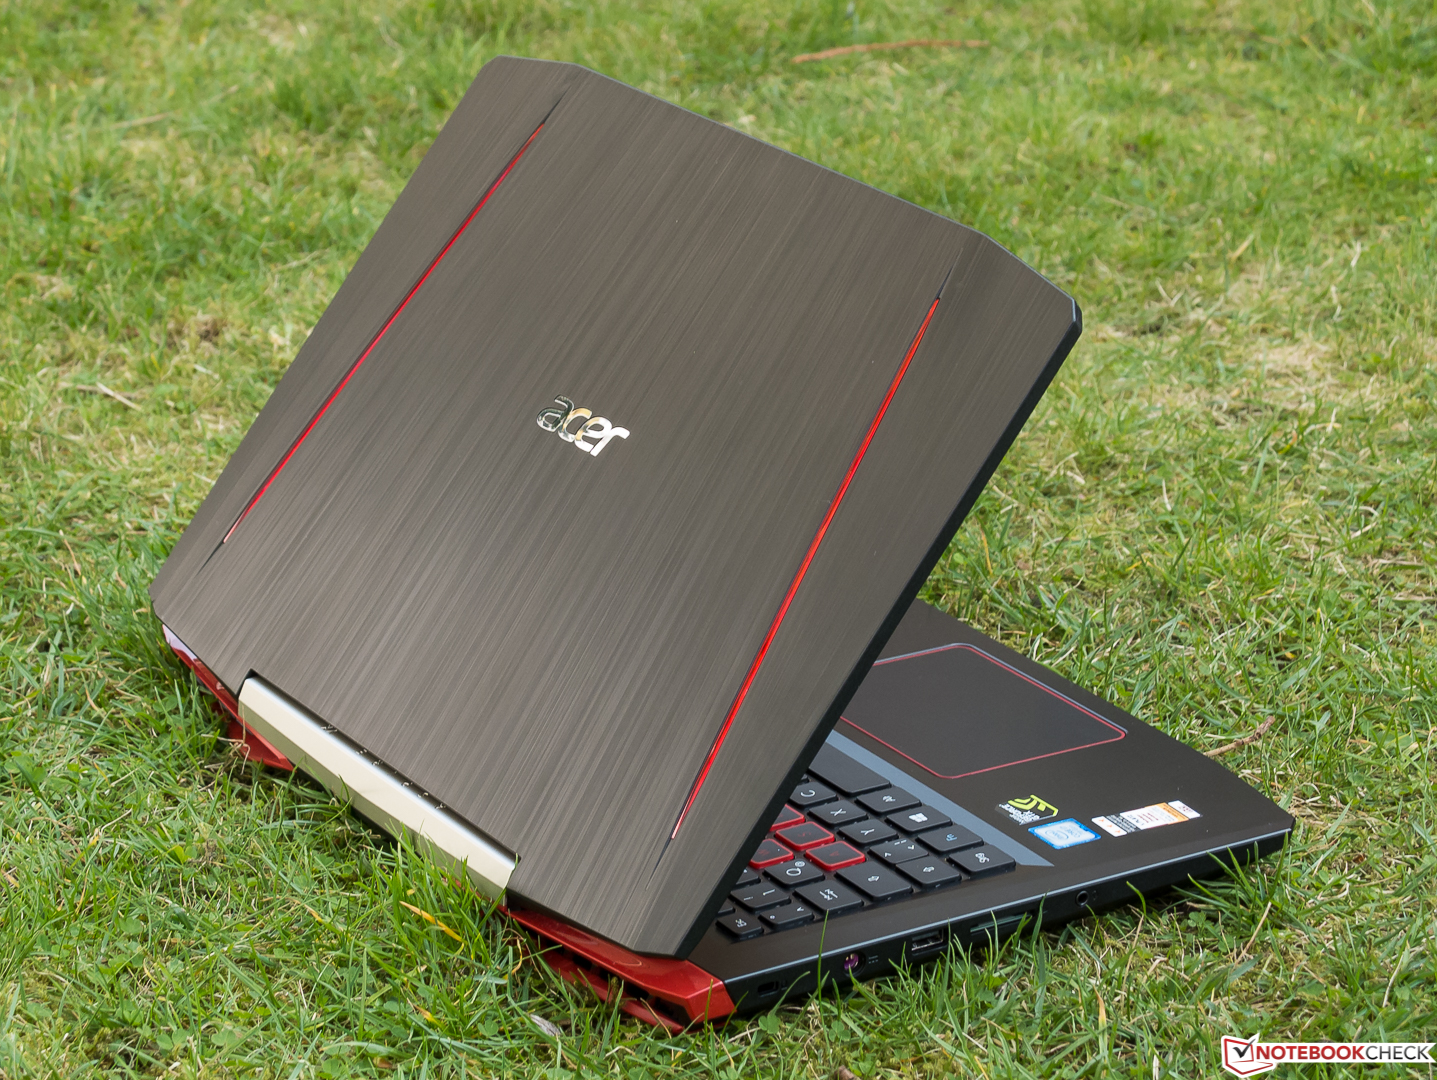
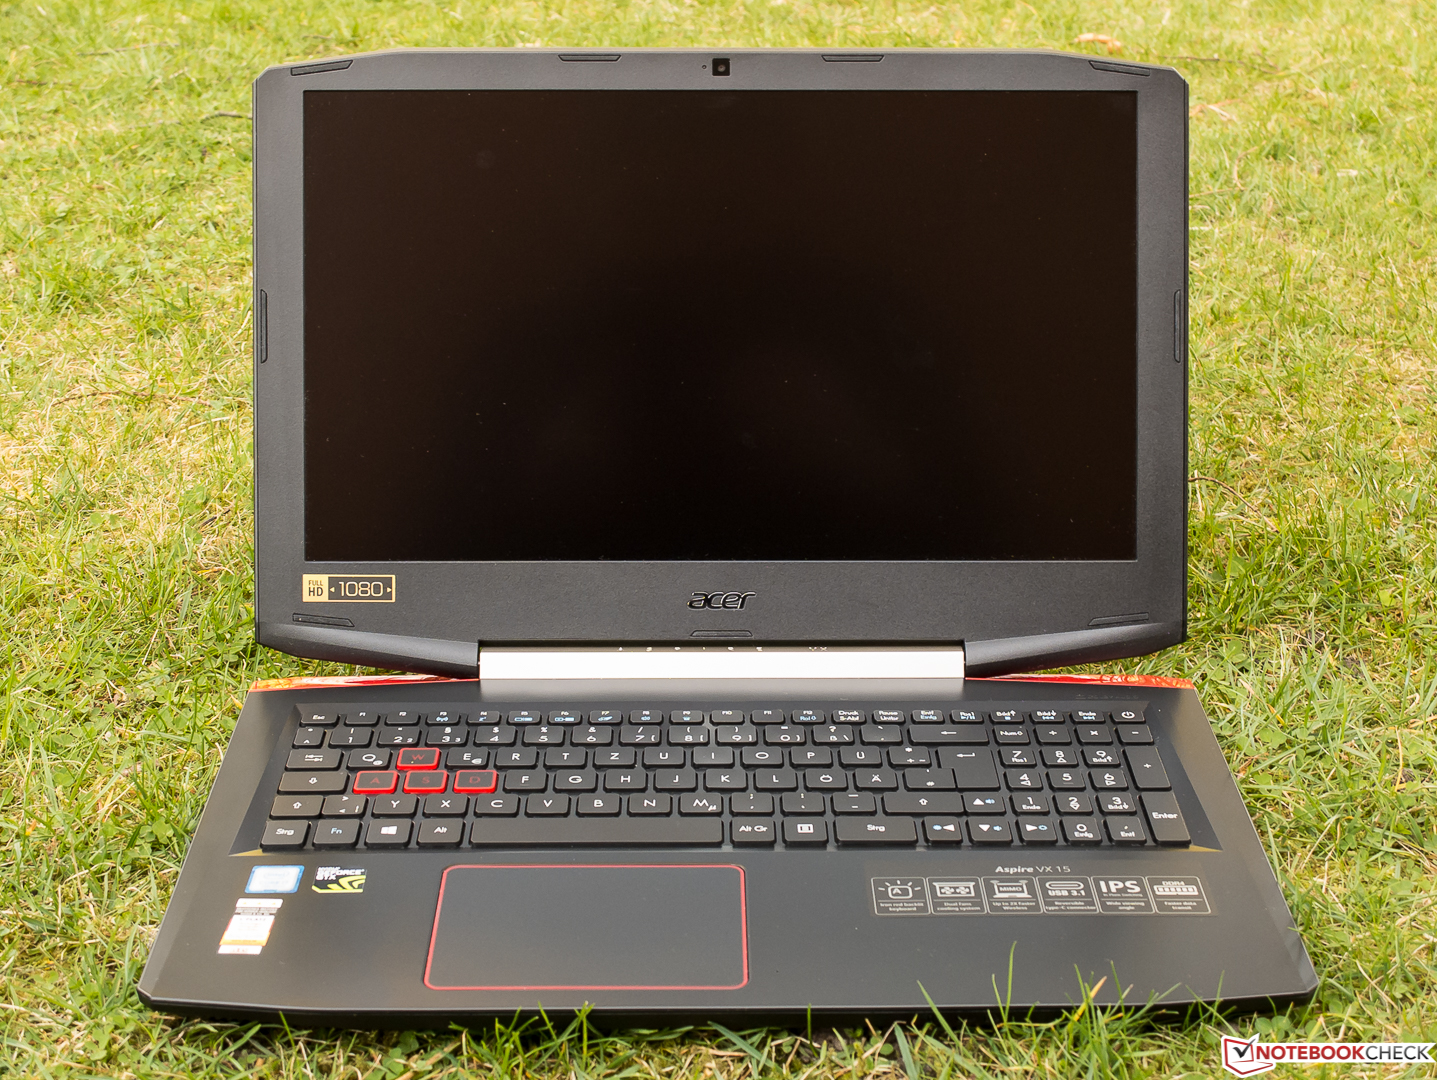
Não espetacular, mas robusto - a Acer fez um bom trabalho com o seu novo VX5-591G-75C4.
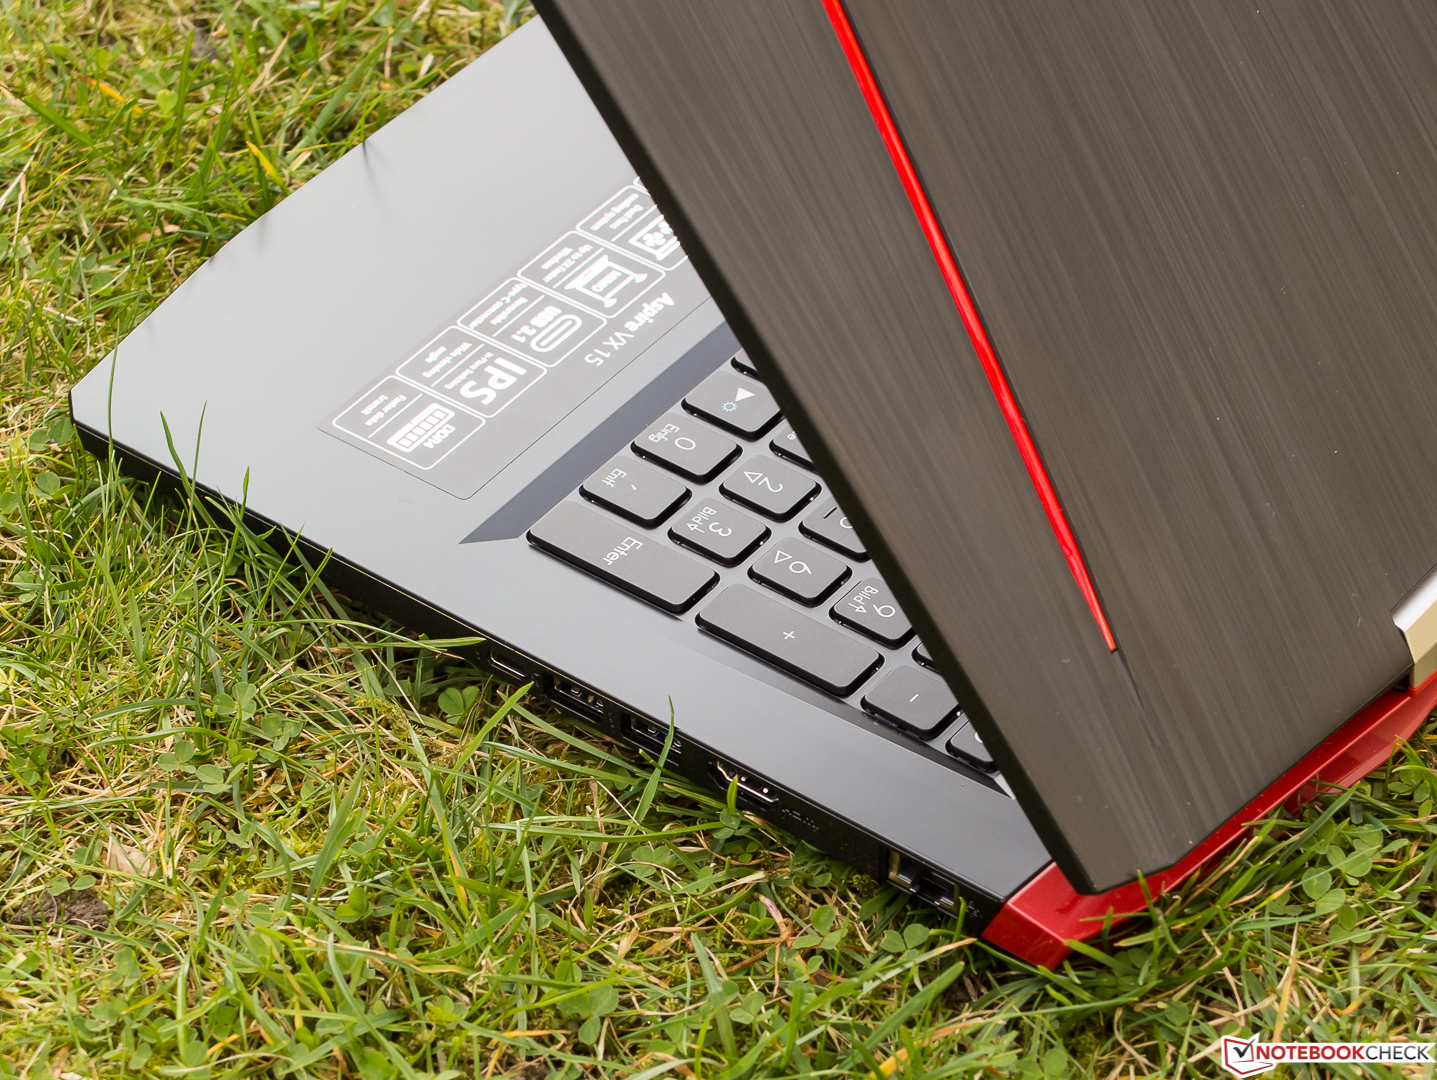
Exceto pelo veloz processador, a maioria dos componentes se situa na gama média superior e por isso corresponde ao preço de 1000 Euros (~$1061) para a versão testada e 1200 Euros (~$1273) para o que tem um SSD. Isso nos leva ao único problema real: Nós só podemos outorgar dar ao portátil multimídia de sucesso sem um SSD uma recomendação de compra condicional. Os usuários que desejam mais poder de jogo e, portanto, precisam de uma GTX 1060 terão inevitavelmente de fazer compromissos no ruído do sistema, como a sua produção de ruído consistentemente silenciosa, é um dos pontos fortes do novo dispositivo multimídia da Acer.
Acer Aspire VX5-591G-75C4 VX15
- 04/11/2017 v6 (old)
Sven Kloevekorn