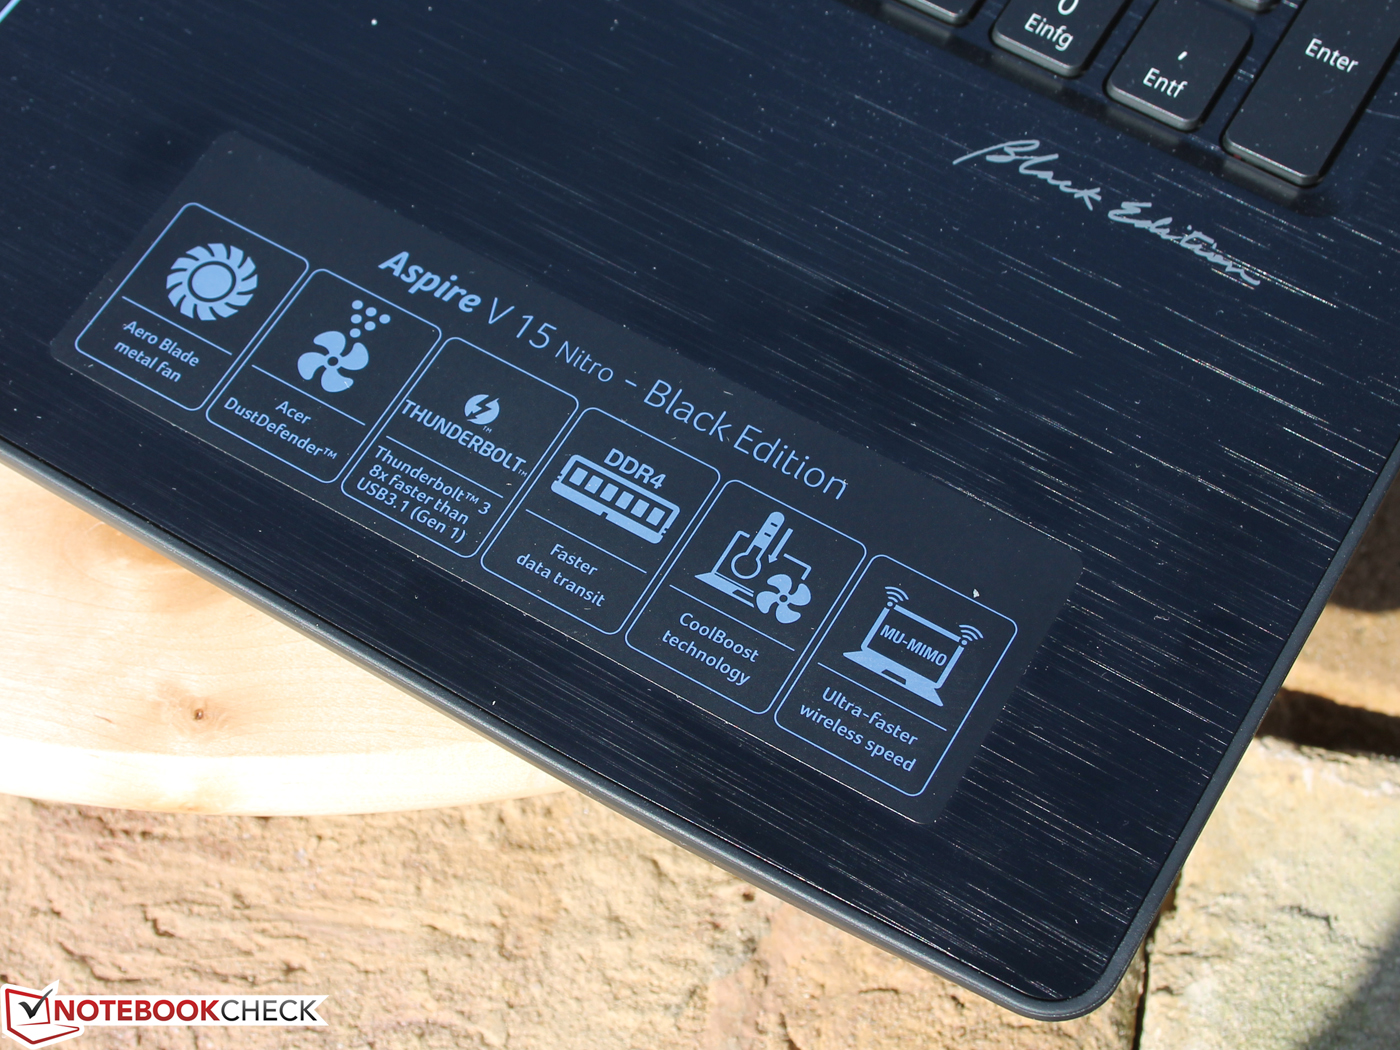
Breve Análise do Portátil Acer Aspire V15 Nitro BE VN7-593G (7700HQ, GTX 1060)

| |||||||||||||||||||||||||
iluminação: 86 %
iluminação com acumulador: 322 cd/m²
Contraste: 1039:1 (Preto: 0.31 cd/m²)
ΔE ColorChecker Calman: 4.73 | ∀{0.5-29.43 Ø4.73}
ΔE Greyscale Calman: 2.99 | ∀{0.09-98 Ø4.97}
85% sRGB (Argyll 1.6.3 3D)
56% AdobeRGB 1998 (Argyll 1.6.3 3D)
62.2% AdobeRGB 1998 (Argyll 3D)
85.1% sRGB (Argyll 3D)
65.8% Display P3 (Argyll 3D)
Gamma: 2.32
CCT: 6905 K
| Acer Aspire VN7-593G-73HP V15 Nitro BE LG Display LP156WF6-SPP1, , 1920x1080, 15.6" | Acer Aspire V15 Nitro BE VN7-592G-79DV Sharp LQ156D1JW02D, , 3840x2160, 15.6" | Asus Strix GL502VM-FY039T LG Philips LP156WF6-SPB6 (LGD046F), , 1920x1080, 15.6" | MSI GT62VR 7RE-223 LG Philips LP156WF6 (LGD046F), , 1920x1080, 15.6" | Gigabyte P55W v7 LG Philips LP156WF6 (LGD046F), , 1920x1080, 15.6" | Dell XPS 15 2017 9560 (7300HQ, Full-HD) Sharp SHP1453 LQ156M1, , 1920x1080, 15.6" | Acer Aspire VX5-591G-75C4 VX15 LG Philips LGD0550 / LP156WF6-SPK4, , 1920x1080, 15.6" | Dell Inspiron 15 7000 7567 AU Optronics AUO38ED B156HTN 28H80, , 1920x1080, 15.6" | MSI GL62M 7RD-077 Chi Mei N156HGE-EAL, , 1920x1080, 15.6" | |
|---|---|---|---|---|---|---|---|---|---|
| Display | 36% | -2% | -2% | -4% | 12% | -36% | -40% | 28% | |
| Display P3 Coverage (%) | 65.8 | 86.2 31% | 64.5 -2% | 63.9 -3% | 63.5 -3% | 68.9 5% | 38.88 -41% | 36.42 -45% | 85.4 30% |
| sRGB Coverage (%) | 85.1 | 100 18% | 83.4 -2% | 83.1 -2% | 82 -4% | 98.9 16% | 58.2 -32% | 54.9 -35% | 100 18% |
| AdobeRGB 1998 Coverage (%) | 62.2 | 99.5 60% | 60.9 -2% | 60.8 -2% | 59.9 -4% | 70.9 14% | 40.2 -35% | 37.62 -40% | 83.8 35% |
| Response Times | 3% | 14% | 18% | 18% | -43% | 39% | 3% | 4% | |
| Response Time Grey 50% / Grey 80% * (ms) | 41 ? | 49 ? -20% | 40 ? 2% | 37 ? 10% | 37 ? 10% | 54 ? -32% | 22 ? 46% | 36 ? 12% | 44 ? -7% |
| Response Time Black / White * (ms) | 34 ? | 25 ? 26% | 25 ? 26% | 25 ? 26% | 25 ? 26% | 52.4 ? -54% | 23 ? 32% | 36 ? -6% | 29 ? 15% |
| PWM Frequency (Hz) | 1000 ? | 198 ? | |||||||
| Screen | 26% | 0% | -2% | -4% | 2% | -15% | -86% | -54% | |
| Brightness middle (cd/m²) | 322 | 303 -6% | 321 0% | 310 -4% | 287 -11% | 400 24% | 281 -13% | 246 -24% | 258 -20% |
| Brightness (cd/m²) | 297 | 291 -2% | 296 0% | 311 5% | 289 -3% | 392 32% | 257 -13% | 235 -21% | 234 -21% |
| Brightness Distribution (%) | 86 | 83 -3% | 88 2% | 85 -1% | 87 1% | 89 3% | 85 -1% | 75 -13% | 79 -8% |
| Black Level * (cd/m²) | 0.31 | 0.22 29% | 0.33 -6% | 0.3 3% | 0.29 6% | 0.26 16% | 0.32 -3% | 0.55 -77% | 0.54 -74% |
| Contrast (:1) | 1039 | 1377 33% | 973 -6% | 1033 -1% | 990 -5% | 1538 48% | 878 -15% | 447 -57% | 478 -54% |
| Colorchecker dE 2000 * | 4.73 | 3.47 27% | 4.42 7% | 4.82 -2% | 4.92 -4% | 4.9 -4% | 5.16 -9% | 10.97 -132% | 9.74 -106% |
| Colorchecker dE 2000 max. * | 12.37 | 6.79 45% | 9.78 21% | 10.14 18% | 11 11% | 11 11% | 9.09 27% | 14.6 -18% | |
| Greyscale dE 2000 * | 2.99 | 1.17 61% | 3.34 -12% | 3.94 -32% | 3.66 -22% | 7.2 -141% | 4.57 -53% | 14.25 -377% | 11.59 -288% |
| Gamma | 2.32 95% | 2.35 94% | 2.4 92% | 2.45 90% | 2.32 95% | 2.11 104% | 2.59 85% | 1.83 120% | 2.19 100% |
| CCT | 6905 94% | 6658 98% | 6213 105% | 6877 95% | 6482 100% | 6911 94% | 6931 94% | 11200 58% | 11851 55% |
| Color Space (Percent of AdobeRGB 1998) (%) | 56 | 86 54% | 55 -2% | 54 -4% | 54 -4% | 64.2 15% | 37 -34% | 35 -37% | 76 36% |
| Color Space (Percent of sRGB) (%) | 85 | 100 18% | 83 -2% | 83 -2% | 82 -4% | 98.9 16% | 58 -32% | 55 -35% | 100 18% |
| Média Total (Programa/Configurações) | 22% /
25% | 4% /
2% | 5% /
1% | 3% /
-1% | -10% /
-2% | -4% /
-12% | -41% /
-63% | -7% /
-30% |
* ... menor é melhor
Exibir tempos de resposta
| ↔ Tempo de resposta preto para branco | ||
|---|---|---|
| 34 ms ... ascensão ↗ e queda ↘ combinadas | ↗ 21 ms ascensão | 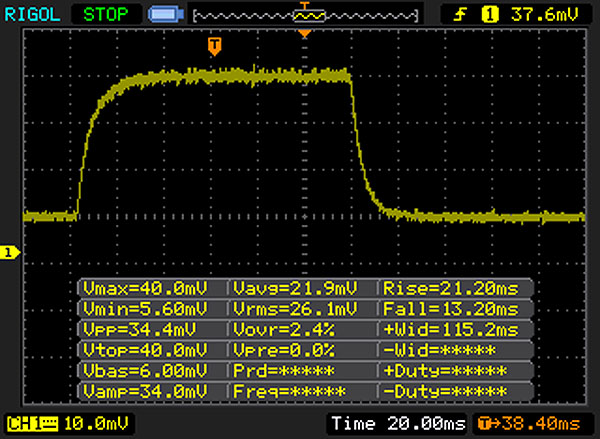 |
| ↘ 13 ms queda | ||
| A tela mostra taxas de resposta lentas em nossos testes e será insatisfatória para os jogadores. Em comparação, todos os dispositivos testados variam de 0.1 (mínimo) a 240 (máximo) ms. » 91 % de todos os dispositivos são melhores. Isso significa que o tempo de resposta medido é pior que a média de todos os dispositivos testados (19.9 ms). | ||
| ↔ Tempo de resposta 50% cinza a 80% cinza | ||
| 41 ms ... ascensão ↗ e queda ↘ combinadas | ↗ 21 ms ascensão | 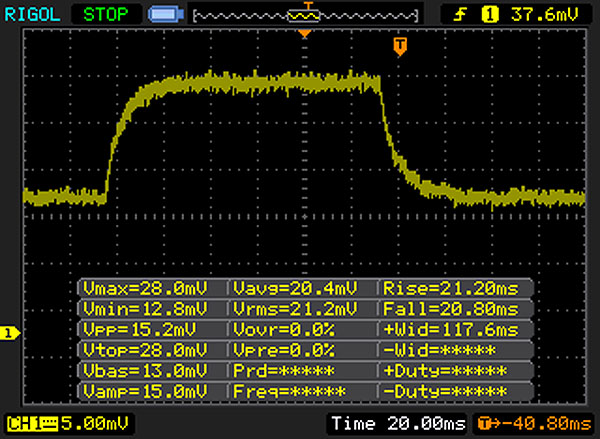 |
| ↘ 20 ms queda | ||
| A tela mostra taxas de resposta lentas em nossos testes e será insatisfatória para os jogadores. Em comparação, todos os dispositivos testados variam de 0.165 (mínimo) a 636 (máximo) ms. » 65 % de todos os dispositivos são melhores. Isso significa que o tempo de resposta medido é pior que a média de todos os dispositivos testados (31.1 ms). | ||
Cintilação da tela / PWM (modulação por largura de pulso)
| Tela tremeluzindo / PWM não detectado | 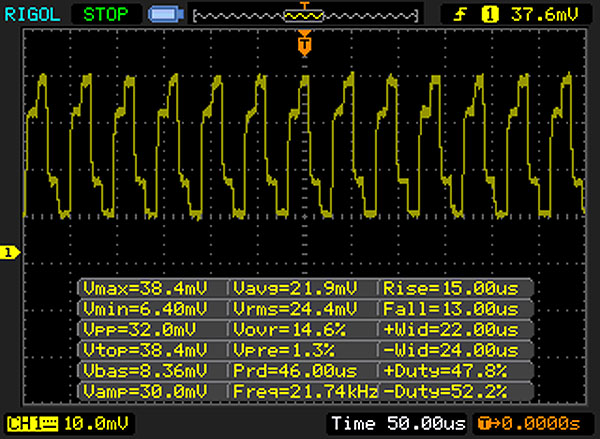 | ||
[pwm_comparison] Em comparação: 52 % de todos os dispositivos testados não usam PWM para escurecer a tela. Se PWM foi detectado, uma média de 7798 (mínimo: 5 - máximo: 343500) Hz foi medida. | |||
| Acer Aspire VN7-593G-73HP V15 Nitro BE Seagate Mobile HDD 1TB ST1000LM035 | Acer Aspire V15 Nitro BE VN7-592G-79DV Lite-On CV1-8B512 M.2 512 GB | Asus Strix GL502VM-FY039T Micron SSD 1100 (MTFDDAV256TBN) | MSI GL62M 7RD-077 HGST Travelstar 7K1000 HTS721010A9E630 | |
|---|---|---|---|---|
| CrystalDiskMark 3.0 | 18615% | 20775% | 74% | |
| Read Seq (MB/s) | 120.9 | 531 339% | 462.5 283% | 112.4 -7% |
| Write Seq (MB/s) | 101.8 | 415.6 308% | 462.7 355% | 107.3 5% |
| Read 512 (MB/s) | 37.83 | 338.9 796% | 335 786% | 43.19 14% |
| Write 512 (MB/s) | 84.4 | 415.6 392% | 407.1 382% | 57 -32% |
| Read 4k (MB/s) | 0.473 | 24.77 5137% | 25.61 5314% | 0.494 4% |
| Write 4k (MB/s) | 0.313 | 78.4 24948% | 86.3 27472% | 1.122 258% |
| Read 4k QD32 (MB/s) | 1.133 | 278.8 24507% | 246.7 21674% | 1.088 -4% |
| Write 4k QD32 (MB/s) | 0.274 | 253.7 92491% | 301.5 109936% | 1.234 350% |

| 3DMark 11 Performance | 12181 pontos | |
| 3DMark Cloud Gate Standard Score | 23269 pontos | |
| 3DMark Fire Strike Score | 9621 pontos | |
| 3DMark Time Spy Score | 3594 pontos | |
Ajuda | ||
| BioShock Infinite - 1920x1080 Ultra Preset, DX11 (DDOF) | |
| MSI GT62VR 7RE-223 | |
| Asus Strix GL502VM-FY039T | |
| HP Omen 17-w100ng | |
| Acer Aspire VN7-593G-73HP V15 Nitro BE | |
| Dell Inspiron 15 7000 7567 | |
| MSI GL62M 7RD-077 | |
| Acer Aspire V15 Nitro BE VN7-592G-79DV | |
| Thief - 1920x1080 Very High Preset AA:FXAA & High SS AF:8x | |
| Acer Aspire VN7-593G-73HP V15 Nitro BE | |
| MSI GL62M 7RD-077 | |
| The Witcher 3 - 1920x1080 Ultra Graphics & Postprocessing (HBAO+) | |
| Gigabyte P55W v7 | |
| Acer Aspire VN7-593G-73HP V15 Nitro BE | |
| Acer Aspire VX5-591G-75C4 VX15 | |
| Dell XPS 15 2017 9560 (7300HQ, Full-HD) | |
| Rise of the Tomb Raider - 1920x1080 Very High Preset AA:FX AF:16x | |
| Gigabyte P55W v7 | |
| Acer Aspire VN7-593G-73HP V15 Nitro BE | |
| Dell Inspiron 15 7000 7567 | |
| MSI GL62M 7RD-077 | |
| Acer Aspire V15 Nitro BE VN7-592G-79DV | |
| Deus Ex Mankind Divided - 1920x1080 Ultra Preset AA:2xMS AF:8x | |
| MSI GT62VR 7RE-223 | |
| Acer Aspire VN7-593G-73HP V15 Nitro BE | |
| HP Omen 17-w100ng | |
| MSI GL62M 7RD-077 | |
| Battlefield 1 - 1920x1080 Ultra Preset AA:T | |
| MSI GT62VR 7RE-223 | |
| HP Omen 17-w100ng | |
| Gigabyte P55W v7 | |
| Acer Aspire VN7-593G-73HP V15 Nitro BE | |
| Dell Inspiron 15 7000 7567 | |
| Dell XPS 15 2017 9560 (7300HQ, Full-HD) | |
| MSI GL62M 7RD-077 | |
| Titanfall 2 - 1920x1080 Very High (Insane Texture Quality) / Enabled AA:TS AF:16x | |
| MSI GT62VR 7RE-223 | |
| Acer Aspire VN7-593G-73HP V15 Nitro BE | |
| HP Omen 17-w100ng | |
| Asus Strix GL502VM-FY039T | |
| Dell Inspiron 15 7000 7567 | |
| Dell XPS 15 2017 9560 (7300HQ, Full-HD) | |
| MSI GL62M 7RD-077 | |
| Dishonored 2 - 1920x1080 Ultra Preset AA:TX | |
| Asus Strix GL502VM-FY039T | |
| Acer Aspire VN7-593G-73HP V15 Nitro BE | |
| Gigabyte P55W v7 | |
| Dell Inspiron 15 7000 7567 | |
| baixo | média | alto | ultra | |
|---|---|---|---|---|
| BioShock Infinite (2013) | 142 | 128 | 88 | |
| Thief (2014) | 63.8 | |||
| The Witcher 3 (2015) | 68 | 38.3 | ||
| Rise of the Tomb Raider (2016) | 74.5 | 60.7 | ||
| Deus Ex Mankind Divided (2016) | 55.9 | 29.4 | ||
| Battlefield 1 (2016) | 60 | 57 | ||
| Titanfall 2 (2016) | 143.5 | 124.2 | 99.4 | |
| Dishonored 2 (2016) | 60.5 | 53.9 |
Barulho
| Ocioso |
| 30.9 / 30.9 / 31.5 dB |
| HDD |
| 32.3 dB |
| Carga |
| 40.7 / 43.9 dB |
 | ||
30 dB silencioso 40 dB(A) audível 50 dB(A) ruidosamente alto |
||
min: | ||
(-) A temperatura máxima no lado superior é 51.9 °C / 125 F, em comparação com a média de 36.8 °C / 98 F , variando de 21 a 71 °C para a classe Multimedia.
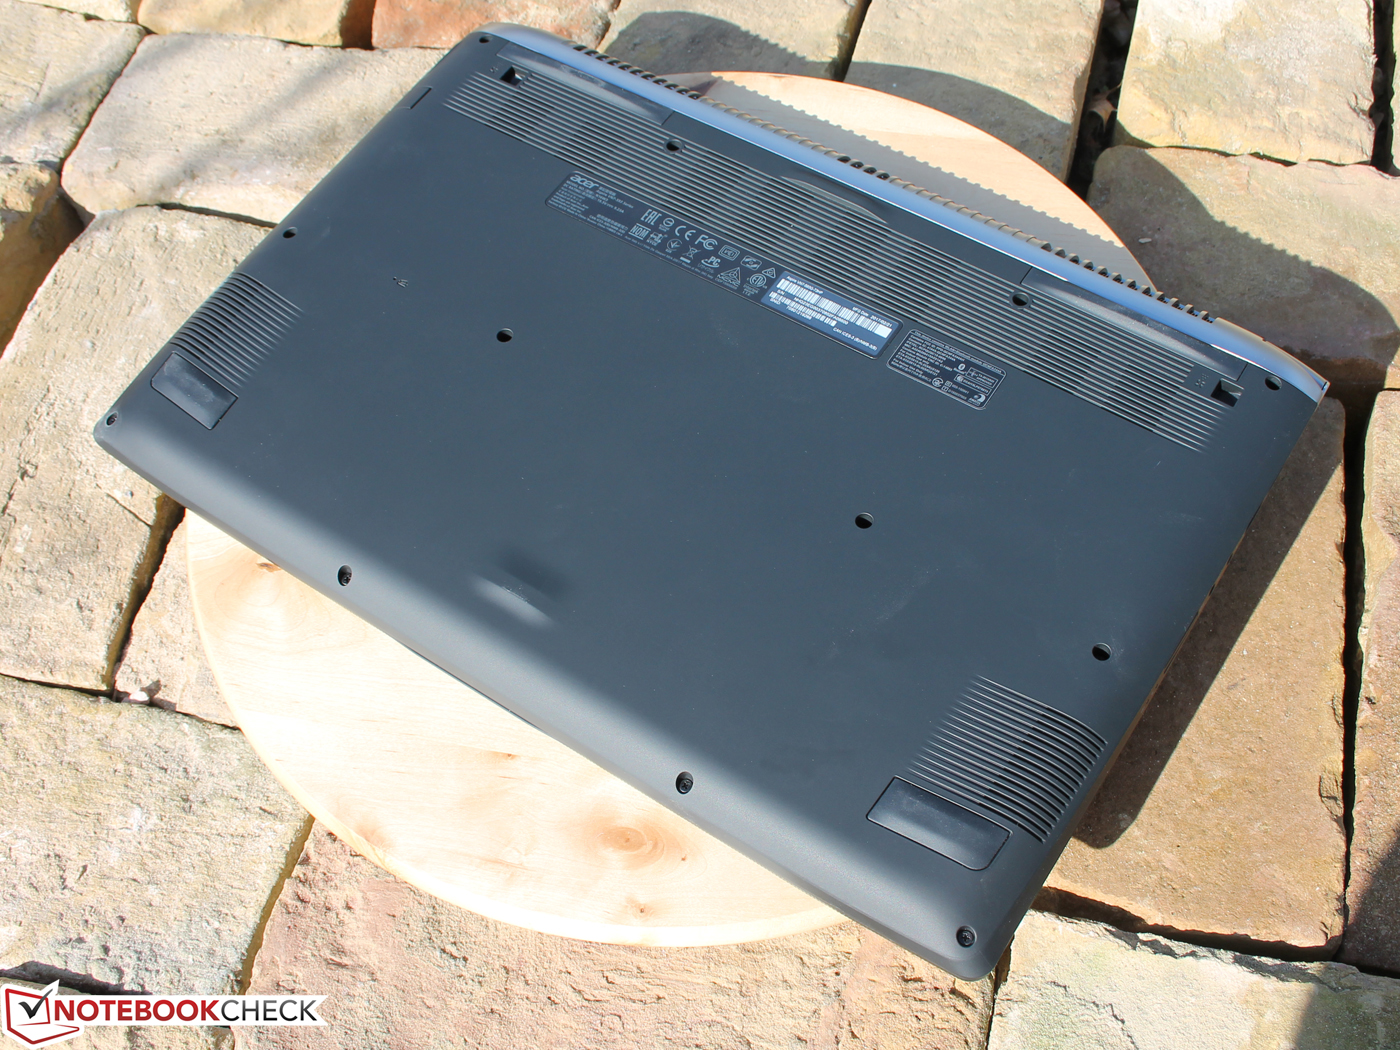
(-) A parte inferior aquece até um máximo de 54.6 °C / 130 F, em comparação com a média de 39.1 °C / 102 F
(+) Em uso inativo, a temperatura média para o lado superior é 26.3 °C / 79 F, em comparação com a média do dispositivo de 31.3 °C / ### class_avg_f### F.
(-) Jogando The Witcher 3, a temperatura média para o lado superior é 39.4 °C / 103 F, em comparação com a média do dispositivo de 31.3 °C / ## #class_avg_f### F.
(+) Os apoios para as mãos e o touchpad estão atingindo a temperatura máxima da pele (34 °C / 93.2 F) e, portanto, não estão quentes.
(-) A temperatura média da área do apoio para as mãos de dispositivos semelhantes foi 28.7 °C / 83.7 F (-5.3 °C / -9.5 F).
Acer Aspire VN7-593G-73HP V15 Nitro BE análise de áudio
(±) | o volume do alto-falante é médio, mas bom (###valor### dB)
Graves 100 - 315Hz
(±) | graves reduzidos - em média 11.8% menor que a mediana
(±) | a linearidade dos graves é média (13.5% delta para a frequência anterior)
Médios 400 - 2.000 Hz
(±) | médios mais altos - em média 5.5% maior que a mediana
(+) | médios são lineares (6.6% delta para frequência anterior)
Altos 2 - 16 kHz
(+) | agudos equilibrados - apenas 1.1% longe da mediana
(+) | os máximos são lineares (4% delta da frequência anterior)
Geral 100 - 16.000 Hz
(+) | o som geral é linear (14.6% diferença em relação à mediana)
Comparado com a mesma classe
» 35% de todos os dispositivos testados nesta classe foram melhores, 4% semelhantes, 61% piores
» O melhor teve um delta de 5%, a média foi 17%, o pior foi 45%
Comparado com todos os dispositivos testados
» 19% de todos os dispositivos testados foram melhores, 4% semelhantes, 77% piores
» O melhor teve um delta de 4%, a média foi 24%, o pior foi 134%
Asus Strix GL502VM-FY039T análise de áudio
(±) | o volume do alto-falante é médio, mas bom (###valor### dB)
Graves 100 - 315Hz
(-) | quase nenhum baixo - em média 19.1% menor que a mediana
(-) | graves não são lineares (18.1% delta para frequência anterior)
Médios 400 - 2.000 Hz
(+) | médios equilibrados - apenas 2.9% longe da mediana
(+) | médios são lineares (4% delta para frequência anterior)
Altos 2 - 16 kHz
(±) | máximos mais altos - em média 5.6% maior que a mediana
(±) | a linearidade dos máximos é média (8% delta para frequência anterior)
Geral 100 - 16.000 Hz
(±) | a linearidade do som geral é média (23% diferença em relação à mediana)
Comparado com a mesma classe
» 83% de todos os dispositivos testados nesta classe foram melhores, 5% semelhantes, 12% piores
» O melhor teve um delta de 6%, a média foi 18%, o pior foi 132%
Comparado com todos os dispositivos testados
» 69% de todos os dispositivos testados foram melhores, 5% semelhantes, 26% piores
» O melhor teve um delta de 4%, a média foi 24%, o pior foi 134%
| desligado | |
| Ocioso | |
| Carga |
|
Key:
min: | |
| Acer Aspire VN7-593G-73HP V15 Nitro BE i7-7700HQ, GeForce GTX 1060 Mobile, Seagate Mobile HDD 1TB ST1000LM035, AH-IPS, Normally Black, Transmissive, 1920x1080, 15.6" | Acer Aspire V15 Nitro BE VN7-592G-79DV 6700HQ, GeForce GTX 960M, Lite-On CV1-8B512 M.2 512 GB, IPS, 3840x2160, 15.6" | Asus Strix GL502VM-FY039T 6700HQ, GeForce GTX 1060 Mobile, Micron SSD 1100 (MTFDDAV256TBN), IPS, 1920x1080, 15.6" | MSI GT62VR 7RE-223 i7-7700HQ, GeForce GTX 1070 Mobile, Samsung SSD PM871a MZNLN256HMHQ, IPS, 1920x1080, 15.6" | Gigabyte P55W v7 i7-7700HQ, GeForce GTX 1060 Mobile, Liteonit CV3-8D256, IPS, 1920x1080, 15.6" | Dell XPS 15 2017 9560 (7300HQ, Full-HD) i5-7300HQ, GeForce GTX 1050 Mobile, WDC WD10SPCX-75KHST0 + SanDisk Z400s M.2 2242 32 GB Cache, LED IGZO IPS InfinityEdge, 1920x1080, 15.6" | Acer Aspire VX5-591G-75C4 VX15 i7-7700HQ, GeForce GTX 1050 Ti Mobile, Toshiba MQ01ABD100, IPS, 1920x1080, 15.6" | Dell Inspiron 15 7000 7567 i7-7700HQ, GeForce GTX 1050 Ti Mobile, Intel SSDSCKKF256H6, TN, 1920x1080, 15.6" | MSI GL62M 7RD-077 i7-7700HQ, GeForce GTX 1050 Mobile, HGST Travelstar 7K1000 HTS721010A9E630, TN LED, 1920x1080, 15.6" | |
|---|---|---|---|---|---|---|---|---|---|
| Power Consumption | -8% | -46% | -83% | -7% | 15% | 8% | 28% | -15% | |
| Idle Minimum * (Watt) | 7.2 | 8.9 -24% | 16 -122% | 20 -178% | 8 -11% | 6.6 8% | 7 3% | 4.4 39% | 10.6 -47% |
| Idle Average * (Watt) | 10.5 | 13.9 -32% | 19 -81% | 24 -129% | 13 -24% | 9 14% | 10.2 3% | 6.8 35% | 14.5 -38% |
| Idle Maximum * (Watt) | 16 | 15.6 2% | 23 -44% | 29 -81% | 18 -13% | 10.7 33% | 14 12% | 8.3 48% | 15 6% |
| Load Average * (Watt) | 82 | 89 -9% | 68 17% | 82 -0% | 76 7% | 77.5 5% | 78 5% | 81 1% | 90 -10% |
| Witcher 3 ultra * (Watt) | 124 | ||||||||
| Load Maximum * (Watt) | 155 | 118 24% | 157 -1% | 193 -25% | 143 8% | 130 16% | 127 18% | 127 18% | 135 13% |
* ... menor é melhor
| Acer Aspire VN7-593G-73HP V15 Nitro BE i7-7700HQ, GeForce GTX 1060 Mobile, 69 Wh | Acer Aspire V15 Nitro BE VN7-592G-79DV 6700HQ, GeForce GTX 960M, 52 Wh | Asus Strix GL502VM-FY039T 6700HQ, GeForce GTX 1060 Mobile, 64 Wh | MSI GT62VR 7RE-223 i7-7700HQ, GeForce GTX 1070 Mobile, 75 Wh | Gigabyte P55W v7 i7-7700HQ, GeForce GTX 1060 Mobile, 63 Wh | Dell XPS 15 2017 9560 (7300HQ, Full-HD) i5-7300HQ, GeForce GTX 1050 Mobile, 56 Wh | Acer Aspire VX5-591G-75C4 VX15 i7-7700HQ, GeForce GTX 1050 Ti Mobile, 52.5 Wh | Dell Inspiron 15 7000 7567 i7-7700HQ, GeForce GTX 1050 Ti Mobile, 74 Wh | MSI GL62M 7RD-077 i7-7700HQ, GeForce GTX 1050 Mobile, 41 Wh | |
|---|---|---|---|---|---|---|---|---|---|
| Duração da bateria | -27% | -37% | -30% | 7% | -12% | -32% | 55% | -44% | |
| Reader / Idle (h) | 8.4 | 8.8 5% | 5.3 -37% | 6.3 -25% | 13.2 57% | 9.4 12% | 5.4 -36% | 19.6 133% | 6.5 -23% |
| WiFi v1.3 (h) | 6 | 3.6 -40% | 3.7 -38% | 4.1 -32% | 5.8 -3% | 5.6 -7% | 5 -17% | 10.4 73% | 3.8 -37% |
| Load (h) | 2.4 | 1.3 -46% | 1.5 -37% | 1.6 -33% | 1.6 -33% | 1.4 -42% | 1.4 -42% | 1.4 -42% | 0.7 -71% |
| H.264 (h) | 3.9 | 3.9 | 4.2 | 7.6 | 3.6 |
Pro
Contra
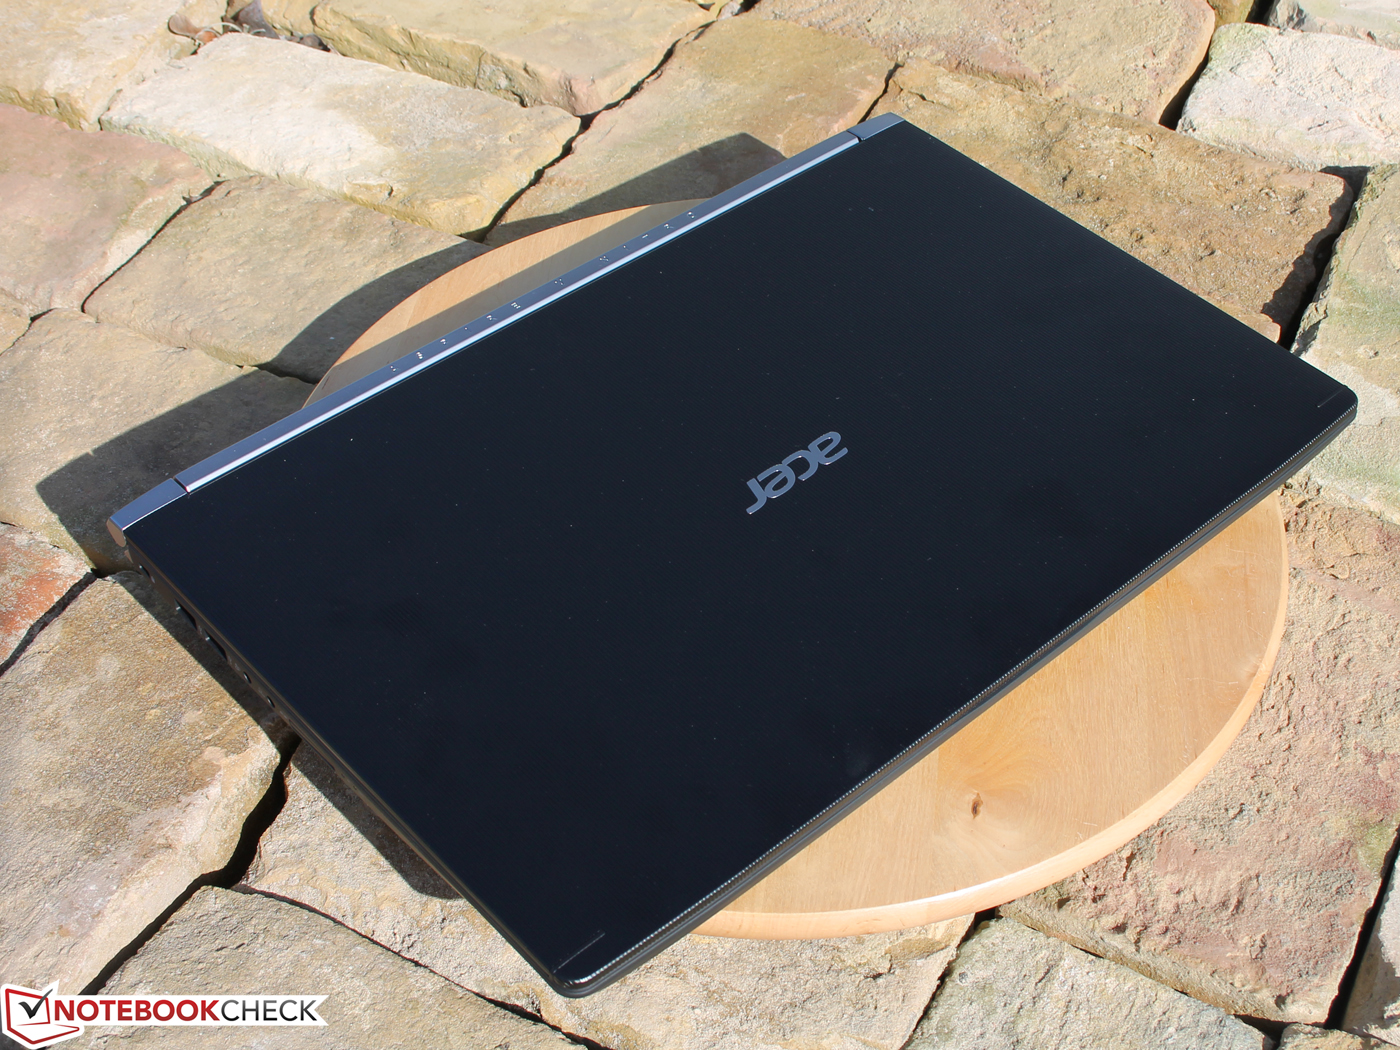
A Acer mais uma vez demonstra suas habilidades e cria uma máquina de 15 polegadas que é que é tão apto para os jogos como para o entretenimento em casa ou no trabalho. Mas primeiro o primeiro.
O desempenho é o claro vencedor aqui. Todos os jogos atuais podem ser jogados com detalhes altos graças à GeForce GTX 1060. O sistema de resfriamento com duas ventoinhas garante altas taxas de fotogramas consistentes durante o estresse dos jogos. Recomendamos a GTX 1060 para os gamers à procura de um portátil, dado que oferece a melhor razão de preço-desempenho.
O 2017 Aspire V15 Nitro Black Edition traz poder para os jogos para o escritório.
Enquanto o V15 dificilmente reproduz ruído no modo inativo, é bastante barulhento durante os jogos. No entanto, os muito bons alto falantes com tons altos e baixos podem abafar isto com facilidade. Os dispositivos de entrada são relativamente bons e as opções de manutenção são quase exemplares. Um painel IPS mate de alto contraste completa as coisas. Embora não cubra todo o espaço de cores, não utiliza PWM.
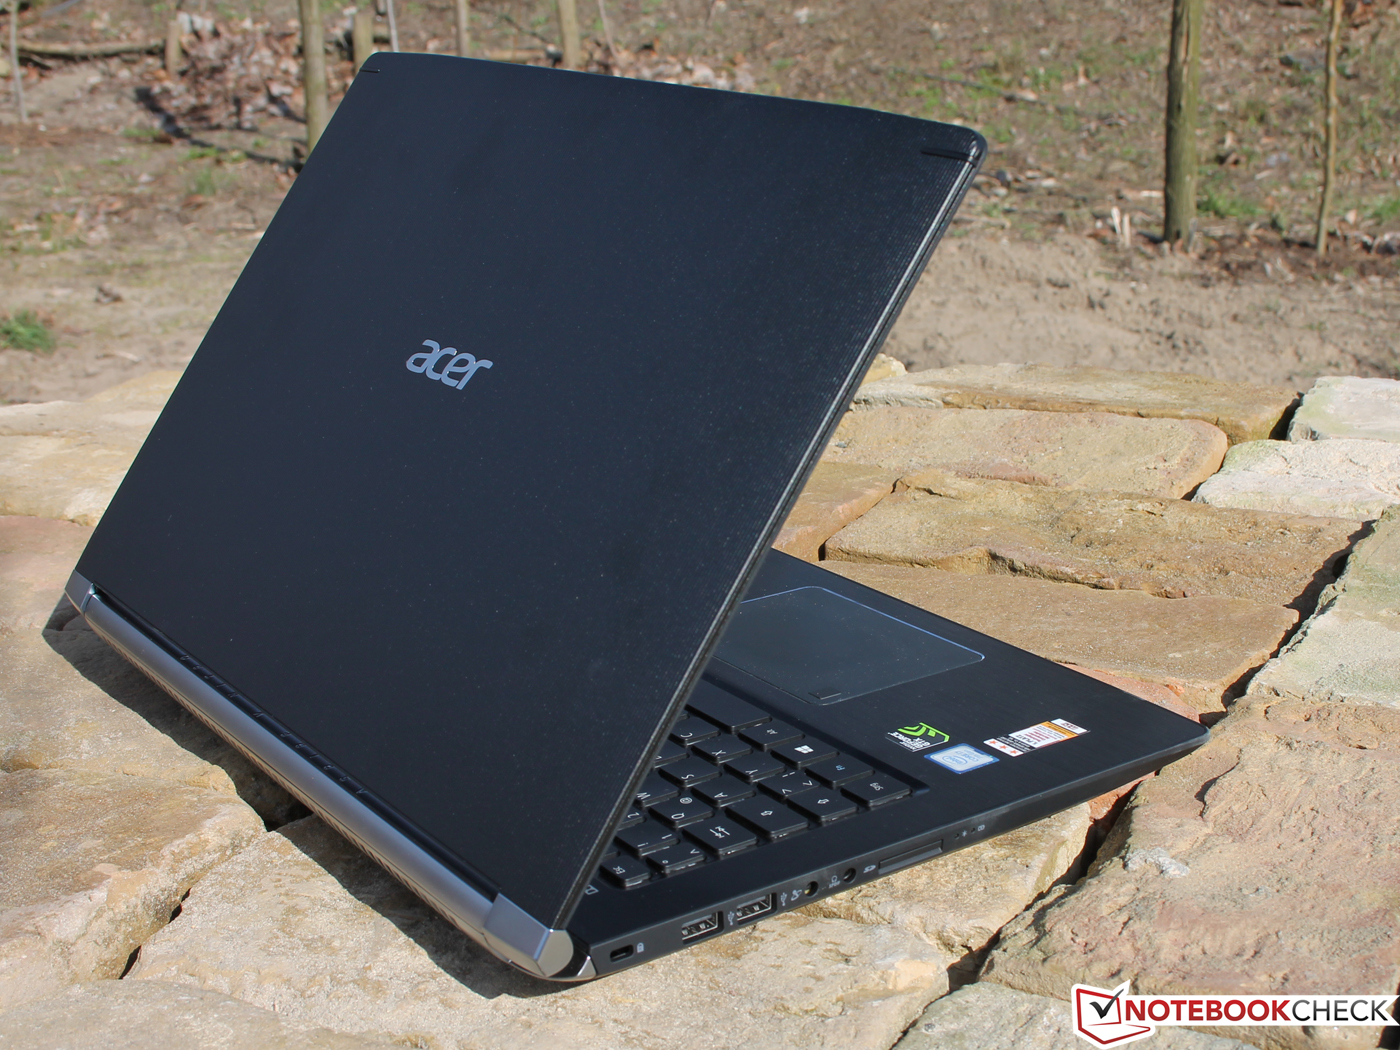
A eficiência energética e a longa duração da bateria se seis horas pode competir com rivais igualmente fortes. Isto nos traz para os problemas. Achamos a fina tampa e as dobradiças um pouco instáveis. Além disso, a webcam é pobre, e o disco rígido é lento e faz barulho. O último problema pode ser eliminado optando por um modelo V15 com um SSD.
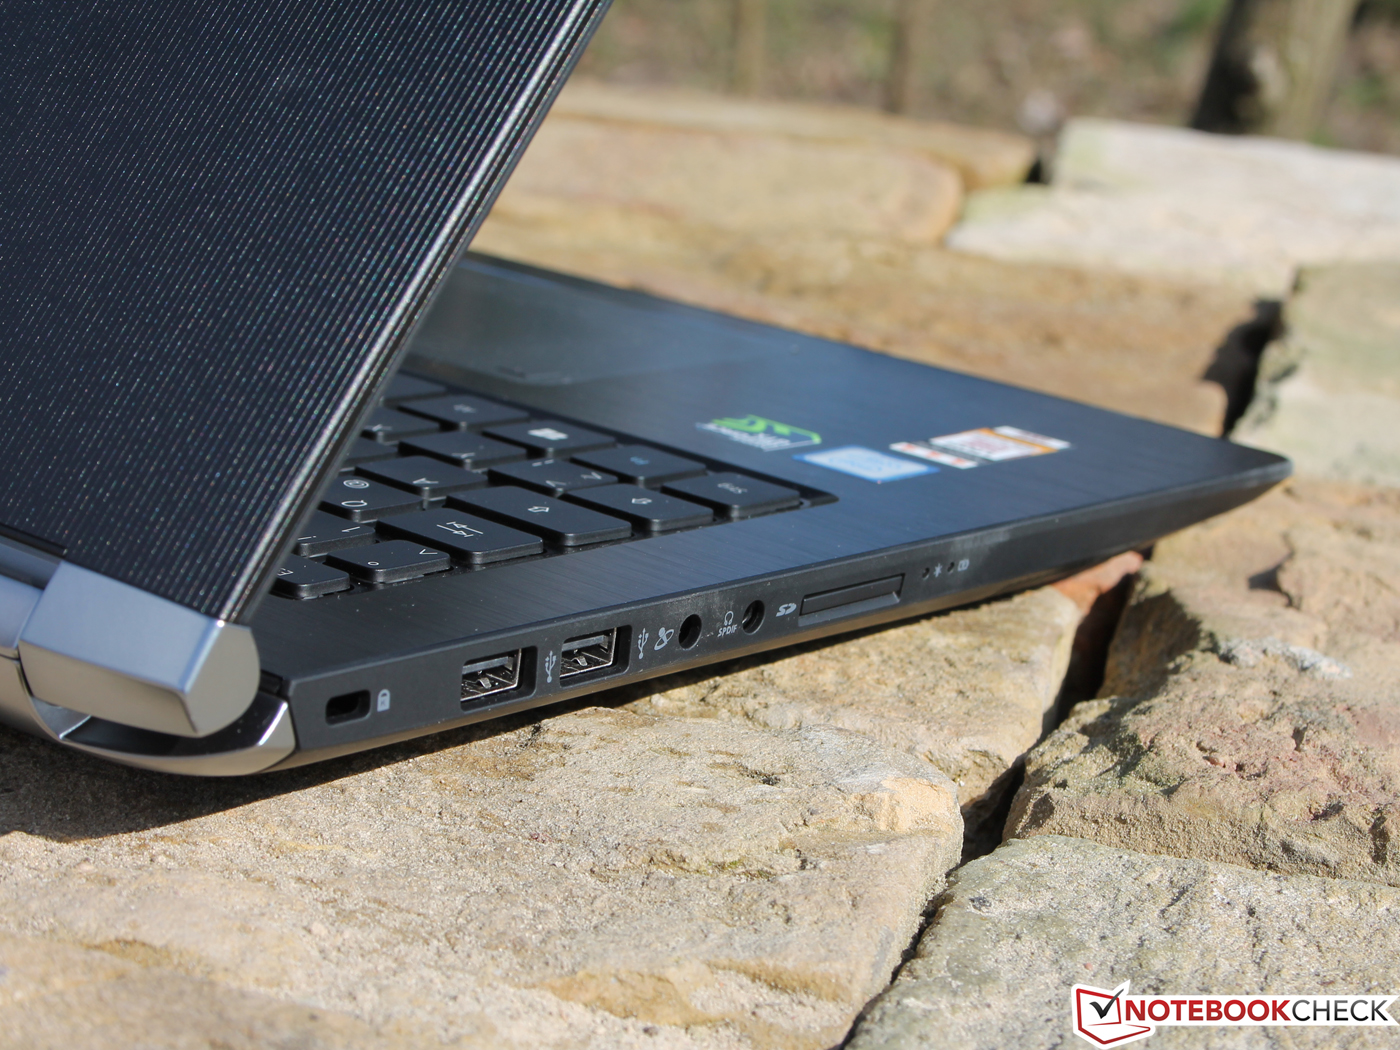
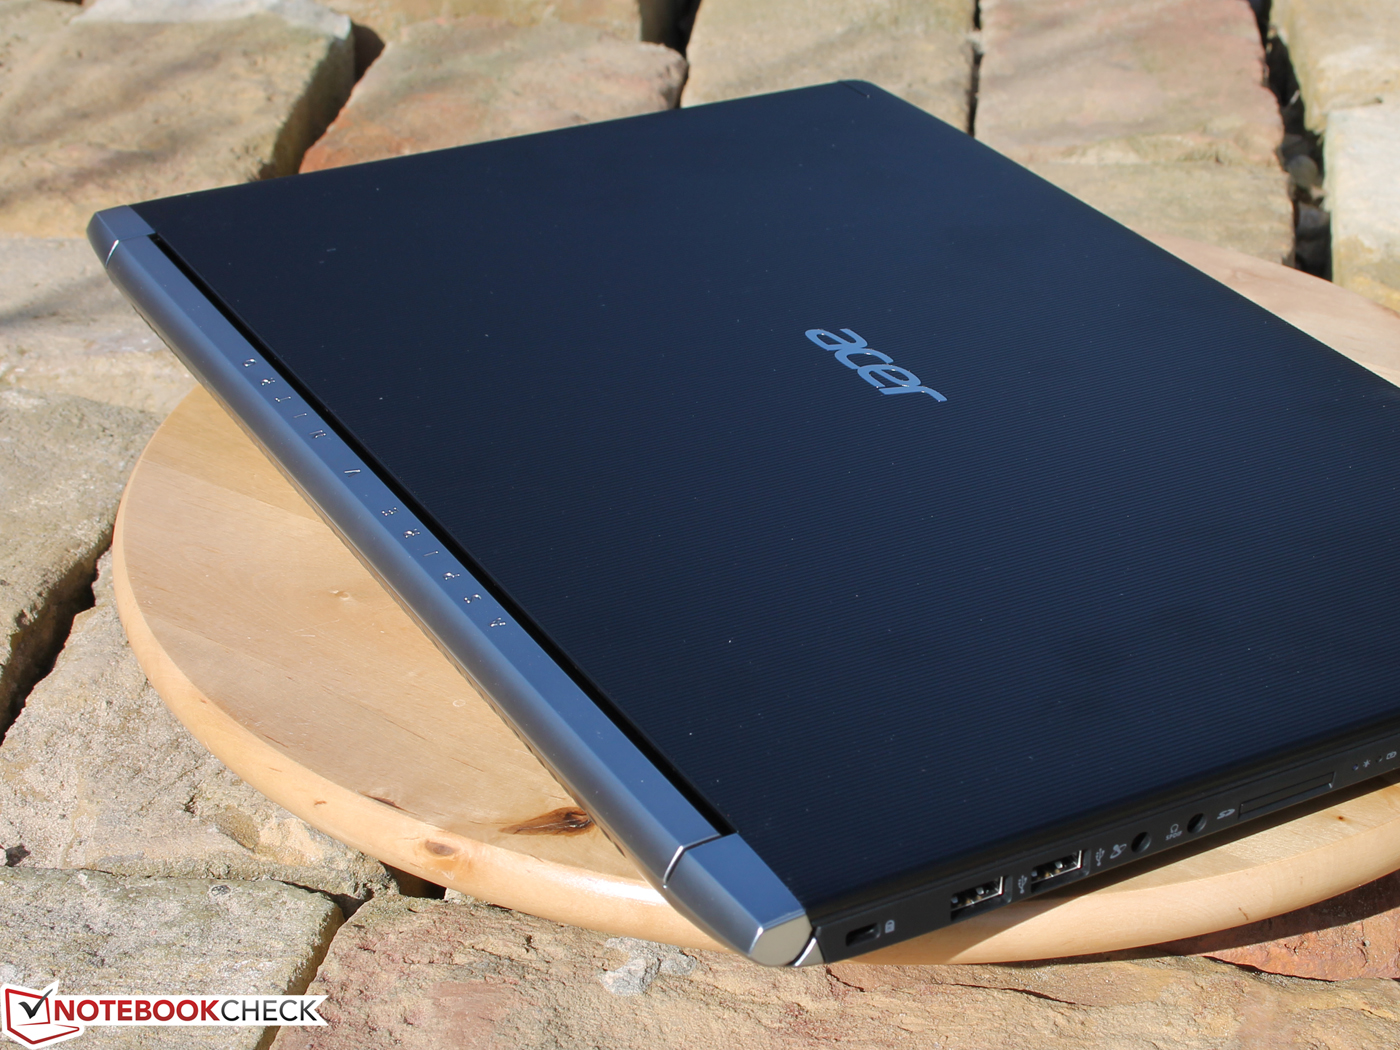
A carcaça instável em alguns lugares, apesar de um novo acabamento de alumínio permanece. Em compensação, nunca foi tão fácil substituir componentes.
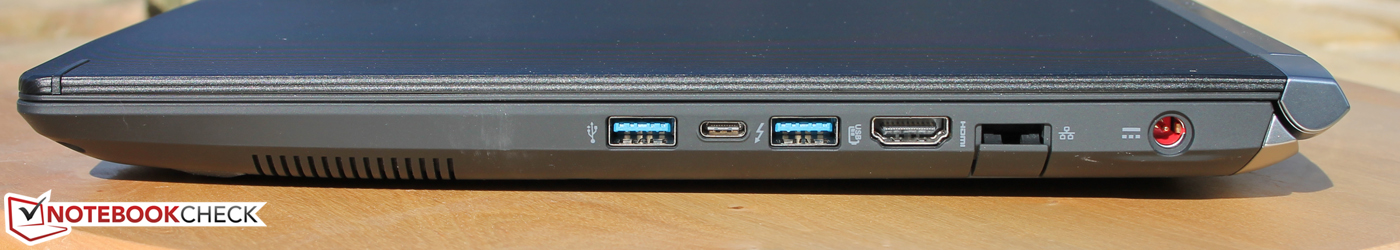
Os gamers definitivamente deveriam dar uma olhada no Asus Strix GL502VM como uma alternativa. Embora ainda esteja equipado com um Broadwell quad-core, custa tanto quanto o nosso Aspire VN7-593G-73HP, mas vem com um SSD (1400 Euros, ~$1502). Não é melhor em todos os aspectos: O Strix GL502VM não possui Thunderbolt 3 e somente tem um uma porta USB 3.0 Type-C.
Acer Aspire VN7-593G-73HP V15 Nitro BE
- 03/18/2017 v6 (old)
Sebastian Jentsch