Breve Análise do Portátil Acer TravelMate P2510 (i5-7200U, 256 GB SSD, IPS)

| SD Card Reader | |
| average JPG Copy Test (av. of 3 runs) | |
| Dell Latitude 5580 (Toshiba Exceria Pro SDXC 64 GB UHS-II) | |
| Acer TravelMate P2510-M-51ZQ (Toshiba Exceria Pro SDXC 64 GB UHS-II) | |
| HP 15-bs103ng (Toshiba Exceria Pro SDXC 64 GB UHS-II) | |
| Lenovo V510-15IKB 80WQ0002GE (Toshiba Exceria Pro SDXC 64 GB UHS-II) | |
| maximum AS SSD Seq Read Test (1GB) | |
| Dell Latitude 5580 (Toshiba Exceria Pro SDXC 64 GB UHS-II) | |
| Lenovo V510-15IKB 80WQ0002GE (Toshiba Exceria Pro SDXC 64 GB UHS-II) | |
| HP 15-bs103ng (Toshiba Exceria Pro SDXC 64 GB UHS-II) | |
| Acer TravelMate P2510-M-51ZQ (Toshiba Exceria Pro SDXC 64 GB UHS-II) | |
| Networking | |
| iperf3 transmit AX12 | |
| Acer TravelMate P2510-M-51ZQ | |
| Dell Latitude 5580 | |
| HP 15-bs103ng | |
| Lenovo V510-15IKB 80WQ0002GE | |
| iperf3 receive AX12 | |
| Acer TravelMate P2510-M-51ZQ | |
| Dell Latitude 5580 | |
| Lenovo V510-15IKB 80WQ0002GE | |
| HP 15-bs103ng | |
| |||||||||||||||||||||||||
iluminação: 78 %
iluminação com acumulador: 216 cd/m²
Contraste: 672:1 (Preto: 0.32 cd/m²)
ΔE ColorChecker Calman: 5.15 | ∀{0.5-29.43 Ø4.71}
ΔE Greyscale Calman: 4.25 | ∀{0.09-98 Ø4.96}
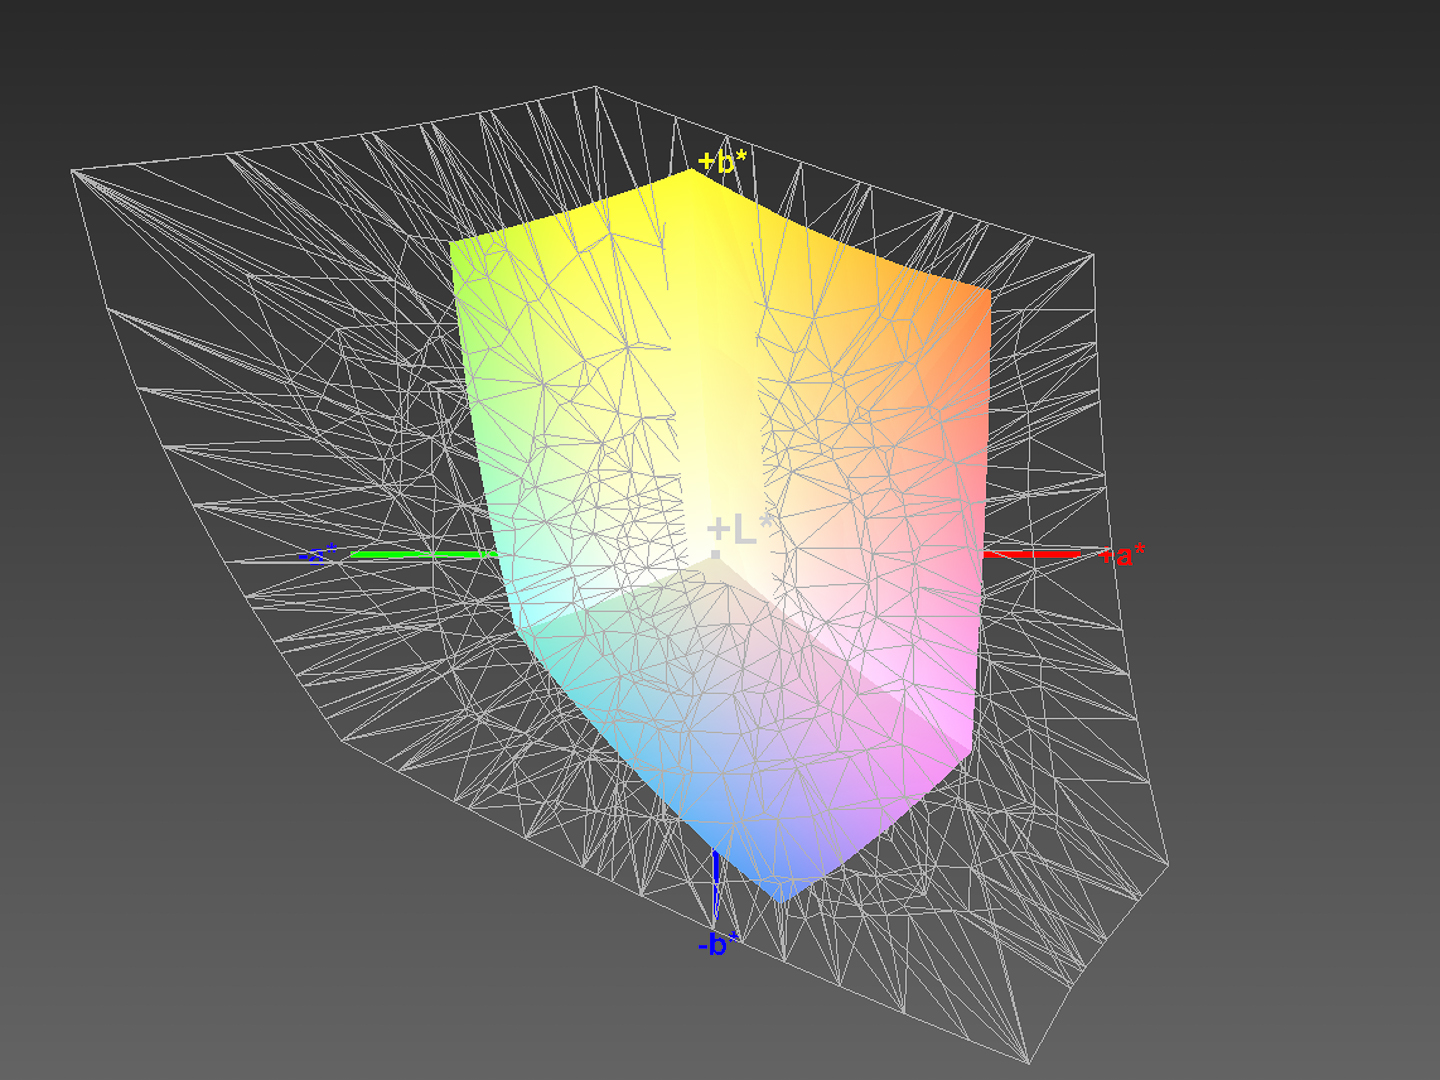
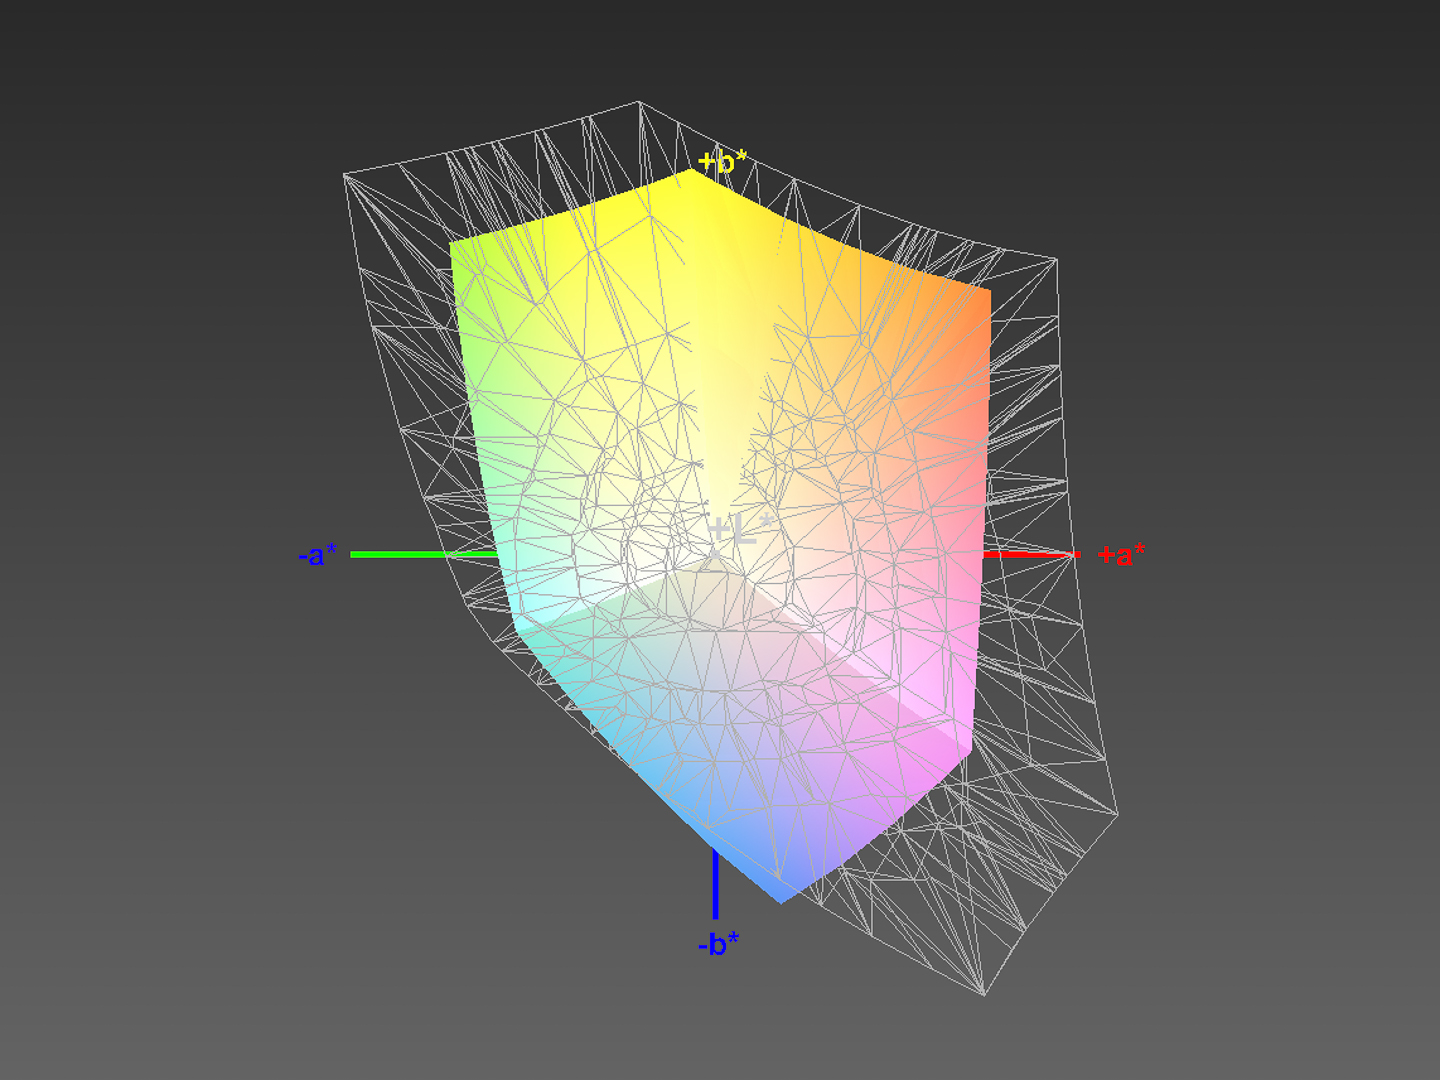
63% sRGB (Argyll 1.6.3 3D)
40% AdobeRGB 1998 (Argyll 1.6.3 3D)
43.94% AdobeRGB 1998 (Argyll 3D)
63.2% sRGB (Argyll 3D)
42.44% Display P3 (Argyll 3D)
Gamma: 2.61
CCT: 6603 K
| Acer TravelMate P2510-M-51ZQ Chi Mei CMN15D3 / N156HCE-EAA, , 1920x1080, 15.6" | Dell Latitude 5580 BOE NV15N42, , 1920x1080, 15.6" | HP 15-bs103ng AU Optronics, , 1920x1080, 15.6" | Lenovo V510-15IKB 80WQ0002GE LG Philips LP156WF6-SPK3, , 1920x1080, 15.6" | |
|---|---|---|---|---|
| Display | -3% | -14% | -9% | |
| Display P3 Coverage (%) | 42.44 | 41.57 -2% | 36.55 -14% | 38.8 -9% |
| sRGB Coverage (%) | 63.2 | 60.7 -4% | 55 -13% | 58.1 -8% |
| AdobeRGB 1998 Coverage (%) | 43.94 | 42.94 -2% | 37.76 -14% | 40.12 -9% |
| Response Times | 1% | 17% | 10% | |
| Response Time Grey 50% / Grey 80% * (ms) | 45 ? | 43 ? 4% | 44 ? 2% | 39 ? 13% |
| Response Time Black / White * (ms) | 32 ? | 33 ? -3% | 22 ? 31% | 30 ? 6% |
| PWM Frequency (Hz) | 25000 ? | 1020 ? | 20000 ? | |
| Screen | 18% | -57% | 6% | |
| Brightness middle (cd/m²) | 215 | 234 9% | 241 12% | 256 19% |
| Brightness (cd/m²) | 198 | 224 13% | 235 19% | 252 27% |
| Brightness Distribution (%) | 78 | 84 8% | 84 8% | 87 12% |
| Black Level * (cd/m²) | 0.32 | 0.18 44% | 0.43 -34% | 0.3 6% |
| Contrast (:1) | 672 | 1300 93% | 560 -17% | 853 27% |
| Colorchecker dE 2000 * | 5.15 | 5.3 -3% | 13.62 -164% | 5.4 -5% |
| Colorchecker dE 2000 max. * | 10.89 | 9.09 17% | 22.81 -109% | 9.36 14% |
| Greyscale dE 2000 * | 4.25 | 4 6% | 15.19 -257% | 5.37 -26% |
| Gamma | 2.61 84% | 2.46 89% | 2.13 103% | 2.58 85% |
| CCT | 6603 98% | 6441 101% | 17407 37% | 6795 96% |
| Color Space (Percent of AdobeRGB 1998) (%) | 40 | 39 -2% | 35 -12% | 37 -7% |
| Color Space (Percent of sRGB) (%) | 63 | 60 -5% | 55 -13% | 58 -8% |
| Média Total (Programa/Configurações) | 5% /
12% | -18% /
-38% | 2% /
3% |
* ... menor é melhor
Exibir tempos de resposta
| ↔ Tempo de resposta preto para branco | ||
|---|---|---|
| 32 ms ... ascensão ↗ e queda ↘ combinadas | ↗ 18 ms ascensão | 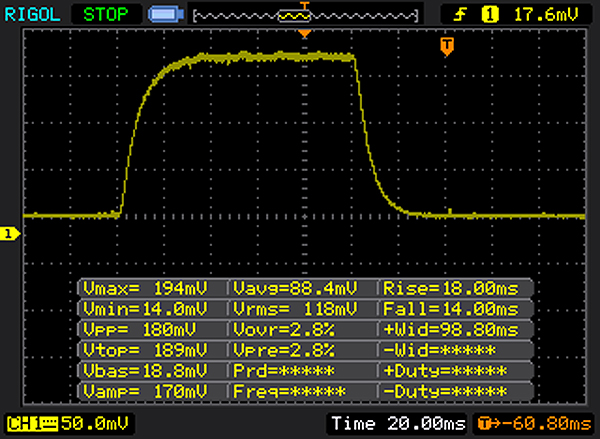 |
| ↘ 14 ms queda | ||
| A tela mostra taxas de resposta lentas em nossos testes e será insatisfatória para os jogadores. Em comparação, todos os dispositivos testados variam de 0.1 (mínimo) a 240 (máximo) ms. » 86 % de todos os dispositivos são melhores. Isso significa que o tempo de resposta medido é pior que a média de todos os dispositivos testados (19.8 ms). | ||
| ↔ Tempo de resposta 50% cinza a 80% cinza | ||
| 45 ms ... ascensão ↗ e queda ↘ combinadas | ↗ 27 ms ascensão | 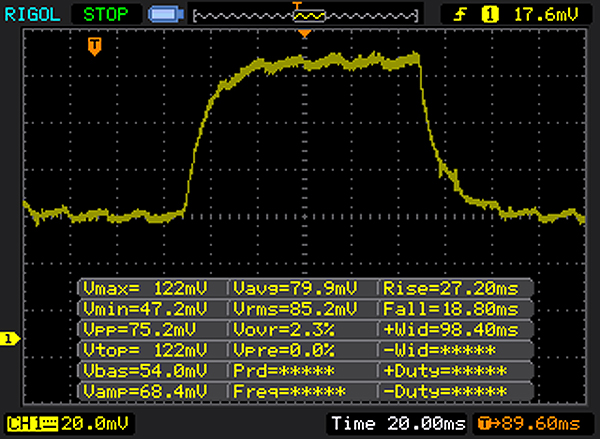 |
| ↘ 18 ms queda | ||
| A tela mostra taxas de resposta lentas em nossos testes e será insatisfatória para os jogadores. Em comparação, todos os dispositivos testados variam de 0.165 (mínimo) a 636 (máximo) ms. » 77 % de todos os dispositivos são melhores. Isso significa que o tempo de resposta medido é pior que a média de todos os dispositivos testados (31 ms). | ||
Cintilação da tela / PWM (modulação por largura de pulso)
| Tela tremeluzindo/PWM detectado | 25000 Hz | ≤ 80 % configuração de brilho | 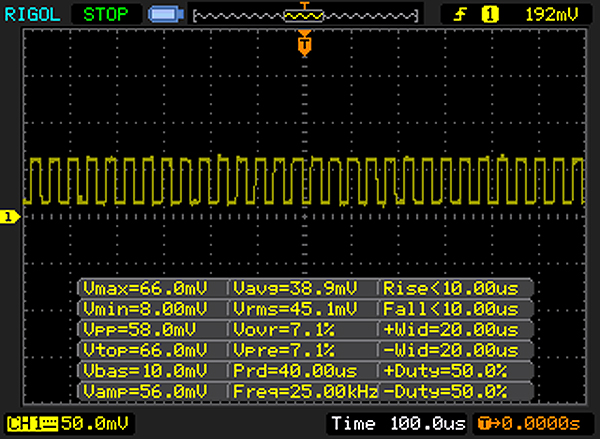 |
A luz de fundo da tela pisca em 25000 Hz (pior caso, por exemplo, utilizando PWM) Cintilação detectada em uma configuração de brilho de 80 % e abaixo. Não deve haver cintilação ou PWM acima desta configuração de brilho. A frequência de 25000 Hz é bastante alta, então a maioria dos usuários sensíveis ao PWM não deve notar nenhuma oscilação. [pwm_comparison] Em comparação: 52 % de todos os dispositivos testados não usam PWM para escurecer a tela. Se PWM foi detectado, uma média de 7754 (mínimo: 5 - máximo: 343500) Hz foi medida. | |||
| Cinebench R15 | |
| CPU Single 64Bit | |
| Dell Latitude 5580 | |
| HP 15-bs103ng | |
| Lenovo V510-15IKB 80WQ0002GE | |
| Acer TravelMate P2510-M-51ZQ | |
| CPU Multi 64Bit | |
| HP 15-bs103ng | |
| Dell Latitude 5580 | |
| Acer TravelMate P2510-M-51ZQ | |
| Lenovo V510-15IKB 80WQ0002GE | |
| PCMark 8 | |
| Home Score Accelerated v2 | |
| Acer TravelMate P2510-M-51ZQ | |
| Lenovo V510-15IKB 80WQ0002GE | |
| HP 15-bs103ng | |
| Dell Latitude 5580 | |
| Work Score Accelerated v2 | |
| HP 15-bs103ng | |
| Acer TravelMate P2510-M-51ZQ | |
| PCMark 8 Home Score Accelerated v2 | 3715 pontos | |
| PCMark 8 Work Score Accelerated v2 | 4592 pontos | |
Ajuda | ||
| Acer TravelMate P2510-M-51ZQ SK Hynix HFS256G39TND-N210A | HP 15-bs103ng Samsung SSD PM871a MZNLN256HMHQ | Lenovo V510-15IKB 80WQ0002GE Samsung CM871a MZNTY256HDHP | |
|---|---|---|---|
| CrystalDiskMark 3.0 | 23% | 24% | |
| Read Seq (MB/s) | 498.1 | 504 1% | 532 7% |
| Write Seq (MB/s) | 260.1 | 466.2 79% | 511 96% |
| Read 512 (MB/s) | 328.5 | 443.7 35% | 414.8 26% |
| Write 512 (MB/s) | 260.9 | 398.4 53% | 307.7 18% |
| Read 4k (MB/s) | 32.59 | 38.81 19% | 39.51 21% |
| Write 4k (MB/s) | 84.2 | 94.6 12% | 108.1 28% |
| Read 4k QD32 (MB/s) | 359.7 | 295.2 -18% | 361.6 1% |
| Write 4k QD32 (MB/s) | 262 | 266.6 2% | 253 -3% |

| 3DMark 11 - 1280x720 Performance GPU | |
| HP 15-bs103ng | |
| Acer TravelMate P2510-M-51ZQ | |
| Lenovo V510-15IKB 80WQ0002GE | |
| Dell Latitude 5580 | |
| 3DMark | |
| 1280x720 Cloud Gate Standard Graphics | |
| Acer TravelMate P2510-M-51ZQ | |
| HP 15-bs103ng | |
| 1920x1080 Fire Strike Graphics | |
| Acer TravelMate P2510-M-51ZQ | |
| HP 15-bs103ng | |
| 3DMark 11 Performance | 1692 pontos | |
| 3DMark Cloud Gate Standard Score | 6501 pontos | |
| 3DMark Fire Strike Score | 938 pontos | |
Ajuda | ||
| baixo | média | alto | ultra | |
|---|---|---|---|---|
| The Witcher 3 (2015) | 14.9 | |||
| Rise of the Tomb Raider (2016) | 18.9 | |||
| Farming Simulator 17 (2016) | 85.5 | 55.4 | 22.8 |
Barulho
| Ocioso |
| 31.8 / 31.8 / 31.8 dB |
| Carga |
| 36.6 / 36.5 dB |
 | ||
30 dB silencioso 40 dB(A) audível 50 dB(A) ruidosamente alto |
||
min: | ||
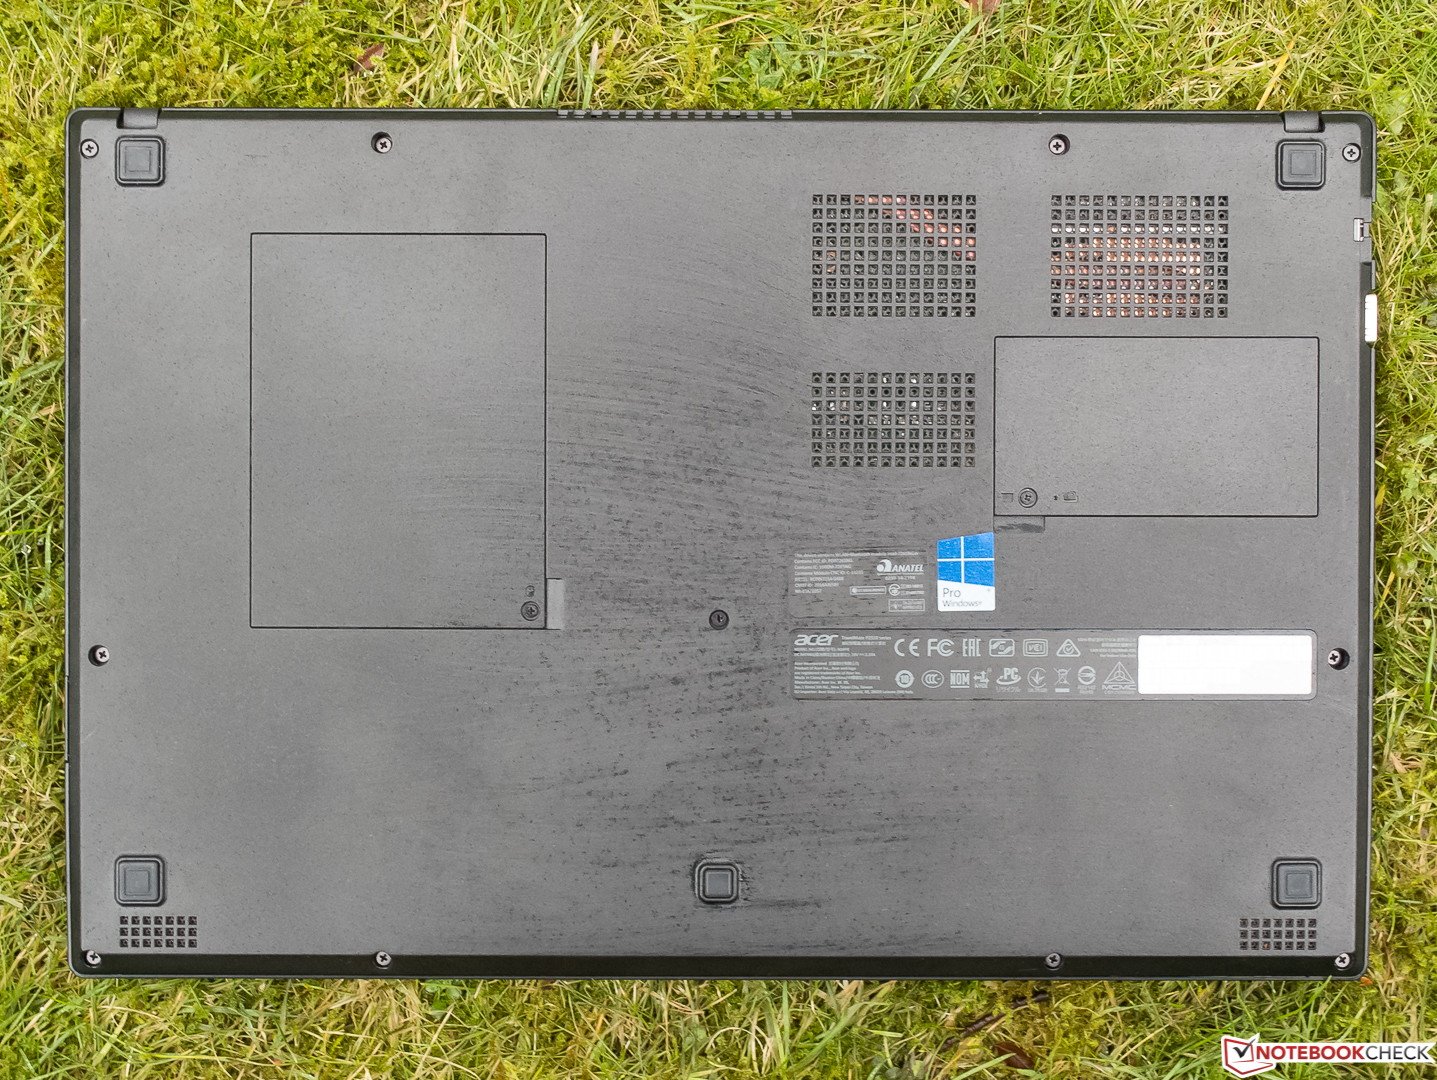
(+) A temperatura máxima no lado superior é 32 °C / 90 F, em comparação com a média de 34.3 °C / 94 F , variando de 21.2 a 62.5 °C para a classe Office.
(+) A parte inferior aquece até um máximo de 35.5 °C / 96 F, em comparação com a média de 36.8 °C / 98 F
(+) Em uso inativo, a temperatura média para o lado superior é 23.9 °C / 75 F, em comparação com a média do dispositivo de 29.5 °C / ### class_avg_f### F.
(+) Os apoios para as mãos e o touchpad são mais frios que a temperatura da pele, com um máximo de 23.9 °C / 75 F e, portanto, são frios ao toque.
(+) A temperatura média da área do apoio para as mãos de dispositivos semelhantes foi 27.5 °C / 81.5 F (+3.6 °C / 6.5 F).
Acer TravelMate P2510-M-51ZQ análise de áudio
(-) | alto-falantes não muito altos (###valor### dB)
Graves 100 - 315Hz
(-) | quase nenhum baixo - em média 16.3% menor que a mediana
(+) | o baixo é linear (5.4% delta para a frequência anterior)
Médios 400 - 2.000 Hz
(±) | médios reduzidos - em média 5.1% menor que a mediana
(+) | médios são lineares (4.7% delta para frequência anterior)
Altos 2 - 16 kHz
(+) | agudos equilibrados - apenas 3.6% longe da mediana
(+) | os máximos são lineares (3.4% delta da frequência anterior)
Geral 100 - 16.000 Hz
(±) | a linearidade do som geral é média (18.4% diferença em relação à mediana)
Comparado com a mesma classe
» 33% de todos os dispositivos testados nesta classe foram melhores, 7% semelhantes, 59% piores
» O melhor teve um delta de 7%, a média foi 21%, o pior foi 53%
Comparado com todos os dispositivos testados
» 41% de todos os dispositivos testados foram melhores, 8% semelhantes, 51% piores
» O melhor teve um delta de 4%, a média foi 23%, o pior foi 134%
Dell Latitude 5580 análise de áudio
(-) | alto-falantes não muito altos (###valor### dB)
Graves 100 - 315Hz
(±) | graves reduzidos - em média 14.1% menor que a mediana
(+) | o baixo é linear (4.8% delta para a frequência anterior)
Médios 400 - 2.000 Hz
(+) | médios equilibrados - apenas 3.8% longe da mediana
(+) | médios são lineares (5.4% delta para frequência anterior)
Altos 2 - 16 kHz
(+) | agudos equilibrados - apenas 2% longe da mediana
(+) | os máximos são lineares (2.1% delta da frequência anterior)
Geral 100 - 16.000 Hz
(±) | a linearidade do som geral é média (15% diferença em relação à mediana)
Comparado com a mesma classe
» 14% de todos os dispositivos testados nesta classe foram melhores, 4% semelhantes, 82% piores
» O melhor teve um delta de 7%, a média foi 21%, o pior foi 53%
Comparado com todos os dispositivos testados
» 21% de todos os dispositivos testados foram melhores, 4% semelhantes, 75% piores
» O melhor teve um delta de 4%, a média foi 23%, o pior foi 134%
HP 15-bs103ng análise de áudio
(-) | alto-falantes não muito altos (###valor### dB)
Graves 100 - 315Hz
(-) | quase nenhum baixo - em média 22.8% menor que a mediana
(±) | a linearidade dos graves é média (14.1% delta para a frequência anterior)
Médios 400 - 2.000 Hz
(+) | médios equilibrados - apenas 2.1% longe da mediana
(+) | médios são lineares (5% delta para frequência anterior)
Altos 2 - 16 kHz
(+) | agudos equilibrados - apenas 2.4% longe da mediana
(±) | a linearidade dos máximos é média (7.7% delta para frequência anterior)
Geral 100 - 16.000 Hz
(±) | a linearidade do som geral é média (18% diferença em relação à mediana)
Comparado com a mesma classe
» 30% de todos os dispositivos testados nesta classe foram melhores, 7% semelhantes, 62% piores
» O melhor teve um delta de 7%, a média foi 21%, o pior foi 53%
Comparado com todos os dispositivos testados
» 38% de todos os dispositivos testados foram melhores, 8% semelhantes, 54% piores
» O melhor teve um delta de 4%, a média foi 23%, o pior foi 134%
Lenovo V510-15IKB 80WQ0002GE análise de áudio
(-) | alto-falantes não muito altos (###valor### dB)
Graves 100 - 315Hz
(±) | graves reduzidos - em média 11.7% menor que a mediana
(±) | a linearidade dos graves é média (8.8% delta para a frequência anterior)
Médios 400 - 2.000 Hz
(+) | médios equilibrados - apenas 1.8% longe da mediana
(+) | médios são lineares (4% delta para frequência anterior)
Altos 2 - 16 kHz
(+) | agudos equilibrados - apenas 3.5% longe da mediana
(±) | a linearidade dos máximos é média (7.2% delta para frequência anterior)
Geral 100 - 16.000 Hz
(+) | o som geral é linear (14.3% diferença em relação à mediana)
Comparado com a mesma classe
» 11% de todos os dispositivos testados nesta classe foram melhores, 4% semelhantes, 85% piores
» O melhor teve um delta de 7%, a média foi 21%, o pior foi 53%
Comparado com todos os dispositivos testados
» 18% de todos os dispositivos testados foram melhores, 4% semelhantes, 78% piores
» O melhor teve um delta de 4%, a média foi 23%, o pior foi 134%
| desligado | |
| Ocioso | |
| Carga |
|
Key:
min: | |
| Acer TravelMate P2510-M-51ZQ i5-7200U, HD Graphics 620, SK Hynix HFS256G39TND-N210A, IPS, 1920x1080, 15.6" | Dell Latitude 5580 i5-7300U, HD Graphics 620, Toshiba MQ01ACF050, IPS, 1920x1080, 15.6" | HP 15-bs103ng i5-8250U, Radeon 520, Samsung SSD PM871a MZNLN256HMHQ, TN LED, 1920x1080, 15.6" | Lenovo V510-15IKB 80WQ0002GE i5-7200U, HD Graphics 620, Samsung CM871a MZNTY256HDHP, IPS, 1920x1080, 15.6" | |
|---|---|---|---|---|
| Power Consumption | -25% | -3% | -20% | |
| Idle Minimum * (Watt) | 3.4 | 4.3 -26% | 3.2 6% | 4 -18% |
| Idle Average * (Watt) | 5.8 | 10.1 -74% | 5.8 -0% | 9.6 -66% |
| Idle Maximum * (Watt) | 8 | 11.8 -48% | 6.3 21% | 9.7 -21% |
| Load Average * (Watt) | 38 | 32 16% | 34 11% | 27.7 27% |
| Load Maximum * (Watt) | 32 | 29 9% | 49 -53% | 38.4 -20% |
* ... menor é melhor
| Acer TravelMate P2510-M-51ZQ i5-7200U, HD Graphics 620, 48 Wh | Dell Latitude 5580 i5-7300U, HD Graphics 620, 68 Wh | HP 15-bs103ng i5-8250U, Radeon 520, 41.6 Wh | Lenovo V510-15IKB 80WQ0002GE i5-7200U, HD Graphics 620, 32 Wh | |
|---|---|---|---|---|
| Duração da bateria | 16% | -8% | -57% | |
| Reader / Idle (h) | 15.2 | 14.8 -3% | ||
| WiFi v1.3 (h) | 8.8 | 10.2 16% | 7.9 -10% | 3.8 -57% |
| Load (h) | 1.9 | 1.7 -11% | ||
| H.264 (h) | 7.6 |
Pro
Contra
Se os problemas com a carcaça deformada dizem respeito apenas à nossa unidade de teste ou não, sempre devemos avaliar o que nos é fornecido. A sub-avaliação resulta correspondentemente ruim.
Se deixar de lado a carcaça, resulta uma impressão muito positiva, considerando o preço muito baixo do modelo de nível de entrada em particular. Os compradores de orçamento com ambições de escritório certamente ignorarão os pontos fracos da tela, bem como o lento leitor de cartões. As vantagens da lista de aspectos positivos, como os bons dispositivos de entrada, a WLAN rápida, TPM e a duração da bateria muito decente, provavelmente serão mais importantes aqui. Do ponto de vista técnico, tudo parece bom, e o TravelMate oferece um desempenho constante enquanto permanece silencioso e frio.
Com o TravelMate P2510-M-51ZQ, a Acer realmente apresenta um portátil de escritório bem sucedido com uma boa relação preço-desempenho, no entanto, devido a defeitos de qualidade consideráveis da carcaça do nosso modelo de teste, devemos reter nossa recomendação de compra.
Acer TravelMate P2510-M-51ZQ
- 03/03/2018 v6 (old)
Sven Kloevekorn