Breve Análise do Portátil Dell Latitude 5580 (Full-HD, i5-7300U)
| |||||||||||||||||||||||||
iluminação: 84 %
iluminação com acumulador: 234 cd/m²
Contraste: 1300:1 (Preto: 0.18 cd/m²)
ΔE ColorChecker Calman: 5.3 | ∀{0.5-29.43 Ø4.71}
ΔE Greyscale Calman: 4 | ∀{0.09-98 Ø4.96}
60% sRGB (Argyll 1.6.3 3D)
39% AdobeRGB 1998 (Argyll 1.6.3 3D)
42.94% AdobeRGB 1998 (Argyll 3D)
60.7% sRGB (Argyll 3D)
41.57% Display P3 (Argyll 3D)
Gamma: 2.46
CCT: 6441 K
| Dell Latitude 5580 BOE NV15N42, , 1920x1080, 15.6" | Dell Latitude 5580 1366x768, 15.6" | Lenovo ThinkPad T470s-20HGS00V00 B140QAN01.5, , 2560x1440, 14" | |
|---|---|---|---|
| Display | -2% | 62% | |
| Display P3 Coverage (%) | 41.57 | 40.13 -3% | 69 66% |
| sRGB Coverage (%) | 60.7 | 60 -1% | 95.1 57% |
| AdobeRGB 1998 Coverage (%) | 42.94 | 41.5 -3% | 69.6 62% |
| Response Times | 20% | 3% | |
| Response Time Grey 50% / Grey 80% * (ms) | 43 ? | 30 ? 30% | 46.4 ? -8% |
| Response Time Black / White * (ms) | 33 ? | 29.6 ? 10% | 28.8 ? 13% |
| PWM Frequency (Hz) | 1020 ? | 201.6 ? | |
| Screen | -79% | -1% | |
| Brightness middle (cd/m²) | 234 | 238 2% | 327 40% |
| Brightness (cd/m²) | 224 | 216 -4% | 311 39% |
| Brightness Distribution (%) | 84 | 83 -1% | 88 5% |
| Black Level * (cd/m²) | 0.18 | 0.53 -194% | 0.25 -39% |
| Contrast (:1) | 1300 | 449 -65% | 1308 1% |
| Colorchecker dE 2000 * | 5.3 | 10.8 -104% | 6.1 -15% |
| Colorchecker dE 2000 max. * | 9.09 | 29.3 -222% | 12.2 -34% |
| Greyscale dE 2000 * | 4 | 12.1 -203% | 8.8 -120% |
| Gamma | 2.46 89% | 2.25 98% | 2.18 101% |
| CCT | 6441 101% | 14344 45% | 6172 105% |
| Color Space (Percent of AdobeRGB 1998) (%) | 39 | 38.3 -2% | 61.56 58% |
| Color Space (Percent of sRGB) (%) | 60 | 59.9 0% | 94.88 58% |
| Média Total (Programa/Configurações) | -20% /
-51% | 21% /
12% |
* ... menor é melhor
Exibir tempos de resposta
| ↔ Tempo de resposta preto para branco | ||
|---|---|---|
| 33 ms ... ascensão ↗ e queda ↘ combinadas | ↗ 19 ms ascensão | 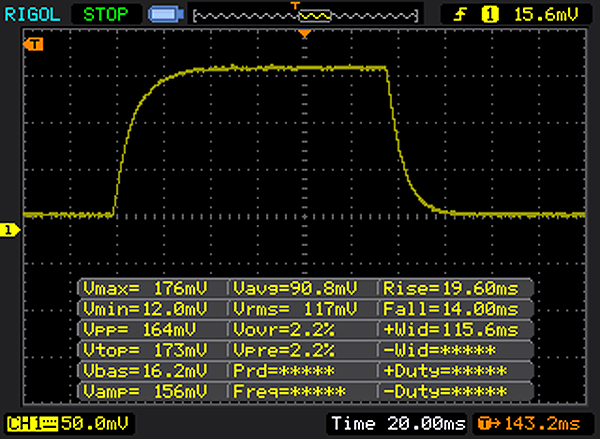 |
| ↘ 14 ms queda | ||
| A tela mostra taxas de resposta lentas em nossos testes e será insatisfatória para os jogadores. Em comparação, todos os dispositivos testados variam de 0.1 (mínimo) a 240 (máximo) ms. » 89 % de todos os dispositivos são melhores. Isso significa que o tempo de resposta medido é pior que a média de todos os dispositivos testados (19.8 ms). | ||
| ↔ Tempo de resposta 50% cinza a 80% cinza | ||
| 43 ms ... ascensão ↗ e queda ↘ combinadas | ↗ 23 ms ascensão | 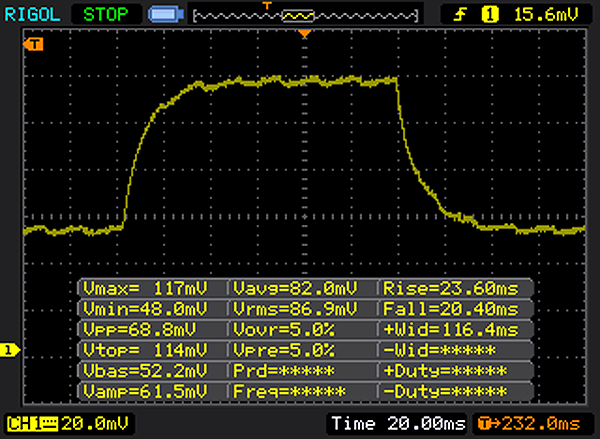 |
| ↘ 20 ms queda | ||
| A tela mostra taxas de resposta lentas em nossos testes e será insatisfatória para os jogadores. Em comparação, todos os dispositivos testados variam de 0.165 (mínimo) a 636 (máximo) ms. » 71 % de todos os dispositivos são melhores. Isso significa que o tempo de resposta medido é pior que a média de todos os dispositivos testados (30.9 ms). | ||
Cintilação da tela / PWM (modulação por largura de pulso)
| Tela tremeluzindo/PWM detectado | 1020 Hz | 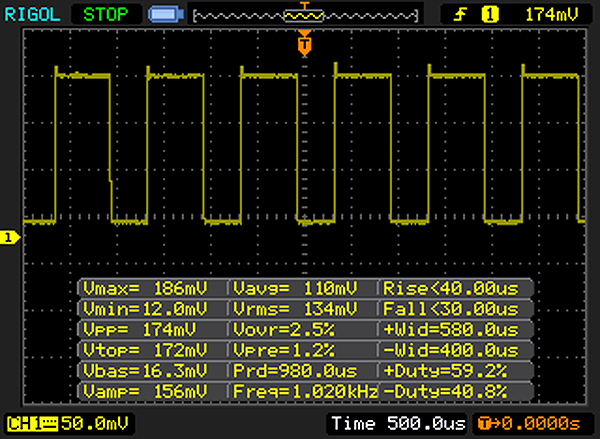 | |
| ≤ 90 brilho cd/m² | |||
A luz de fundo da tela pisca em 1020 Hz (pior caso, por exemplo, utilizando PWM) Cintilação detectada em uma configuração de brilho de 90 cd/m² e abaixo. Não deve haver cintilação ou PWM acima desta configuração de brilho. A frequência de 1020 Hz é bastante alta, então a maioria dos usuários sensíveis ao PWM não deve notar nenhuma oscilação. A cintilação ocorre em configurações de brilho relativamente baixas, portanto, o uso prolongado nesta configuração de brilho ou inferior pode causar fadiga ocular. [pwm_comparison] Em comparação: 52 % de todos os dispositivos testados não usam PWM para escurecer a tela. Se PWM foi detectado, uma média de 7744 (mínimo: 5 - máximo: 343500) Hz foi medida. | |||

| PCMark 8 | |
| Home Score Accelerated v2 | |
| Lenovo ThinkPad T470s-20HF0012US | |
| HP EliteBook x360 1030 G2 | |
| Dell Latitude 5580 | |
| Dell Latitude 5580 | |
| HP Probook 650 G3 Z2W44ET | |
| Microsoft Surface Pro (2017) i5 | |
| Acer Aspire E5-774-54HJ | |
| Work Score Accelerated v2 | |
| Lenovo ThinkPad T470s-20HF0012US | |
| HP EliteBook x360 1030 G2 | |
| Dell Latitude 5580 | |
| HP Probook 650 G3 Z2W44ET | |
| Microsoft Surface Pro (2017) i5 | |
| PCMark 8 Home Score Accelerated v2 | 3300 pontos | |
Ajuda | ||
| 3DMark 11 - 1280x720 Performance GPU | |
| Lenovo ThinkPad T470s-20HGS00V00 | |
| Dell Latitude 5289 | |
| Lenovo ThinkPad T470s-20HF0012US | |
| HP EliteBook x360 1030 G2 | |
| Dell Latitude 5580 | |
| Dell Latitude 5580 | |
| BioShock Infinite | |
| 1280x720 Very Low Preset | |
| Lenovo ThinkPad T470s-20HF0012US | |
| Dell Latitude 5580 | |
| Dell Latitude 5580 | |
| 1366x768 Medium Preset | |
| Lenovo ThinkPad T470s-20HF0012US | |
| Dell Latitude 5580 | |
| Dell Latitude 5580 | |
| baixo | média | alto | ultra | |
|---|---|---|---|---|
| BioShock Infinite (2013) | 39.7 | 23.6 | 19.6 |
Barulho
| Ocioso |
| 32.8 / 32.8 / 33.6 dB |
| Carga |
| 37.6 / 37.6 dB |
 | ||
30 dB silencioso 40 dB(A) audível 50 dB(A) ruidosamente alto |
||
min: | ||
(+) A temperatura máxima no lado superior é 35.4 °C / 96 F, em comparação com a média de 34.3 °C / 94 F , variando de 21.2 a 62.5 °C para a classe Office.
(±) A parte inferior aquece até um máximo de 41.8 °C / 107 F, em comparação com a média de 36.8 °C / 98 F
(+) Em uso inativo, a temperatura média para o lado superior é 27.2 °C / 81 F, em comparação com a média do dispositivo de 29.5 °C / ### class_avg_f### F.
(+) Os apoios para as mãos e o touchpad são mais frios que a temperatura da pele, com um máximo de 28.1 °C / 82.6 F e, portanto, são frios ao toque.
(±) A temperatura média da área do apoio para as mãos de dispositivos semelhantes foi 27.6 °C / 81.7 F (-0.5 °C / -0.9 F).
| desligado | |
| Ocioso | |
| Carga |
|
Key:
min: | |
| Dell Latitude 5580 i5-7300U, HD Graphics 620, Toshiba MQ01ACF050, IPS, 1920x1080, 15.6" | Lenovo ThinkPad T470s-20HF0012US i5-7300U, HD Graphics 620, Samsung PM961 MZVLW256HEHP, IPS, 1920x1080, 14" | Dell Latitude 5580 i5-7200U, HD Graphics 620, Seagate ST500LM021-1KJ15, TN LED, 1366x768, 15.6" | HP Probook 650 G3 Z2W44ET i5-7200U, HD Graphics 620, Hitachi Travelstar Z7K500 HTS725050A7E630, TN LED, 1920x1080, 15.6" | |
|---|---|---|---|---|
| Power Consumption | -3% | 19% | 17% | |
| Idle Minimum * (Watt) | 4.3 | 4.8 -12% | 3.5 19% | 4 7% |
| Idle Average * (Watt) | 10.1 | 6.6 35% | 6 41% | 6.9 32% |
| Idle Maximum * (Watt) | 11.8 | 7 41% | 7.3 38% | 7.6 36% |
| Load Average * (Watt) | 32 | 39.2 -23% | 30.8 4% | 29 9% |
| Load Maximum * (Watt) | 29 | 44.8 -54% | 31 -7% | 28.7 1% |
* ... menor é melhor
| Dell Latitude 5580 i5-7300U, HD Graphics 620, 68 Wh | Lenovo ThinkPad T470s-20HF0012US i5-7300U, HD Graphics 620, 51 Wh | Dell Latitude 5580 i5-7200U, HD Graphics 620, 68 Wh | HP Probook 650 G3 Z2W44ET i5-7200U, HD Graphics 620, 48 Wh | |
|---|---|---|---|---|
| Duração da bateria | -21% | 14% | -24% | |
| WiFi v1.3 (h) | 10.2 | 8.1 -21% | 11.6 14% | 7.8 -24% |
| Reader / Idle (h) | 17.7 | 18.4 | 12.8 | |
| Load (h) | 2.9 | 2.2 | 3 | |
| H.264 (h) | 6.7 |
Pro
Contra
A diferença com o modelo Latitude 5580 que já testamos pode não parecer grande à primeira vista. Mas particularmente, a tela Full-HD faz a diferença e completa o pacote. Já admiramos os bons dispositivos de entrada do dispositivo na última análise, que são adequados para sessões longas de digitação no trabalho ou em casa. Particularmente para o setor empresarial, o Dell Latitude 5580 oferece alguns padrões de segurança importantes.
A atualização do processador nessa configuração não teve êxito. Nossos benchmarks não mostraram uma melhora no desempenho notável. Ele ainda está fica uma hora atrás no tempo de duração da bateria.
O Dell Latitude demonstra ser um companheiro estável, seja como um portátil de negócios de nível básico ou um parceiro de escritório para uso diário.
No entanto, também vale a pena dar uma olhada no Lenovo ThinkPad T470s, que possui um armazenamento SSD ais veloz e se desempenhou melhor em nossos benchmarks.
Dell Latitude 5580
- 07/02/2017 v6 (old)
Nino Ricchizzi