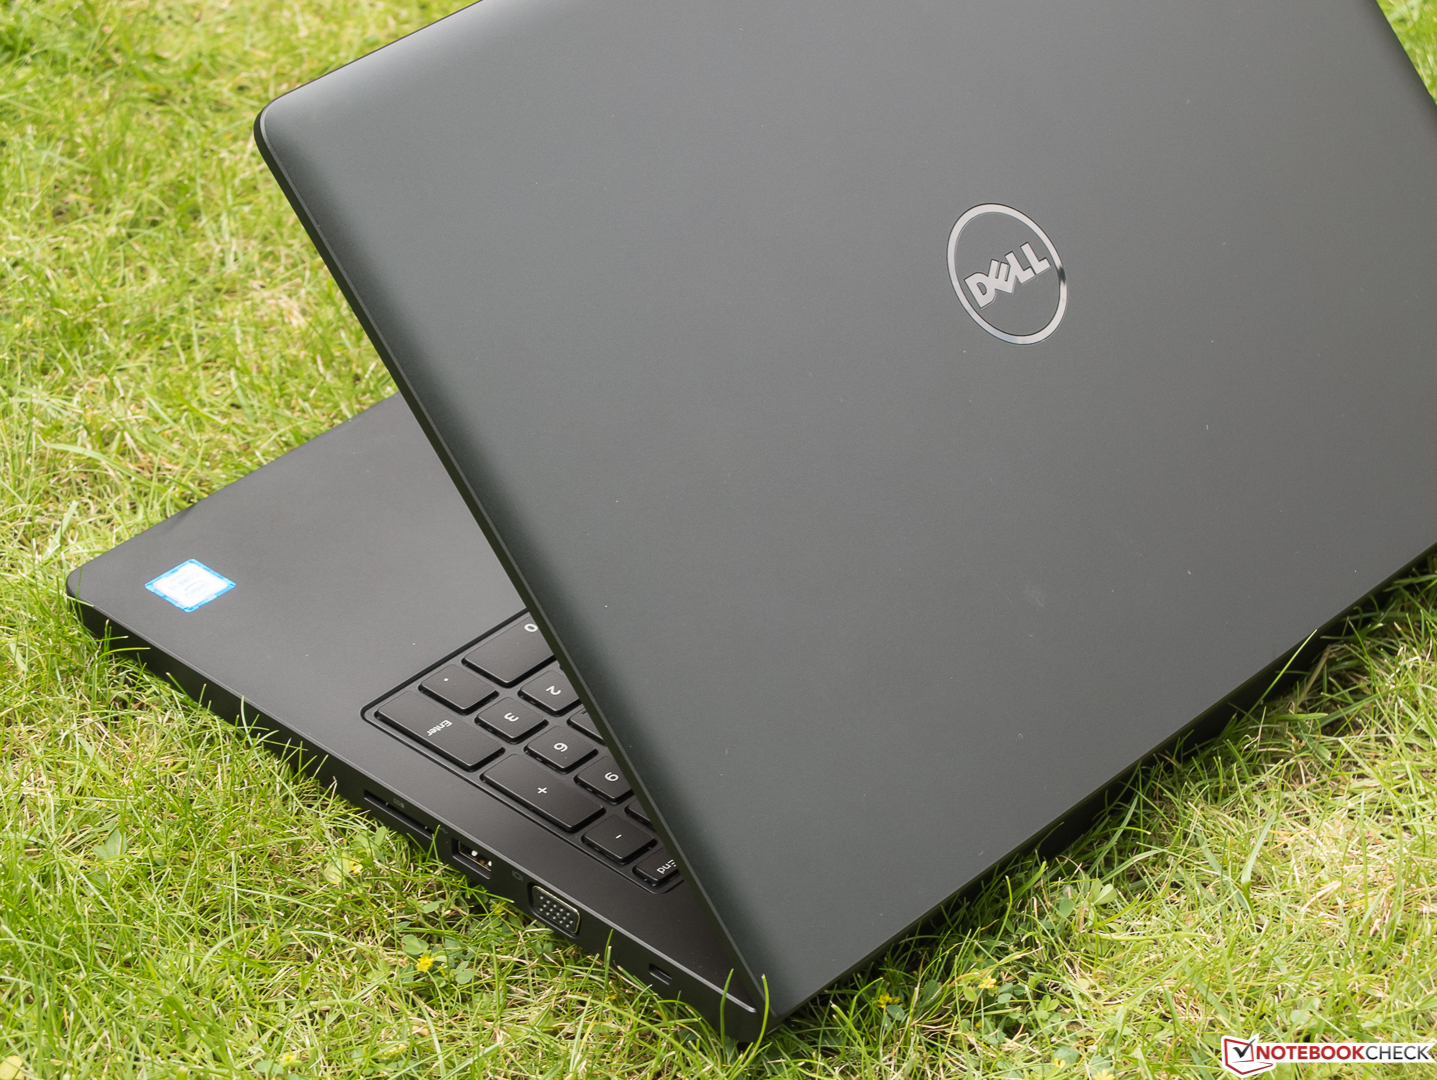
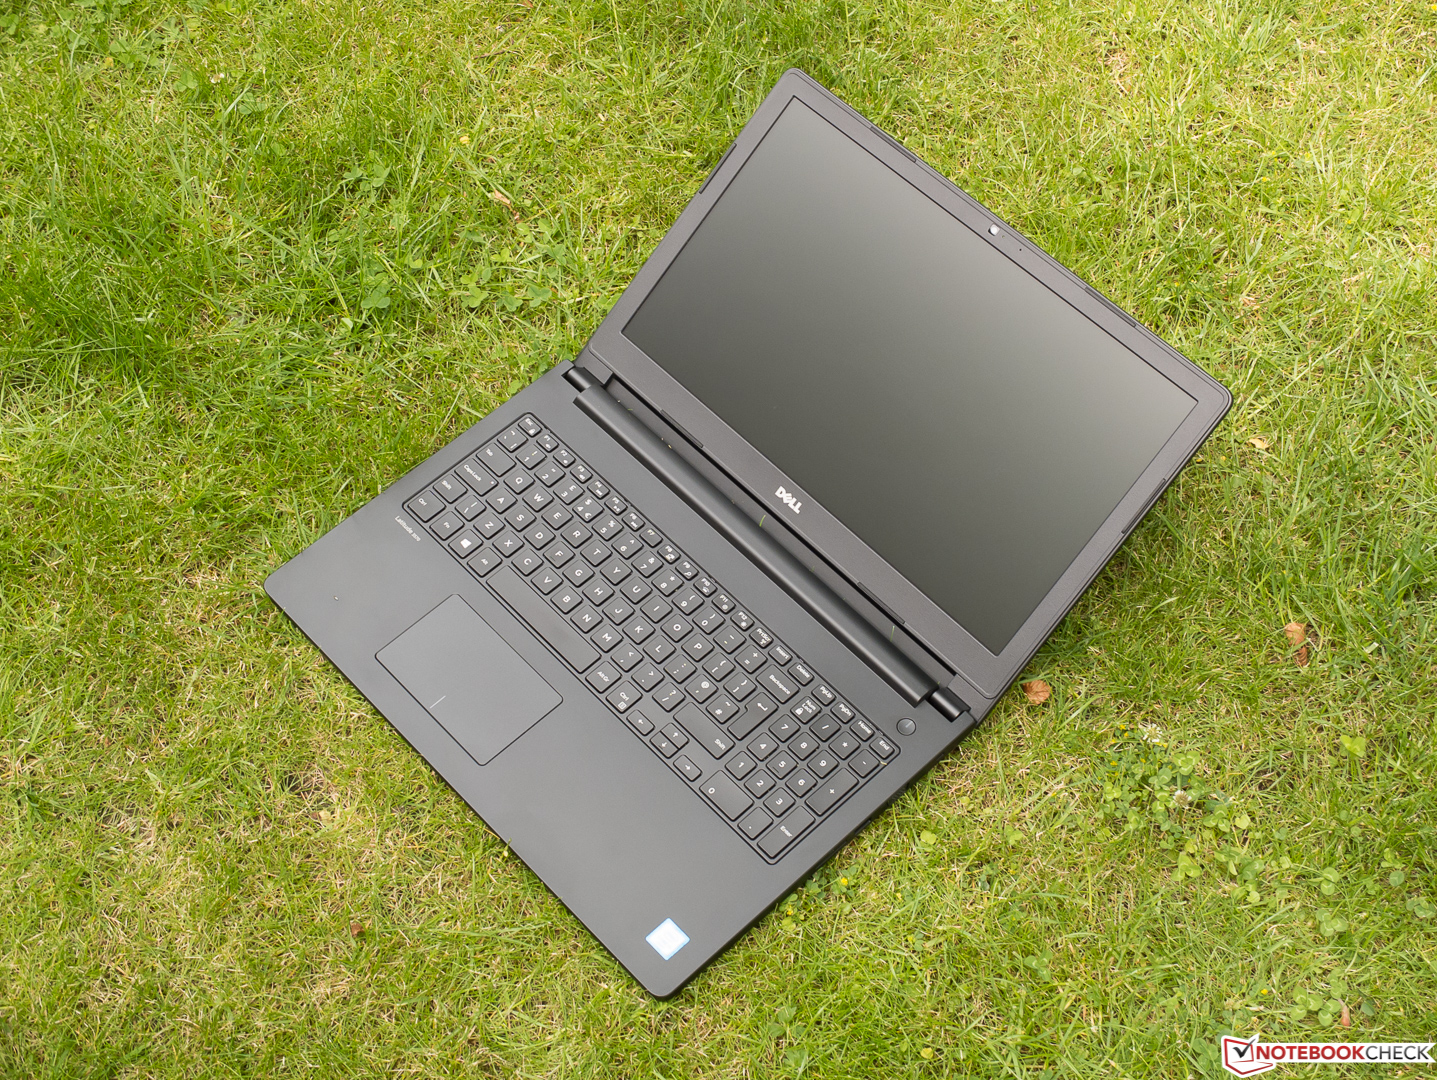
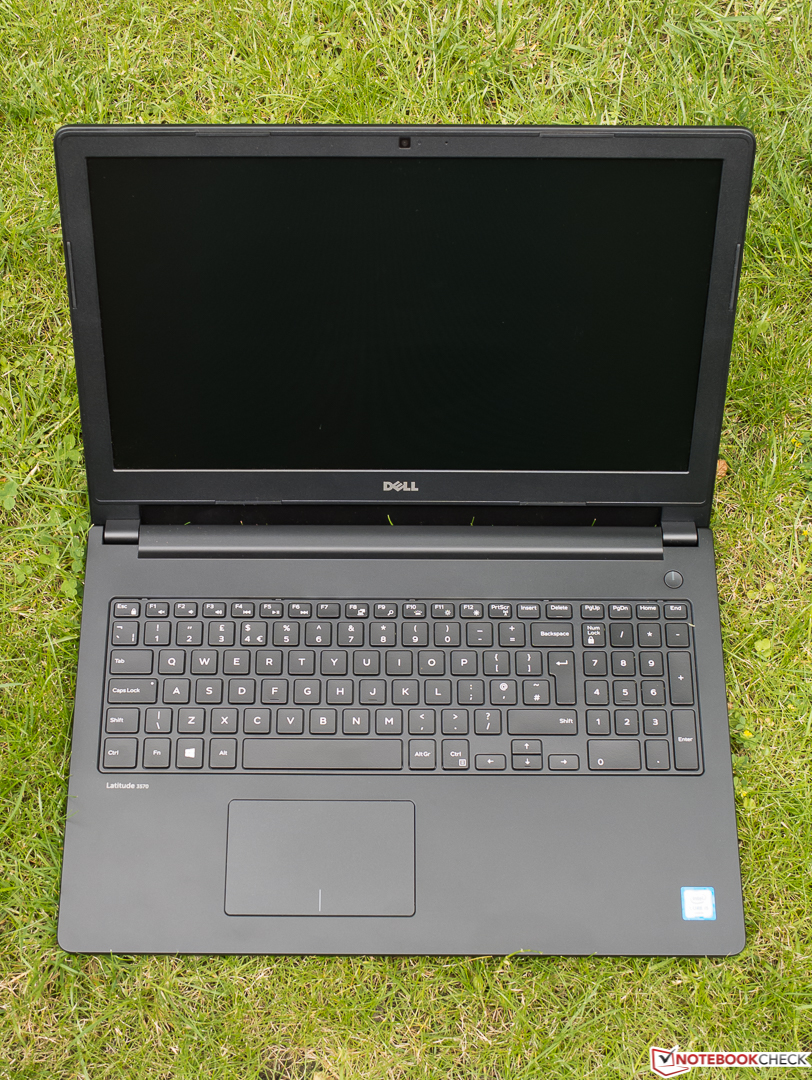
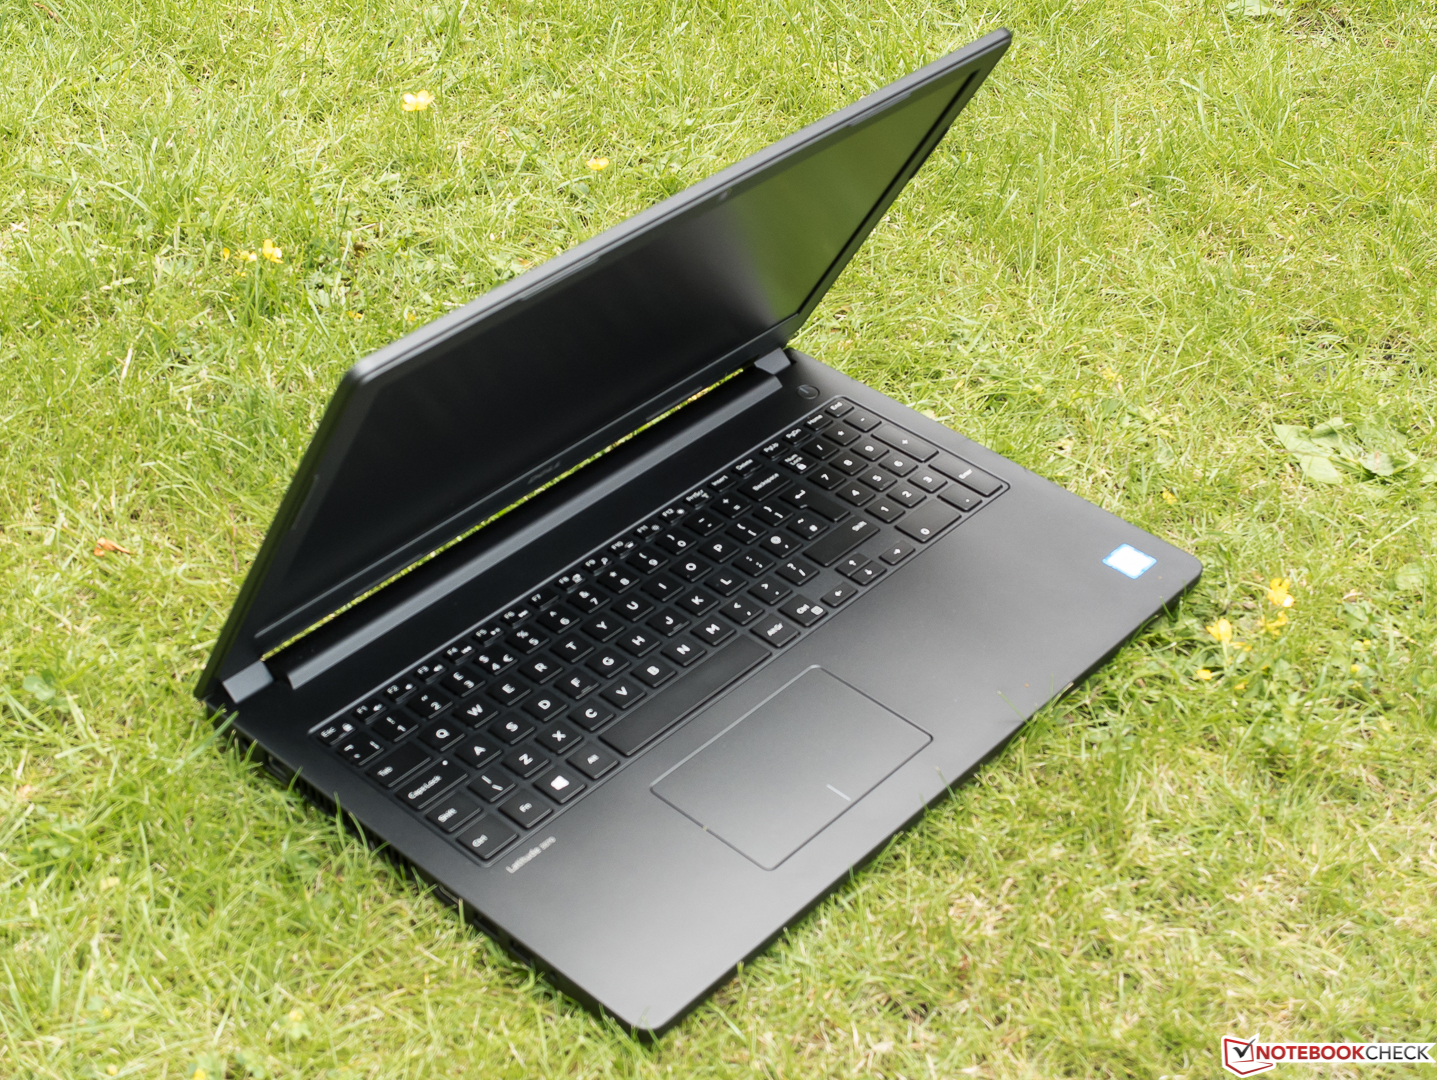
Breve Análise do Portátil Dell Latitude 15 3570


| |||||||||||||||||||||||||
iluminação: 88 %
iluminação com acumulador: 206 cd/m²
Contraste: 326:1 (Preto: 0.62 cd/m²)
ΔE ColorChecker Calman: 12.35 | ∀{0.5-29.43 Ø4.71}
ΔE Greyscale Calman: 13.46 | ∀{0.09-98 Ø4.96}
61% sRGB (Argyll 1.6.3 3D)
39% AdobeRGB 1998 (Argyll 1.6.3 3D)
41.96% AdobeRGB 1998 (Argyll 3D)
61.1% sRGB (Argyll 3D)
40.61% Display P3 (Argyll 3D)
Gamma: 2.44
CCT: 15217 K
| Dell Latitude 15-3570 | Lenovo ThinkPad L560-20F10026GE | HP ProBook 450 G3 | Lenovo ThinkPad E550-20DF00CNGE | |
|---|---|---|---|---|
| Display | -4% | -6% | -2% | |
| Display P3 Coverage (%) | 40.61 | 39 -4% | 38.1 -6% | 39.84 -2% |
| sRGB Coverage (%) | 61.1 | 58.3 -5% | 57.3 -6% | 59.3 -3% |
| AdobeRGB 1998 Coverage (%) | 41.96 | 40.33 -4% | 39.37 -6% | 41.2 -2% |
| Response Times | 9% | 7% | ||
| Response Time Grey 50% / Grey 80% * (ms) | 37 ? | 39.2 ? -6% | 41.2 ? -11% | |
| Response Time Black / White * (ms) | 37 ? | 28 ? 24% | 28 ? 24% | |
| PWM Frequency (Hz) | ||||
| Screen | 35% | 14% | 9% | |
| Brightness middle (cd/m²) | 202 | 262 30% | 211 4% | 195 -3% |
| Brightness (cd/m²) | 211 | 250 18% | 214 1% | 188 -11% |
| Brightness Distribution (%) | 88 | 92 5% | 91 3% | 90 2% |
| Black Level * (cd/m²) | 0.62 | 0.29 53% | 0.43 31% | 0.46 26% |
| Contrast (:1) | 326 | 903 177% | 491 51% | 424 30% |
| Colorchecker dE 2000 * | 12.35 | 8.49 31% | 9.25 25% | 9.92 20% |
| Colorchecker dE 2000 max. * | 19.9 | 17.99 10% | ||
| Greyscale dE 2000 * | 13.46 | 8.11 40% | 9.83 27% | 10.06 25% |
| Gamma | 2.44 90% | 2.37 93% | 2.82 78% | 2.37 93% |
| CCT | 15217 43% | 6300 103% | 10890 60% | 11552 56% |
| Color Space (Percent of AdobeRGB 1998) (%) | 39 | 37.07 -5% | 36.4 -7% | 38 -3% |
| Color Space (Percent of sRGB) (%) | 61 | 57.94 -5% | 57.3 -6% | 59.3 -3% |
| Média Total (Programa/Configurações) | 13% /
24% | 5% /
9% | 4% /
6% |
* ... menor é melhor
Exibir tempos de resposta
| ↔ Tempo de resposta preto para branco | ||
|---|---|---|
| 37 ms ... ascensão ↗ e queda ↘ combinadas | ↗ 20 ms ascensão | 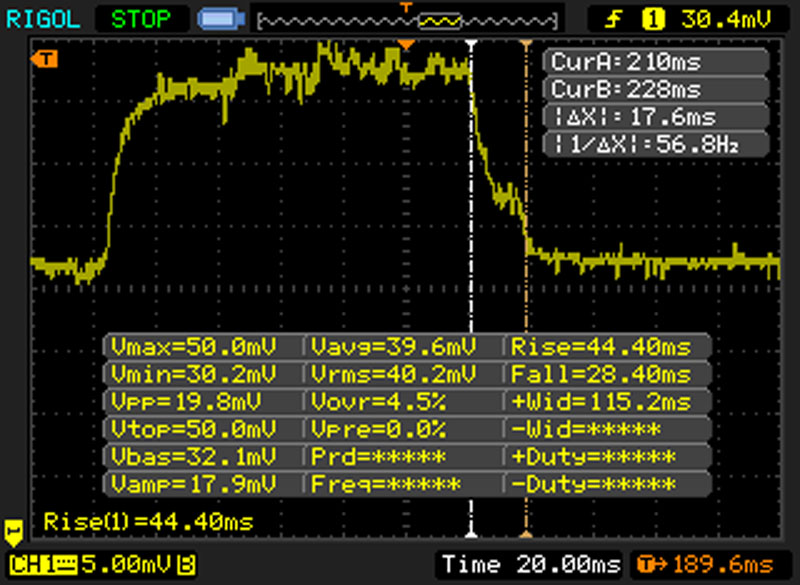 |
| ↘ 17 ms queda | ||
| A tela mostra taxas de resposta lentas em nossos testes e será insatisfatória para os jogadores. Em comparação, todos os dispositivos testados variam de 0.1 (mínimo) a 240 (máximo) ms. » 95 % de todos os dispositivos são melhores. Isso significa que o tempo de resposta medido é pior que a média de todos os dispositivos testados (19.8 ms). | ||
| ↔ Tempo de resposta 50% cinza a 80% cinza | ||
| 37 ms ... ascensão ↗ e queda ↘ combinadas | ↗ 13 ms ascensão | 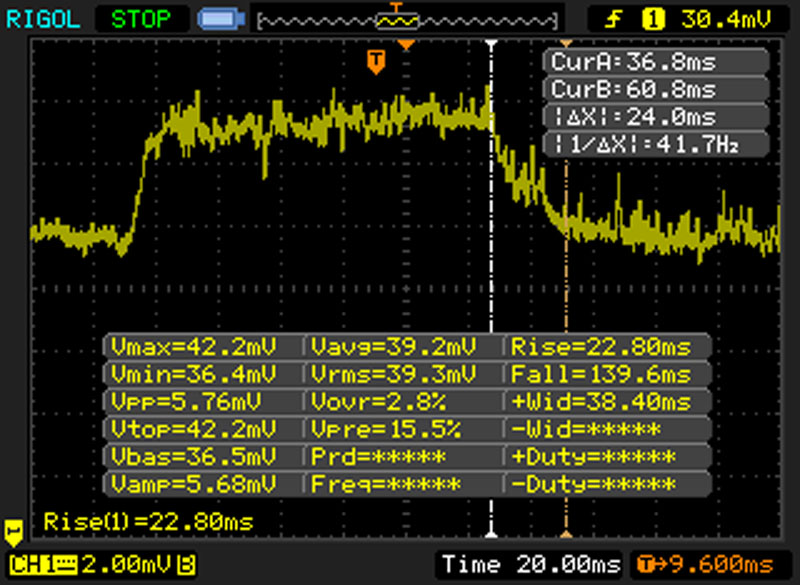 |
| ↘ 24 ms queda | ||
| A tela mostra taxas de resposta lentas em nossos testes e será insatisfatória para os jogadores. Em comparação, todos os dispositivos testados variam de 0.165 (mínimo) a 636 (máximo) ms. » 53 % de todos os dispositivos são melhores. Isso significa que o tempo de resposta medido é pior que a média de todos os dispositivos testados (31 ms). | ||
Cintilação da tela / PWM (modulação por largura de pulso)
| Tela tremeluzindo / PWM não detectado | ||
[pwm_comparison] Em comparação: 52 % de todos os dispositivos testados não usam PWM para escurecer a tela. Se PWM foi detectado, uma média de 7754 (mínimo: 5 - máximo: 343500) Hz foi medida. | ||
| PCMark 8 | |
| Home Score Accelerated v2 | |
| Lenovo ThinkPad E550-20DF00CNGE | |
| Dell Latitude 15-3570 | |
| HP ProBook 450 G3 | |
| Lenovo ThinkPad L560-20F10026GE | |
| Work Score Accelerated v2 | |
| Dell Latitude 15-3570 | |
| Lenovo ThinkPad E550-20DF00CNGE | |
| HP ProBook 450 G3 | |
| Lenovo ThinkPad L560-20F10026GE | |
| PCMark 8 Home Score Accelerated v2 | 3337 pontos | |
| PCMark 8 Work Score Accelerated v2 | 4477 pontos | |
Ajuda | ||
| Dell Latitude 15-3570 Samsung CM871 MZNLF128HCHP | Lenovo ThinkPad L560-20F10026GE WDC Slim WD10SPCX-21KHST0 | HP ProBook 450 G3 Seagate ST500LM021-1KJ15 | Lenovo ThinkPad E550-20DF00CNGE WDC Slim WD10SPCX-22HWST0 | |
|---|---|---|---|---|
| CrystalDiskMark 3.0 | -90% | -90% | -92% | |
| Read Seq (MB/s) | 453.2 | 113.6 -75% | 122.8 -73% | 101.9 -78% |
| Read 4k (MB/s) | 19.06 | 0.488 -97% | 0.341 -98% | 0.315 -98% |
| Read 4k QD32 (MB/s) | 93.5 | 1.367 -99% | 0.897 -99% | 0.967 -99% |
| AS SSD | ||||
| Seq Read (MB/s) | 489.1 | |||
| 4K Read (MB/s) | 17.25 | |||
| 4K-64 Read (MB/s) | 81.8 | |||
| Score Write (Points) | 54 | |||
| Média Total (Programa/Configurações) | -90% /
-90% | -90% /
-90% | -92% /
-92% |

| 3DMark 11 - 1280x720 Performance GPU | |
| Lenovo ThinkPad E550-20DF00CNGE | |
| Dell Latitude 15-3570 | |
| Lenovo ThinkPad L560-20F10026GE | |
| HP ProBook 450 G3 | |
| 3DMark 11 Performance | 1363 pontos | |
| 3DMark Ice Storm Standard Score | 46457 pontos | |
| 3DMark Cloud Gate Standard Score | 4919 pontos | |
Ajuda | ||
| baixo | média | alto | ultra | |
|---|---|---|---|---|
| BioShock Infinite (2013) | 36.5 | 20.8 | 16.8 | |
| Metro: Last Light (2013) | 17.7 | 15.3 | ||
| The Witcher 3 (2015) | 11.2 | 7 |
Barulho
| Ocioso |
| 31 / 31 / 31 dB |
| Carga |
| 34.2 / 34.3 dB |
 | ||
30 dB silencioso 40 dB(A) audível 50 dB(A) ruidosamente alto |
||
min: | ||
(+) A temperatura máxima no lado superior é 36.1 °C / 97 F, em comparação com a média de 34.3 °C / 94 F , variando de 21.2 a 62.5 °C para a classe Office.
(-) A parte inferior aquece até um máximo de 47 °C / 117 F, em comparação com a média de 36.8 °C / 98 F
(+) Em uso inativo, a temperatura média para o lado superior é 29.5 °C / 85 F, em comparação com a média do dispositivo de 29.5 °C / ### class_avg_f### F.
(+) Os apoios para as mãos e o touchpad estão atingindo a temperatura máxima da pele (35.8 °C / 96.4 F) e, portanto, não estão quentes.
(-) A temperatura média da área do apoio para as mãos de dispositivos semelhantes foi 27.5 °C / 81.5 F (-8.3 °C / -14.9 F).
| desligado | |
| Ocioso | |
| Carga |
|
Key:
min: | |
| Dell Latitude 15-3570 HD Graphics 520, 6200U, Samsung CM871 MZNLF128HCHP | Lenovo ThinkPad L560-20F10026GE HD Graphics 520, 6200U, WDC Slim WD10SPCX-21KHST0 | HP ProBook 450 G3 HD Graphics 520, 6200U, Seagate ST500LM021-1KJ15 | Lenovo ThinkPad E550-20DF00CNGE Radeon R7 M265, 5500U, WDC Slim WD10SPCX-22HWST0 | |
|---|---|---|---|---|
| Duração da bateria | -29% | -43% | -42% | |
| Reader / Idle (h) | 17.1 | 11.6 -32% | 9.6 -44% | 11.1 -35% |
| WiFi v1.3 (h) | 9 | 6.8 -24% | 5.2 -42% | 4.9 -46% |
| Load (h) | 2.6 | 1.8 -31% | 1.5 -42% | 1.4 -46% |
Pro
Contra
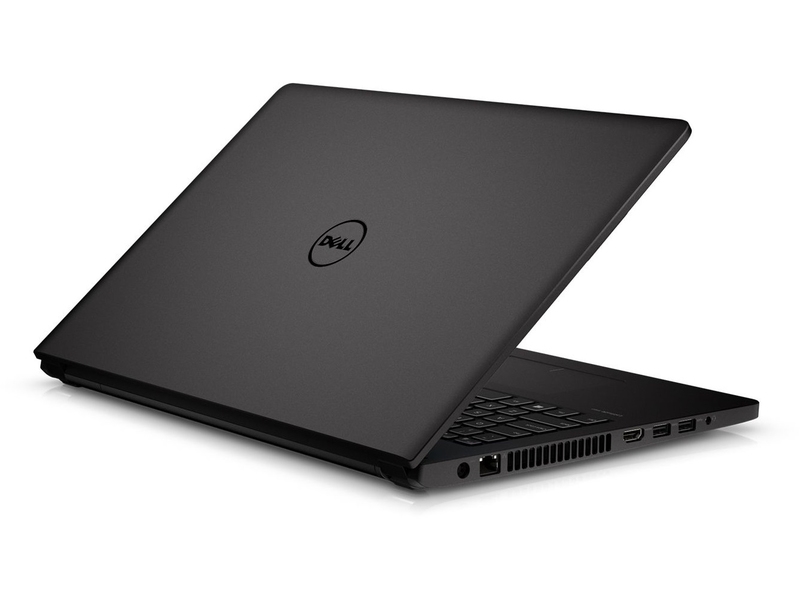
Enquanto o Dell Latitude 15-3570 esteja em oferta, particularmente o membro de menor preço do trabalhador de escritório pode se dizer que tem uma razão de preço-desempenho muito boa. Um preço de entrada de 419 Euros (~$463 incluindo o desconto) não é um problema para a boa carcaça e os bons dispositivos de entrada do modelo menor. No entanto, o modelo de teste exibe fraquezas evidentes na tela e no som, e por isso, os fanáticos da multimídia deveriam procurar outra coisa. Por outro lado, os aspectos técnicos, e a operação quase silenciosa e fria é impressionante. Se a bateria protuberante for um problema, também está disponível uma bateria de 48 Wh. Os usuários preocupados com a segurança receberão muito bem o chio TPM e a opção de leitor de digitais.
A versão testada do 3570 teve a vantagem de um manuseio bastante mais fluente que seus rivais graças ao seu SSD. No entanto, a tela não mantém o nível aqui, e nãos apenas por causa de sua baixa resolução.
Esta é uma versão reduzida da análise original. Você pode ler a análise completa em inglês aqui.
Dell Latitude 15-3570
- 07/01/2016 v5.1 (old)
Sven Kloevekorn