Breve Análise do Portátil Empresarial HP ProBook 640 G3 (7200U, Full HD)
| SD Card Reader | |
| average JPG Copy Test (av. of 3 runs) | |
| Dell Latitude 14 E5470 | |
| Dell Latitude 14 E5470 | |
| HP ProBook 640 G2-T9X60ET | |
| Acer TravelMate P648-M-757N | |
| HP ProBook 640 G3 Z2W33ET | |
| Lenovo ThinkPad L460-20FVS01400 | |
| maximum AS SSD Seq Read Test (1GB) | |
| Dell Latitude 14 E5470 | |
| Dell Latitude 14 E5470 | |
| HP ProBook 640 G2-T9X60ET | |
| Lenovo ThinkPad L460-20FVS01400 | |
| HP ProBook 640 G3 Z2W33ET | |
| Networking | |
| iperf3 transmit AX12 | |
| HP ProBook 640 G3 Z2W33ET (jseb) | |
| Dell Latitude 14 E5470 (jseb) | |
| iperf3 receive AX12 | |
| Dell Latitude 14 E5470 (jseb) | |
| HP ProBook 640 G3 Z2W33ET (jseb) | |
| |||||||||||||||||||||||||
iluminação: 88 %
iluminação com acumulador: 360 cd/m²
Contraste: 497:1 (Preto: 0.69 cd/m²)
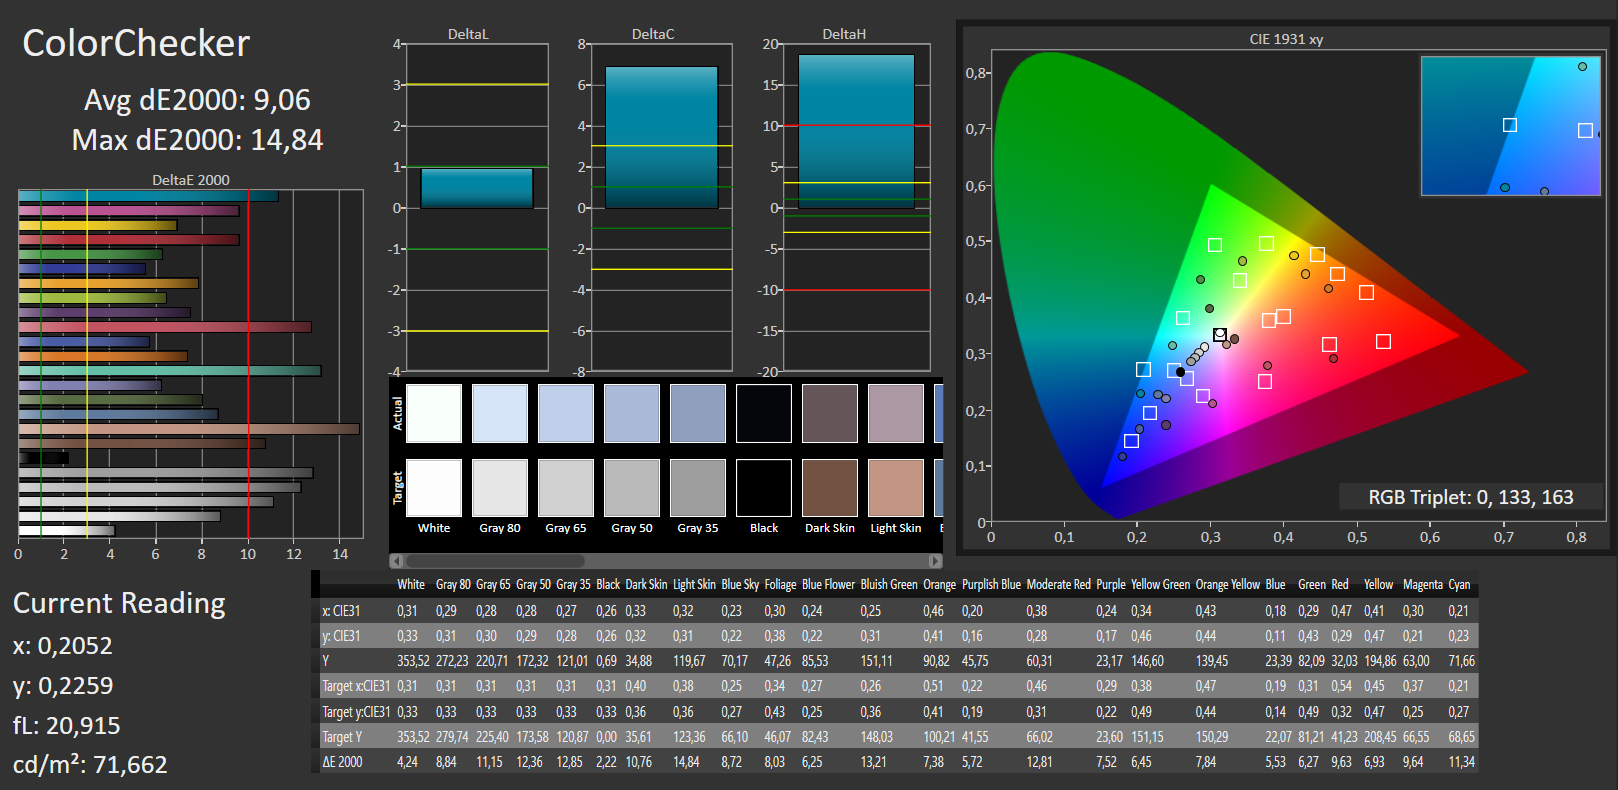
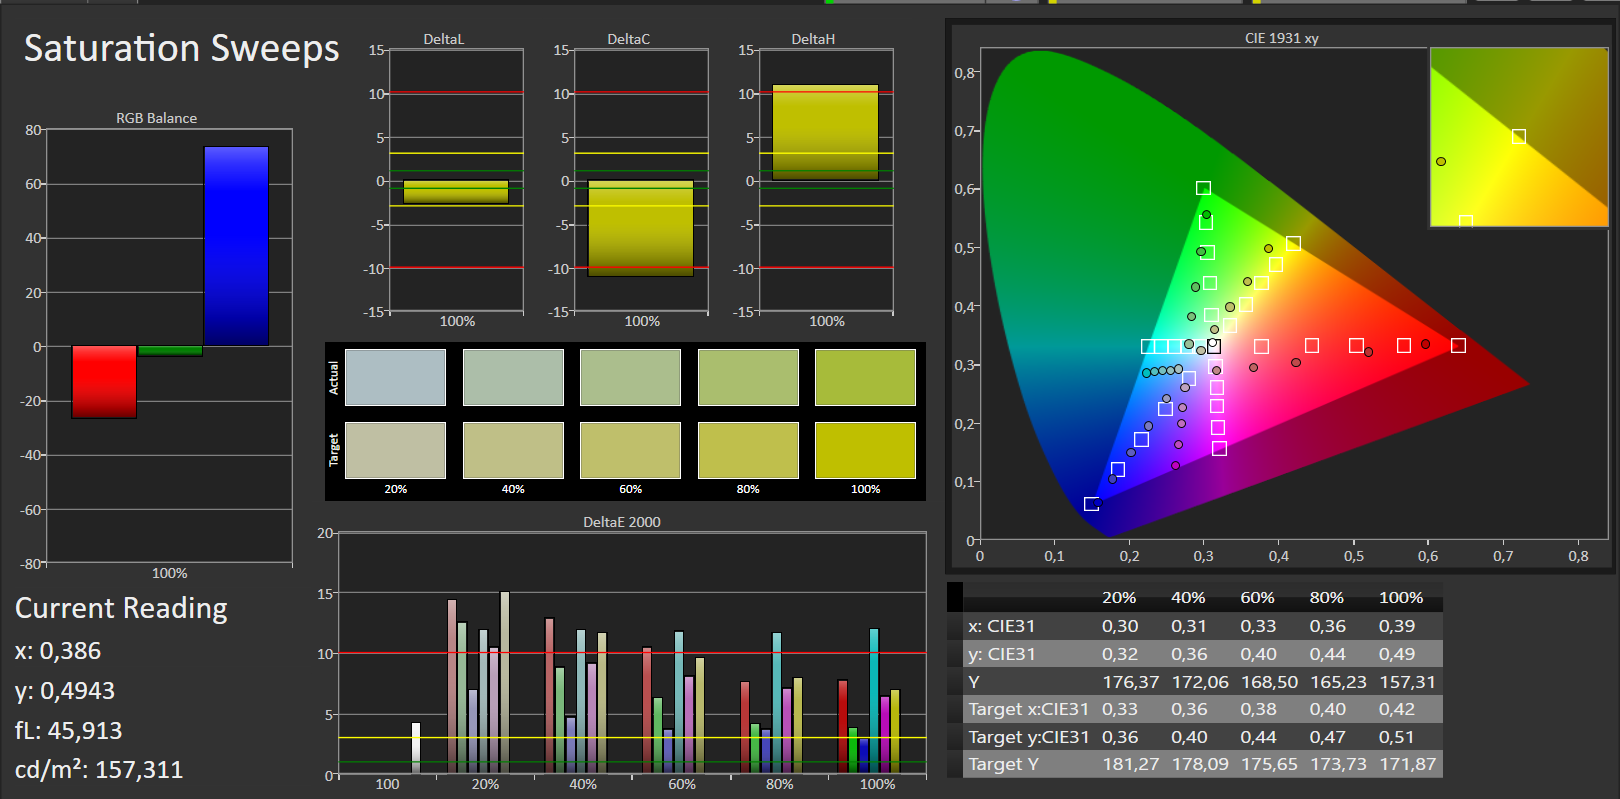
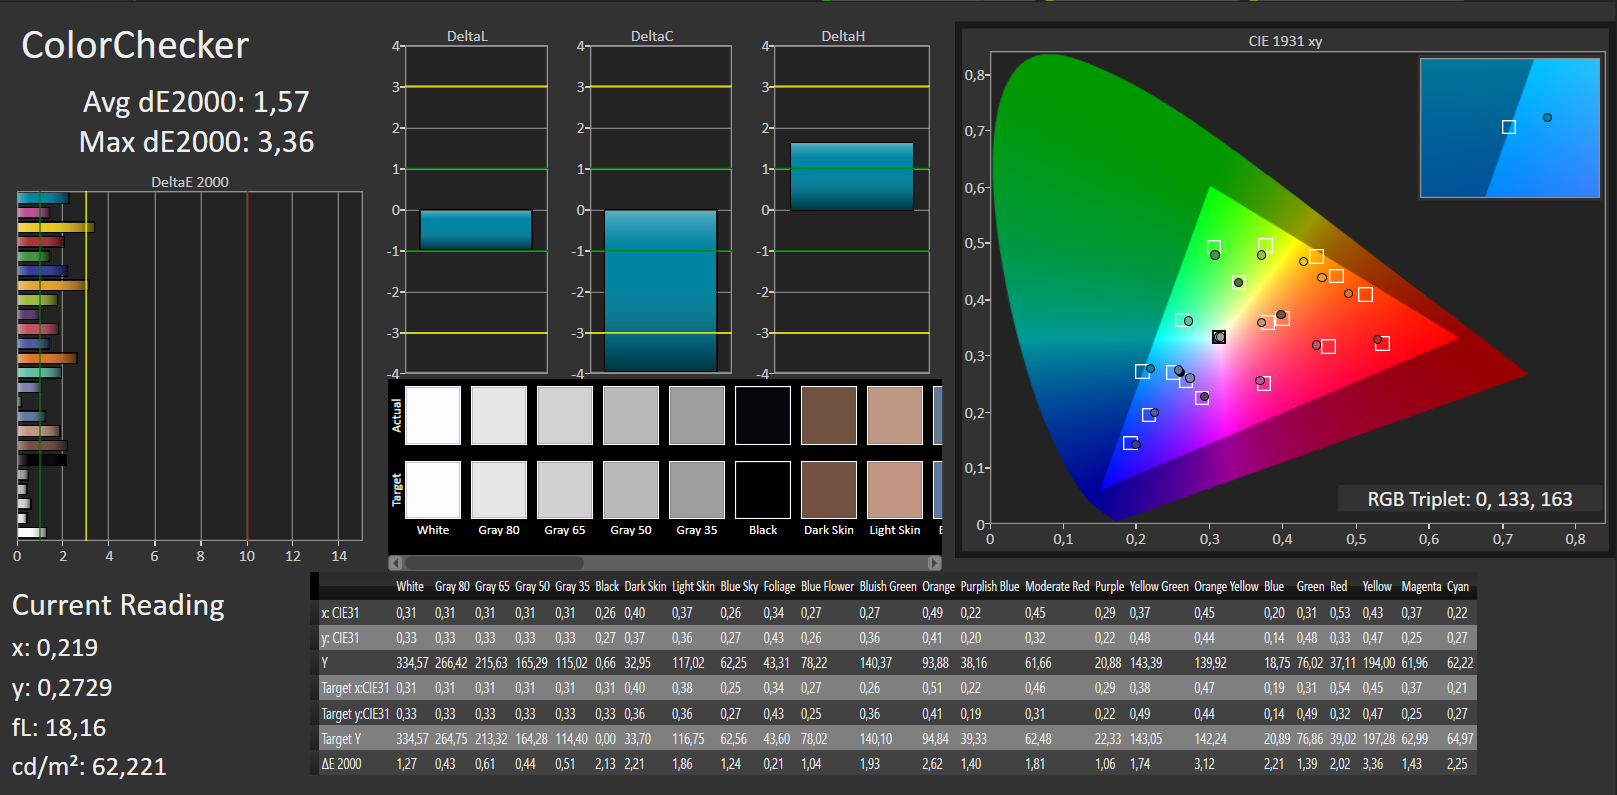
ΔE ColorChecker Calman: 9.06 | ∀{0.5-29.43 Ø4.71}
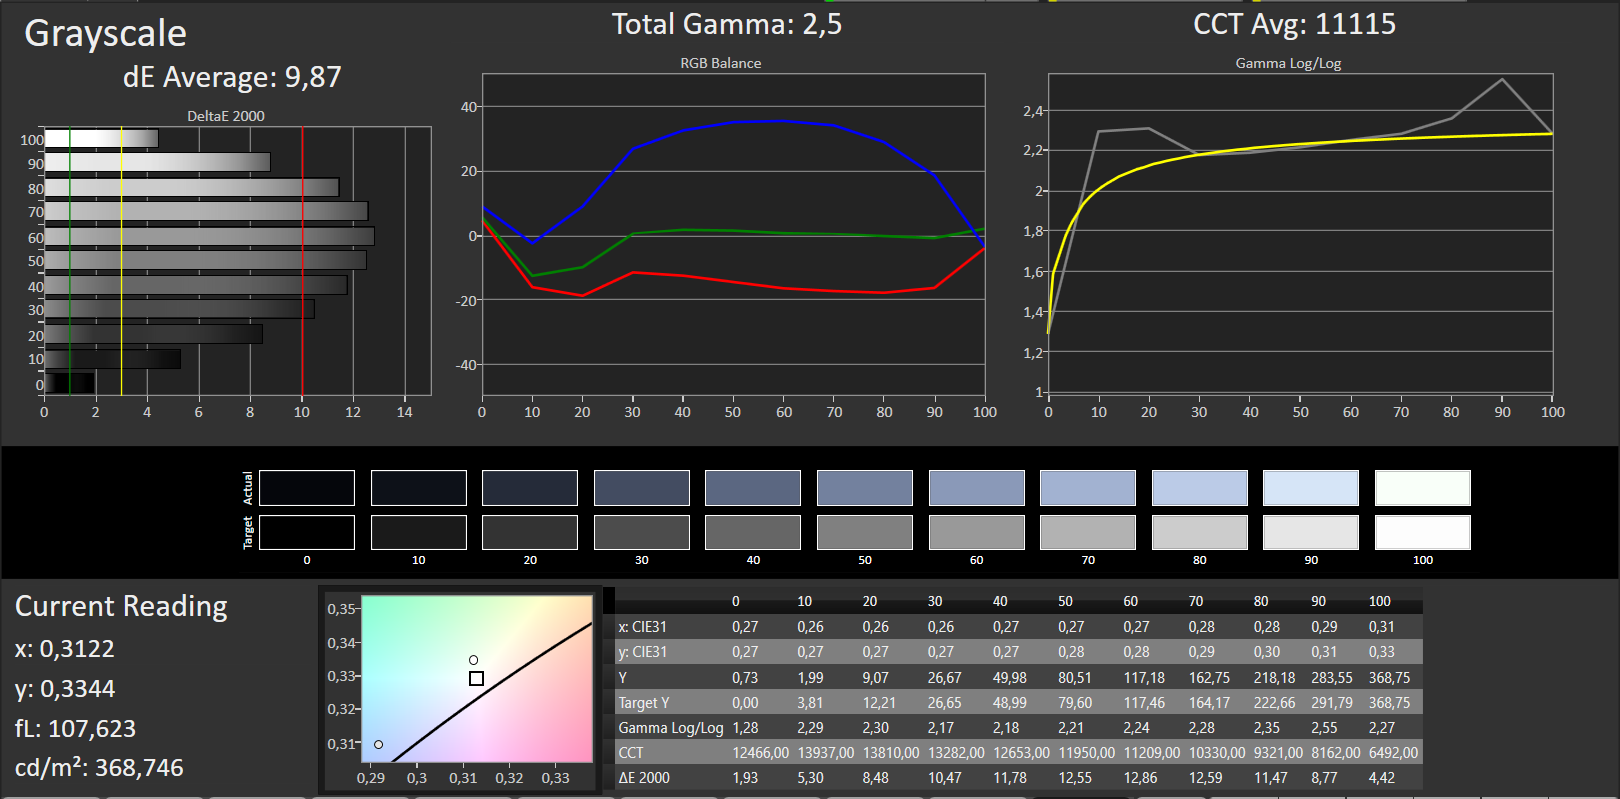
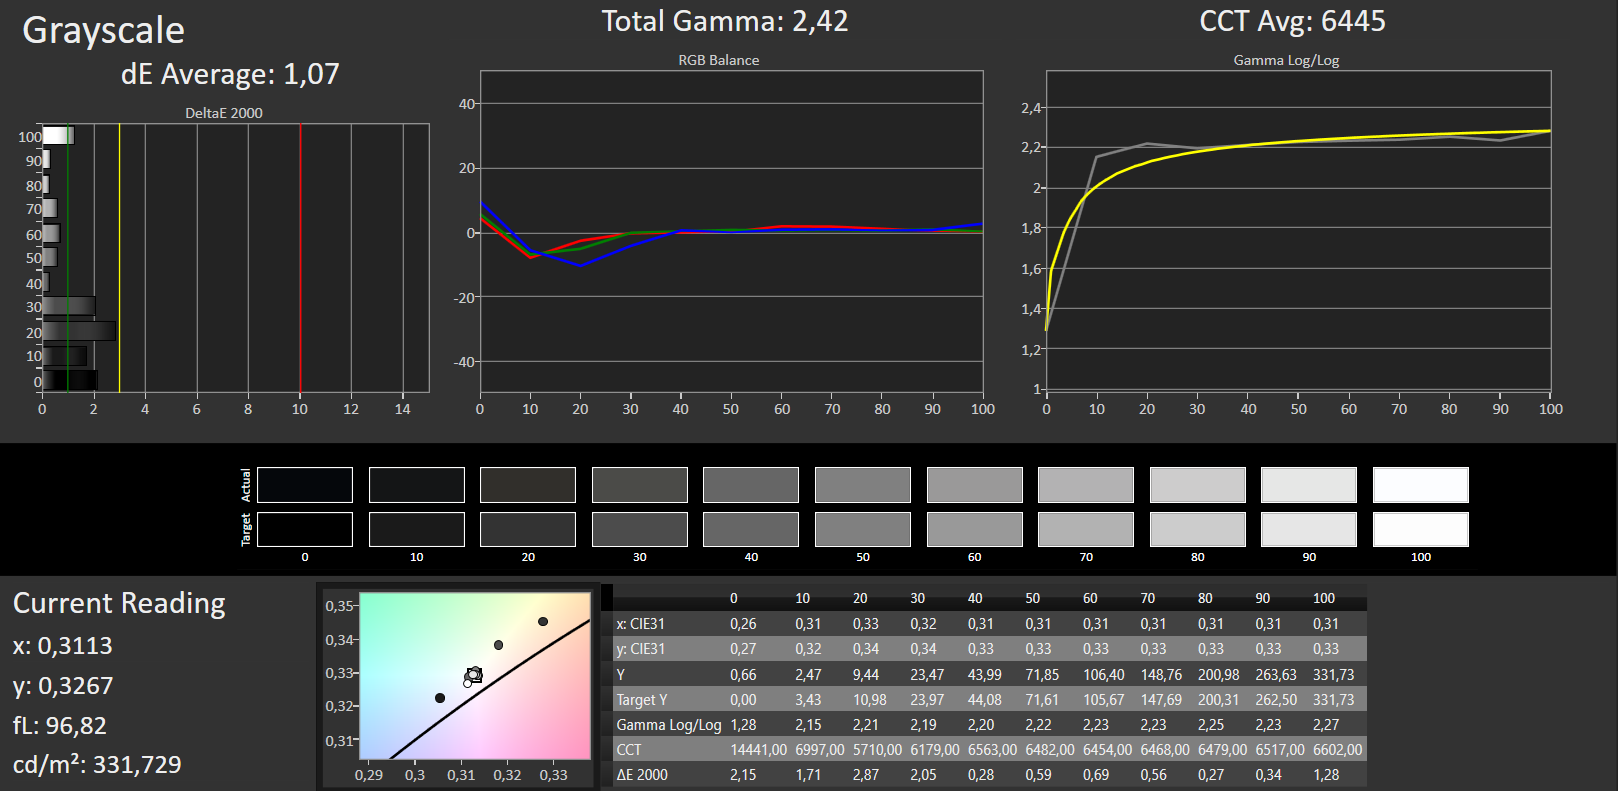
ΔE Greyscale Calman: 9.87 | ∀{0.09-98 Ø4.96}
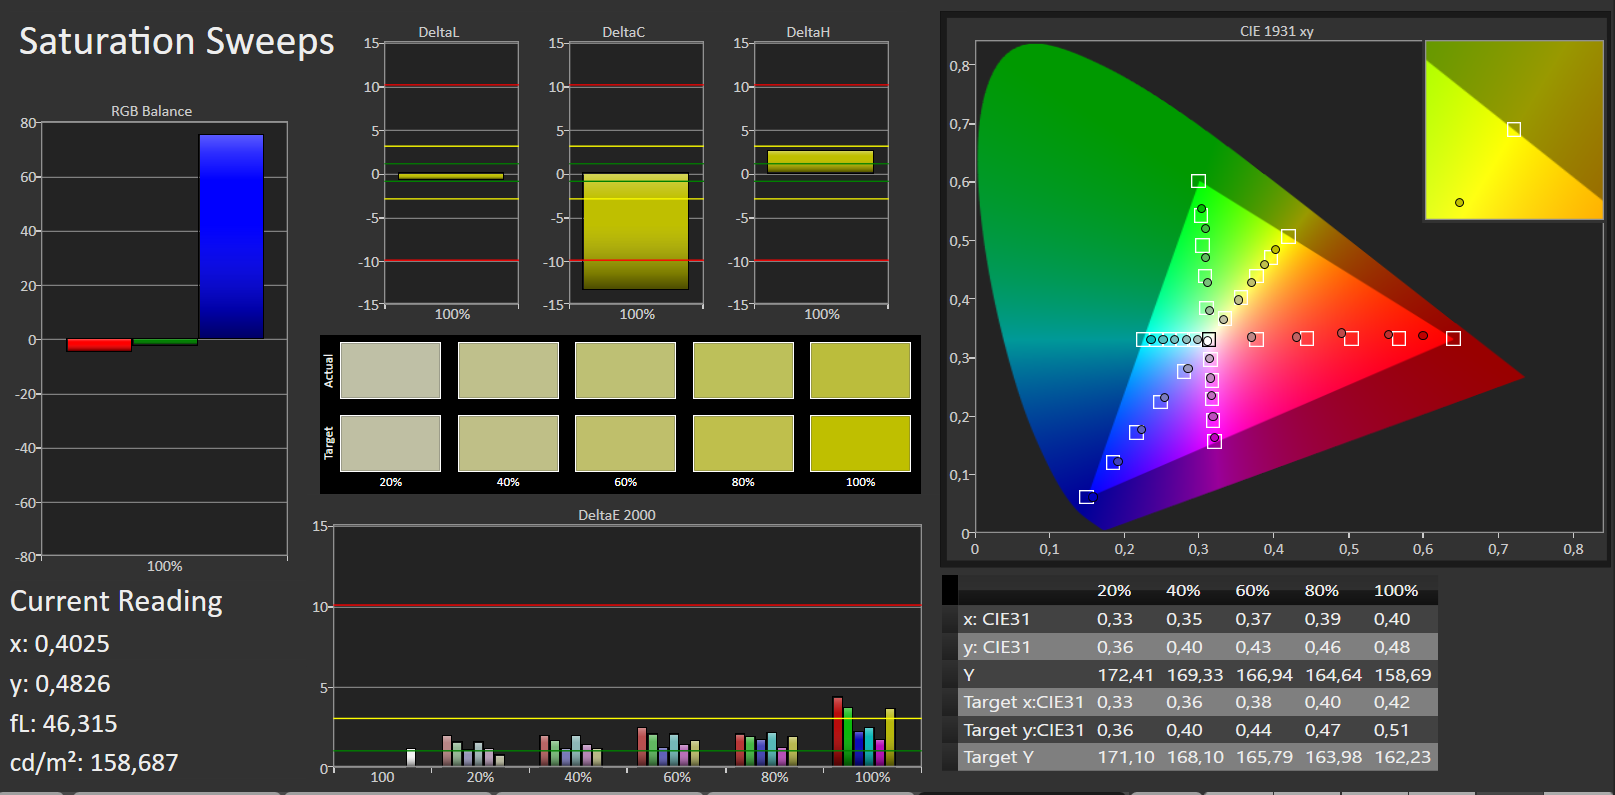
75% sRGB (Argyll 1.6.3 3D)
47% AdobeRGB 1998 (Argyll 1.6.3 3D)
51.1% AdobeRGB 1998 (Argyll 3D)
74.5% sRGB (Argyll 3D)
49.46% Display P3 (Argyll 3D)
Gamma: 2.5
CCT: 11115 K
| HP ProBook 640 G3 Z2W33ET TN LED, 1920x1080, 14" | HP ProBook 640 G2-T9X60ET TN-Panel, 1920x1080, 14" | Dell Latitude 14 E5470 AH-IPS, WLED, 1920x1080, 14" | Dell Latitude 14 E5470 TN, 1366x768, 14" | Lenovo ThinkPad L460-20FVS01400 IPS, 1920x1080, 14" | Acer TravelMate P648-M-757N IPS, 1920x1080, 14" | |
|---|---|---|---|---|---|---|
| Display | 0% | 22% | -19% | -15% | -28% | |
| Display P3 Coverage (%) | 49.46 | 49.54 0% | 64.8 31% | 40.06 -19% | 42.2 -15% | 35.53 -28% |
| sRGB Coverage (%) | 74.5 | 74.6 0% | 84.8 14% | 60.3 -19% | 62.3 -16% | 53.3 -28% |
| AdobeRGB 1998 Coverage (%) | 51.1 | 51.2 0% | 62 21% | 41.42 -19% | 43.72 -14% | 36.72 -28% |
| Response Times | 8% | 9% | -18% | -4% | 5% | |
| Response Time Grey 50% / Grey 80% * (ms) | 41 ? | 43.2 ? -5% | 39 ? 5% | 56.8 ? -39% | 44.4 ? -8% | 44 ? -7% |
| Response Time Black / White * (ms) | 30 ? | 24 ? 20% | 26 ? 13% | 28.8 ? 4% | 29.6 ? 1% | 25 ? 17% |
| PWM Frequency (Hz) | 192 ? | 200 ? | ||||
| Screen | 1% | 21% | -19% | 11% | 28% | |
| Brightness middle (cd/m²) | 343 | 315 -8% | 323 -6% | 229 -33% | 245 -29% | 254 -26% |
| Brightness (cd/m²) | 332 | 304 -8% | 316 -5% | 207 -38% | 225 -32% | 243 -27% |
| Brightness Distribution (%) | 88 | 93 6% | 79 -10% | 80 -9% | 83 -6% | 90 2% |
| Black Level * (cd/m²) | 0.69 | 0.61 12% | 0.57 17% | 0.69 -0% | 0.24 65% | 0.19 72% |
| Contrast (:1) | 497 | 516 4% | 567 14% | 332 -33% | 1021 105% | 1337 169% |
| Colorchecker dE 2000 * | 9.06 | 8.8 3% | 3.68 59% | 10.16 -12% | 6.89 24% | 4.93 46% |
| Colorchecker dE 2000 max. * | 14.84 | 15.03 -1% | 8.33 44% | 17.18 -16% | 17.62 -19% | 10.14 32% |
| Greyscale dE 2000 * | 9.87 | 9.44 4% | 2.99 70% | 10.87 -10% | 6.45 35% | 2.71 73% |
| Gamma | 2.5 88% | 2.53 87% | 2.49 88% | 2.41 91% | 2.46 89% | 2.36 93% |
| CCT | 11115 58% | 11794 55% | 6572 99% | 12881 50% | 6857 95% | 6914 94% |
| Color Space (Percent of AdobeRGB 1998) (%) | 47 | 47.37 1% | 55 17% | 38.4 -18% | 40.1 -15% | 34 -28% |
| Color Space (Percent of sRGB) (%) | 75 | 74.78 0% | 85 13% | 60.4 -19% | 61.8 -18% | 53 -29% |
| Média Total (Programa/Configurações) | 3% /
2% | 17% /
20% | -19% /
-19% | -3% /
4% | 2% /
14% |
* ... menor é melhor
Cintilação da tela / PWM (modulação por largura de pulso)
| Tela tremeluzindo/PWM detectado | 192 Hz | ≤ 90 % configuração de brilho | 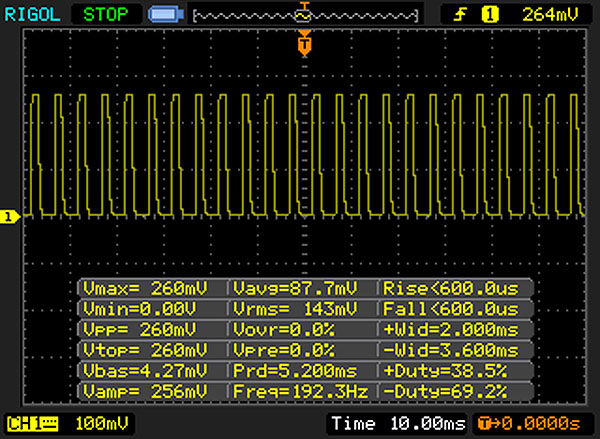 |
A luz de fundo da tela pisca em 192 Hz (pior caso, por exemplo, utilizando PWM) Cintilação detectada em uma configuração de brilho de 90 % e abaixo. Não deve haver cintilação ou PWM acima desta configuração de brilho. A frequência de 192 Hz é relativamente baixa, portanto, usuários sensíveis provavelmente notarão cintilação e sentirão fadiga ocular na configuração de brilho indicada e abaixo. [pwm_comparison] Em comparação: 52 % de todos os dispositivos testados não usam PWM para escurecer a tela. Se PWM foi detectado, uma média de 7754 (mínimo: 5 - máximo: 343500) Hz foi medida. | |||
Exibir tempos de resposta
| ↔ Tempo de resposta preto para branco | ||
|---|---|---|
| 30 ms ... ascensão ↗ e queda ↘ combinadas | ↗ 13 ms ascensão | 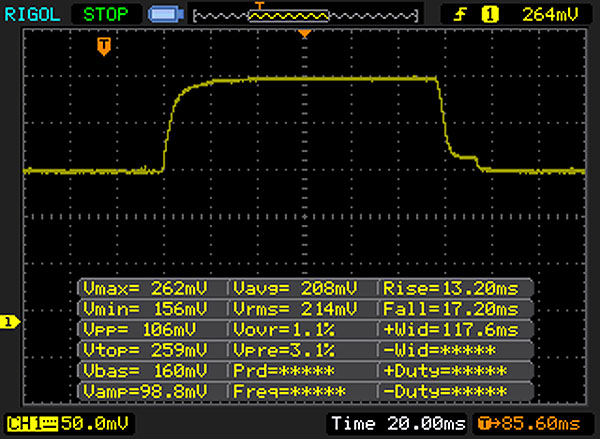 |
| ↘ 17 ms queda | ||
| A tela mostra taxas de resposta lentas em nossos testes e será insatisfatória para os jogadores. Em comparação, todos os dispositivos testados variam de 0.1 (mínimo) a 240 (máximo) ms. » 80 % de todos os dispositivos são melhores. Isso significa que o tempo de resposta medido é pior que a média de todos os dispositivos testados (19.8 ms). | ||
| ↔ Tempo de resposta 50% cinza a 80% cinza | ||
| 41 ms ... ascensão ↗ e queda ↘ combinadas | ↗ 19 ms ascensão | 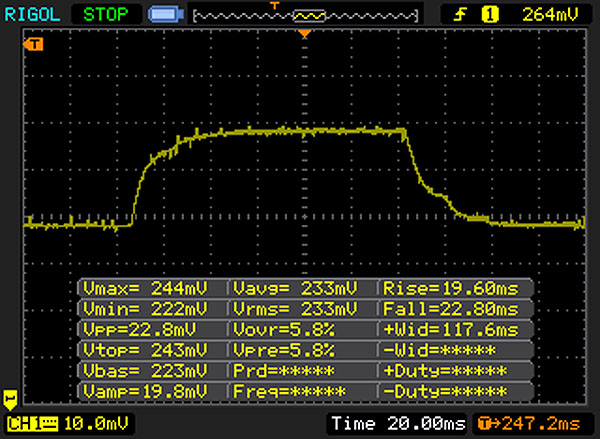 |
| ↘ 22 ms queda | ||
| A tela mostra taxas de resposta lentas em nossos testes e será insatisfatória para os jogadores. Em comparação, todos os dispositivos testados variam de 0.165 (mínimo) a 636 (máximo) ms. » 65 % de todos os dispositivos são melhores. Isso significa que o tempo de resposta medido é pior que a média de todos os dispositivos testados (31 ms). | ||

| Geekbench 3 | |
| 32 Bit Single-Core Score | |
| Acer TravelMate P648-M-757N | |
| HP ProBook 640 G3 Z2W33ET | |
| Lenovo ThinkPad L460-20FVS01400 | |
| 32 Bit Multi-Core Score | |
| Acer TravelMate P648-M-757N | |
| HP ProBook 640 G3 Z2W33ET | |
| Lenovo ThinkPad L460-20FVS01400 | |
| Geekbench 4.0 | |
| 64 Bit Single-Core Score | |
| HP ProBook 640 G3 Z2W33ET | |
| 64 Bit Multi-Core Score | |
| HP ProBook 640 G3 Z2W33ET | |
| JetStream 1.1 - 1.1 Total | |
| HP ProBook 640 G3 Z2W33ET | |
| Dell Latitude 14 E5470 | |
| Lenovo ThinkPad L460-20FVS01400 | |
| HP ProBook 640 G2-T9X60ET | |
| Acer TravelMate P648-M-757N | |
| PCMark 7 Score | 5067 pontos | |
| PCMark 8 Home Score Accelerated v2 | 3414 pontos | |
| PCMark 8 Creative Score Accelerated v2 | 4274 pontos | |
| PCMark 8 Work Score Accelerated v2 | 4545 pontos | |
Ajuda | ||

| HP ProBook 640 G3 Z2W33ET Samsung PM951 NVMe MZVLV256 | HP ProBook 640 G2-T9X60ET Samsung SSD PM871 MZNLN256HCHP | Dell Latitude 14 E5470 Micron SSD 1100 (MTFDDAV256TBN) | Dell Latitude 14 E5470 Liteon L8H-256V2G | Lenovo ThinkPad L460-20FVS01400 Toshiba HG6 THNSFJ256GCSU | Acer TravelMate P648-M-757N Lite-On CV1-8B256 | |
|---|---|---|---|---|---|---|
| CrystalDiskMark 3.0 | -22% | -34% | -26% | -31% | -25% | |
| Read Seq (MB/s) | 1285 | 492.8 -62% | 465.4 -64% | 508 -60% | 480.9 -63% | 531 -59% |
| Write Seq (MB/s) | 283.6 | 303.2 7% | 363.1 28% | 360.6 27% | 426.4 50% | 358.8 27% |
| Read 512 (MB/s) | 679 | 417.4 -39% | 338.4 -50% | 374.1 -45% | 361.8 -47% | 384.8 -43% |
| Write 512 (MB/s) | 300.8 | 301.5 0% | 246.1 -18% | 300.2 0% | 220.9 -27% | 363 21% |
| Read 4k (MB/s) | 41.79 | 33.28 -20% | 25.83 -38% | 31.98 -23% | 21.51 -49% | 31.3 -25% |
| Write 4k (MB/s) | 138.6 | 84.6 -39% | 80.3 -42% | 93.1 -33% | 71.5 -48% | 80.3 -42% |
| Read 4k QD32 (MB/s) | 507 | 394.2 -22% | 246.1 -51% | 274.7 -46% | 277.6 -45% | 239.4 -53% |
| Write 4k QD32 (MB/s) | 293.3 | 295.5 1% | 197.7 -33% | 205.6 -30% | 230.4 -21% | 225.3 -23% |
| 3DMark 06 Standard Score | 7879 pontos | |
| 3DMark 11 Performance | 1541 pontos | |
| 3DMark Ice Storm Standard Score | 52206 pontos | |
| 3DMark Cloud Gate Standard Score | 5693 pontos | |
| 3DMark Fire Strike Score | 754 pontos | |
| 3DMark Fire Strike Extreme Score | 337 pontos | |
Ajuda | ||
| 3DMark 11 - 1280x720 Performance GPU | |
| Lenovo ThinkPad L460-20FVS01400 | |
| HP ProBook 640 G3 Z2W33ET | |
| HP ProBook 640 G2-T9X60ET | |
| Dell Latitude 14 E5470 | |
| Dell Latitude 14 E5470 | |
| Acer TravelMate P648-M-757N | |
| baixo | média | alto | ultra | |
|---|---|---|---|---|
| Tomb Raider (2013) | 65.6 | 33.4 | 19.2 | 9.7 |
| BioShock Infinite (2013) | 39.9 | 24.5 | 20.2 | 7.1 |
| Battlefield 4 (2013) | 30.7 | 24.5 | 15.9 | 5.3 |
Barulho
| Ocioso |
| 30.7 / 30.7 / 31.5 dB |
| DVD |
| 35.7 / dB |
| Carga |
| 31.4 / 31.1 dB |
 | ||
30 dB silencioso 40 dB(A) audível 50 dB(A) ruidosamente alto |
||
min: | ||
| HP ProBook 640 G3 Z2W33ET i5-7200U, HD Graphics 620 | HP ProBook 640 G2-T9X60ET 6200U, HD Graphics 520 | Dell Latitude 14 E5470 6440HQ, HD Graphics 530 | Dell Latitude 14 E5470 6300U, HD Graphics 520 | Lenovo ThinkPad L460-20FVS01400 6500U, Radeon R5 M330 | Acer TravelMate P648-M-757N 6500U, HD Graphics 520 | |
|---|---|---|---|---|---|---|
| Noise | 2% | -1% | 0% | -0% | -3% | |
| desligado / ambiente * (dB) | 30.7 | 29 6% | 30.3 1% | 29.2 5% | 29.2 5% | 31.2 -2% |
| Idle Minimum * (dB) | 30.7 | 29 6% | 30.3 1% | 29.2 5% | 29.2 5% | 31.2 -2% |
| Idle Average * (dB) | 30.7 | 29.8 3% | 30.3 1% | 29.2 5% | 29.2 5% | 31.2 -2% |
| Idle Maximum * (dB) | 31.5 | 30.2 4% | 30.3 4% | 29.2 7% | 29.2 7% | 31.6 -0% |
| Load Average * (dB) | 31.4 | 30.2 4% | 31.6 -1% | 32.1 -2% | 32.5 -4% | 33.3 -6% |
| Load Maximum * (dB) | 31.1 | 33.9 -9% | 35 -13% | 36.8 -18% | 37.2 -20% | 32.4 -4% |
* ... menor é melhor
(+) A temperatura máxima no lado superior é 34 °C / 93 F, em comparação com a média de 34.3 °C / 94 F , variando de 21.2 a 62.5 °C para a classe Office.
(+) A parte inferior aquece até um máximo de 33.2 °C / 92 F, em comparação com a média de 36.8 °C / 98 F
(+) Em uso inativo, a temperatura média para o lado superior é 24.9 °C / 77 F, em comparação com a média do dispositivo de 29.5 °C / ### class_avg_f### F.
(+) Os apoios para as mãos e o touchpad são mais frios que a temperatura da pele, com um máximo de 25.6 °C / 78.1 F e, portanto, são frios ao toque.
(±) A temperatura média da área do apoio para as mãos de dispositivos semelhantes foi 27.5 °C / 81.5 F (+1.9 °C / 3.4 F).
| HP ProBook 640 G3 Z2W33ET i5-7200U, HD Graphics 620 | HP ProBook 640 G2-T9X60ET 6200U, HD Graphics 520 | Dell Latitude 14 E5470 6440HQ, HD Graphics 530 | Dell Latitude 14 E5470 6300U, HD Graphics 520 | Lenovo ThinkPad L460-20FVS01400 6500U, Radeon R5 M330 | Acer TravelMate P648-M-757N 6500U, HD Graphics 520 | |
|---|---|---|---|---|---|---|
| Heat | -21% | -25% | -17% | -20% | -15% | |
| Maximum Upper Side * (°C) | 34 | 40.7 -20% | 43 -26% | 41.5 -22% | 40.8 -20% | 38.5 -13% |
| Maximum Bottom * (°C) | 33.2 | 42.6 -28% | 43 -30% | 41.4 -25% | 51.9 -56% | 36.7 -11% |
| Idle Upper Side * (°C) | 25.6 | 29.9 -17% | 31.2 -22% | 26.9 -5% | 25.2 2% | 31.5 -23% |
| Idle Bottom * (°C) | 26 | 30.3 -17% | 31.3 -20% | 29.6 -14% | 27.6 -6% | 29.6 -14% |
* ... menor é melhor
HP ProBook 640 G3 Z2W33ET análise de áudio
(-) | alto-falantes não muito altos (###valor### dB)
Graves 100 - 315Hz
(-) | quase nenhum baixo - em média 15% menor que a mediana
(±) | a linearidade dos graves é média (7.5% delta para a frequência anterior)
Médios 400 - 2.000 Hz
(+) | médios equilibrados - apenas 4.1% longe da mediana
(+) | médios são lineares (6.1% delta para frequência anterior)
Altos 2 - 16 kHz
(±) | máximos mais altos - em média 8.8% maior que a mediana
(+) | os máximos são lineares (4.6% delta da frequência anterior)
Geral 100 - 16.000 Hz
(±) | a linearidade do som geral é média (22.2% diferença em relação à mediana)
Comparado com a mesma classe
» 58% de todos os dispositivos testados nesta classe foram melhores, 9% semelhantes, 33% piores
» O melhor teve um delta de 7%, a média foi 21%, o pior foi 53%
Comparado com todos os dispositivos testados
» 65% de todos os dispositivos testados foram melhores, 6% semelhantes, 29% piores
» O melhor teve um delta de 4%, a média foi 23%, o pior foi 134%
Apple MacBook 12 (Early 2016) 1.1 GHz análise de áudio
(+) | os alto-falantes podem tocar relativamente alto (###valor### dB)
Graves 100 - 315Hz
(±) | graves reduzidos - em média 11.3% menor que a mediana
(±) | a linearidade dos graves é média (14.2% delta para a frequência anterior)
Médios 400 - 2.000 Hz
(+) | médios equilibrados - apenas 2.4% longe da mediana
(+) | médios são lineares (5.5% delta para frequência anterior)
Altos 2 - 16 kHz
(+) | agudos equilibrados - apenas 2% longe da mediana
(+) | os máximos são lineares (4.5% delta da frequência anterior)
Geral 100 - 16.000 Hz
(+) | o som geral é linear (10.2% diferença em relação à mediana)
Comparado com a mesma classe
» 7% de todos os dispositivos testados nesta classe foram melhores, 2% semelhantes, 90% piores
» O melhor teve um delta de 5%, a média foi 18%, o pior foi 53%
Comparado com todos os dispositivos testados
» 5% de todos os dispositivos testados foram melhores, 1% semelhantes, 94% piores
» O melhor teve um delta de 4%, a média foi 23%, o pior foi 134%
| desligado | |
| Ocioso | |
| Carga |
|
Key:
min: | |
| HP ProBook 640 G3 Z2W33ET i5-7200U, HD Graphics 620 | HP ProBook 640 G2-T9X60ET 6200U, HD Graphics 520 | Dell Latitude 14 E5470 6440HQ, HD Graphics 530 | Dell Latitude 14 E5470 6300U, HD Graphics 520 | Lenovo ThinkPad L460-20FVS01400 6500U, Radeon R5 M330 | Acer TravelMate P648-M-757N 6500U, HD Graphics 520 | |
|---|---|---|---|---|---|---|
| Power Consumption | -22% | -66% | -17% | -41% | -68% | |
| Idle Minimum * (Watt) | 2.3 | 3.3 -43% | 4.1 -78% | 3.5 -52% | 3.1 -35% | 5.3 -130% |
| Idle Average * (Watt) | 5.2 | 6 -15% | 8.1 -56% | 5.3 -2% | 6.3 -21% | 9.3 -79% |
| Idle Maximum * (Watt) | 5.6 | 6.9 -23% | 11.4 -104% | 6 -7% | 7.9 -41% | 11.5 -105% |
| Load Average * (Watt) | 27.2 | 27.7 -2% | 33.5 -23% | 26.3 3% | 29.5 -8% | 30.8 -13% |
| Load Maximum * (Watt) | 28.7 | 36.6 -28% | 49 -71% | 36.6 -28% | 57.3 -100% | 32 -11% |
* ... menor é melhor
| HP ProBook 640 G3 Z2W33ET i5-7200U, HD Graphics 620, 46 Wh | HP ProBook 640 G2-T9X60ET 6200U, HD Graphics 520, 46 Wh | Dell Latitude 14 E5470 6440HQ, HD Graphics 530, 62 Wh | Dell Latitude 14 E5470 6300U, HD Graphics 520, 62 Wh | Lenovo ThinkPad L460-20FVS01400 6500U, Radeon R5 M330, 48 Wh | Acer TravelMate P648-M-757N 6500U, HD Graphics 520, 54 Wh | |
|---|---|---|---|---|---|---|
| Duração da bateria | -9% | -32% | 9% | -26% | -14% | |
| Reader / Idle (h) | 24.6 | 16.6 -33% | 15.2 -38% | 21.7 -12% | 19.2 -22% | 18.1 -26% |
| H.264 (h) | 8.7 | 6.9 -21% | 10.8 24% | 7.2 -17% | 9.1 5% | |
| WiFi v1.3 (h) | 8.7 | 9.6 10% | 7.2 -17% | 11.1 28% | 7.1 -18% | 9.1 5% |
| Load (h) | 3 | 2.9 -3% | 1.4 -53% | 2.9 -3% | 1.6 -47% | 1.8 -40% |
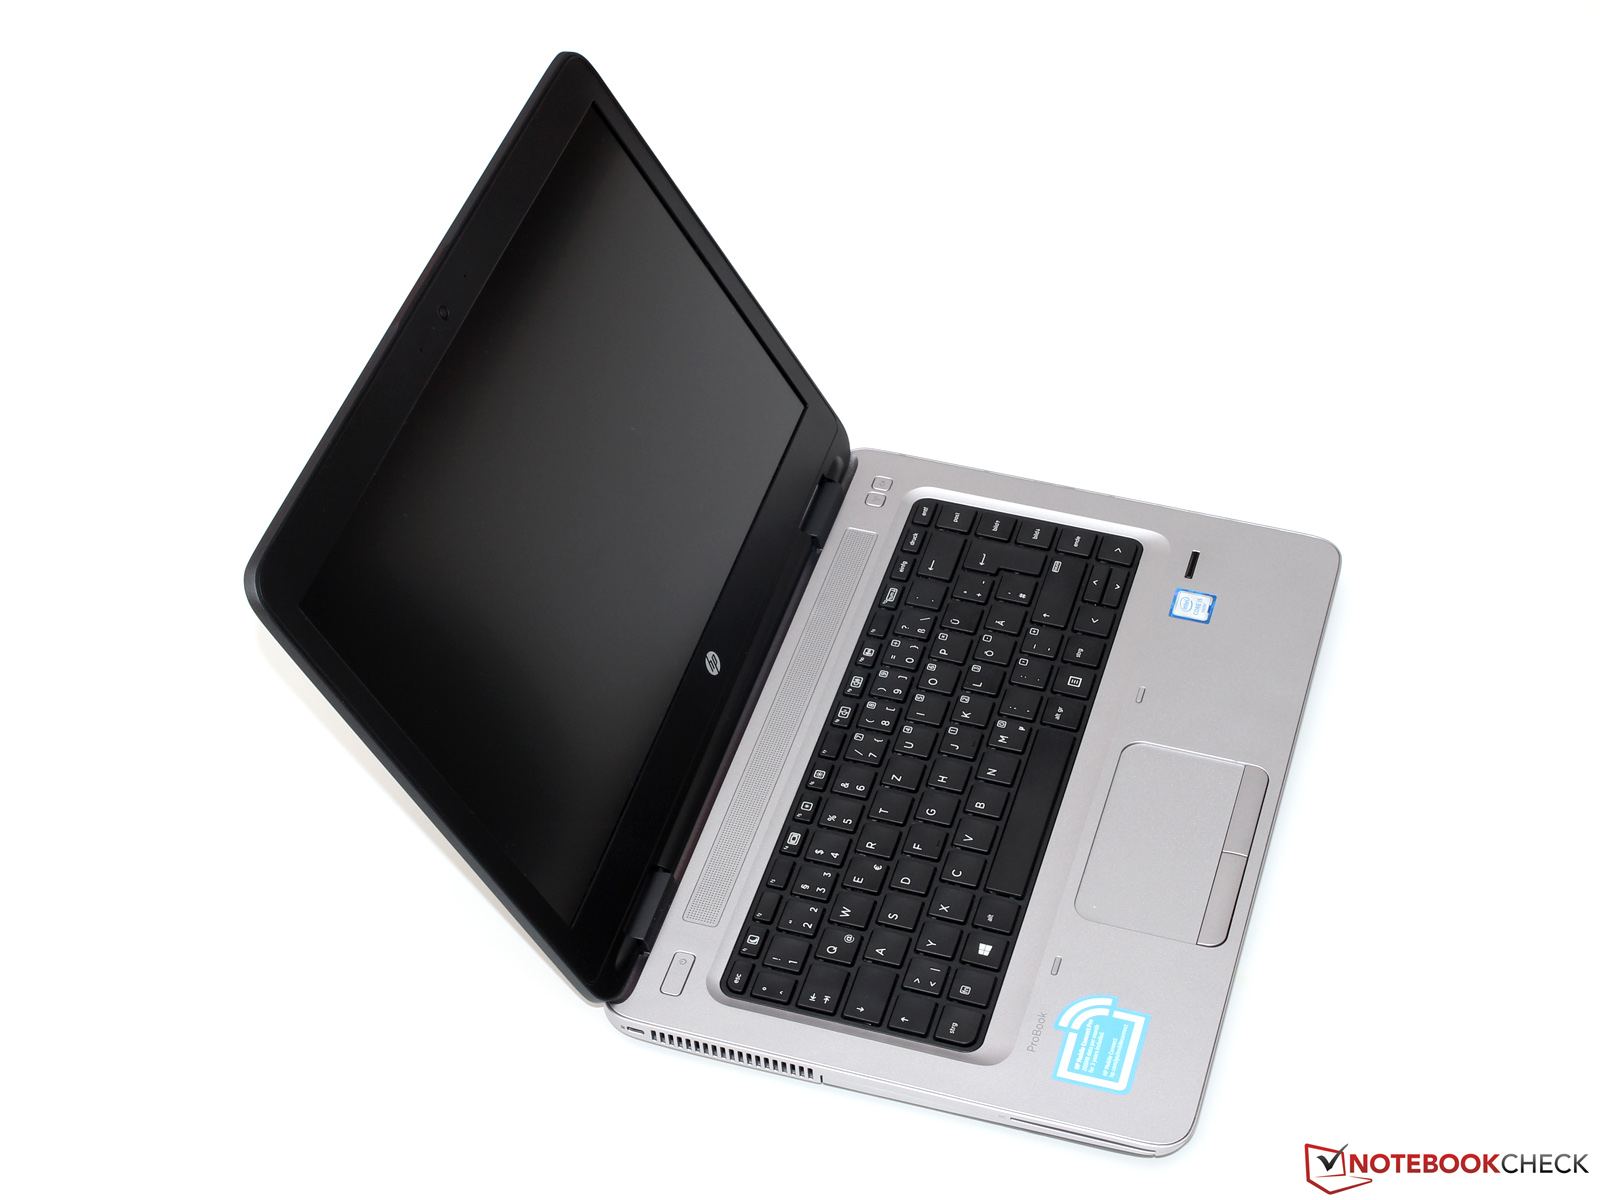
Graças ao processador Kaby Lake, o ProBook oferece alto desempenho nos aplicativos. No entanto, a vantagem sobre o seu predecessor Skylake é pouca. O portátil funcionou silenciosamente durante quase todo o uso intenso e não esquenta muito - qualidades muito positivas para um aparelho de trabalho. O SSD NVMe integrado garante um sistema fluente e breves tempos de espera. Seria possível substituir o SSD removendo a placa inferior do portátil, o qual pode ser feito rapidamente.
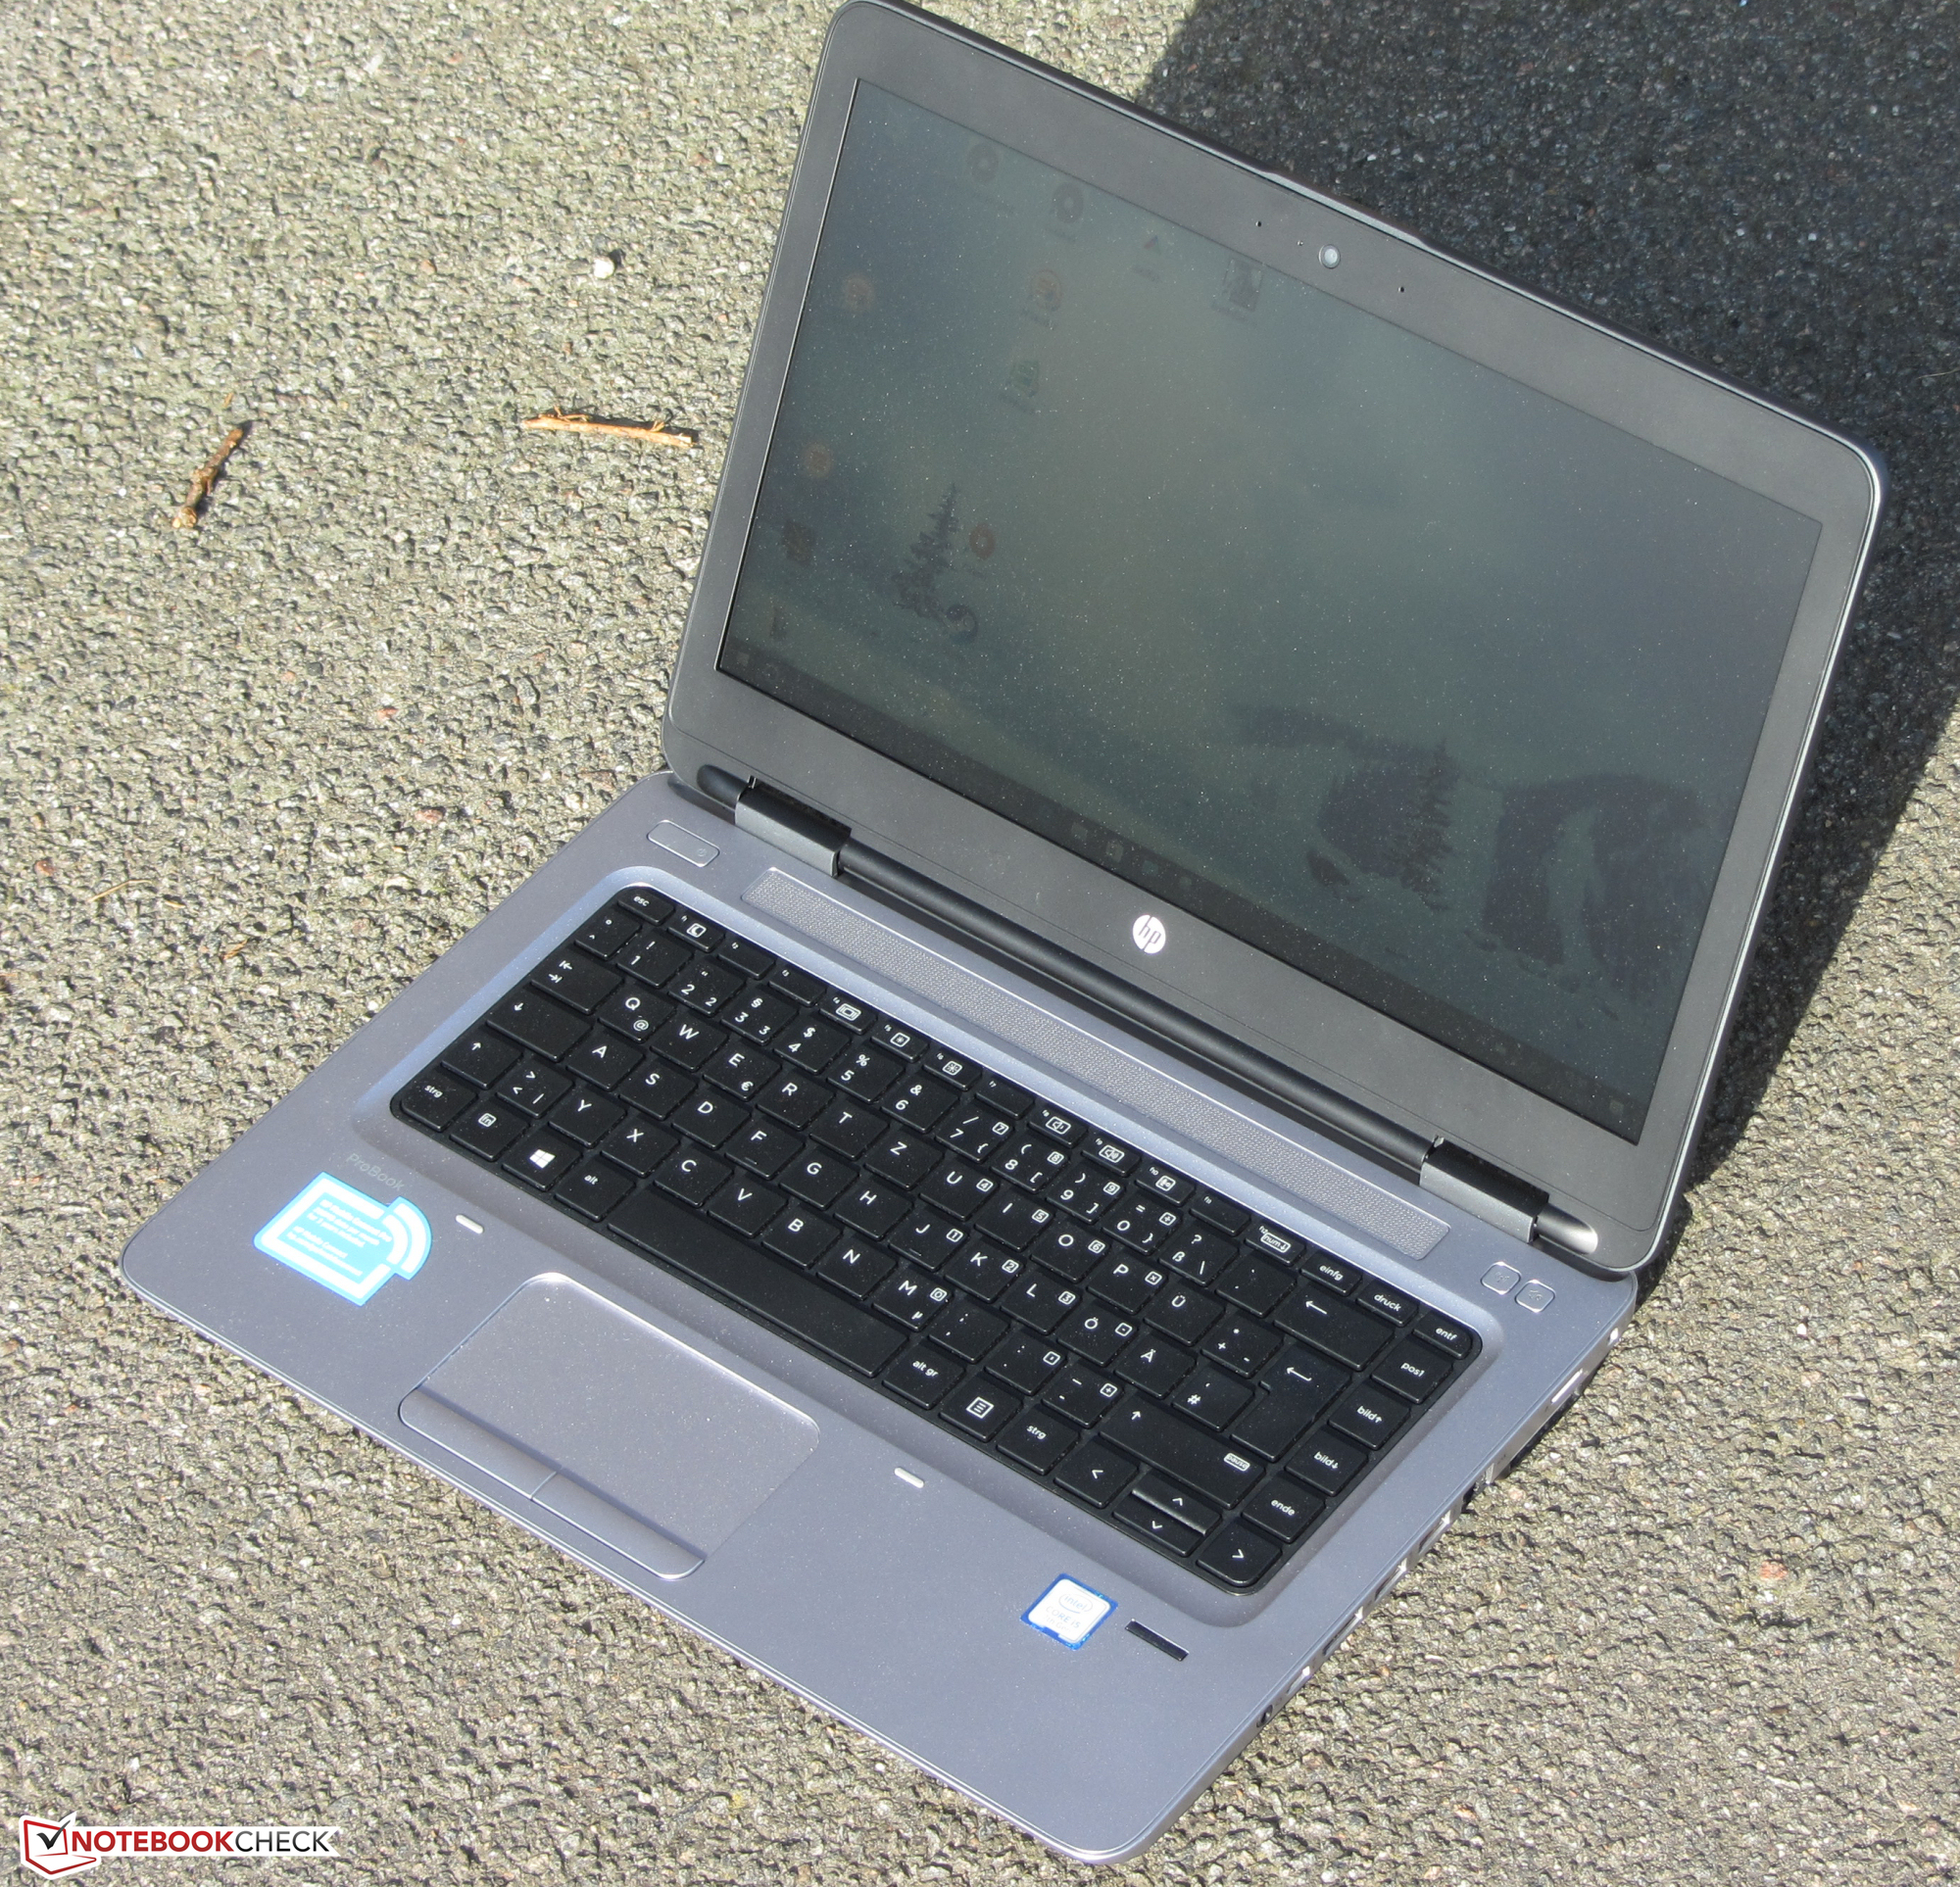
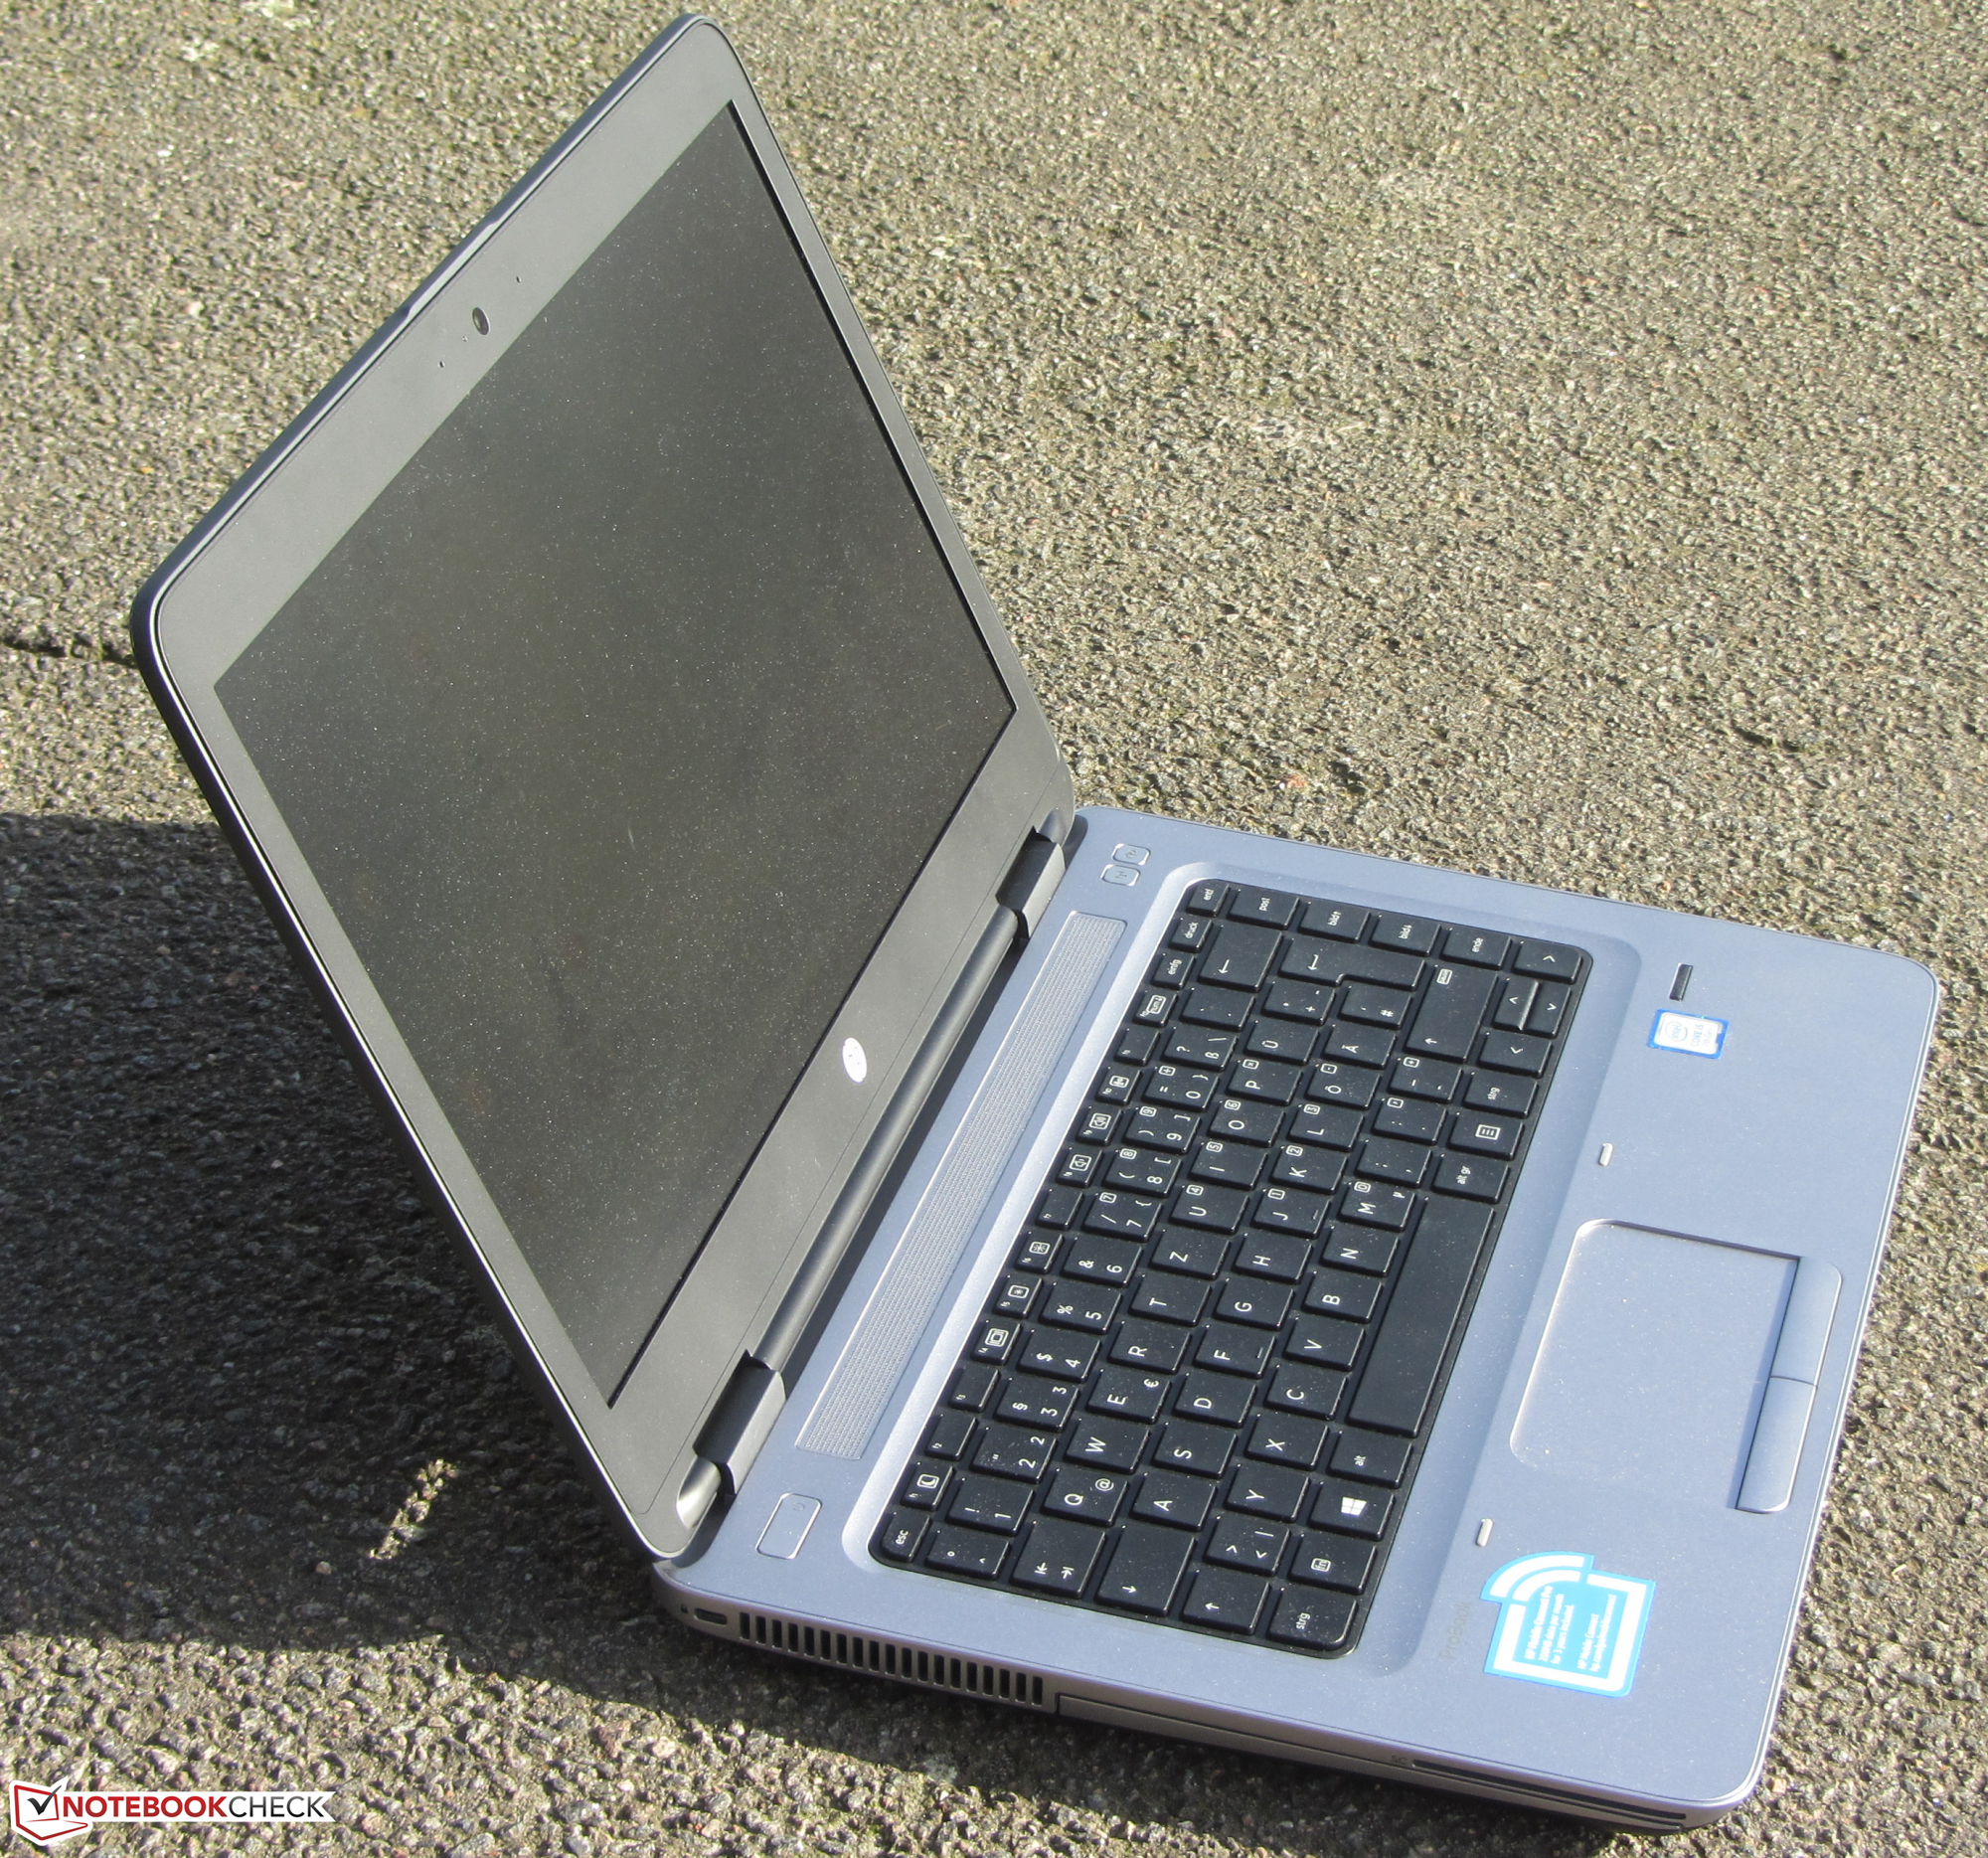
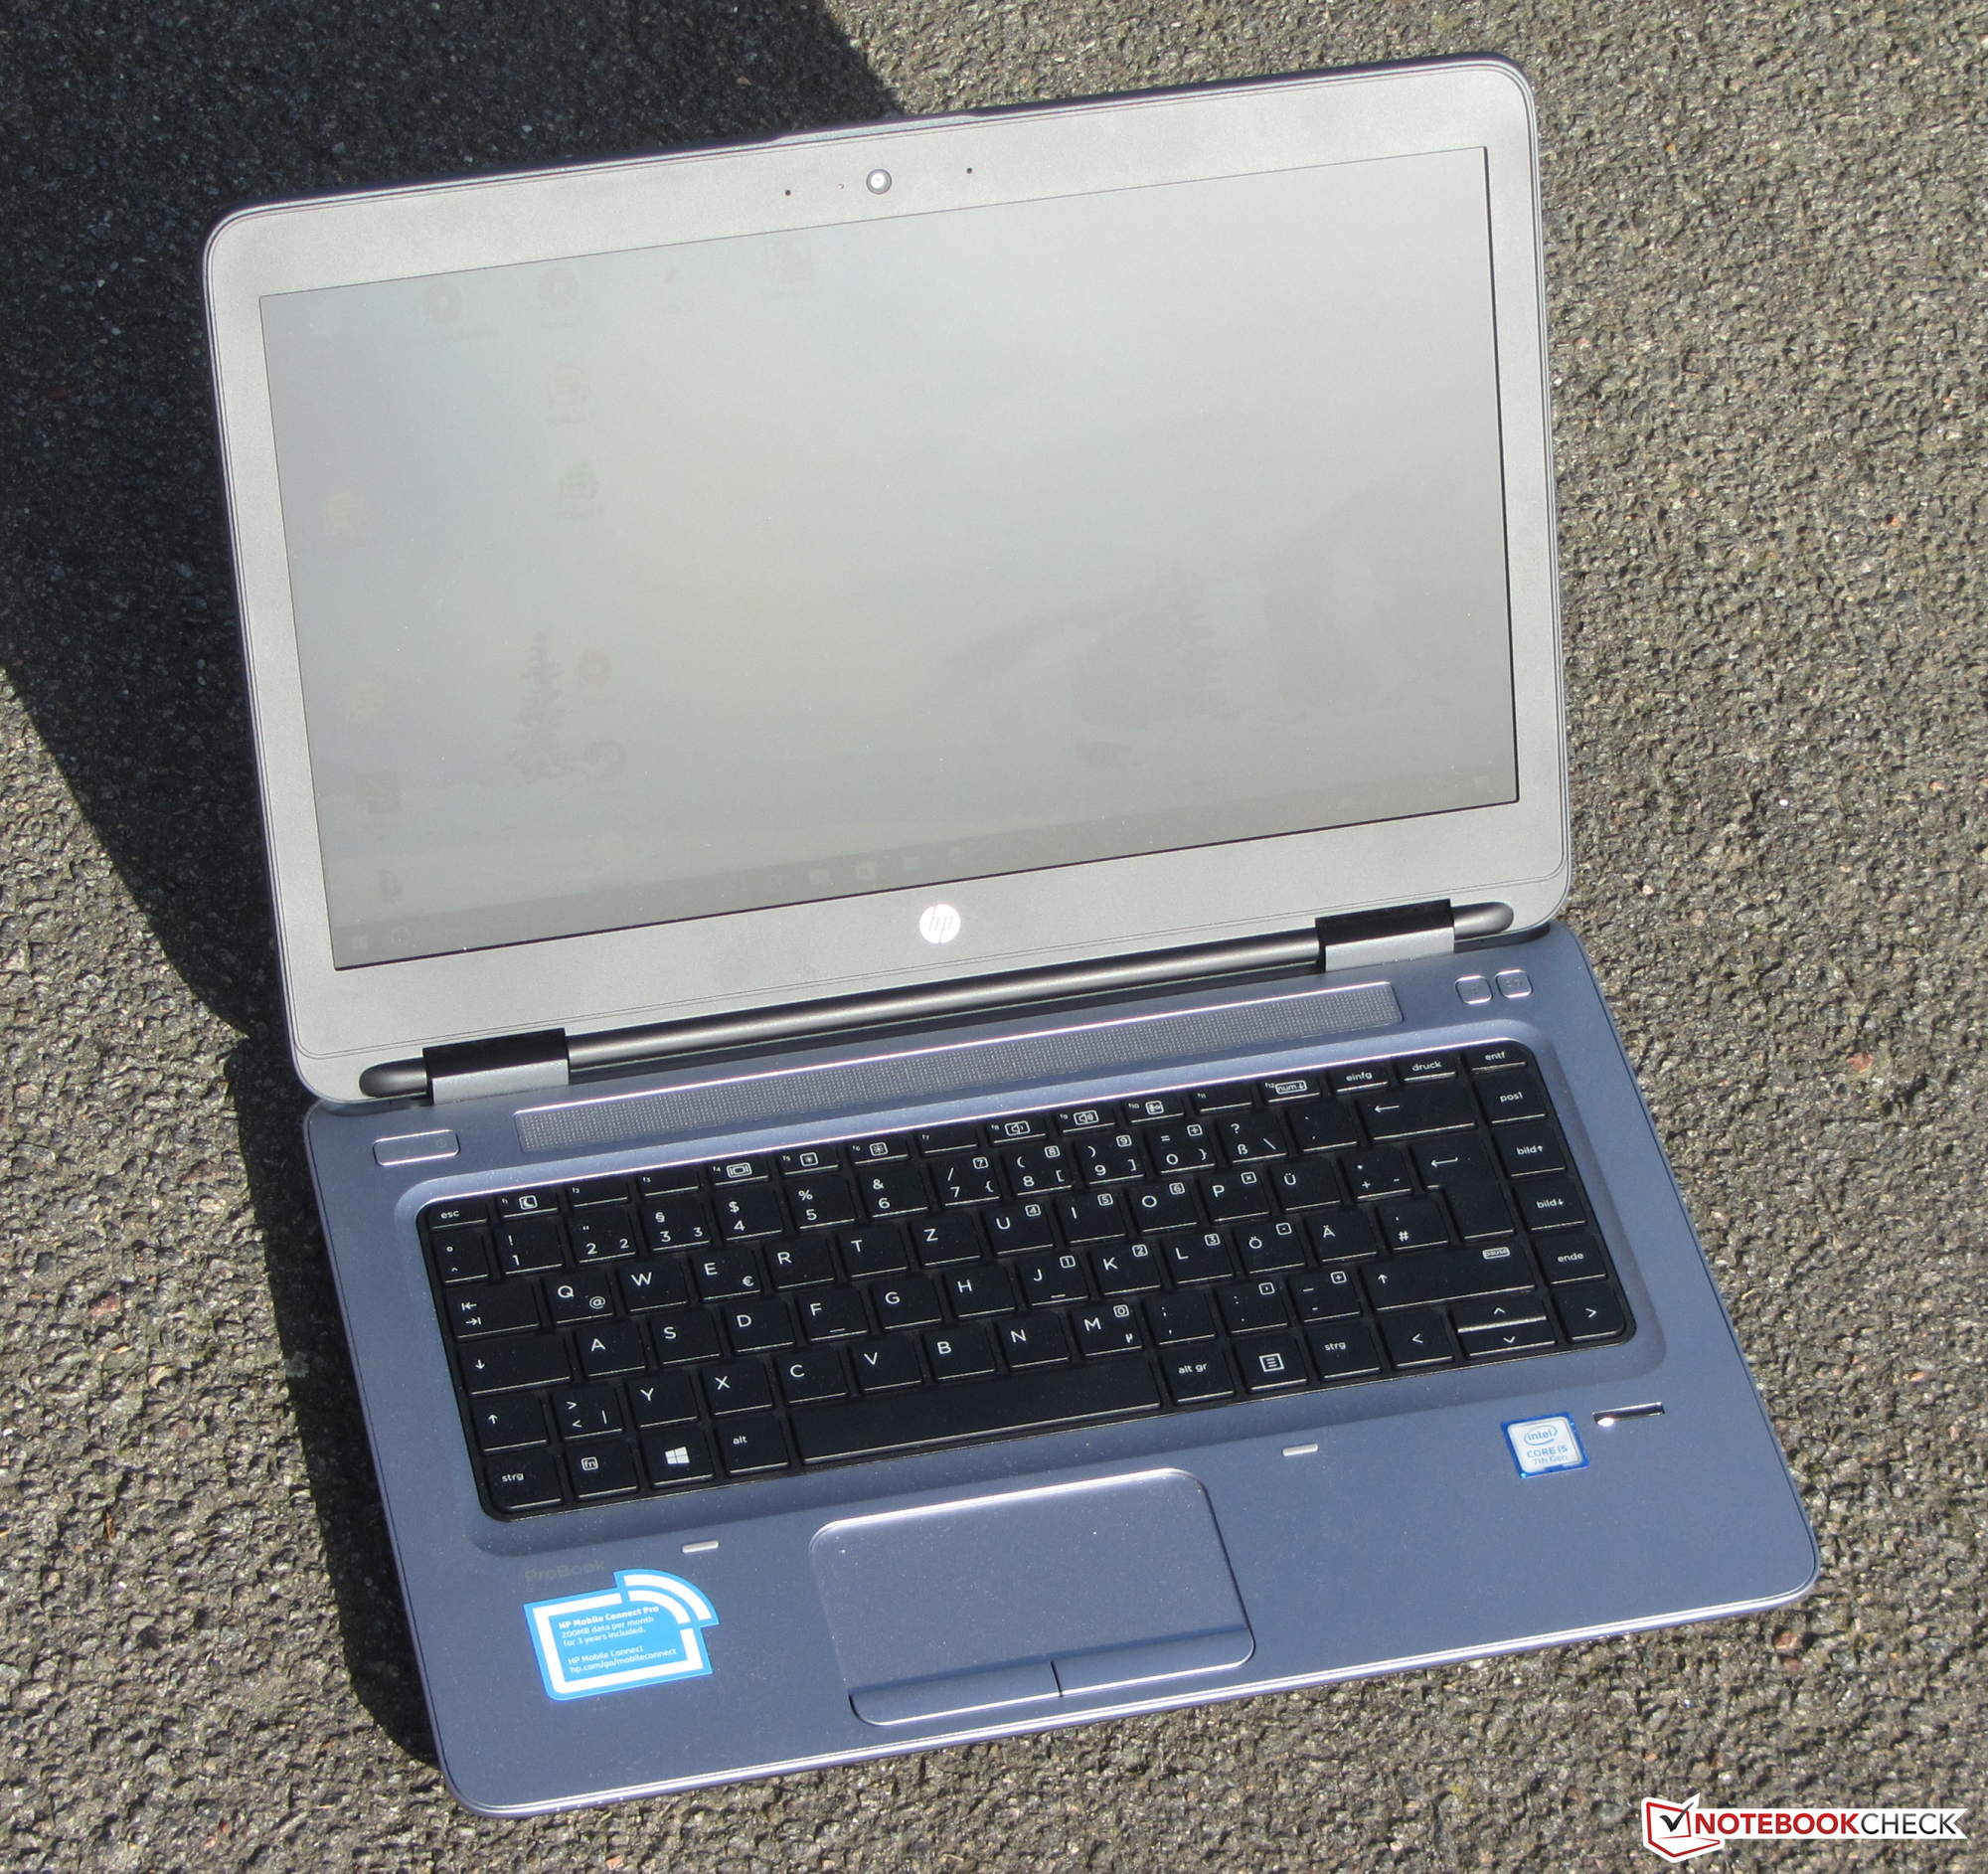
A carcaça e os dispositivos de entrada não apresentam modificações; a HP utiliza os do predecessor. Nada contra isso, dado que ambos os componentes deixaram uma boa impressão. A duração da bateria é muito boa, bem como foi o caso do predecessor, por isso deveria bastar para um dia de trabalho. Um modem LTE/HSPA+ permite que você acesse a internet ou uma rede via comunicações móveis.
A HP faz muitas coisas bem com este portátil, porém, ainda recebe algumas críticas.
Nossa crítica se relaciona, mais uma vez, com a tela: Possui ângulos de visão estreitos e baixo contraste. Isto não é aceitável. A faixa de preços de mais de 1.000 Euros demanda a integração de uma tela excelente. Outro ponto de crítica é o teclado, que esperávamos que seja iluminado nesta faixa de preços. E por último, mas não menos importante: A HP somente outorga uma garantia de um ano.
Pro
Contra
Thanks to the Kaby Lake processor, the ProBook offers high application performance. However, the advantage over its Skylake predecessor is slim. The laptop runs noiselessly or at least quietly over the entire load range and has low heat development - very positive qualities for a work device. The built-in NVMe SSD ensures a swiftly running system and short loading times. Replacing the SSD would be possible by removing the bottom shell of the notebook, which is quickly accomplished.
The case and input devices show no modifications; HP brings them over from the predecessor. Nothing speaks against this, since both components left a good impression. The battery life is very good, as was the case with the predecessor, so it should suffice for a workday. An LTE/HSPA+ modem enables you to access the internet or a company network via mobile communications.
HP does many things right with this notebook, yet still manages to collect criticism.
Our criticism relates once again to the display: It has narrow viewing angles and low contrast. This is not acceptable. The price range above 1,000 Euros demands the integration of an excellent display. Another point of critique is the keyboard that we expect to be backlit in this price range. And last but not least: HP only includes a one-year warranty.
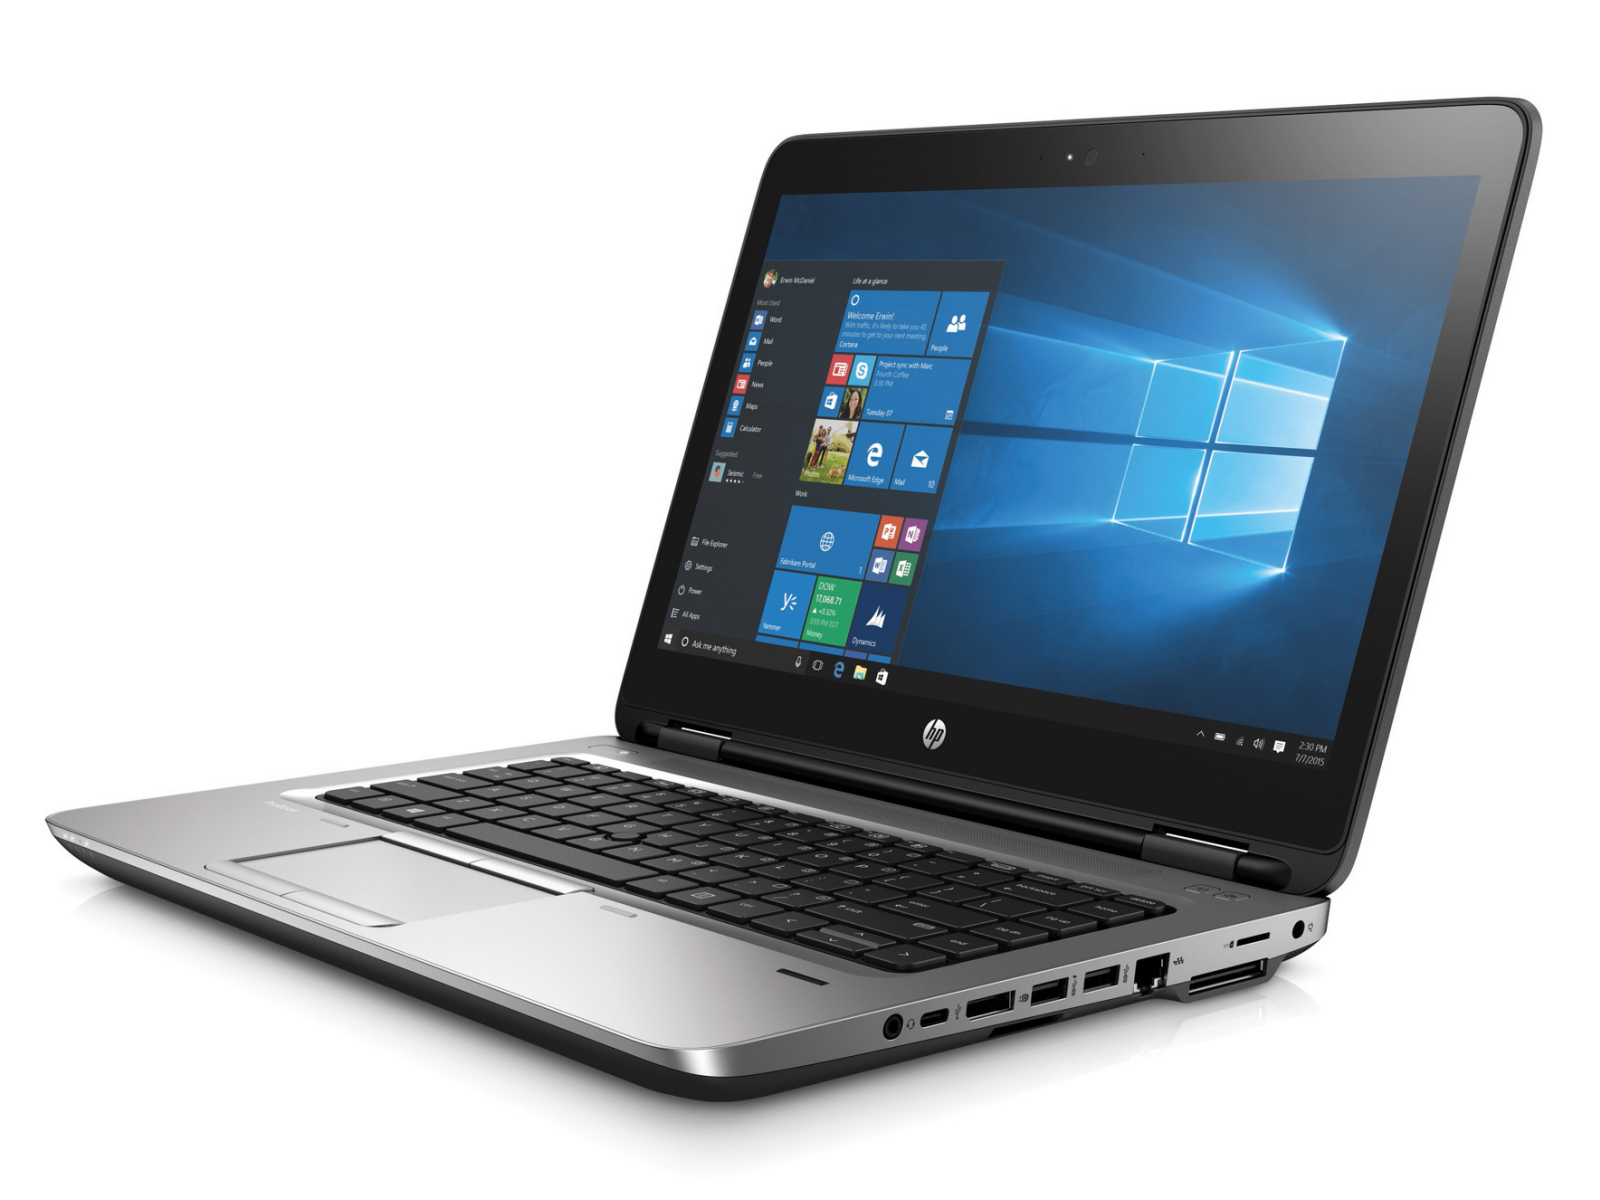
HP ProBook 640 G3 Z2W33ET
- 02/27/2017 v6 (old)
Sascha Mölck