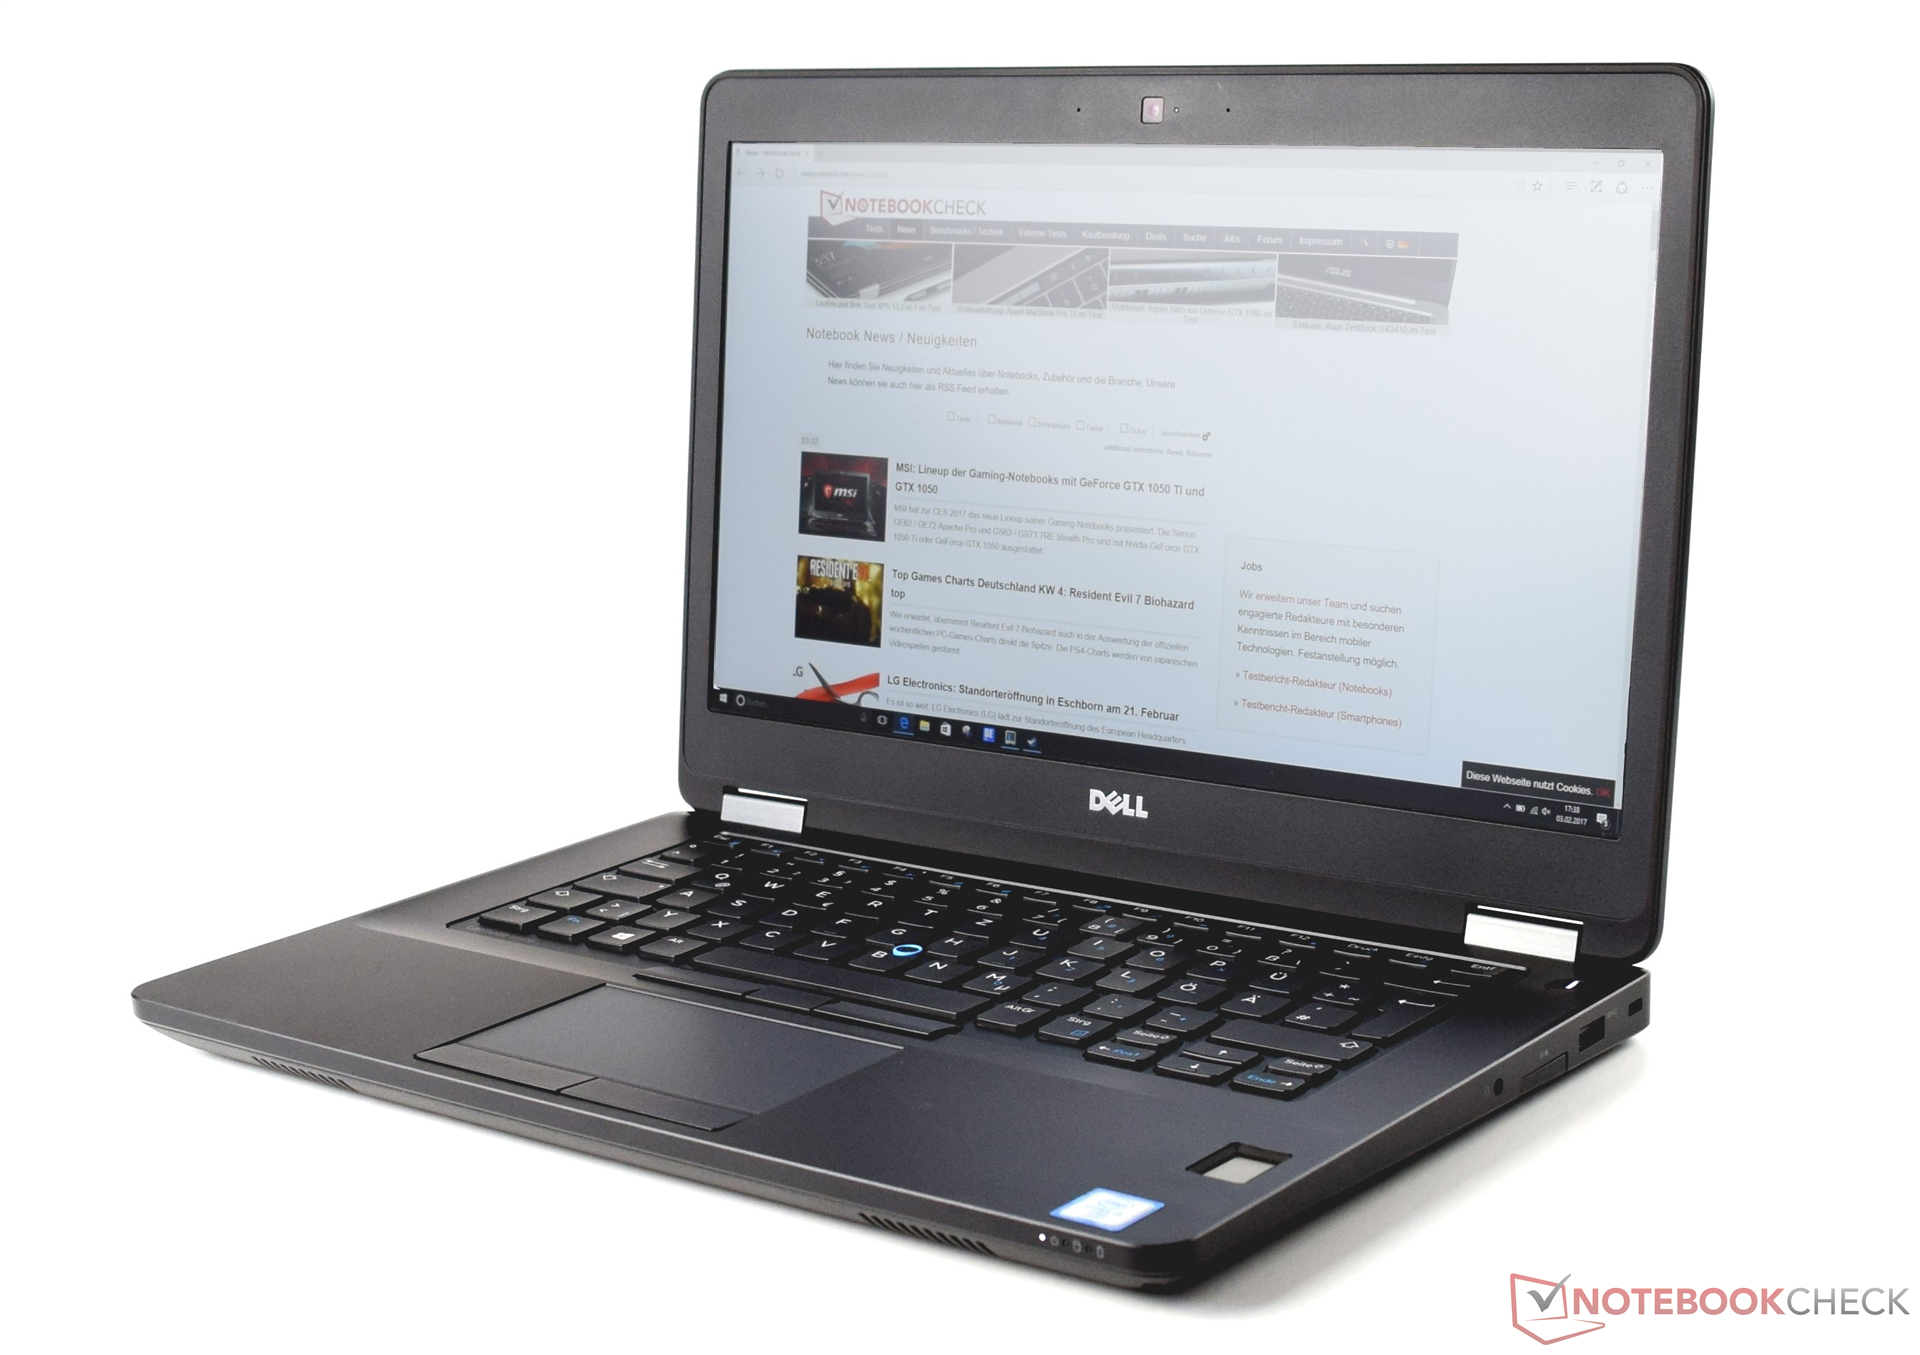
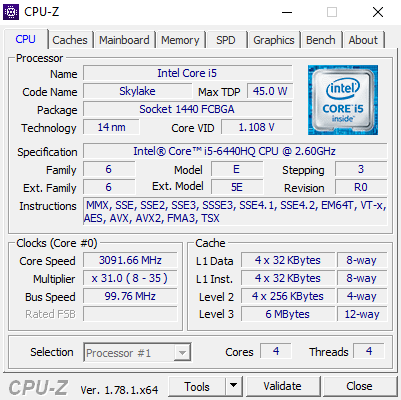
Breve Análise do Portátil Dell Latitude 14 E5470 6440HQ
| SD Card Reader | |
| average JPG Copy Test (av. of 3 runs) | |
| Dell Latitude 14 E5470 | |
| Dell Latitude 14 E5470 | |
| HP ProBook 440 G4-Y8B51EA | |
| Acer TravelMate P648-M-757N | |
| Lenovo ThinkPad T460-20FN003LGE | |
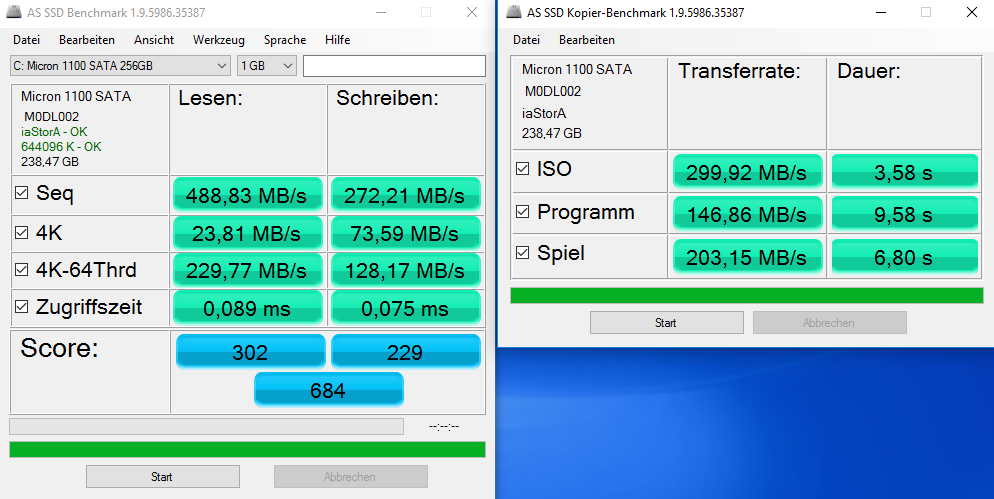
| maximum AS SSD Seq Read Test (1GB) | |
| Dell Latitude 14 E5470 | |
| Dell Latitude 14 E5470 | |
| Lenovo ThinkPad T460-20FN003LGE | |
| HP ProBook 440 G4-Y8B51EA | |
| Networking | |
| iperf3 transmit AX12 | |
| Lenovo IdeaPad 710S Plus-13IKB | |
| Dell Vostro 15-5568 | |
| Dell Latitude 14 E5470 (jseb) | |
| HP Pavilion 14-al103ng | |
| iperf3 receive AX12 | |
| Dell Latitude 14 E5470 (jseb) | |
| Lenovo IdeaPad 710S Plus-13IKB | |
| Dell Vostro 15-5568 | |
| HP Pavilion 14-al103ng | |
| |||||||||||||||||||||||||
iluminação: 79 %
iluminação com acumulador: 323 cd/m²
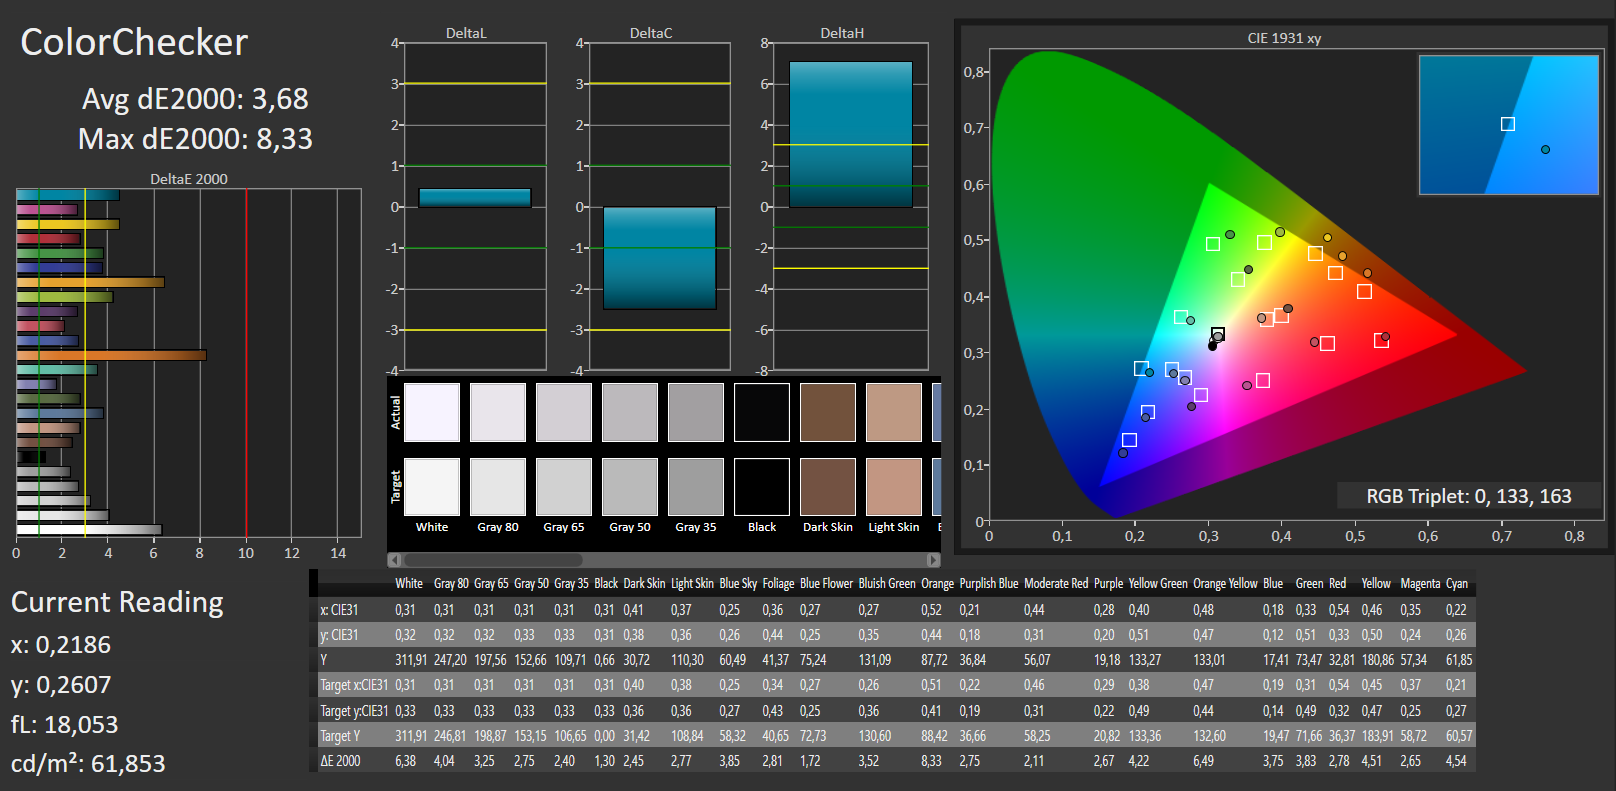
Contraste: 567:1 (Preto: 0.57 cd/m²)
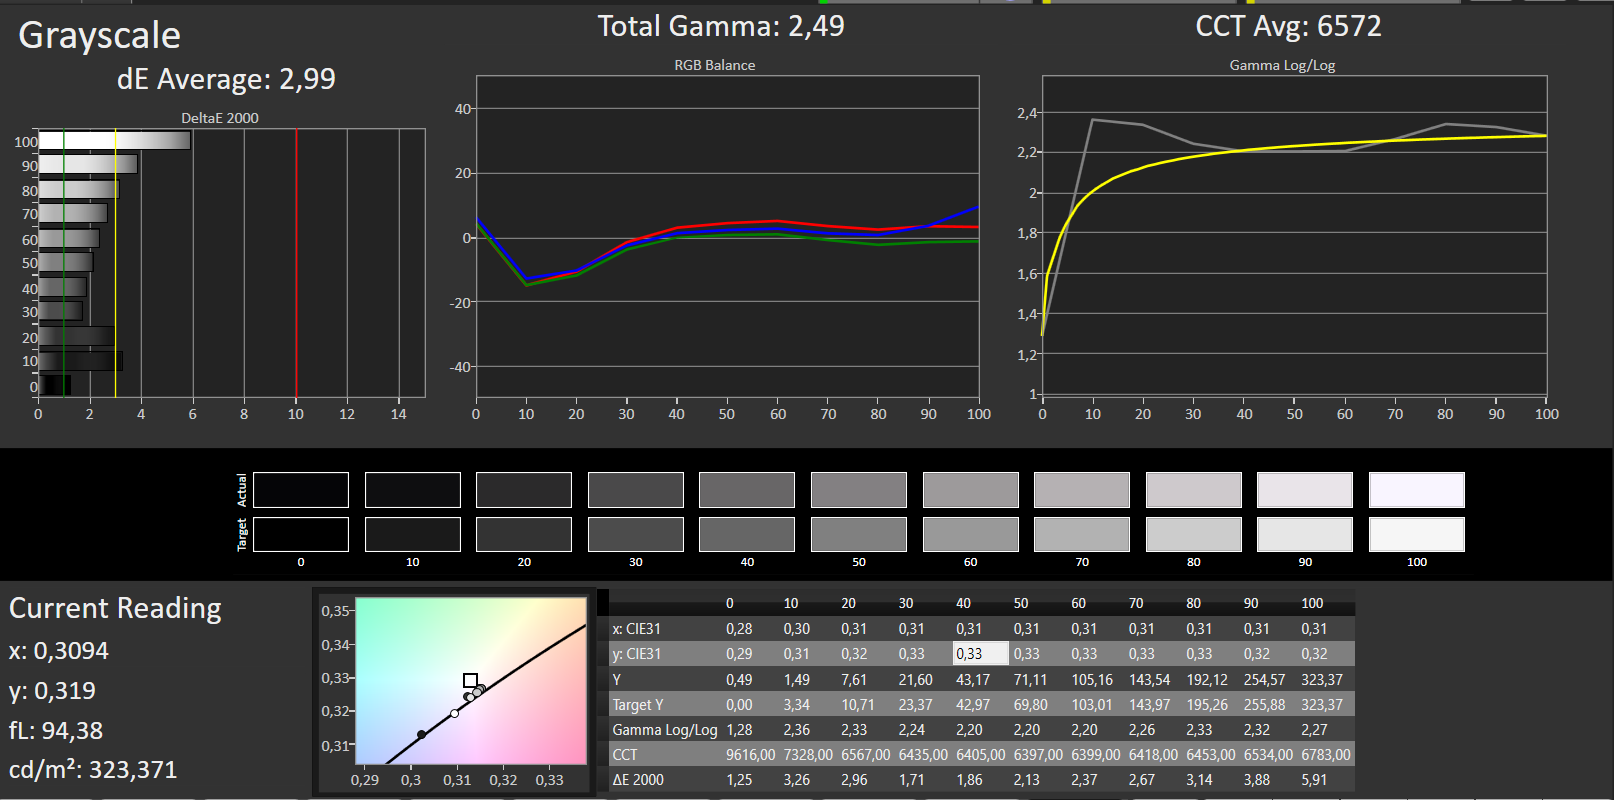
ΔE ColorChecker Calman: 3.68 | ∀{0.5-29.43 Ø4.72}
ΔE Greyscale Calman: 2.99 | ∀{0.09-98 Ø4.97}
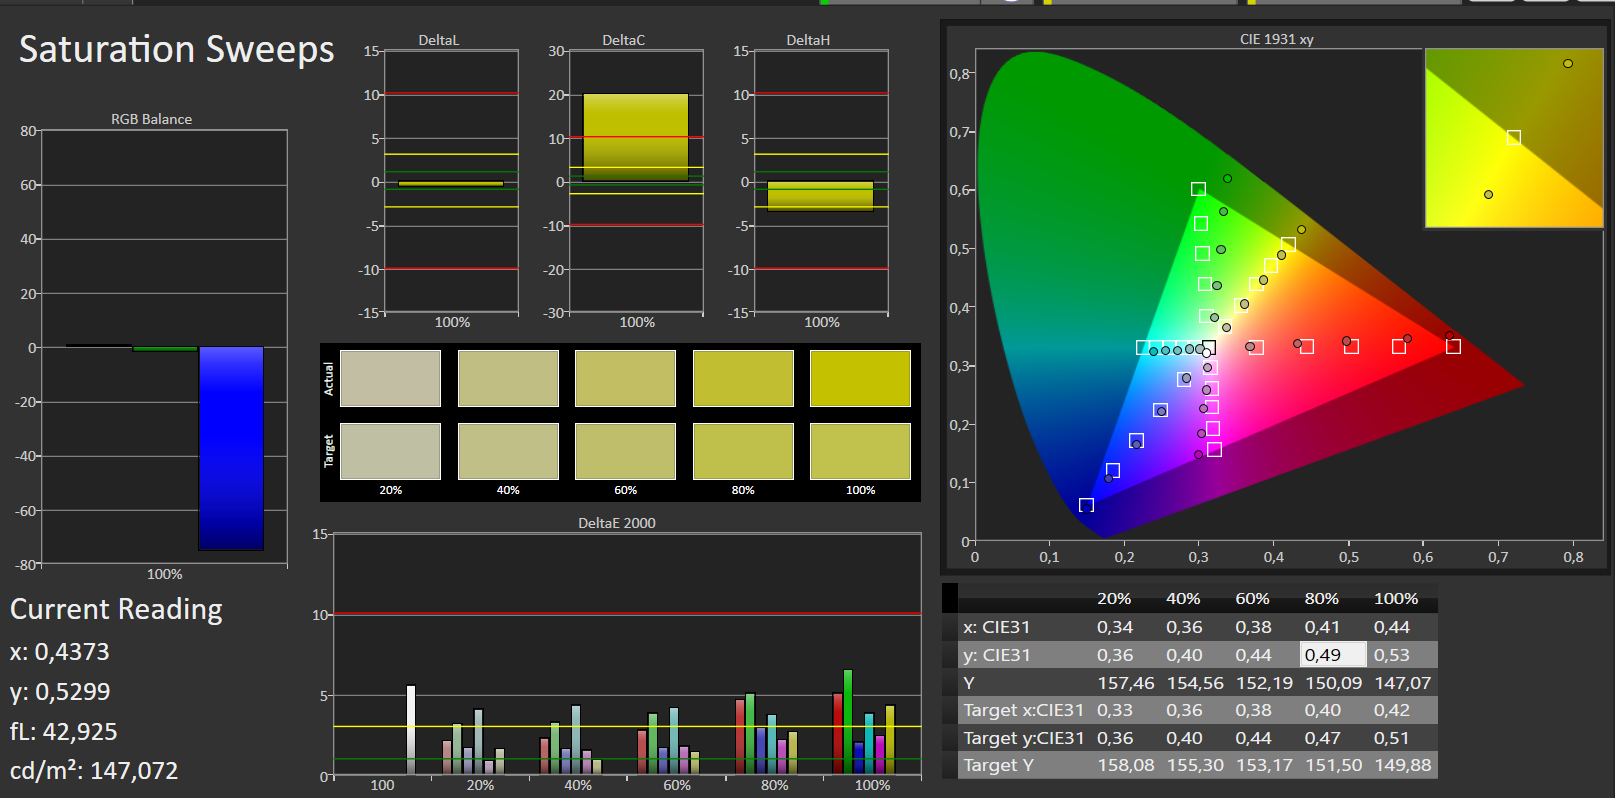
85% sRGB (Argyll 1.6.3 3D)
55% AdobeRGB 1998 (Argyll 1.6.3 3D)
62% AdobeRGB 1998 (Argyll 3D)
84.8% sRGB (Argyll 3D)
64.8% Display P3 (Argyll 3D)
Gamma: 2.49
CCT: 6572 K
| Dell Latitude 14 E5470 LP140WF3, 1920x1080, 14" | Dell Latitude 14 E5470 LG Philips LGD04B1 140WHU, 1366x768, 14" | HP ProBook 440 G4-Y8B51EA AUO1E3D, 1920x1080, 14" | Lenovo ThinkPad T460-20FN003LGE Lenovo LEN40A9 / N140HCE-EAA, 1920x1080, 14" | Acer TravelMate P648-M-757N AU Optronics B140HAN02.1, 1920x1080, 14" | |
|---|---|---|---|---|---|
| Display | -33% | -37% | -31% | -41% | |
| Display P3 Coverage (%) | 64.8 | 40.06 -38% | 37.6 -42% | 42.09 -35% | 35.53 -45% |
| sRGB Coverage (%) | 84.8 | 60.3 -29% | 56.6 -33% | 62 -27% | 53.3 -37% |
| AdobeRGB 1998 Coverage (%) | 62 | 41.42 -33% | 38.85 -37% | 43.6 -30% | 36.72 -41% |
| Response Times | -29% | -3% | -2% | -5% | |
| Response Time Grey 50% / Grey 80% * (ms) | 39 ? | 56.8 ? -46% | 43.2 ? -11% | 42.4 ? -9% | 44 ? -13% |
| Response Time Black / White * (ms) | 26 ? | 28.8 ? -11% | 24.4 ? 6% | 24.8 ? 5% | 25 ? 4% |
| PWM Frequency (Hz) | |||||
| Screen | -73% | -57% | -35% | 5% | |
| Brightness middle (cd/m²) | 323 | 229 -29% | 216 -33% | 230 -29% | 254 -21% |
| Brightness (cd/m²) | 316 | 207 -34% | 203 -36% | 216 -32% | 243 -23% |
| Brightness Distribution (%) | 79 | 80 1% | 83 5% | 85 8% | 90 14% |
| Black Level * (cd/m²) | 0.57 | 0.69 -21% | 0.47 18% | 0.26 54% | 0.19 67% |
| Contrast (:1) | 567 | 332 -41% | 460 -19% | 885 56% | 1337 136% |
| Colorchecker dE 2000 * | 3.68 | 10.16 -176% | 8.98 -144% | 7.32 -99% | 4.93 -34% |
| Colorchecker dE 2000 max. * | 8.33 | 17.18 -106% | 14.07 -69% | 18.14 -118% | 10.14 -22% |
| Greyscale dE 2000 * | 2.99 | 10.87 -264% | 9.61 -221% | 6.98 -133% | 2.71 9% |
| Gamma | 2.49 88% | 2.41 91% | 2.63 84% | 2.5 88% | 2.36 93% |
| CCT | 6572 99% | 12881 50% | 11265 58% | 6683 97% | 6914 94% |
| Color Space (Percent of AdobeRGB 1998) (%) | 55 | 38.4 -30% | 35.9 -35% | 39.97 -27% | 34 -38% |
| Color Space (Percent of sRGB) (%) | 85 | 60.4 -29% | 56.7 -33% | 61.55 -28% | 53 -38% |
| Média Total (Programa/Configurações) | -45% /
-59% | -32% /
-46% | -23% /
-30% | -14% /
-5% |
* ... menor é melhor
Exibir tempos de resposta
| ↔ Tempo de resposta preto para branco | ||
|---|---|---|
| 26 ms ... ascensão ↗ e queda ↘ combinadas | ↗ 5 ms ascensão | 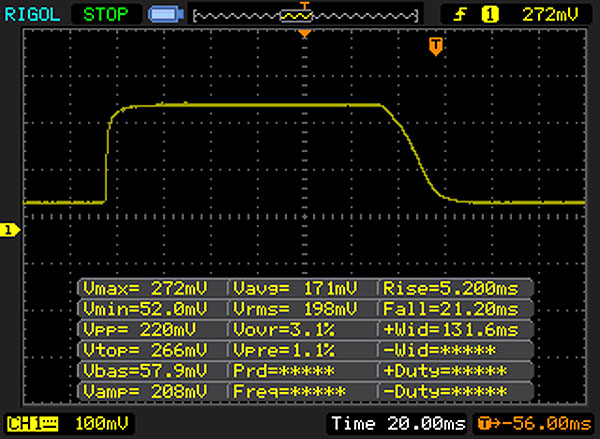 |
| ↘ 21 ms queda | ||
| A tela mostra taxas de resposta relativamente lentas em nossos testes e pode ser muito lenta para os jogadores. Em comparação, todos os dispositivos testados variam de 0.1 (mínimo) a 240 (máximo) ms. » 62 % de todos os dispositivos são melhores. Isso significa que o tempo de resposta medido é pior que a média de todos os dispositivos testados (19.8 ms). | ||
| ↔ Tempo de resposta 50% cinza a 80% cinza | ||
| 39 ms ... ascensão ↗ e queda ↘ combinadas | ↗ 15 ms ascensão | 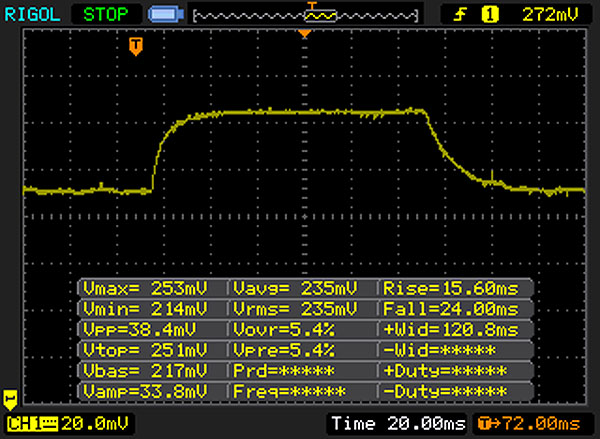 |
| ↘ 24 ms queda | ||
| A tela mostra taxas de resposta lentas em nossos testes e será insatisfatória para os jogadores. Em comparação, todos os dispositivos testados variam de 0.165 (mínimo) a 636 (máximo) ms. » 59 % de todos os dispositivos são melhores. Isso significa que o tempo de resposta medido é pior que a média de todos os dispositivos testados (31 ms). | ||
Cintilação da tela / PWM (modulação por largura de pulso)
| Tela tremeluzindo / PWM não detectado | ||
[pwm_comparison] Em comparação: 52 % de todos os dispositivos testados não usam PWM para escurecer a tela. Se PWM foi detectado, uma média de 7769 (mínimo: 5 - máximo: 343500) Hz foi medida. | ||
| Cinebench R11.5 | |
| CPU Multi 64Bit | |
| Dell Latitude 14 E5470 | |
| HP ProBook 440 G4-Y8B51EA | |
| Dell Latitude 14 E5470 | |
| Acer TravelMate P648-M-757N | |
| CPU Single 64Bit | |
| HP ProBook 440 G4-Y8B51EA | |
| Dell Latitude 14 E5470 | |
| Dell Latitude 14 E5470 | |
| Acer TravelMate P648-M-757N | |
| Cinebench R10 | |
| Rendering Multiple CPUs 64Bit | |
| Dell Latitude 14 E5470 | |
| Dell Latitude 14 E5470 | |
| Rendering Single CPUs 64Bit | |
| Dell Latitude 14 E5470 | |
| Dell Latitude 14 E5470 | |
| JetStream 1.1 - 1.1 Total | |
| Dell Latitude 14 E5470 | |
| HP ProBook 440 G4-Y8B51EA | |
| Lenovo ThinkPad T460-20FN003LGE | |
| Acer TravelMate P648-M-757N | |
| Octane V2 - Total Score | |
| Dell Latitude 14 E5470 | |
| HP ProBook 440 G4-Y8B51EA | |
| Dell Latitude 14 E5470 | |
| Lenovo ThinkPad T460-20FN003LGE | |
| Acer TravelMate P648-M-757N | |
| Mozilla Kraken 1.1 - Total | |
| Acer TravelMate P648-M-757N | |
| Lenovo ThinkPad T460-20FN003LGE | |
| Dell Latitude 14 E5470 | |
| Dell Latitude 14 E5470 | |
| HP ProBook 440 G4-Y8B51EA | |
* ... menor é melhor
| PCMark 8 | |
| Home Score Accelerated v2 | |
| HP ProBook 440 G4-Y8B51EA | |
| Acer TravelMate P648-M-757N | |
| Dell Latitude 14 E5470 | |
| Dell Latitude 14 E5470 | |
| Lenovo ThinkPad T460-20FN003LGE | |
| Work Score Accelerated v2 | |
| HP ProBook 440 G4-Y8B51EA | |
| Dell Latitude 14 E5470 | |
| Dell Latitude 14 E5470 | |
| Acer TravelMate P648-M-757N | |
| Lenovo ThinkPad T460-20FN003LGE | |
| Creative Score Accelerated v2 | |
| HP ProBook 440 G4-Y8B51EA | |
| Dell Latitude 14 E5470 | |
| Dell Latitude 14 E5470 | |
| Acer TravelMate P648-M-757N | |
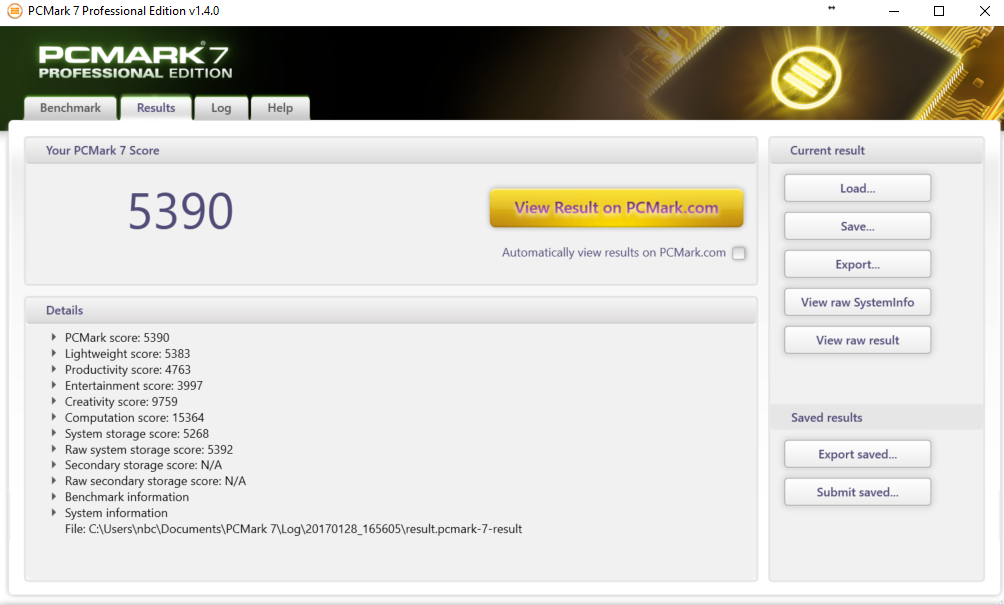
| PCMark 7 Score | 5390 pontos | |
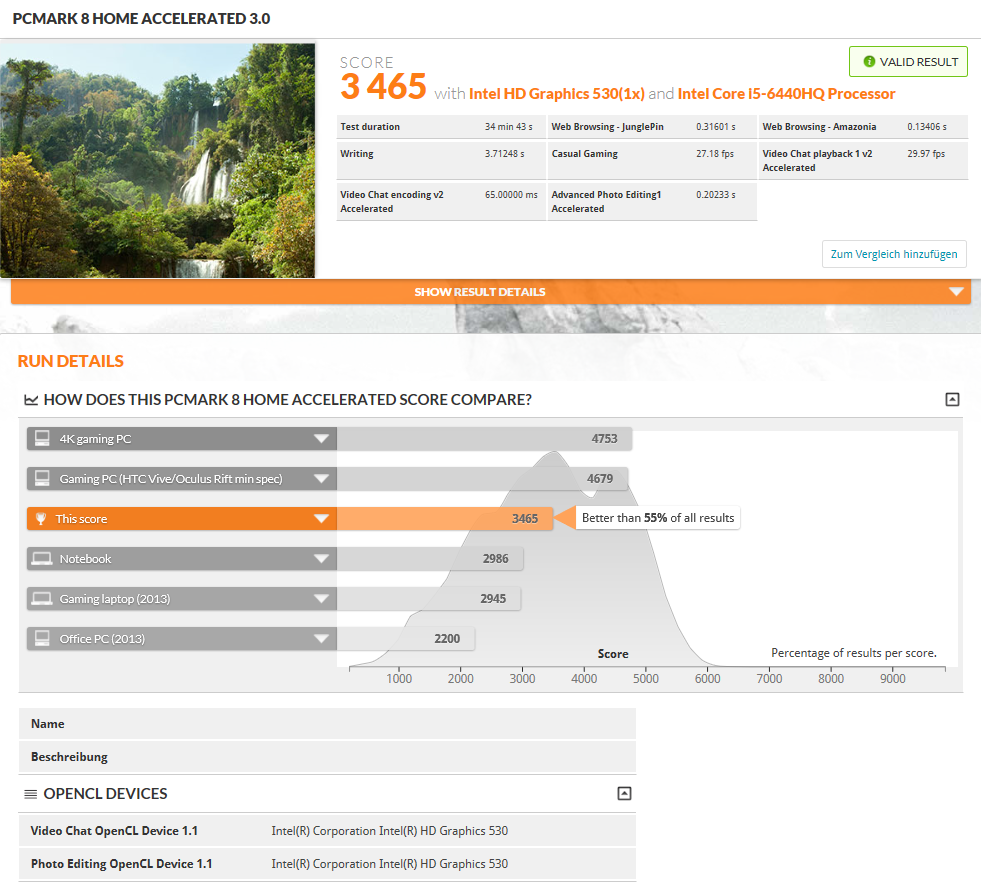
| PCMark 8 Home Score Accelerated v2 | 3465 pontos | |
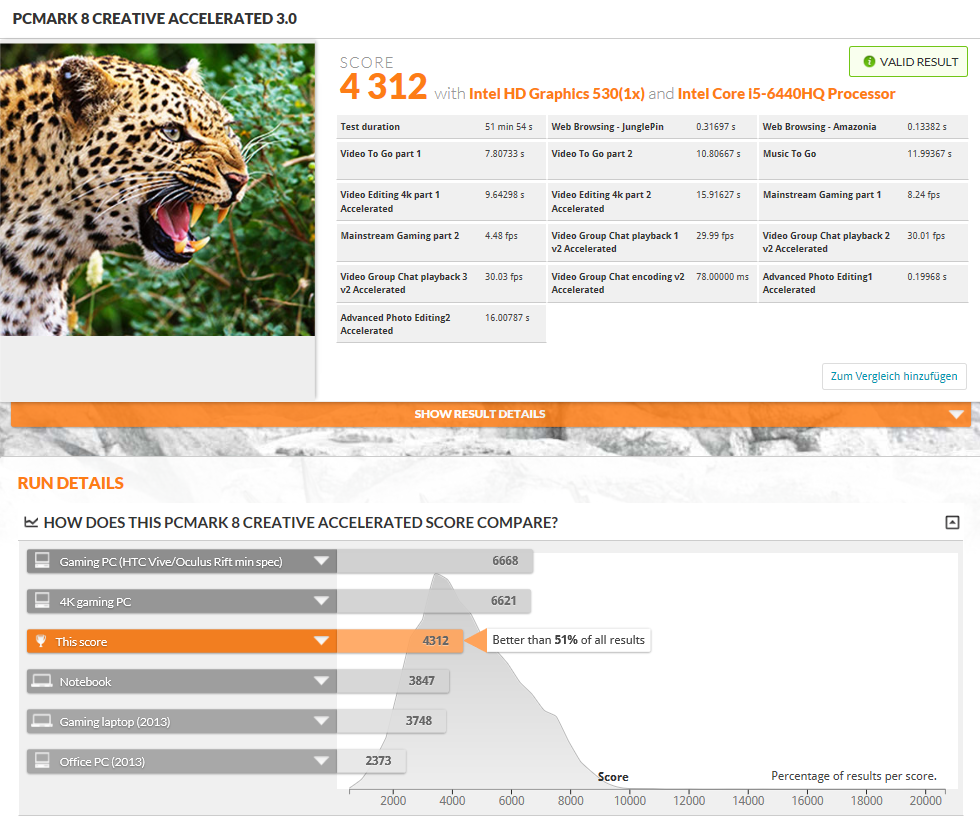
| PCMark 8 Creative Score Accelerated v2 | 4312 pontos | |
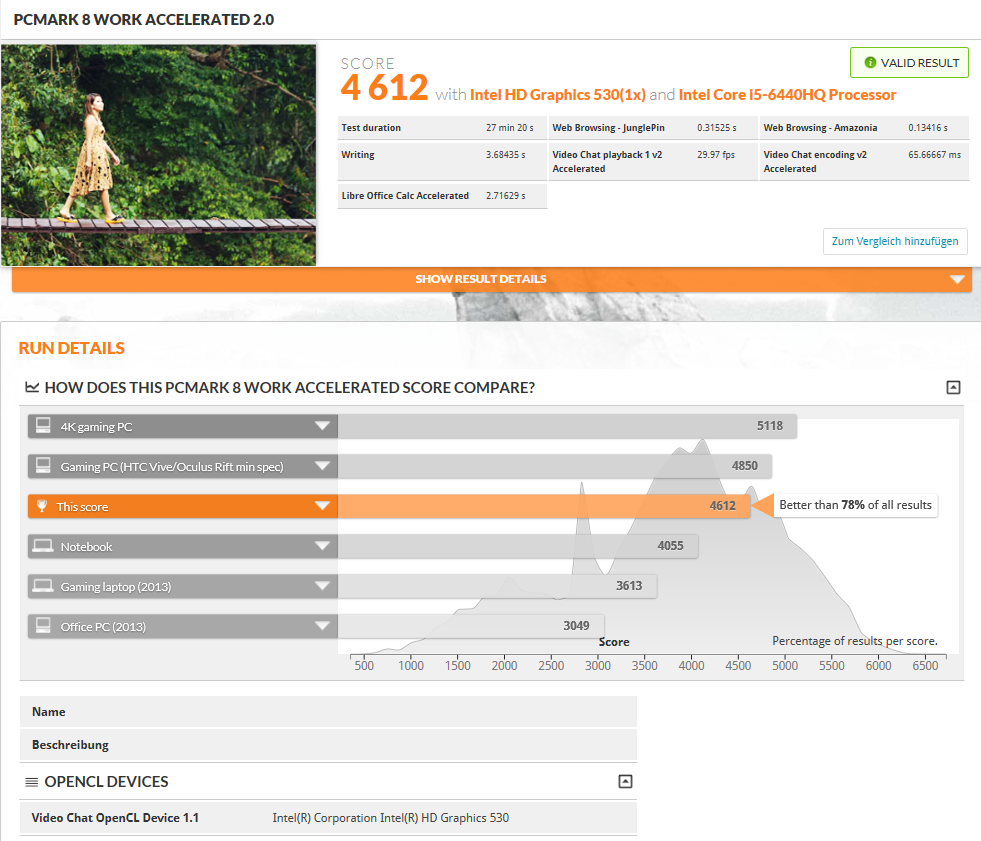
| PCMark 8 Work Score Accelerated v2 | 4612 pontos | |
Ajuda | ||

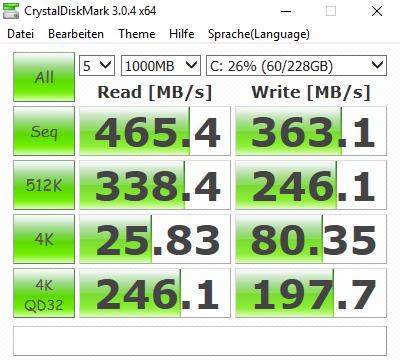
| Dell Latitude 14 E5470 Micron SSD 1100 (MTFDDAV256TBN) | Dell Latitude 14 E5470 Liteon L8H-256V2G | HP ProBook 440 G4-Y8B51EA SanDisk SD8SNAT256G1002 | Lenovo ThinkPad T460-20FN003LGE Toshiba HG6 THNSFJ256GCSU | Acer TravelMate P648-M-757N Lite-On CV1-8B256 | |
|---|---|---|---|---|---|
| CrystalDiskMark 3.0 | 12% | -6% | 6% | 13% | |
| Read Seq (MB/s) | 465.4 | 508 9% | 491.2 6% | 458.9 -1% | 531 14% |
| Write Seq (MB/s) | 363.1 | 360.6 -1% | 322.2 -11% | 394.4 9% | 358.8 -1% |
| Read 512 (MB/s) | 338.4 | 374.1 11% | 310.1 -8% | 371.3 10% | 384.8 14% |
| Write 512 (MB/s) | 246.1 | 300.2 22% | 276 12% | 232.7 -5% | 363 48% |
| Read 4k (MB/s) | 25.83 | 31.98 24% | 19.57 -24% | 21.7 -16% | 31.3 21% |
| Write 4k (MB/s) | 80.3 | 93.1 16% | 77.8 -3% | 72.9 -9% | 80.3 0% |
| Read 4k QD32 (MB/s) | 246.1 | 274.7 12% | 146.3 -41% | 369.9 50% | 239.4 -3% |
| Write 4k QD32 (MB/s) | 197.7 | 205.6 4% | 241.4 22% | 216 9% | 225.3 14% |


| 3DMark | |
| 1280x720 Cloud Gate Standard Graphics | |
| HP ProBook 440 G4-Y8B51EA | |
| Acer TravelMate P648-M-757N | |
| Dell Latitude 14 E5470 | |
| Dell Latitude 14 E5470 | |
| Lenovo ThinkPad T460-20FN003LGE | |
| 1920x1080 Fire Strike Graphics | |
| HP ProBook 440 G4-Y8B51EA | |
| Acer TravelMate P648-M-757N | |
| Dell Latitude 14 E5470 | |
| Dell Latitude 14 E5470 | |
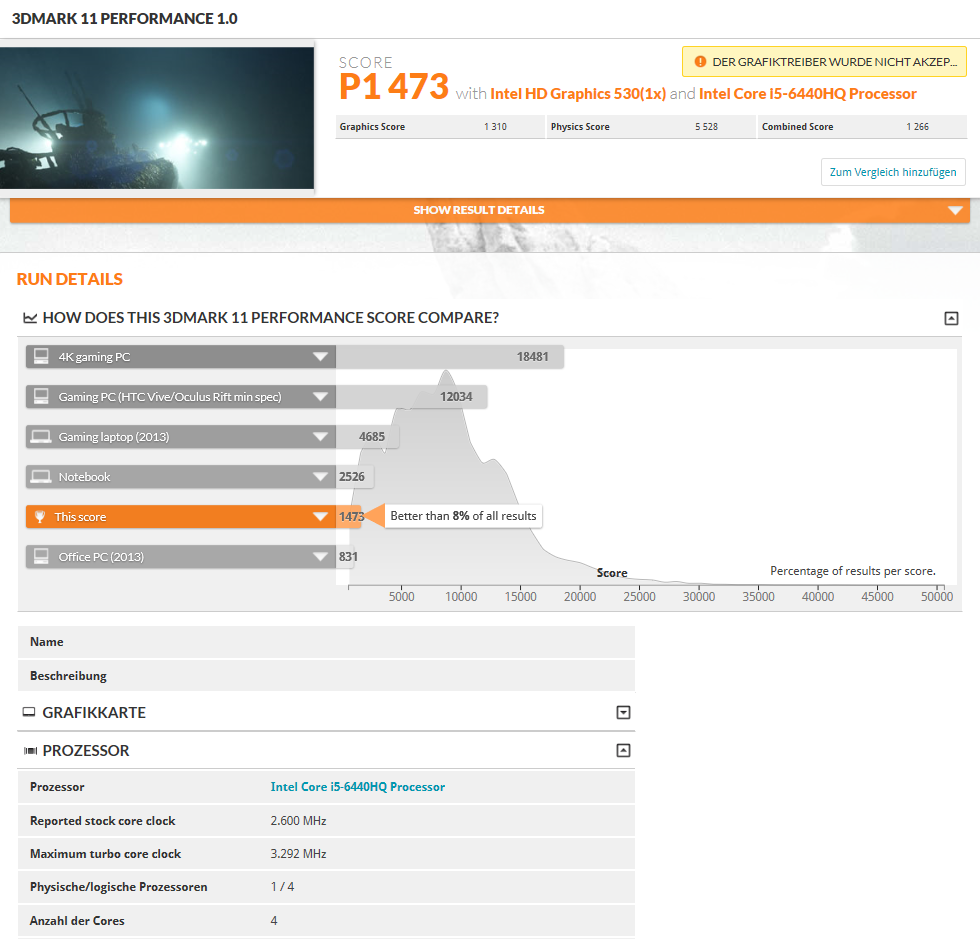
| 3DMark 11 - 1280x720 Performance GPU | |
| HP ProBook 440 G4-Y8B51EA | |
| Dell Latitude 14 E5470 | |
| Dell Latitude 14 E5470 | |
| Acer TravelMate P648-M-757N | |
| Lenovo ThinkPad T460-20FN003LGE | |
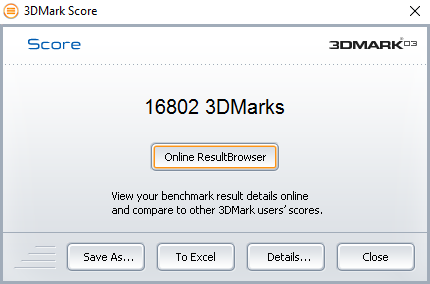
| 3DMark 03 Standard | 16802 pontos | |
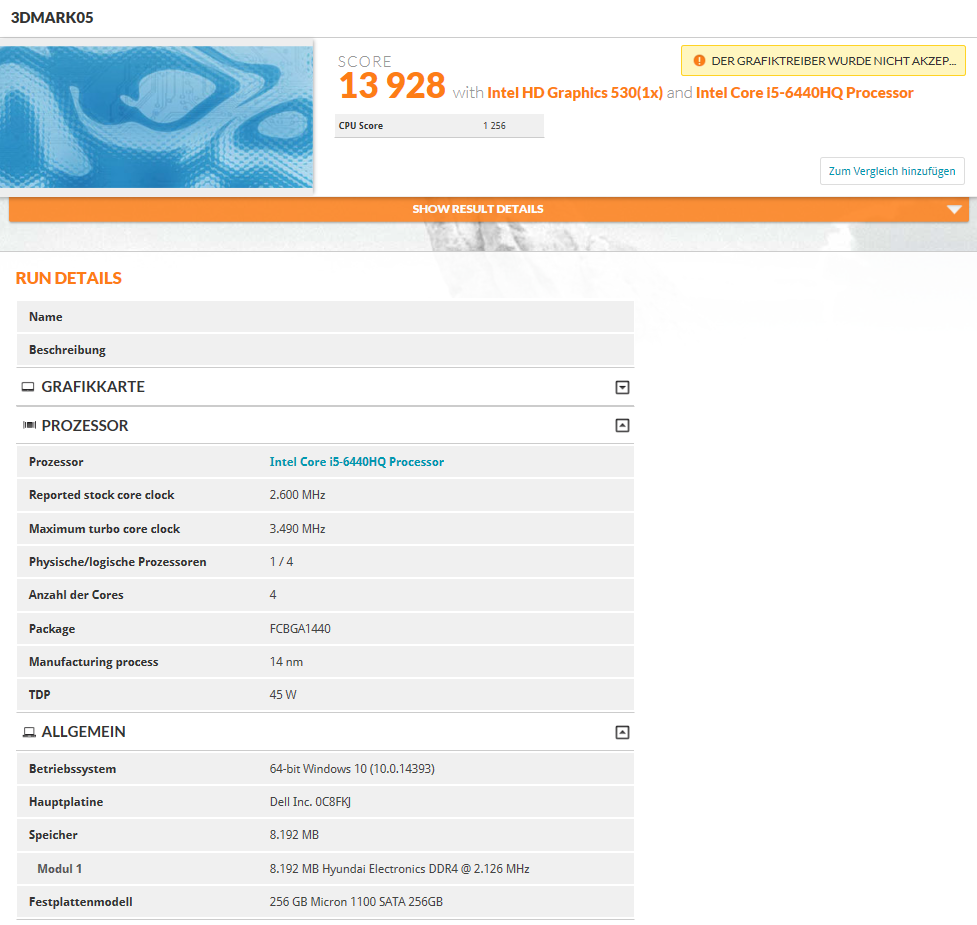
| 3DMark 05 Standard | 13920 pontos | |
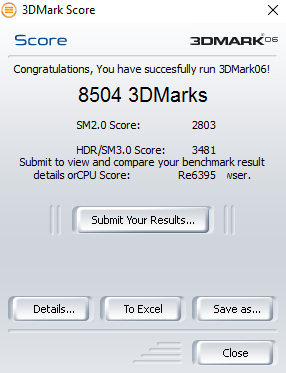
| 3DMark 06 Standard Score | 8504 pontos | |
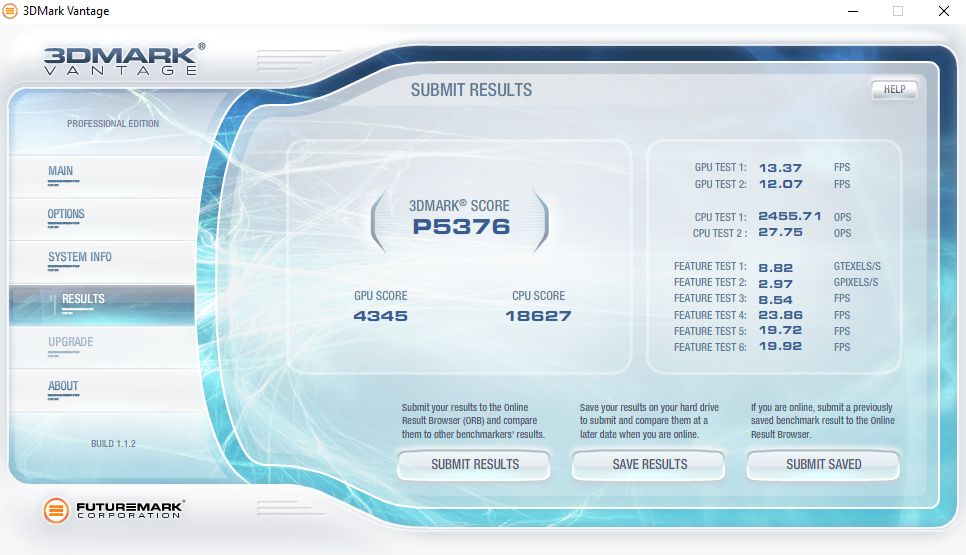
| 3DMark Vantage P Result | 5376 pontos | |
| 3DMark 11 Performance | 1473 pontos | |
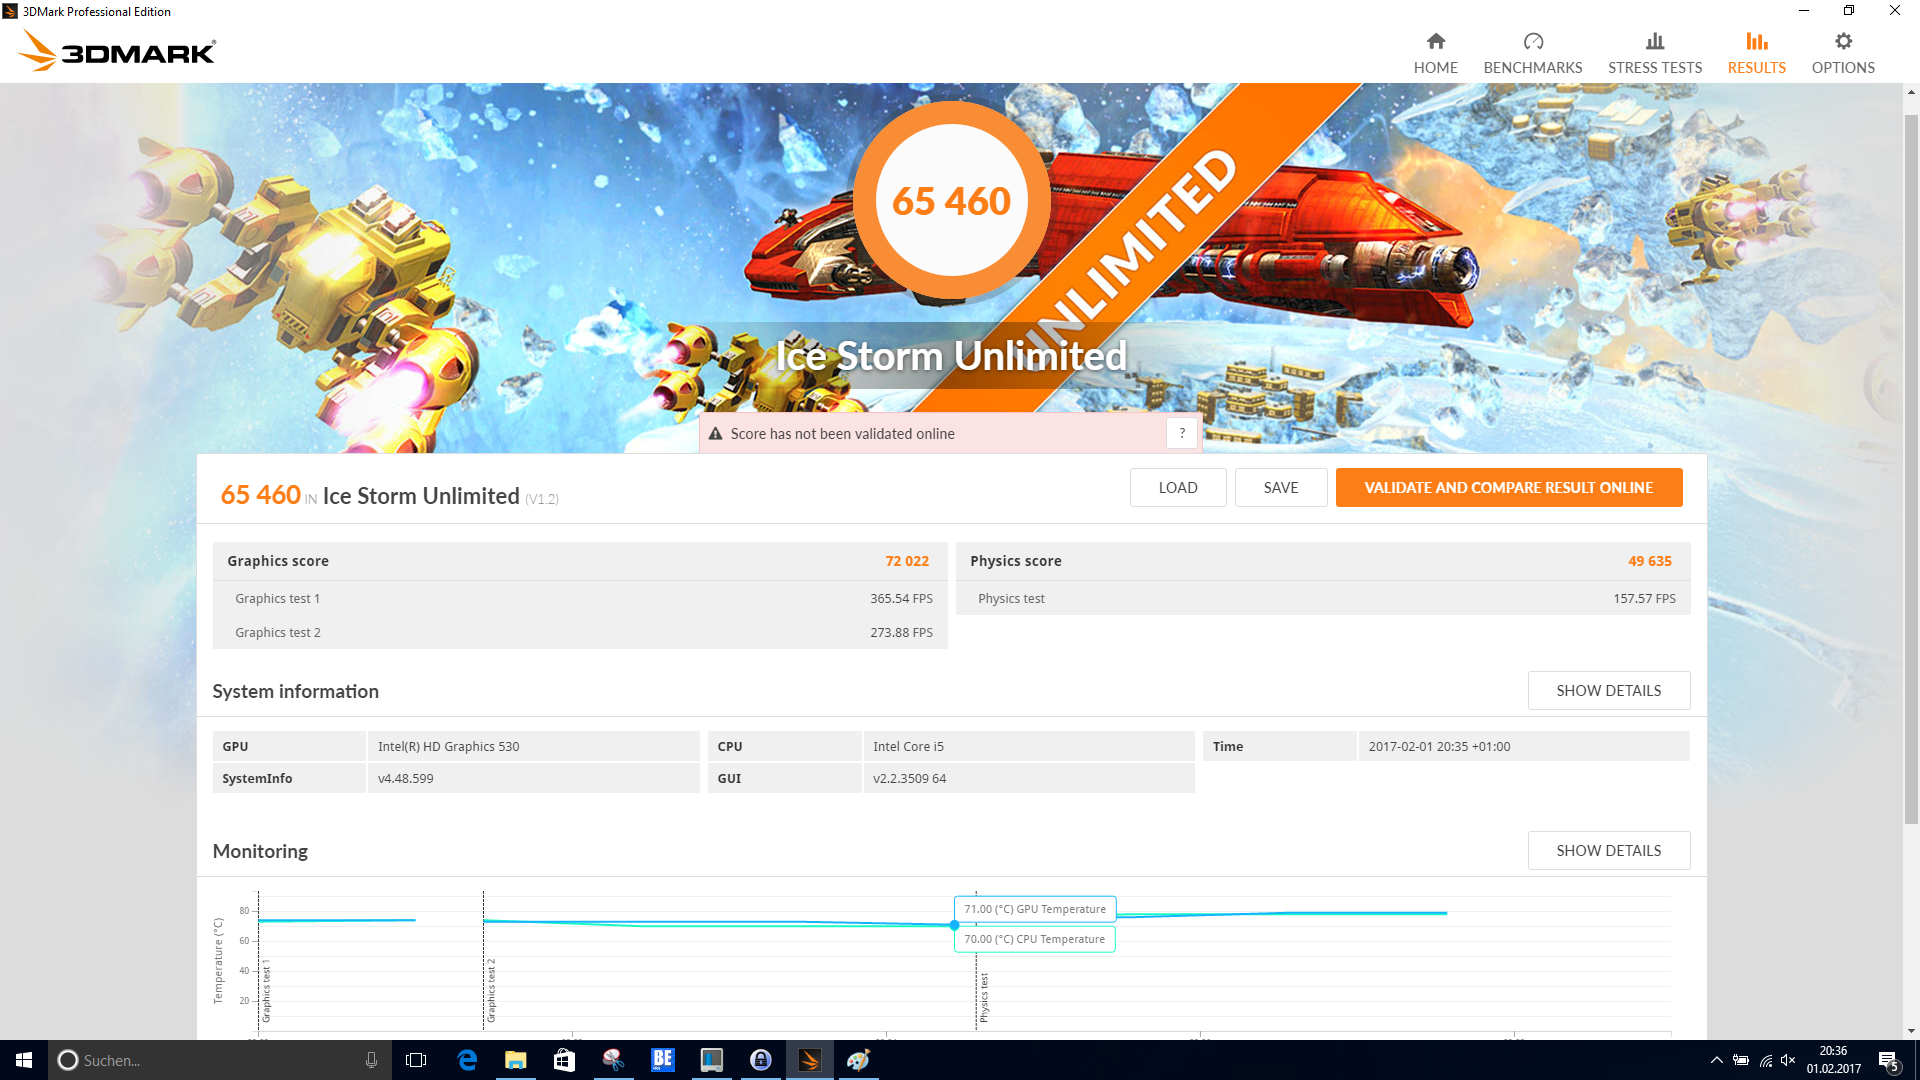
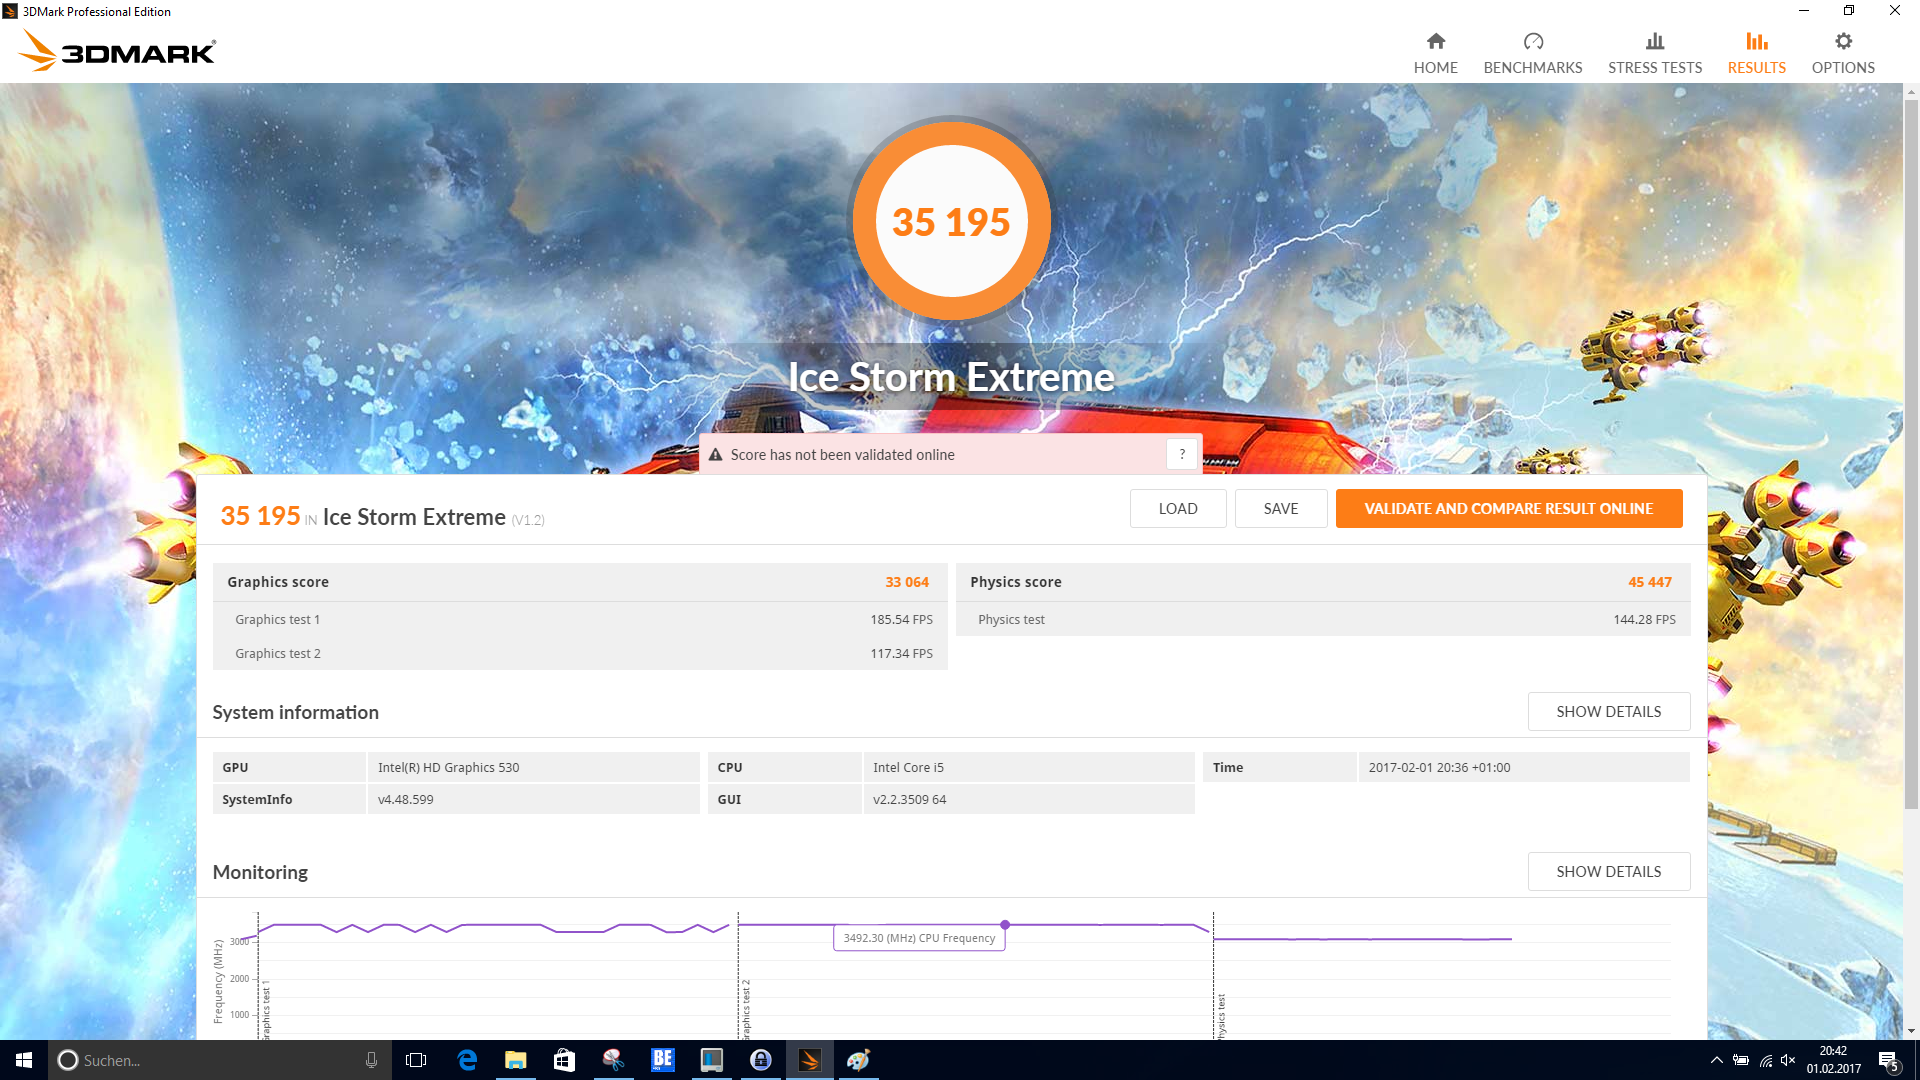
| 3DMark Ice Storm Standard Score | 52579 pontos | |
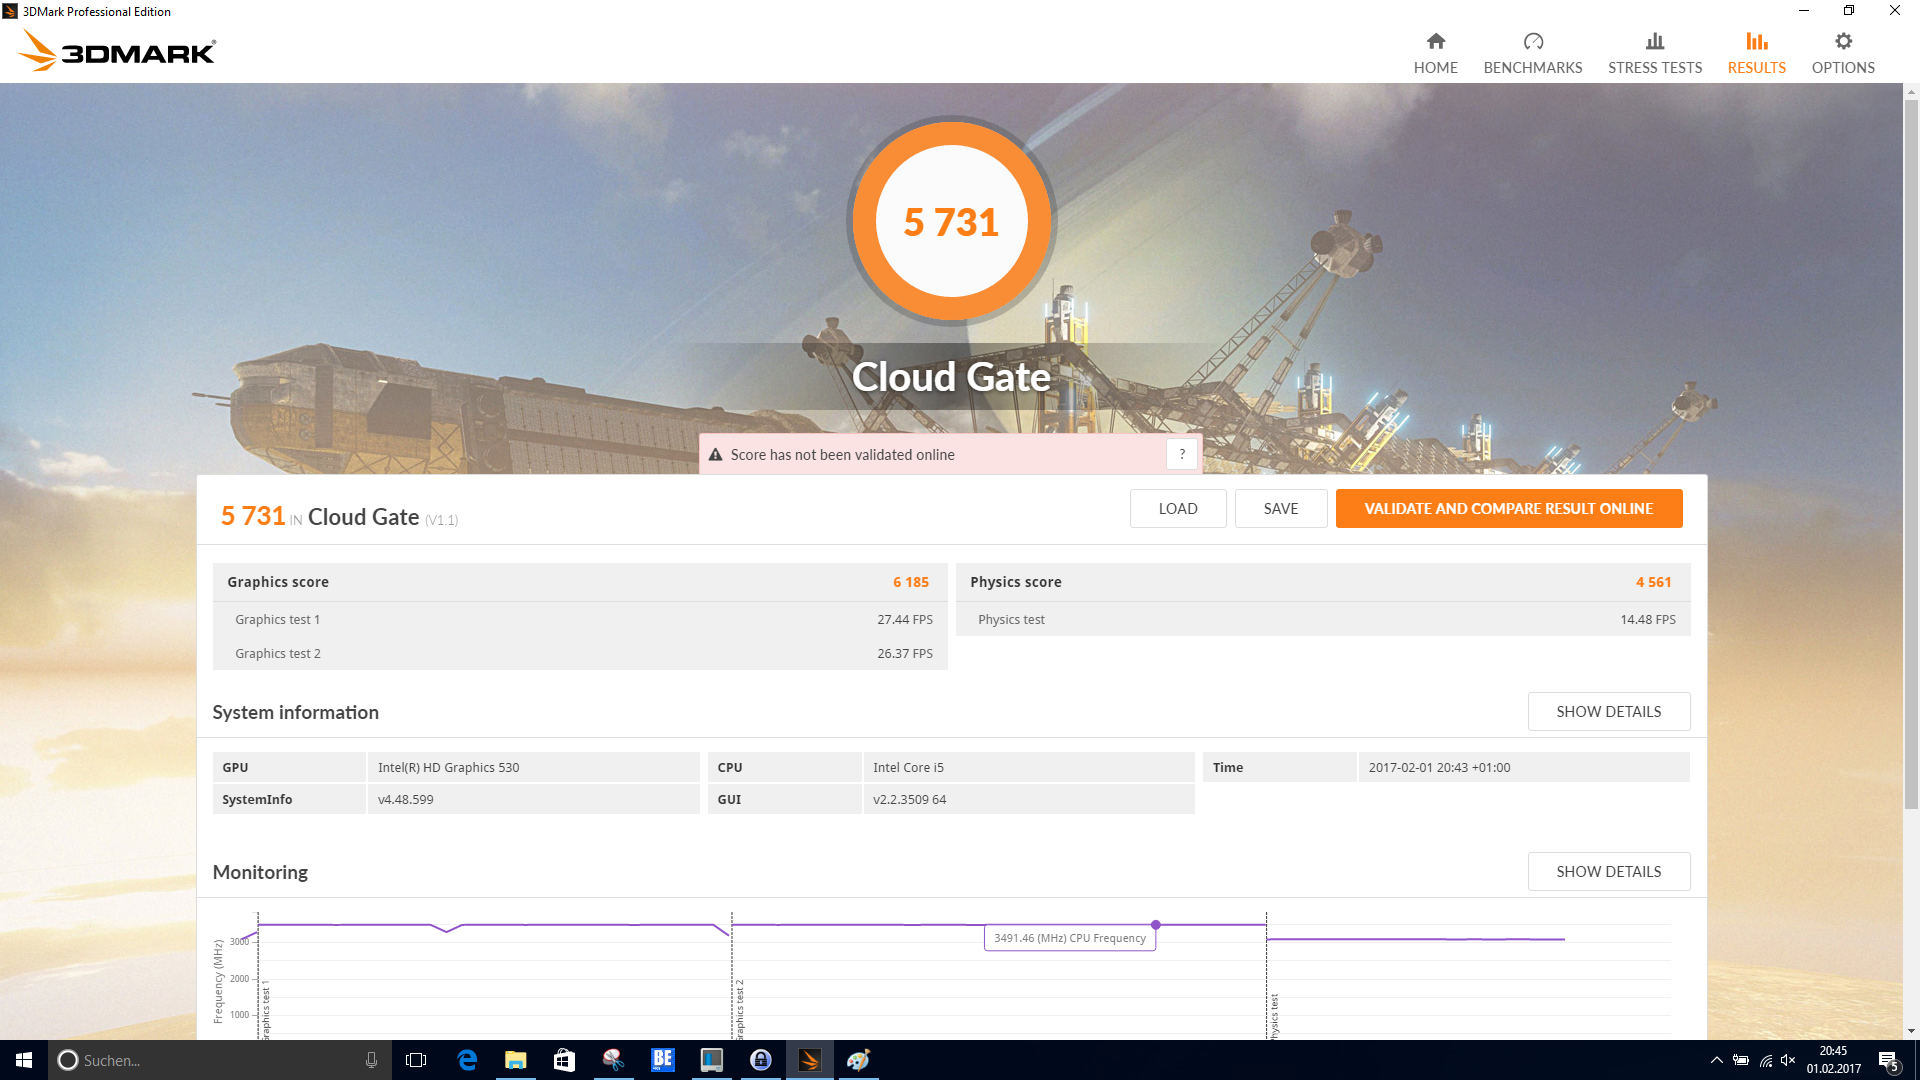
| 3DMark Cloud Gate Standard Score | 5731 pontos | |
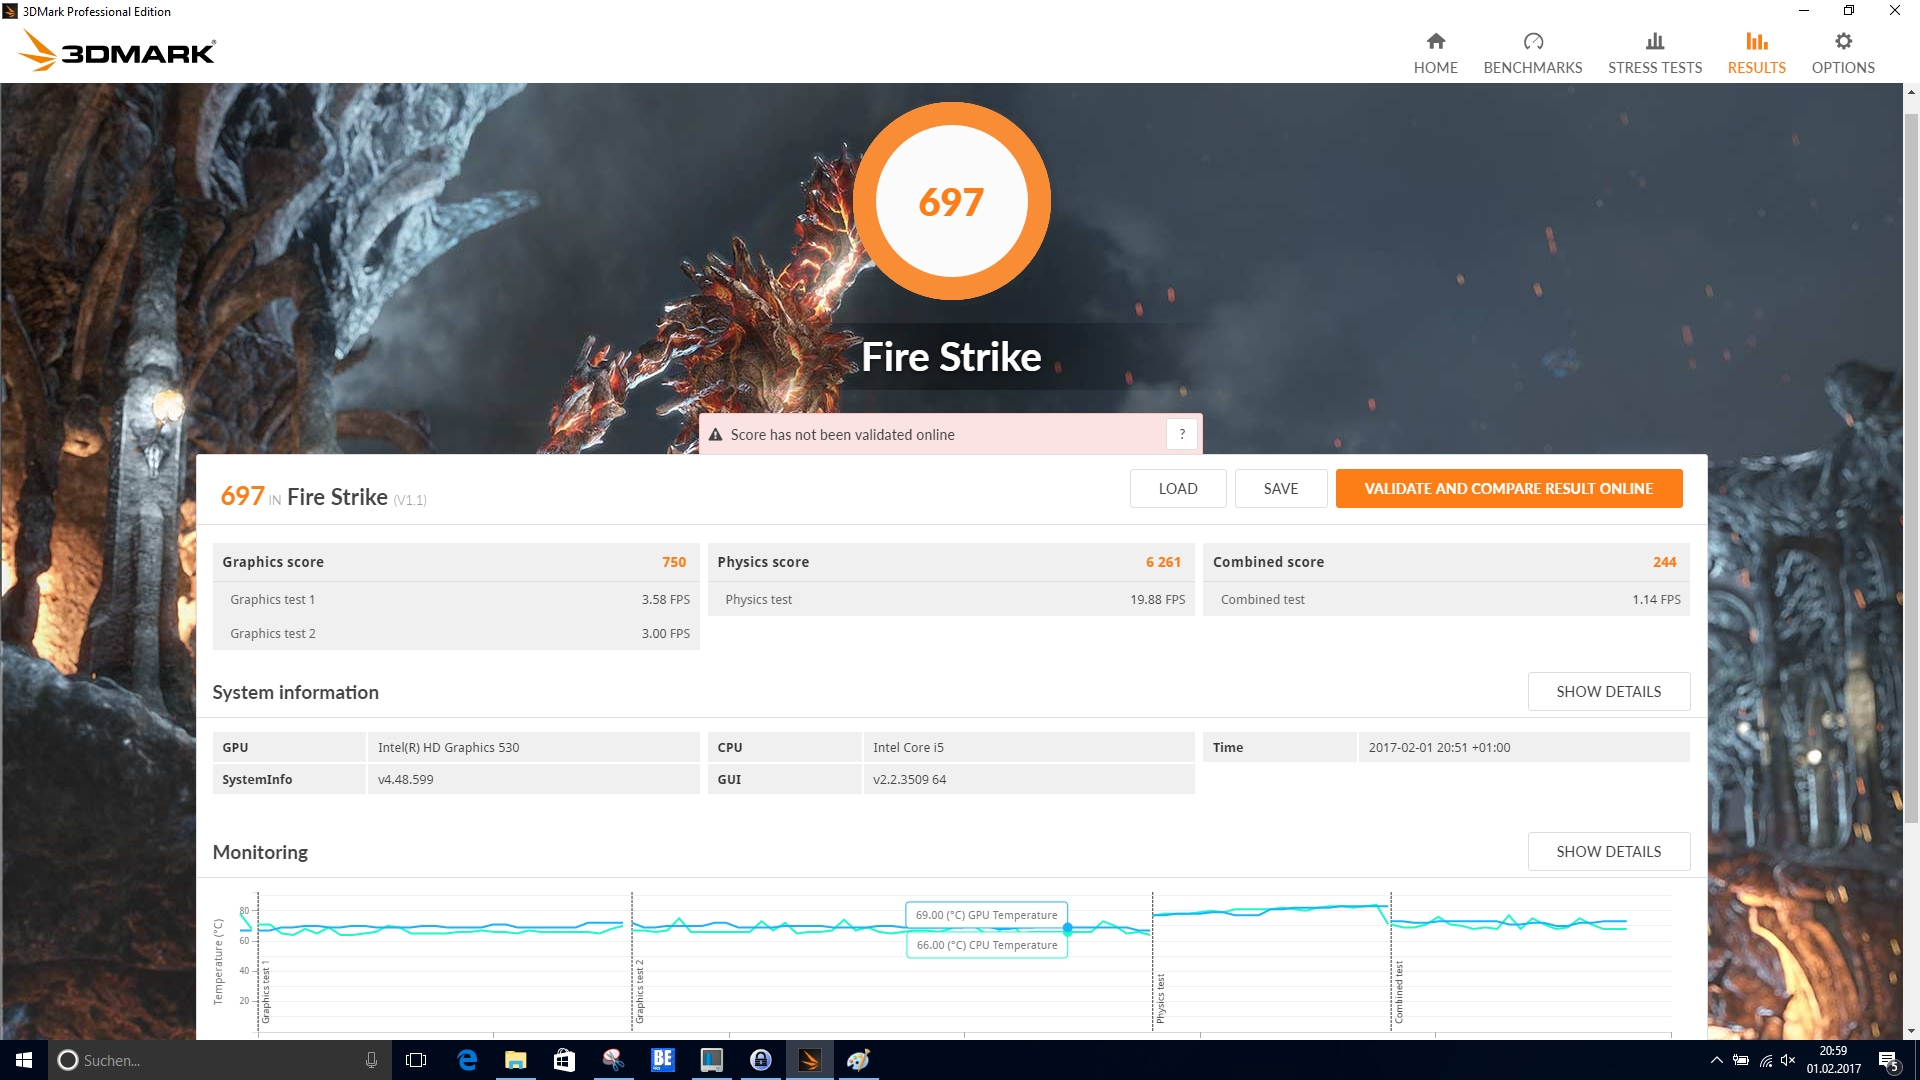
| 3DMark Fire Strike Score | 697 pontos | |
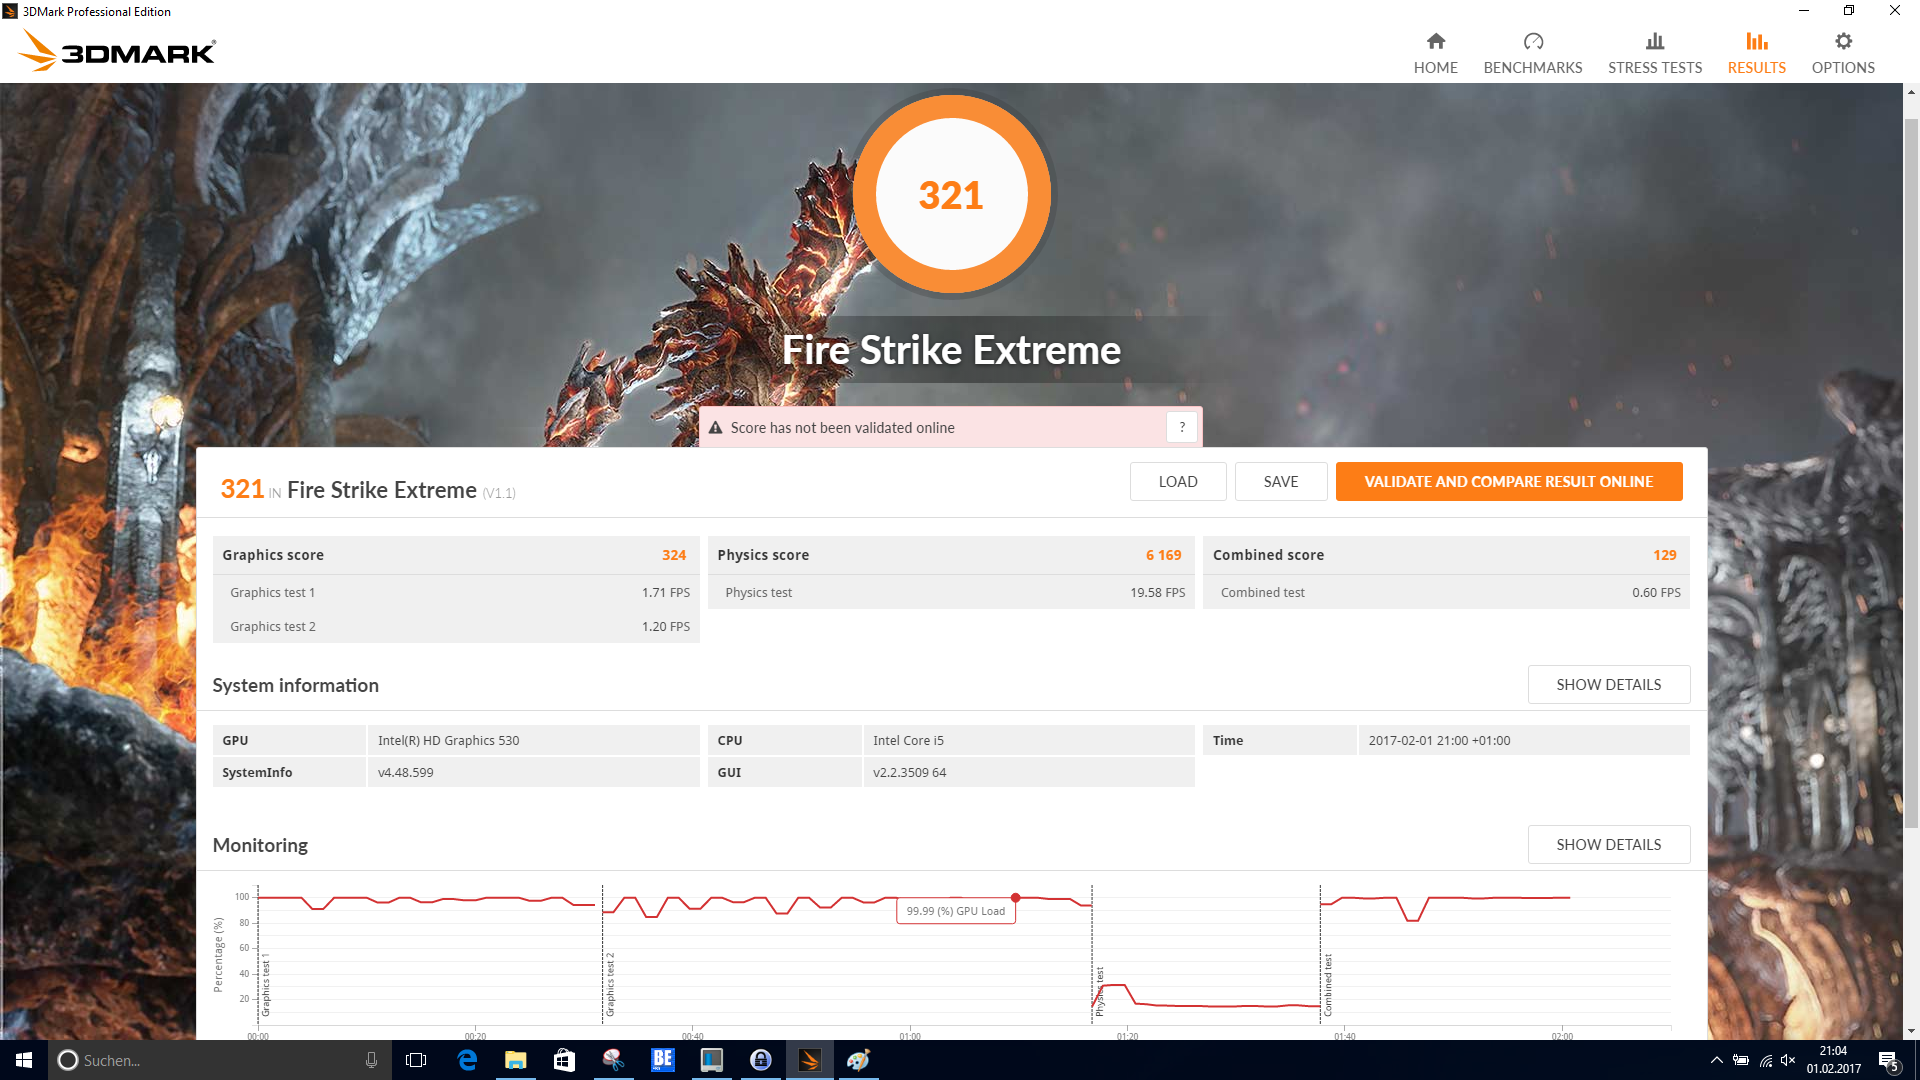
| 3DMark Fire Strike Extreme Score | 321 pontos | |
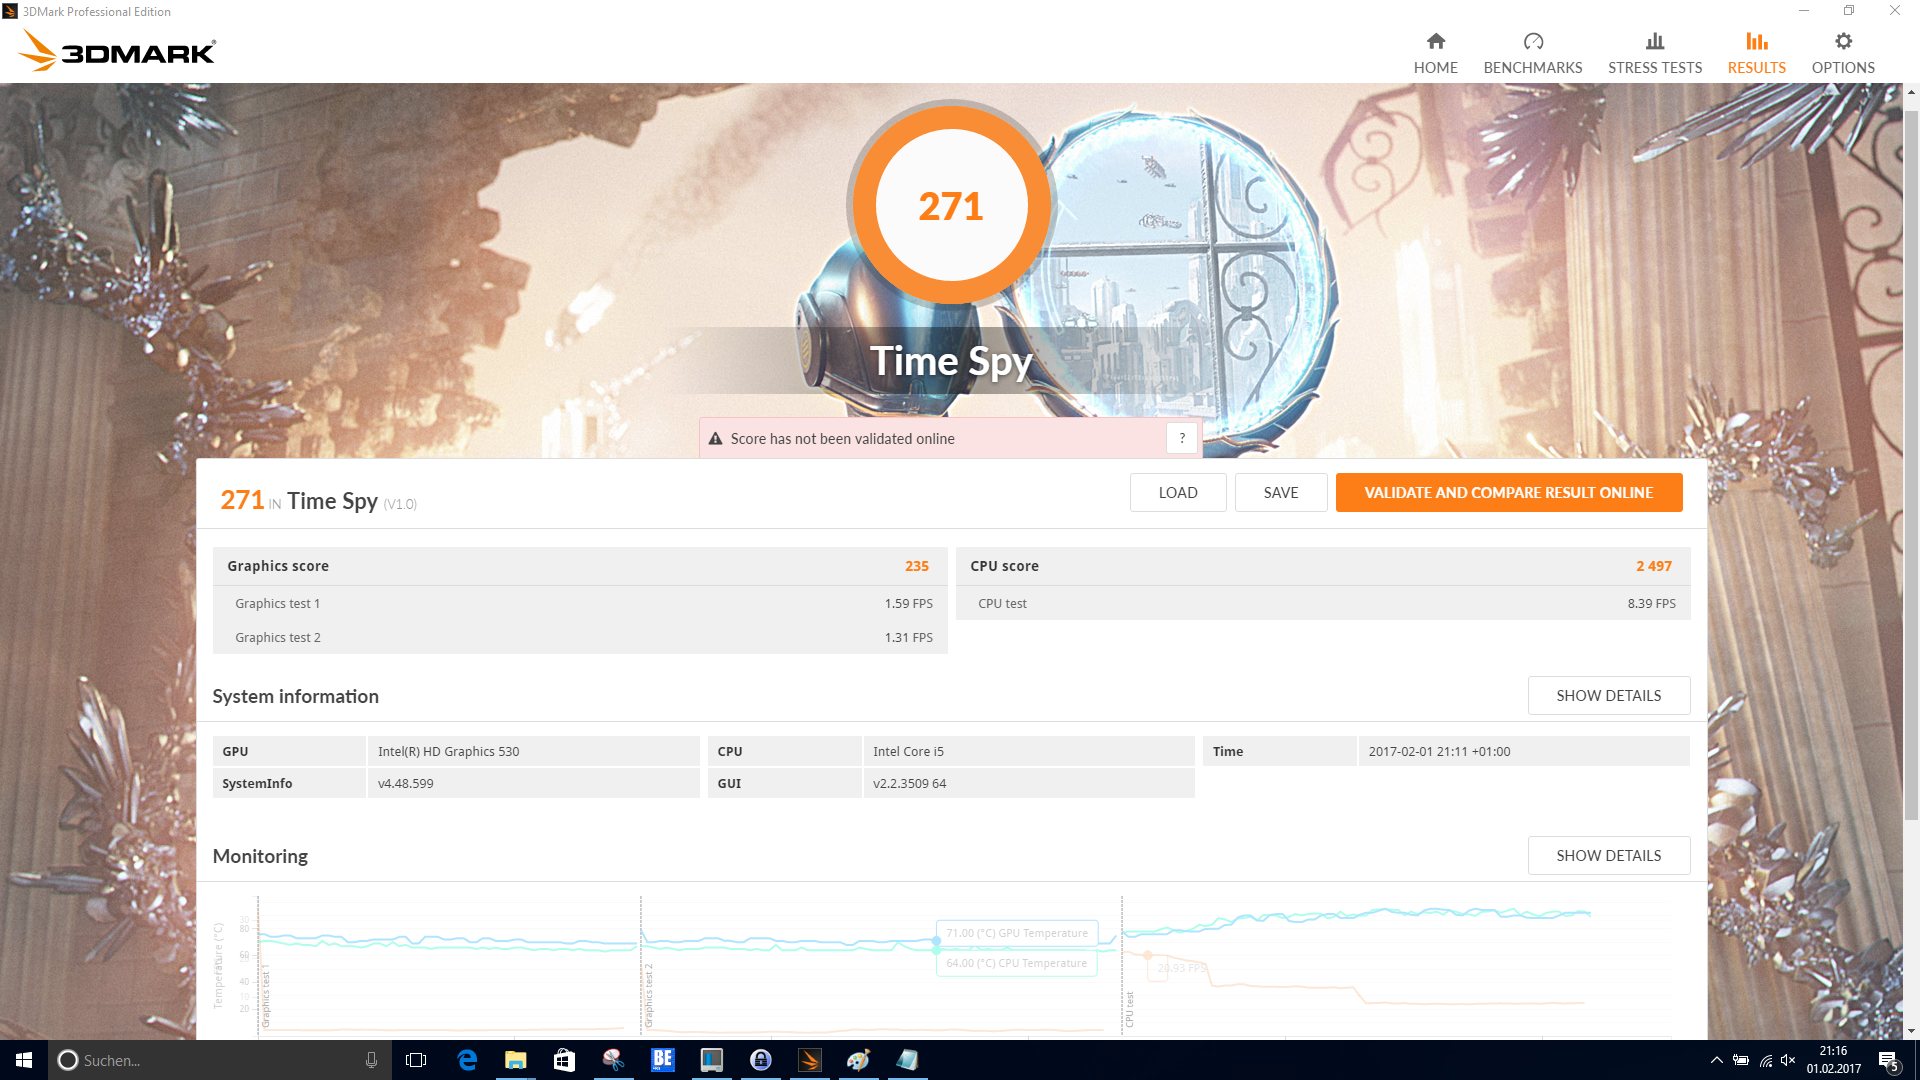
| 3DMark Time Spy Score | 271 pontos | |
Ajuda | ||
| BioShock Infinite - 1366x768 Medium Preset | |
| HP ProBook 440 G4-Y8B51EA | |
| Acer TravelMate P648-M-757N | |
| Dell Latitude 14 E5470 | |
| Dell Latitude 14 E5470 | |
| Lenovo ThinkPad T460-20FN003LGE | |
| Battlefield 4 - 1366x768 Medium Preset | |
| HP ProBook 440 G4-Y8B51EA | |
| Dell Latitude 14 E5470 | |
| Acer TravelMate P648-M-757N | |
| Dell Latitude 14 E5470 | |
| Lenovo ThinkPad T460-20FN003LGE | |
| baixo | média | alto | ultra | |
|---|---|---|---|---|
| BioShock Infinite (2013) | 45.6 | 23.7 | 19.5 | 5.5 |
| Battlefield 4 (2013) | 41.2 | 27.8 | 18.3 | 4.9 |
| Rise of the Tomb Raider (2016) | 15 |
Barulho
| Ocioso |
| 30.3 / 30.3 / 30.3 dB |
| Carga |
| 31.6 / 35 dB |
 | ||
30 dB silencioso 40 dB(A) audível 50 dB(A) ruidosamente alto |
||
min: | ||
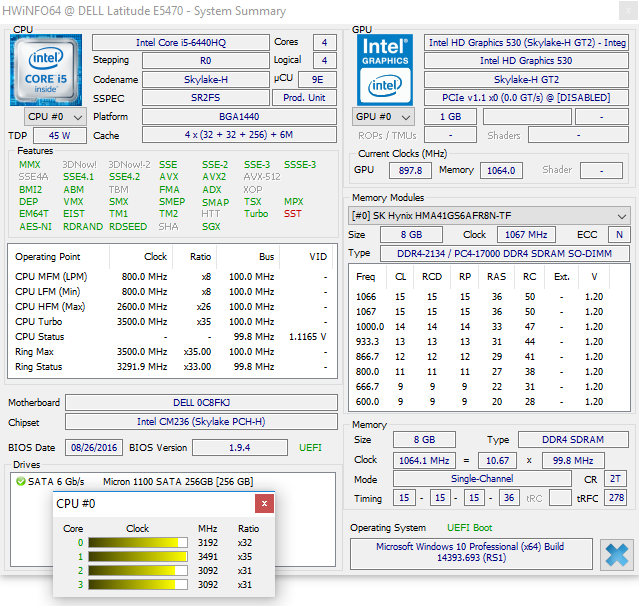
| Dell Latitude 14 E5470 6440HQ, HD Graphics 530 | Dell Latitude 14 E5470 6300U, HD Graphics 520 | HP ProBook 440 G4-Y8B51EA i7-7500U, GeForce 930MX | Lenovo ThinkPad T460-20FN003LGE 6200U, HD Graphics 520 | Acer TravelMate P648-M-757N 6500U, HD Graphics 520 | |
|---|---|---|---|---|---|
| Noise | 2% | -2% | 0% | -2% | |
| desligado / ambiente * (dB) | 30.3 | 29.2 4% | 29 4% | 29 4% | 31.2 -3% |
| Idle Minimum * (dB) | 30.3 | 29.2 4% | 29 4% | 29 4% | 31.2 -3% |
| Idle Average * (dB) | 30.3 | 29.2 4% | 29 4% | 29 4% | 31.2 -3% |
| Idle Maximum * (dB) | 30.3 | 29.2 4% | 29 4% | 29 4% | 31.6 -4% |
| Load Average * (dB) | 31.6 | 32.1 -2% | 37.4 -18% | 34.2 -8% | 33.3 -5% |
| Load Maximum * (dB) | 35 | 36.8 -5% | 39 -11% | 37.8 -8% | 32.4 7% |
* ... menor é melhor
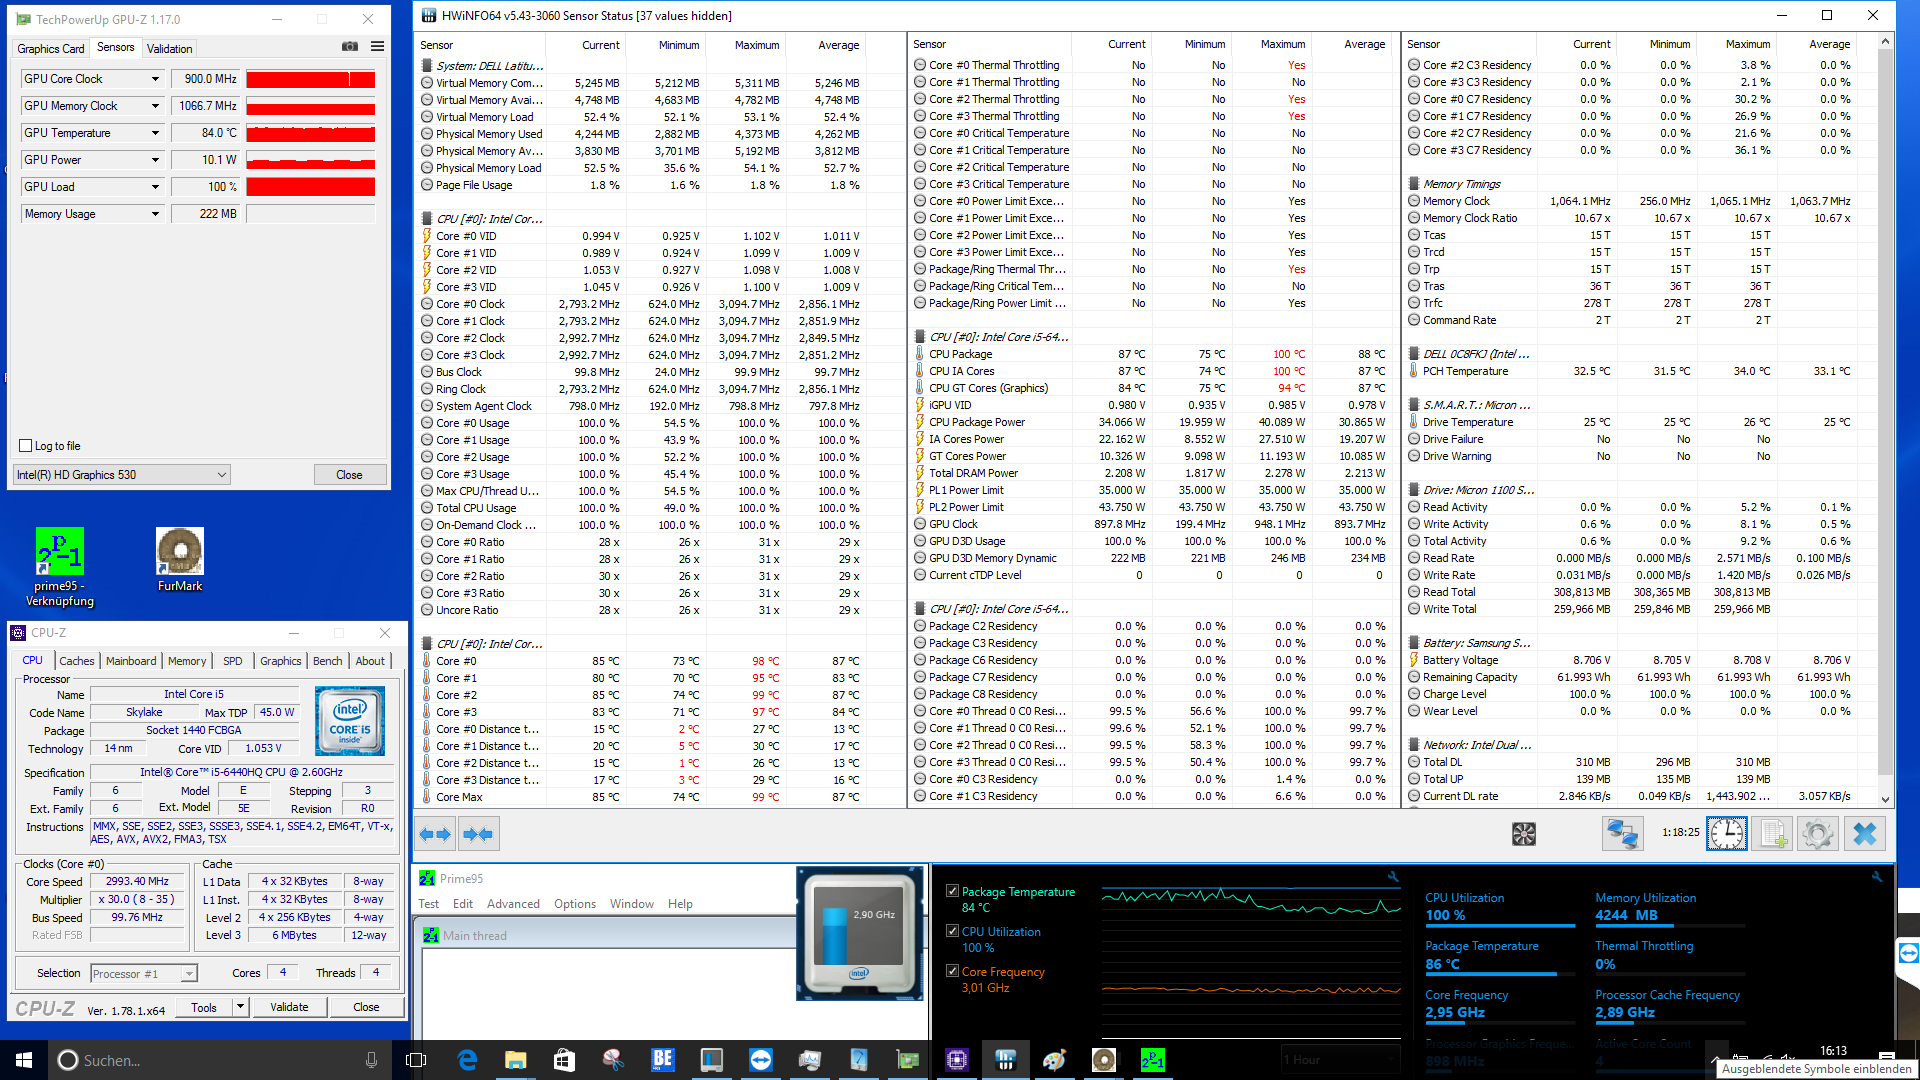
(±) A temperatura máxima no lado superior é 43 °C / 109 F, em comparação com a média de 34.3 °C / 94 F , variando de 21.2 a 62.5 °C para a classe Office.
(±) A parte inferior aquece até um máximo de 43 °C / 109 F, em comparação com a média de 36.8 °C / 98 F
(+) Em uso inativo, a temperatura média para o lado superior é 27.8 °C / 82 F, em comparação com a média do dispositivo de 29.5 °C / ### class_avg_f### F.
(+) Os apoios para as mãos e o touchpad são mais frios que a temperatura da pele, com um máximo de 26.2 °C / 79.2 F e, portanto, são frios ao toque.
(±) A temperatura média da área do apoio para as mãos de dispositivos semelhantes foi 27.5 °C / 81.5 F (+1.3 °C / 2.3 F).
| Dell Latitude 14 E5470 6440HQ, HD Graphics 530 | Dell Latitude 14 E5470 6300U, HD Graphics 520 | HP ProBook 440 G4-Y8B51EA i7-7500U, GeForce 930MX | Lenovo ThinkPad T460-20FN003LGE 6200U, HD Graphics 520 | Acer TravelMate P648-M-757N 6500U, HD Graphics 520 | |
|---|---|---|---|---|---|
| Heat | 7% | 8% | 5% | 7% | |
| Maximum Upper Side * (°C) | 43 | 41.5 3% | 41.5 3% | 37.3 13% | 38.5 10% |
| Maximum Bottom * (°C) | 43 | 41.4 4% | 38.1 11% | 44.3 -3% | 36.7 15% |
| Idle Upper Side * (°C) | 31.2 | 26.9 14% | 28.4 9% | 29 7% | 31.5 -1% |
| Idle Bottom * (°C) | 31.3 | 29.6 5% | 28.3 10% | 30.1 4% | 29.6 5% |
* ... menor é melhor
Dell Latitude 14 E5470 análise de áudio
(±) | o volume do alto-falante é médio, mas bom (###valor### dB)
Graves 100 - 315Hz
(-) | quase nenhum baixo - em média 16.2% menor que a mediana
(+) | o baixo é linear (4.3% delta para a frequência anterior)
Médios 400 - 2.000 Hz
(±) | médios mais altos - em média 5.3% maior que a mediana
(+) | médios são lineares (5.2% delta para frequência anterior)
Altos 2 - 16 kHz
(±) | máximos mais altos - em média 6.8% maior que a mediana
(+) | os máximos são lineares (2.9% delta da frequência anterior)
Geral 100 - 16.000 Hz
(±) | a linearidade do som geral é média (19.7% diferença em relação à mediana)
Comparado com a mesma classe
» 41% de todos os dispositivos testados nesta classe foram melhores, 8% semelhantes, 52% piores
» O melhor teve um delta de 7%, a média foi 21%, o pior foi 53%
Comparado com todos os dispositivos testados
» 50% de todos os dispositivos testados foram melhores, 7% semelhantes, 43% piores
» O melhor teve um delta de 4%, a média foi 24%, o pior foi 134%
Apple MacBook 12 (Early 2016) 1.1 GHz análise de áudio
(+) | os alto-falantes podem tocar relativamente alto (###valor### dB)
Graves 100 - 315Hz
(±) | graves reduzidos - em média 11.3% menor que a mediana
(±) | a linearidade dos graves é média (14.2% delta para a frequência anterior)
Médios 400 - 2.000 Hz
(+) | médios equilibrados - apenas 2.4% longe da mediana
(+) | médios são lineares (5.5% delta para frequência anterior)
Altos 2 - 16 kHz
(+) | agudos equilibrados - apenas 2% longe da mediana
(+) | os máximos são lineares (4.5% delta da frequência anterior)
Geral 100 - 16.000 Hz
(+) | o som geral é linear (10.2% diferença em relação à mediana)
Comparado com a mesma classe
» 7% de todos os dispositivos testados nesta classe foram melhores, 2% semelhantes, 91% piores
» O melhor teve um delta de 5%, a média foi 18%, o pior foi 53%
Comparado com todos os dispositivos testados
» 5% de todos os dispositivos testados foram melhores, 1% semelhantes, 94% piores
» O melhor teve um delta de 4%, a média foi 24%, o pior foi 134%
| desligado | |
| Ocioso | |
| Carga |
|
Key:
min: | |
| Dell Latitude 14 E5470 6440HQ, HD Graphics 530, Micron SSD 1100 (MTFDDAV256TBN) | Dell Latitude 14 E5470 6300U, HD Graphics 520, Liteon L8H-256V2G | HP ProBook 440 G4-Y8B51EA i7-7500U, GeForce 930MX, SanDisk SD8SNAT256G1002 | Lenovo ThinkPad T460-20FN003LGE 6200U, HD Graphics 520, Toshiba HG6 THNSFJ256GCSU | Acer TravelMate P648-M-757N 6500U, HD Graphics 520, Lite-On CV1-8B256 | |
|---|---|---|---|---|---|
| Power Consumption | 29% | 14% | 23% | -0% | |
| Idle Minimum * (Watt) | 4.1 | 3.5 15% | 3 27% | 3.5 15% | 5.3 -29% |
| Idle Average * (Watt) | 8.1 | 5.3 35% | 5.4 33% | 6.7 17% | 9.3 -15% |
| Idle Maximum * (Watt) | 11.4 | 6 47% | 6.3 45% | 7.3 36% | 11.5 -1% |
| Load Average * (Watt) | 33.5 | 26.3 21% | 37.5 -12% | 28.2 16% | 30.8 8% |
| Load Maximum * (Watt) | 49 | 36.6 25% | 61.1 -25% | 34.6 29% | 32 35% |
* ... menor é melhor
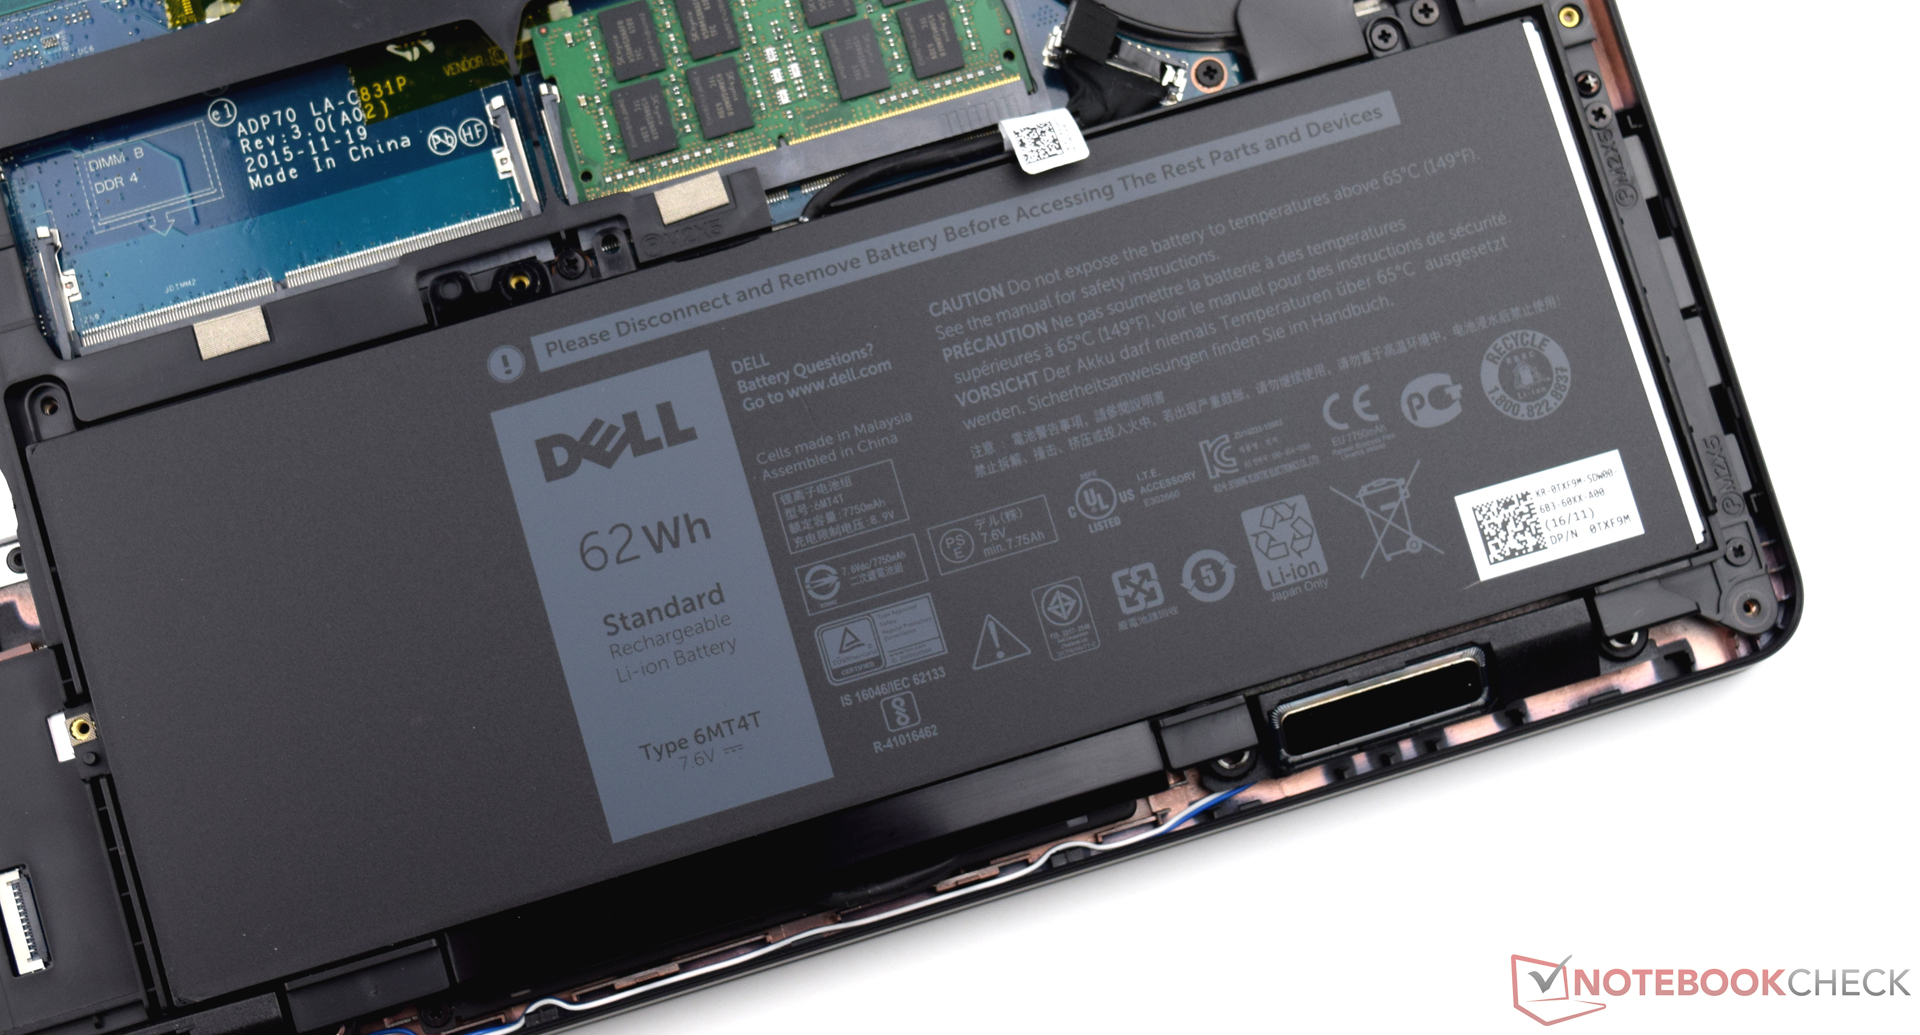
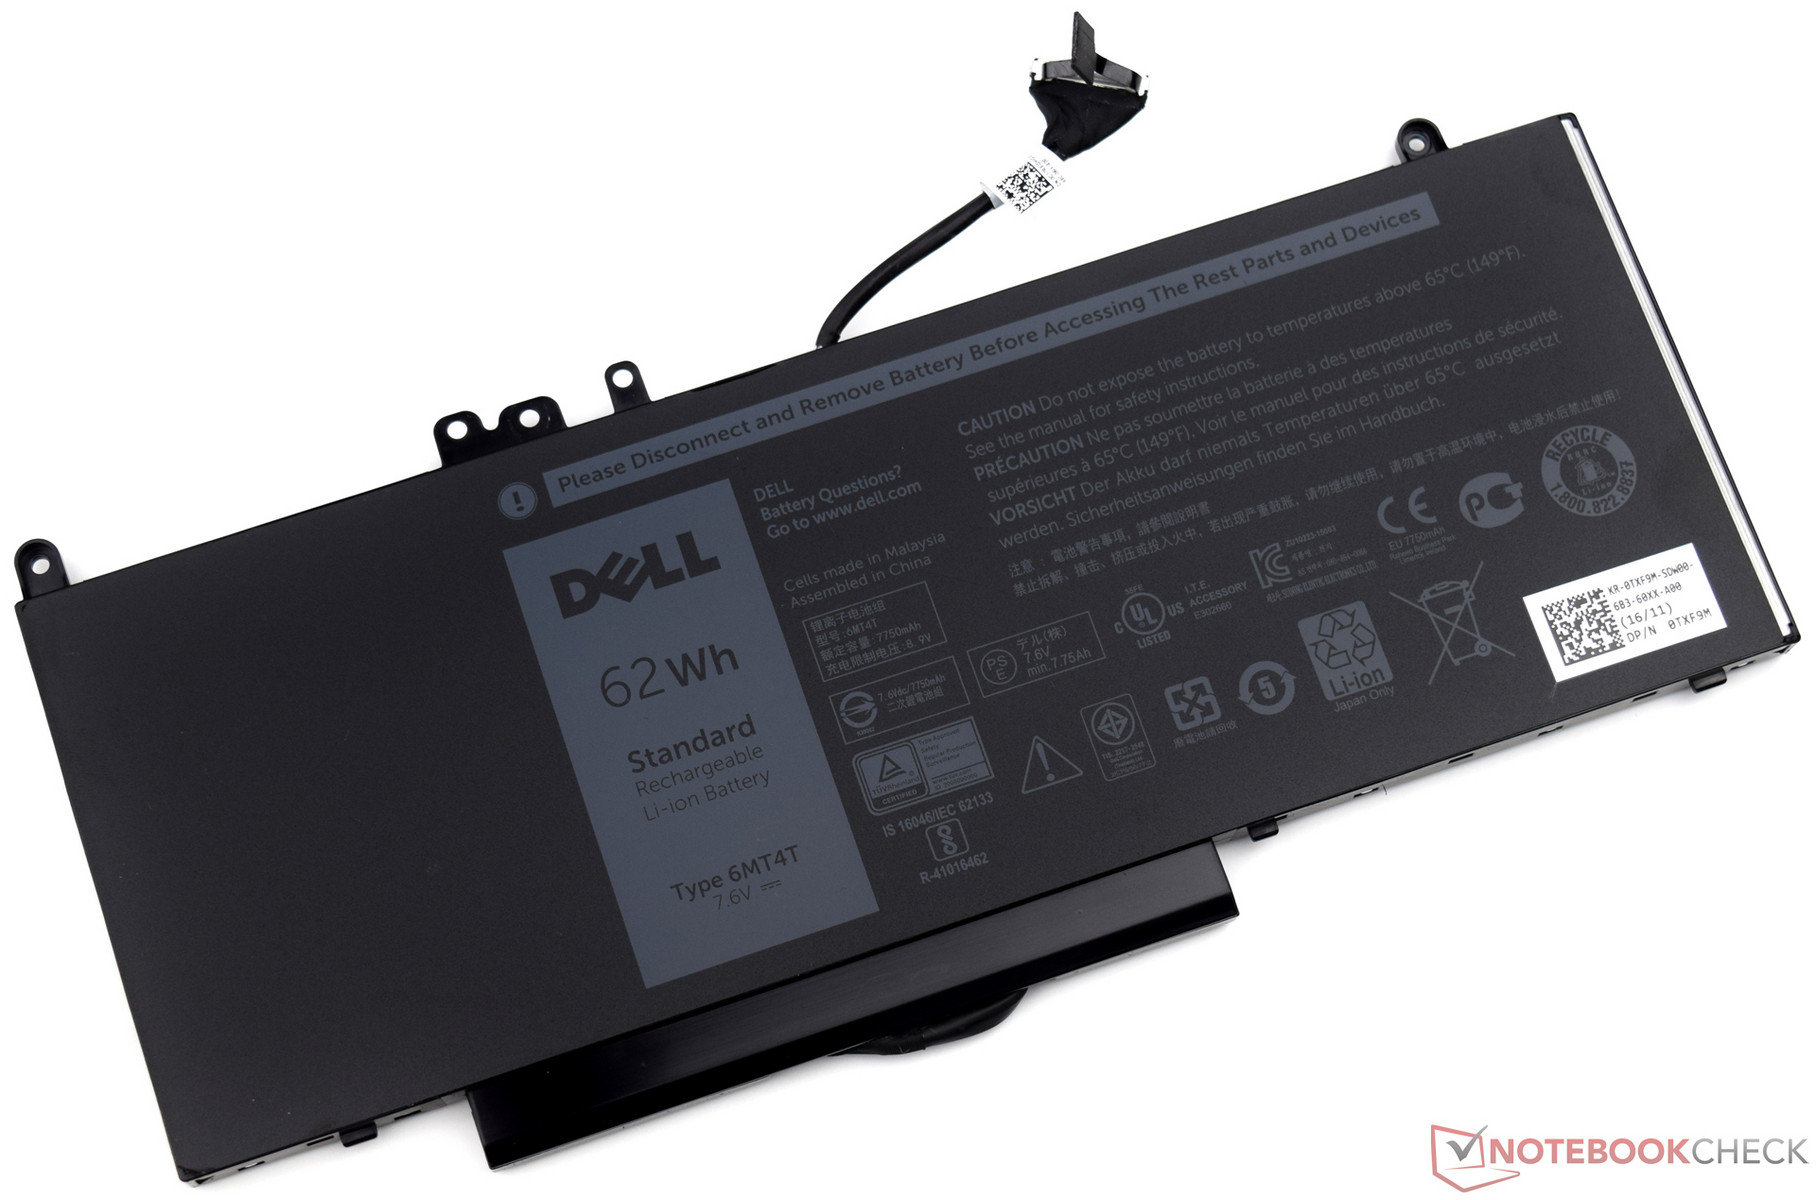

| Dell Latitude 14 E5470 6440HQ, HD Graphics 530, 62 Wh | Dell Latitude 14 E5470 6300U, HD Graphics 520, 62 Wh | HP ProBook 440 G4-Y8B51EA i7-7500U, GeForce 930MX, 48 Wh | Lenovo ThinkPad T460-20FN003LGE 6200U, HD Graphics 520, 46 Wh | Acer TravelMate P648-M-757N 6500U, HD Graphics 520, 54 Wh | |
|---|---|---|---|---|---|
| Duração da bateria | 65% | 33% | 5% | 27% | |
| Reader / Idle (h) | 15.2 | 21.7 43% | 18.1 19% | 15.9 5% | 18.1 19% |
| H.264 (h) | 6.9 | 10.8 57% | 9.5 38% | 8.5 23% | 9.1 32% |
| WiFi v1.3 (h) | 7.2 | 11.1 54% | 6.9 -4% | 5.6 -22% | 9.1 26% |
| Load (h) | 1.4 | 2.9 107% | 2.5 79% | 1.6 14% | 1.8 29% |
Pro
Contra

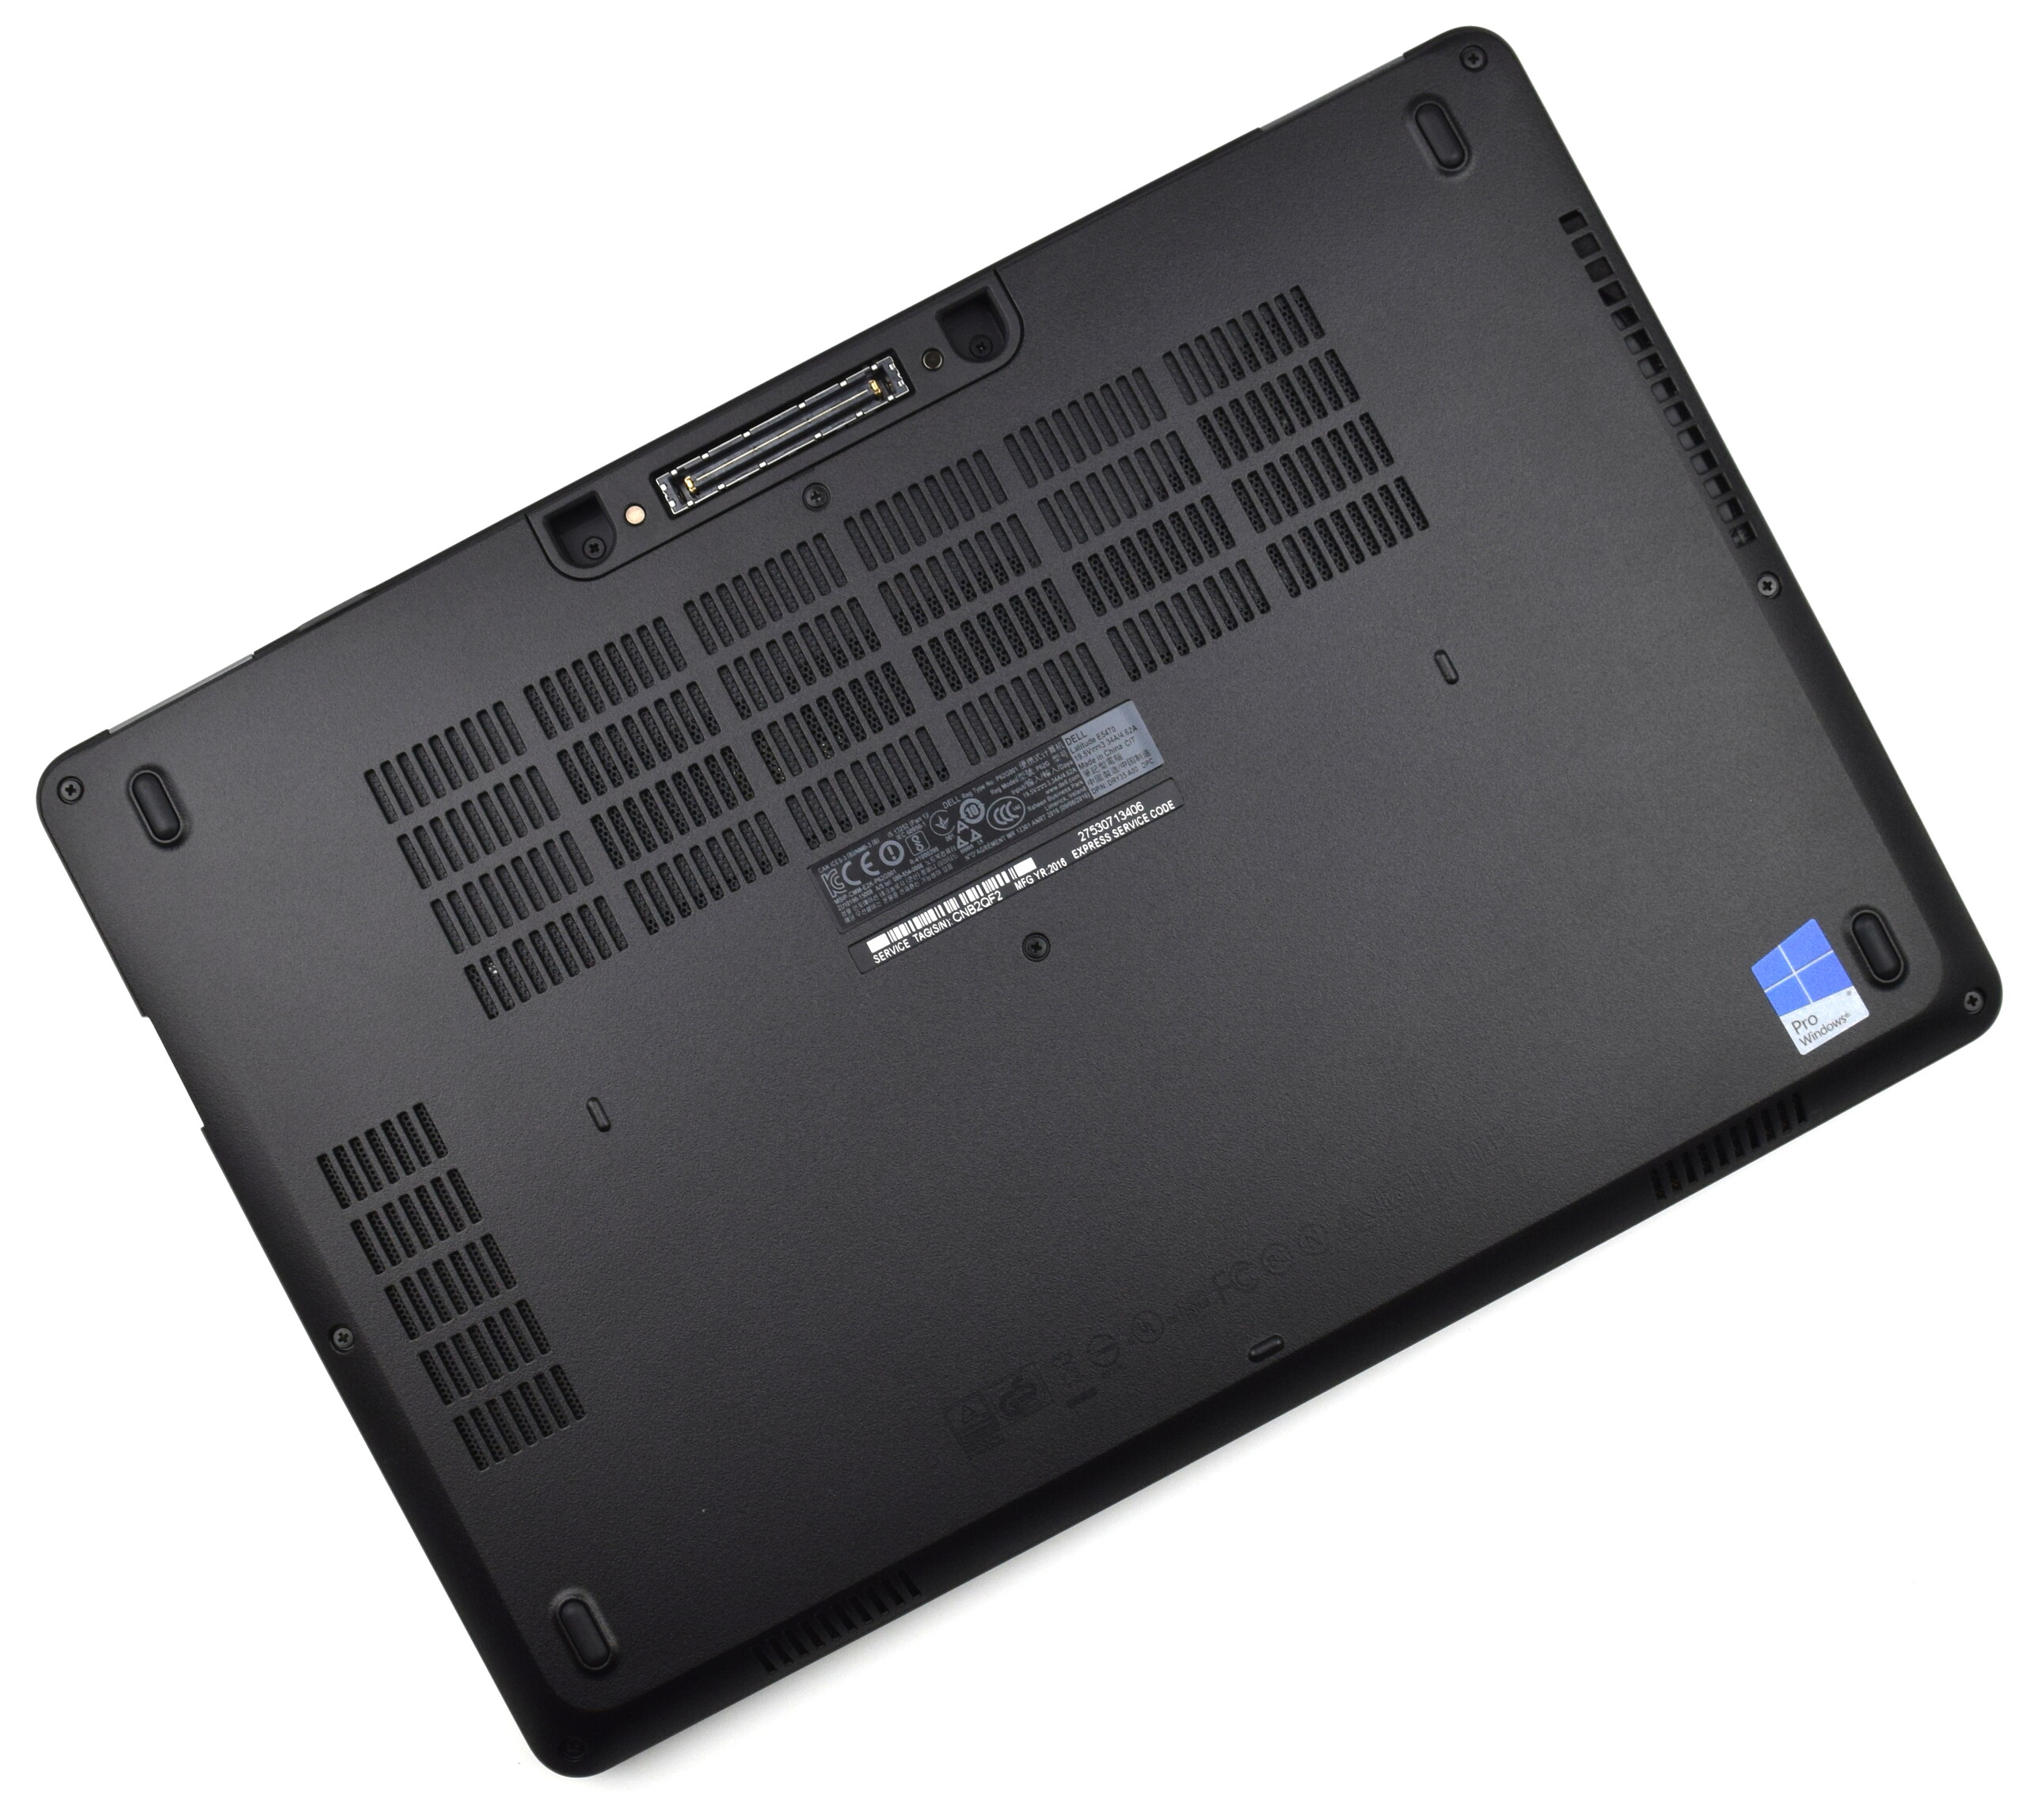
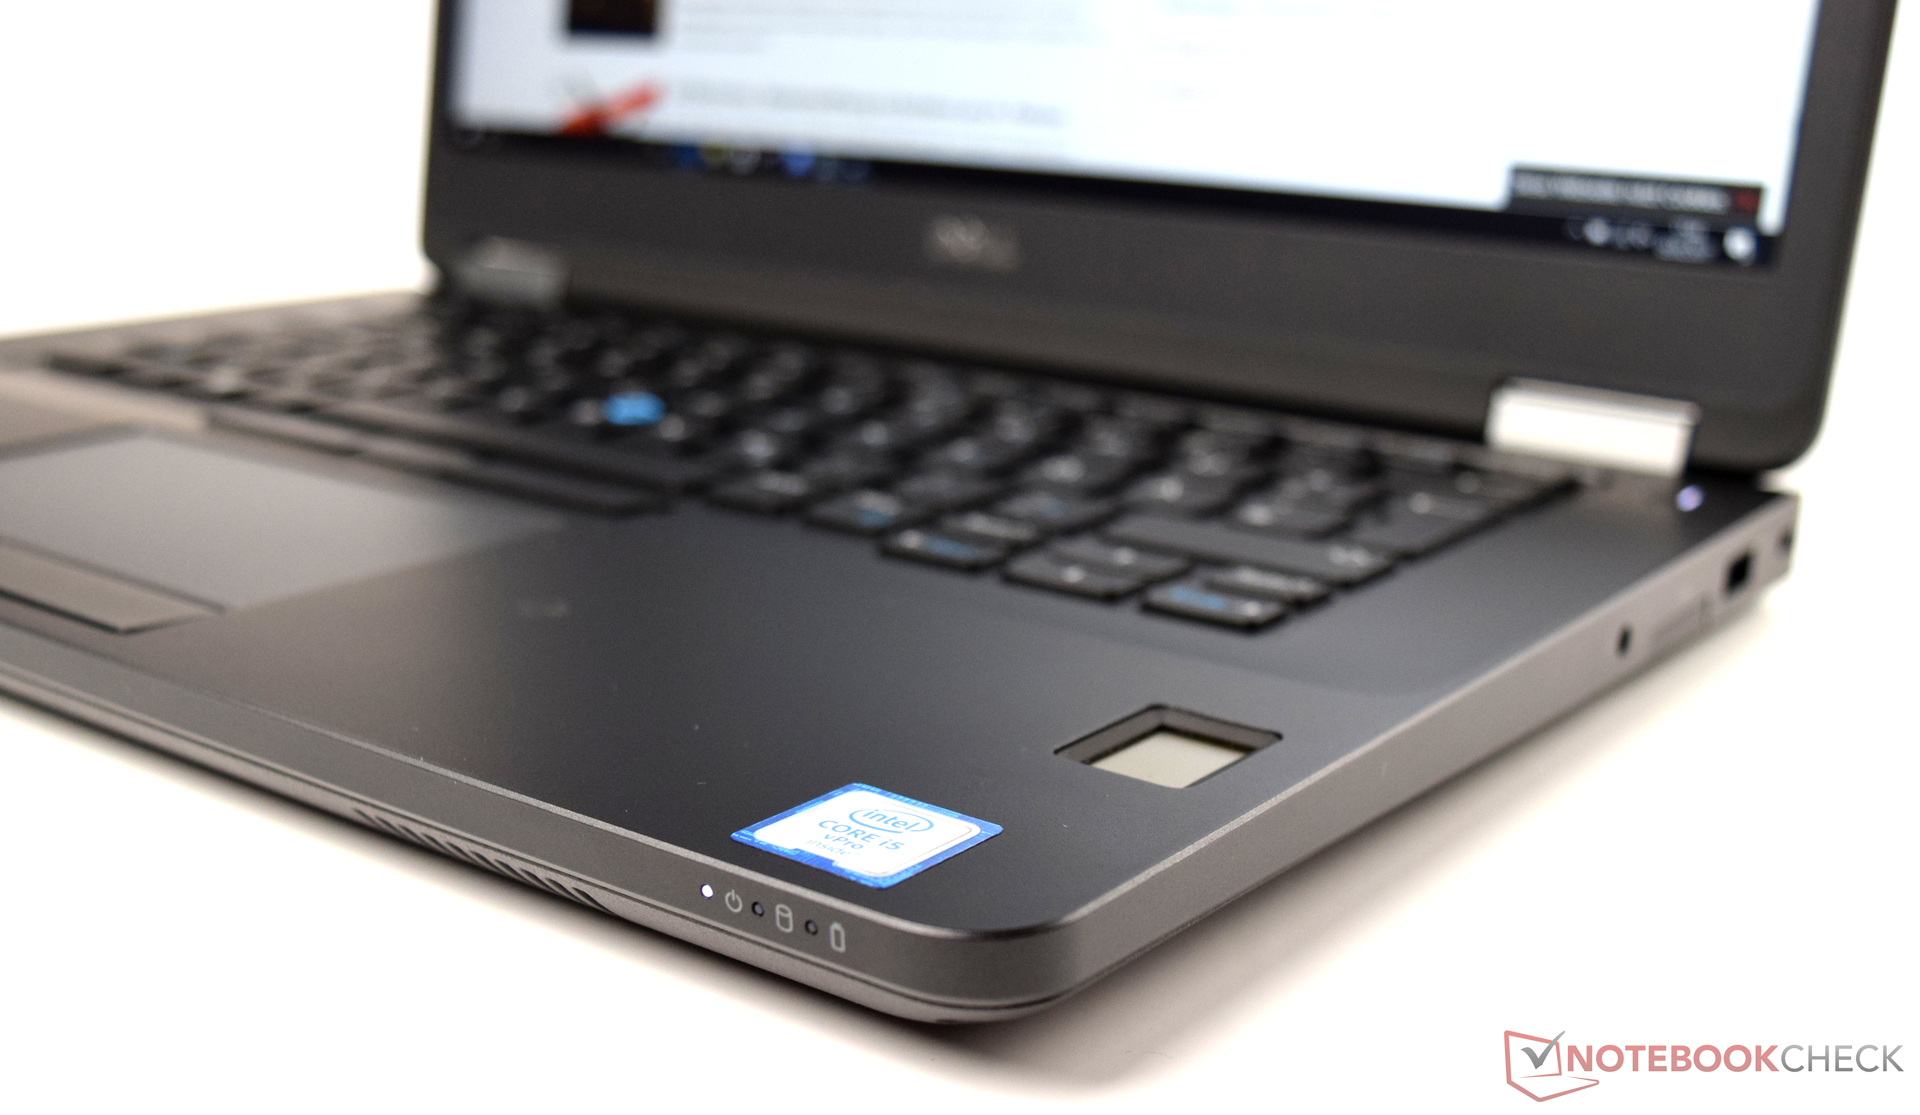
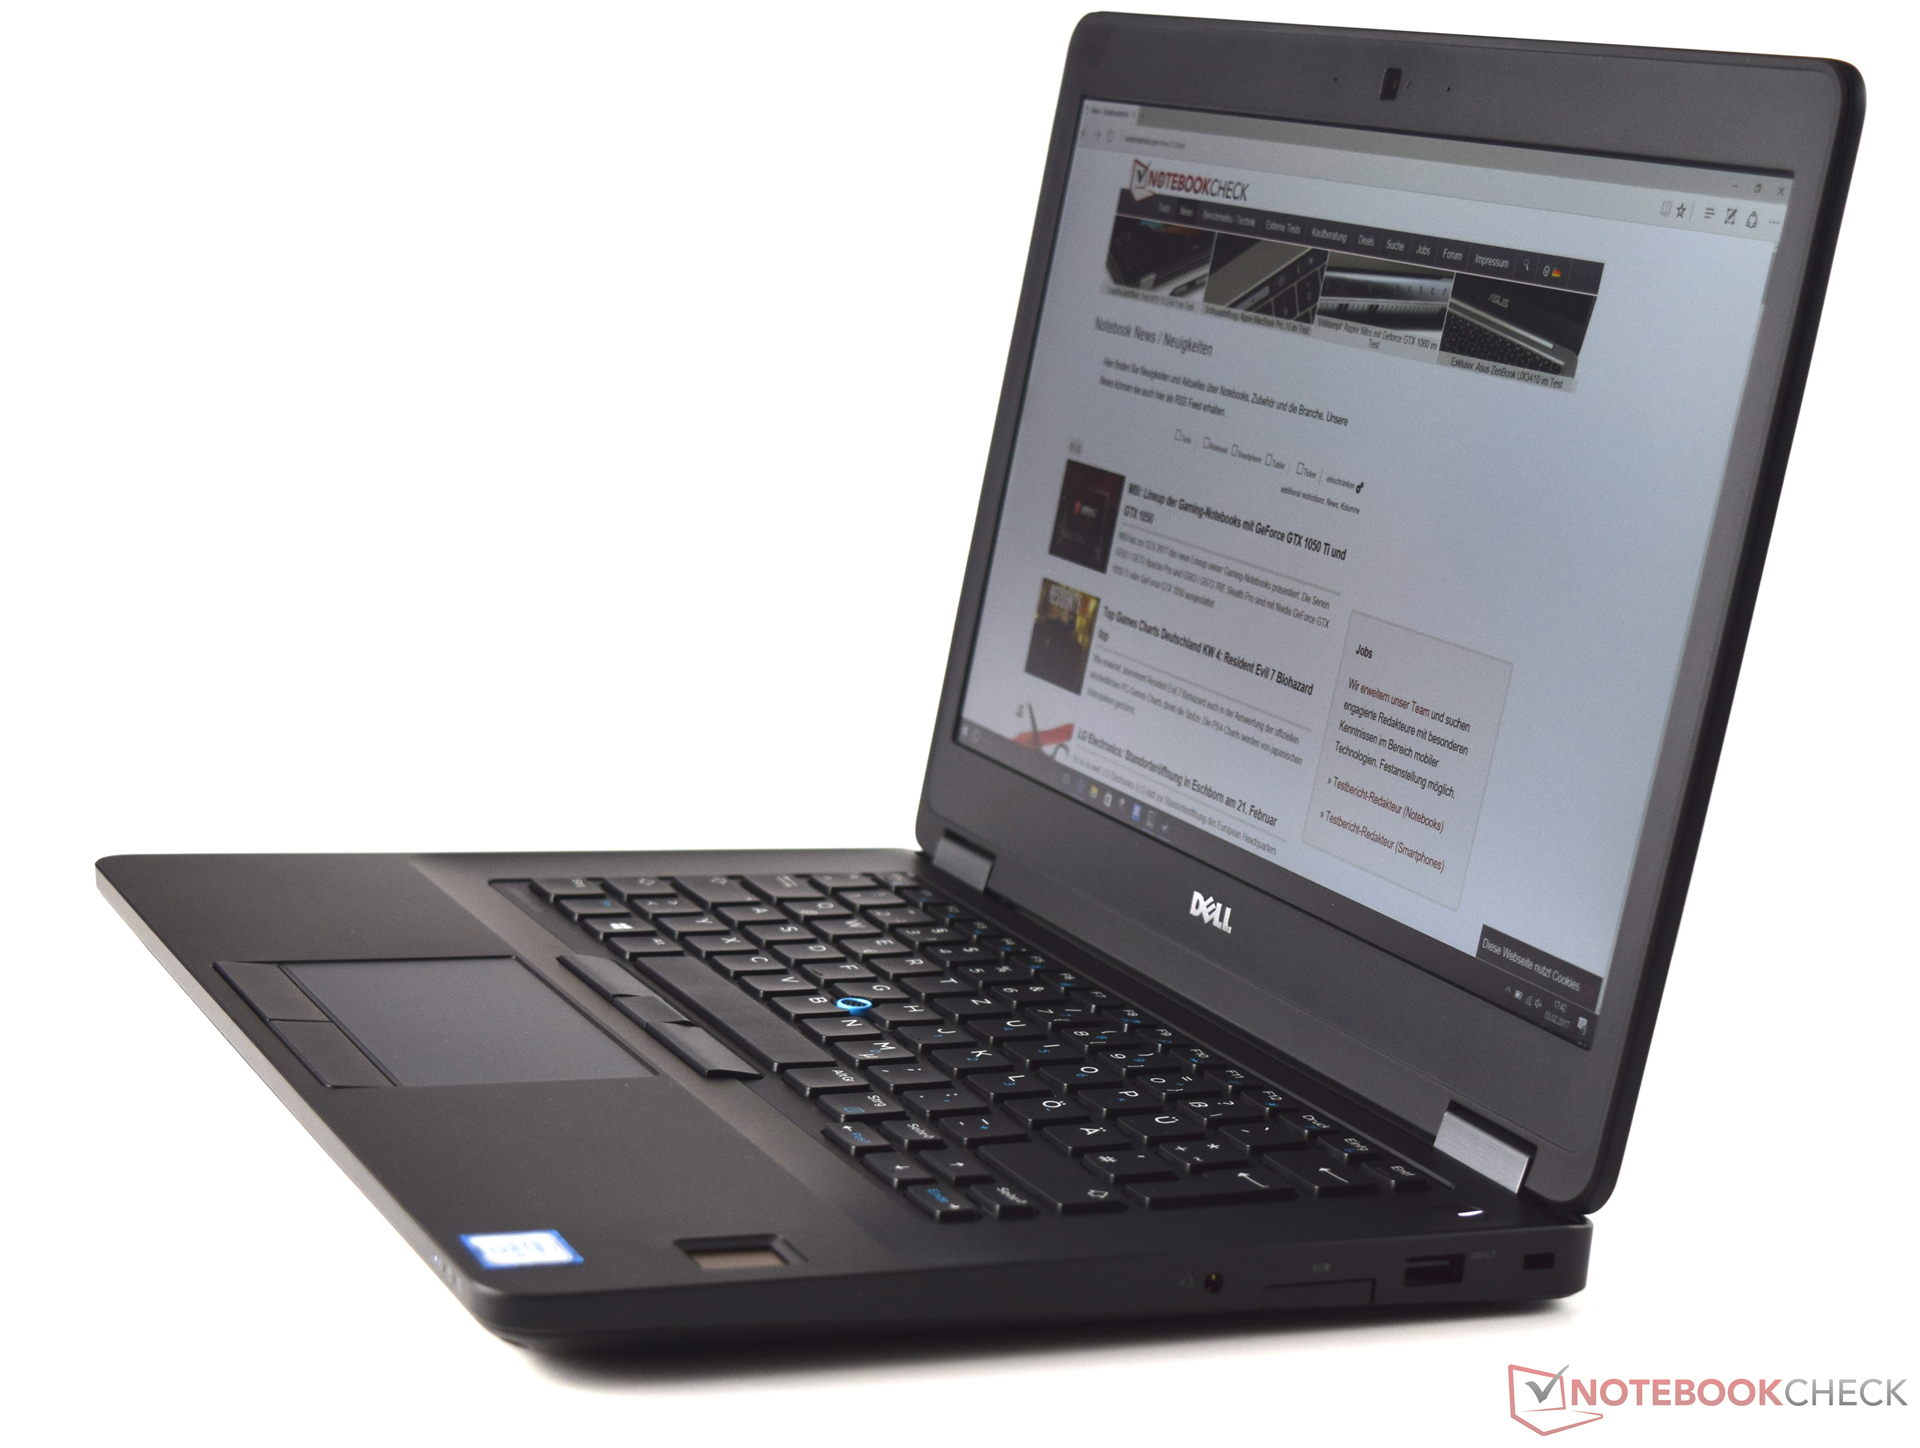
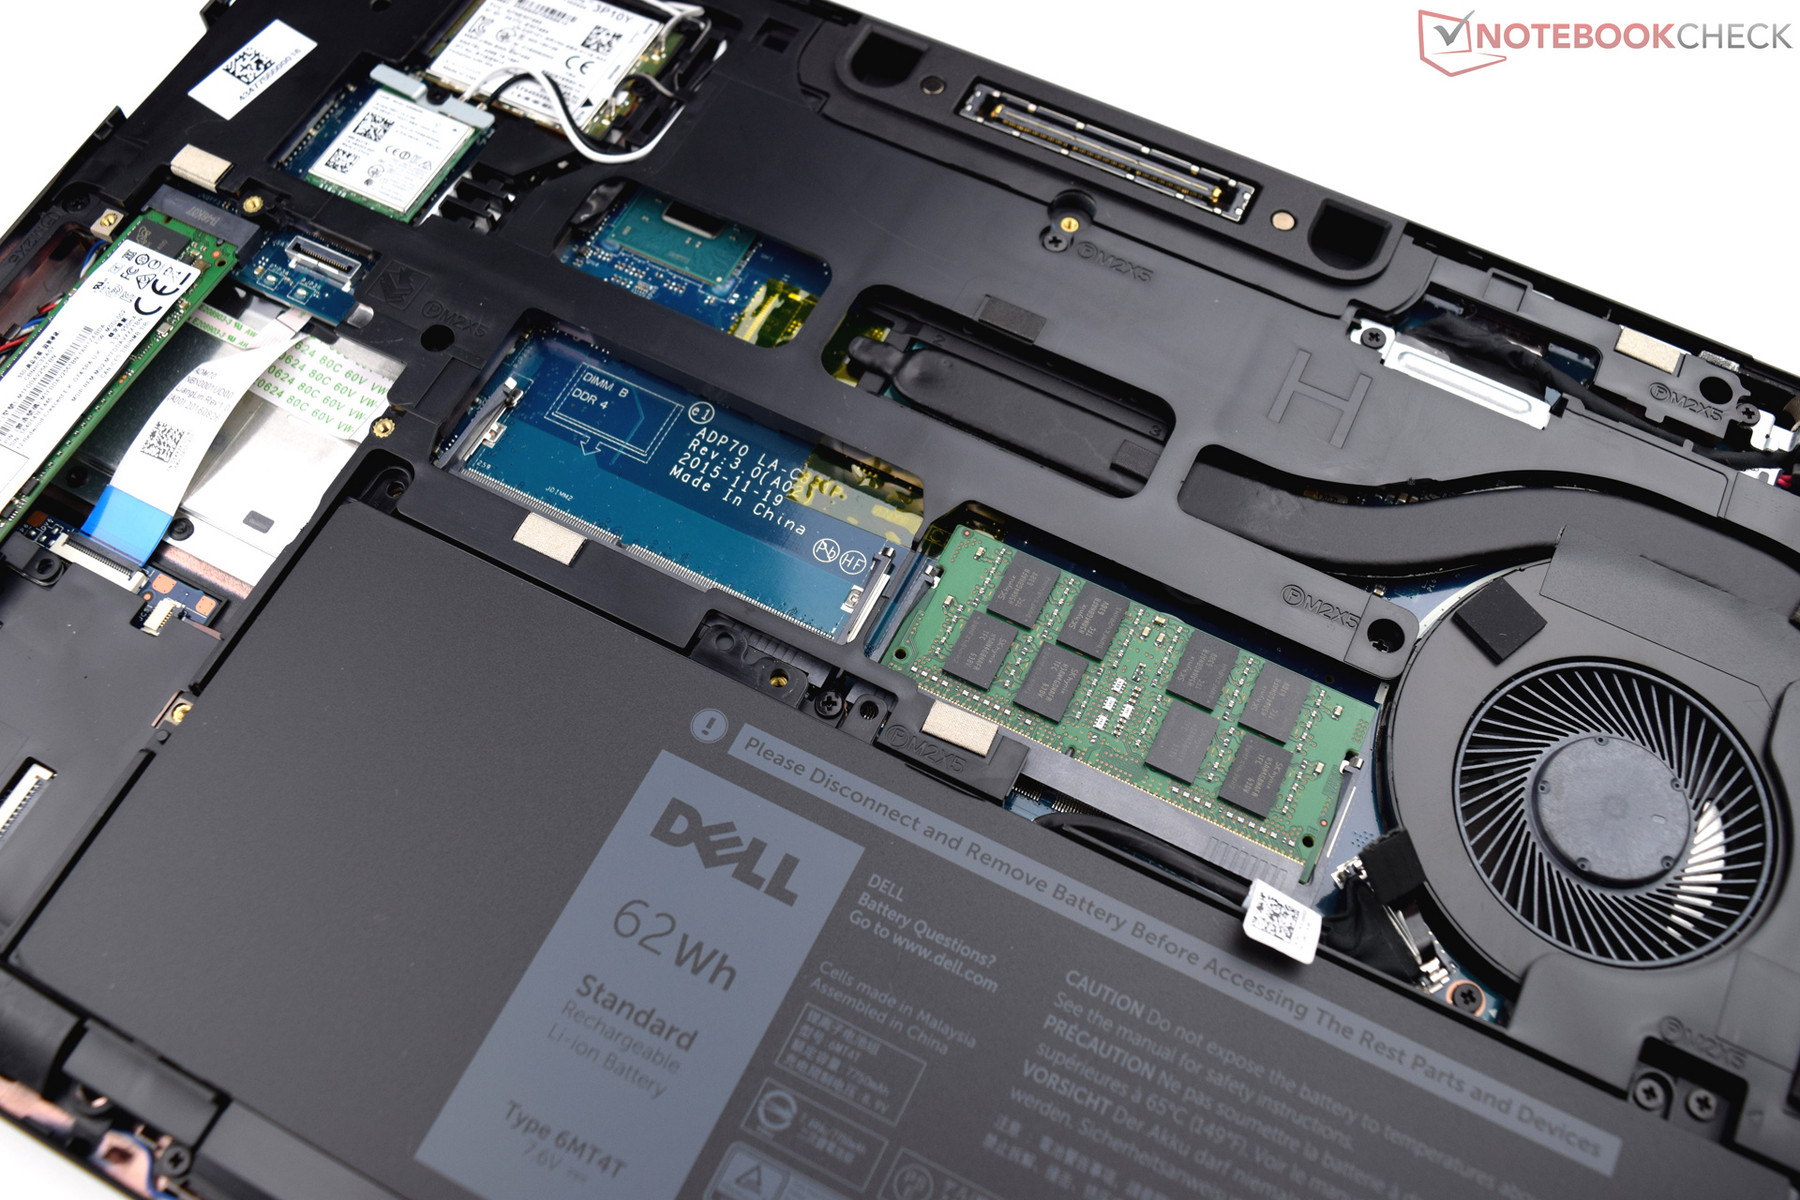
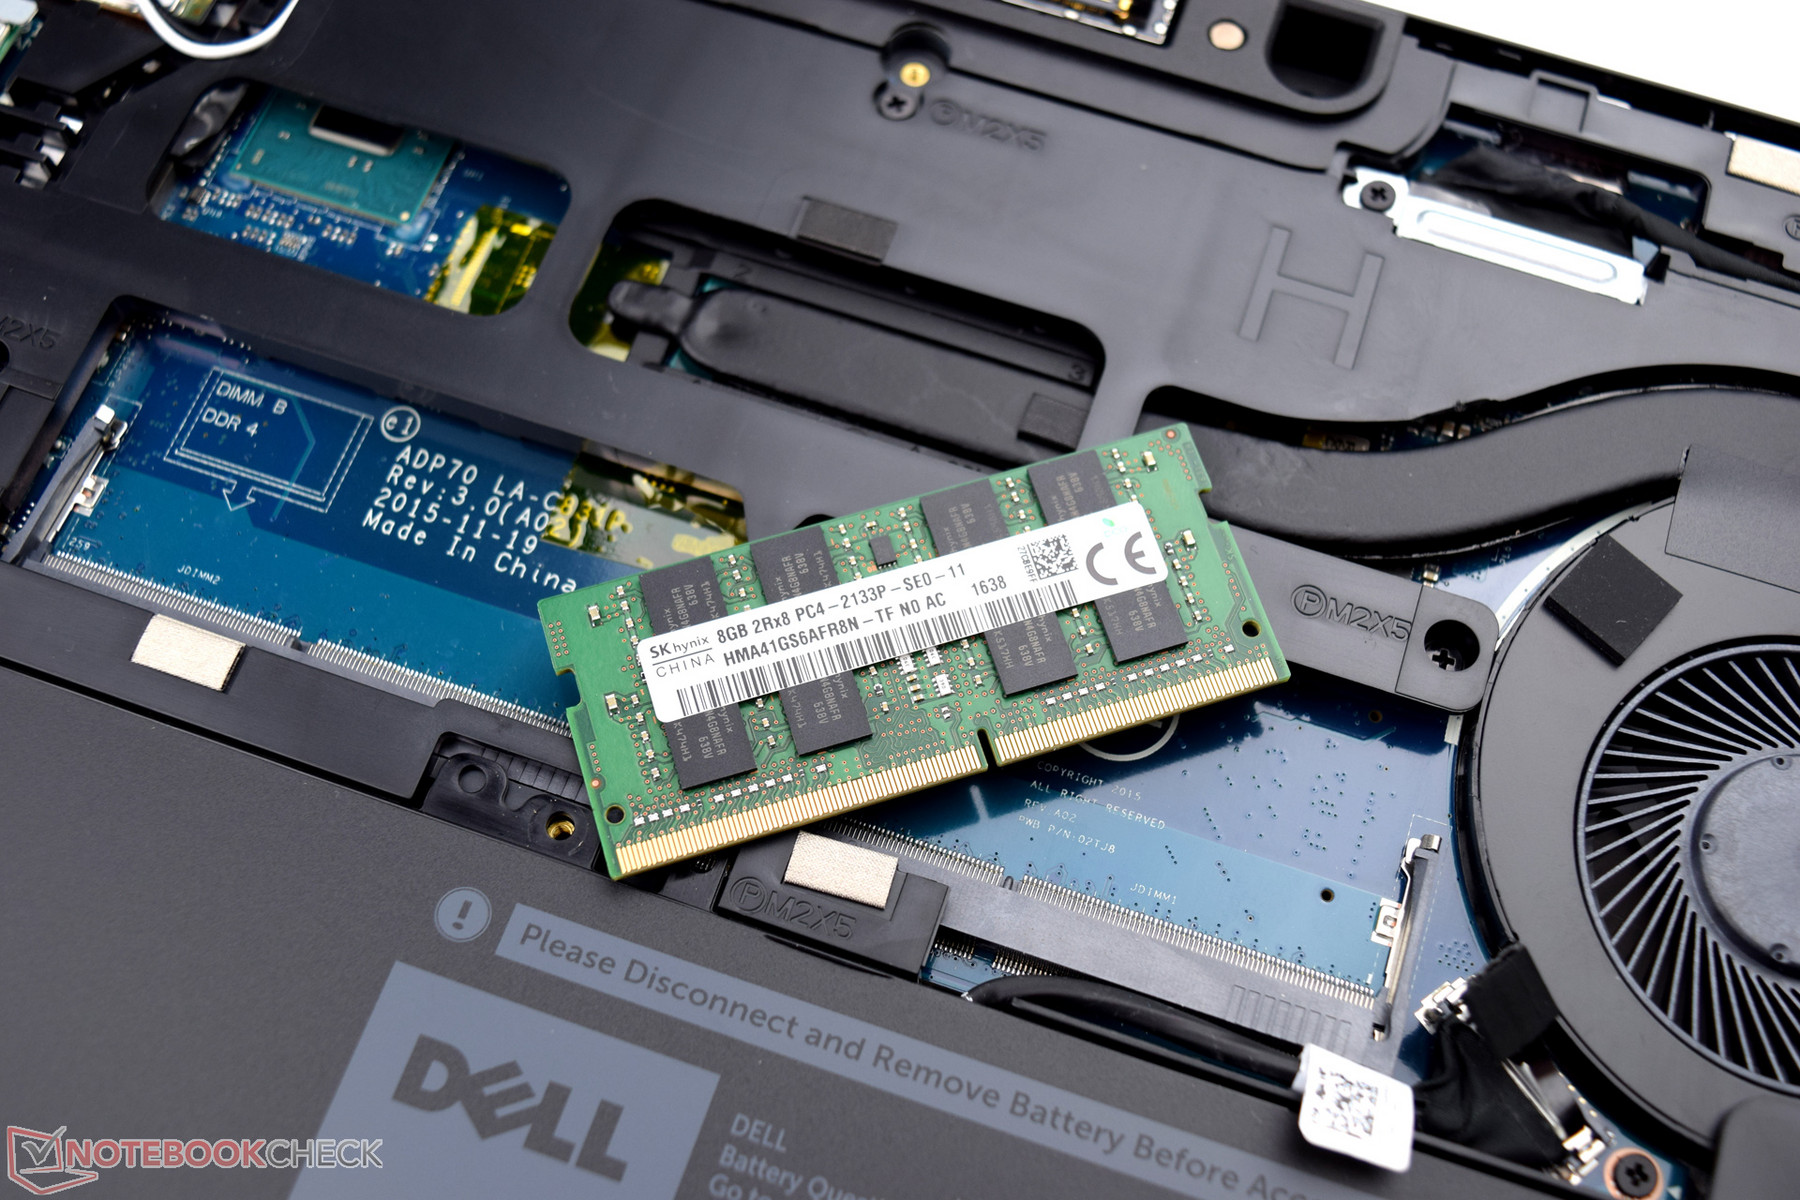
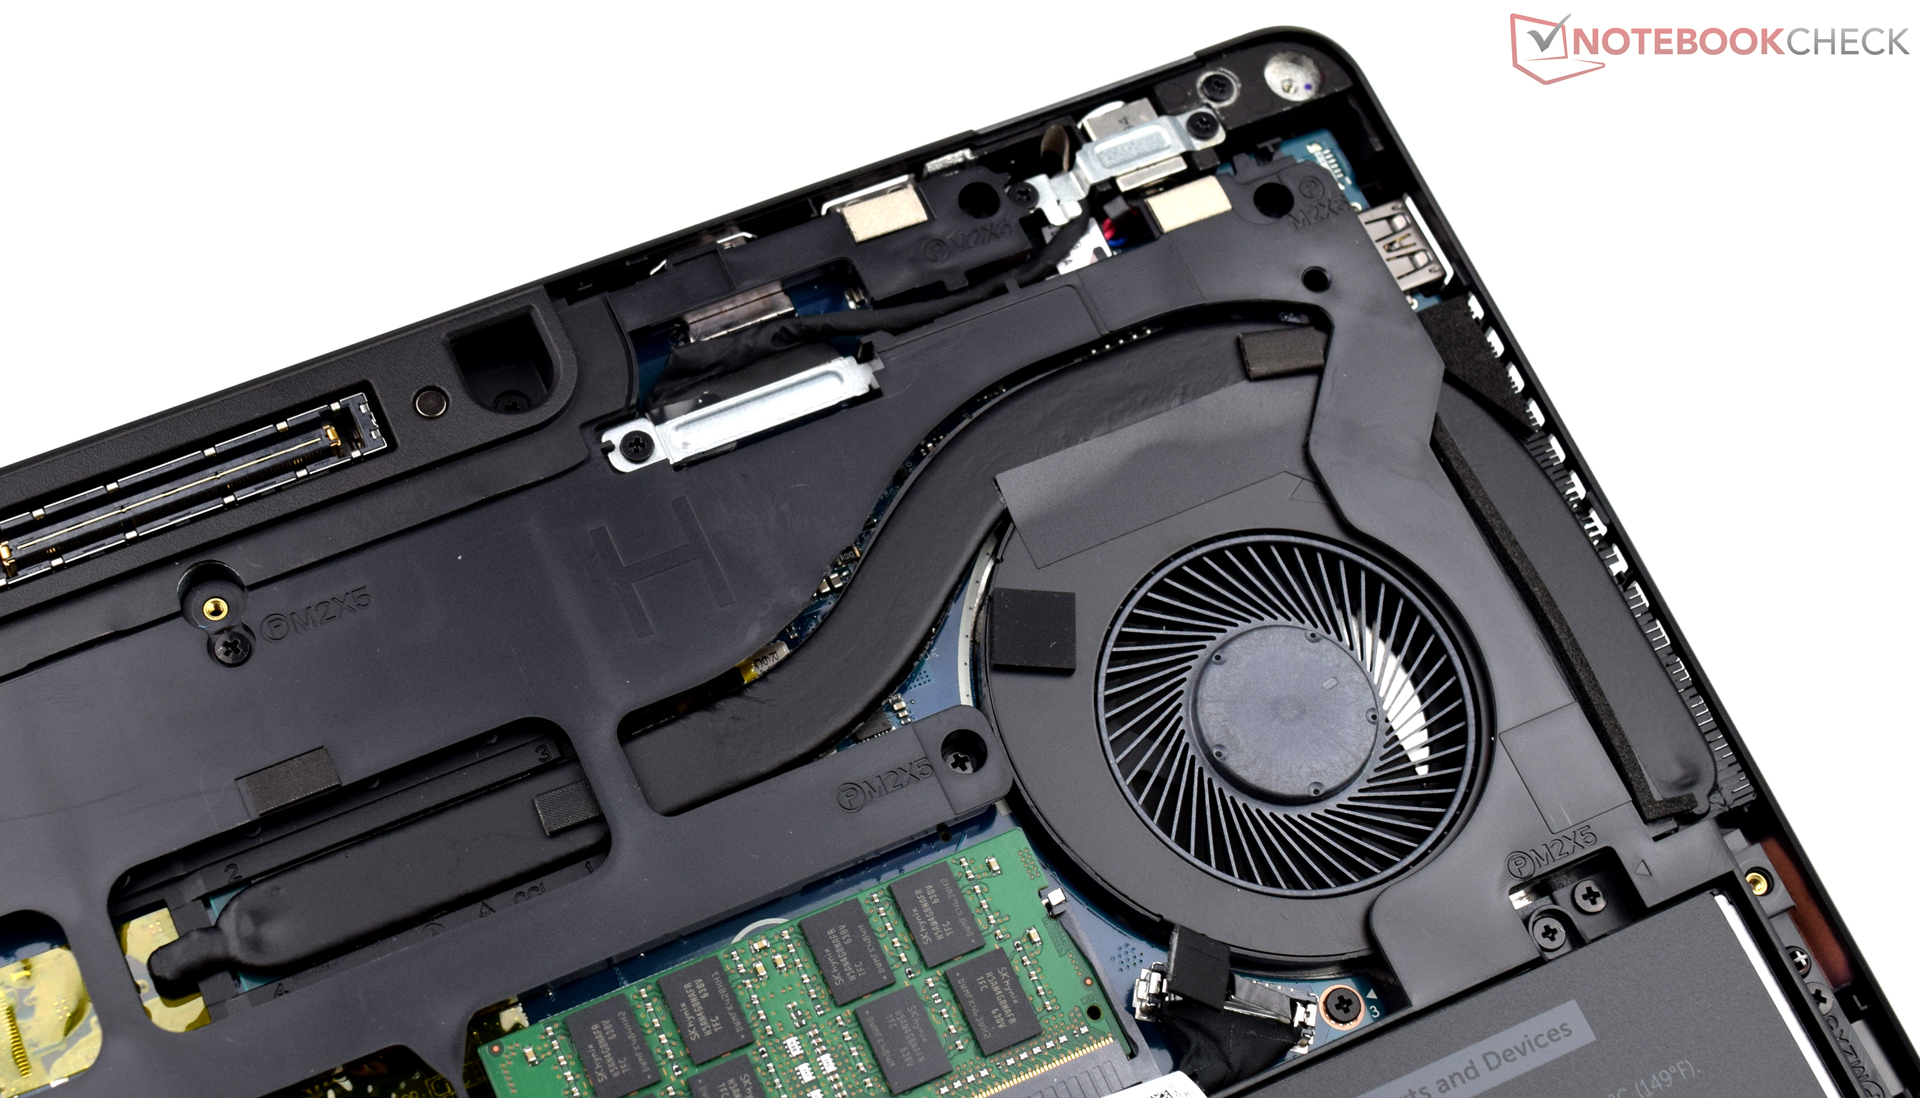
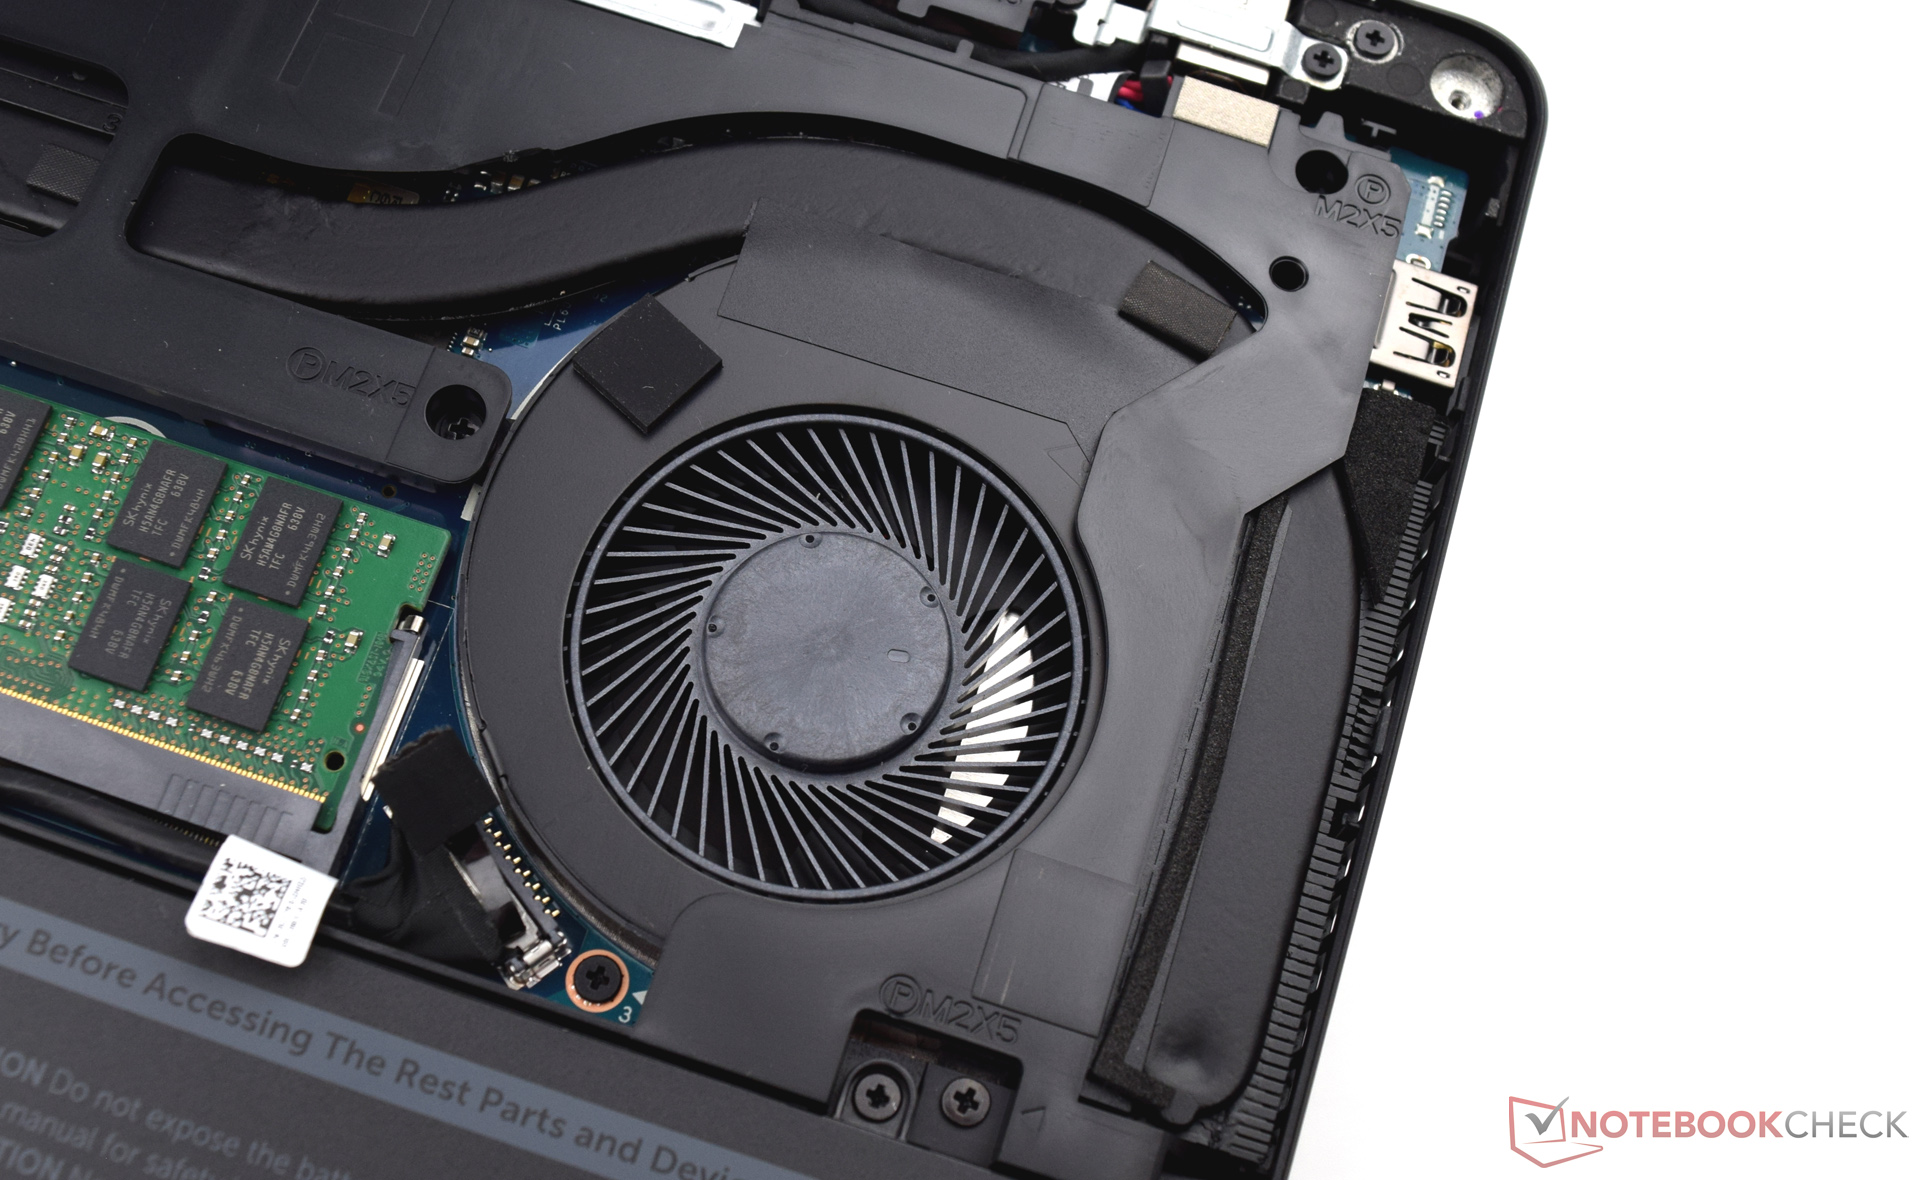
A Dell apresenta um portátil muito bem construído com bom poder de cômputo. Embora um processador Skylake um pouco antigo ainda funcione dentro do Dell Latitude 14 E5470, os mais recentes processadores Kaby Lake algumas vezes são superados. Quatro núcleos físicos são simplesmente mais eficientes quando os aplicativos têm suporte para multitarefa. A combinação do potente processador, 8 GB de memória de trabalho e um SSD de 256 GB garantem um sistema fluente.
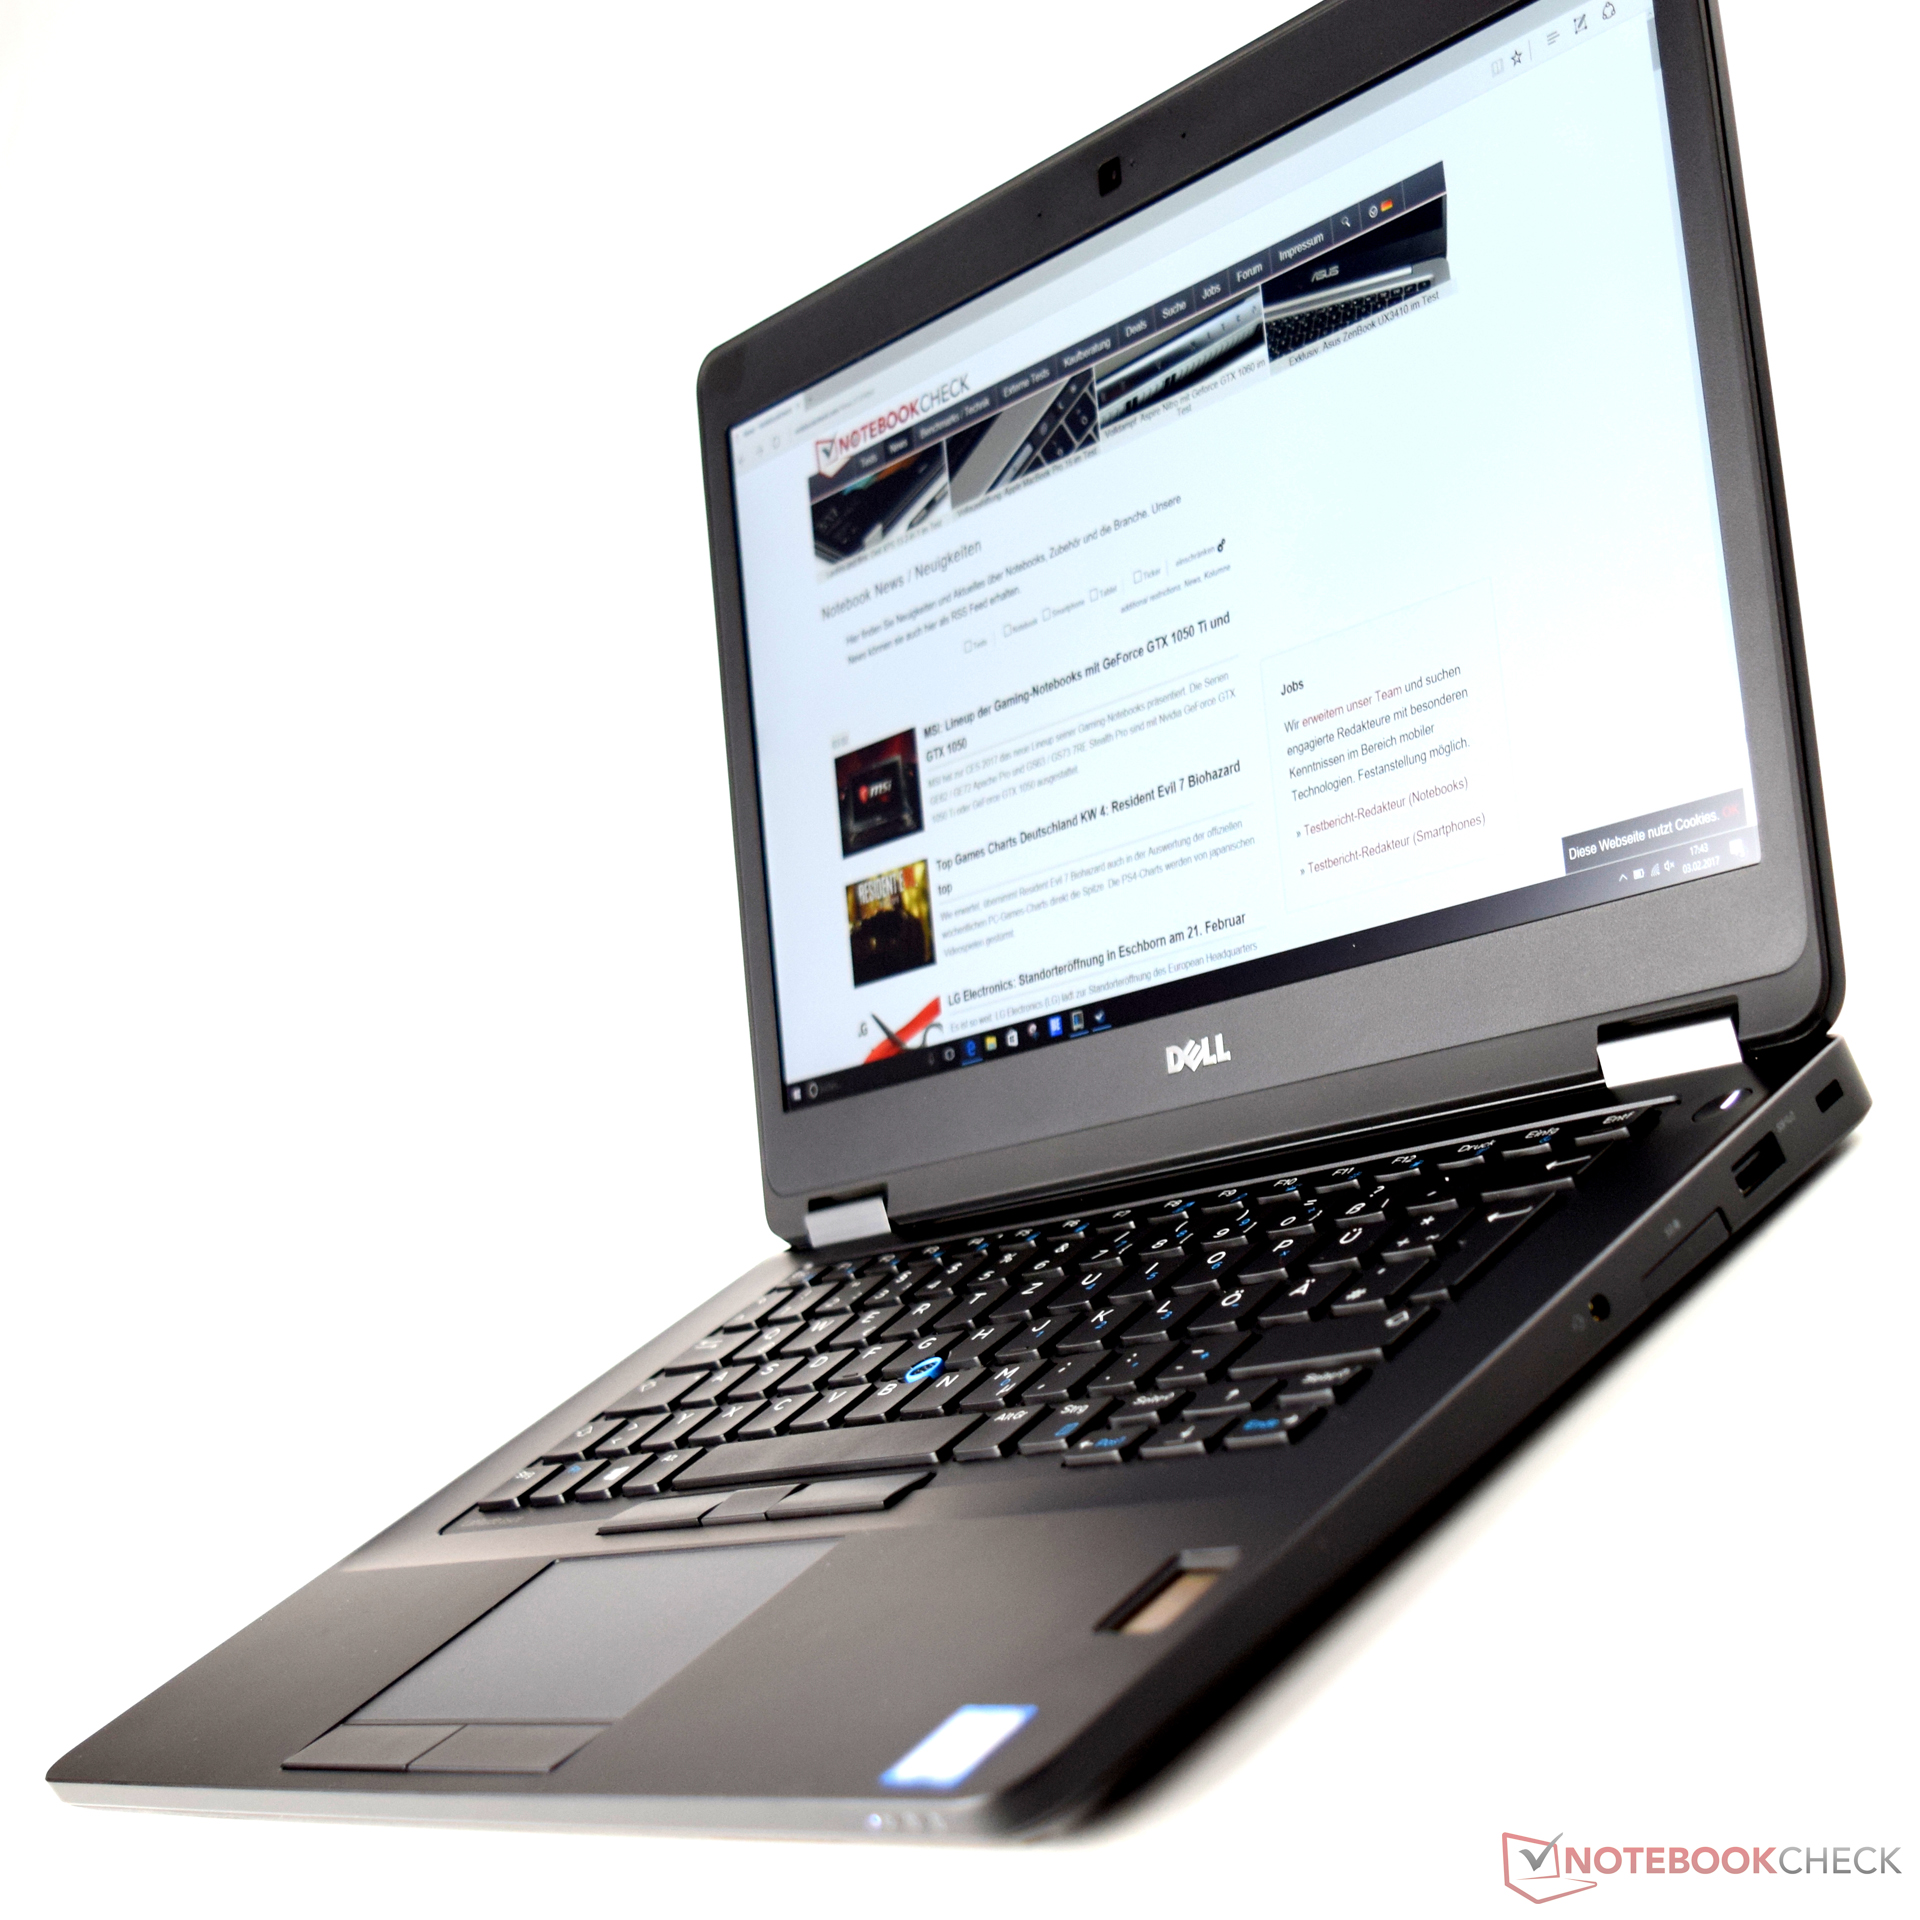
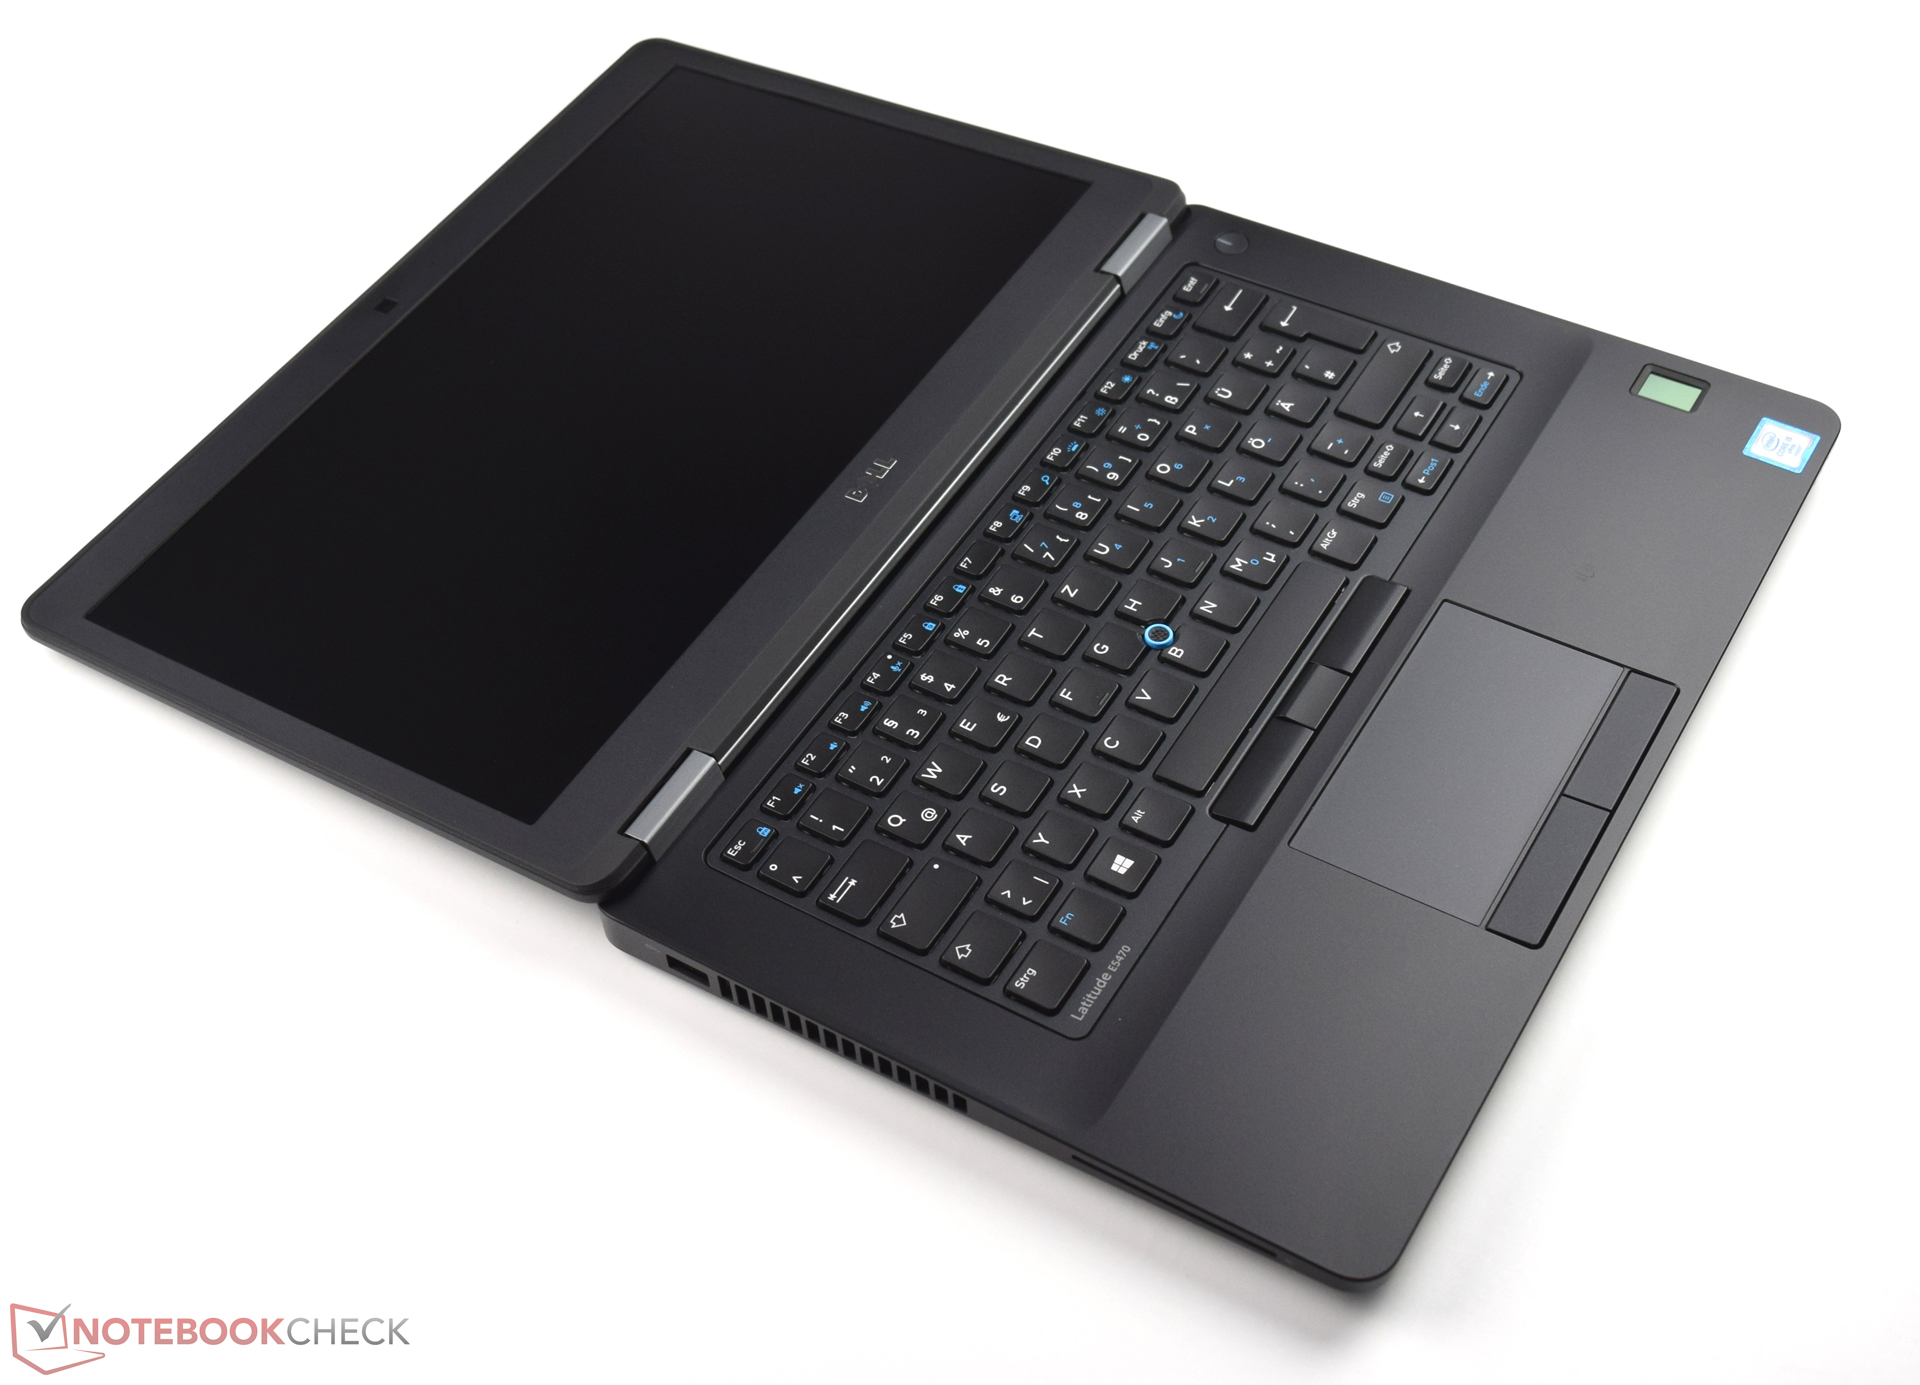
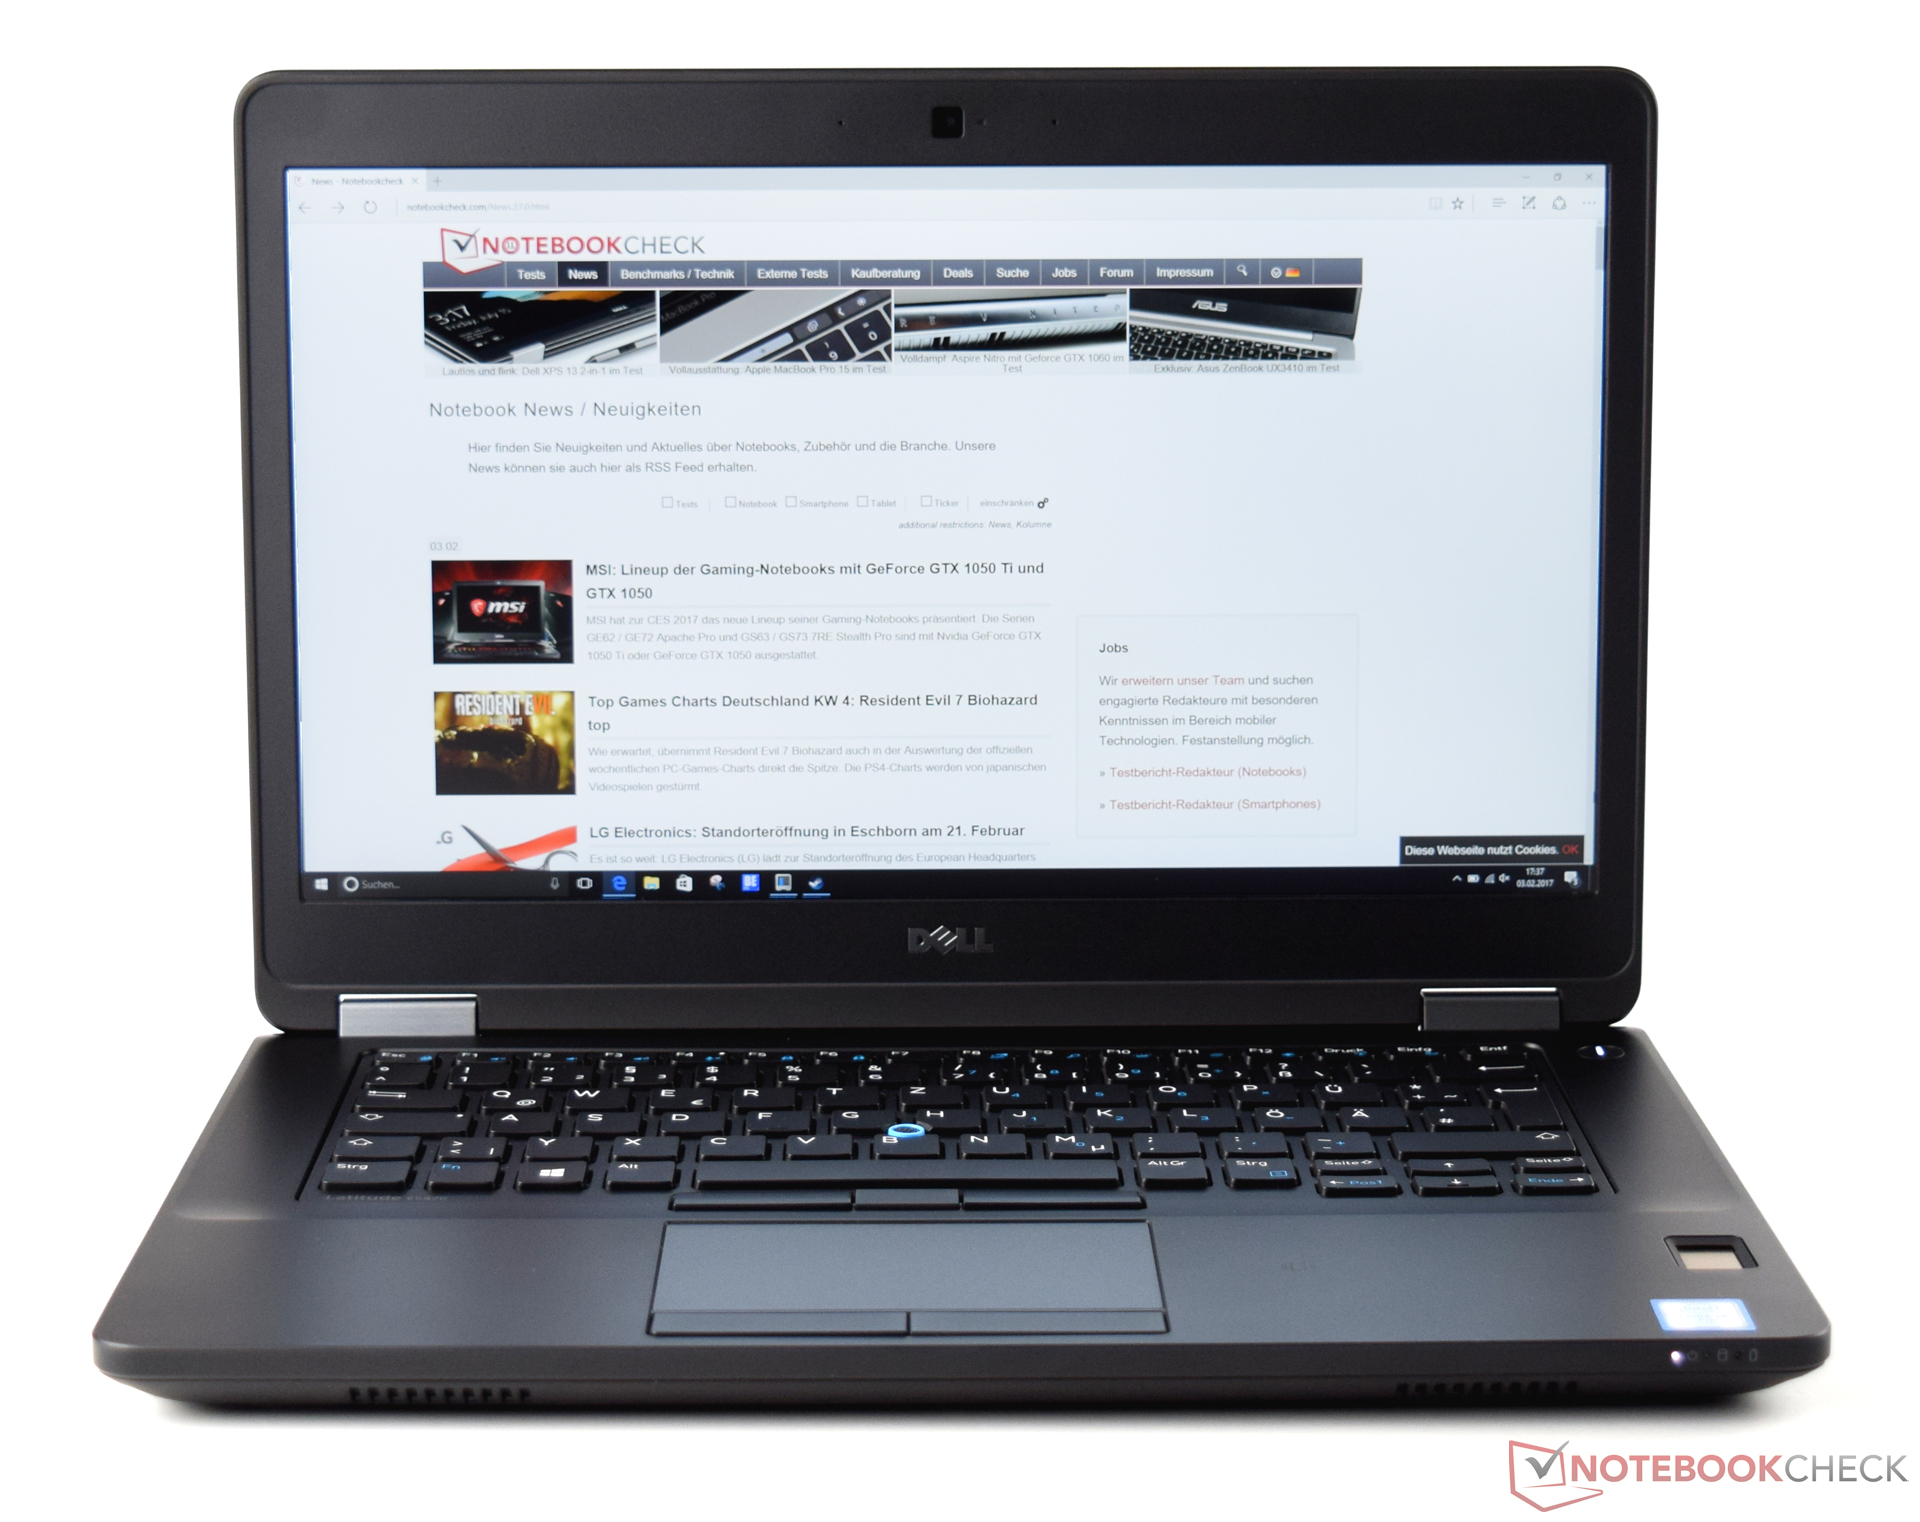
O Dell Latitude 14 E5470 nos convenceu com o seu bom desempenho do sistema no teste. Os dispositivos de entrada, a sólida e elegante carcaça e uma construção de alta qualidade são feitos para uma longa vida útil. Vários recursos de segurança e os úteis acessórios podem facilitar a futura rotina do escritório.
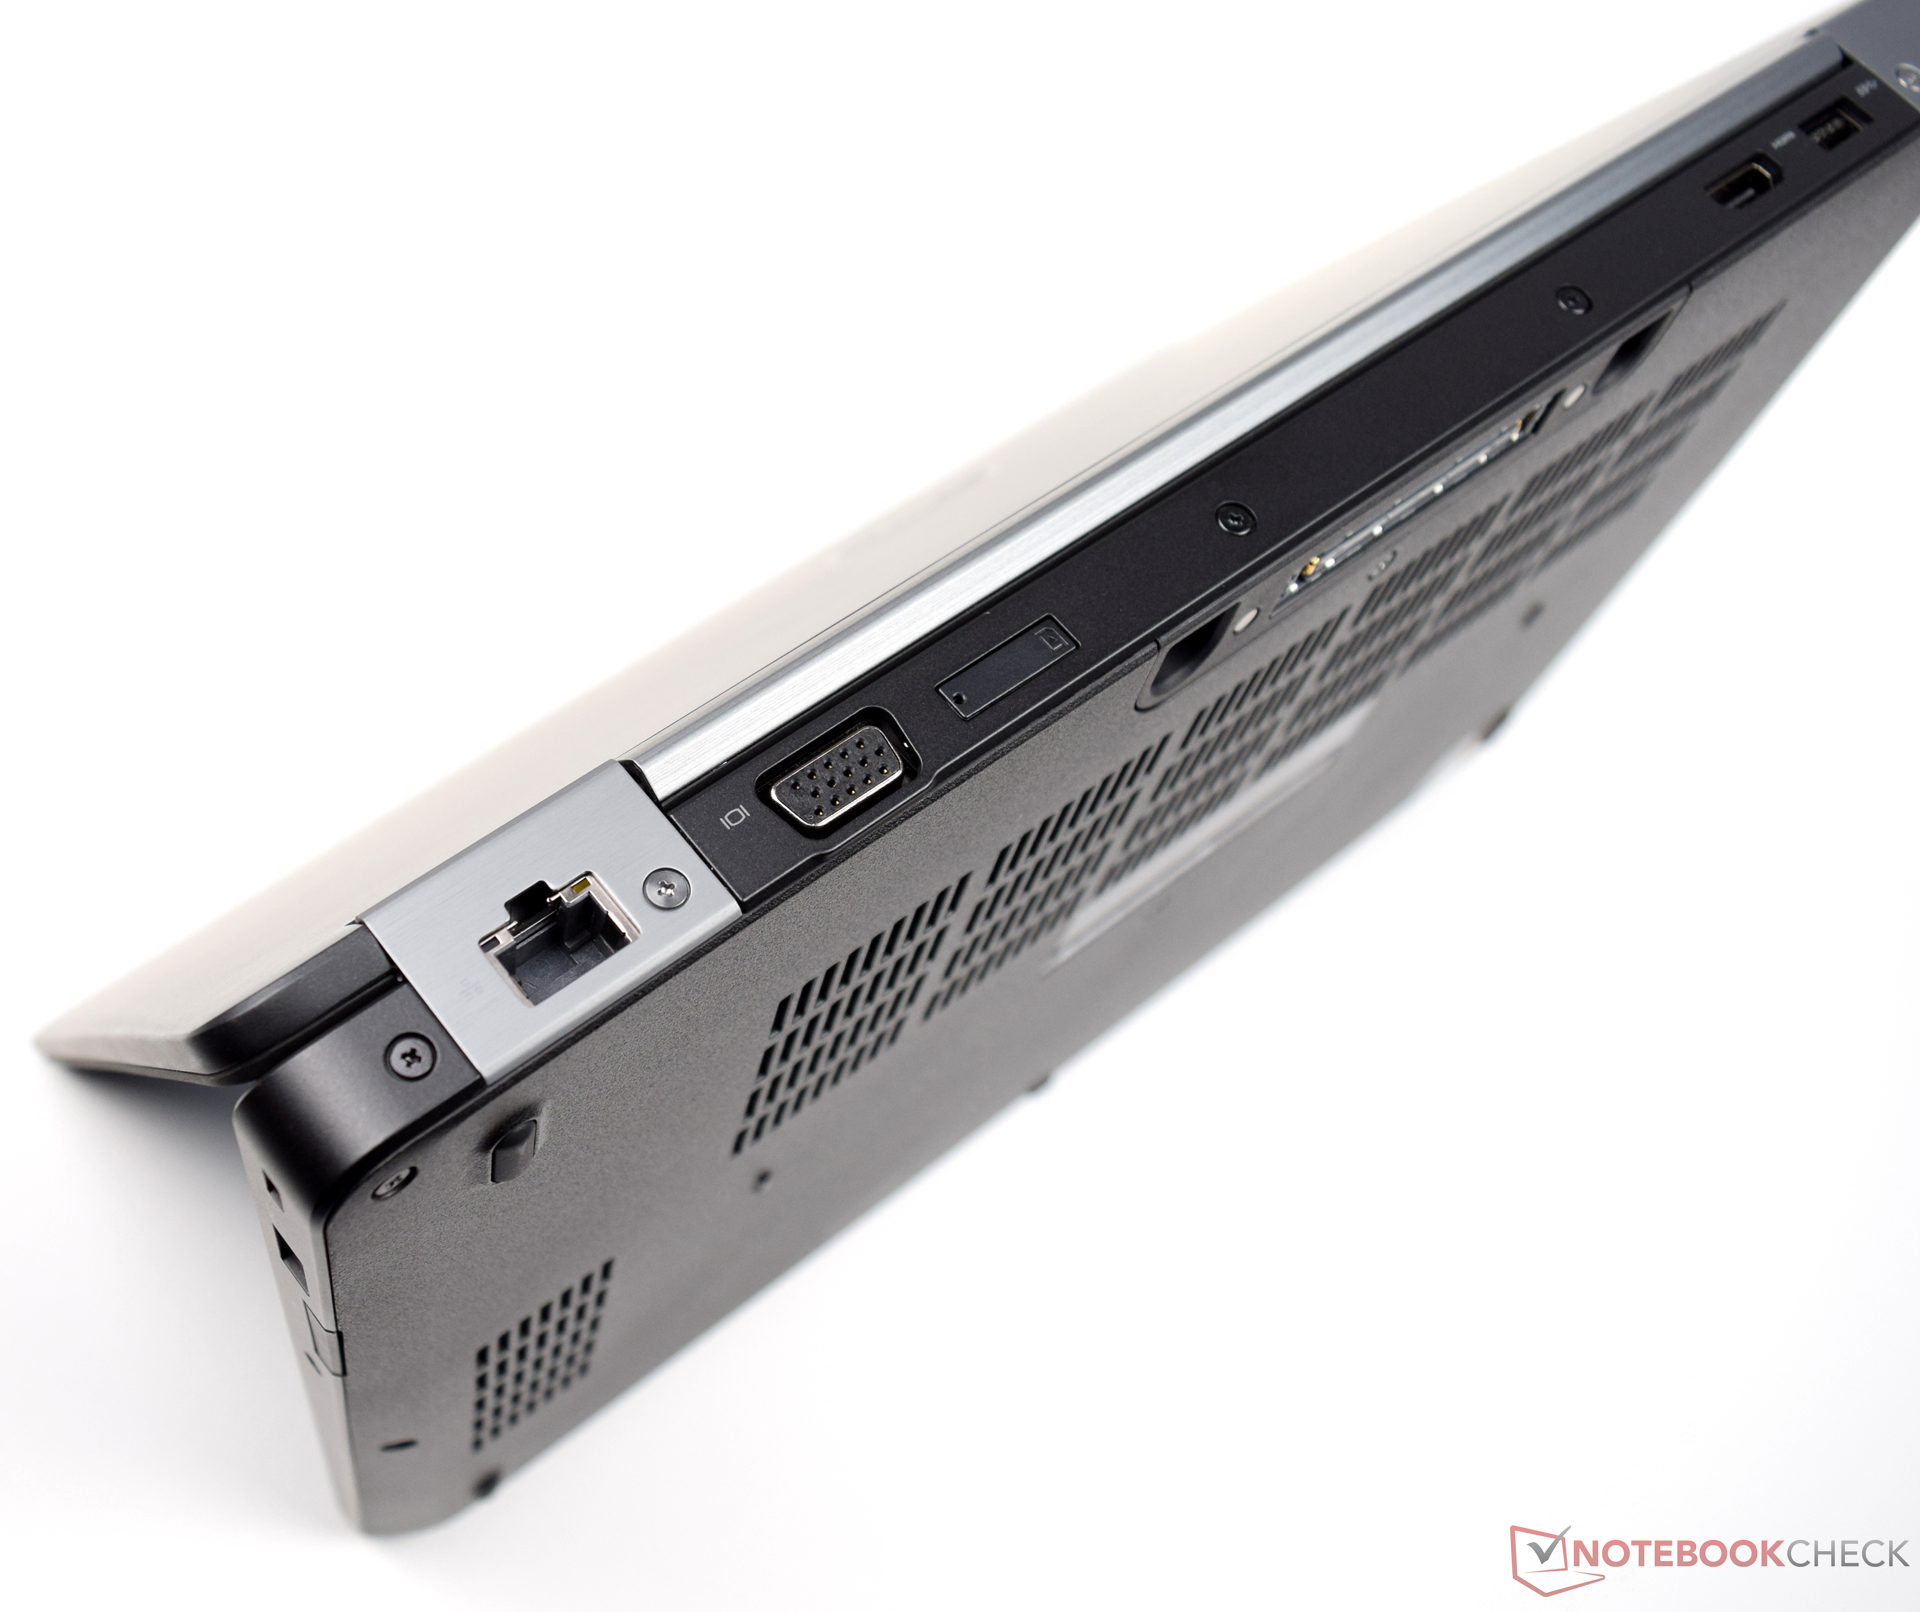
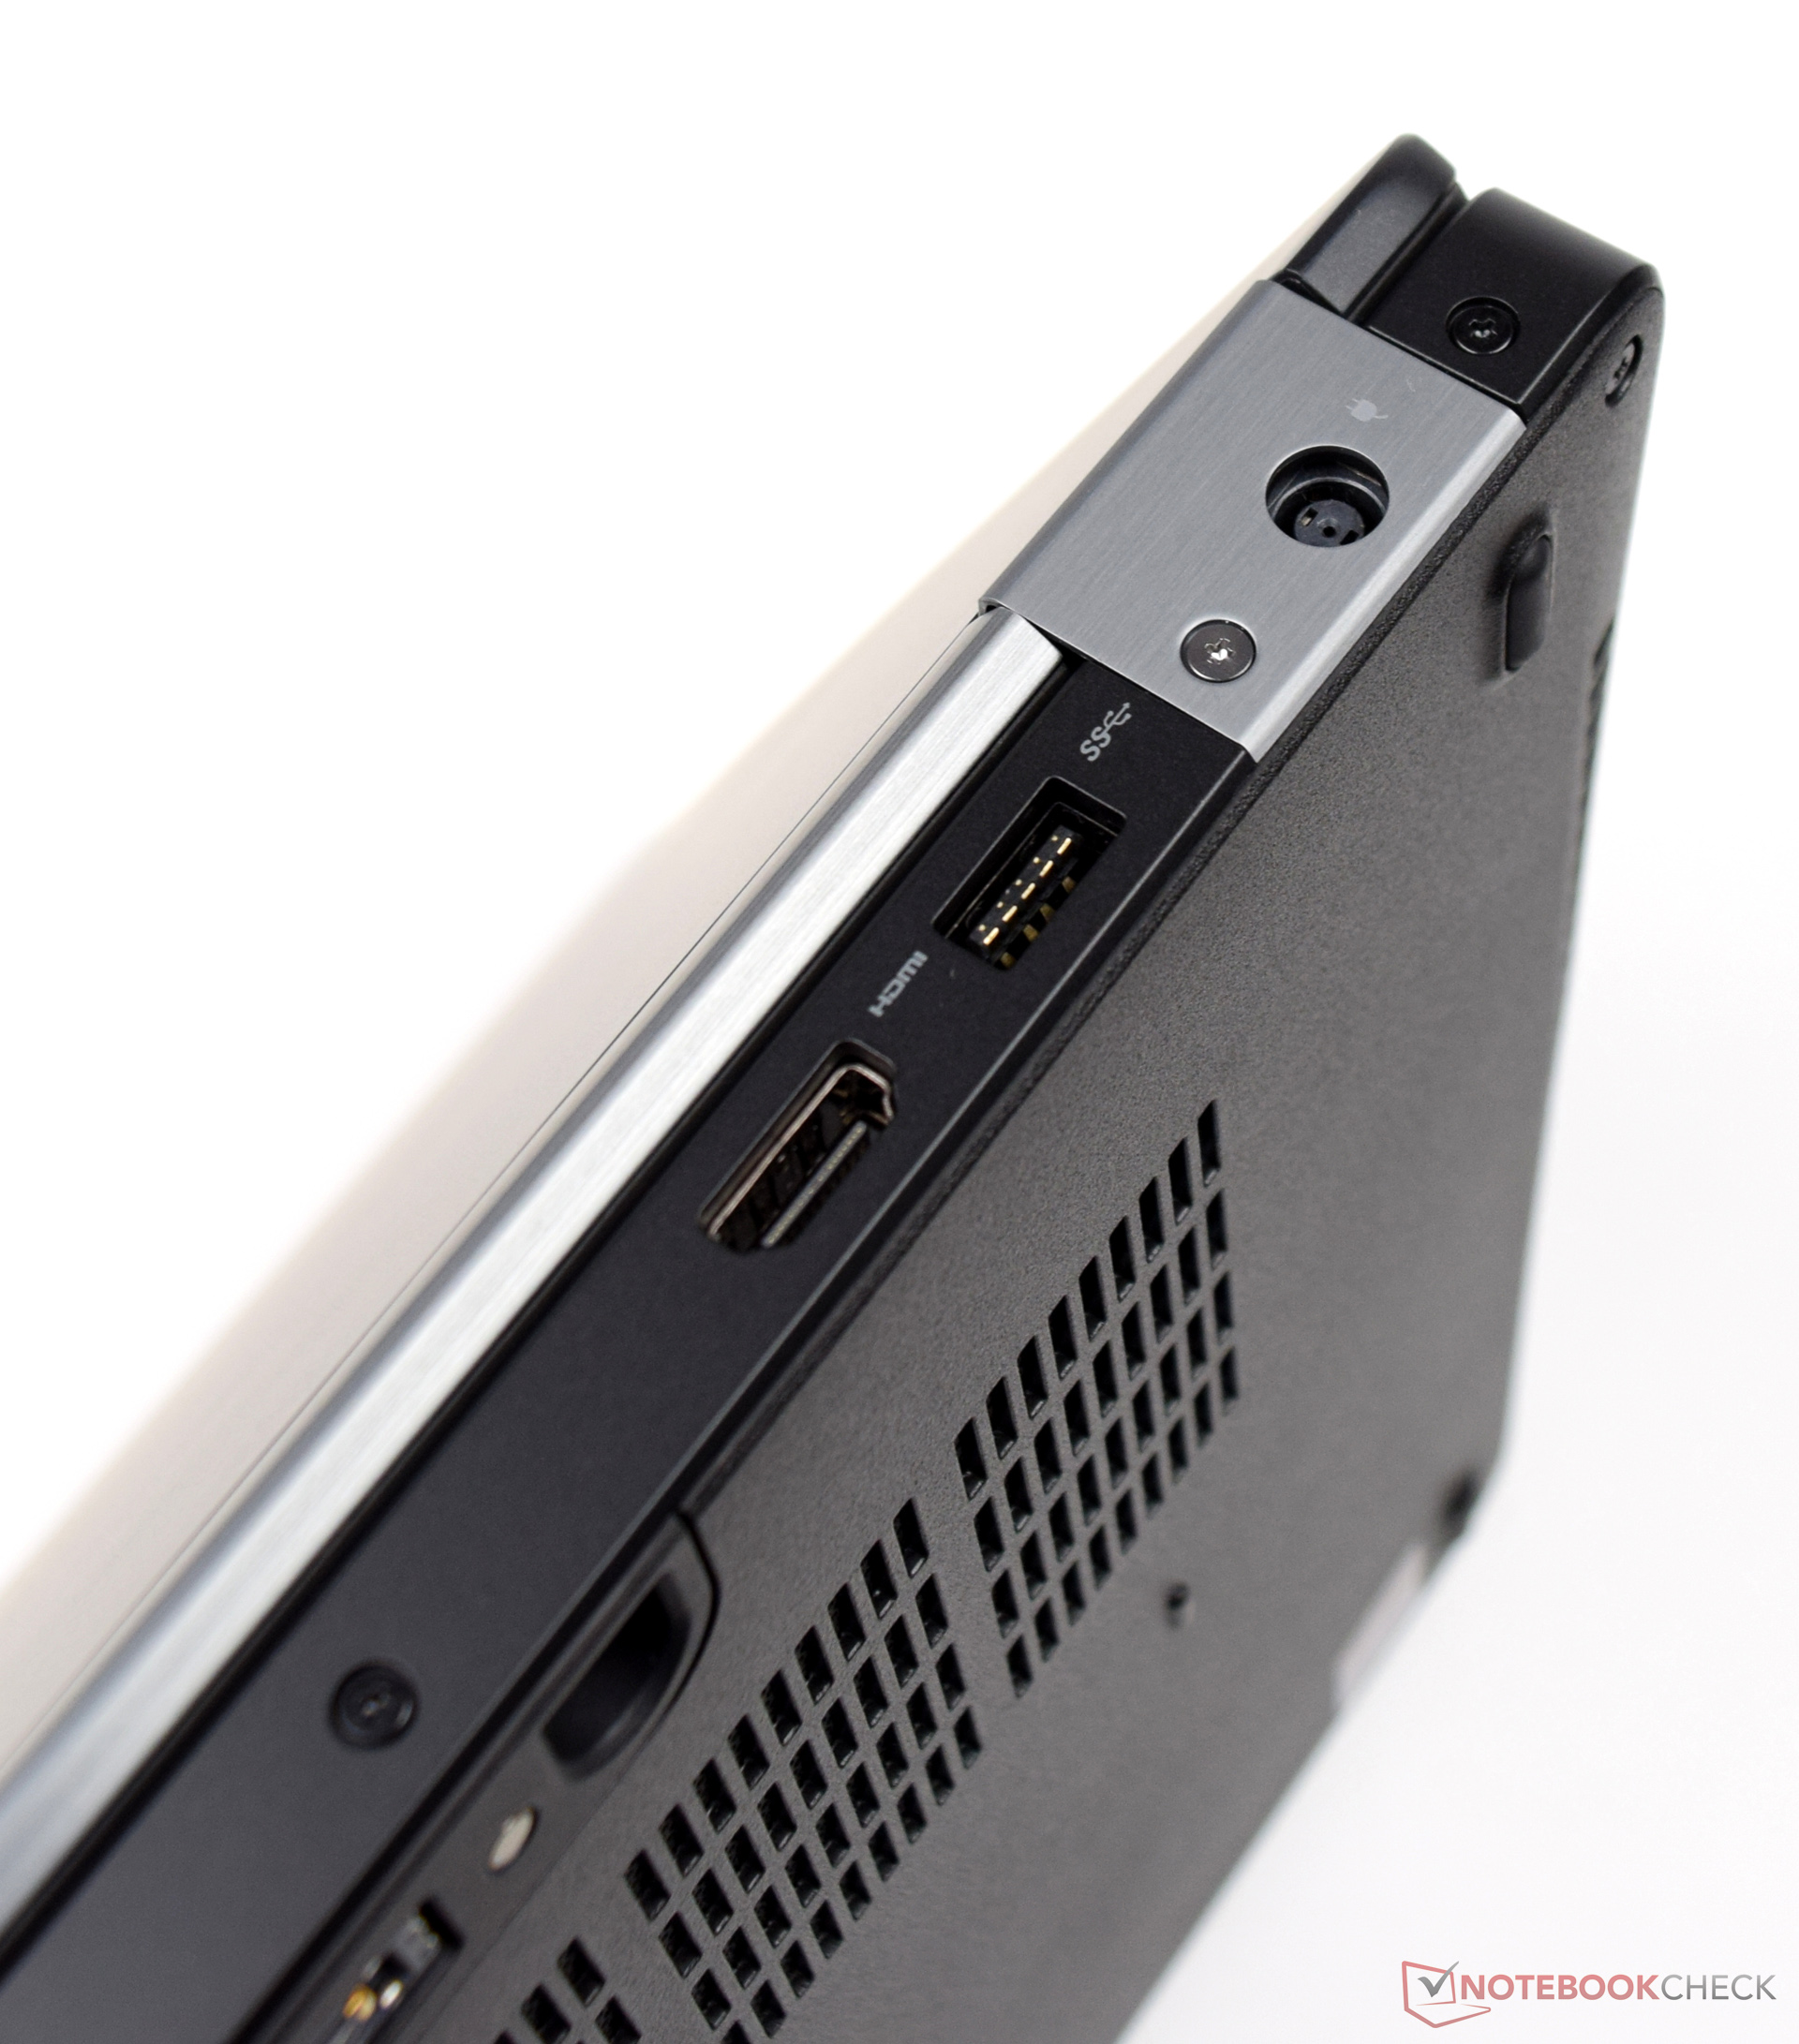
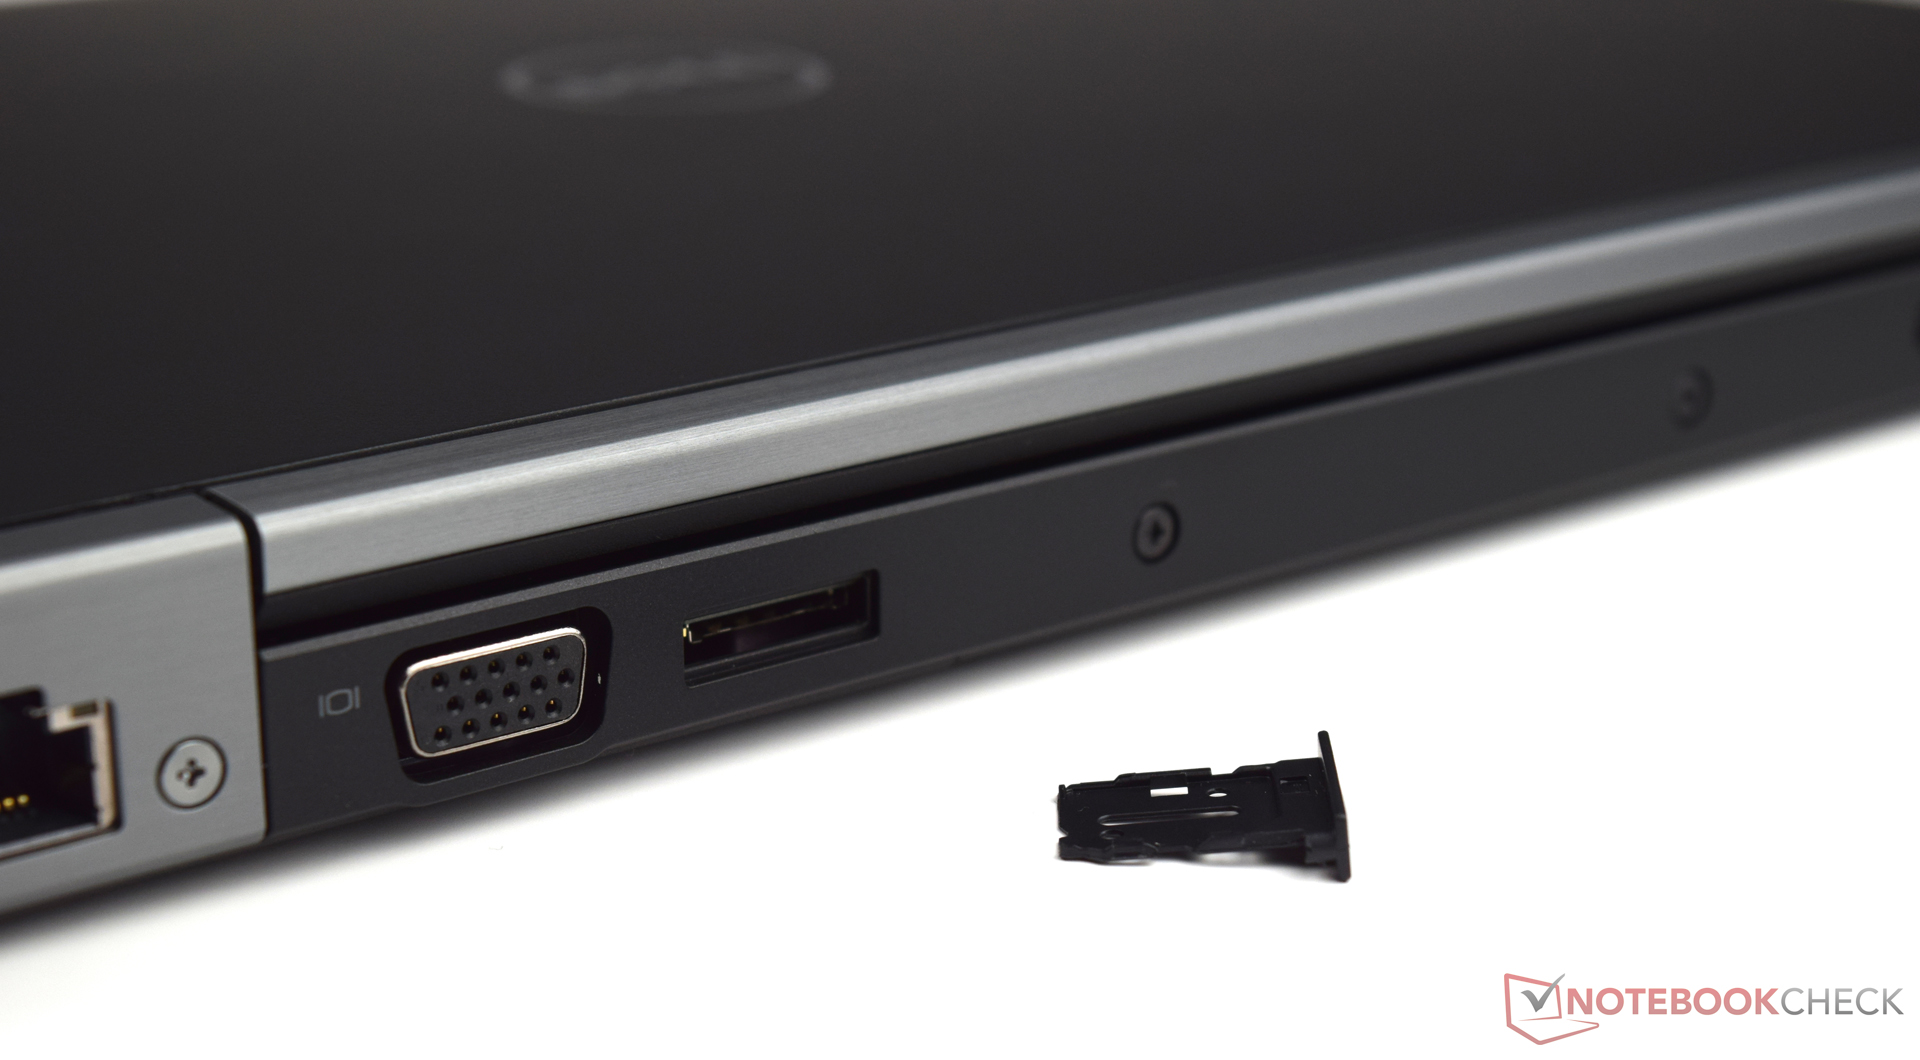
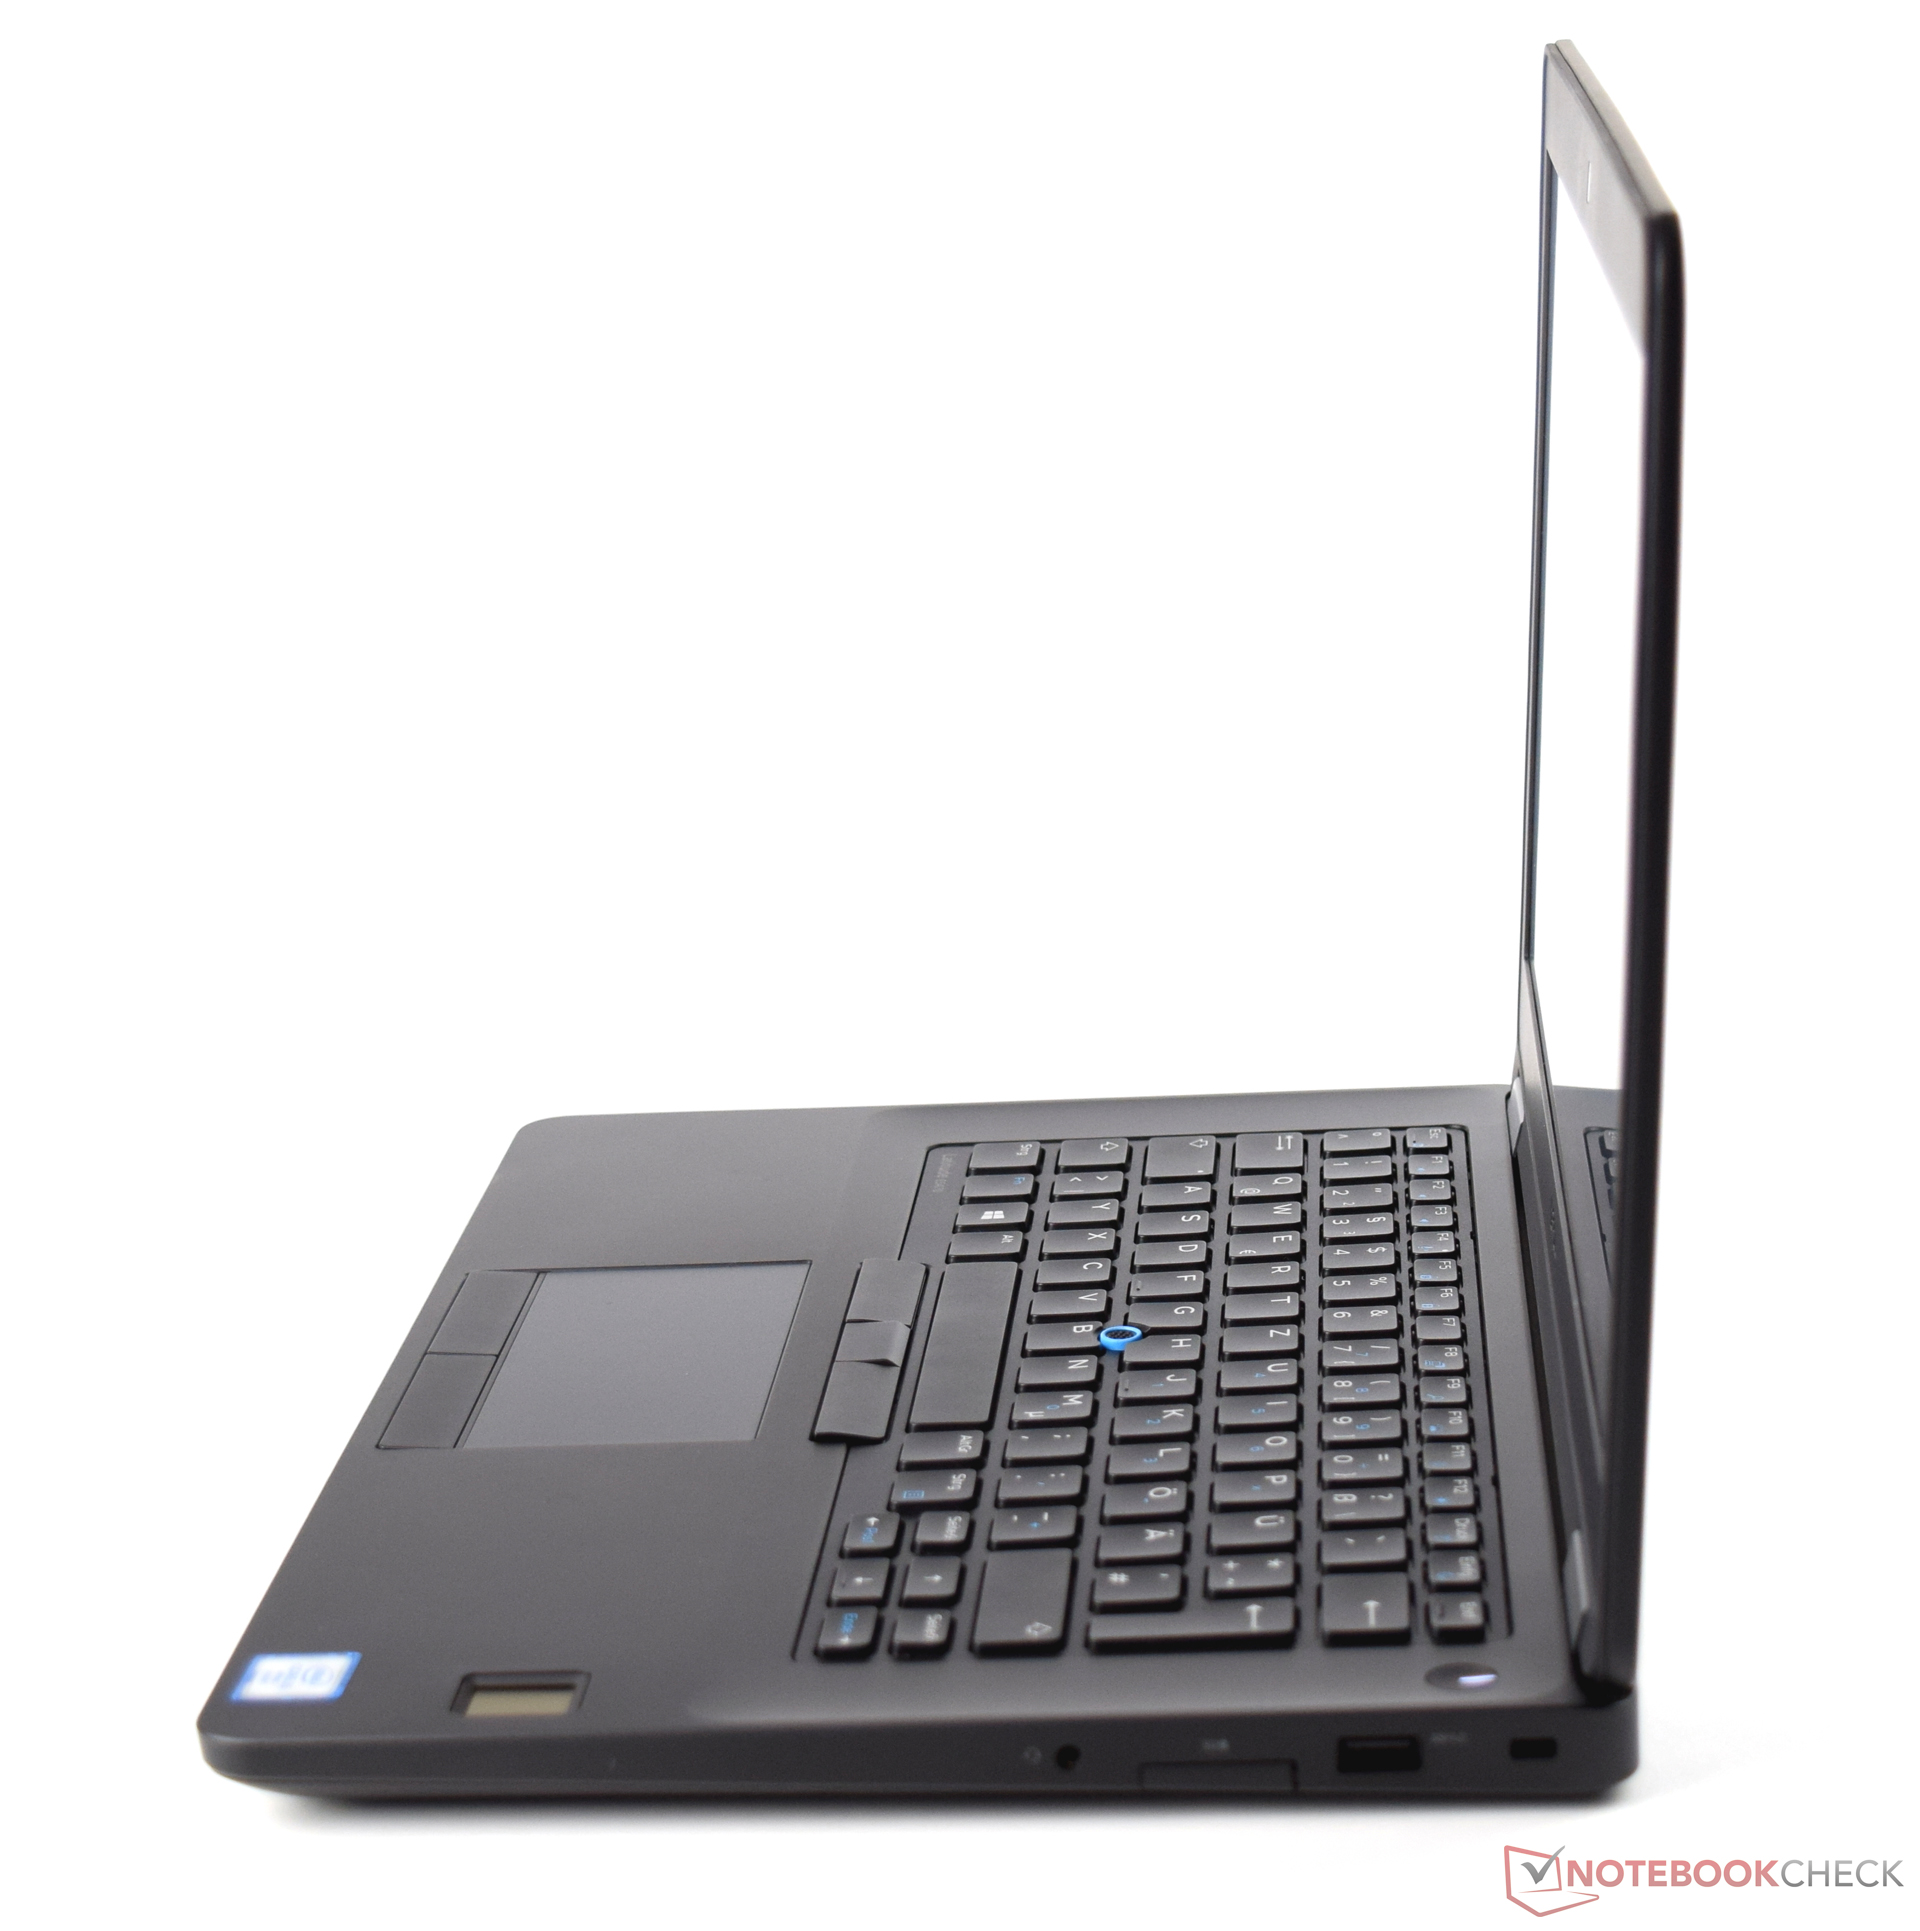
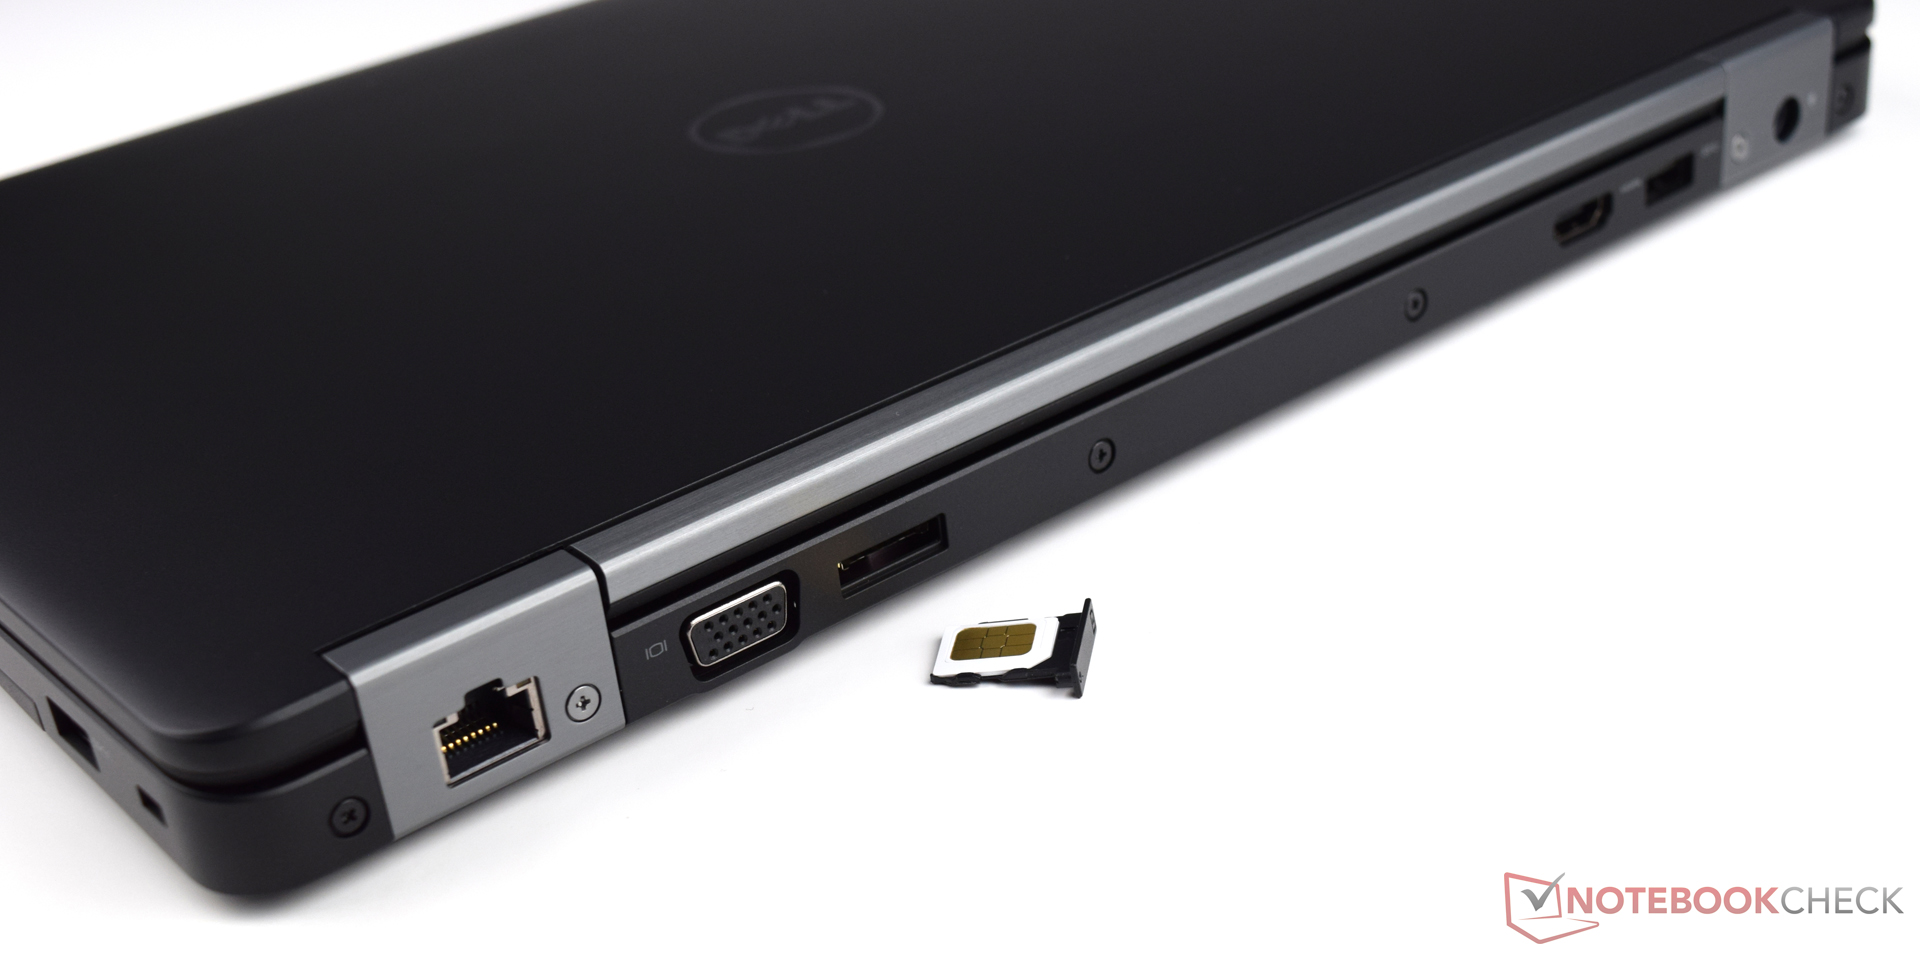
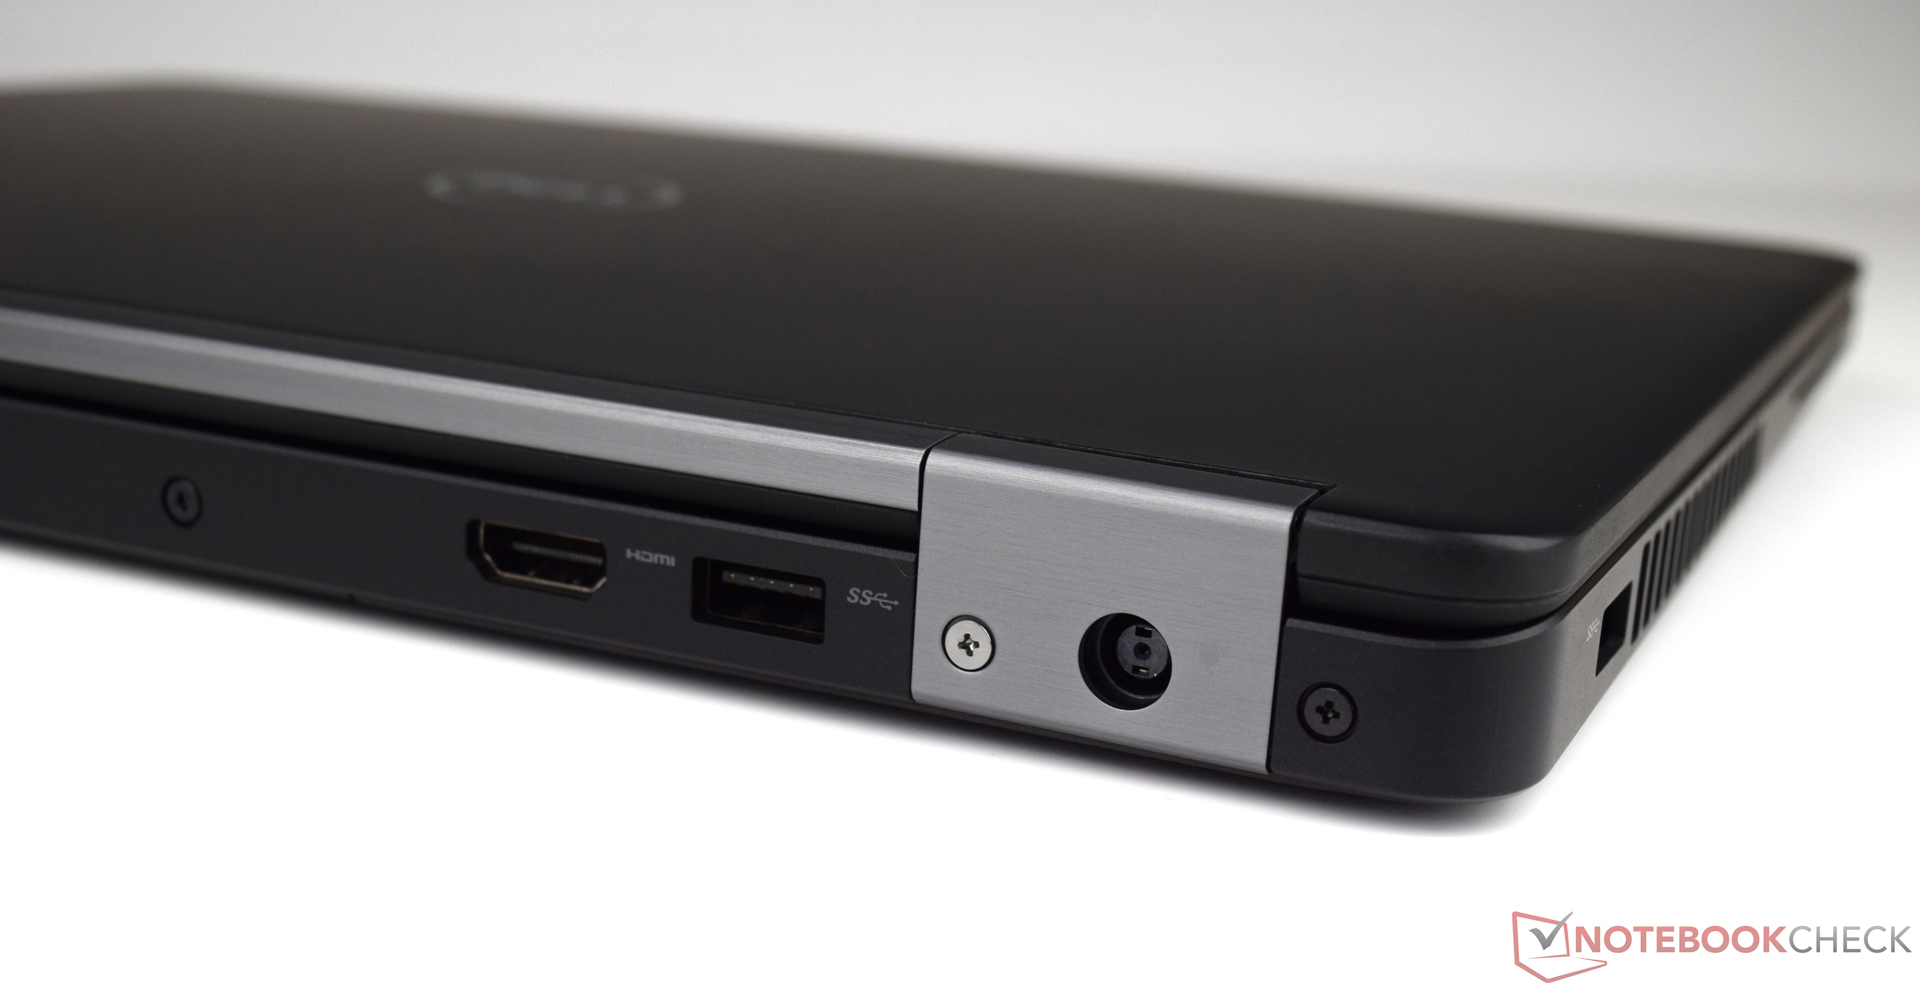
O Dell Latitude 14 E5470 não dá muito motivos para reclamar, mas teríamos desejado pelo menos uma porta USB Type-C Gen.2 em termos de preparação para o futuro. A abordagem com a tela que apresenta boas taxas é um passo na direção correta. No entanto, poderia ser um painel com um contaste um pouco mais alto nesta faixa de preços.
Mas finalmente podemos dizer que o Dell Latitude 14 E5470 é um bom aparelho de escritório para o duro trabalho empresarial. Os diversos recursos de segurança adicionam pontos positivos e poderia ser um fator decisivo para a compra.
Dell Latitude 14 E5470
- 02/10/2017 v6 (old)
Sebastian Bade