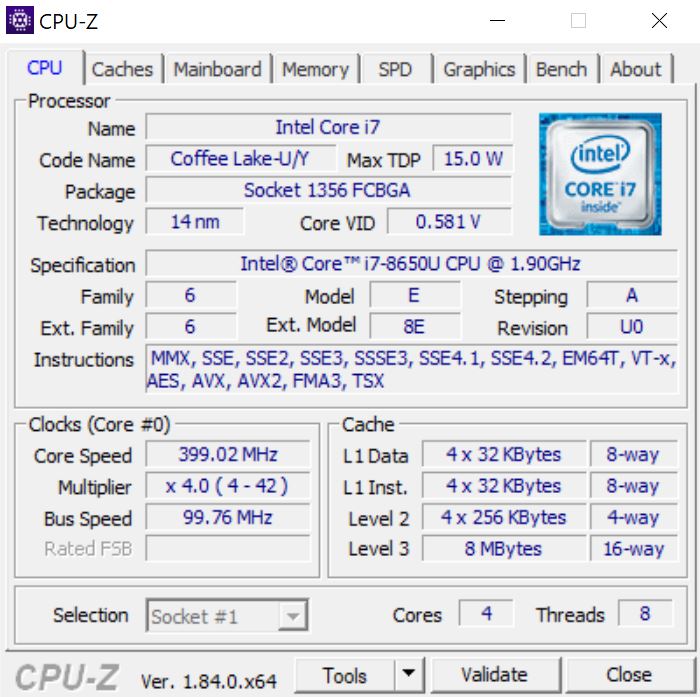
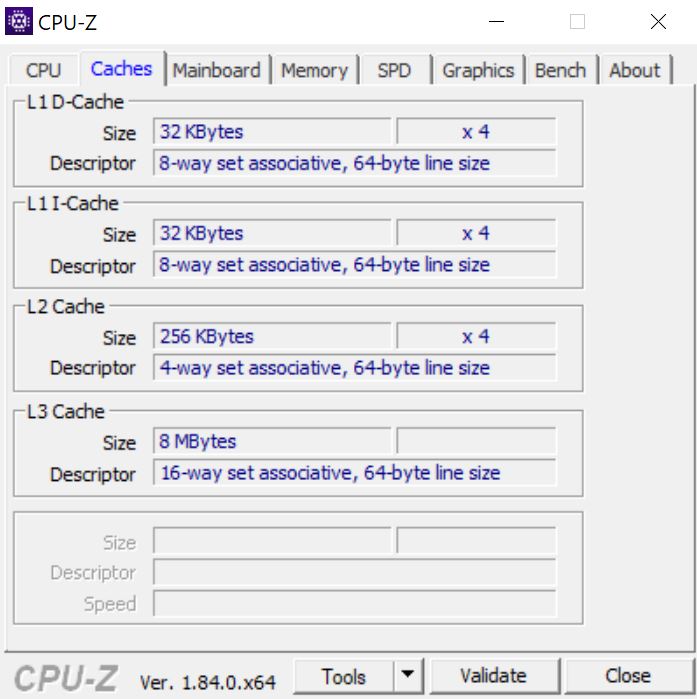
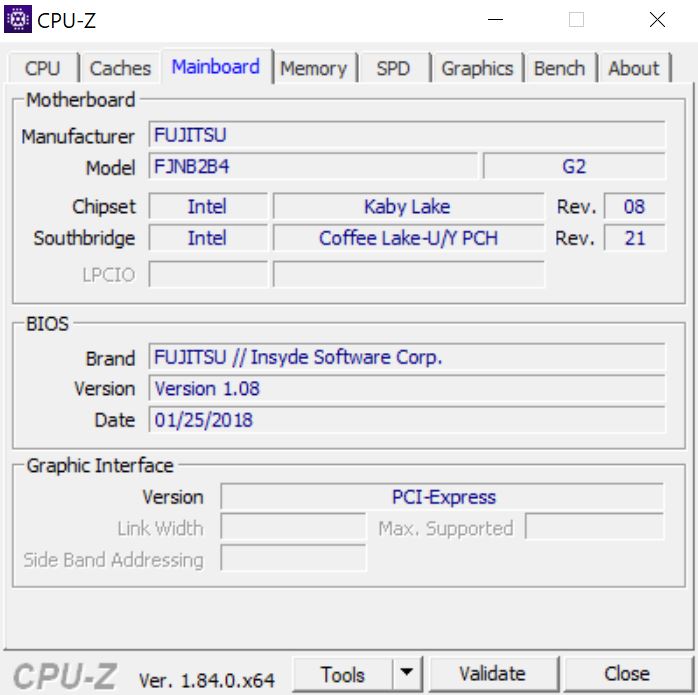
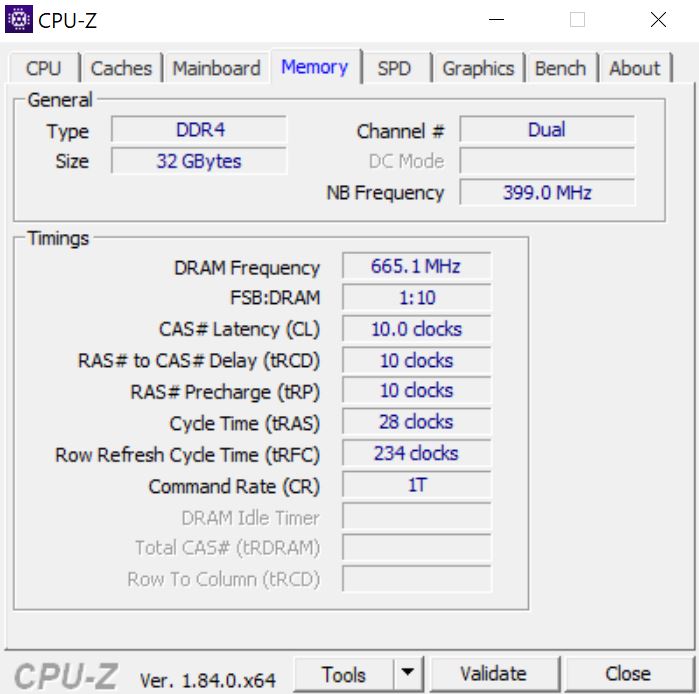
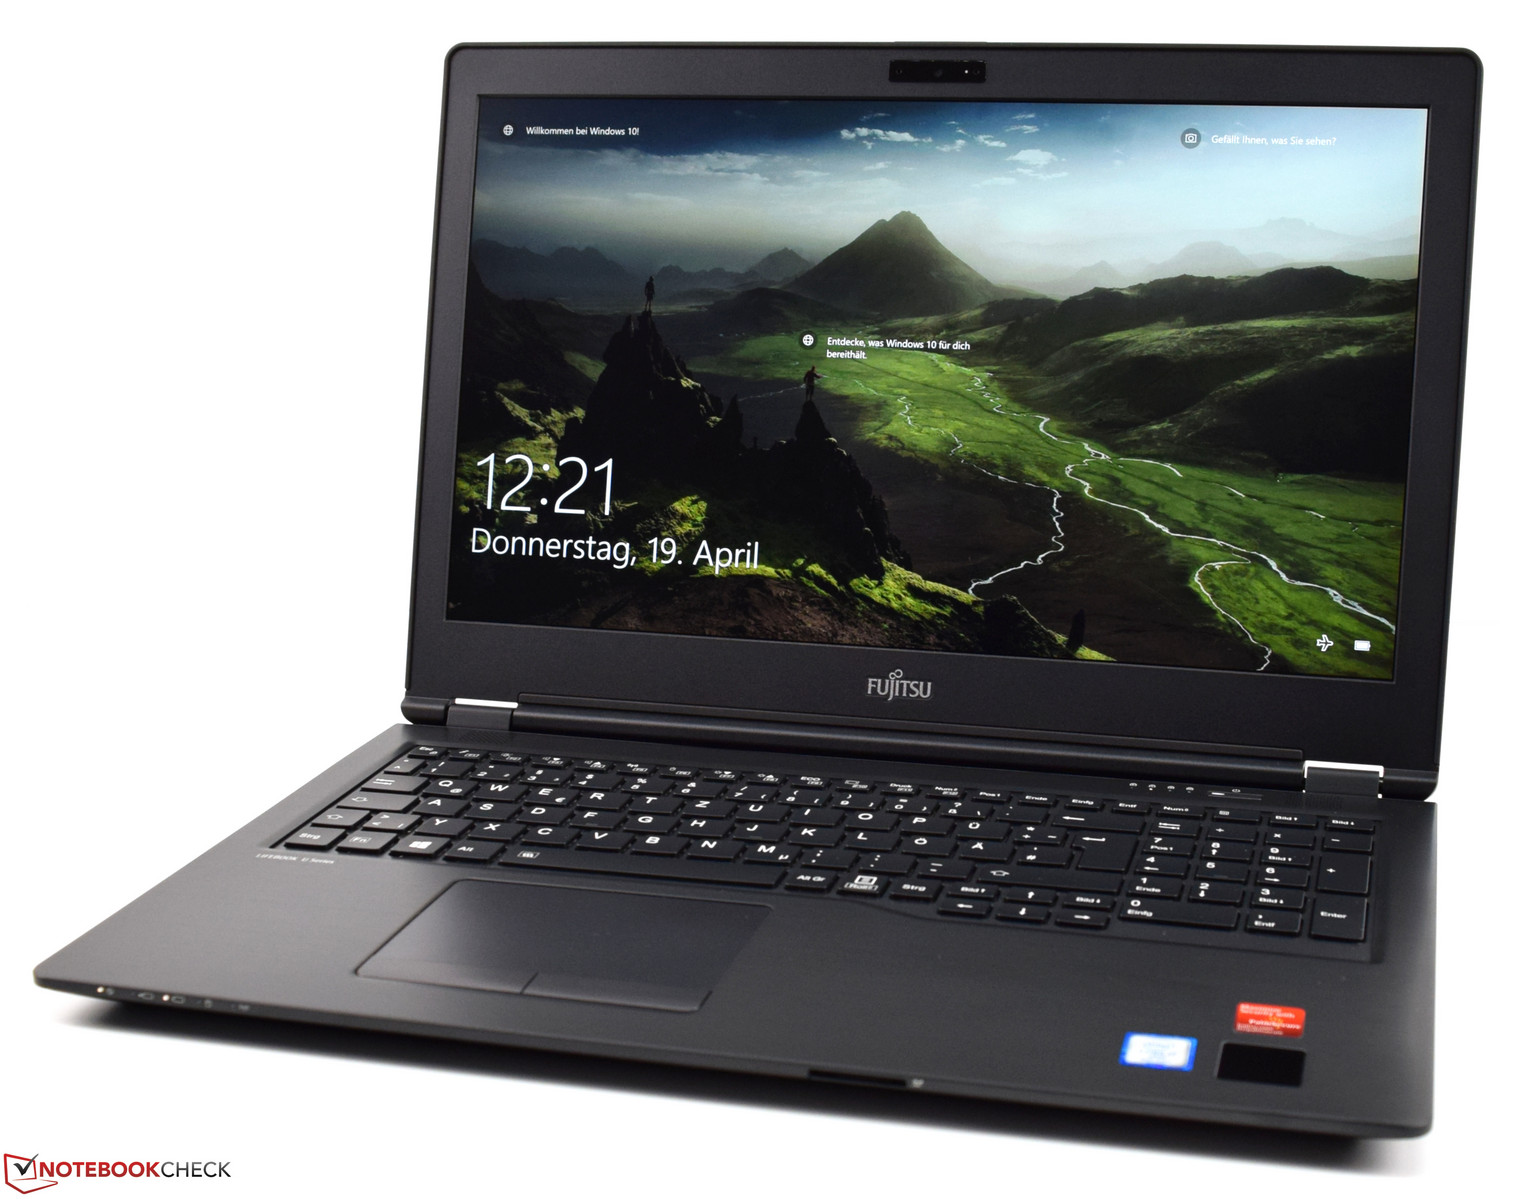
Breve Análise do Portátil Fujitsu LifeBook U758 (i7-8650U, UHD)

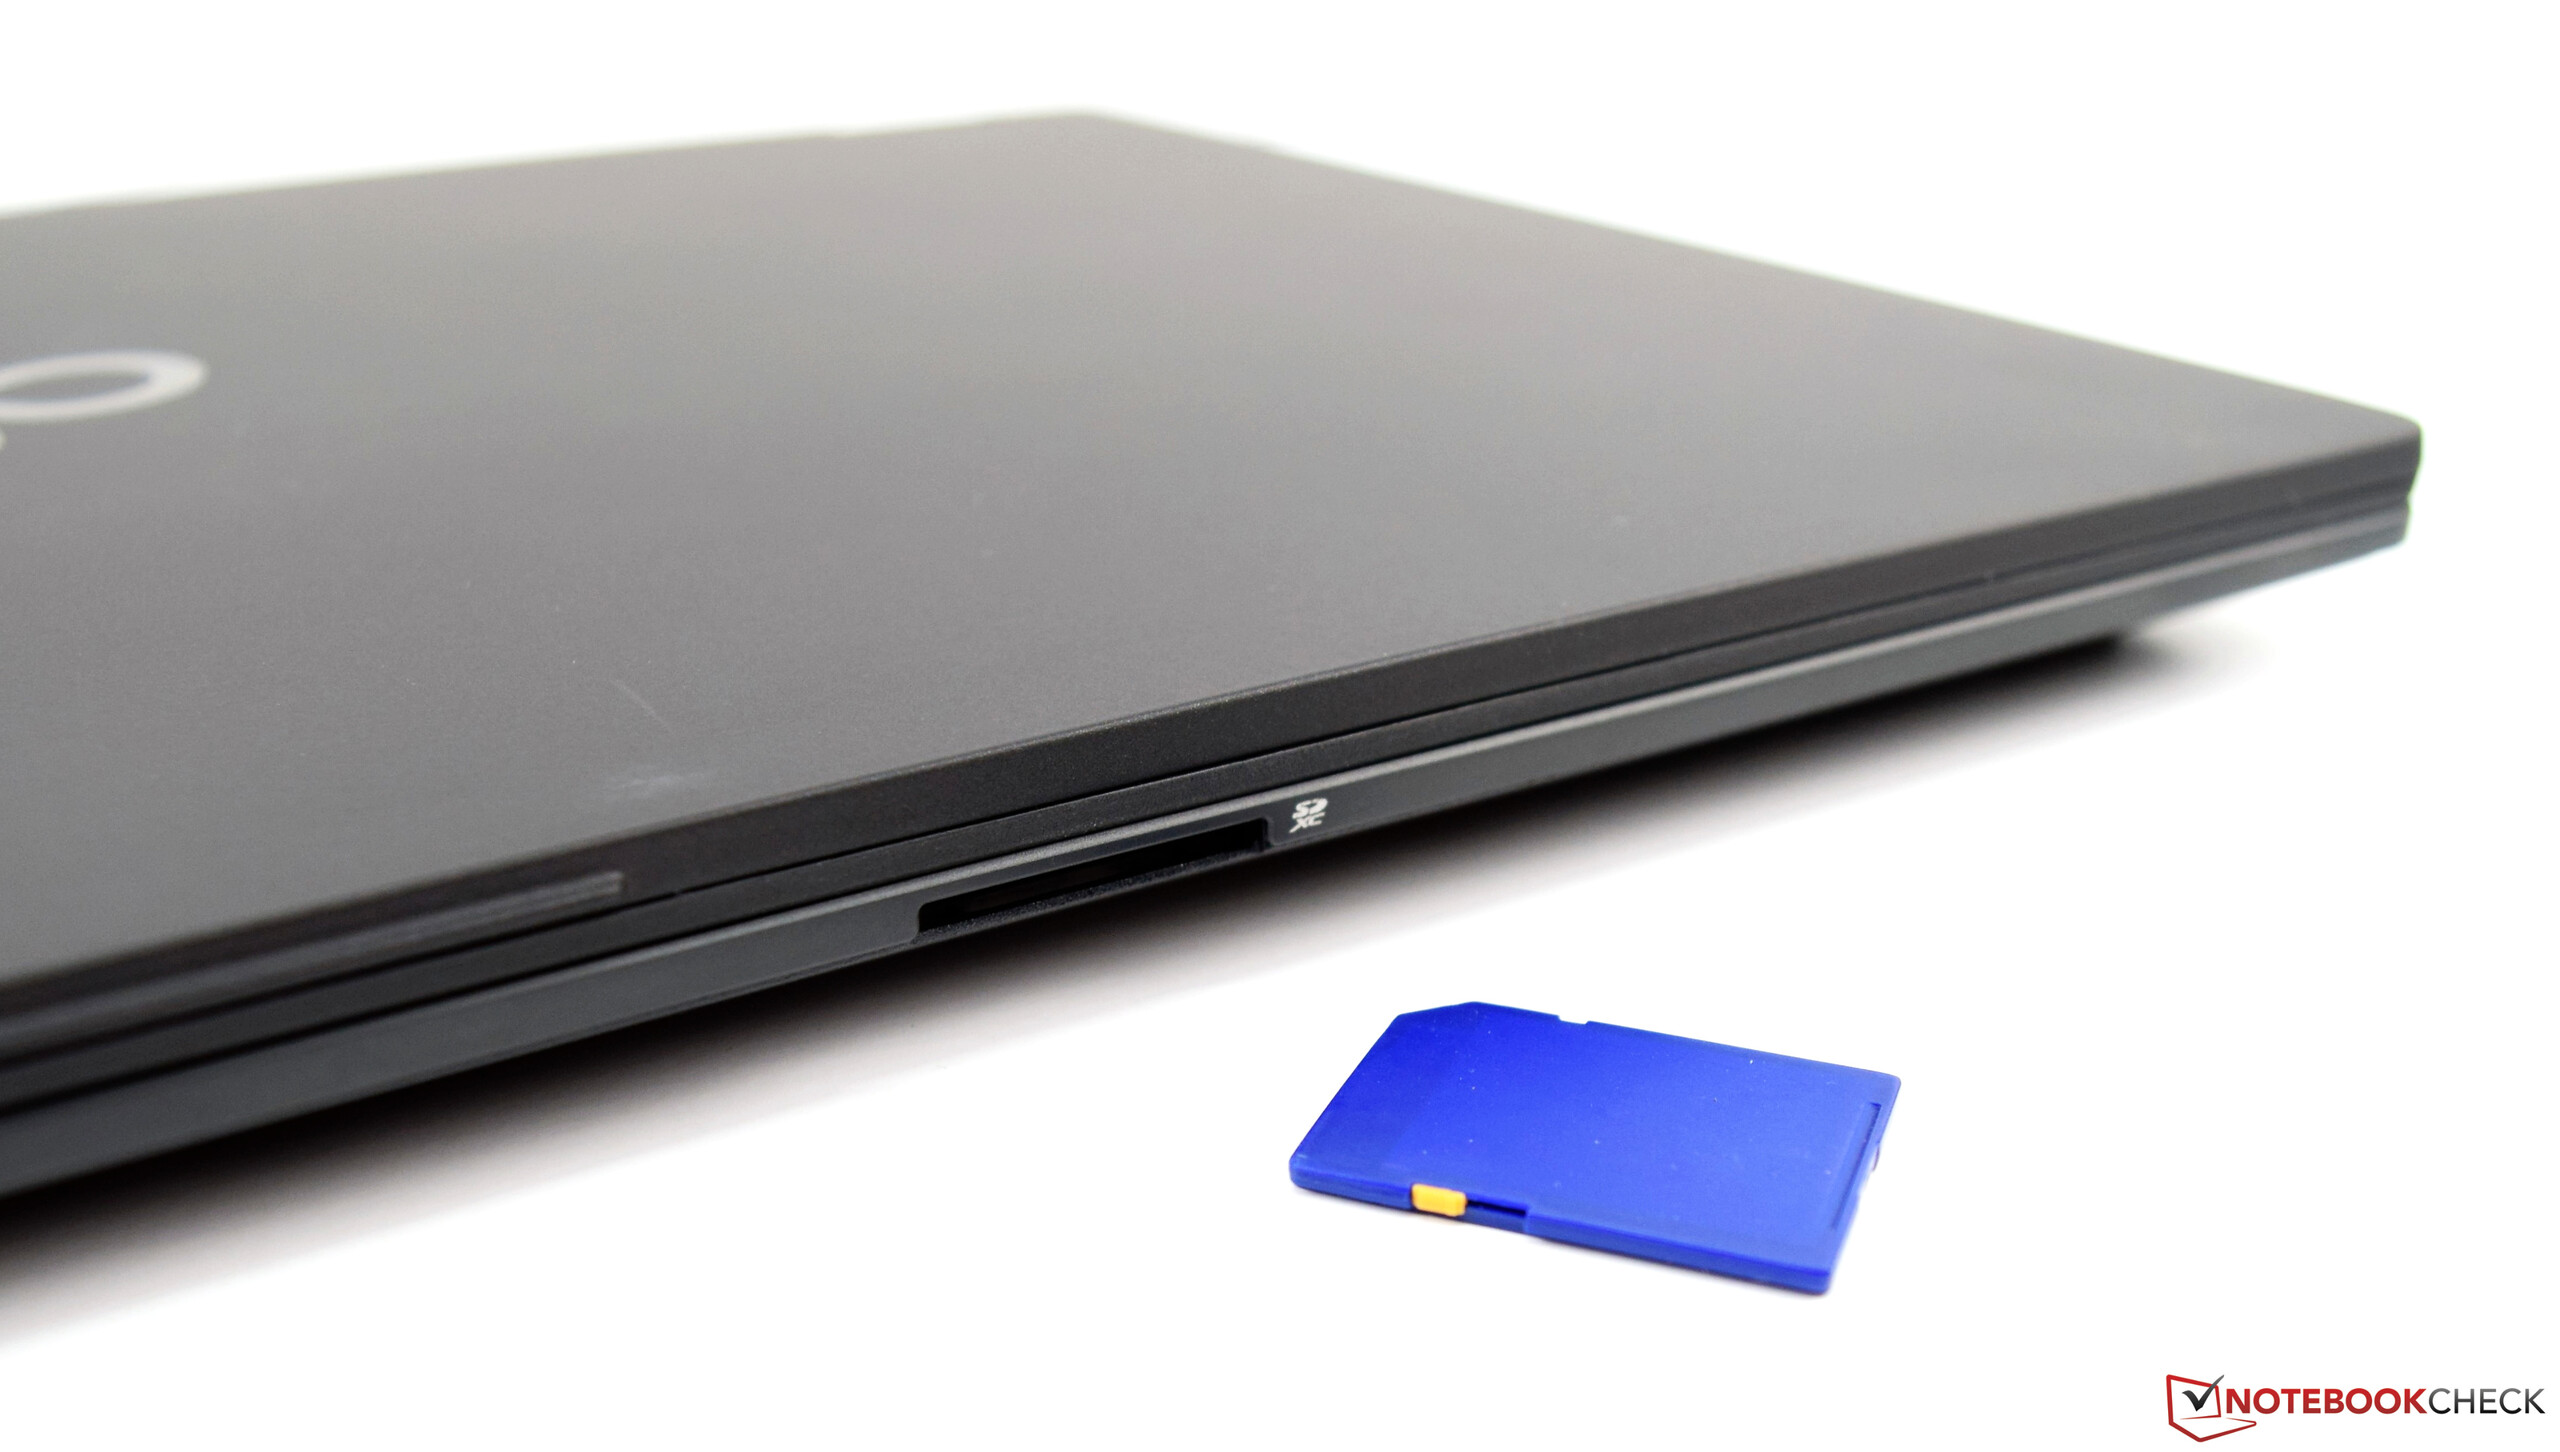
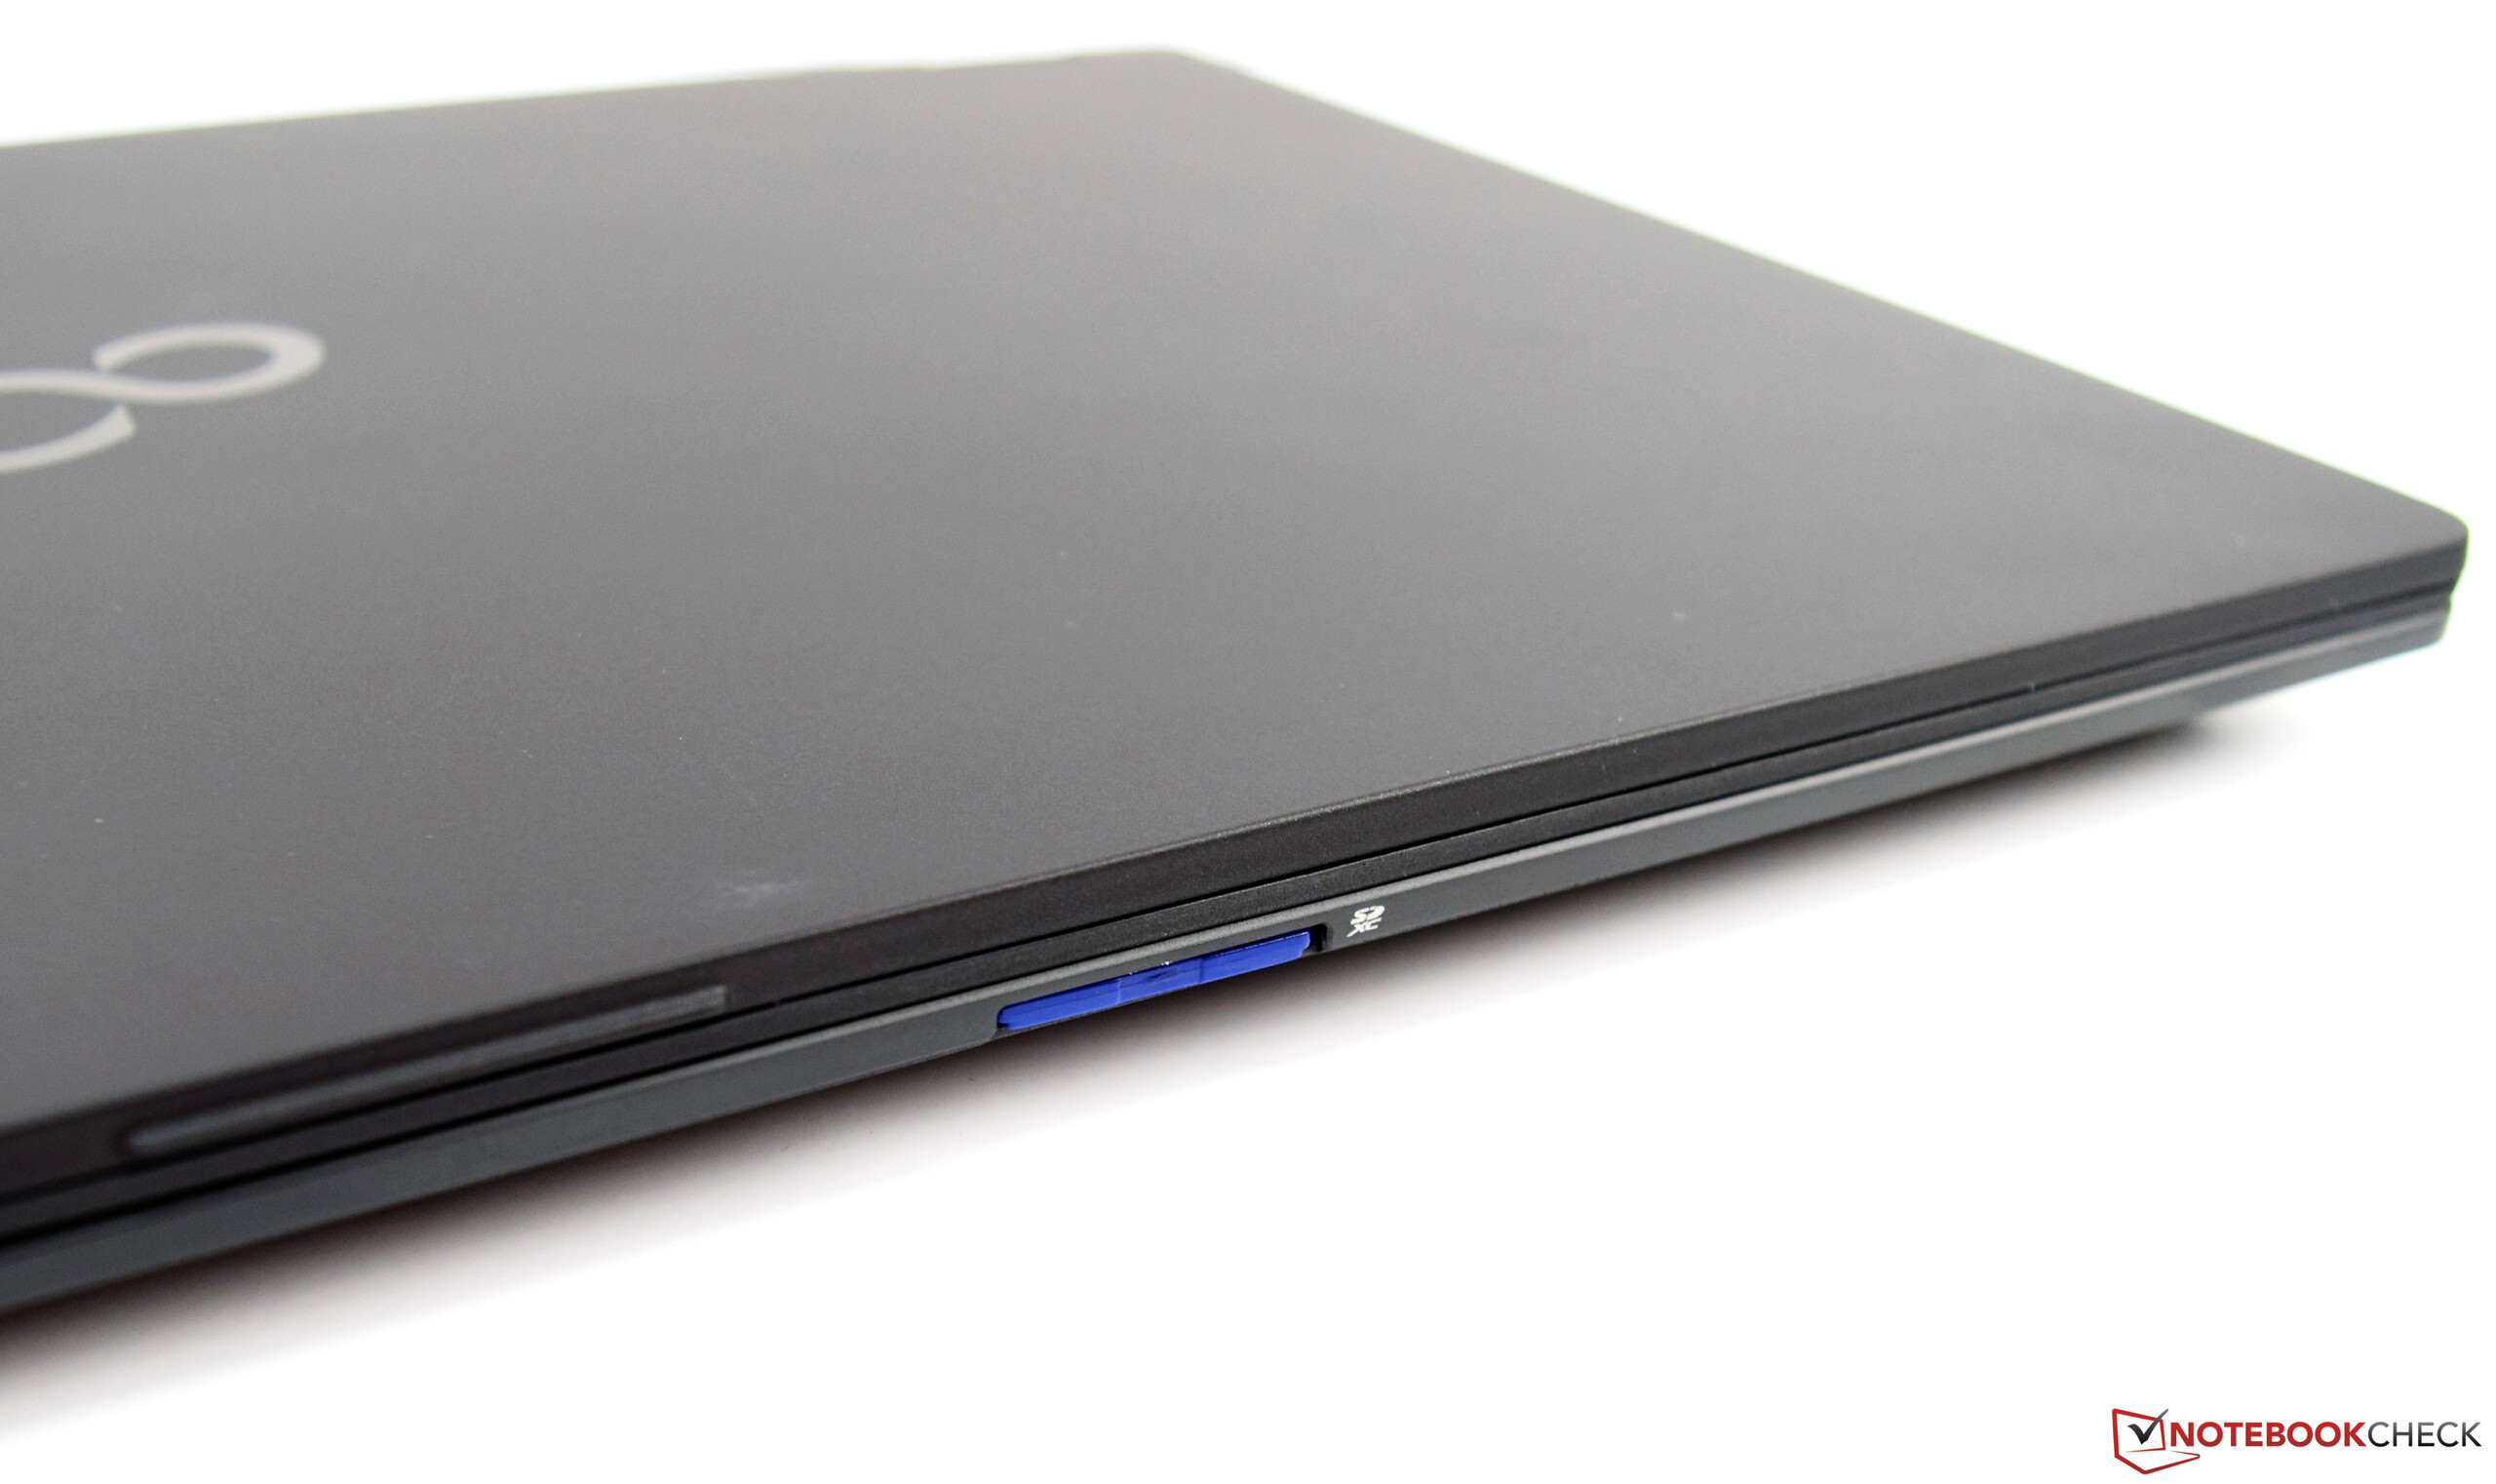
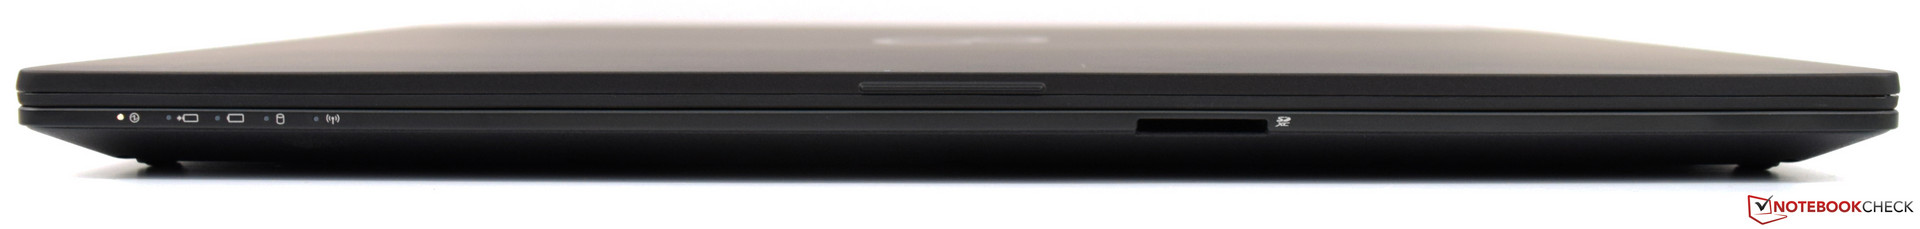
| SD Card Reader | |
| average JPG Copy Test (av. of 3 runs) | |
| Dell Latitude 5590 (Toshiba Exceria Pro SDXC 64 GB UHS-II) | |
| Schenker Slim 15 L17 (Toshiba Exceria Pro SDXC 64 GB UHS-II) | |
| Lenovo ThinkPad T580-20LAS01H00 (Toshiba Exceria Pro SDXC 64 GB UHS-II) | |
| Fujitsu LifeBook U758 (Toshiba Exceria Pro SDXC 64 GB UHS-II) | |
| Fujitsu LifeBook U757 (Toshiba Exceria Pro SDXC 64 GB UHS-II) | |
| Média da turma Office (19.8 - 198.5, n=22, últimos 2 anos) | |
| maximum AS SSD Seq Read Test (1GB) | |
| Dell Latitude 5590 (Toshiba Exceria Pro SDXC 64 GB UHS-II) | |
| Schenker Slim 15 L17 (Toshiba Exceria Pro SDXC 64 GB UHS-II) | |
| Lenovo ThinkPad T580-20LAS01H00 (Toshiba Exceria Pro SDXC 64 GB UHS-II) | |
| Fujitsu LifeBook U758 (Toshiba Exceria Pro SDXC 64 GB UHS-II) | |
| Fujitsu LifeBook U757 (Toshiba Exceria Pro SDXC 64 GB UHS-II) | |
| Média da turma Office (27.4 - 249, n=21, últimos 2 anos) | |
| Networking | |
| iperf3 transmit AX12 | |
| HP EliteBook 850 G5 3JX58EA | |
| Fujitsu LifeBook U758 | |
| Fujitsu LifeBook U757 | |
| Schenker Slim 15 L17 | |
| Dell Latitude 5590 | |
| Lenovo ThinkPad T580-20LAS01H00 | |
| iperf3 receive AX12 | |
| Fujitsu LifeBook U757 | |
| Fujitsu LifeBook U758 | |
| Lenovo ThinkPad T580-20LAS01H00 | |
| Schenker Slim 15 L17 | |
| HP EliteBook 850 G5 3JX58EA | |
| Dell Latitude 5590 | |
| |||||||||||||||||||||||||
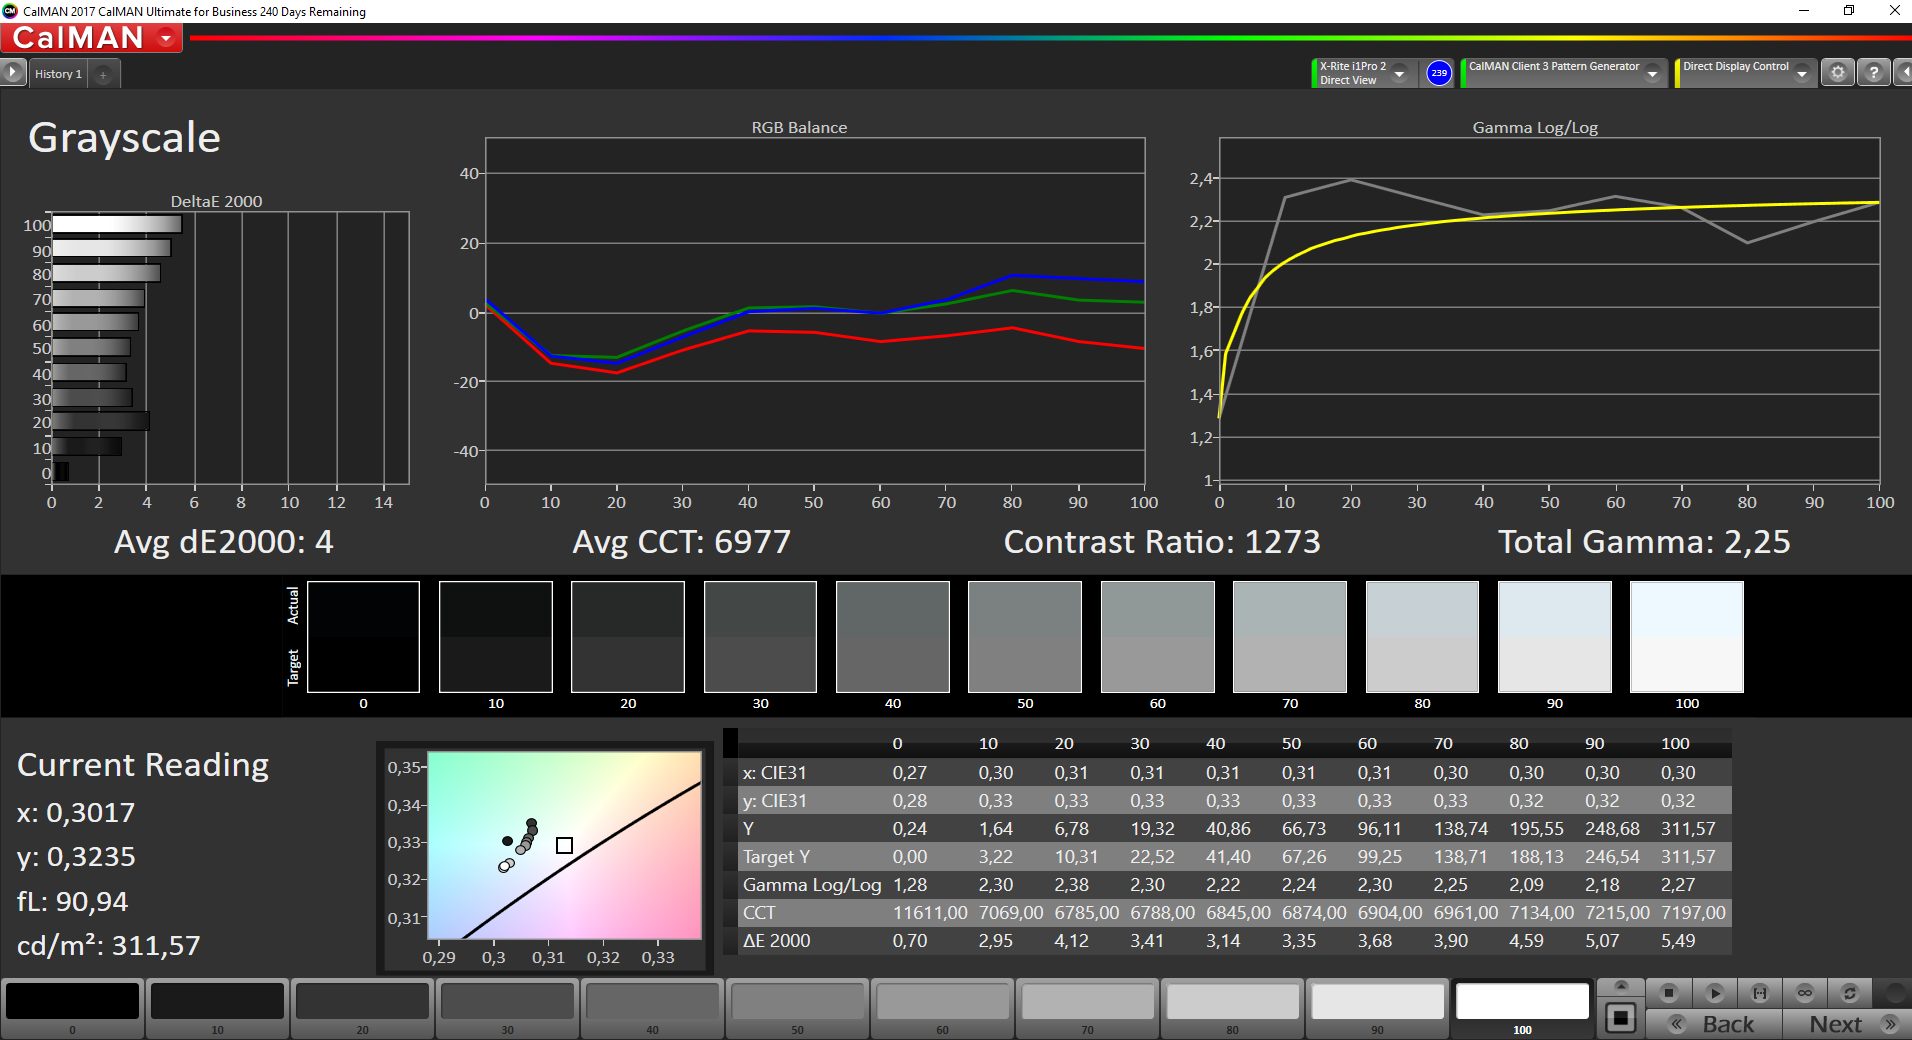
iluminação: 93 %
iluminação com acumulador: 315 cd/m²
Contraste: 1300:1 (Preto: 0.24 cd/m²)
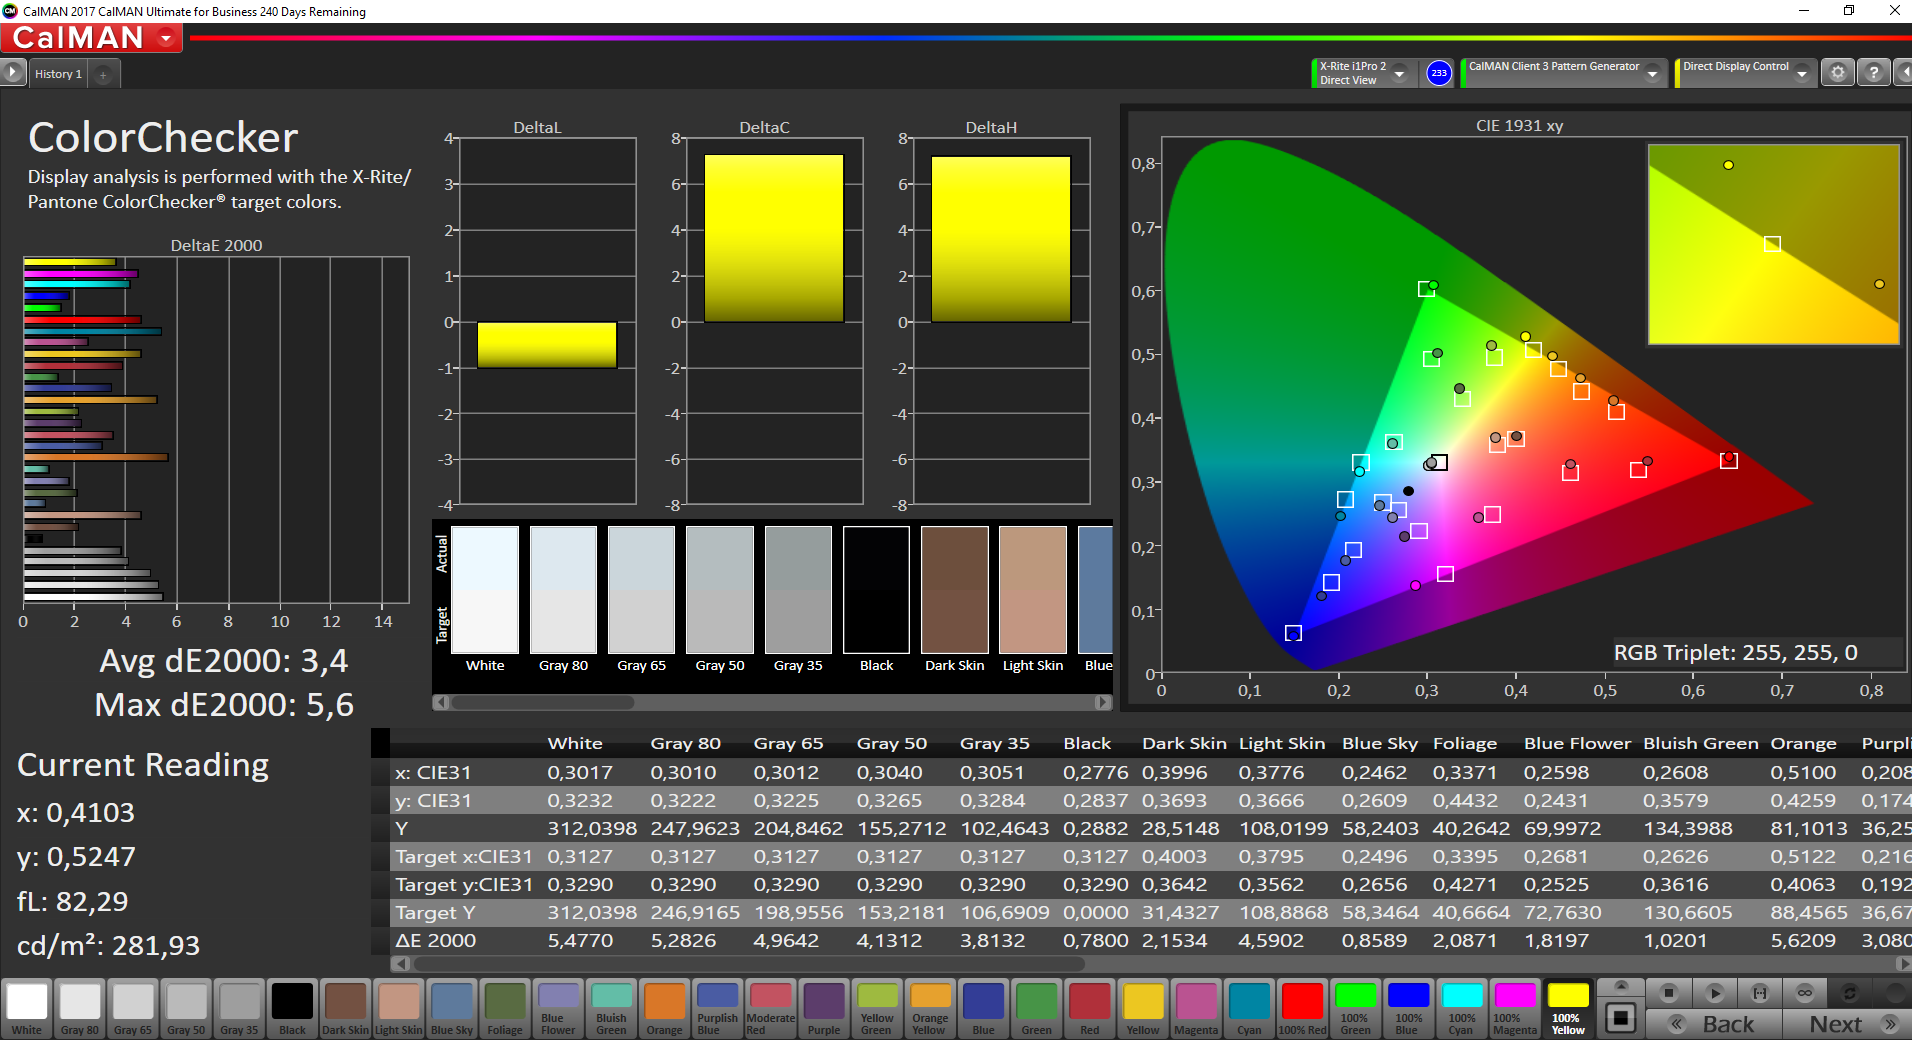
ΔE ColorChecker Calman: 3.4 | ∀{0.5-29.43 Ø4.71}
calibrated: 2.7
ΔE Greyscale Calman: 4 | ∀{0.09-98 Ø4.96}
94.1% sRGB (Argyll 1.6.3 3D)
60.9% AdobeRGB 1998 (Argyll 1.6.3 3D)
66.9% AdobeRGB 1998 (Argyll 3D)
94.2% sRGB (Argyll 3D)
65.4% Display P3 (Argyll 3D)
Gamma: 2.25
CCT: 6977 K
| Fujitsu LifeBook U758 LG, LP156UD1-SPB1, 3840x2160, 15.6" | Lenovo ThinkPad T580-20LAS01H00 NV156QUM-N44, 3840x2160, 15.6" | HP EliteBook 850 G5 3JX58EA AUO24ED, 1920x1080, 15.6" | Dell Latitude 5590 NV15N42, 1920x1080, 15.6" | Fujitsu LifeBook U757 LP156WF6-SPP1, 1920x1080, 15.6" | Schenker Slim 15 L17 LG LP156WF6, 1920x1080, 15.6" | |
|---|---|---|---|---|---|---|
| Display | 0% | -4% | -36% | -5% | -8% | |
| Display P3 Coverage (%) | 65.4 | 69.2 6% | 63.4 -3% | 41.56 -36% | 65.8 1% | 63.9 -2% |
| sRGB Coverage (%) | 94.2 | 90.7 -4% | 88.8 -6% | 61.3 -35% | 84.8 -10% | 82.8 -12% |
| AdobeRGB 1998 Coverage (%) | 66.9 | 66.3 -1% | 64.4 -4% | 42.93 -36% | 62 -7% | 60.5 -10% |
| Response Times | -17% | 3% | -38% | 8% | -2% | |
| Response Time Grey 50% / Grey 80% * (ms) | 38.4 ? | 51.2 ? -33% | 42 ? -9% | 53.2 ? -39% | 36 ? 6% | 40 ? -4% |
| Response Time Black / White * (ms) | 29.2 ? | 29.6 ? -1% | 25 ? 14% | 39.6 ? -36% | 26.4 ? 10% | 29.2 ? -0% |
| PWM Frequency (Hz) | 952 ? | 1000 ? | 20660 ? | |||
| Screen | 1% | -23% | -56% | -18% | -14% | |
| Brightness middle (cd/m²) | 312 | 310 -1% | 402 29% | 243 -22% | 313 0% | 333 7% |
| Brightness (cd/m²) | 304 | 283 -7% | 383 26% | 234 -23% | 294 -3% | 336 11% |
| Brightness Distribution (%) | 93 | 87 -6% | 88 -5% | 83 -11% | 84 -10% | 93 0% |
| Black Level * (cd/m²) | 0.24 | 0.24 -0% | 0.41 -71% | 0.19 21% | 0.27 -13% | 0.3 -25% |
| Contrast (:1) | 1300 | 1292 -1% | 980 -25% | 1279 -2% | 1159 -11% | 1110 -15% |
| Colorchecker dE 2000 * | 3.4 | 3.1 9% | 5.25 -54% | 6.6 -94% | 4.5 -32% | 4.7 -38% |
| Colorchecker dE 2000 max. * | 5.6 | 7.6 -36% | 8.65 -54% | 22.3 -298% | 10.5 -88% | 9.7 -73% |
| Colorchecker dE 2000 calibrated * | 2.7 | 2.2 19% | 5.19 -92% | 5 -85% | ||
| Greyscale dE 2000 * | 4 | 2.3 43% | 4 -0% | 5.2 -30% | 4 -0% | 3.5 12% |
| Gamma | 2.25 98% | 2.21 100% | 2.68 82% | 2.24 98% | 2.24 98% | 2.26 97% |
| CCT | 6977 93% | 6876 95% | 6756 96% | 6990 93% | 6387 102% | 6339 103% |
| Color Space (Percent of AdobeRGB 1998) (%) | 60.9 | 59.1 -3% | 58 -5% | 39.2 -36% | 55.3 -9% | 54.2 -11% |
| Color Space (Percent of sRGB) (%) | 94.1 | 90.1 -4% | 89 -5% | 60.8 -35% | 84.74 -10% | 82.7 -12% |
| Média Total (Programa/Configurações) | -5% /
-1% | -8% /
-17% | -43% /
-50% | -5% /
-12% | -8% /
-11% |
* ... menor é melhor

Exibir tempos de resposta
| ↔ Tempo de resposta preto para branco | ||
|---|---|---|
| 29.2 ms ... ascensão ↗ e queda ↘ combinadas | ↗ 18 ms ascensão | 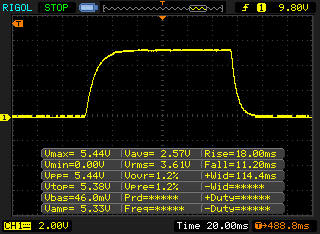 |
| ↘ 11.2 ms queda | ||
| A tela mostra taxas de resposta relativamente lentas em nossos testes e pode ser muito lenta para os jogadores. Em comparação, todos os dispositivos testados variam de 0.1 (mínimo) a 240 (máximo) ms. » 78 % de todos os dispositivos são melhores. Isso significa que o tempo de resposta medido é pior que a média de todos os dispositivos testados (19.8 ms). | ||
| ↔ Tempo de resposta 50% cinza a 80% cinza | ||
| 38.4 ms ... ascensão ↗ e queda ↘ combinadas | ↗ 21.2 ms ascensão | 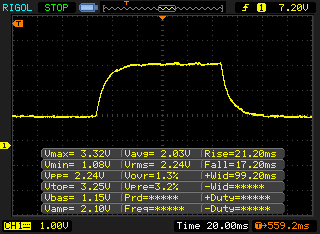 |
| ↘ 17.2 ms queda | ||
| A tela mostra taxas de resposta lentas em nossos testes e será insatisfatória para os jogadores. Em comparação, todos os dispositivos testados variam de 0.165 (mínimo) a 636 (máximo) ms. » 58 % de todos os dispositivos são melhores. Isso significa que o tempo de resposta medido é pior que a média de todos os dispositivos testados (31 ms). | ||
Cintilação da tela / PWM (modulação por largura de pulso)
| Tela tremeluzindo / PWM não detectado | 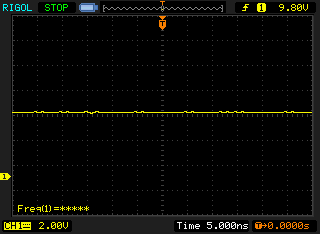 | ||
[pwm_comparison] Em comparação: 52 % de todos os dispositivos testados não usam PWM para escurecer a tela. Se PWM foi detectado, uma média de 7747 (mínimo: 5 - máximo: 343500) Hz foi medida. | |||
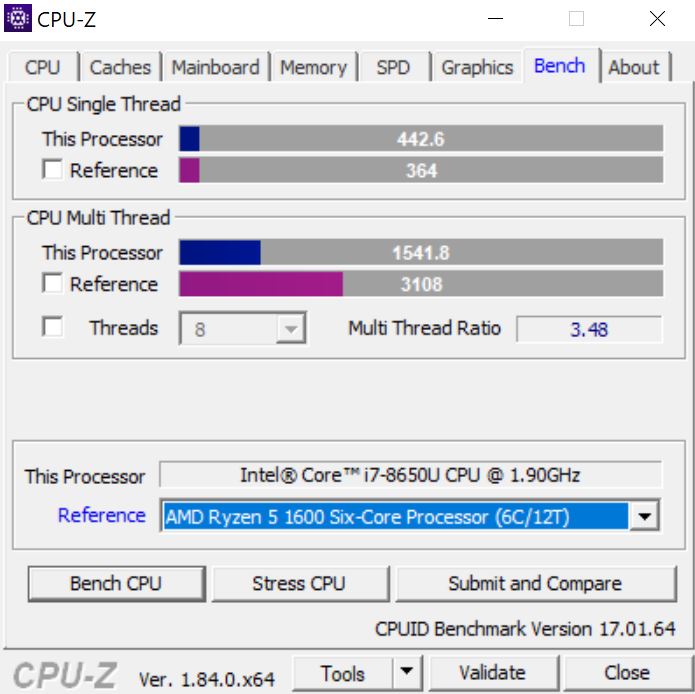
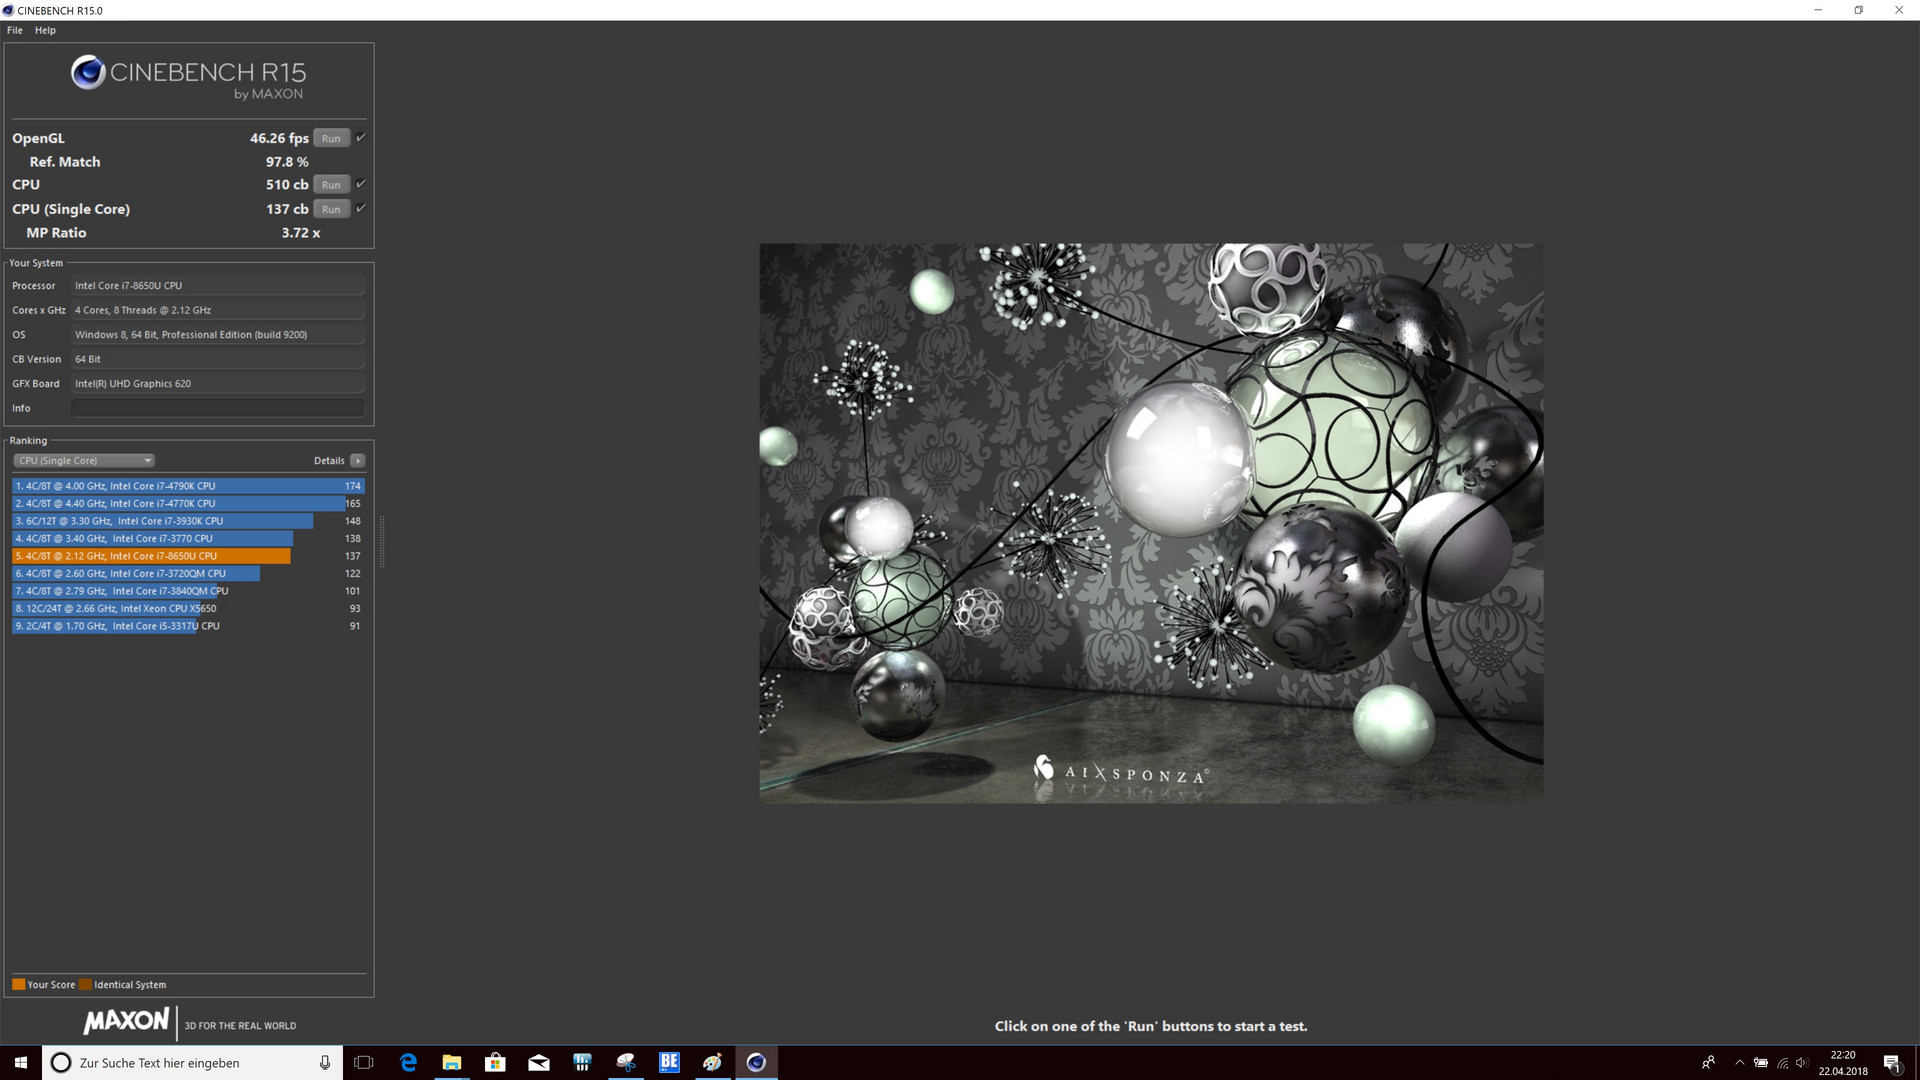
| Cinebench R15 | |
| CPU Single 64Bit | |
| Média da turma Office (99.5 - 316, n=76, últimos 2 anos) | |
| Schenker Slim 15 L17 | |
| Média Intel Core i7-8650U (128 - 178, n=17) | |
| Lenovo ThinkPad T580-20LAS01H00 | |
| Dell Latitude 5590 | |
| HP EliteBook 850 G5 3JX58EA | |
| Fujitsu LifeBook U758 | |
| Fujitsu LifeBook U757 | |
| CPU Multi 64Bit | |
| Média da turma Office (250 - 3380, n=76, últimos 2 anos) | |
| Dell Latitude 5590 | |
| Lenovo ThinkPad T580-20LAS01H00 | |
| Média Intel Core i7-8650U (451 - 675, n=19) | |
| HP EliteBook 850 G5 3JX58EA | |
| Schenker Slim 15 L17 | |
| Fujitsu LifeBook U758 | |
| Fujitsu LifeBook U757 | |
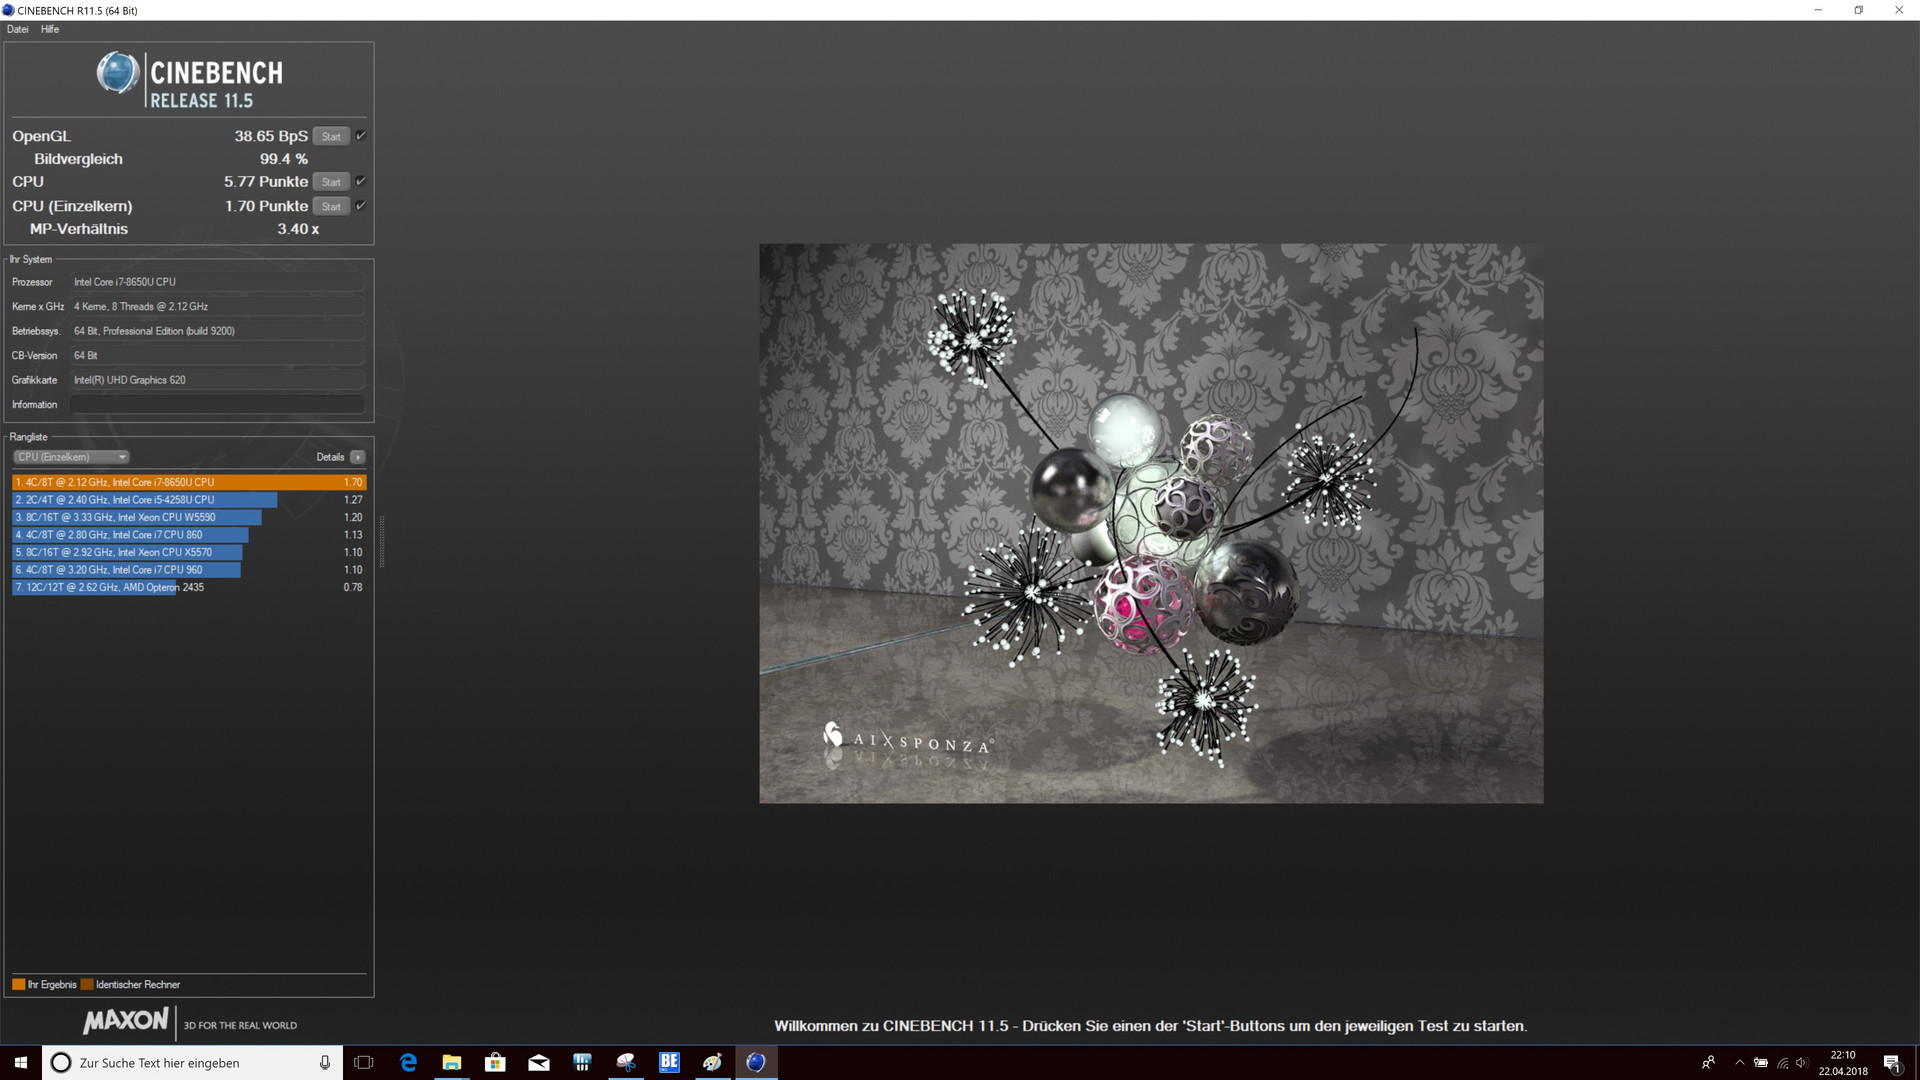
| Cinebench R11.5 | |
| CPU Multi 64Bit | |
| Média da turma Office (9.76 - 31.5, n=14, últimos 2 anos) | |
| Dell Latitude 5590 | |
| Média Intel Core i7-8650U (5.04 - 7.24, n=9) | |
| Fujitsu LifeBook U758 | |
| Schenker Slim 15 L17 | |
| CPU Single 64Bit | |
| Média da turma Office (2 - 3.6, n=14, últimos 2 anos) | |
| Schenker Slim 15 L17 | |
| Média Intel Core i7-8650U (1.67 - 2.04, n=9) | |
| Fujitsu LifeBook U758 | |
| Dell Latitude 5590 | |
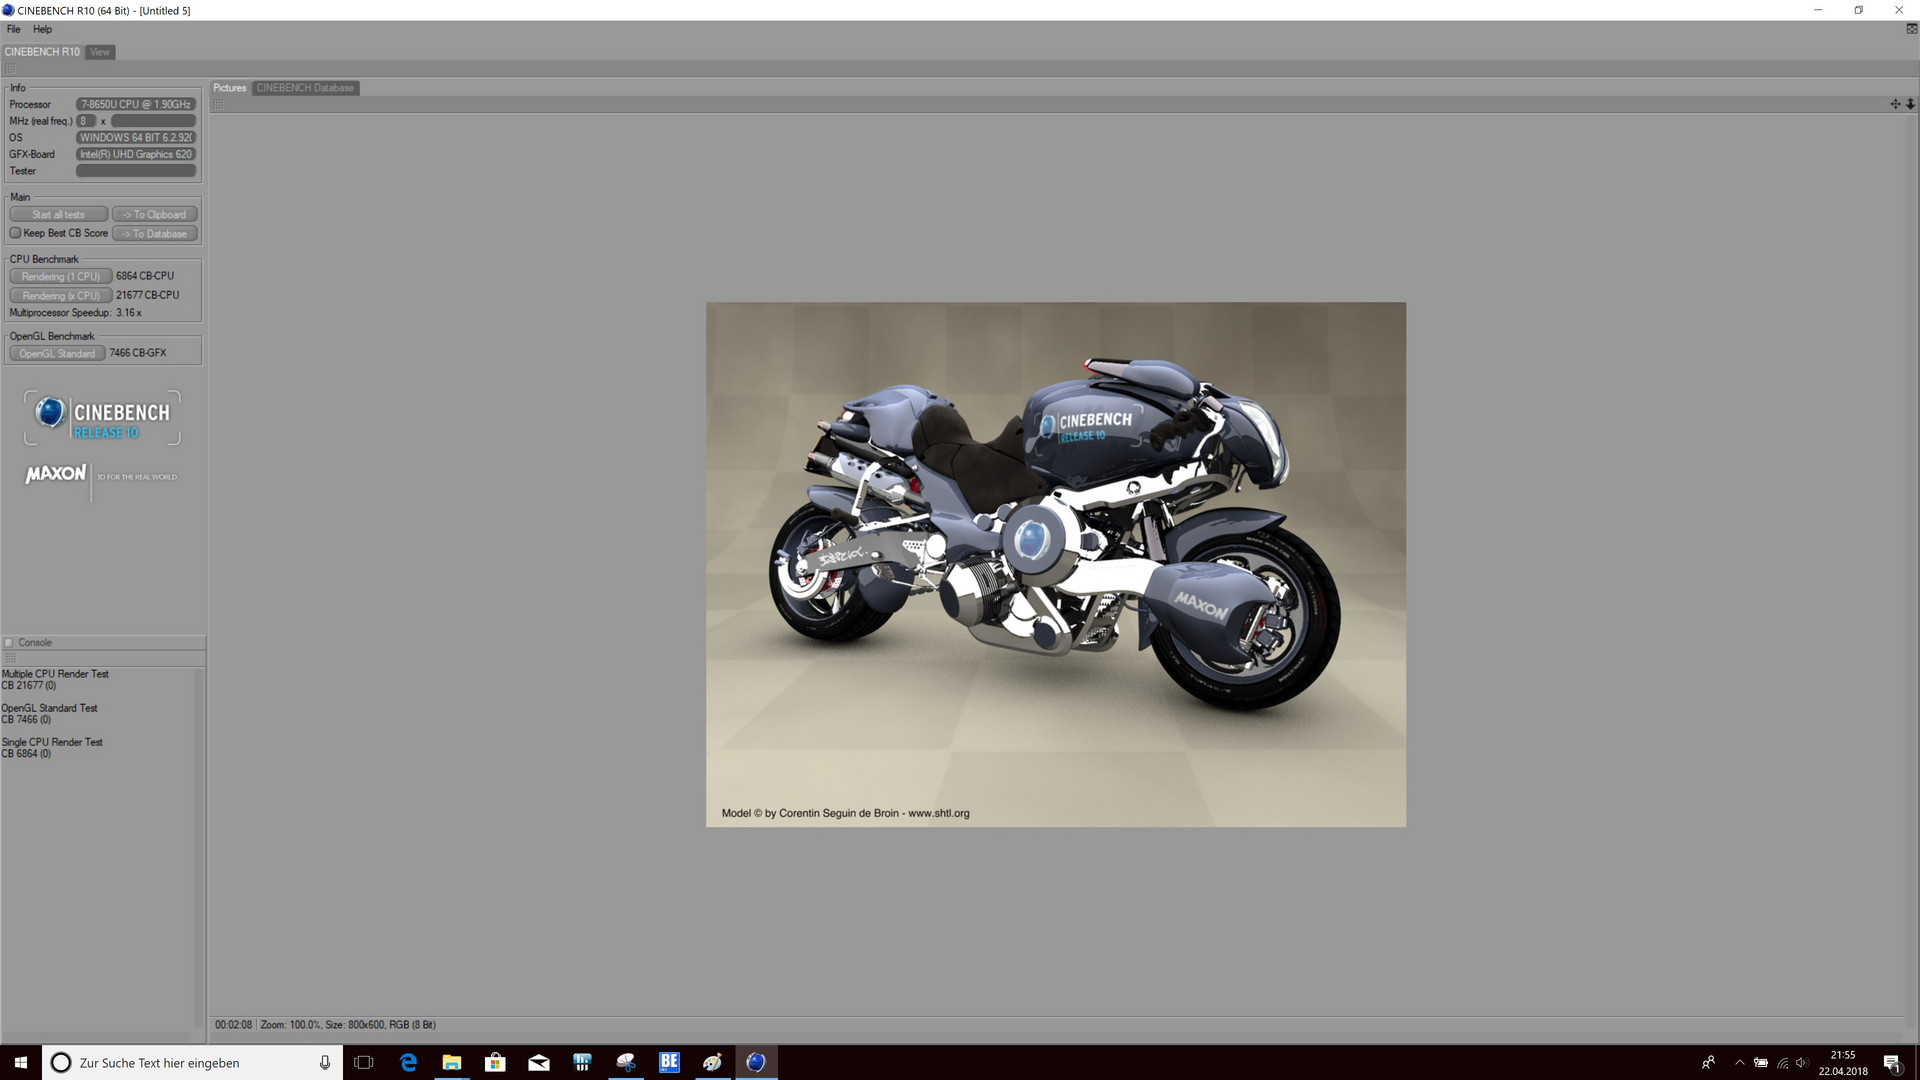
| Cinebench R10 | |
| Rendering Multiple CPUs 64Bit | |
| Média da turma Office (48700 - 80160, n=7, últimos 2 anos) | |
| Dell Latitude 5590 | |
| Fujitsu LifeBook U758 | |
| Média Intel Core i7-8650U (n=1) | |
| Schenker Slim 15 L17 | |
| Rendering Single CPUs 64Bit | |
| Média da turma Office (11106 - 15443, n=7, últimos 2 anos) | |
| Schenker Slim 15 L17 | |
| Dell Latitude 5590 | |
| Fujitsu LifeBook U758 | |
| Média Intel Core i7-8650U (n=1) | |
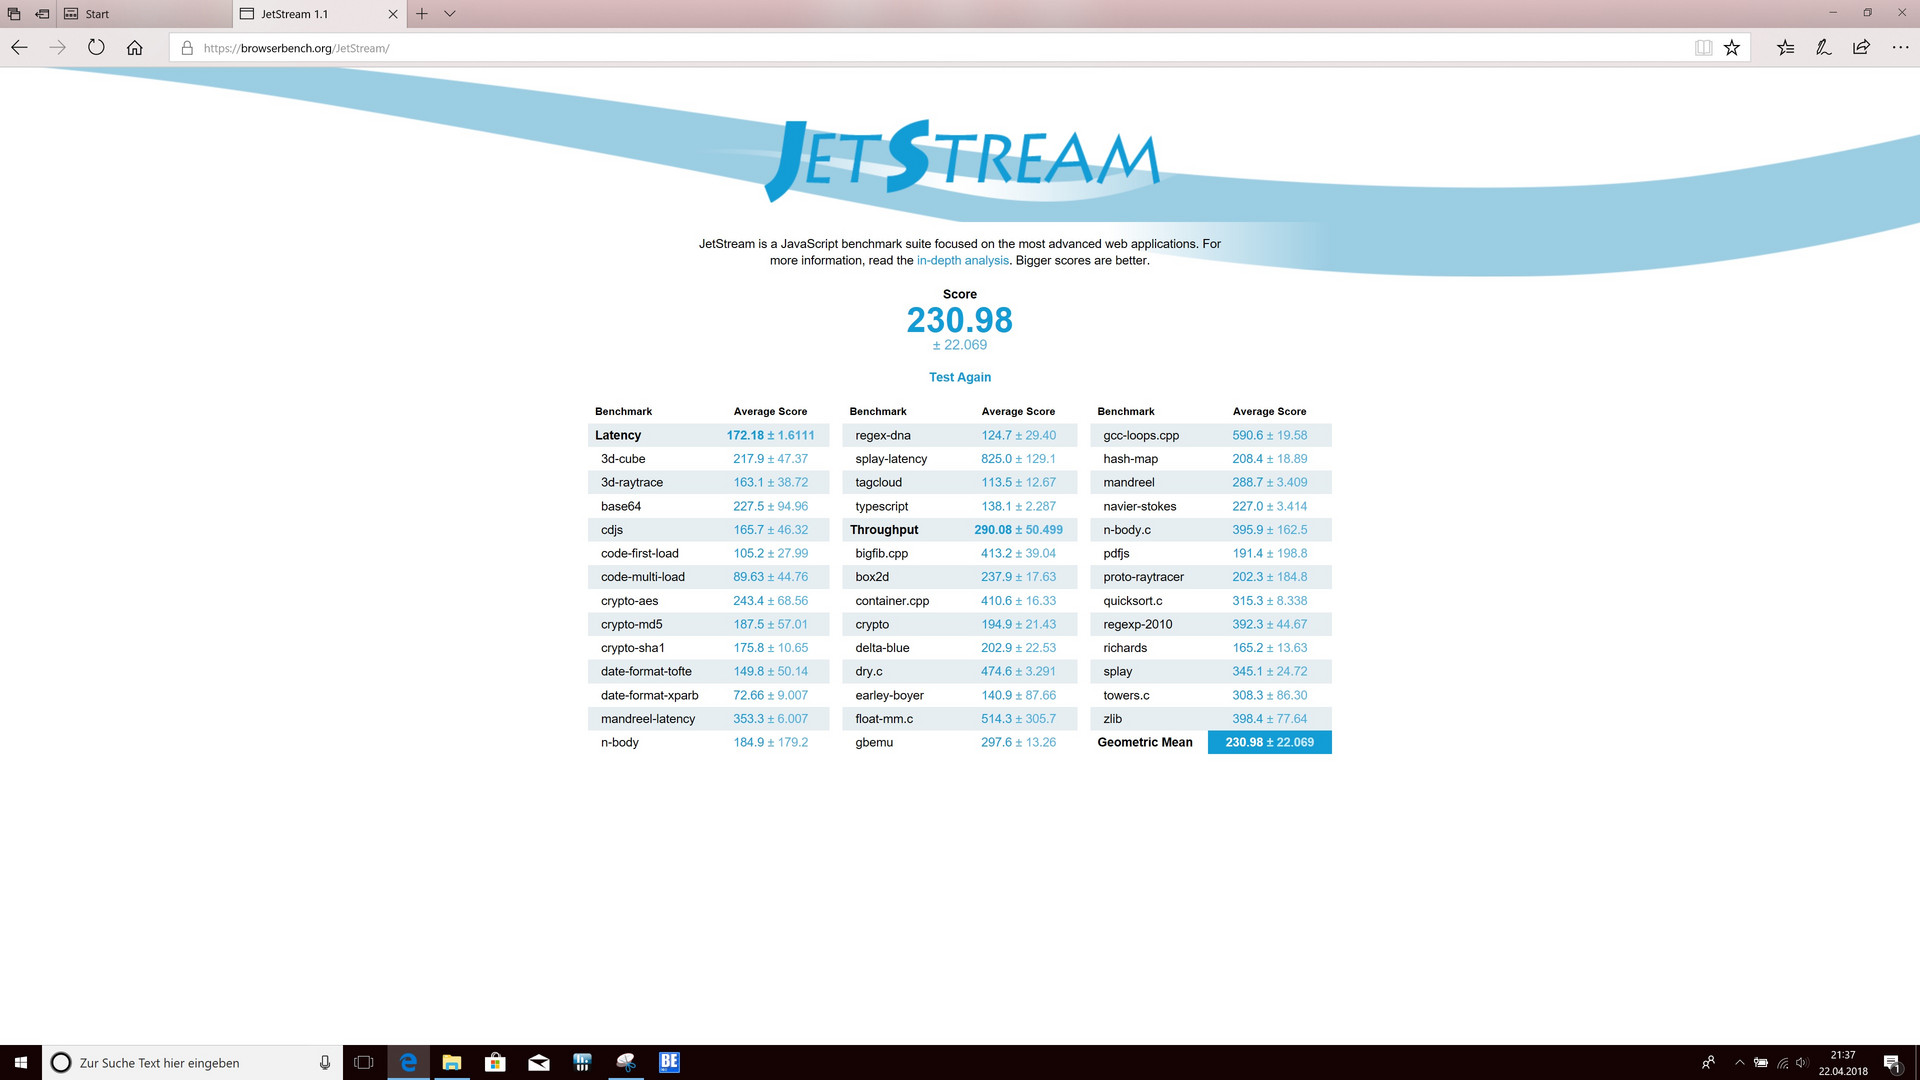
| JetStream 1.1 - 1.1 Total | |
| Schenker Slim 15 L17 | |
| Média Intel Core i7-8650U (145 - 285, n=13) | |
| Lenovo ThinkPad T580-20LAS01H00 | |
| Fujitsu LifeBook U758 | |
| Dell Latitude 5590 | |
| HP EliteBook 850 G5 3JX58EA | |
| Fujitsu LifeBook U757 | |
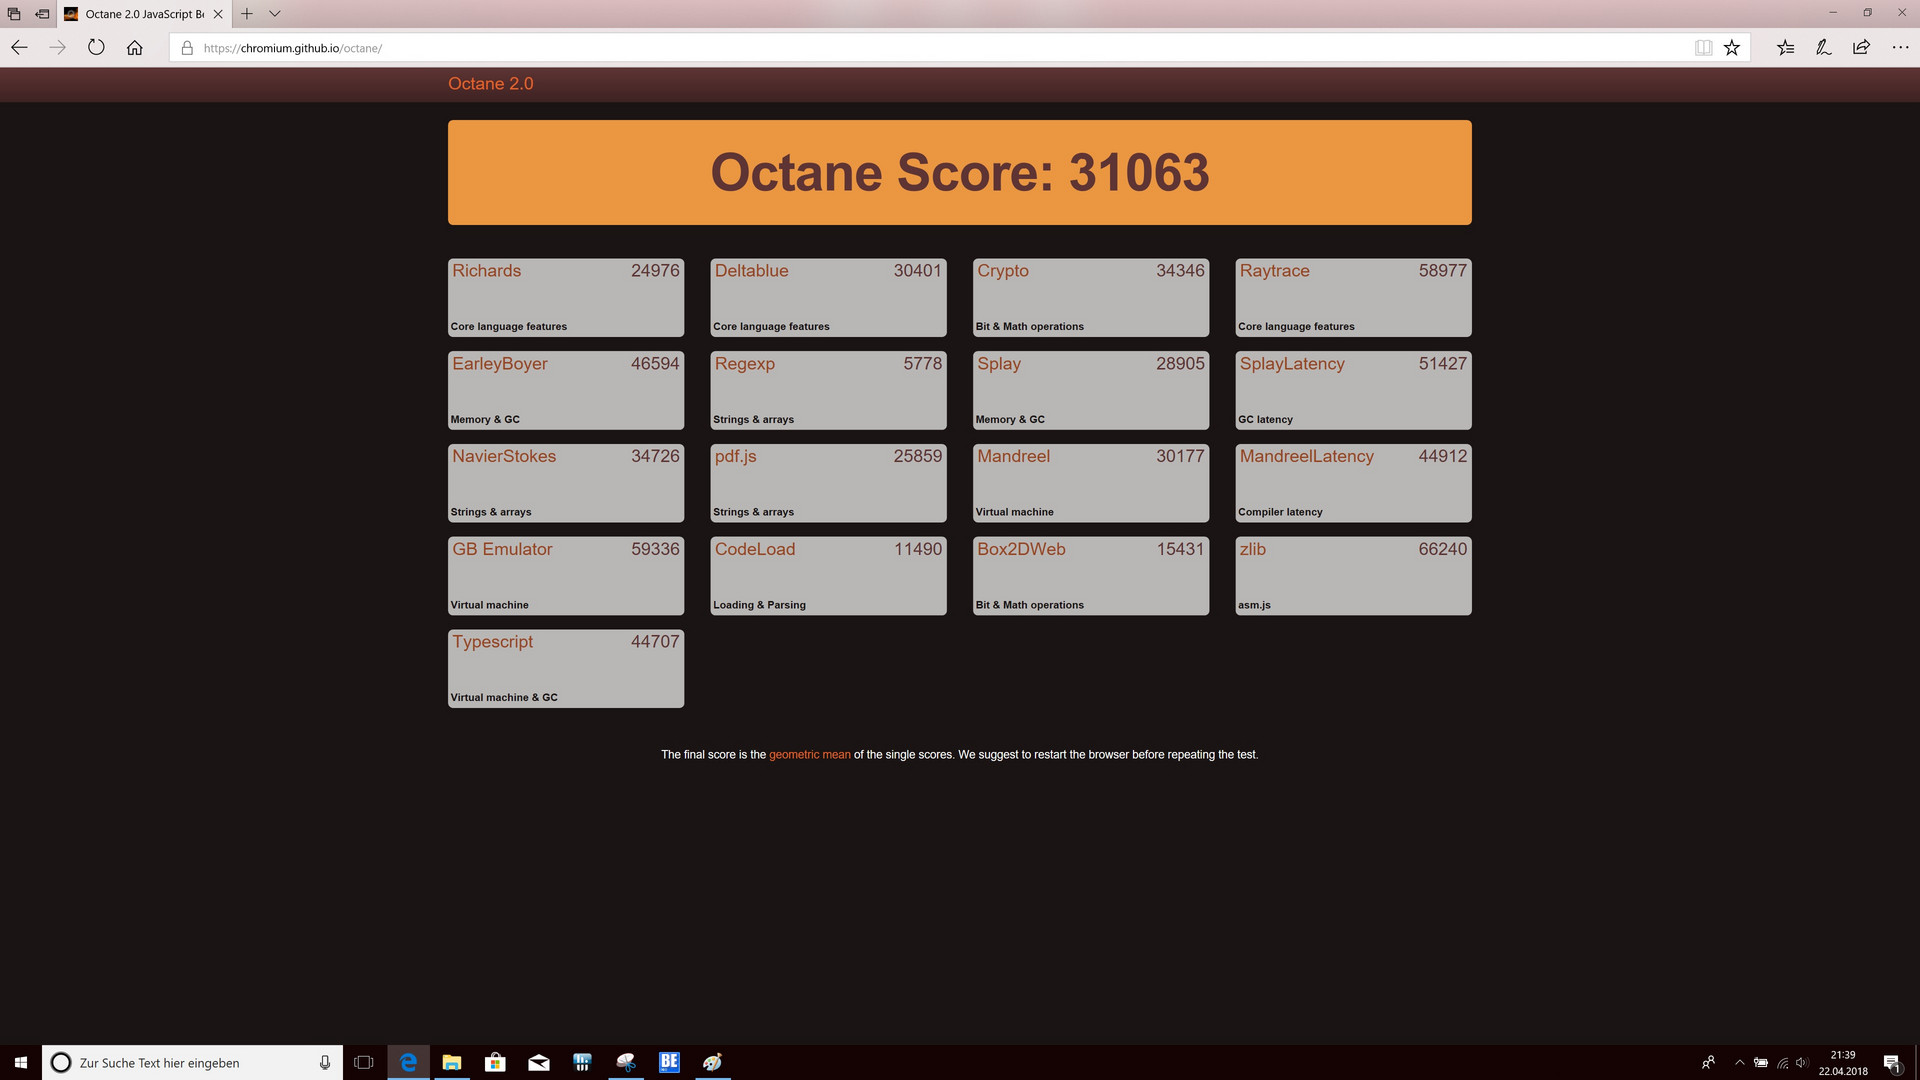
| Octane V2 - Total Score | |
| Média da turma Office (49011 - 126830, n=19, últimos 2 anos) | |
| Schenker Slim 15 L17 | |
| Lenovo ThinkPad T580-20LAS01H00 | |
| Média Intel Core i7-8650U (11491 - 42822, n=9) | |
| Dell Latitude 5590 | |
| Fujitsu LifeBook U758 | |
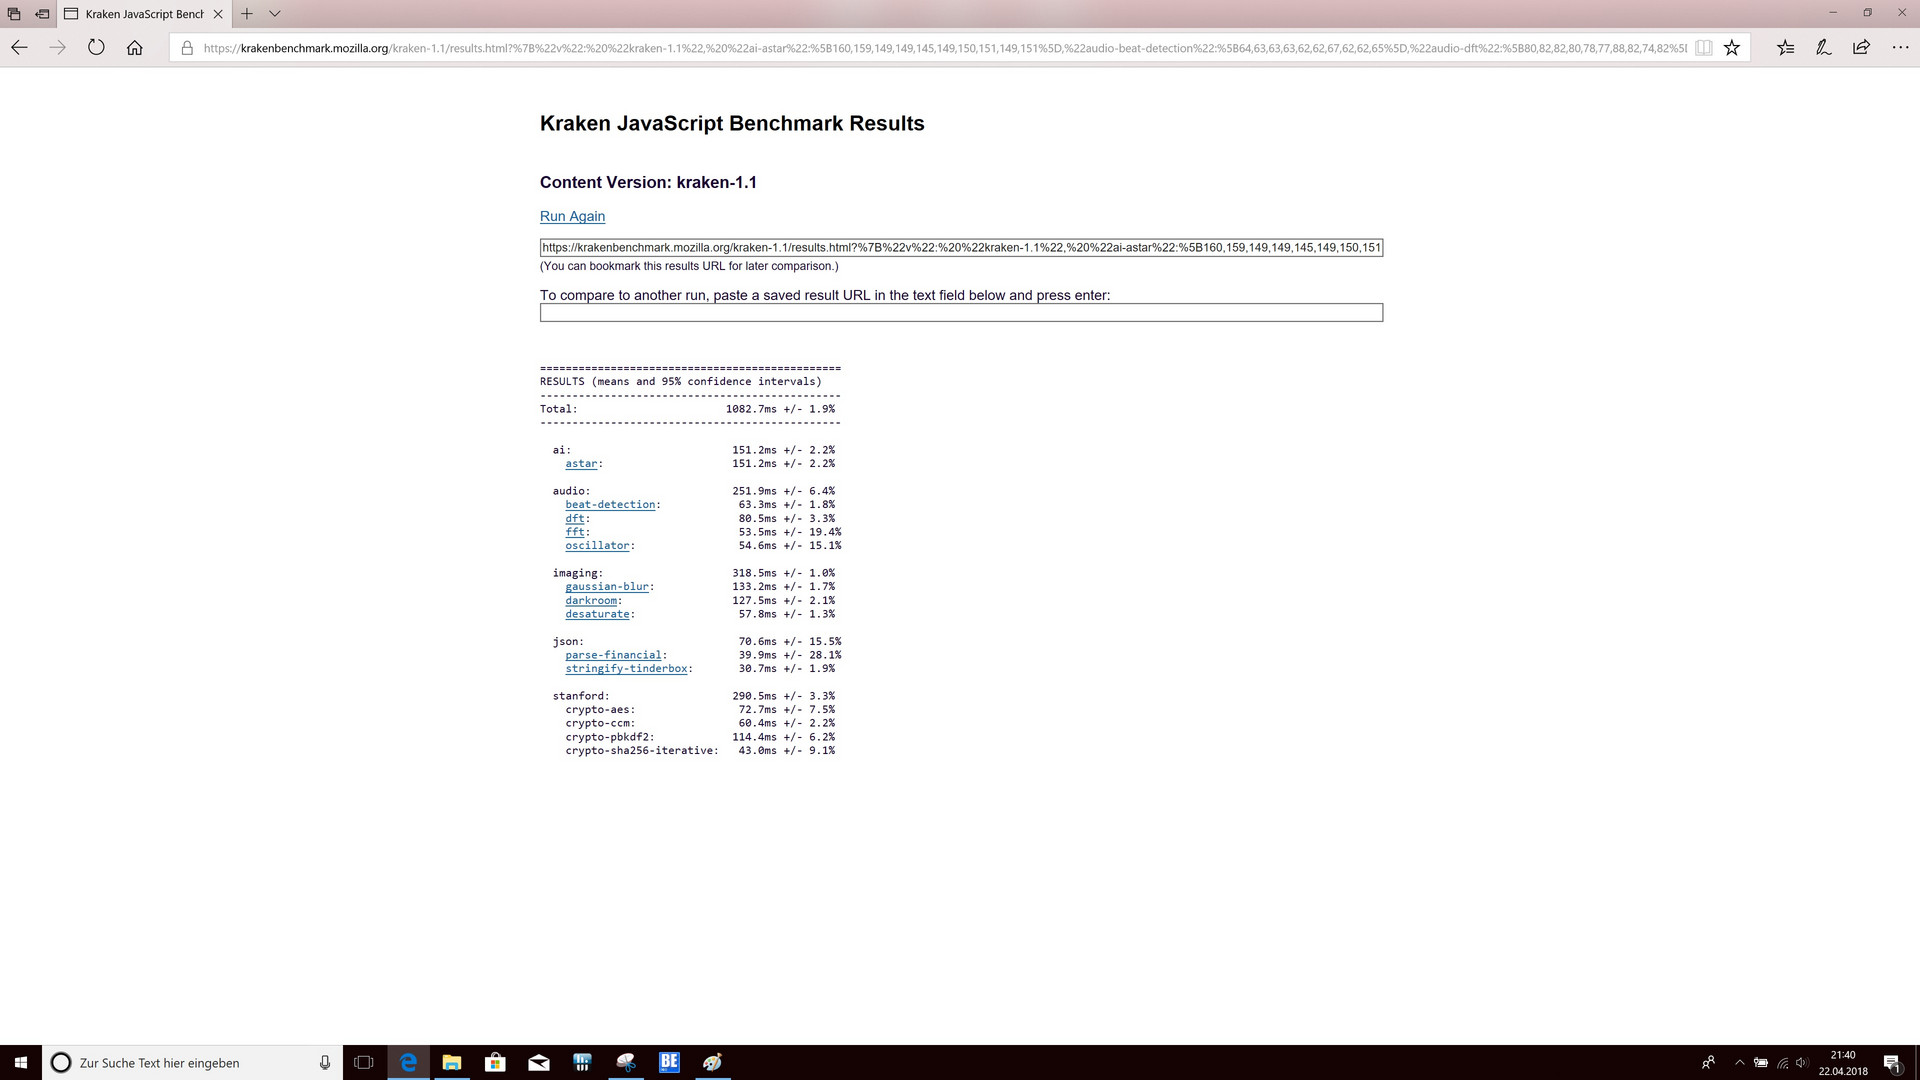
| Mozilla Kraken 1.1 - Total | |
| Dell Latitude 5590 | |
| Lenovo ThinkPad T580-20LAS01H00 | |
| Média Intel Core i7-8650U (809 - 1912, n=10) | |
| Fujitsu LifeBook U758 | |
| Schenker Slim 15 L17 | |
| Média da turma Office (391 - 1297, n=77, últimos 2 anos) | |
* ... menor é melhor
| PCMark 8 | |
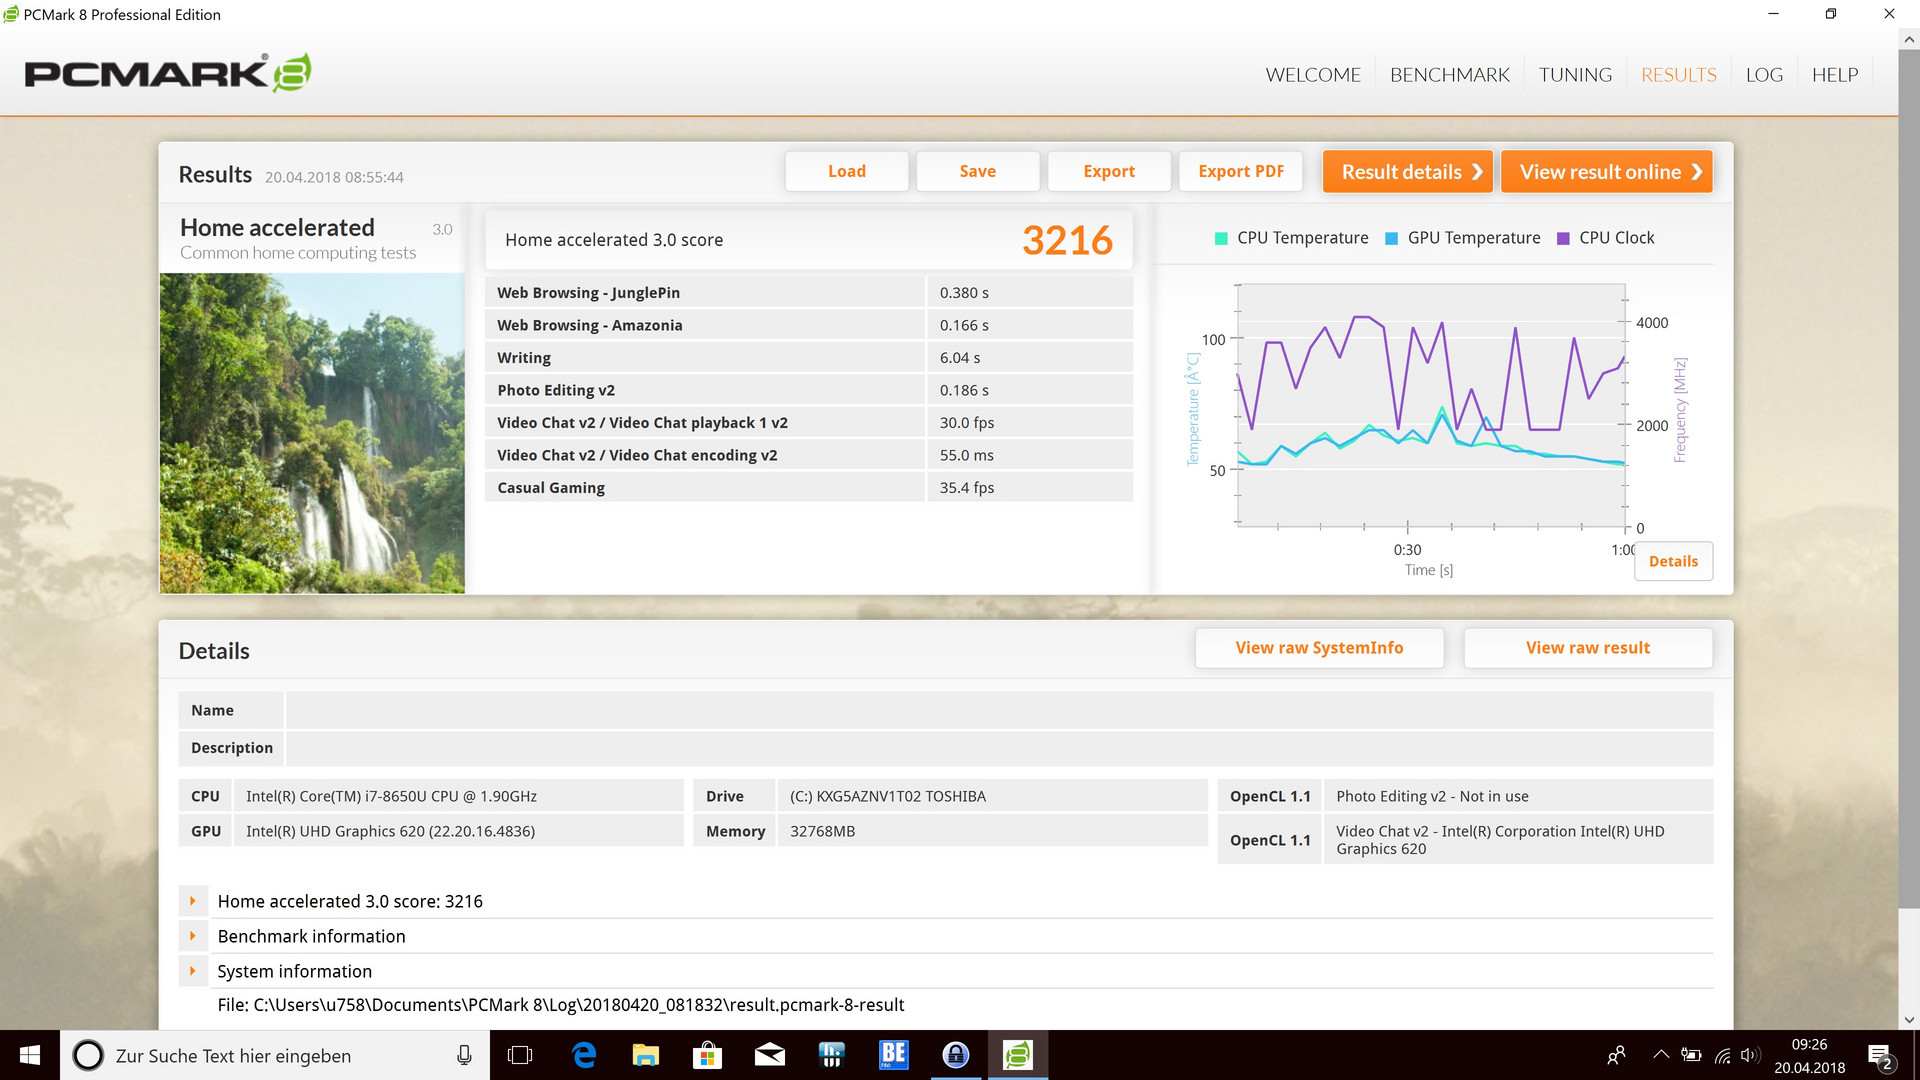
| Home Score Accelerated v2 | |
| Média da turma Office (n=1últimos 2 anos) | |
| Dell Latitude 5590 | |
| Média Intel Core i7-8650U, Intel UHD Graphics 620 (3216 - 4103, n=10) | |
| HP EliteBook 850 G5 3JX58EA | |
| Schenker Slim 15 L17 | |
| Fujitsu LifeBook U757 | |
| Fujitsu LifeBook U758 | |
| Lenovo ThinkPad T580-20LAS01H00 | |
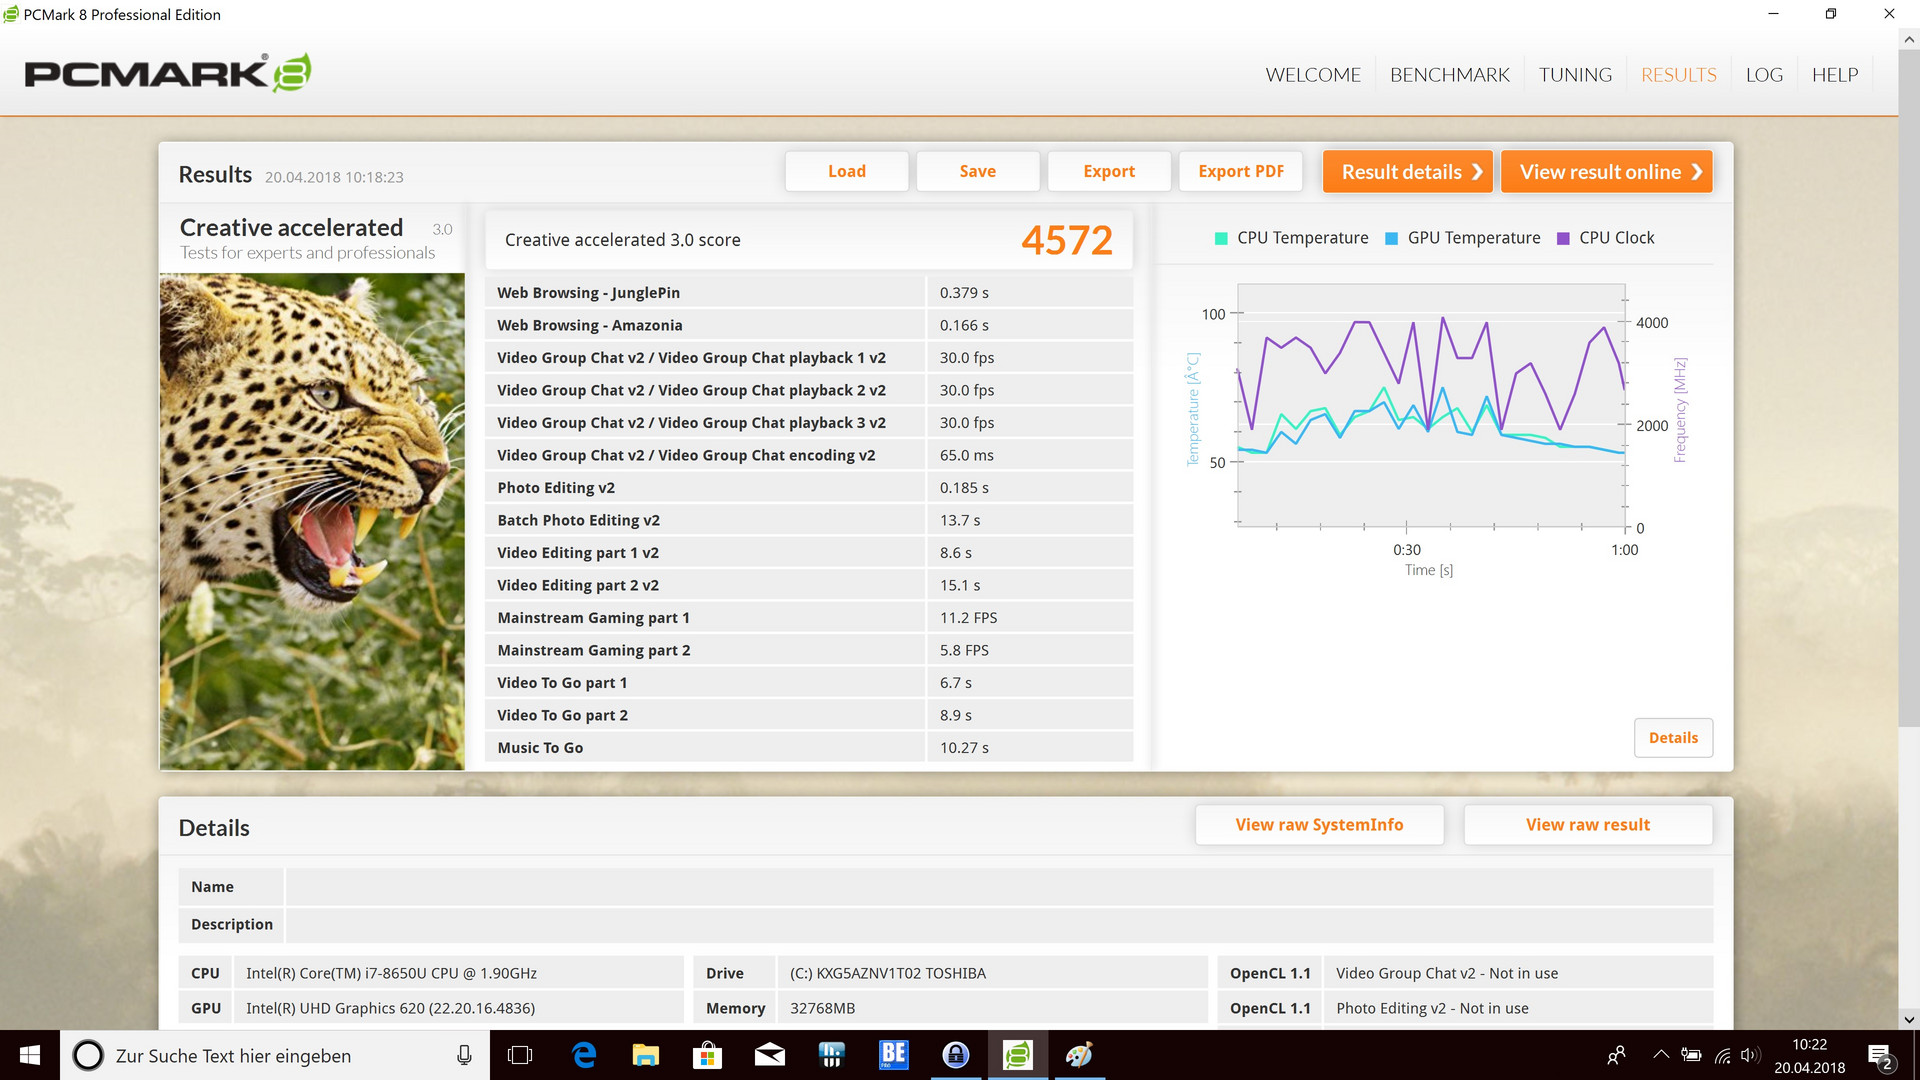
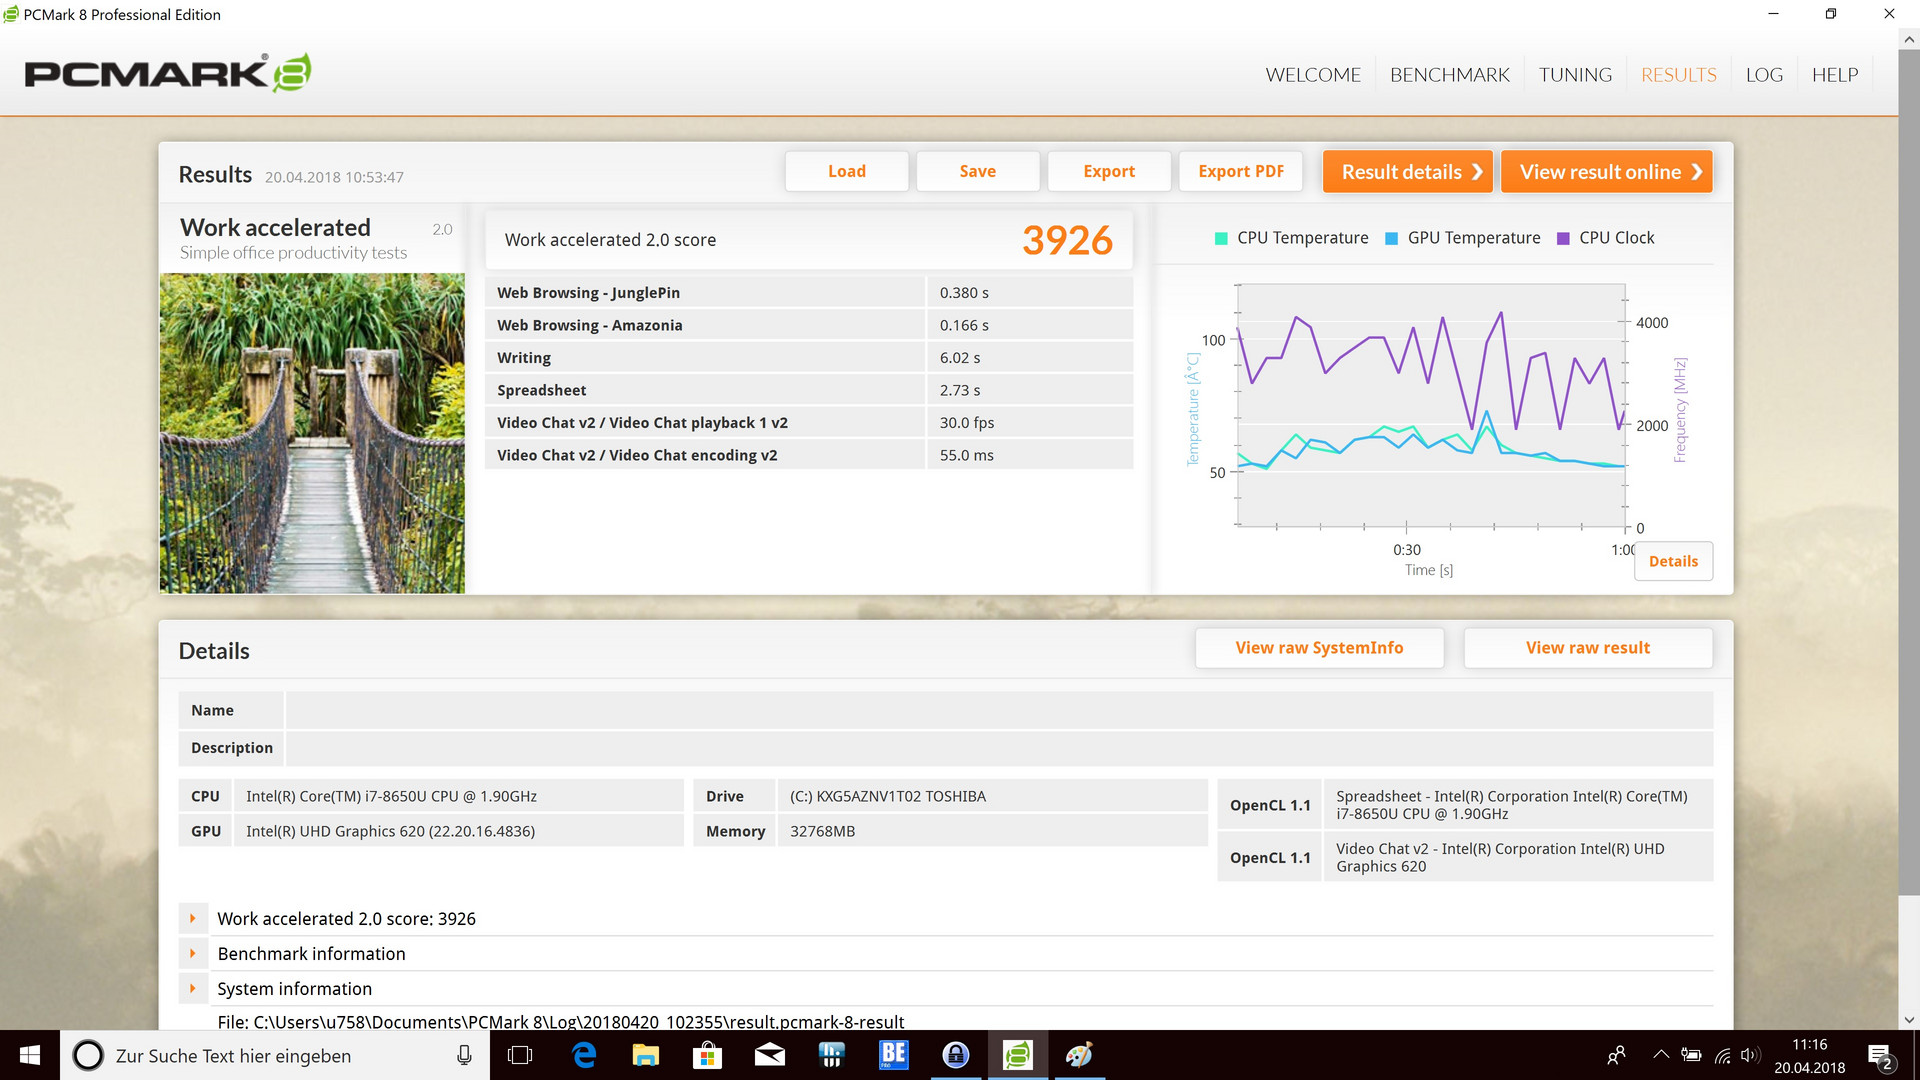
| Work Score Accelerated v2 | |
| Média da turma Office (n=1últimos 2 anos) | |
| Média Intel Core i7-8650U, Intel UHD Graphics 620 (3926 - 5200, n=8) | |
| Dell Latitude 5590 | |
| Lenovo ThinkPad T580-20LAS01H00 | |
| Fujitsu LifeBook U758 | |
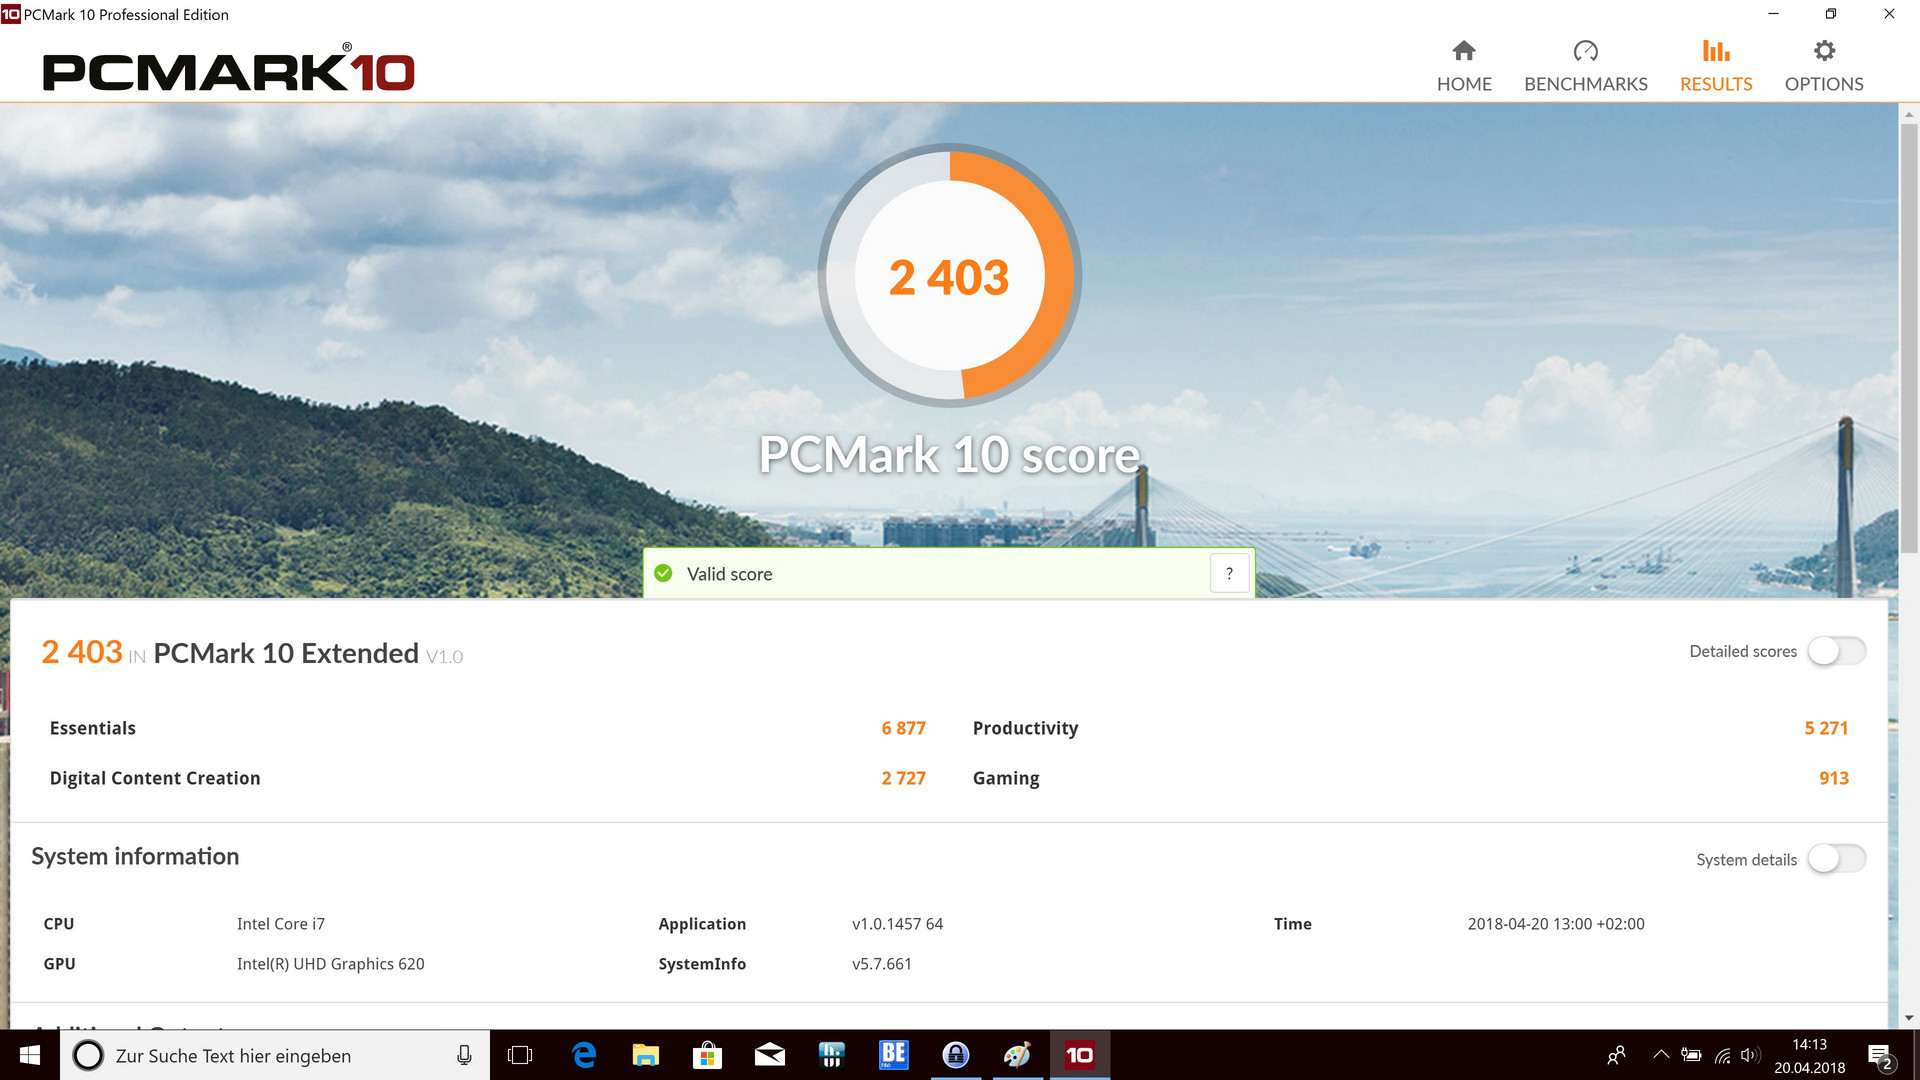
| PCMark 10 | |
| Score | |
| Média da turma Office (2601 - 9298, n=67, últimos 2 anos) | |
| Média Intel Core i7-8650U, Intel UHD Graphics 620 (2403 - 4078, n=10) | |
| HP EliteBook 850 G5 3JX58EA | |
| Lenovo ThinkPad T580-20LAS01H00 | |
| Schenker Slim 15 L17 | |
| Dell Latitude 5590 | |
| Fujitsu LifeBook U758 | |
| Productivity | |
| Média da turma Office (5336 - 17243, n=67, últimos 2 anos) | |
| Schenker Slim 15 L17 | |
| Média Intel Core i7-8650U, Intel UHD Graphics 620 (5271 - 7142, n=10) | |
| Dell Latitude 5590 | |
| HP EliteBook 850 G5 3JX58EA | |
| Fujitsu LifeBook U758 | |
| Lenovo ThinkPad T580-20LAS01H00 | |
| PCMark 8 Home Score Accelerated v2 | 3216 pontos | |
| PCMark 8 Creative Score Accelerated v2 | 4572 pontos | |
| PCMark 8 Work Score Accelerated v2 | 3926 pontos | |
| PCMark 10 Score | 2403 pontos | |
Ajuda | ||
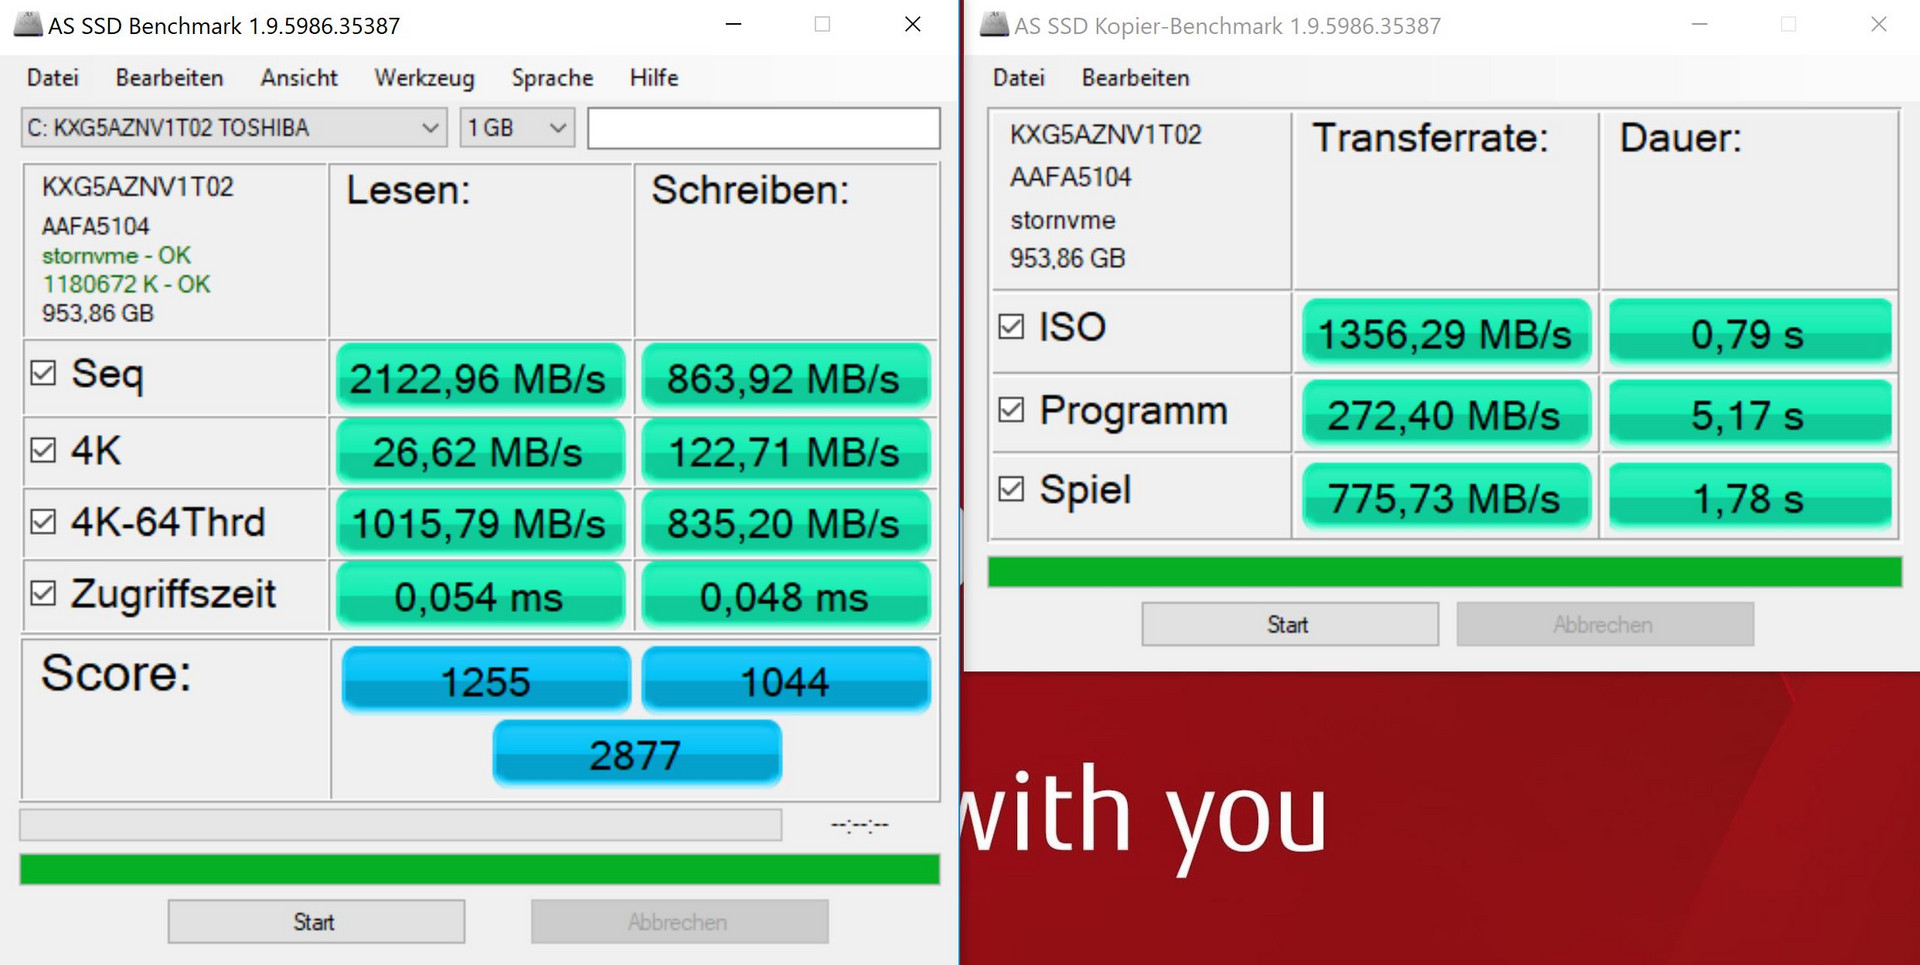
| Fujitsu LifeBook U758 Toshiba KXG5AZNV1T02 | Lenovo ThinkPad T580-20LAS01H00 Samsung SSD PM981 MZVLB512HAJQ | HP EliteBook 850 G5 3JX58EA Toshiba XG5 KXG50ZNV256G | Dell Latitude 5590 SK hynix SC311 M.2 | Fujitsu LifeBook U757 Samsung CM871a MZNTY256HDHP | Schenker Slim 15 L17 Samsung SSD 960 Pro 512 GB m.2 | |
|---|---|---|---|---|---|---|
| CrystalDiskMark 3.0 | 1% | -17% | -41% | -30% | 51% | |
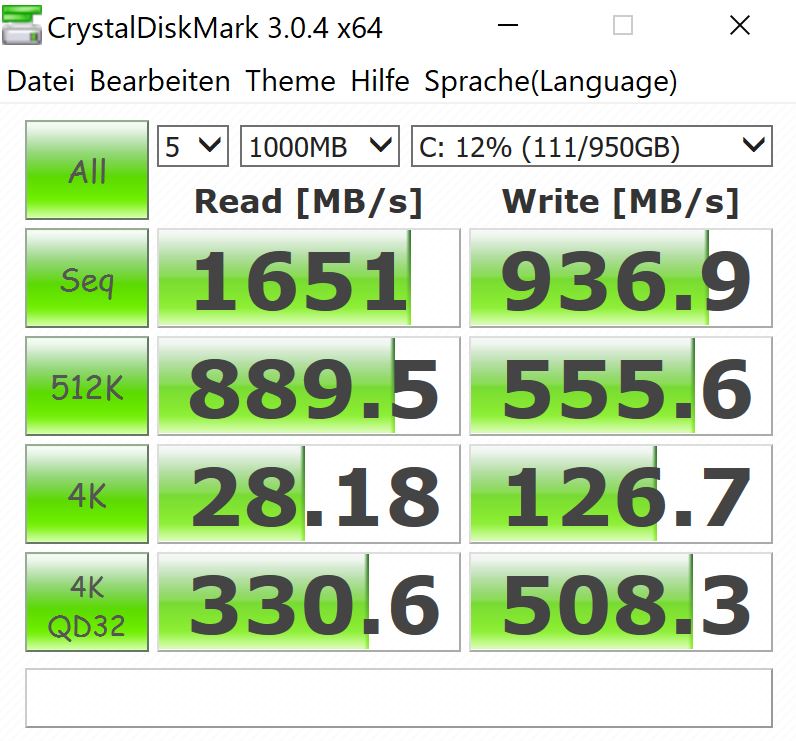
| Read Seq (MB/s) | 1651 | 944 -43% | 2069 25% | 498.8 -70% | 509 -69% | 1958 19% |
| Write Seq (MB/s) | 937 | 924 -1% | 393.4 -58% | 436.4 -53% | 488.4 -48% | 1776 90% |
| Read 512 (MB/s) | 890 | 555 -38% | 914 3% | 352.9 -60% | 414.3 -53% | 819 -8% |
| Write 512 (MB/s) | 556 | 565 2% | 284.9 -49% | 322.8 -42% | 321.7 -42% | 1157 108% |
| Read 4k (MB/s) | 28.18 | 63.9 127% | 31.76 13% | 29.11 3% | 36.43 29% | 54 92% |
| Write 4k (MB/s) | 126.7 | 135.3 7% | 99.2 -22% | 74.5 -41% | 88.4 -30% | 157.7 24% |
| Read 4k QD32 (MB/s) | 330.6 | 336.2 2% | 282 -15% | 276.4 -16% | 402.8 22% | 605 83% |
| Write 4k QD32 (MB/s) | 508 | 264.9 -48% | 338.5 -33% | 267 -47% | 256.7 -49% | 511 1% |

| 3DMark | |
| 1280x720 Cloud Gate Standard Graphics | |
| Média da turma Office (11640 - 118515, n=38, últimos 2 anos) | |
| Lenovo ThinkPad T580-20LAS01H00 | |
| Schenker Slim 15 L17 | |
| Média Intel UHD Graphics 620 (6205 - 16400, n=225) | |
| Fujitsu LifeBook U758 | |
| Dell Latitude 5590 | |
| HP EliteBook 850 G5 3JX58EA | |
| 1920x1080 Fire Strike Graphics | |
| Média da turma Office (736 - 21871, n=74, últimos 2 anos) | |
| Lenovo ThinkPad T580-20LAS01H00 | |
| Schenker Slim 15 L17 | |
| Fujitsu LifeBook U758 | |
| Média Intel UHD Graphics 620 (557 - 2608, n=213) | |
| HP EliteBook 850 G5 3JX58EA | |
| Dell Latitude 5590 | |
| 3DMark 11 - 1280x720 Performance GPU | |
| Média da turma Office (2551 - 18313, n=71, últimos 2 anos) | |
| Lenovo ThinkPad T580-20LAS01H00 | |
| Média Intel UHD Graphics 620 (1144 - 3432, n=244) | |
| Schenker Slim 15 L17 | |
| HP EliteBook 850 G5 3JX58EA | |
| Fujitsu LifeBook U758 | |
| Dell Latitude 5590 | |
| Fujitsu LifeBook U757 | |

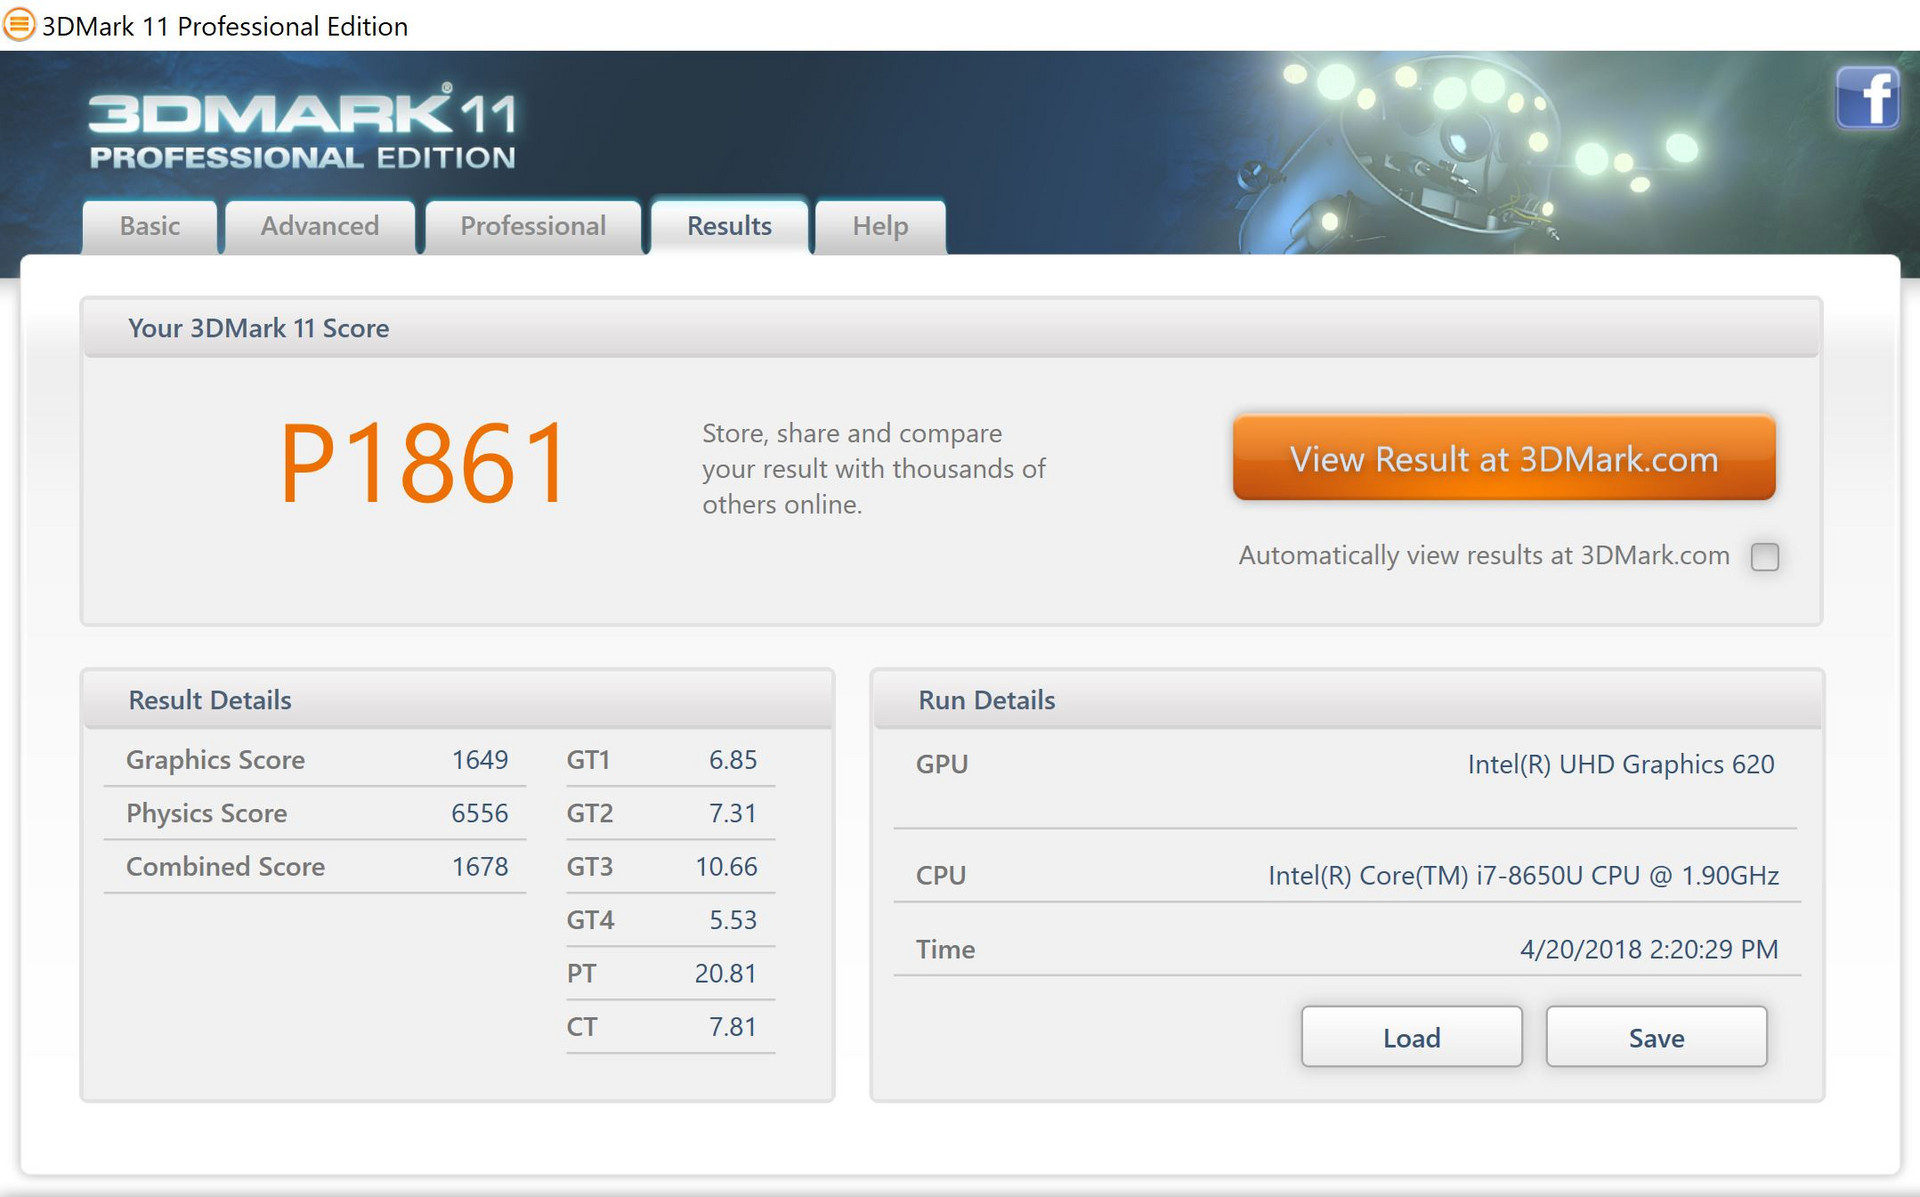
| 3DMark 11 Performance | 1861 pontos | |
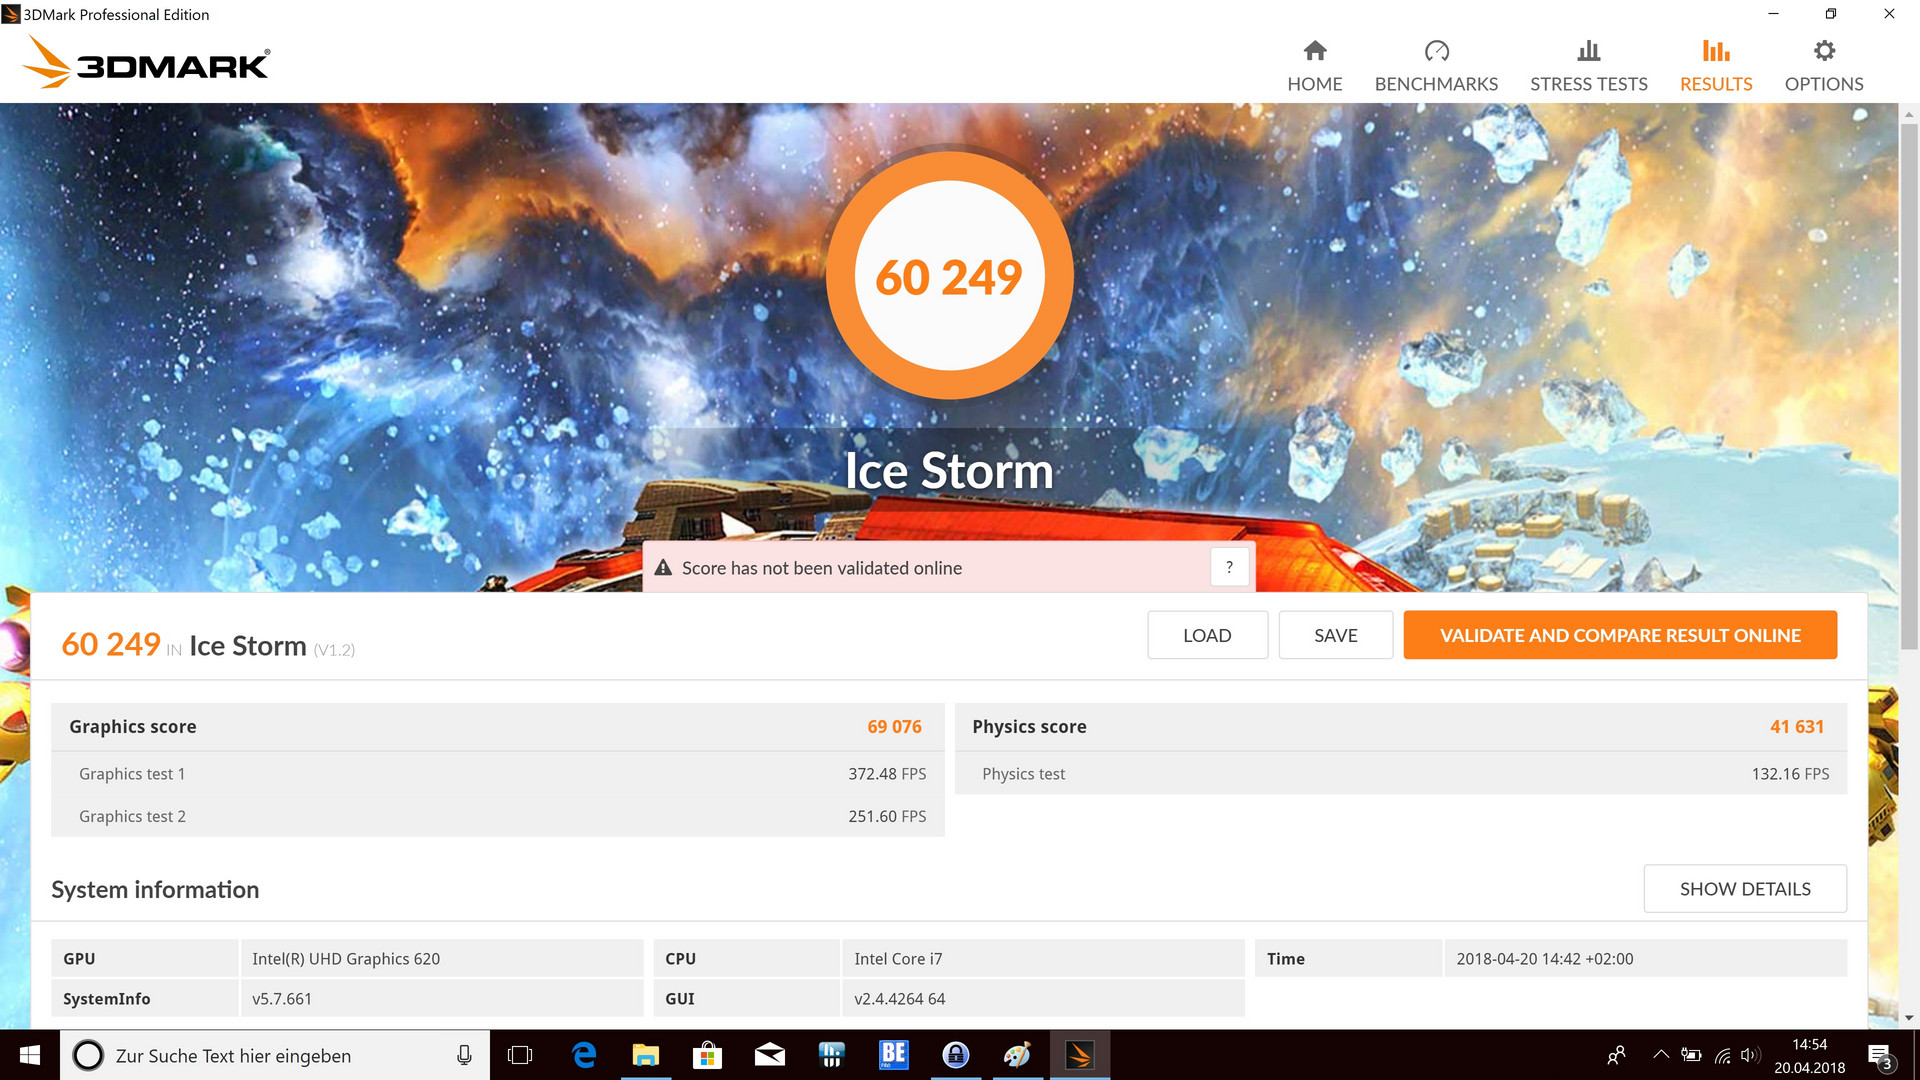
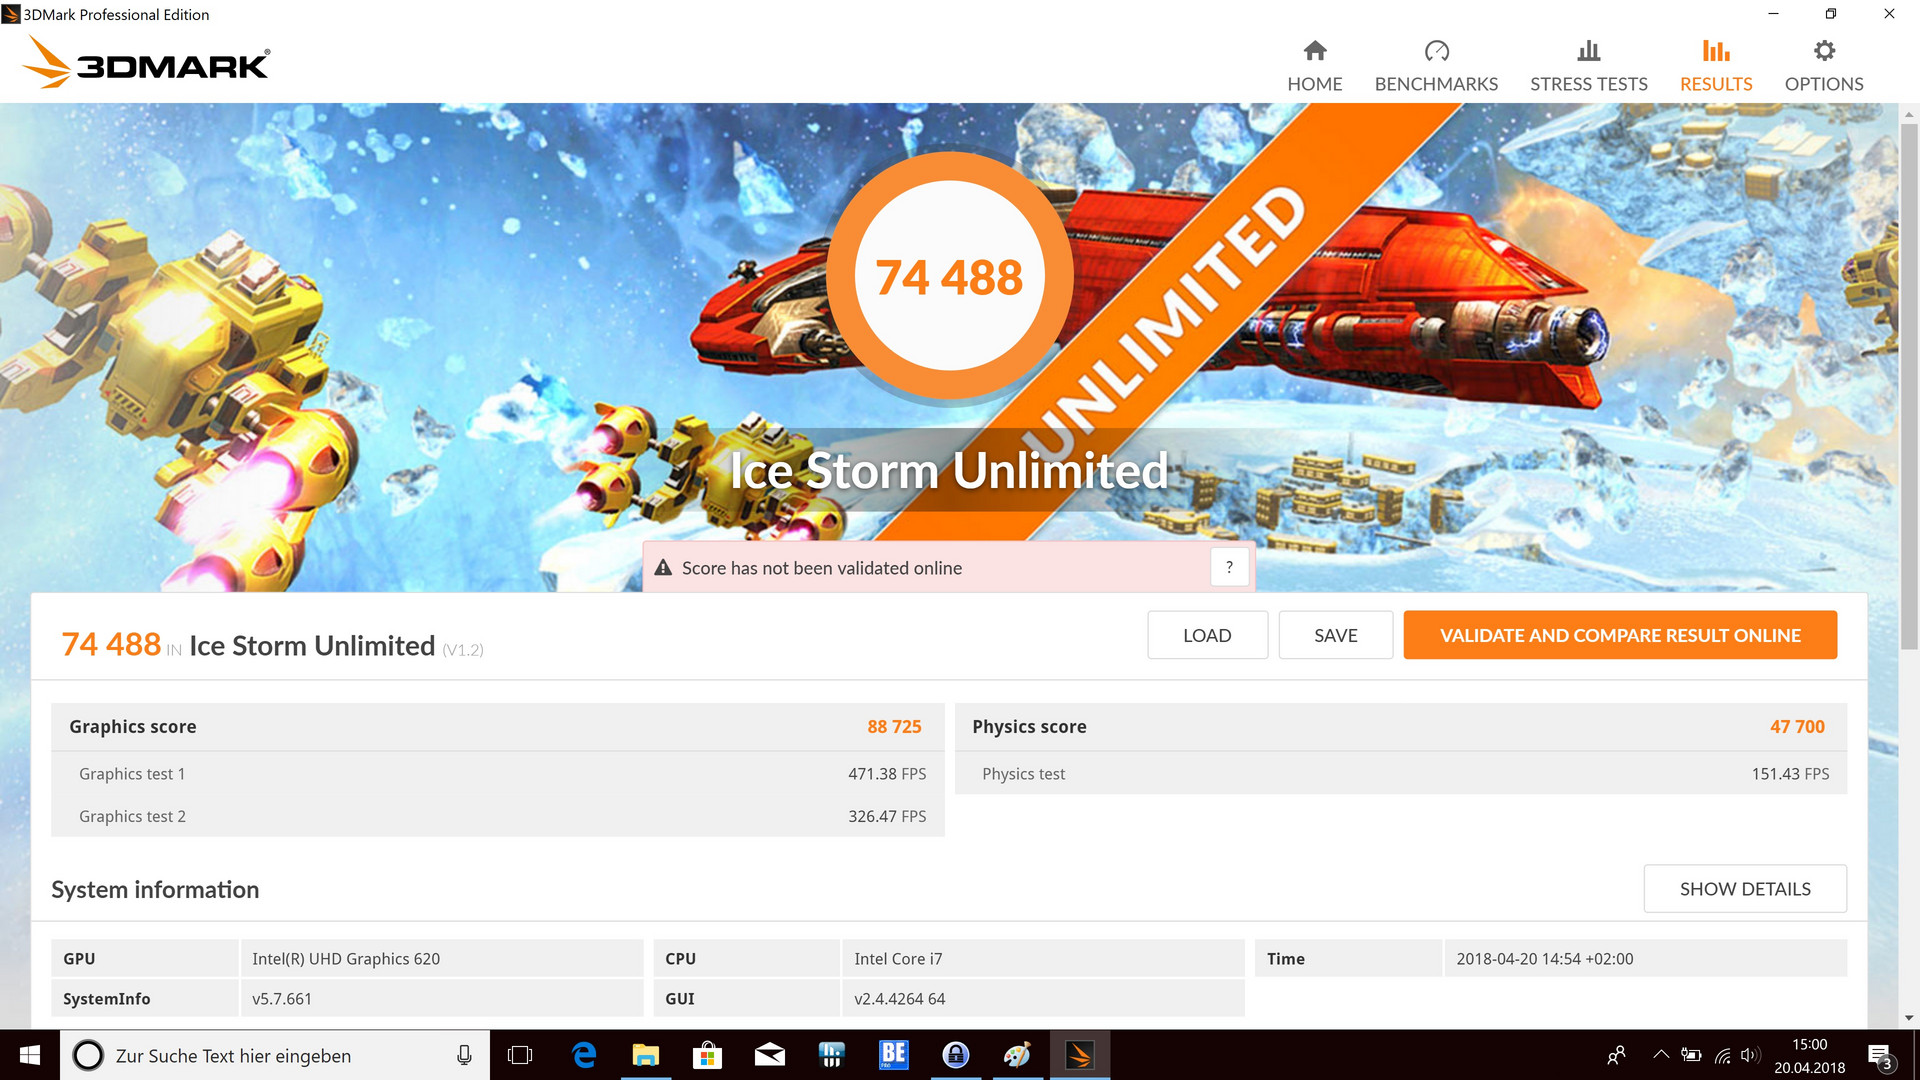
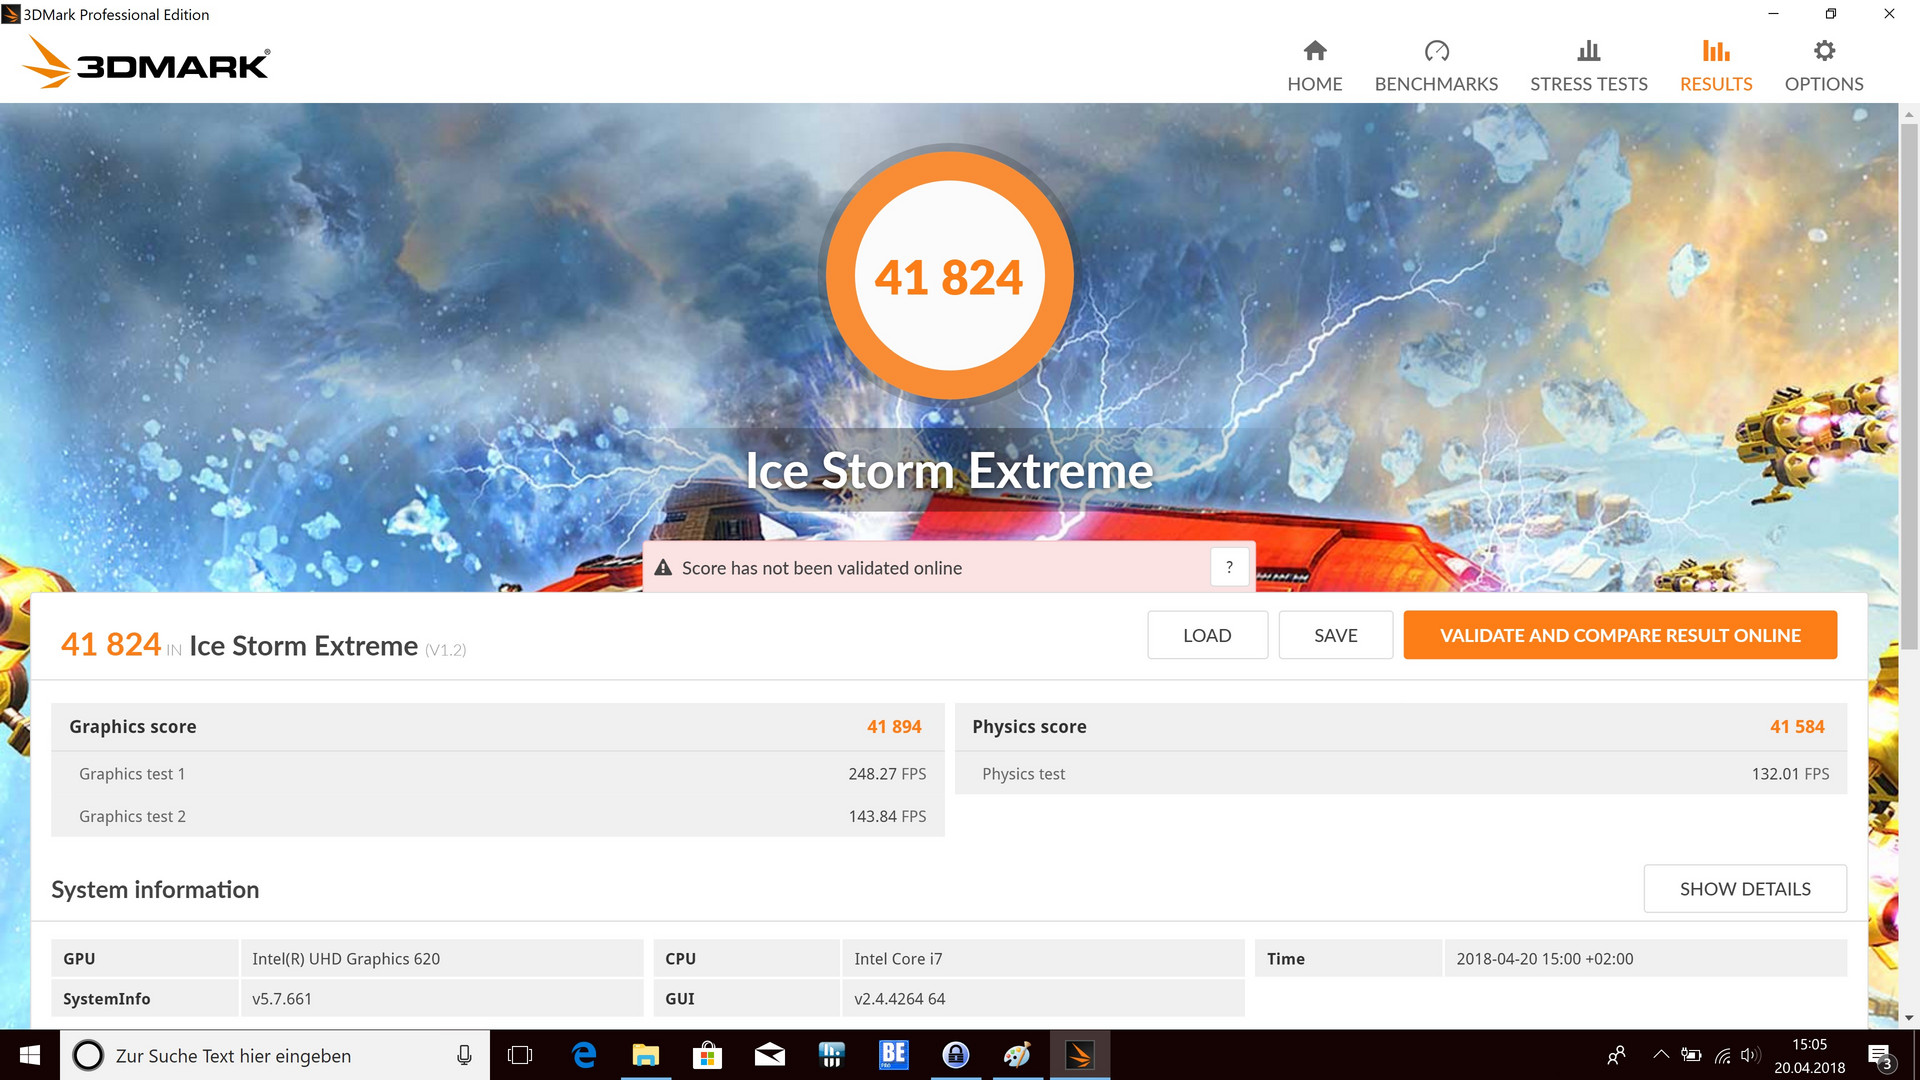
| 3DMark Ice Storm Standard Score | 60249 pontos | |
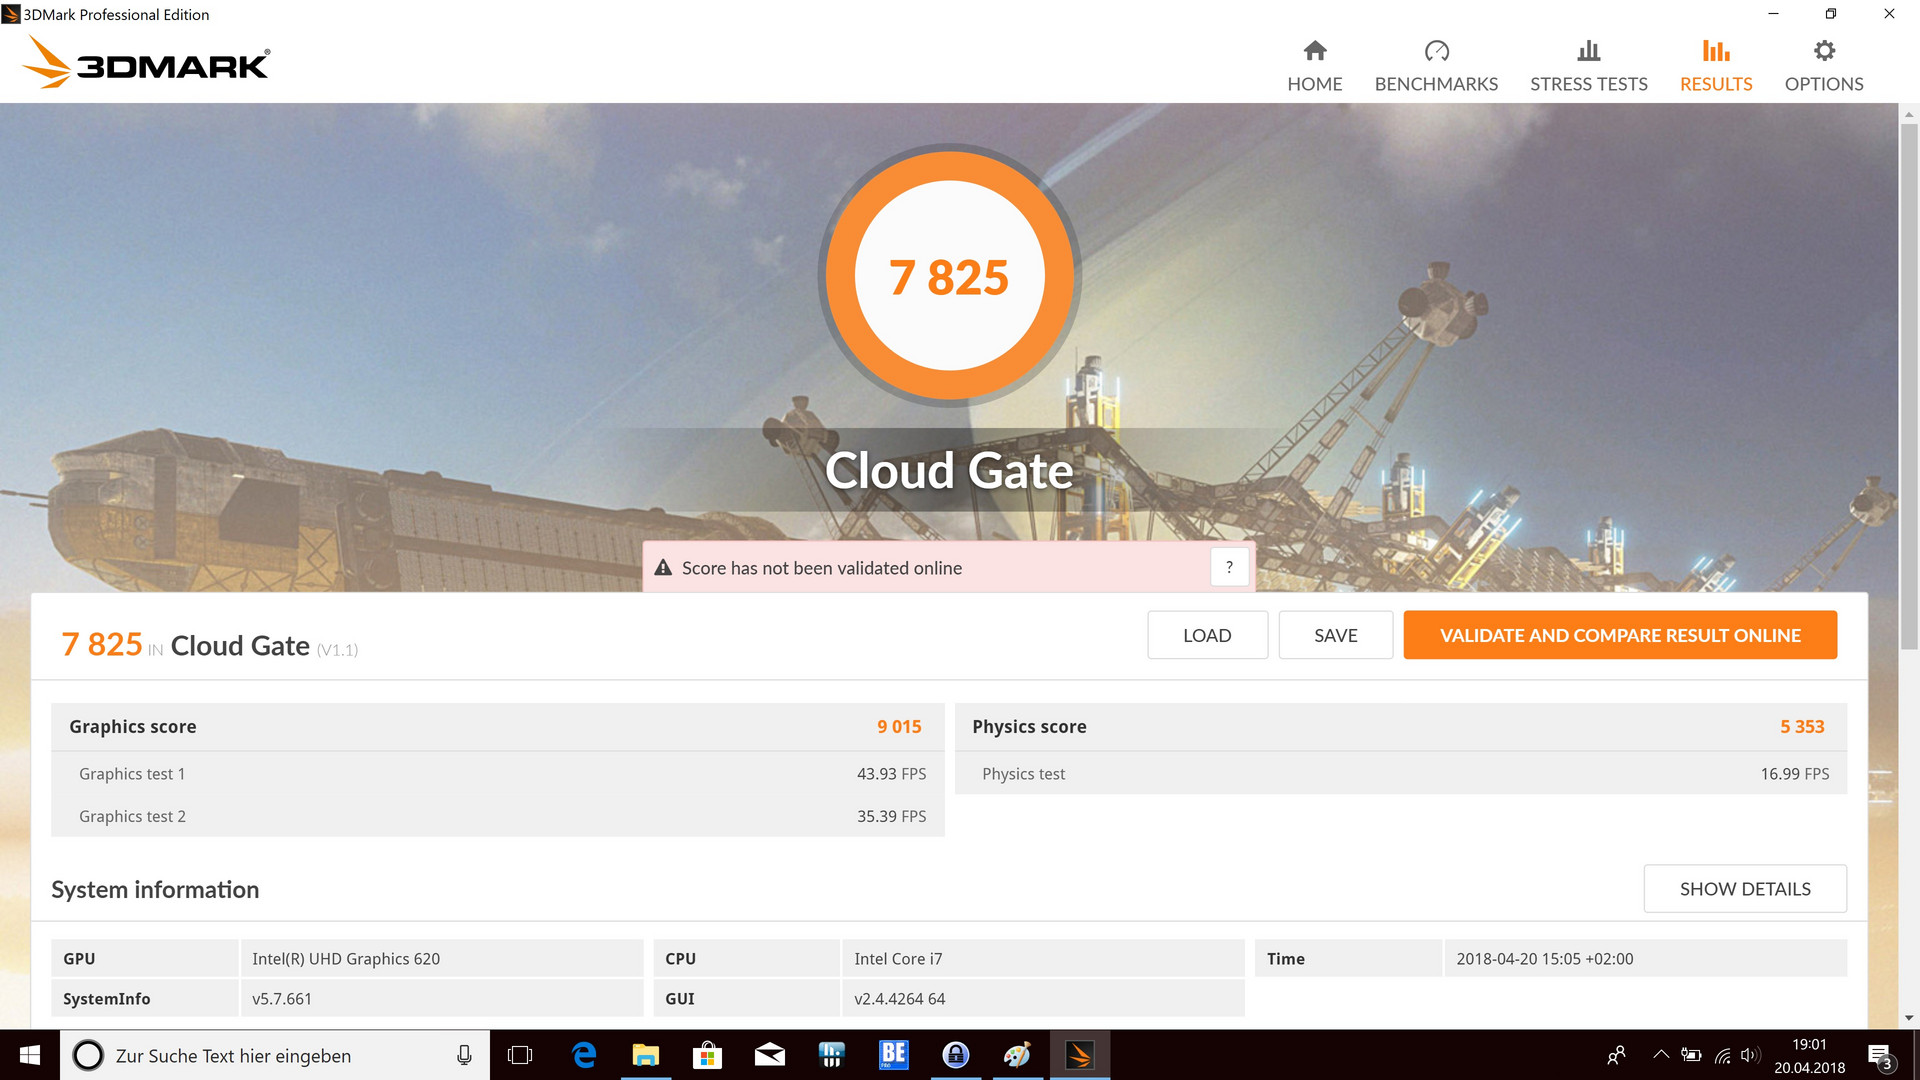
| 3DMark Cloud Gate Standard Score | 7825 pontos | |
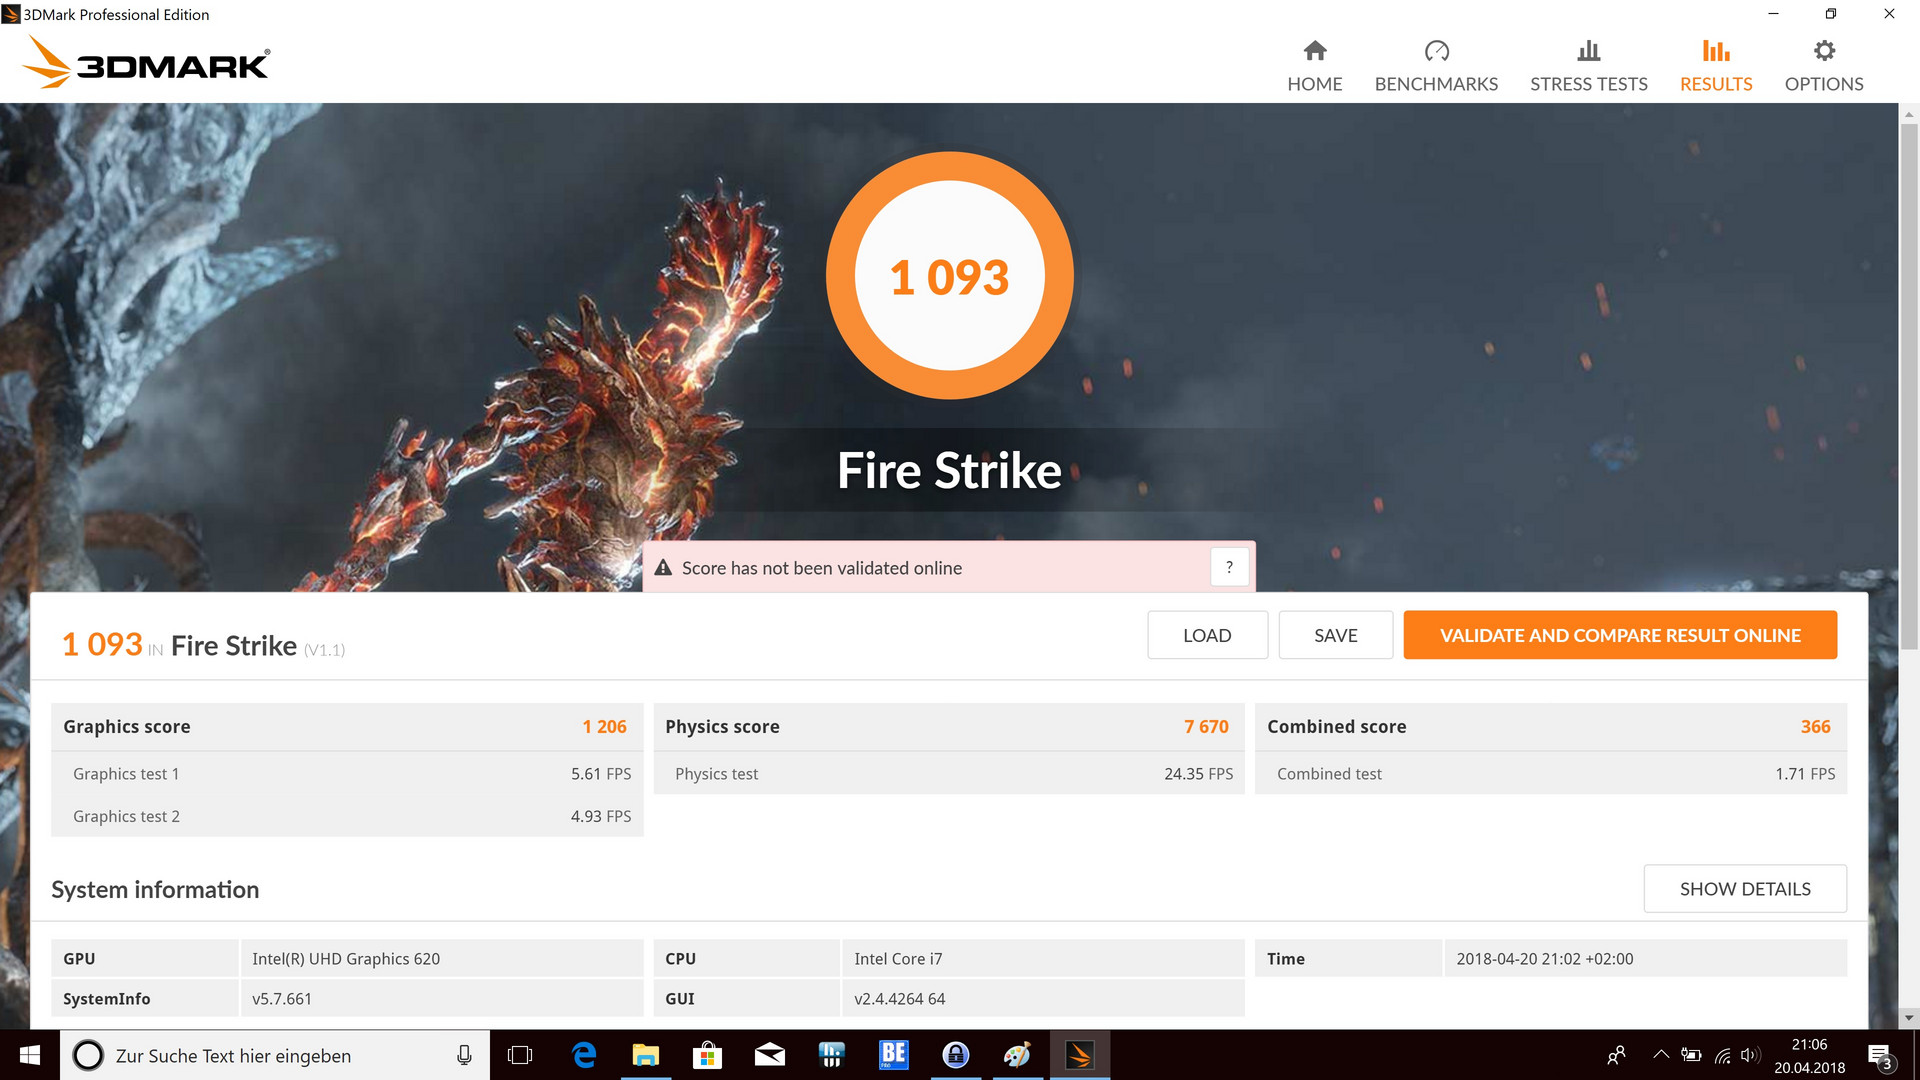
| 3DMark Fire Strike Score | 1093 pontos | |
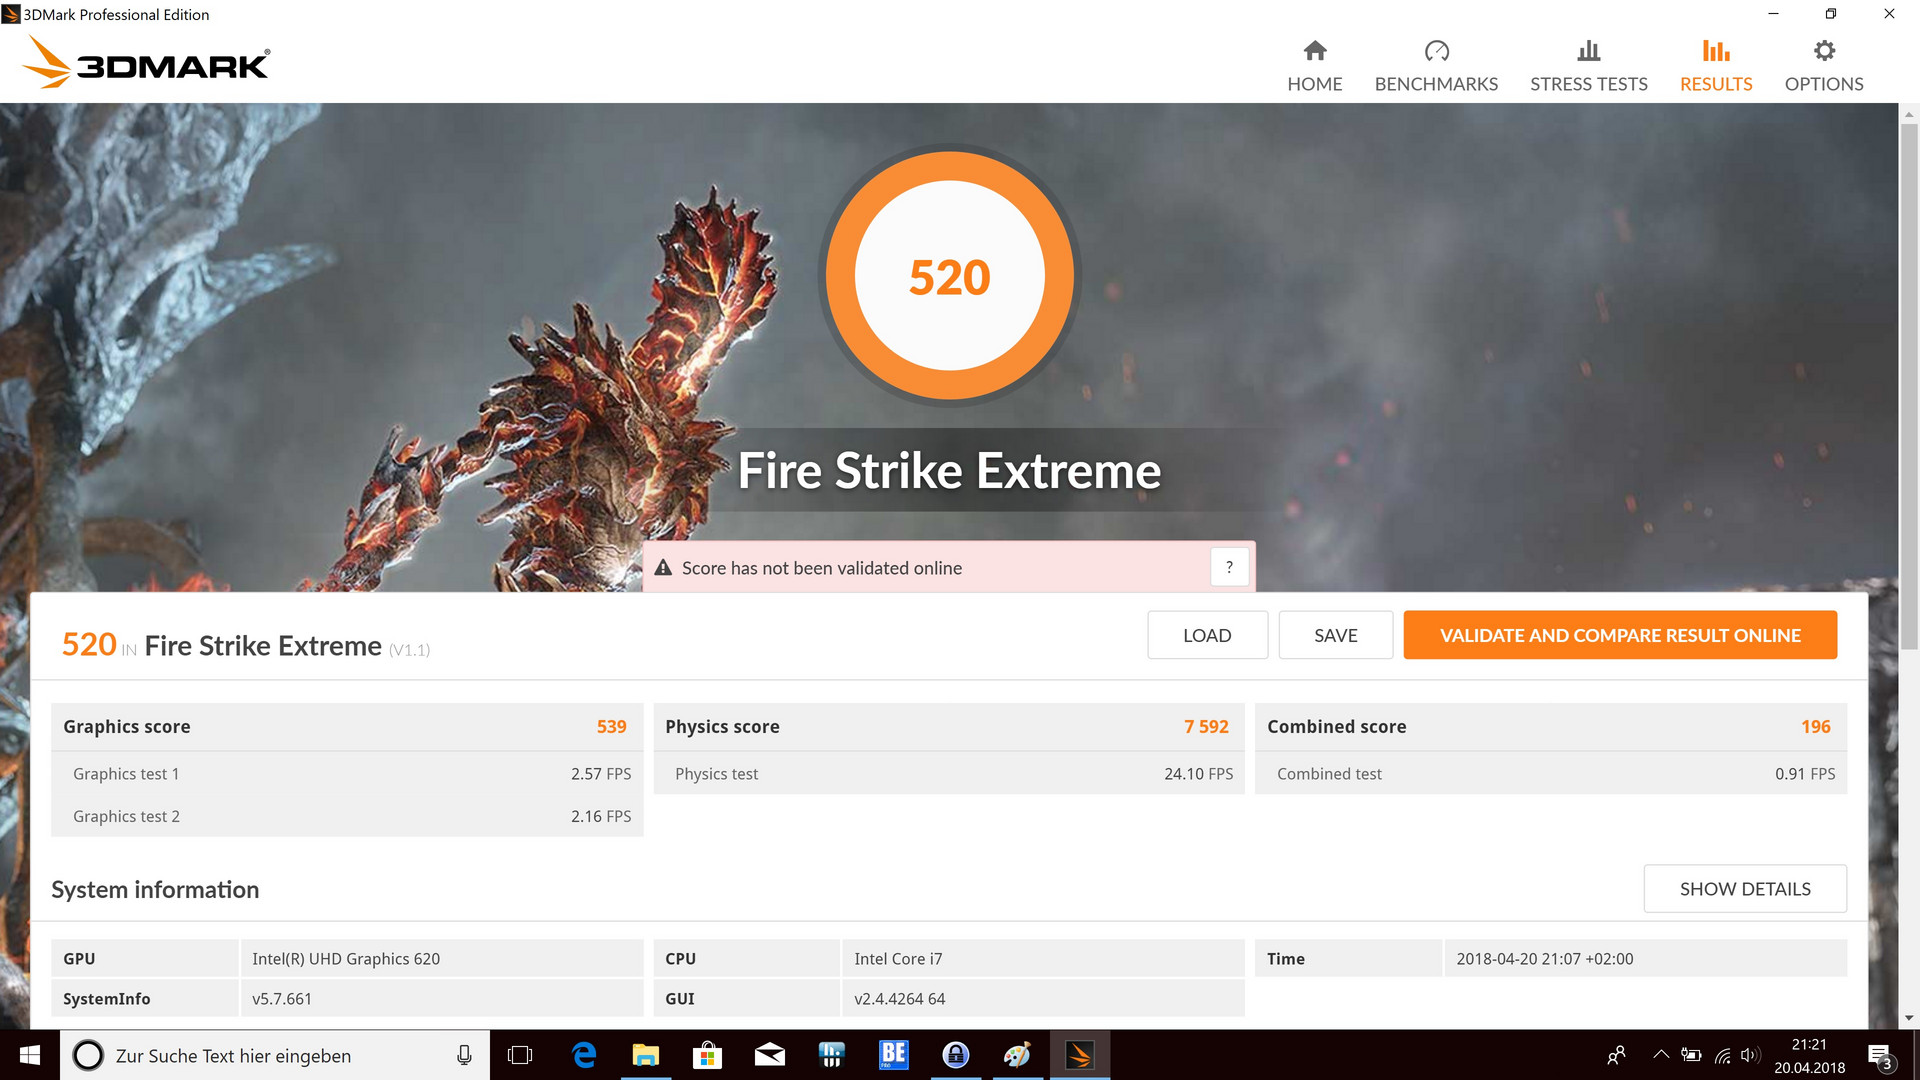
| 3DMark Fire Strike Extreme Score | 519 pontos | |
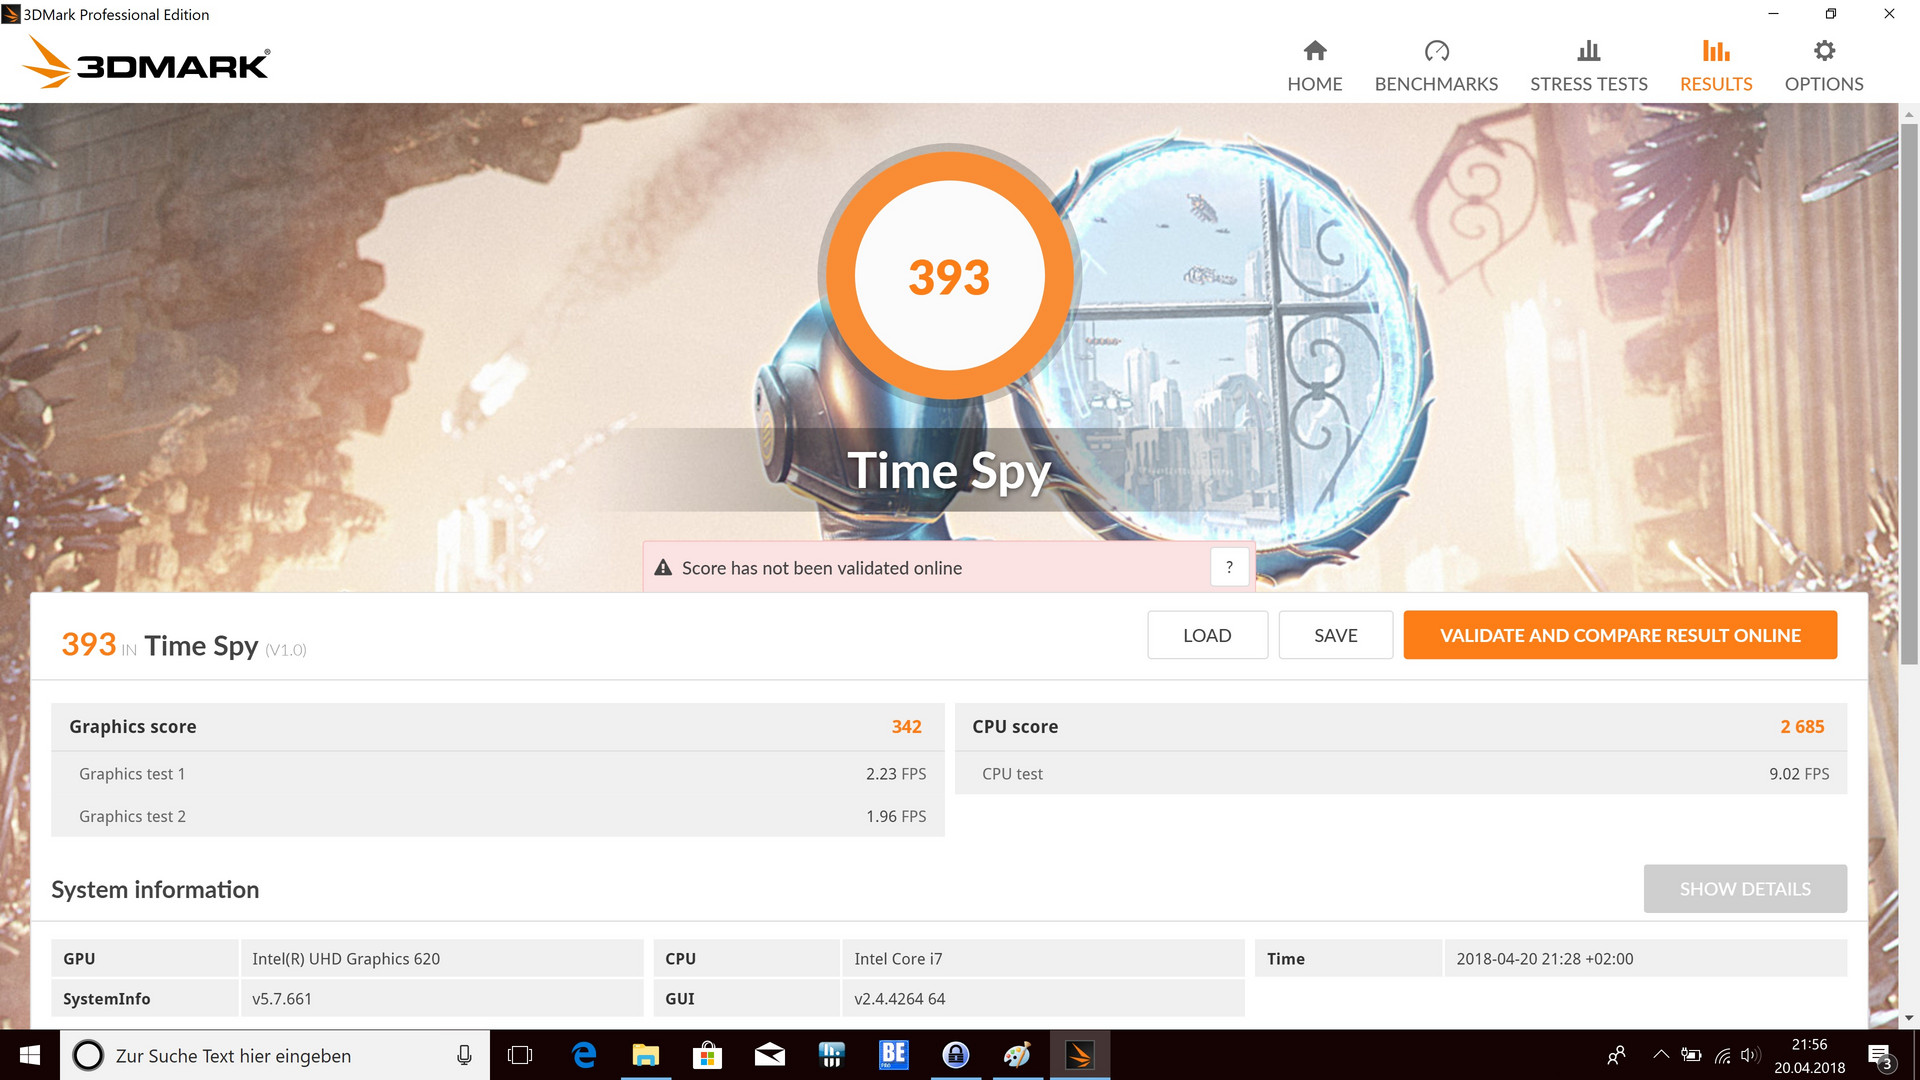
| 3DMark Time Spy Score | 393 pontos | |
Ajuda | ||
| baixo | média | alto | ultra | |
|---|---|---|---|---|
| BioShock Infinite (2013) | 66 | 33.9 | 29.5 | 10.1 |
| Rocket League (2017) | 68.5 | 32.3 | 21 | |
| FIFA 18 (2017) | 62.3 | 33.4 | 28.9 | 26.4 |
Barulho
| Ocioso |
| 29.3 / 29.3 / 29.6 dB |
| Carga |
| 31.4 / 33.1 dB |
 | ||
30 dB silencioso 40 dB(A) audível 50 dB(A) ruidosamente alto |
||
min: | ||
| Fujitsu LifeBook U758 UHD Graphics 620, i7-8650U, Toshiba KXG5AZNV1T02 | Lenovo ThinkPad T580-20LAS01H00 GeForce MX150, i5-8550U, Samsung SSD PM981 MZVLB512HAJQ | HP EliteBook 850 G5 3JX58EA UHD Graphics 620, i5-8250U, Toshiba XG5 KXG50ZNV256G | Dell Latitude 5590 UHD Graphics 620, i5-8250U, SK hynix SC311 M.2 | Fujitsu LifeBook U757 HD Graphics 620, i5-7200U, Samsung CM871a MZNTY256HDHP | Schenker Slim 15 L17 UHD Graphics 620, i5-8550U, Samsung SSD 960 Pro 512 GB m.2 | |
|---|---|---|---|---|---|---|
| Noise | -6% | -4% | -7% | 1% | -6% | |
| desligado / ambiente * (dB) | 29.3 | 29.3 -0% | 30 -2% | 29 1% | 28.2 4% | 29.1 1% |
| Idle Minimum * (dB) | 29.3 | 29.3 -0% | 30 -2% | 29 1% | 28.2 4% | 29.1 1% |
| Idle Average * (dB) | 29.3 | 29.3 -0% | 30 -2% | 29 1% | 28.2 4% | 29.1 1% |
| Idle Maximum * (dB) | 29.6 | 31.8 -7% | 32.2 -9% | 31.3 -6% | 28.2 5% | 30.5 -3% |
| Load Average * (dB) | 31.4 | 35.8 -14% | 33.2 -6% | 36.6 -17% | 33.3 -6% | 31.2 1% |
| Load Maximum * (dB) | 33.1 | 38 -15% | 34.2 -3% | 40.9 -24% | 34 -3% | 45.9 -39% |
| Witcher 3 ultra * (dB) | 35.8 |
* ... menor é melhor
(±) A temperatura máxima no lado superior é 43.5 °C / 110 F, em comparação com a média de 34.3 °C / 94 F , variando de 21.2 a 62.5 °C para a classe Office.
(±) A parte inferior aquece até um máximo de 42.3 °C / 108 F, em comparação com a média de 36.8 °C / 98 F
(+) Em uso inativo, a temperatura média para o lado superior é 23.8 °C / 75 F, em comparação com a média do dispositivo de 29.5 °C / ### class_avg_f### F.
(+) Os apoios para as mãos e o touchpad são mais frios que a temperatura da pele, com um máximo de 26 °C / 78.8 F e, portanto, são frios ao toque.
(±) A temperatura média da área do apoio para as mãos de dispositivos semelhantes foi 27.5 °C / 81.5 F (+1.5 °C / 2.7 F).
| Fujitsu LifeBook U758 UHD Graphics 620, i7-8650U, Toshiba KXG5AZNV1T02 | Lenovo ThinkPad T580-20LAS01H00 GeForce MX150, i5-8550U, Samsung SSD PM981 MZVLB512HAJQ | HP EliteBook 850 G5 3JX58EA UHD Graphics 620, i5-8250U, Toshiba XG5 KXG50ZNV256G | Dell Latitude 5590 UHD Graphics 620, i5-8250U, SK hynix SC311 M.2 | Fujitsu LifeBook U757 HD Graphics 620, i5-7200U, Samsung CM871a MZNTY256HDHP | Schenker Slim 15 L17 UHD Graphics 620, i5-8550U, Samsung SSD 960 Pro 512 GB m.2 | |
|---|---|---|---|---|---|---|
| Heat | -4% | 6% | 5% | -2% | -0% | |
| Maximum Upper Side * (°C) | 43.5 | 41.7 4% | 37.6 14% | 36.6 16% | 42 3% | 38.5 11% |
| Maximum Bottom * (°C) | 42.3 | 54.6 -29% | 37.8 11% | 47.5 -12% | 38.8 8% | 41.8 1% |
| Idle Upper Side * (°C) | 25.4 | 23.6 7% | 25.3 -0% | 23.2 9% | 29.2 -15% | 26.4 -4% |
| Idle Bottom * (°C) | 25.7 | 25 3% | 25.8 -0% | 24.2 6% | 26.3 -2% | 27.9 -9% |
* ... menor é melhor
Fujitsu LifeBook U758 análise de áudio
(±) | o volume do alto-falante é médio, mas bom (###valor### dB)
Graves 100 - 315Hz
(-) | quase nenhum baixo - em média 23.3% menor que a mediana
(±) | a linearidade dos graves é média (10.5% delta para a frequência anterior)
Médios 400 - 2.000 Hz
(+) | médios equilibrados - apenas 4.8% longe da mediana
(+) | médios são lineares (5.6% delta para frequência anterior)
Altos 2 - 16 kHz
(+) | agudos equilibrados - apenas 1.8% longe da mediana
(+) | os máximos são lineares (3.4% delta da frequência anterior)
Geral 100 - 16.000 Hz
(±) | a linearidade do som geral é média (23.4% diferença em relação à mediana)
Comparado com a mesma classe
» 66% de todos os dispositivos testados nesta classe foram melhores, 8% semelhantes, 26% piores
» O melhor teve um delta de 7%, a média foi 21%, o pior foi 53%
Comparado com todos os dispositivos testados
» 70% de todos os dispositivos testados foram melhores, 6% semelhantes, 24% piores
» O melhor teve um delta de 4%, a média foi 23%, o pior foi 134%
Lenovo ThinkPad T580-20LAS01H00 análise de áudio
(±) | o volume do alto-falante é médio, mas bom (###valor### dB)
Graves 100 - 315Hz
(-) | quase nenhum baixo - em média 19.7% menor que a mediana
(±) | a linearidade dos graves é média (13.5% delta para a frequência anterior)
Médios 400 - 2.000 Hz
(+) | médios equilibrados - apenas 4.6% longe da mediana
(+) | médios são lineares (3.7% delta para frequência anterior)
Altos 2 - 16 kHz
(+) | agudos equilibrados - apenas 2.2% longe da mediana
(+) | os máximos são lineares (5.6% delta da frequência anterior)
Geral 100 - 16.000 Hz
(±) | a linearidade do som geral é média (19% diferença em relação à mediana)
Comparado com a mesma classe
» 37% de todos os dispositivos testados nesta classe foram melhores, 7% semelhantes, 56% piores
» O melhor teve um delta de 7%, a média foi 21%, o pior foi 53%
Comparado com todos os dispositivos testados
» 45% de todos os dispositivos testados foram melhores, 7% semelhantes, 48% piores
» O melhor teve um delta de 4%, a média foi 23%, o pior foi 134%
| desligado | |
| Ocioso | |
| Carga |
|
Key:
min: | |
| Fujitsu LifeBook U758 i7-8650U, UHD Graphics 620, Toshiba KXG5AZNV1T02, IPS, 3840x2160, 15.6" | Lenovo ThinkPad T580-20LAS01H00 i5-8550U, GeForce MX150, Samsung SSD PM981 MZVLB512HAJQ, IPS LED, 3840x2160, 15.6" | HP EliteBook 850 G5 3JX58EA i5-8250U, UHD Graphics 620, Toshiba XG5 KXG50ZNV256G, IPS LED, 1920x1080, 15.6" | Dell Latitude 5590 i5-8250U, UHD Graphics 620, SK hynix SC311 M.2, IPS, 1920x1080, 15.6" | Fujitsu LifeBook U757 i5-7200U, HD Graphics 620, Samsung CM871a MZNTY256HDHP, IPS LED, 1920x1080, 15.6" | Schenker Slim 15 L17 i5-8550U, UHD Graphics 620, Samsung SSD 960 Pro 512 GB m.2, IPS, 1920x1080, 15.6" | |
|---|---|---|---|---|---|---|
| Power Consumption | -20% | 22% | 8% | 28% | -6% | |
| Idle Minimum * (Watt) | 5.6 | 5.3 5% | 2.7 52% | 3.6 36% | 3.96 29% | 7.2 -29% |
| Idle Average * (Watt) | 11.5 | 10.2 11% | 8.1 30% | 6.5 43% | 7.74 33% | 10.9 5% |
| Idle Maximum * (Watt) | 12.5 | 13.6 -9% | 10.1 19% | 7.2 42% | 8.64 31% | 12.6 -1% |
| Load Average * (Watt) | 34.2 | 58.3 -70% | 39 -14% | 46.2 -35% | 28.8 16% | 37 -8% |
| Load Maximum * (Watt) | 47.9 | 65.3 -36% | 37.2 22% | 68.8 -44% | 32 33% | 45.5 5% |
| Witcher 3 ultra * (Watt) | 47.8 |
* ... menor é melhor
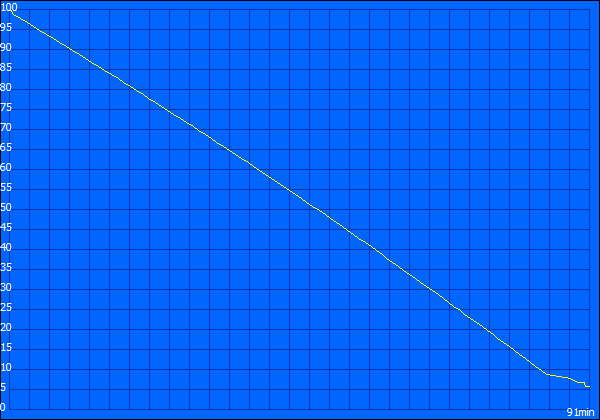
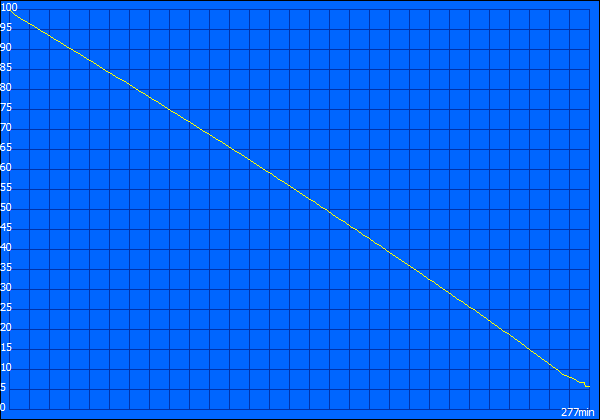
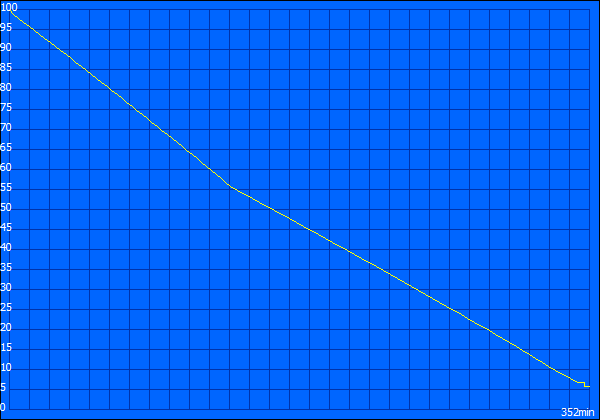
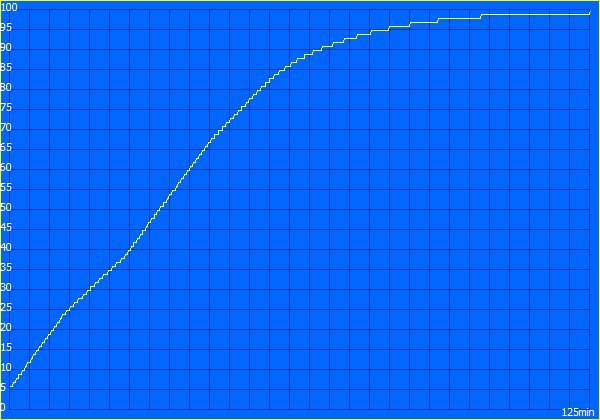
| Fujitsu LifeBook U758 i7-8650U, UHD Graphics 620, 50 Wh | Lenovo ThinkPad T580-20LAS01H00 i5-8550U, GeForce MX150, 105 Wh | HP EliteBook 850 G5 3JX58EA i5-8250U, UHD Graphics 620, 56 Wh | Dell Latitude 5590 i5-8250U, UHD Graphics 620, 51 Wh | Fujitsu LifeBook U757 i5-7200U, HD Graphics 620, 50 Wh | Schenker Slim 15 L17 i5-8550U, UHD Graphics 620, 44 Wh | |
|---|---|---|---|---|---|---|
| Duração da bateria | 81% | 99% | 37% | 59% | -15% | |
| Reader / Idle (h) | 9.7 | 19.7 103% | 17.8 84% | 17.4 79% | 7.4 -24% | |
| H.264 (h) | 5.9 | 9.4 59% | 10.5 78% | 6.7 14% | 4.3 -27% | |
| WiFi v1.3 (h) | 4.6 | 8.7 89% | 9.3 102% | 7.4 61% | 7.3 59% | 4.6 0% |
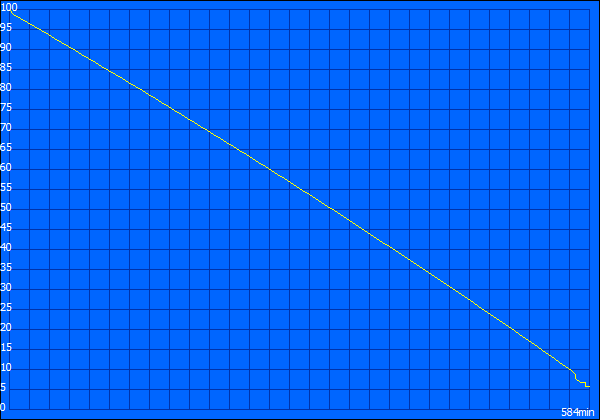
| Load (h) | 1.5 | 2.6 73% | 3.5 133% | 1.4 -7% | 1.4 -7% |
Pro
Contra
Nós testamos agora ambas as atualizações da série LifeBook U da Fujitsu. O LifeBook U748 se saiu um pouco melhor do que a unidade de teste de hoje, o U758. Suas especificações técnicas parecem muito promissoras e fazem com que o U758 pareça ser um portátil muito poderoso. Mas que sentido tem usar um processador potente se não consegue atingir seu potencial máximo? Um modelo mais barato da série Core pode ter sido uma opção melhor.
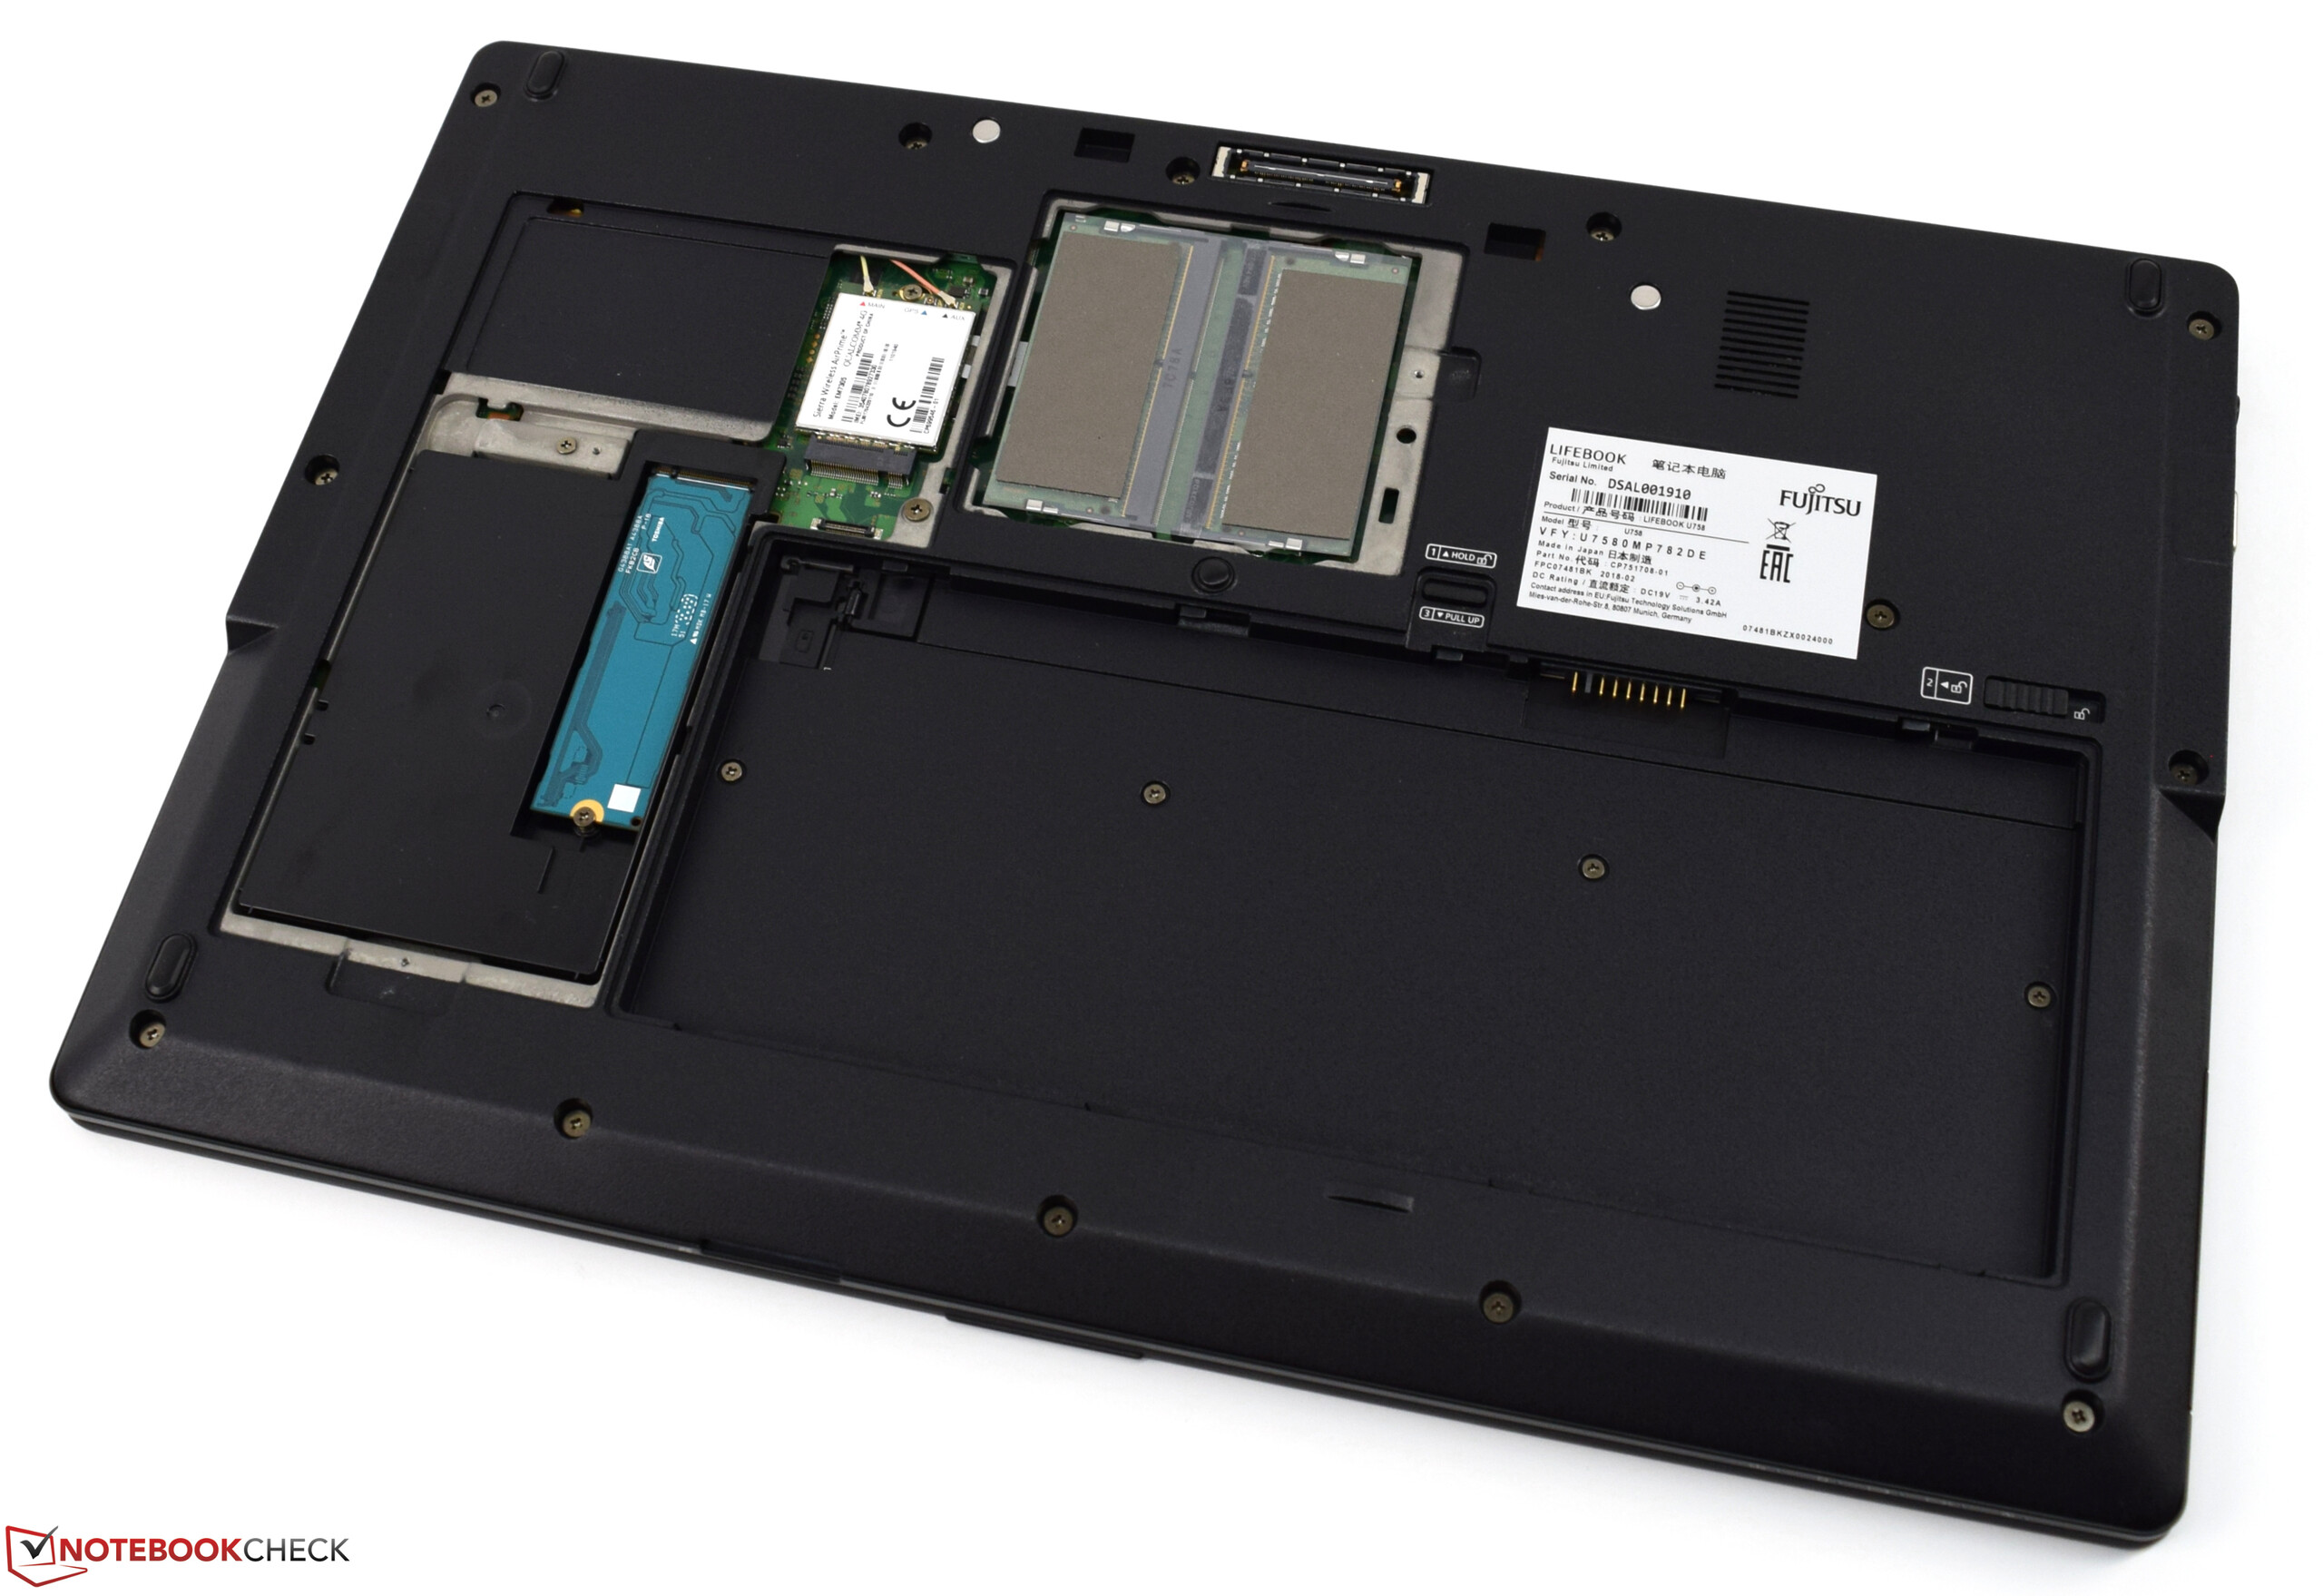
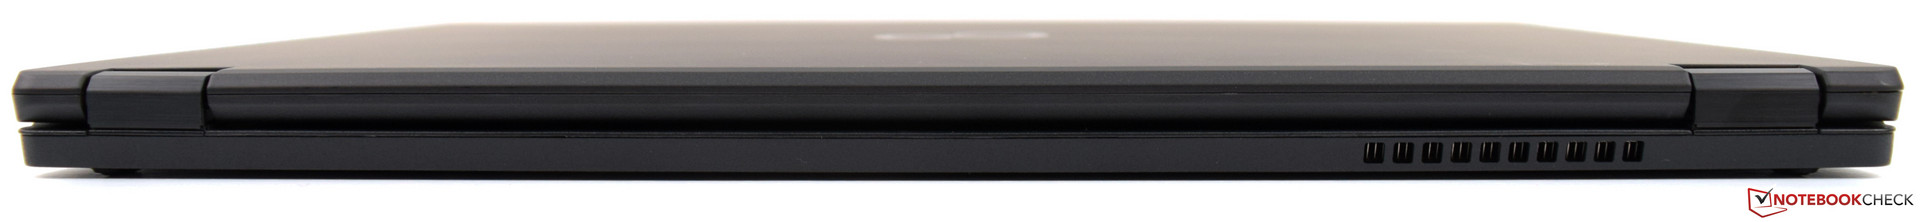
O LifeBook U758 nos impressionou com sua boa carcaça, que é muito amigável com as escotilhas de manutenção e a bateria fácil de remover. Também gostamos da tela 4K que oferece boa qualidade de imagem e cobertura de espaço de cores decente. Infelizmente, a tela poderia ter mais brilho para ser usada em exteriores.
O Fujitsu LifeBook U758 é um bom dispositivo empresarial que oferece muitos recursos de segurança e, memória e armazenamento suficientes, para aplicativos com uso intensivo da CPU. Os fanáticos de VMware e Hyper-V ficarão muito felizes com o LifeBook U758 nesta configuração.
Apesar das repetidas críticas ao desempenho da CPU, o desempenho do sistema é bom, embora alguns dos dispositivos de comparação ofereçam melhor desempenho. A Fujitsu também deve dar outra olhada no touchpad, que foi bastante decepcionante. Os dispositivos da Lenovo, Dell e HP também oferecem um TouchStick como alternativa ao touchpad. O LifeBook não possui esse recurso.
Há um monte de pequenas coisas que poderiam ter sido melhoradas para ser menos como o U748. Devido ao seu tamanho, seria uma boa ideia oferecer uma opção com uma GPU dedicada. Como é, a única diferença real entre nossa unidade de teste e o U748 é seu tamanho. Se você realmente quer o hardware do U758, você também pode obtê-lo no U748 menor.
Fujitsu LifeBook U758
- 05/02/2018 v6 (old)
Sebastian Bade
Price comparison
