Breve Análise do Portátil Lenovo ThinkPad T580 (i7-8550U, MX150, UHD)
| SD Card Reader | |
| average JPG Copy Test (av. of 3 runs) | |
| Dell Latitude 5590 (Toshiba Exceria Pro SDXC 64 GB UHS-II) | |
| Lenovo ThinkPad P51 20HH0016GE (Toshiba Exceria Pro SDXC 64 GB UHS-II) | |
| Dell XPS 15 9560 (i7-7700HQ, UHD) (Toshiba Exceria Pro SDXC 64 GB UHS-II) | |
| Lenovo ThinkPad T580-20LAS01H00 (Toshiba Exceria Pro SDXC 64 GB UHS-II) | |
| HP EliteBook 850 G4-Z2W86ET (Toshiba Exceria Pro SDXC 64 GB UHS-II) | |
| Média da turma Office (19.8 - 198.5, n=22, últimos 2 anos) | |
| maximum AS SSD Seq Read Test (1GB) | |
| Dell XPS 15 9560 (i7-7700HQ, UHD) (Toshiba Exceria Pro SDXC 64 GB UHS-II) | |
| Lenovo ThinkPad P51 20HH0016GE (Toshiba Exceria Pro SDXC 64 GB UHS-II) | |
| Dell Latitude 5590 (Toshiba Exceria Pro SDXC 64 GB UHS-II) | |
| HP EliteBook 850 G4-Z2W86ET (Toshiba Exceria Pro SDXC 64 GB UHS-II) | |
| Lenovo ThinkPad T580-20LAS01H00 (Toshiba Exceria Pro SDXC 64 GB UHS-II) | |
| Média da turma Office (27.4 - 249, n=21, últimos 2 anos) | |
| Networking | |
| iperf3 transmit AX12 | |
| Dell XPS 15 9560 (i7-7700HQ, UHD) | |
| HP EliteBook 850 G4-Z2W86ET | |
| Lenovo ThinkPad P51 20HH0016GE | |
| Dell Latitude 5590 | |
| Lenovo ThinkPad T580-20LAS01H00 | |
| iperf3 receive AX12 | |
| Dell XPS 15 9560 (i7-7700HQ, UHD) | |
| Lenovo ThinkPad P51 20HH0016GE | |
| Lenovo ThinkPad T580-20LAS01H00 | |
| HP EliteBook 850 G4-Z2W86ET | |
| Dell Latitude 5590 | |
| |||||||||||||||||||||||||
iluminação: 87 %
iluminação com acumulador: 313 cd/m²
Contraste: 1292:1 (Preto: 0.24 cd/m²)
ΔE ColorChecker Calman: 3.1 | ∀{0.5-29.43 Ø4.71}
calibrated: 2.2
ΔE Greyscale Calman: 2.3 | ∀{0.09-98 Ø4.96}
90.1% sRGB (Argyll 1.6.3 3D)
59.1% AdobeRGB 1998 (Argyll 1.6.3 3D)
66.3% AdobeRGB 1998 (Argyll 3D)
90.7% sRGB (Argyll 3D)
69.2% Display P3 (Argyll 3D)
Gamma: 2.21
CCT: 6876 K
| Lenovo ThinkPad T580-20LAS01H00 NV156QUM-N44, , 3840x2160, 15.6" | Lenovo ThinkPad T570-20HAS01E00 BOE NV156QUM-N44, , 3840x2160, 15.6" | Dell Latitude 5590 NV15N42, , 1920x1080, 15.6" | HP EliteBook 850 G4-Z2W86ET AUO35ED, , 1920x1080, 15.6" | Dell XPS 15 9560 (i7-7700HQ, UHD) 3840x2160, 15.6" | Lenovo ThinkPad P51 20HH0016GE LEN40BD, B156ZAN02.1, , 3840x2160, 15.6" | |
|---|---|---|---|---|---|---|
| Display | 1% | -36% | -12% | 30% | 28% | |
| Display P3 Coverage (%) | 69.2 | 70 1% | 41.56 -40% | 56.8 -18% | 89.7 30% | 86.3 25% |
| sRGB Coverage (%) | 90.7 | 91.1 0% | 61.3 -32% | 83.7 -8% | 100 10% | 99.5 10% |
| AdobeRGB 1998 Coverage (%) | 66.3 | 66.7 1% | 42.93 -35% | 58.7 -11% | 100 51% | 99.3 50% |
| Response Times | 34% | -19% | 29% | -22% | 18% | |
| Response Time Grey 50% / Grey 80% * (ms) | 51.2 ? | 41.6 ? 19% | 53.2 ? -4% | 47.2 ? 8% | 57.2 ? -12% | 40.8 ? 20% |
| Response Time Black / White * (ms) | 29.6 ? | 15.2 ? 49% | 39.6 ? -34% | 15.2 ? 49% | 39.2 ? -32% | 25.2 ? 15% |
| PWM Frequency (Hz) | 952 ? | 926 ? | 1000 ? | 199.2 ? | 962 | |
| Screen | -21% | -59% | -117% | -17% | 2% | |
| Brightness middle (cd/m²) | 310 | 339 9% | 243 -22% | 338 9% | 370.1 19% | 317 2% |
| Brightness (cd/m²) | 283 | 314 11% | 234 -17% | 341 20% | 356 26% | 309 9% |
| Brightness Distribution (%) | 87 | 89 2% | 83 -5% | 90 3% | 87 0% | 89 2% |
| Black Level * (cd/m²) | 0.24 | 0.36 -50% | 0.19 21% | 0.81 -238% | 0.37 -54% | 0.36 -50% |
| Contrast (:1) | 1292 | 942 -27% | 1279 -1% | 417 -68% | 1000 -23% | 881 -32% |
| Colorchecker dE 2000 * | 3.1 | 4.2 -35% | 6.6 -113% | 10.9 -252% | 5.3 -71% | 2.7 13% |
| Colorchecker dE 2000 max. * | 7.6 | 7.8 -3% | 22.3 -193% | 18.7 -146% | 9.9 -30% | 4.1 46% |
| Colorchecker dE 2000 calibrated * | 2.2 | 5 -127% | ||||
| Greyscale dE 2000 * | 2.3 | 5.1 -122% | 5.2 -126% | 13.3 -478% | 4.6 -100% | 3 -30% |
| Gamma | 2.21 100% | 2.16 102% | 2.24 98% | 2.11 104% | 2.31 95% | 2.27 97% |
| CCT | 6876 95% | 6569 99% | 6990 93% | 16030 41% | 6284 103% | 6077 107% |
| Color Space (Percent of AdobeRGB 1998) (%) | 59.1 | 59.4 1% | 39.2 -34% | 53.8 -9% | 88.3 49% | 87.6 48% |
| Color Space (Percent of sRGB) (%) | 90.1 | 91 1% | 60.8 -33% | 83.4 -7% | 100 11% | 99.5 10% |
| Média Total (Programa/Configurações) | 5% /
-10% | -38% /
-50% | -33% /
-76% | -3% /
-8% | 16% /
9% |
* ... menor é melhor
Exibir tempos de resposta
| ↔ Tempo de resposta preto para branco | ||
|---|---|---|
| 29.6 ms ... ascensão ↗ e queda ↘ combinadas | ↗ 17.2 ms ascensão | 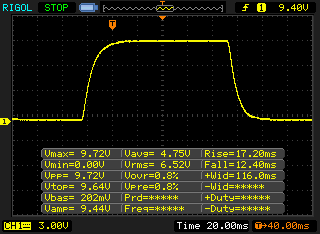 |
| ↘ 12.4 ms queda | ||
| A tela mostra taxas de resposta relativamente lentas em nossos testes e pode ser muito lenta para os jogadores. Em comparação, todos os dispositivos testados variam de 0.1 (mínimo) a 240 (máximo) ms. » 79 % de todos os dispositivos são melhores. Isso significa que o tempo de resposta medido é pior que a média de todos os dispositivos testados (19.8 ms). | ||
| ↔ Tempo de resposta 50% cinza a 80% cinza | ||
| 51.2 ms ... ascensão ↗ e queda ↘ combinadas | ↗ 24.4 ms ascensão | 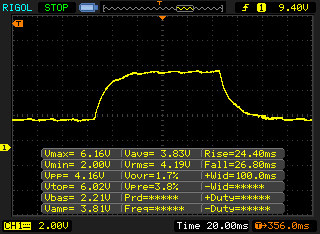 |
| ↘ 26.8 ms queda | ||
| A tela mostra taxas de resposta lentas em nossos testes e será insatisfatória para os jogadores. Em comparação, todos os dispositivos testados variam de 0.165 (mínimo) a 636 (máximo) ms. » 88 % de todos os dispositivos são melhores. Isso significa que o tempo de resposta medido é pior que a média de todos os dispositivos testados (31 ms). | ||
Cintilação da tela / PWM (modulação por largura de pulso)
| Tela tremeluzindo/PWM detectado | 952 Hz | ≤ 99 % configuração de brilho | 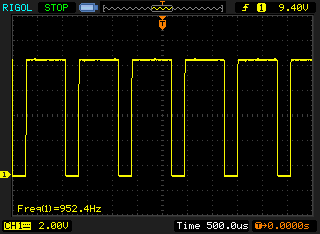 |
A luz de fundo da tela pisca em 952 Hz (pior caso, por exemplo, utilizando PWM) Cintilação detectada em uma configuração de brilho de 99 % e abaixo. Não deve haver cintilação ou PWM acima desta configuração de brilho. A frequência de 952 Hz é bastante alta, então a maioria dos usuários sensíveis ao PWM não deve notar nenhuma oscilação. [pwm_comparison] Em comparação: 52 % de todos os dispositivos testados não usam PWM para escurecer a tela. Se PWM foi detectado, uma média de 7754 (mínimo: 5 - máximo: 343500) Hz foi medida. | |||
| PCMark 10 | |
| Digital Content Creation | |
| Média da turma Office (2049 - 13541, n=68, últimos 2 anos) | |
| Lenovo ThinkPad T580-20LAS01H00 | |
| Média Intel Core i7-8550U, NVIDIA GeForce MX150 (2036 - 3518, n=19) | |
| Dell Latitude 5590 | |
| Productivity | |
| Média da turma Office (5336 - 17243, n=68, últimos 2 anos) | |
| Média Intel Core i7-8550U, NVIDIA GeForce MX150 (4779 - 7244, n=19) | |
| Dell Latitude 5590 | |
| Lenovo ThinkPad T580-20LAS01H00 | |
| Essentials | |
| Média da turma Office (3245 - 11594, n=68, últimos 2 anos) | |
| Dell Latitude 5590 | |
| Média Intel Core i7-8550U, NVIDIA GeForce MX150 (5448 - 8412, n=19) | |
| Lenovo ThinkPad T580-20LAS01H00 | |
| Score | |
| Média da turma Office (2601 - 9298, n=68, últimos 2 anos) | |
| Média Intel Core i7-8550U, NVIDIA GeForce MX150 (3056 - 4106, n=19) | |
| Lenovo ThinkPad T580-20LAS01H00 | |
| Dell Latitude 5590 | |
| PCMark 8 Home Score Accelerated v2 | 3145 pontos | |
| PCMark 8 Work Score Accelerated v2 | 4063 pontos | |
| PCMark 10 Score | 3425 pontos | |
Ajuda | ||
| Lenovo ThinkPad T580-20LAS01H00 Samsung SSD PM981 MZVLB512HAJQ | Dell Latitude 5590 SK hynix SC311 M.2 | HP EliteBook 850 G4-Z2W86ET Samsung PM951 NVMe MZVLV256 | Dell XPS 15 9560 (i7-7700HQ, UHD) Lite-On CX2-8B512-Q11 | Lenovo ThinkPad P51 20HH0016GE Samsung PM961 NVMe MZVLW512HMJP | Lenovo ThinkPad T570-20HAS01E00 Samsung PM961 NVMe MZVLW512HMJP | Média Samsung SSD PM981 MZVLB512HAJQ | |
|---|---|---|---|---|---|---|---|
| AS SSD | -63% | -24% | -1% | 20% | -1% | -4% | |
| Seq Read (MB/s) | 1373 | 503 -63% | 1308 -5% | 2026 48% | 2624 91% | 1357 -1% | 1976 ? 44% |
| Seq Write (MB/s) | 1262 | 393 -69% | 282.9 -78% | 1207 -4% | 1506 19% | 1207 -4% | 1637 ? 30% |
| 4K Read (MB/s) | 51.5 | 29.03 -44% | 38.48 -25% | 41.34 -20% | 55.6 8% | 50.2 -3% | 50.5 ? -2% |
| 4K Write (MB/s) | 110.9 | 73.5 -34% | 137.5 24% | 112.2 1% | 143.1 29% | 118.1 6% | 112 ? 1% |
| 4K-64 Read (MB/s) | 1153 | 306 -73% | 849 -26% | 962 -17% | 1372 19% | 1195 4% | 1203 ? 4% |
| 4K-64 Write (MB/s) | 1278 | 212.7 -83% | 212.3 -83% | 789 -38% | 623 -51% | 828 -35% | 1504 ? 18% |
| Access Time Read * (ms) | 0.059 | 0.111 -88% | 0.043 27% | 0.034 42% | 0.032 46% | 0.042 29% | 0.05092 ? 14% |
| Access Time Write * (ms) | 0.033 | 0.047 -42% | 0.034 -3% | 0.034 -3% | 0.025 24% | 0.03 9% | 0.08337 ? -153% |
| Score Total (Points) | 3548 | 912 -74% | 1873 -47% | 2810 -21% | 3424 -3% | 3155 -11% | 3966 ? 12% |
* ... menor é melhor

| 3DMark 11 - 1280x720 Performance GPU | |
| Média da turma Office (2551 - 18313, n=72, últimos 2 anos) | |
| Lenovo ThinkPad P51 20HH0016GE | |
| Lenovo ThinkPad T580-20LAS01H00 | |
| Média NVIDIA GeForce MX150 (2796 - 4905, n=47) | |
| Lenovo ThinkPad T570-20HAS01E00 | |
| Dell Latitude 5590 | |
| HP EliteBook 850 G4-Z2W86ET | |
| 3DMark 11 Performance | 4663 pontos | |
| 3DMark Cloud Gate Standard Score | 12322 pontos | |
| 3DMark Fire Strike Score | 3009 pontos | |
Ajuda | ||
| BioShock Infinite - 1366x768 High Preset | |
| Dell XPS 15 9560 (i7-7700HQ, UHD) | |
| Lenovo ThinkPad T580-20LAS01H00 | |
| Média NVIDIA GeForce MX150 (59.7 - 98, n=33) | |
| Lenovo ThinkPad T570-20HAS01E00 | |
| Dell Latitude 5590 | |
| HP EliteBook 850 G4-Z2W86ET | |
| Civilization 6 - 1366x768 Medium Preset | |
| Lenovo ThinkPad T580-20LAS01H00 | |
| Média NVIDIA GeForce MX150 (42.9 - 53, n=4) | |
| Lenovo ThinkPad T570-20HAS01E00 | |
| baixo | média | alto | ultra | 4K | |
|---|---|---|---|---|---|
| BioShock Infinite (2013) | 184.9 | 107.5 | 85.2 | 32.5 | |
| The Witcher 3 (2015) | 52.4 | 31.7 | 18.3 | 10.1 | |
| Rise of the Tomb Raider (2016) | 71.8 | 36.1 | 20.2 | 16.9 | 7 |
| Civilization 6 (2016) | 87.7 | 50.9 | 20.8 | 16.2 | 9.7 |
Barulho
| Ocioso |
| 29.3 / 29.3 / 31.8 dB |
| Carga |
| 35.8 / 38 dB |
 | ||
30 dB silencioso 40 dB(A) audível 50 dB(A) ruidosamente alto |
||
min: | ||
(±) A temperatura máxima no lado superior é 41.7 °C / 107 F, em comparação com a média de 34.3 °C / 94 F , variando de 21.2 a 62.5 °C para a classe Office.
(-) A parte inferior aquece até um máximo de 54.6 °C / 130 F, em comparação com a média de 36.8 °C / 98 F
(+) Em uso inativo, a temperatura média para o lado superior é 23.2 °C / 74 F, em comparação com a média do dispositivo de 29.5 °C / ### class_avg_f### F.
(±) Jogando The Witcher 3, a temperatura média para o lado superior é 34.1 °C / 93 F, em comparação com a média do dispositivo de 29.5 °C / ## #class_avg_f### F.
(±) Os apoios para as mãos e o touchpad podem ficar muito quentes ao toque, com um máximo de 37.3 °C / 99.1 F.
(-) A temperatura média da área do apoio para as mãos de dispositivos semelhantes foi 27.5 °C / 81.5 F (-9.8 °C / -17.6 F).
Lenovo ThinkPad T580-20LAS01H00 análise de áudio
(±) | o volume do alto-falante é médio, mas bom (###valor### dB)
Graves 100 - 315Hz
(-) | quase nenhum baixo - em média 19.7% menor que a mediana
(±) | a linearidade dos graves é média (13.5% delta para a frequência anterior)
Médios 400 - 2.000 Hz
(+) | médios equilibrados - apenas 4.6% longe da mediana
(+) | médios são lineares (3.7% delta para frequência anterior)
Altos 2 - 16 kHz
(+) | agudos equilibrados - apenas 2.2% longe da mediana
(+) | os máximos são lineares (5.6% delta da frequência anterior)
Geral 100 - 16.000 Hz
(±) | a linearidade do som geral é média (19% diferença em relação à mediana)
Comparado com a mesma classe
» 37% de todos os dispositivos testados nesta classe foram melhores, 7% semelhantes, 56% piores
» O melhor teve um delta de 7%, a média foi 21%, o pior foi 53%
Comparado com todos os dispositivos testados
» 45% de todos os dispositivos testados foram melhores, 7% semelhantes, 48% piores
» O melhor teve um delta de 4%, a média foi 23%, o pior foi 134%
Dell XPS 15 9560 (i7-7700HQ, UHD) análise de áudio
(-) | alto-falantes não muito altos (###valor### dB)
Graves 100 - 315Hz
(±) | graves reduzidos - em média 12.9% menor que a mediana
(±) | a linearidade dos graves é média (14.3% delta para a frequência anterior)
Médios 400 - 2.000 Hz
(+) | médios equilibrados - apenas 3.5% longe da mediana
(±) | a linearidade dos médios é média (8.9% delta para frequência anterior)
Altos 2 - 16 kHz
(+) | agudos equilibrados - apenas 2.3% longe da mediana
(±) | a linearidade dos máximos é média (7.3% delta para frequência anterior)
Geral 100 - 16.000 Hz
(±) | a linearidade do som geral é média (16.2% diferença em relação à mediana)
Comparado com a mesma classe
» 41% de todos os dispositivos testados nesta classe foram melhores, 7% semelhantes, 51% piores
» O melhor teve um delta de 5%, a média foi 17%, o pior foi 45%
Comparado com todos os dispositivos testados
» 26% de todos os dispositivos testados foram melhores, 6% semelhantes, 68% piores
» O melhor teve um delta de 4%, a média foi 23%, o pior foi 134%
| desligado | |
| Ocioso | |
| Carga |
|
Key:
min: | |
| Lenovo ThinkPad T580-20LAS01H00 i5-8550U, GeForce MX150, Samsung SSD PM981 MZVLB512HAJQ, IPS LED, 3840x2160, 15.6" | Dell Latitude 5590 i5-8250U, UHD Graphics 620, SK hynix SC311 M.2, IPS, 1920x1080, 15.6" | HP EliteBook 850 G4-Z2W86ET i5-7200U, HD Graphics 620, Samsung PM951 NVMe MZVLV256, TN LED, 1920x1080, 15.6" | Dell XPS 15 9560 (i7-7700HQ, UHD) i7-7700HQ, GeForce GTX 1050 Mobile, Lite-On CX2-8B512-Q11, IGZO IPS, 3840x2160, 15.6" | Lenovo ThinkPad P51 20HH0016GE E3-1505M v6, Quadro M2200, Samsung PM961 NVMe MZVLW512HMJP, IPS, 3840x2160, 15.6" | Lenovo ThinkPad T570-20HAS01E00 i7-7500U, GeForce 940MX, Samsung PM961 NVMe MZVLW512HMJP, IPS, 3840x2160, 15.6" | |
|---|---|---|---|---|---|---|
| Power Consumption | 26% | 42% | -81% | -65% | 5% | |
| Idle Minimum * (Watt) | 5.3 | 3.6 32% | 3.58 32% | 11.9 -125% | 8.6 -62% | 4.7 11% |
| Idle Average * (Watt) | 10.2 | 6.5 36% | 5.97 41% | 17.1 -68% | 15.9 -56% | 9.9 3% |
| Idle Maximum * (Watt) | 13.6 | 7.2 47% | 6.81 50% | 17.3 -27% | 22.1 -63% | 10.9 20% |
| Load Average * (Watt) | 58.3 | 46.2 21% | 29.4 50% | 94.7 -62% | 84.4 -45% | 56.1 4% |
| Witcher 3 ultra * (Watt) | 47.8 | 104.8 -119% | ||||
| Load Maximum * (Watt) | 65.3 | 68.8 -5% | 39.7 39% | 122 -87% | 130.6 -100% | 75 -15% |
* ... menor é melhor
| Lenovo ThinkPad T580-20LAS01H00 i5-8550U, GeForce MX150, 105 Wh | Dell Latitude 5590 i5-8250U, UHD Graphics 620, 51 Wh | HP EliteBook 850 G4-Z2W86ET i5-7200U, HD Graphics 620, 51 Wh | Dell XPS 15 9560 (i7-7700HQ, UHD) i7-7700HQ, GeForce GTX 1050 Mobile, 97 Wh | Lenovo ThinkPad P51 20HH0016GE E3-1505M v6, Quadro M2200, 90 Wh | Lenovo ThinkPad T570-20HAS01E00 i7-7500U, GeForce 940MX, 56 Wh | Média da turma Office | |
|---|---|---|---|---|---|---|---|
| Duração da bateria | -26% | 2% | -27% | -24% | -14% | 28% | |
| Reader / Idle (h) | 19.7 | 17.4 -12% | 18 -9% | 13.9 -29% | 16.4 -17% | 13.3 -32% | 24.5 ? 24% |
| H.264 (h) | 9.4 | 6.7 -29% | 10.6 13% | 7.6 -19% | 8.1 -14% | 15.5 ? 65% | |
| WiFi v1.3 (h) | 8.7 | 7.4 -15% | 8.8 1% | 7.2 -17% | 6.9 -21% | 6.9 -21% | 13.2 ? 52% |
| Load (h) | 2.6 | 1.4 -46% | 2.7 4% | 1.7 -35% | 1.6 -38% | 2.9 12% | 1.808 ? -30% |
Pro
Contra

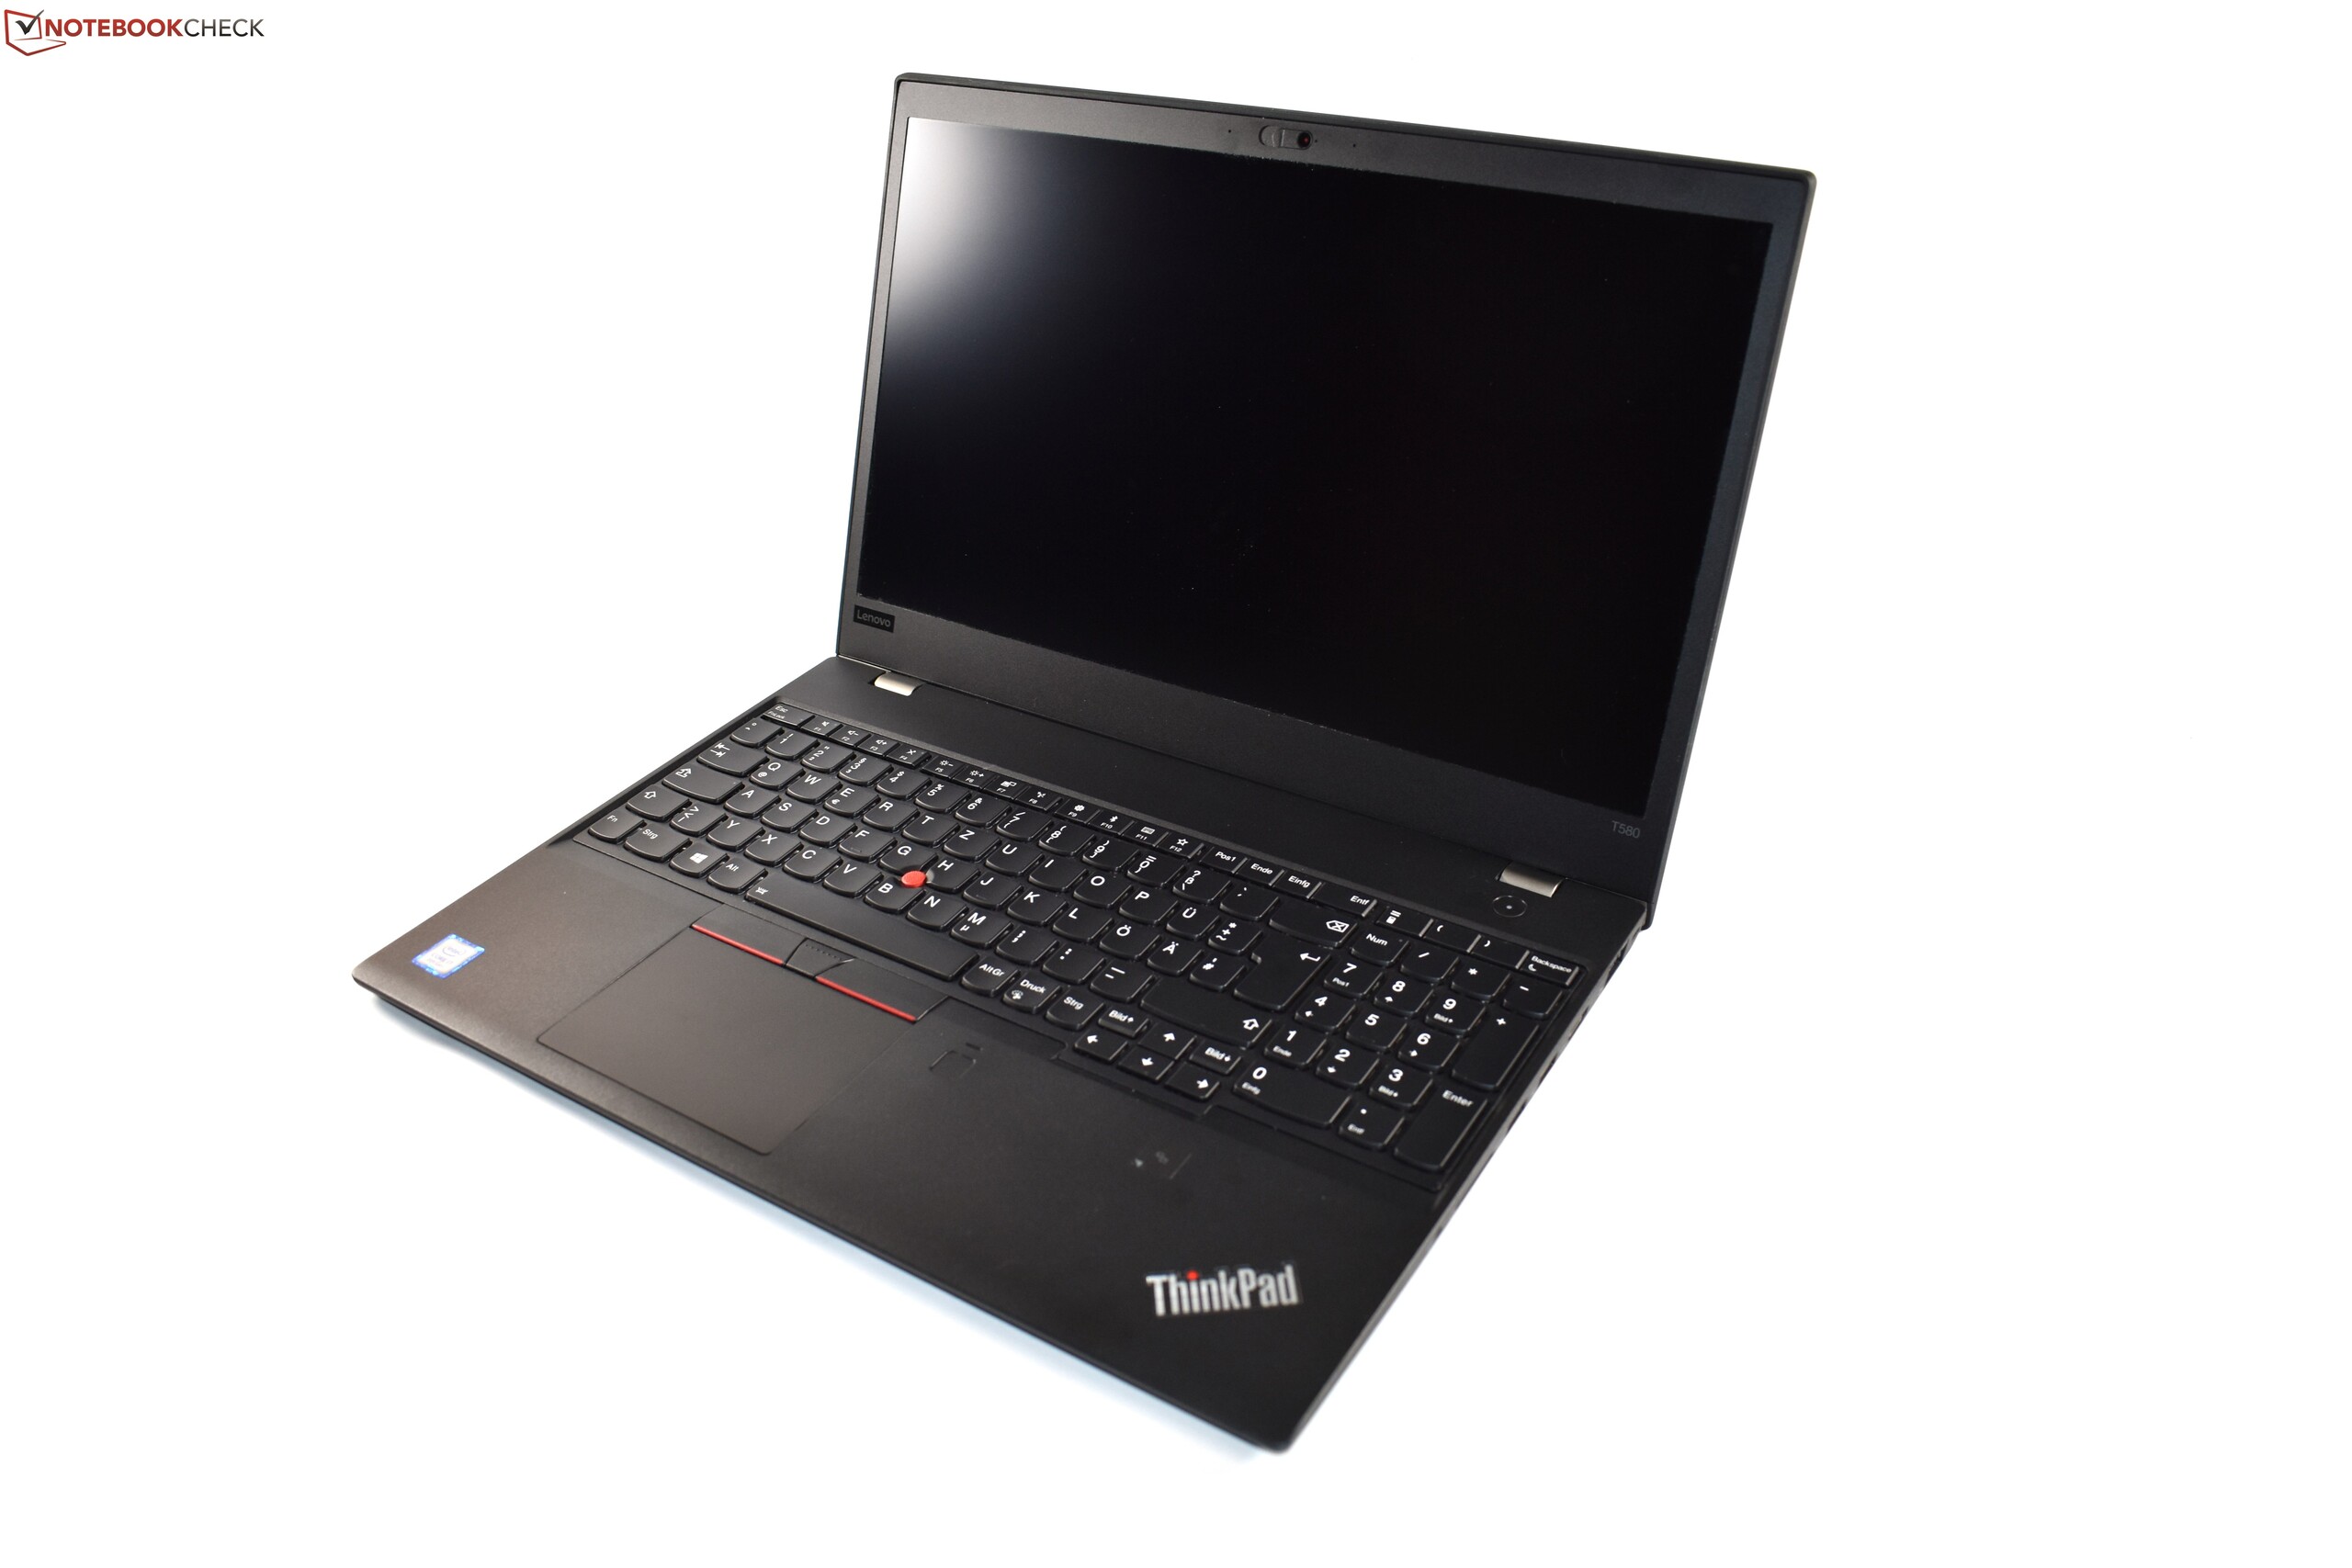
O Lenovo ThinkPad T580 é um bom portátil de negócios que fica um pouco atrás de seus modelos de irmãos menores na série ThinkPad T.
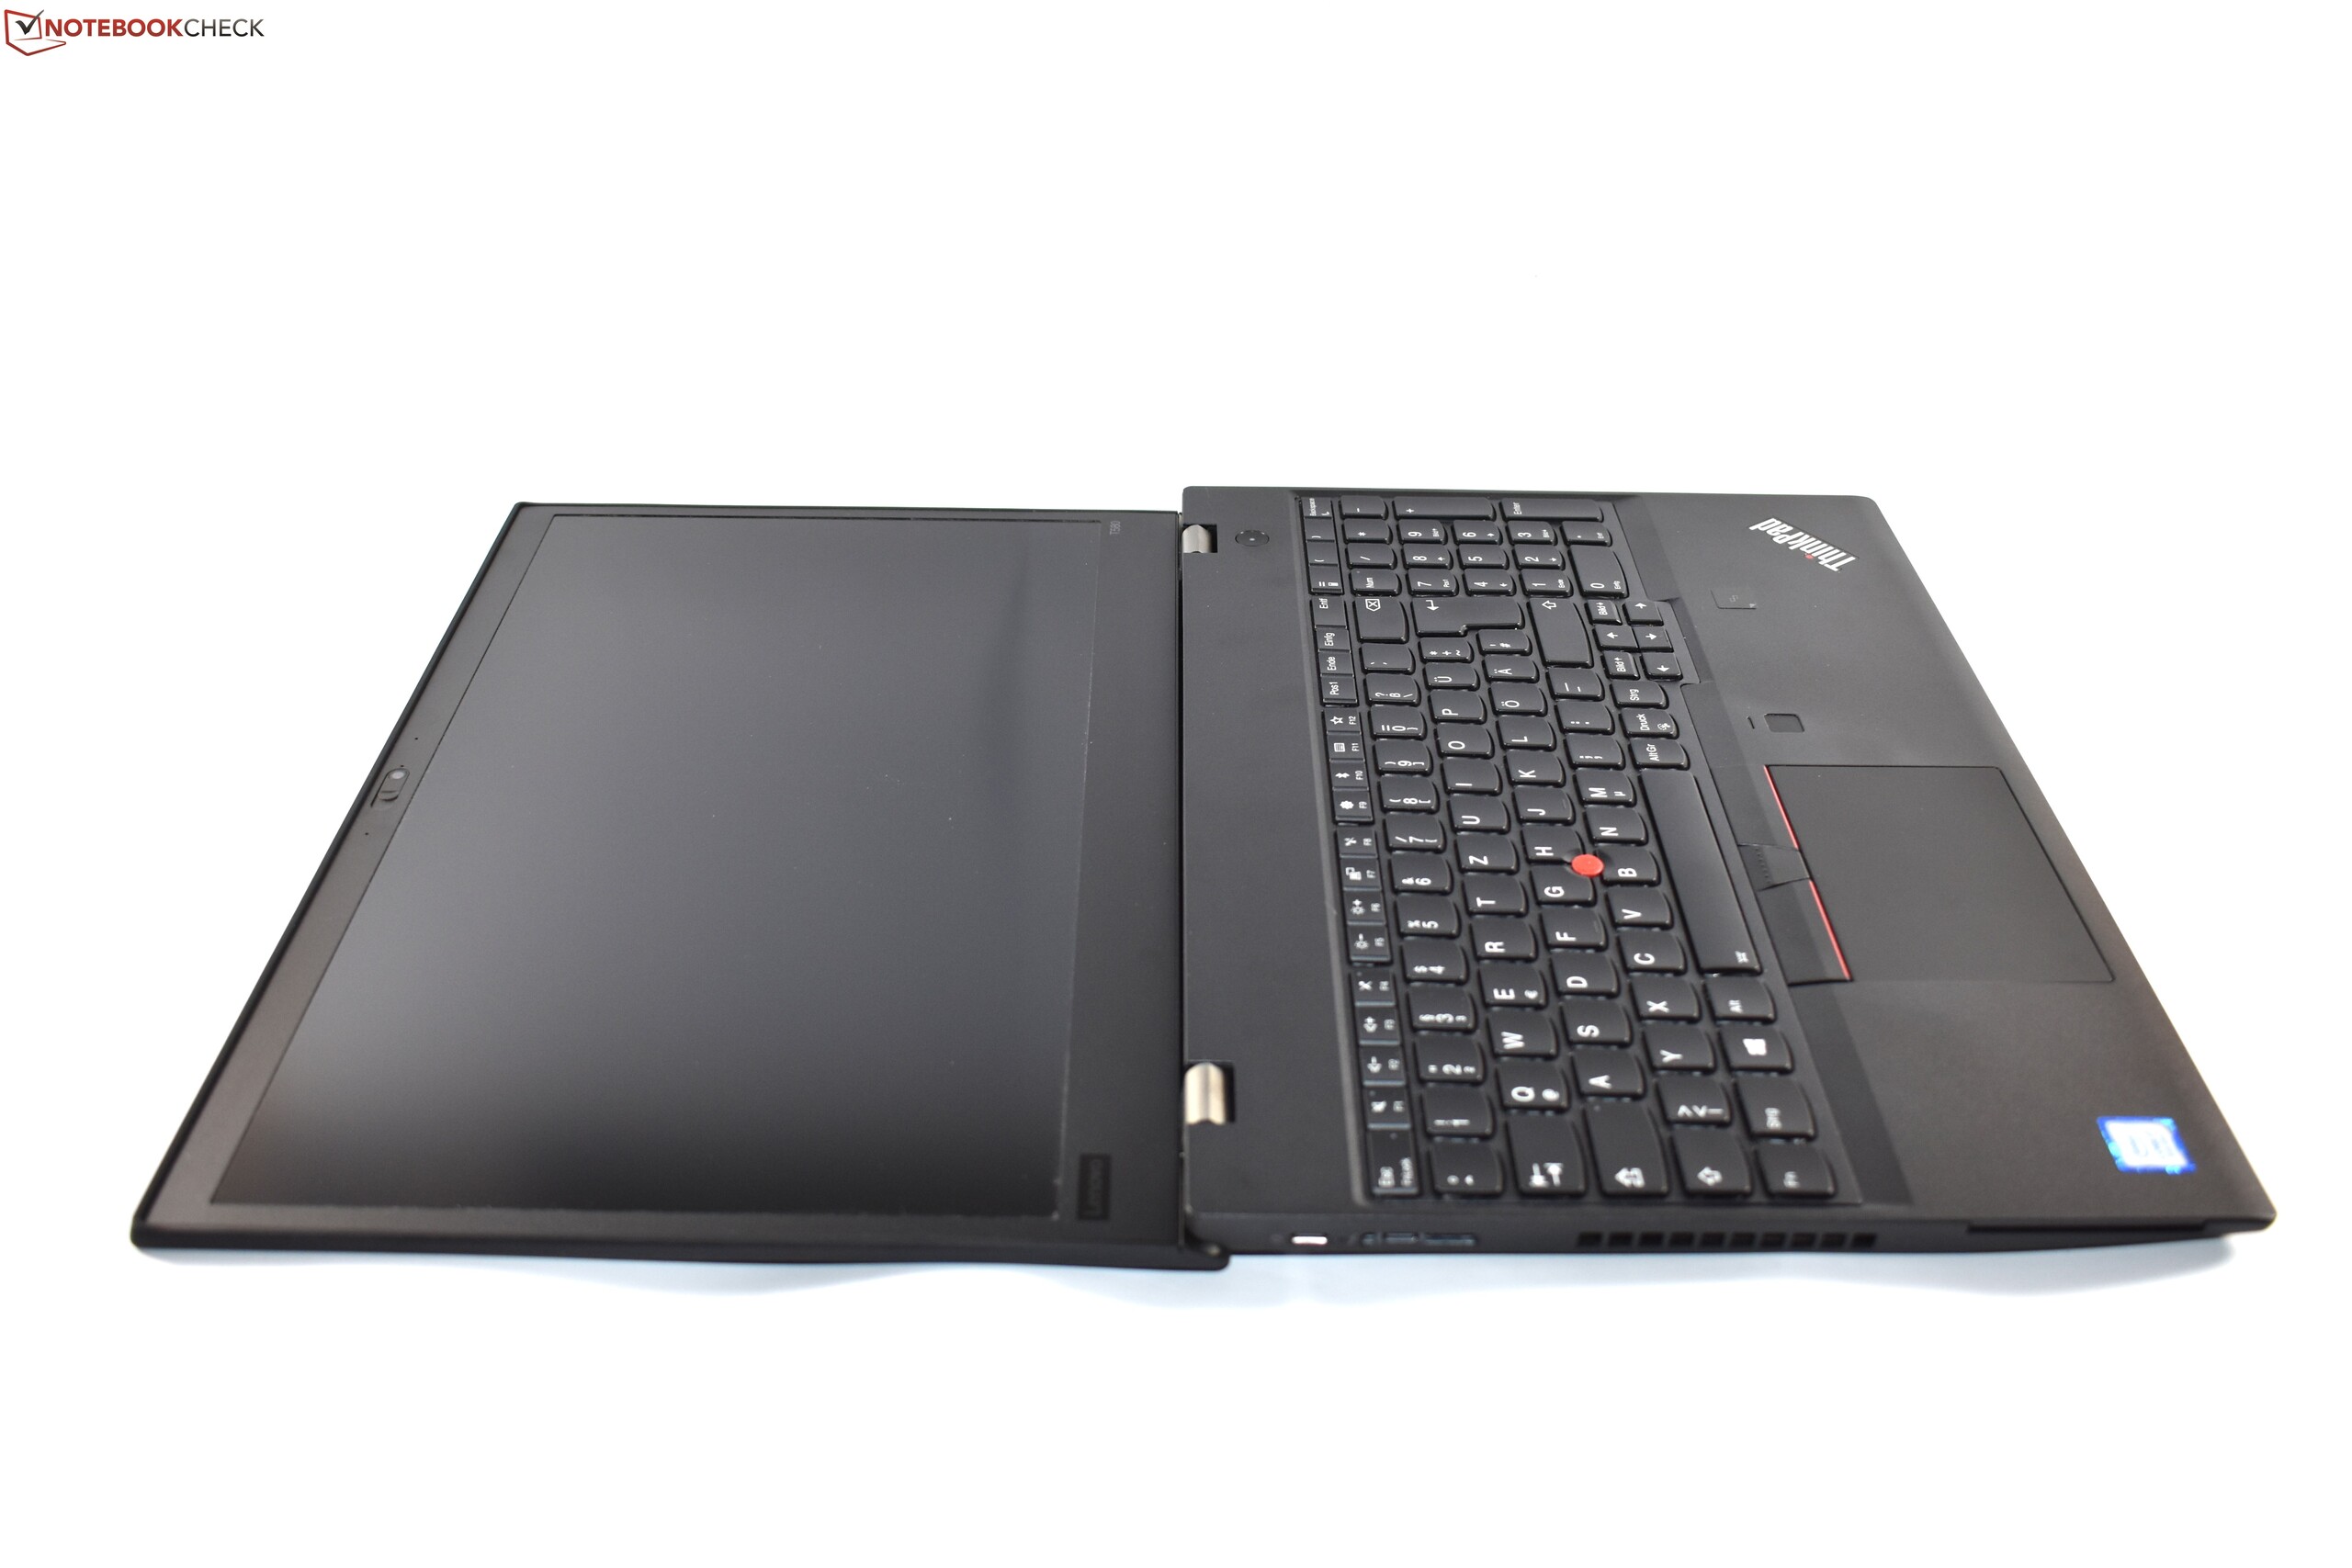
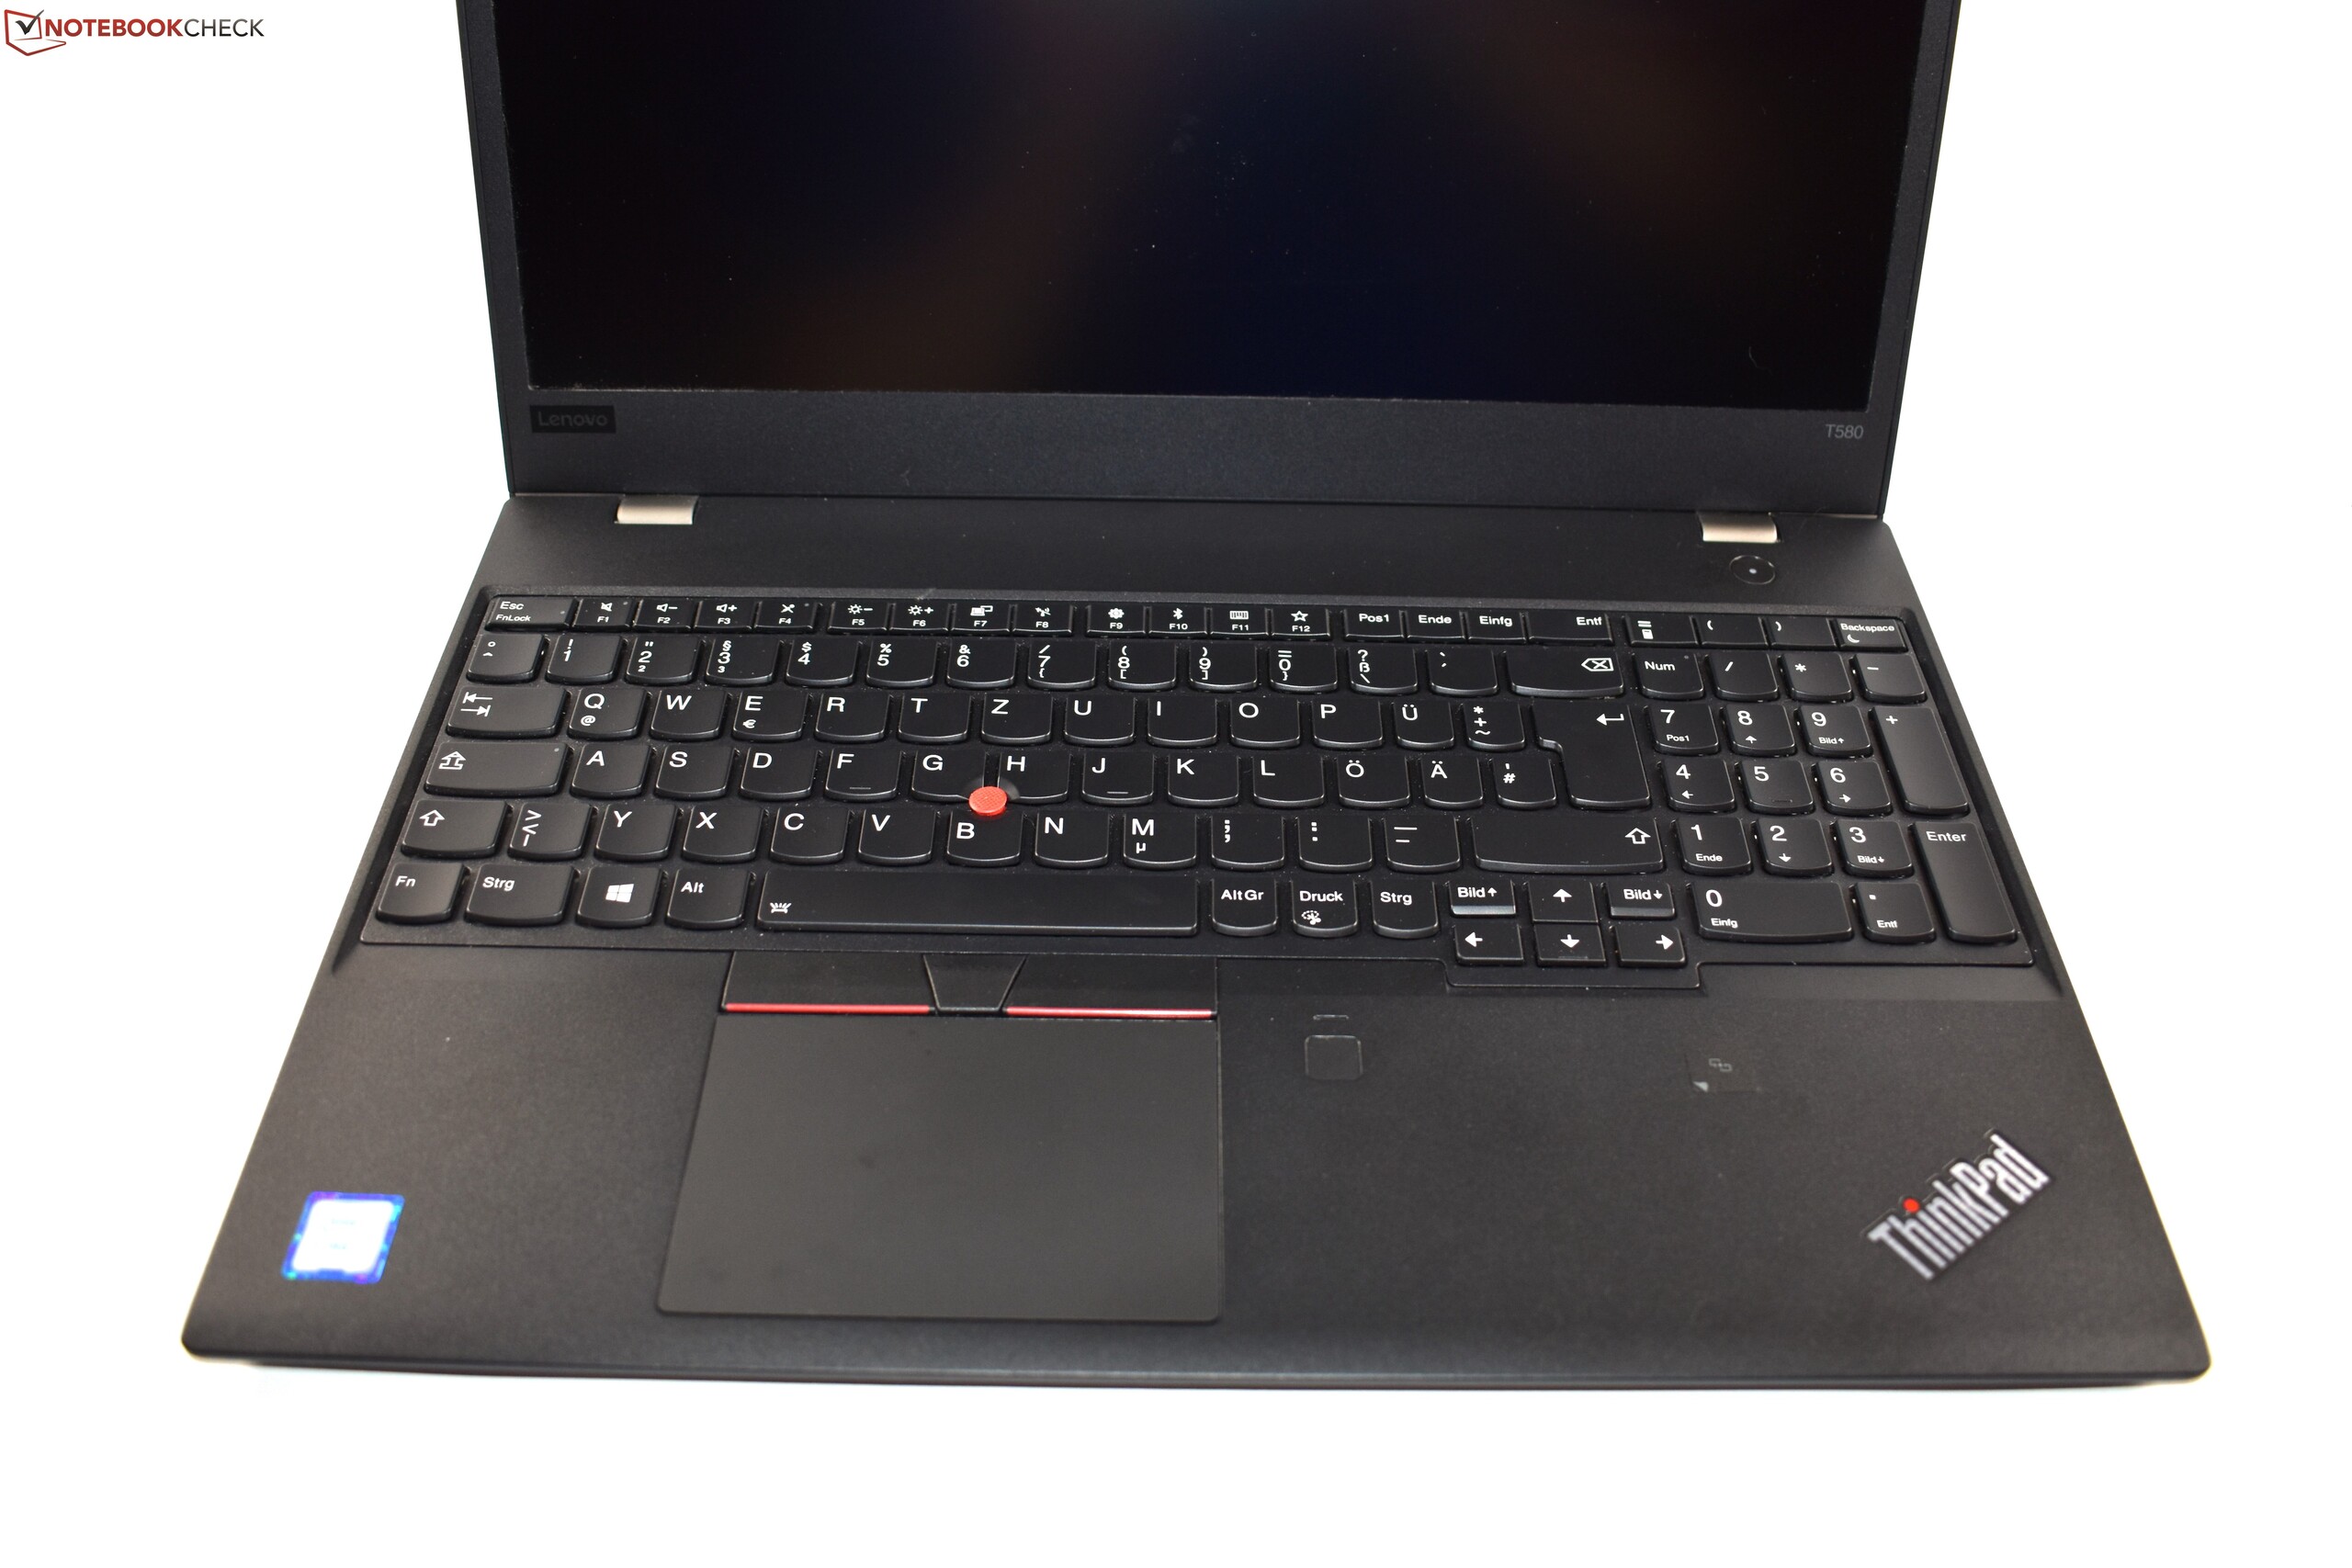
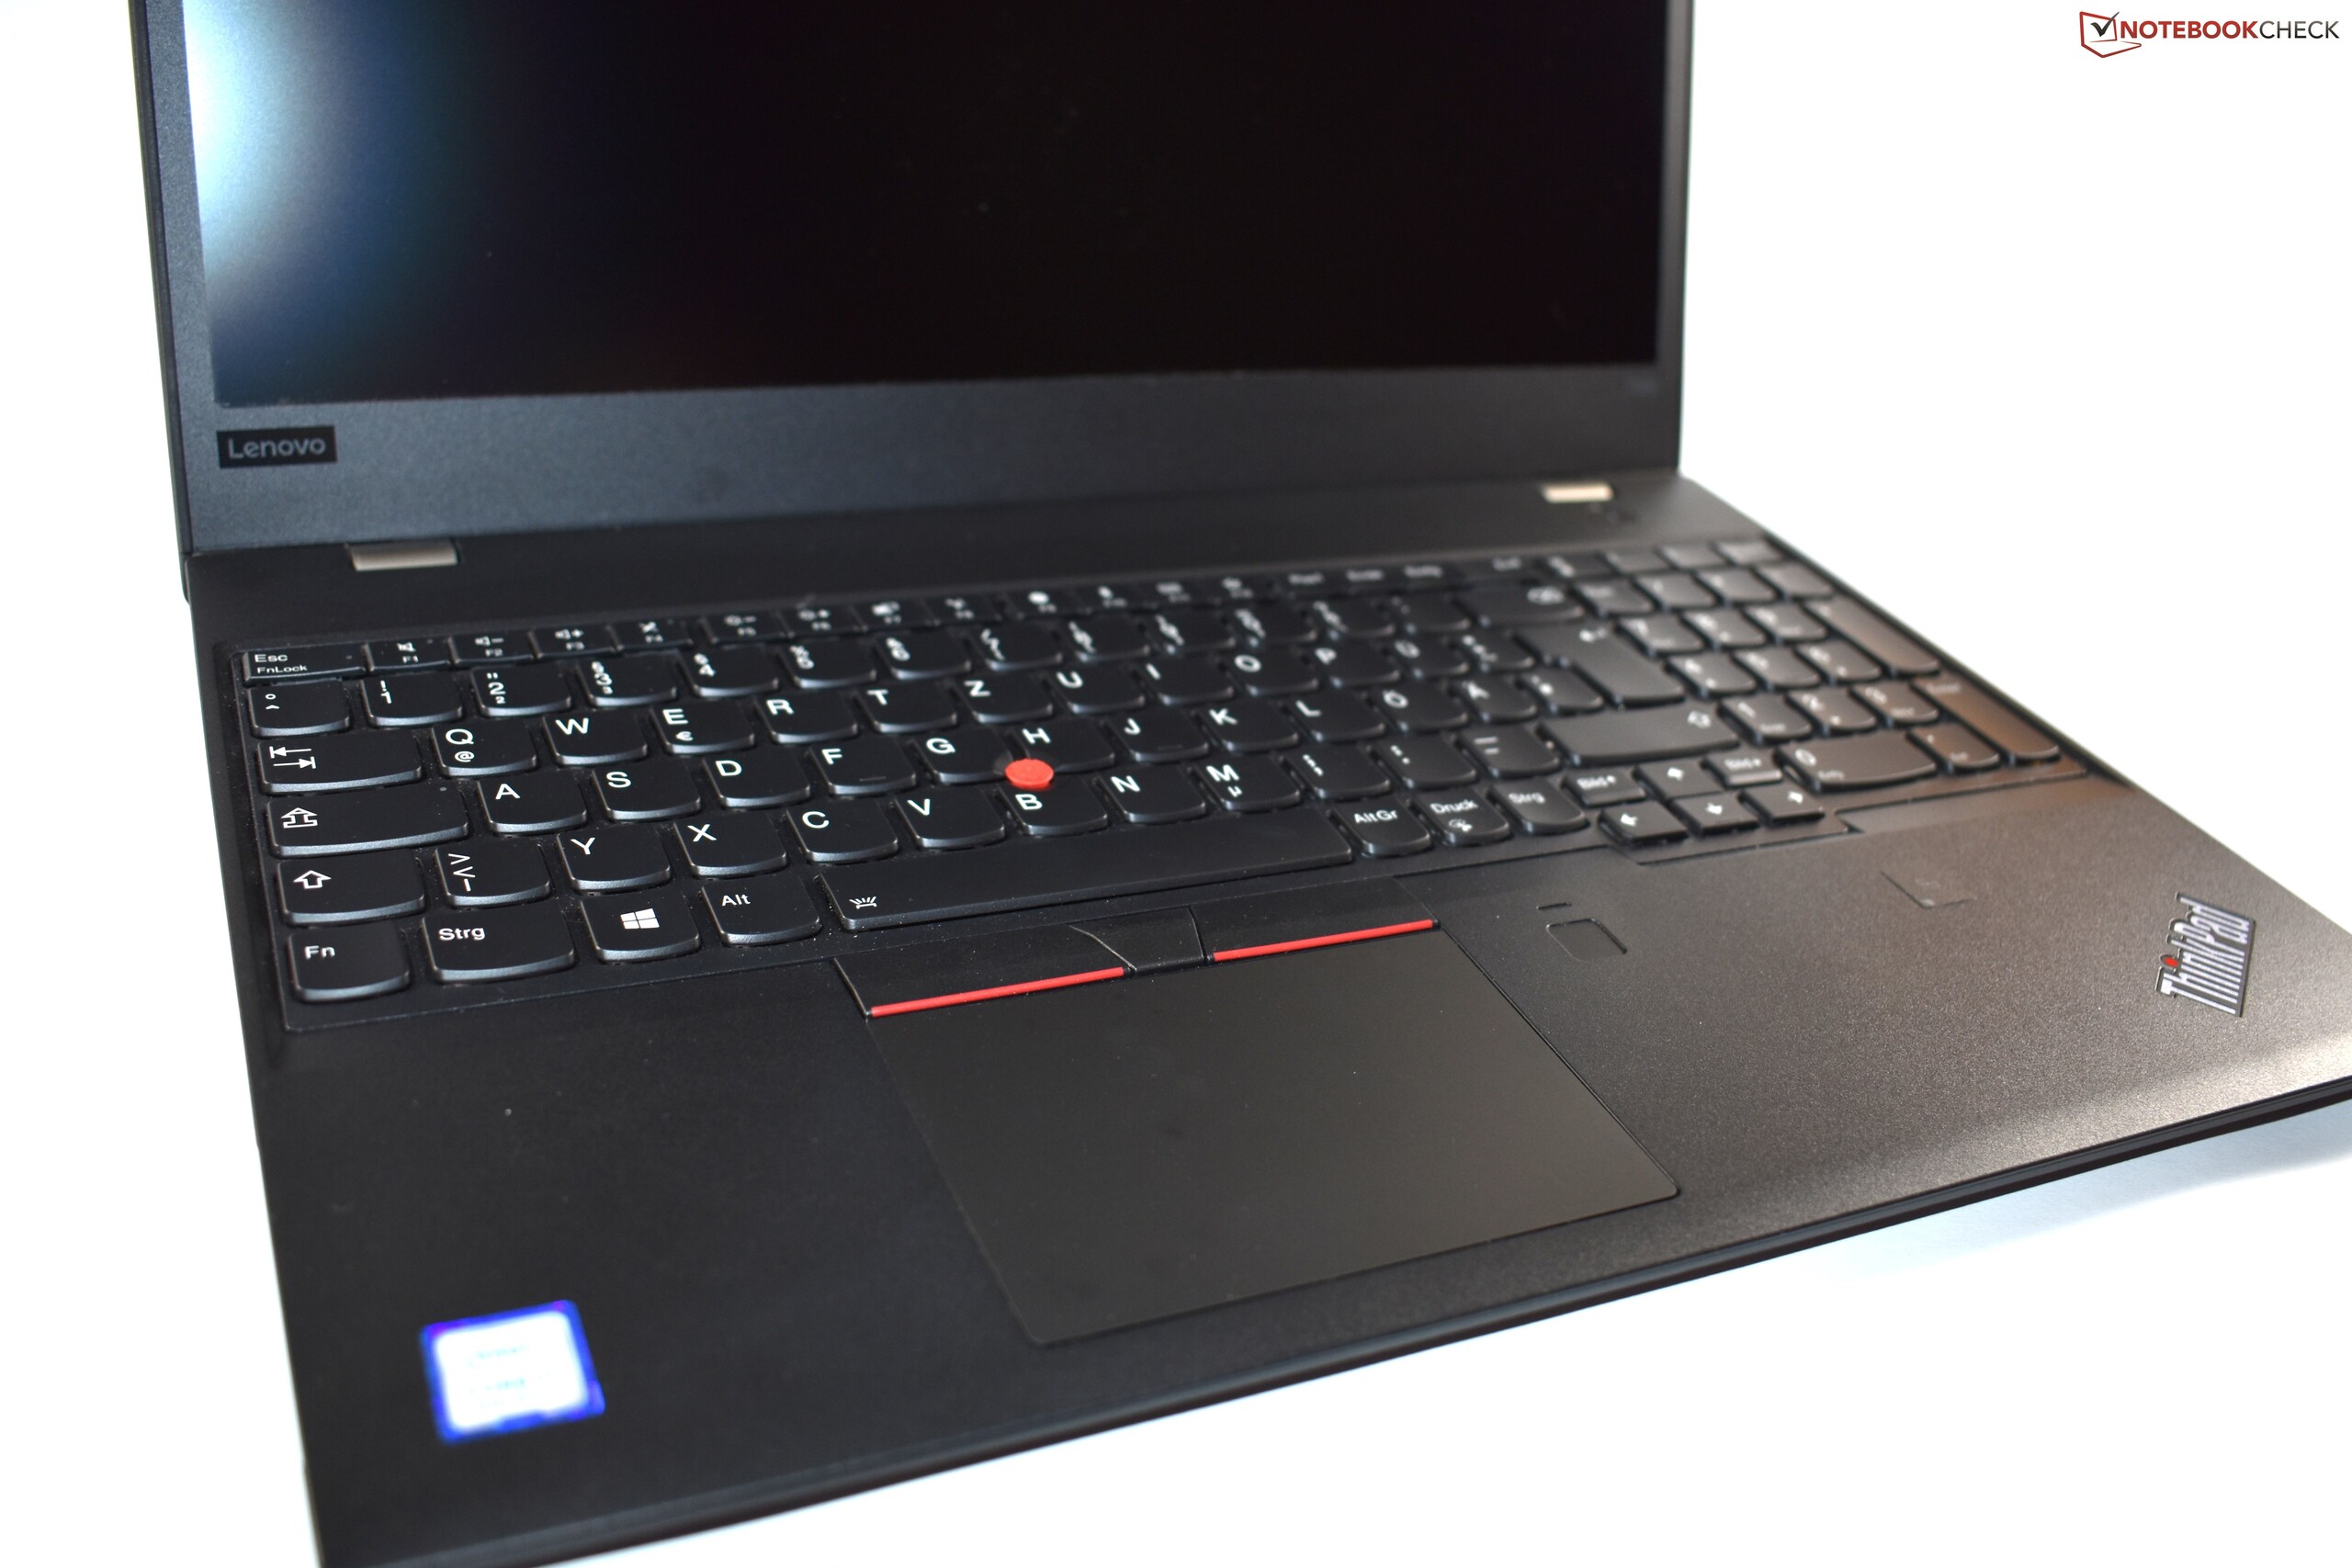
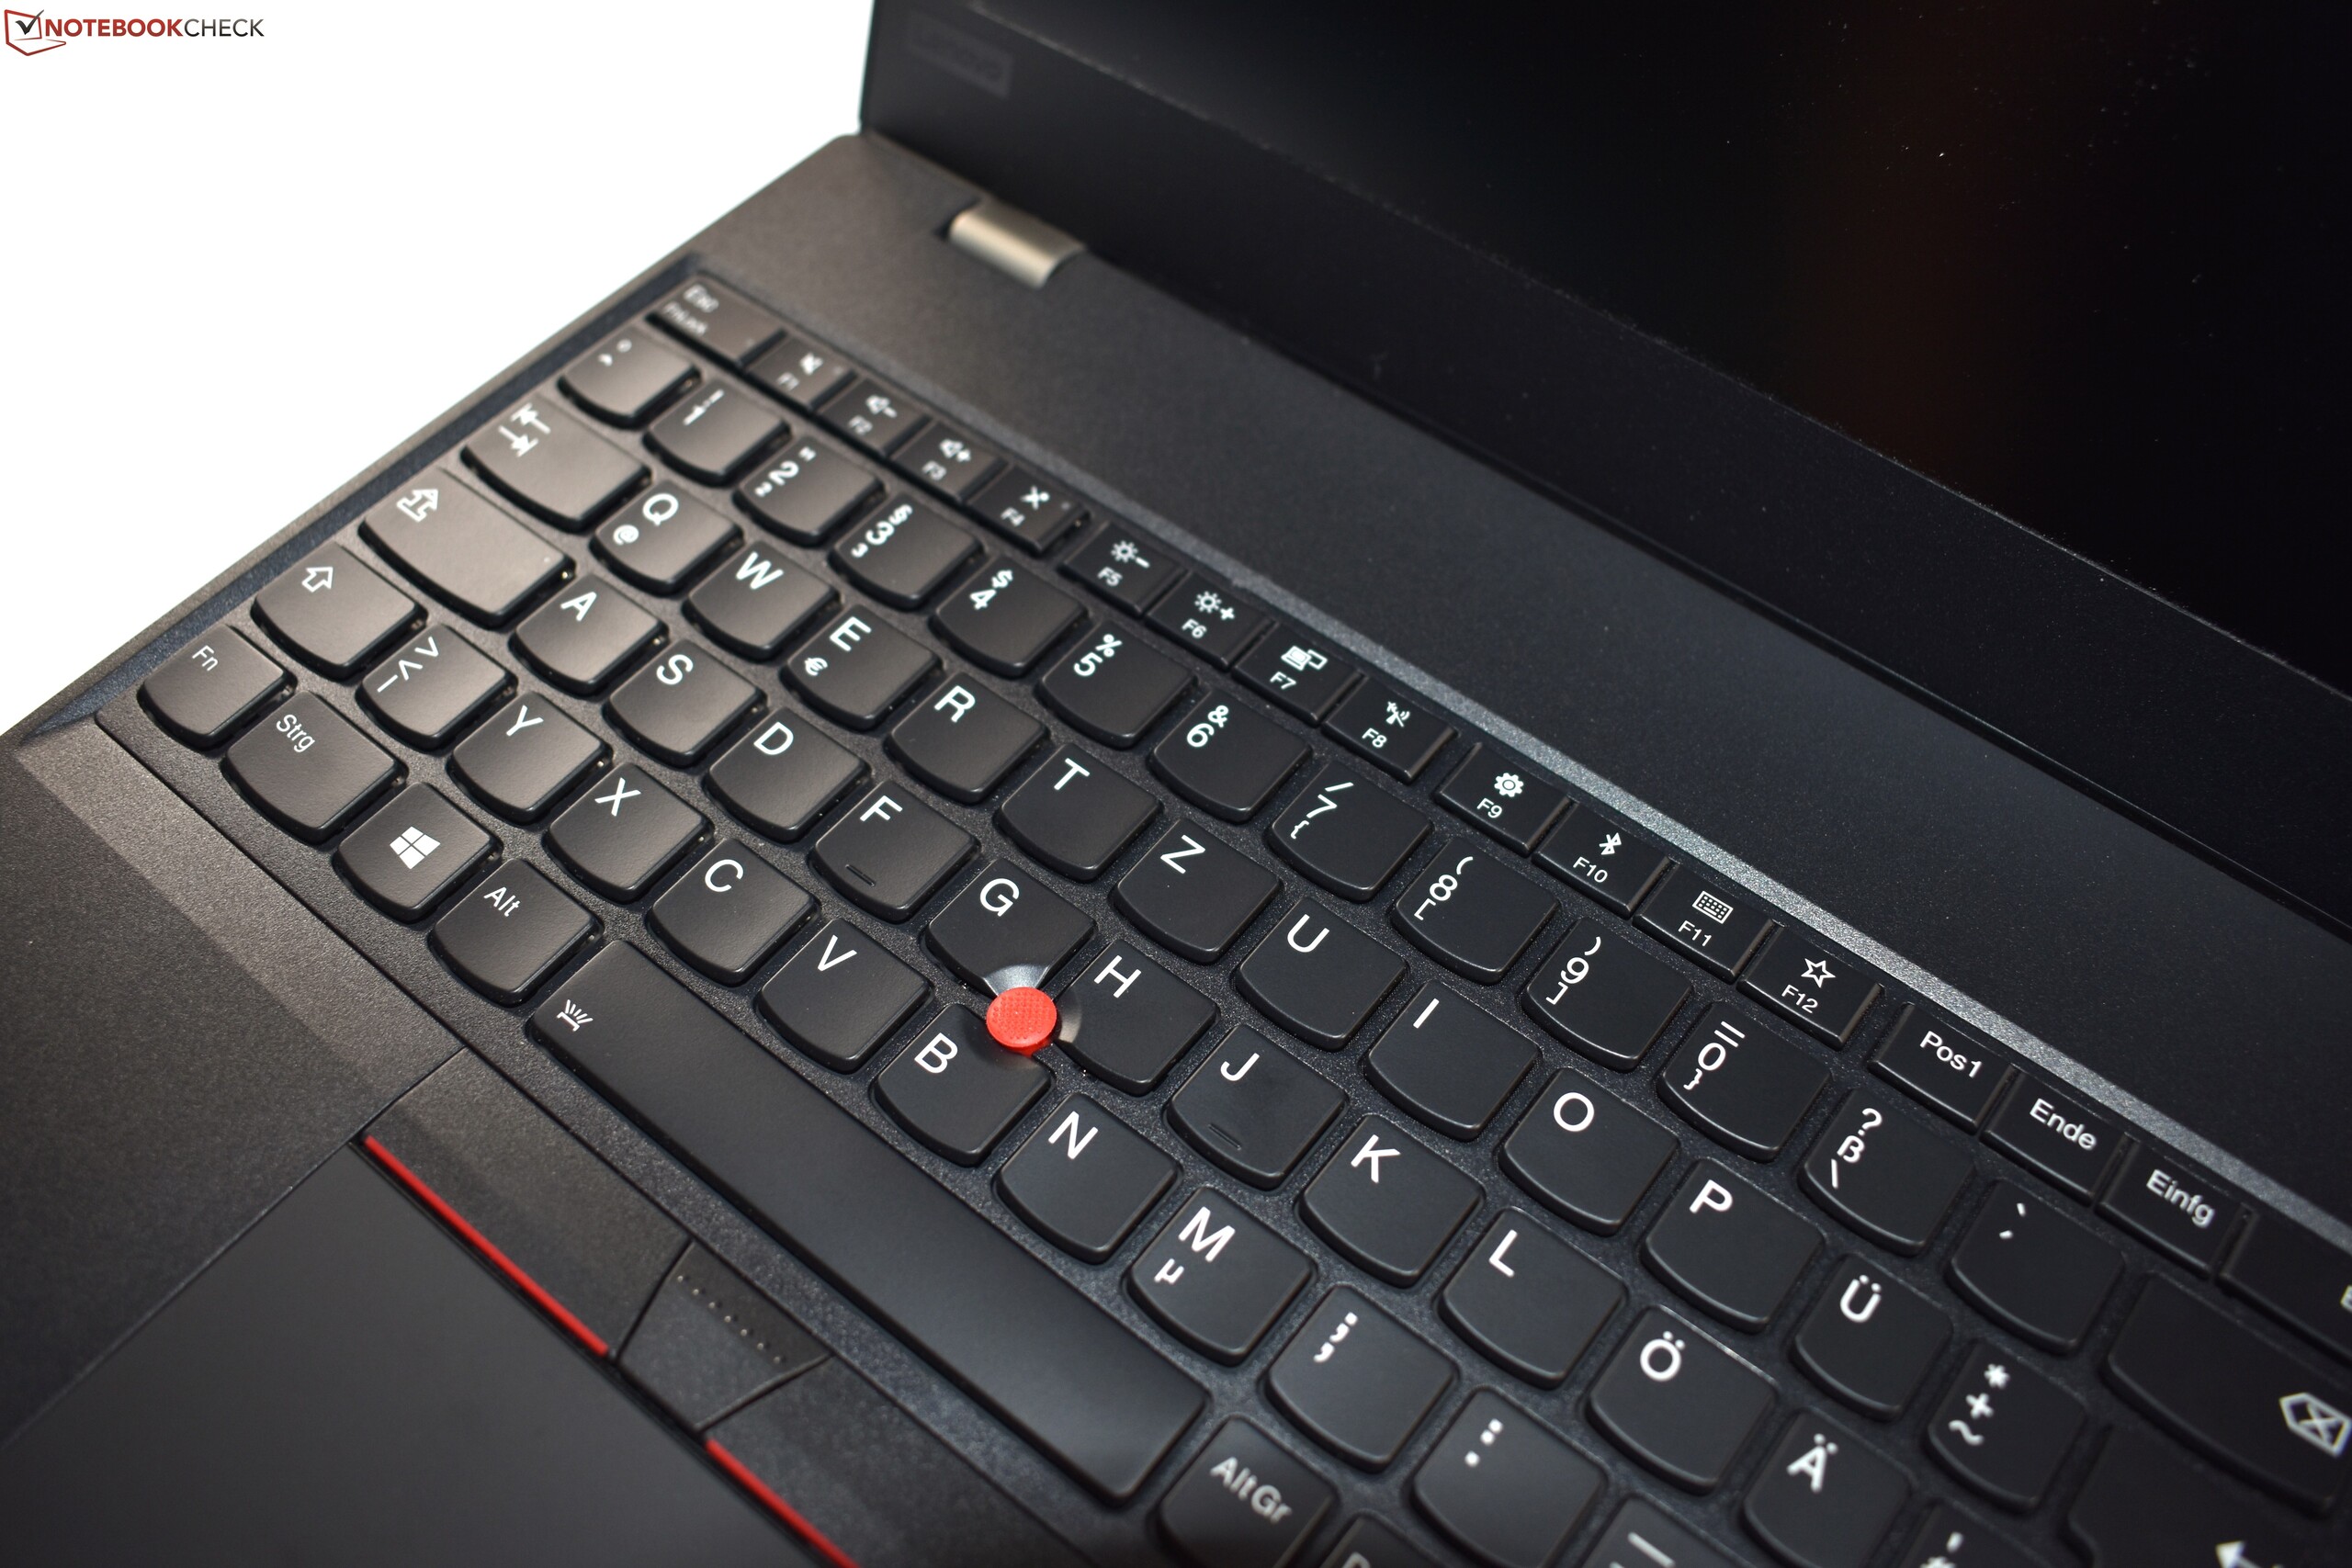
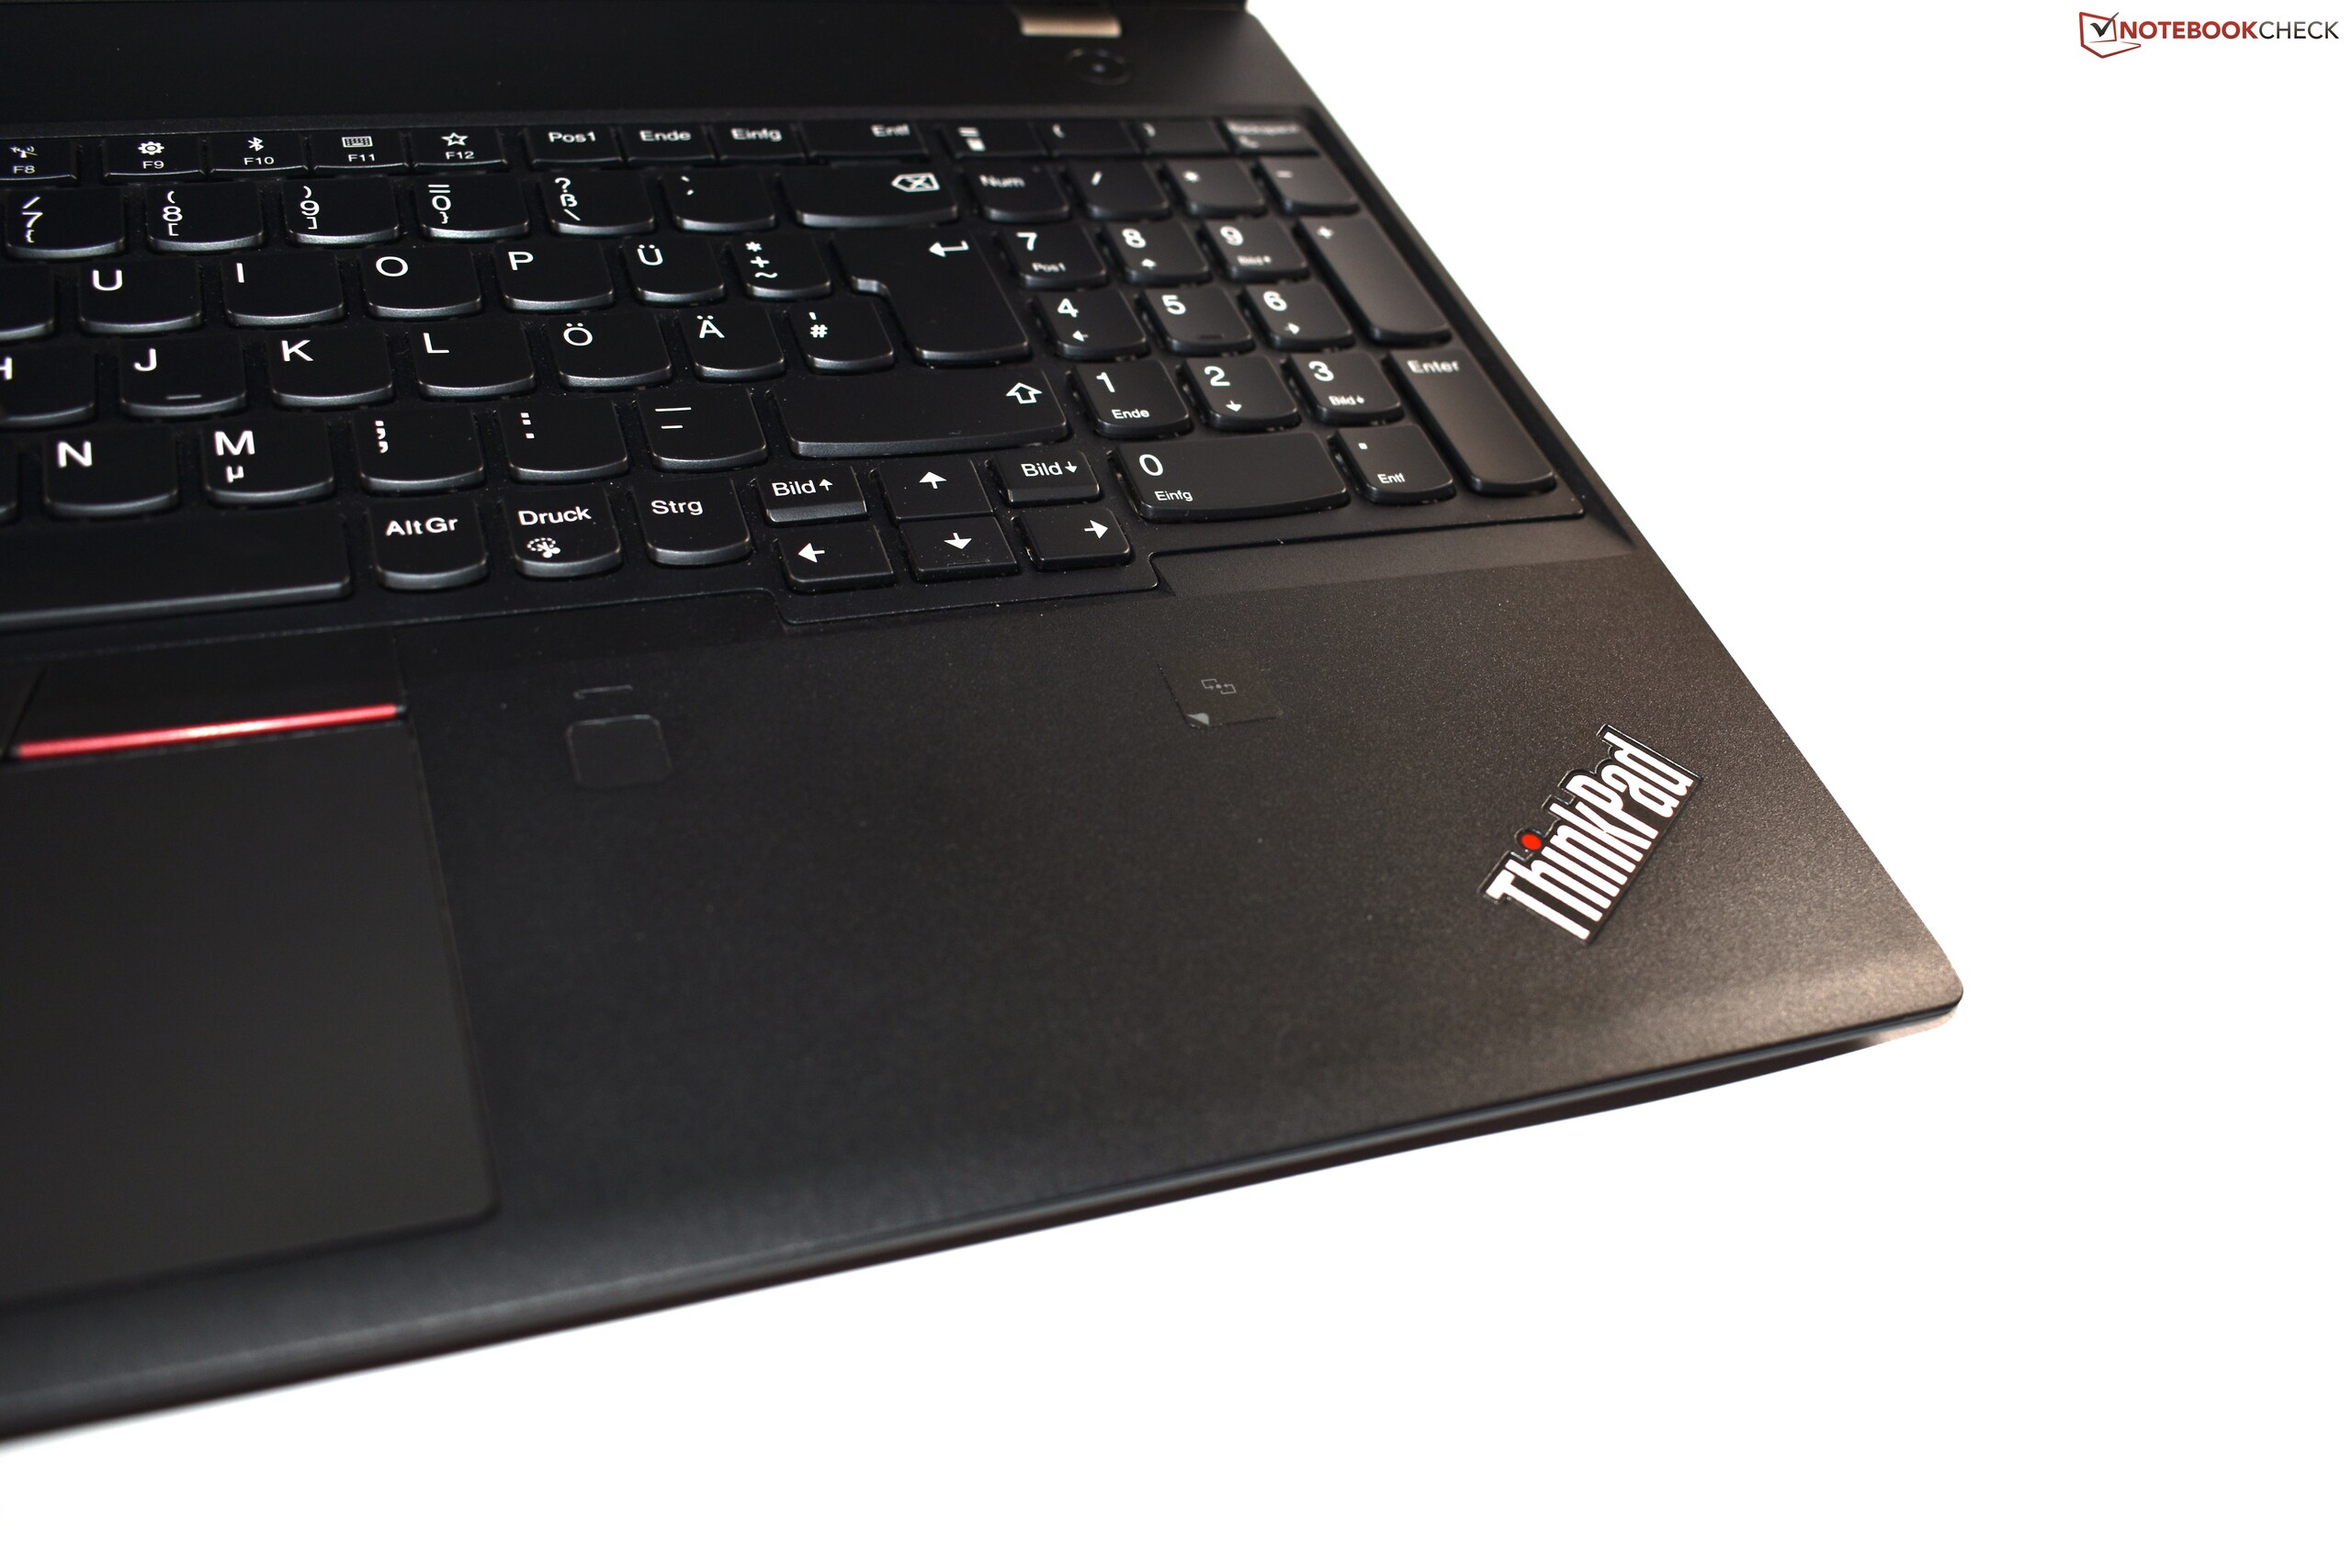
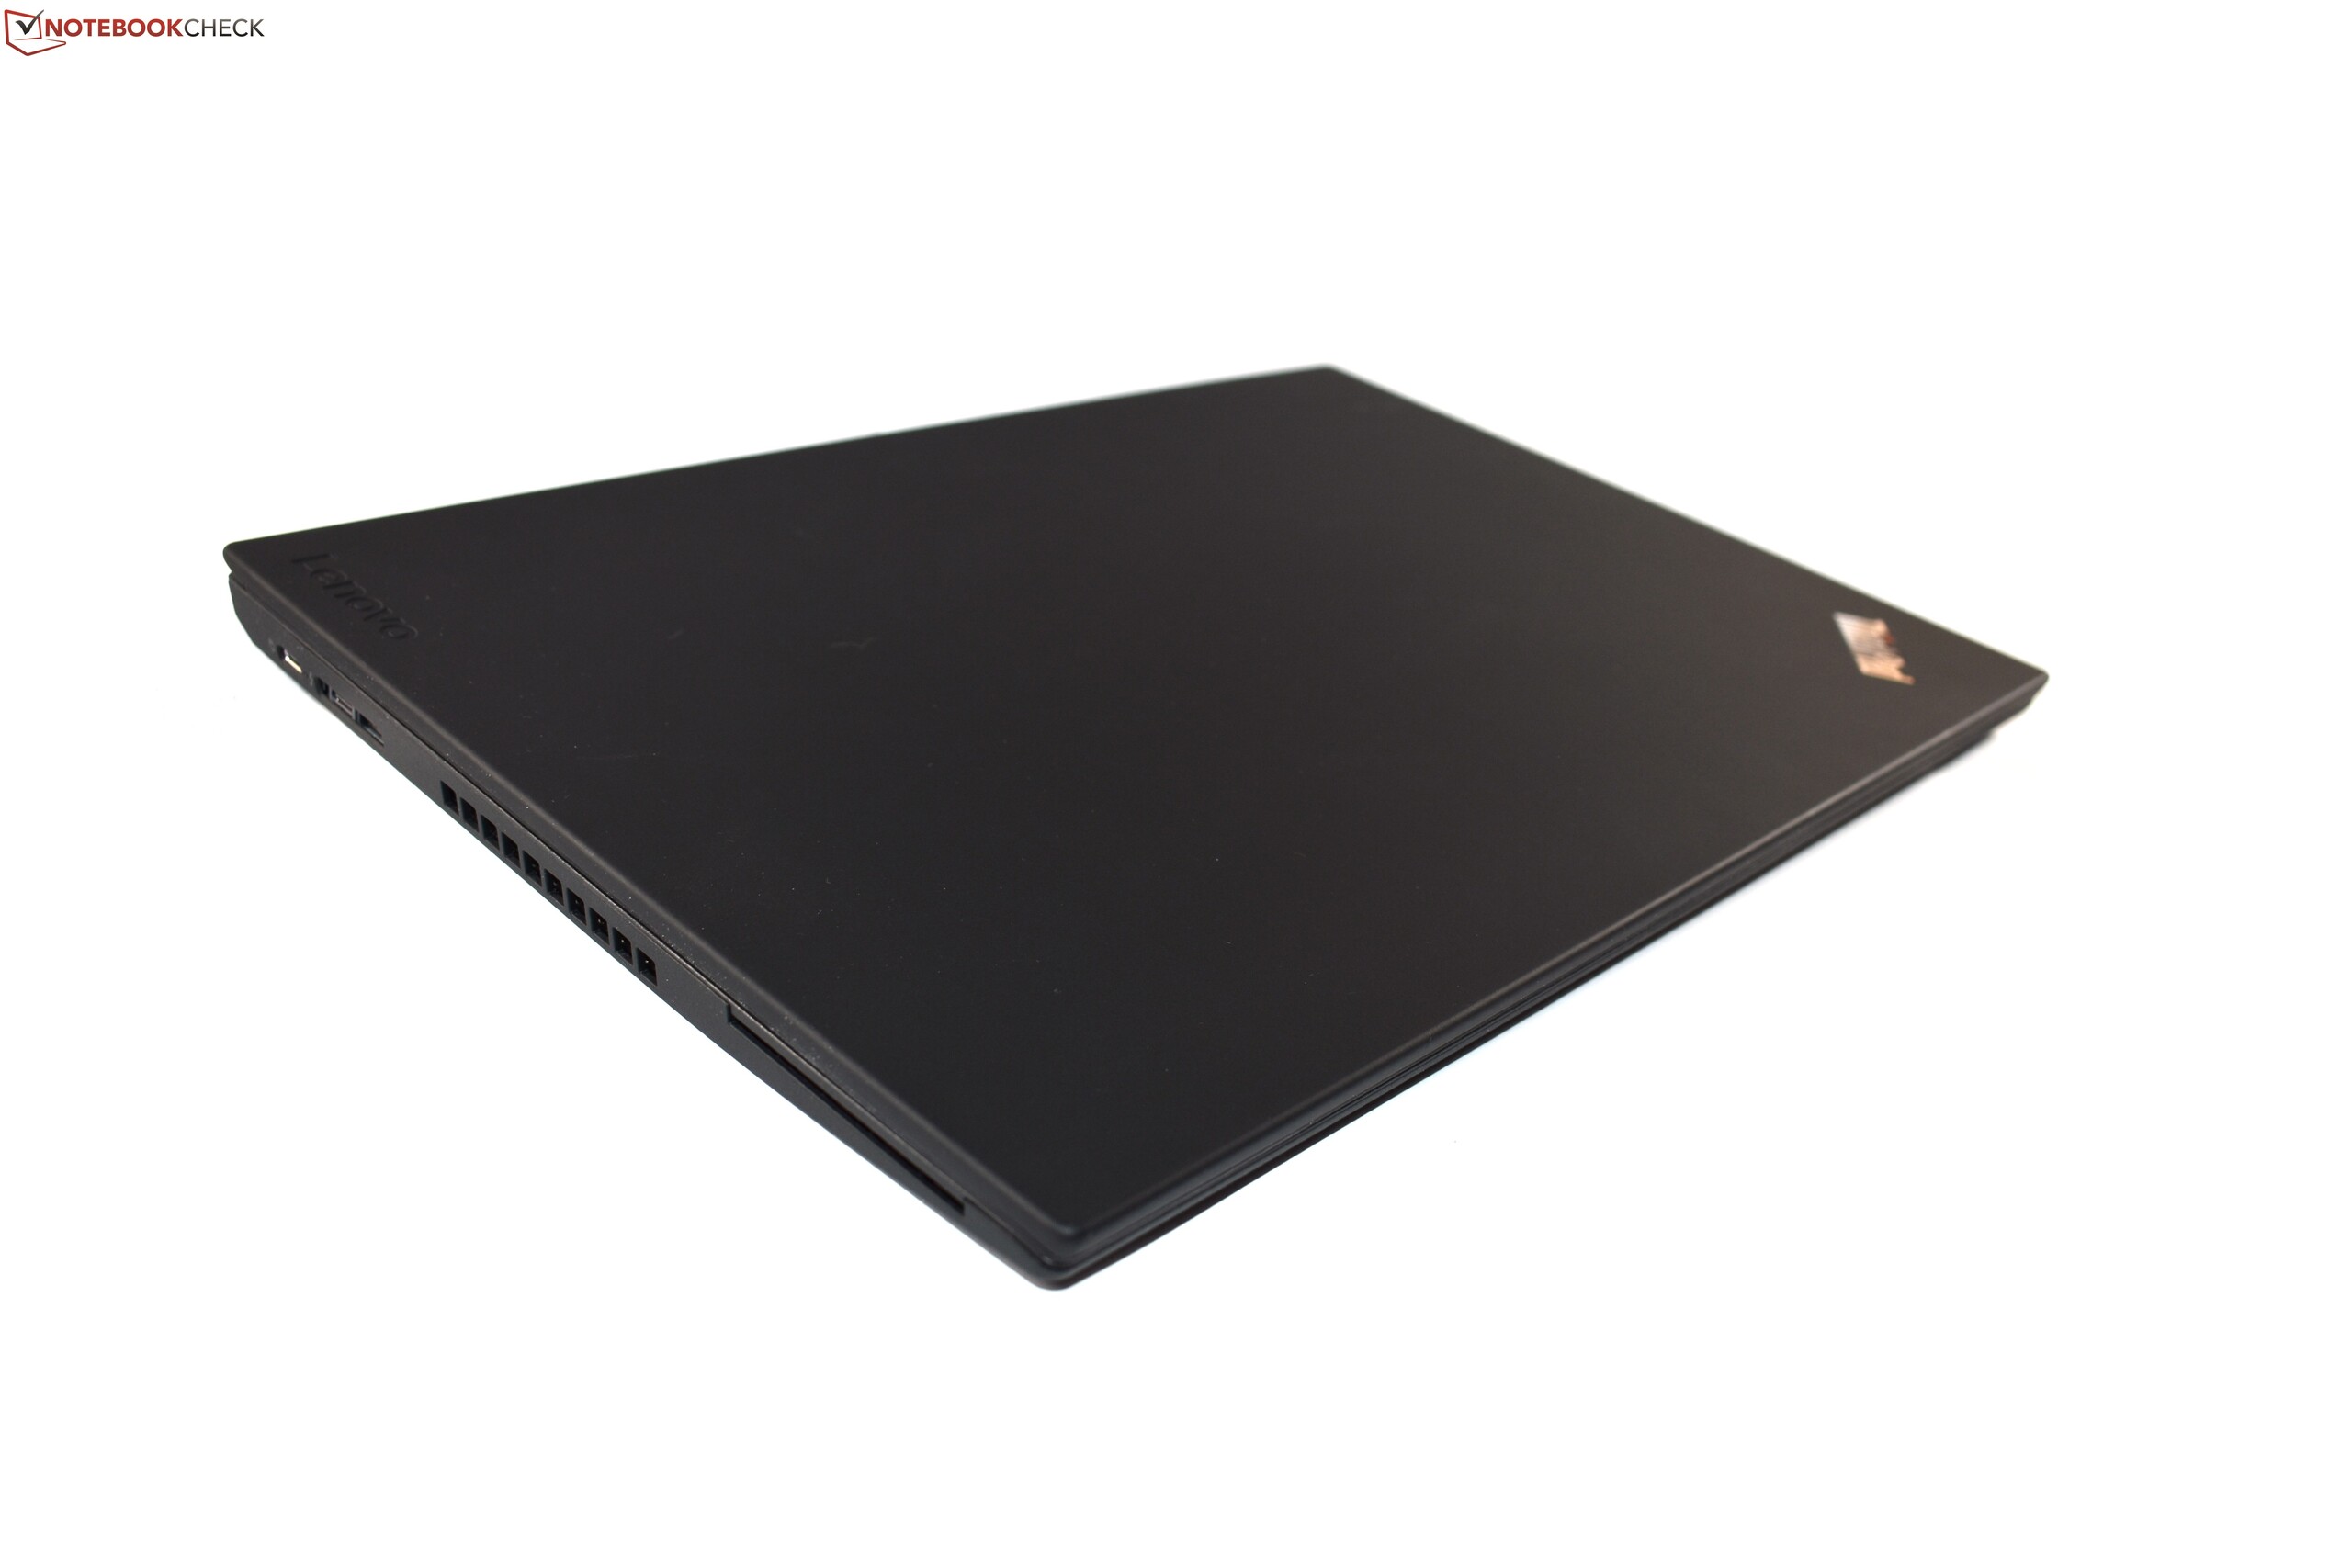
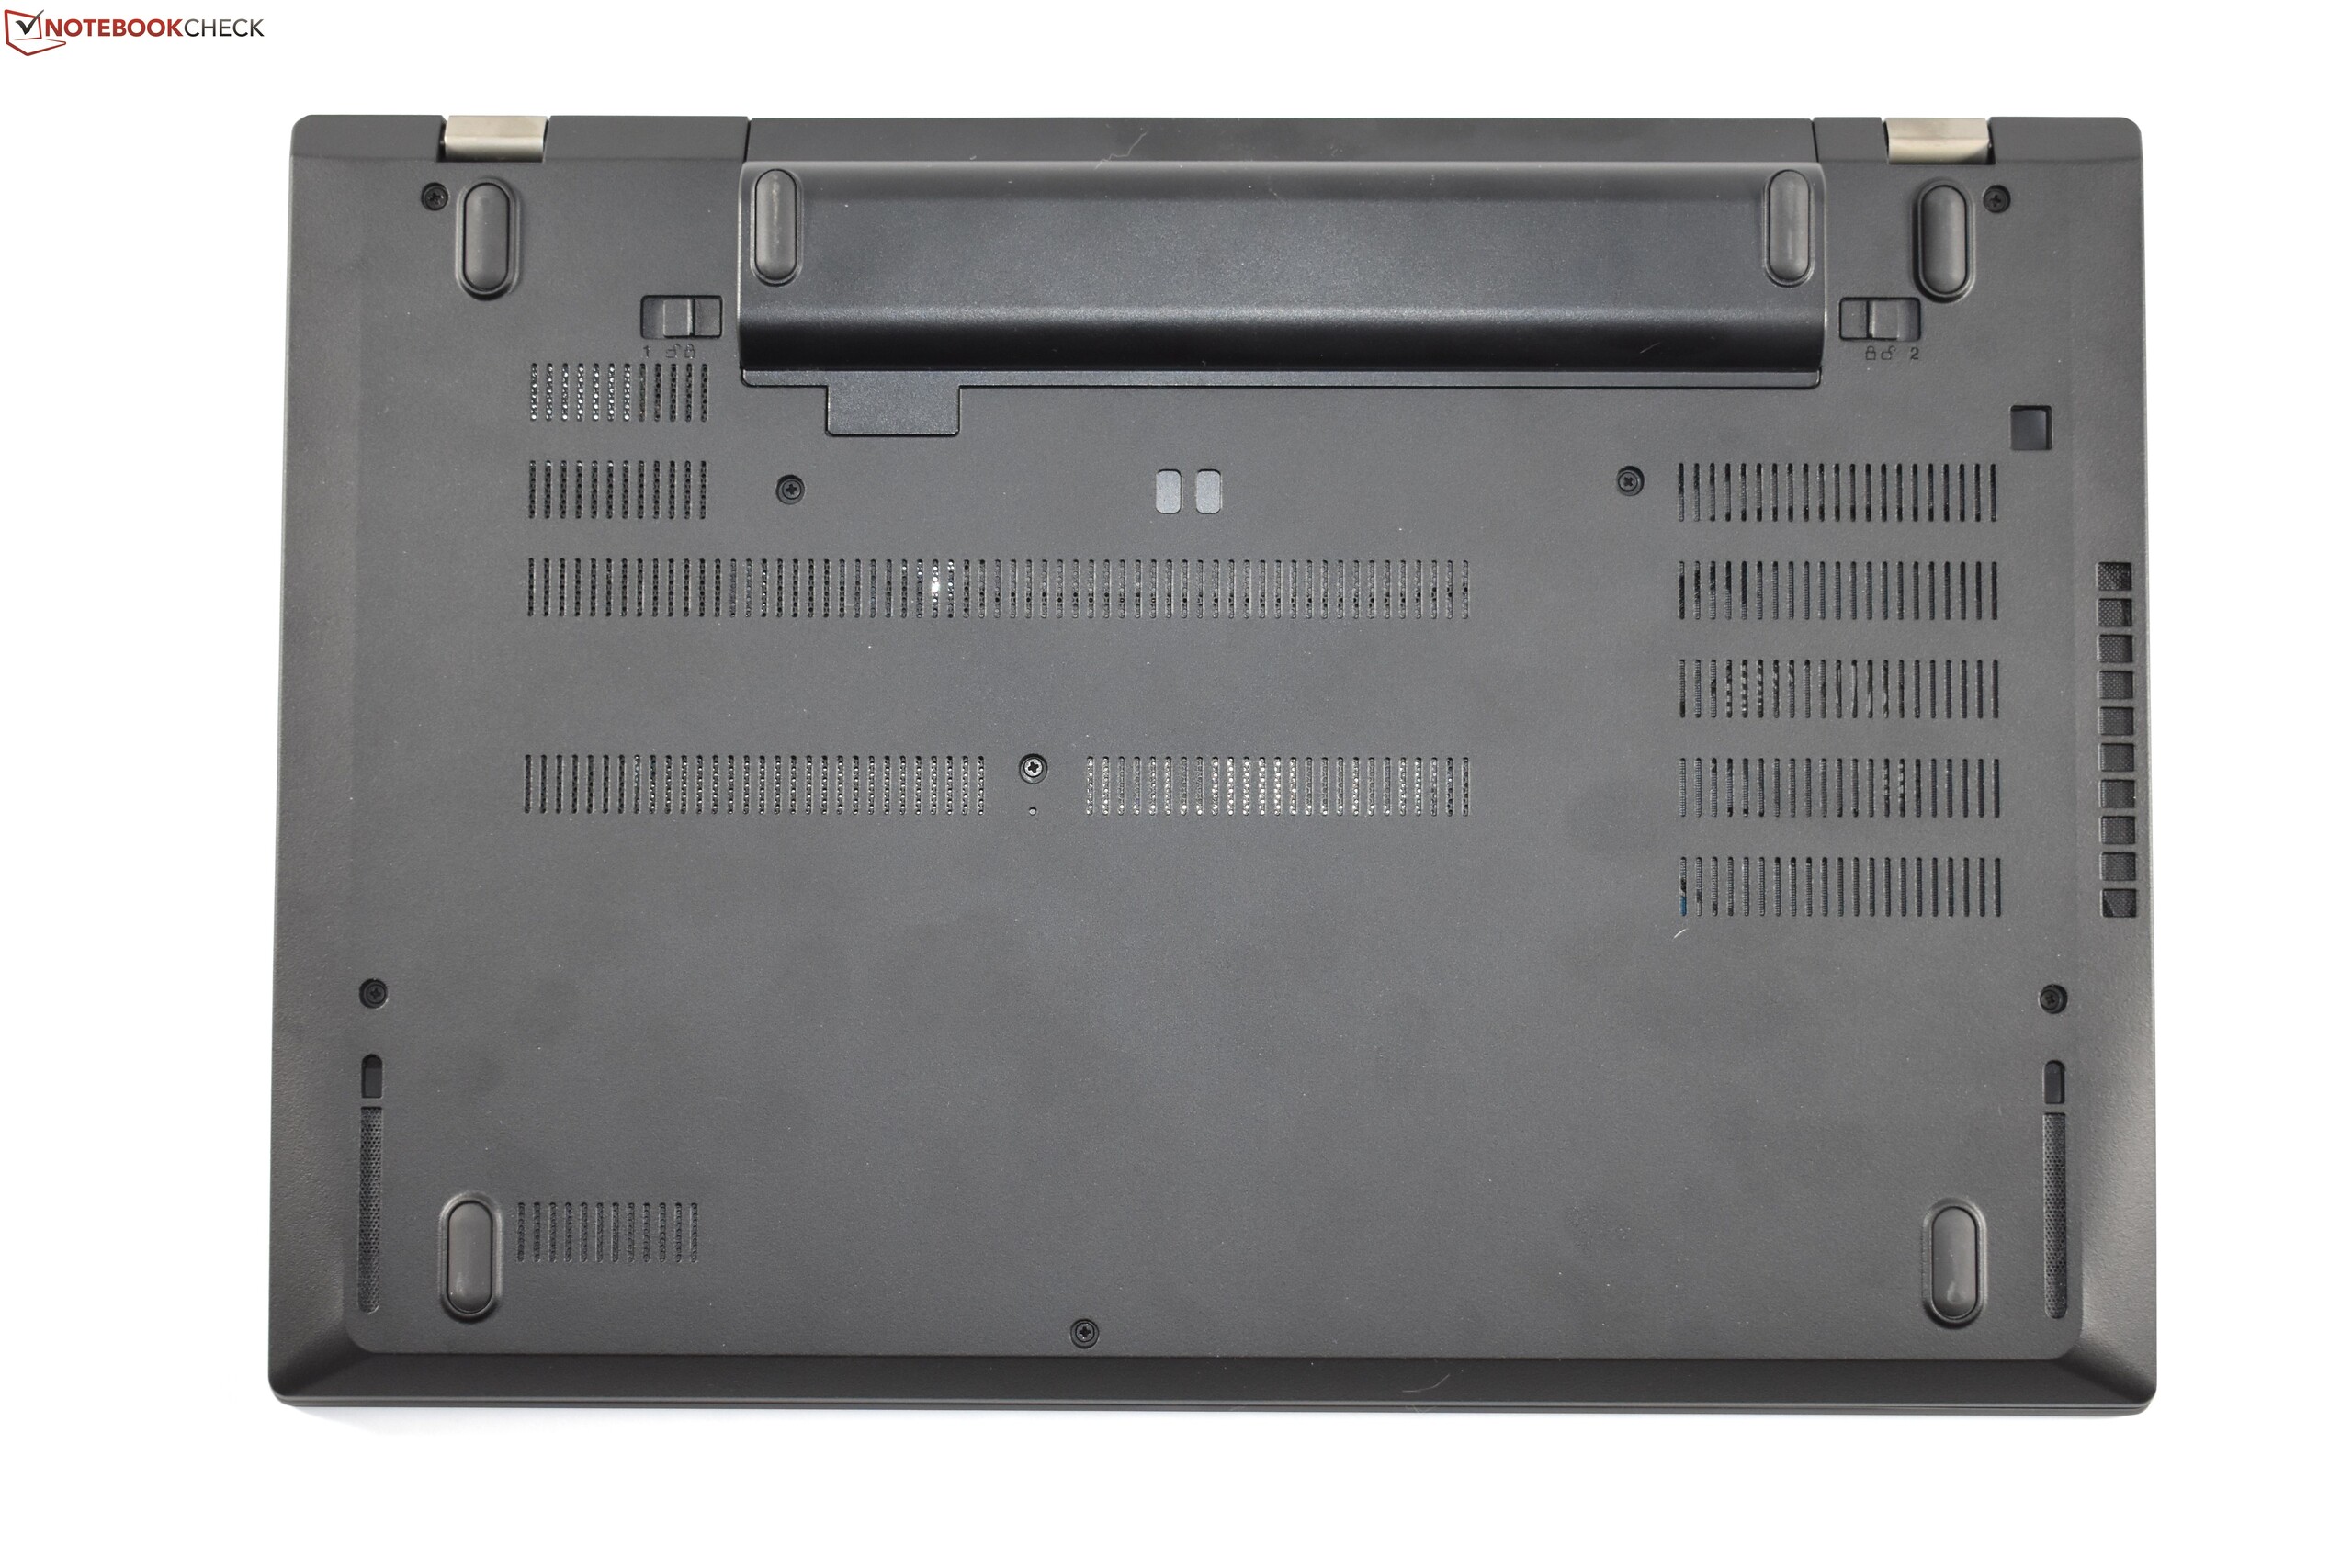
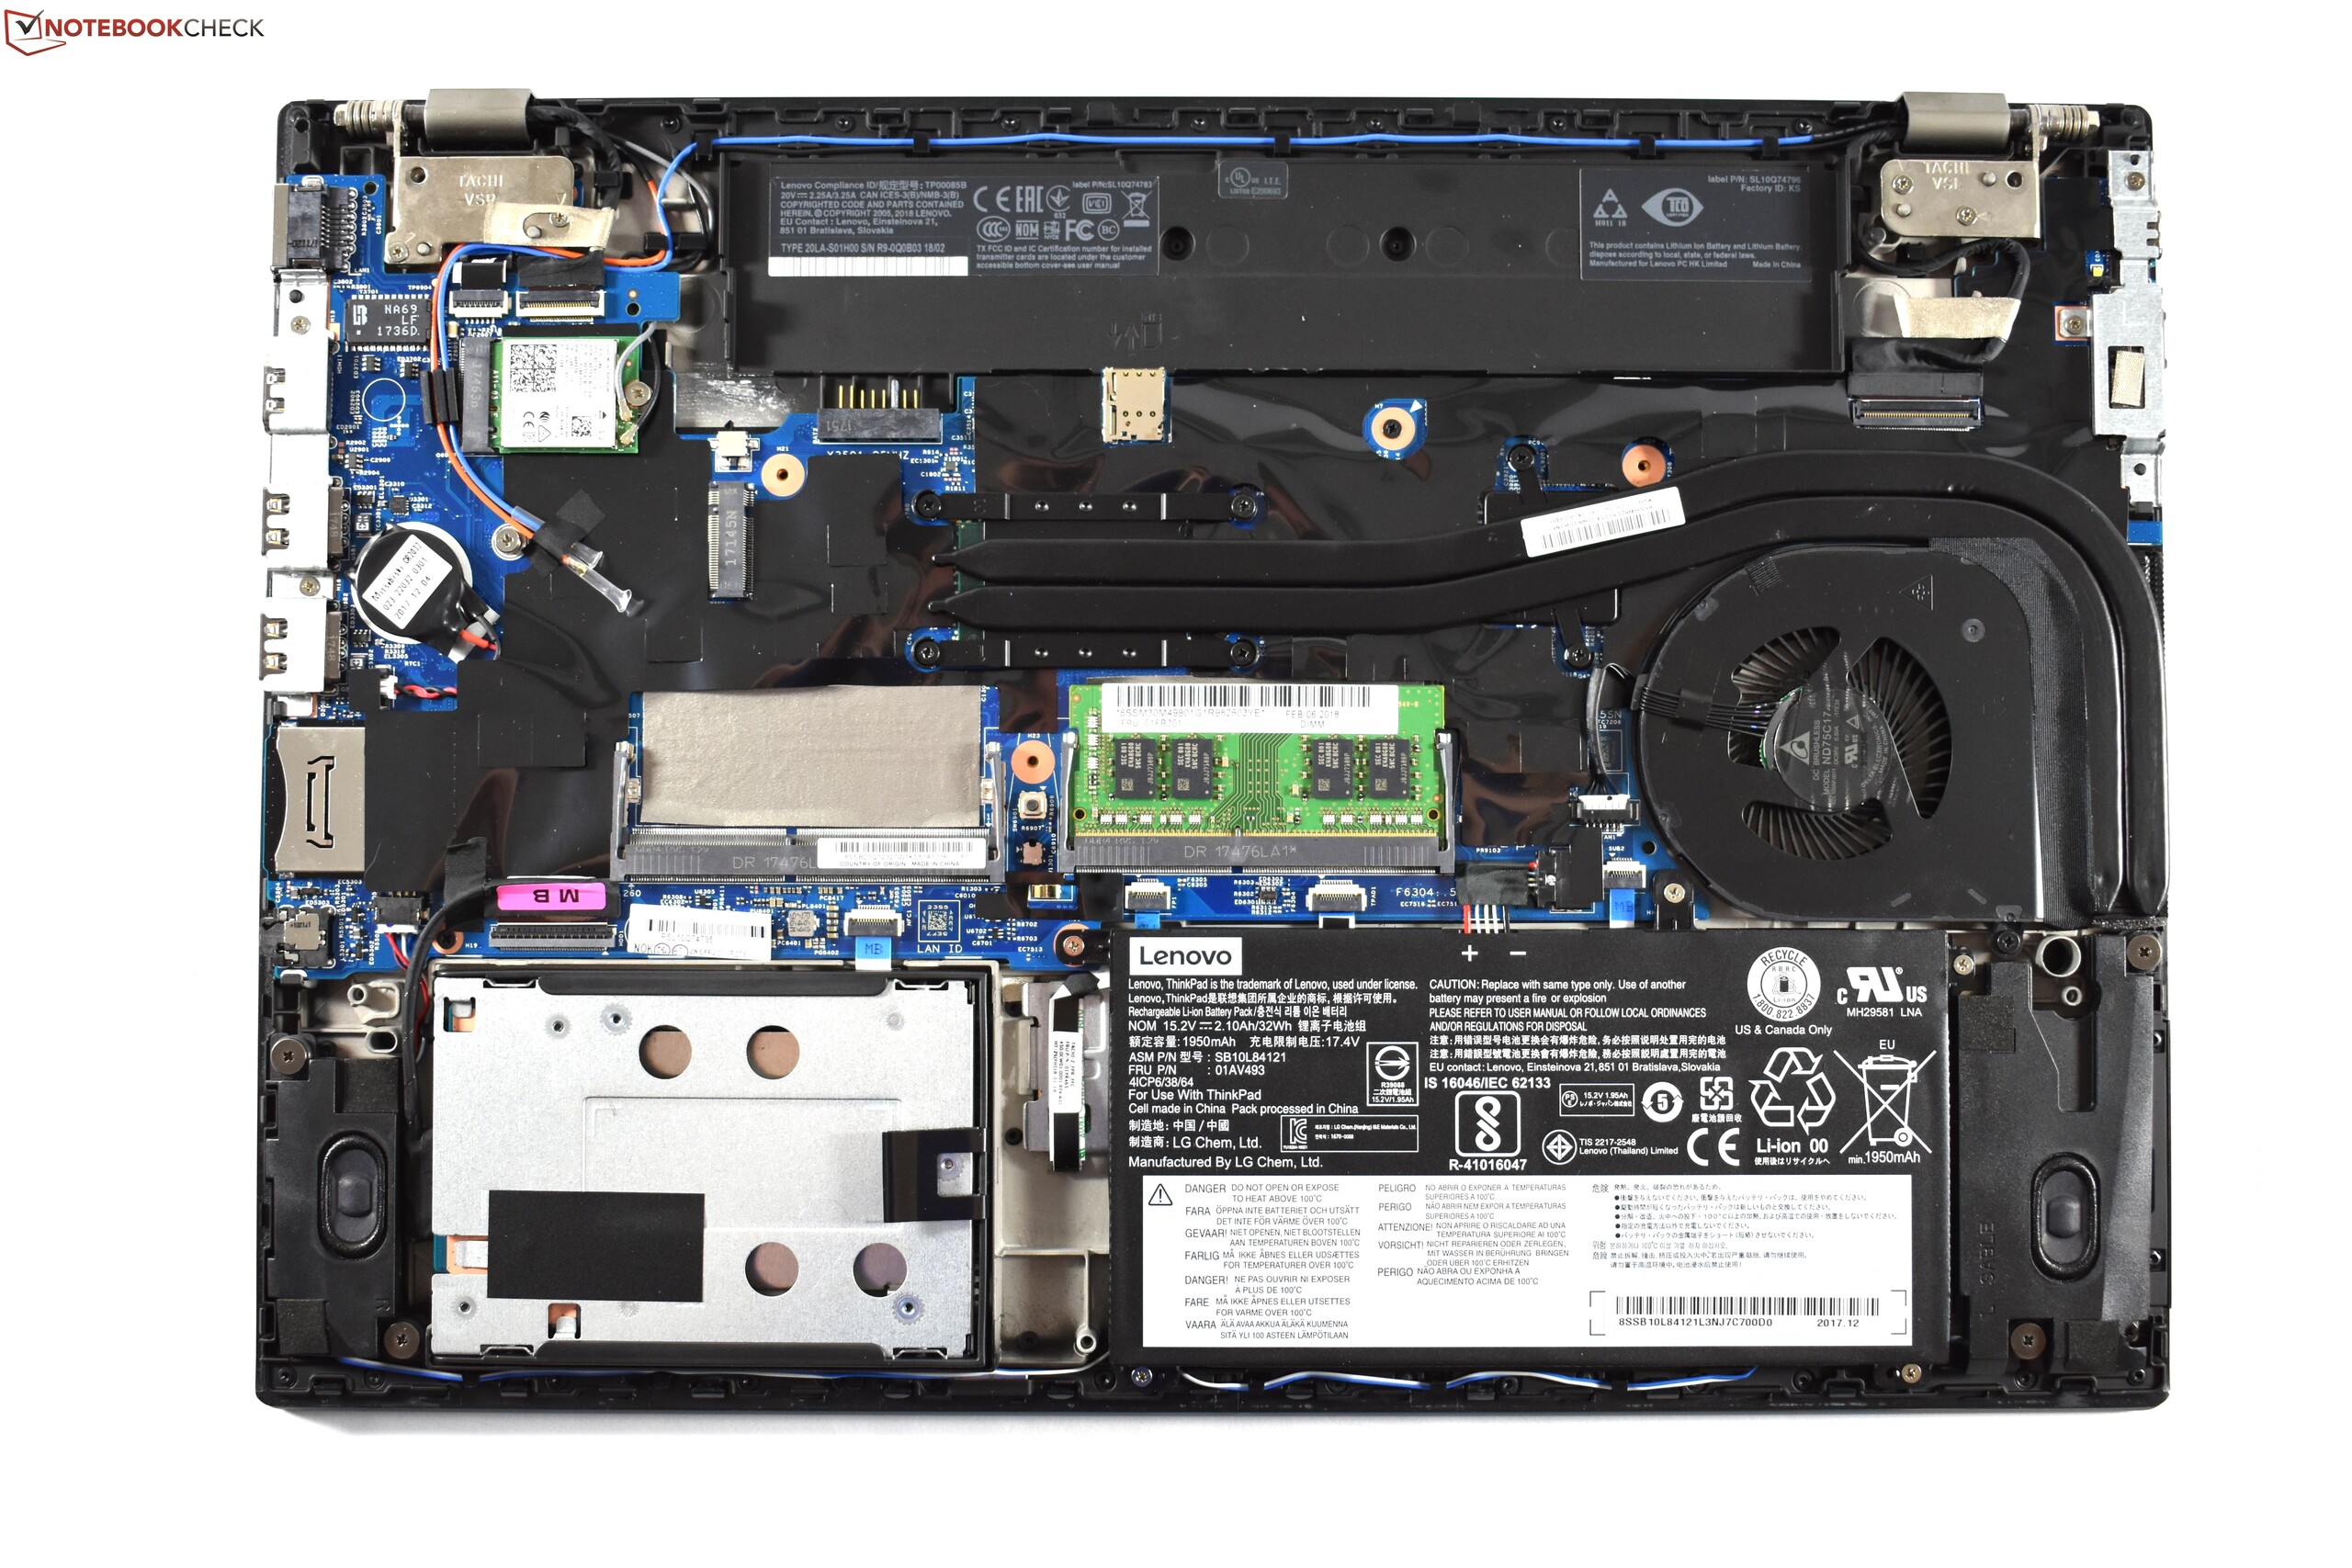
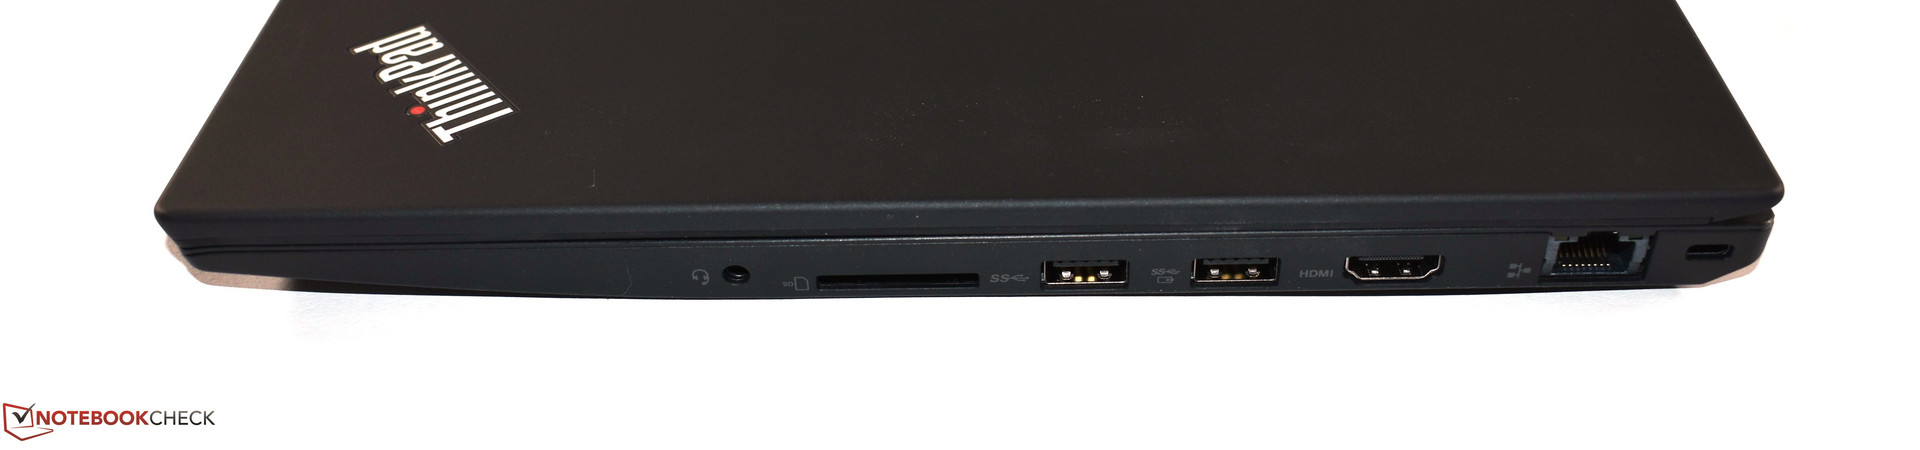
Os dispositivos de entrada falam muito bem do T580. Seus dispositivos de entrada são quase tão bons quanto do ThinkPad T480 e T480s. Além disso, o T580 também oferece um teclado numérico, que é muito útil para muitos usuários. A carcaça do T580, que não mudou muito quando comparado ao predecessor, parece um pouco mais “rústico” quando comparado a outros ThinkPads que possuem uma qualidade de construção muito boa. Além disso, o T580 é razoavelmente fácil de manter. Além disso, o ThinkPad T580 também oferece muitas portas, que foram ainda mais modernizadas com a remoção dos conectores proprietários. O T580 também apresenta um notável salto no desempenho quando comparado ao seu antecessor, em grande parte graças à sua CPU Intel Core i7-8550U com velocidade acima da média, bem como a versão não MaxQ da GeForce MX150 da Nvidia. Como um portátil corporativo de ponta, o T580 oferece um pacote de garantia abrangente e muitos recursos de segurança - entre esses recursos está a capa prática da câmera conhecida como ThinkShutter. O último aspecto positivo do T580 é o recurso Power Bridge, que permite que os usuários troquem a bateria externa sempre que precisarem. Isso oferece aos usuários uma medida adicional de flexibilidade.
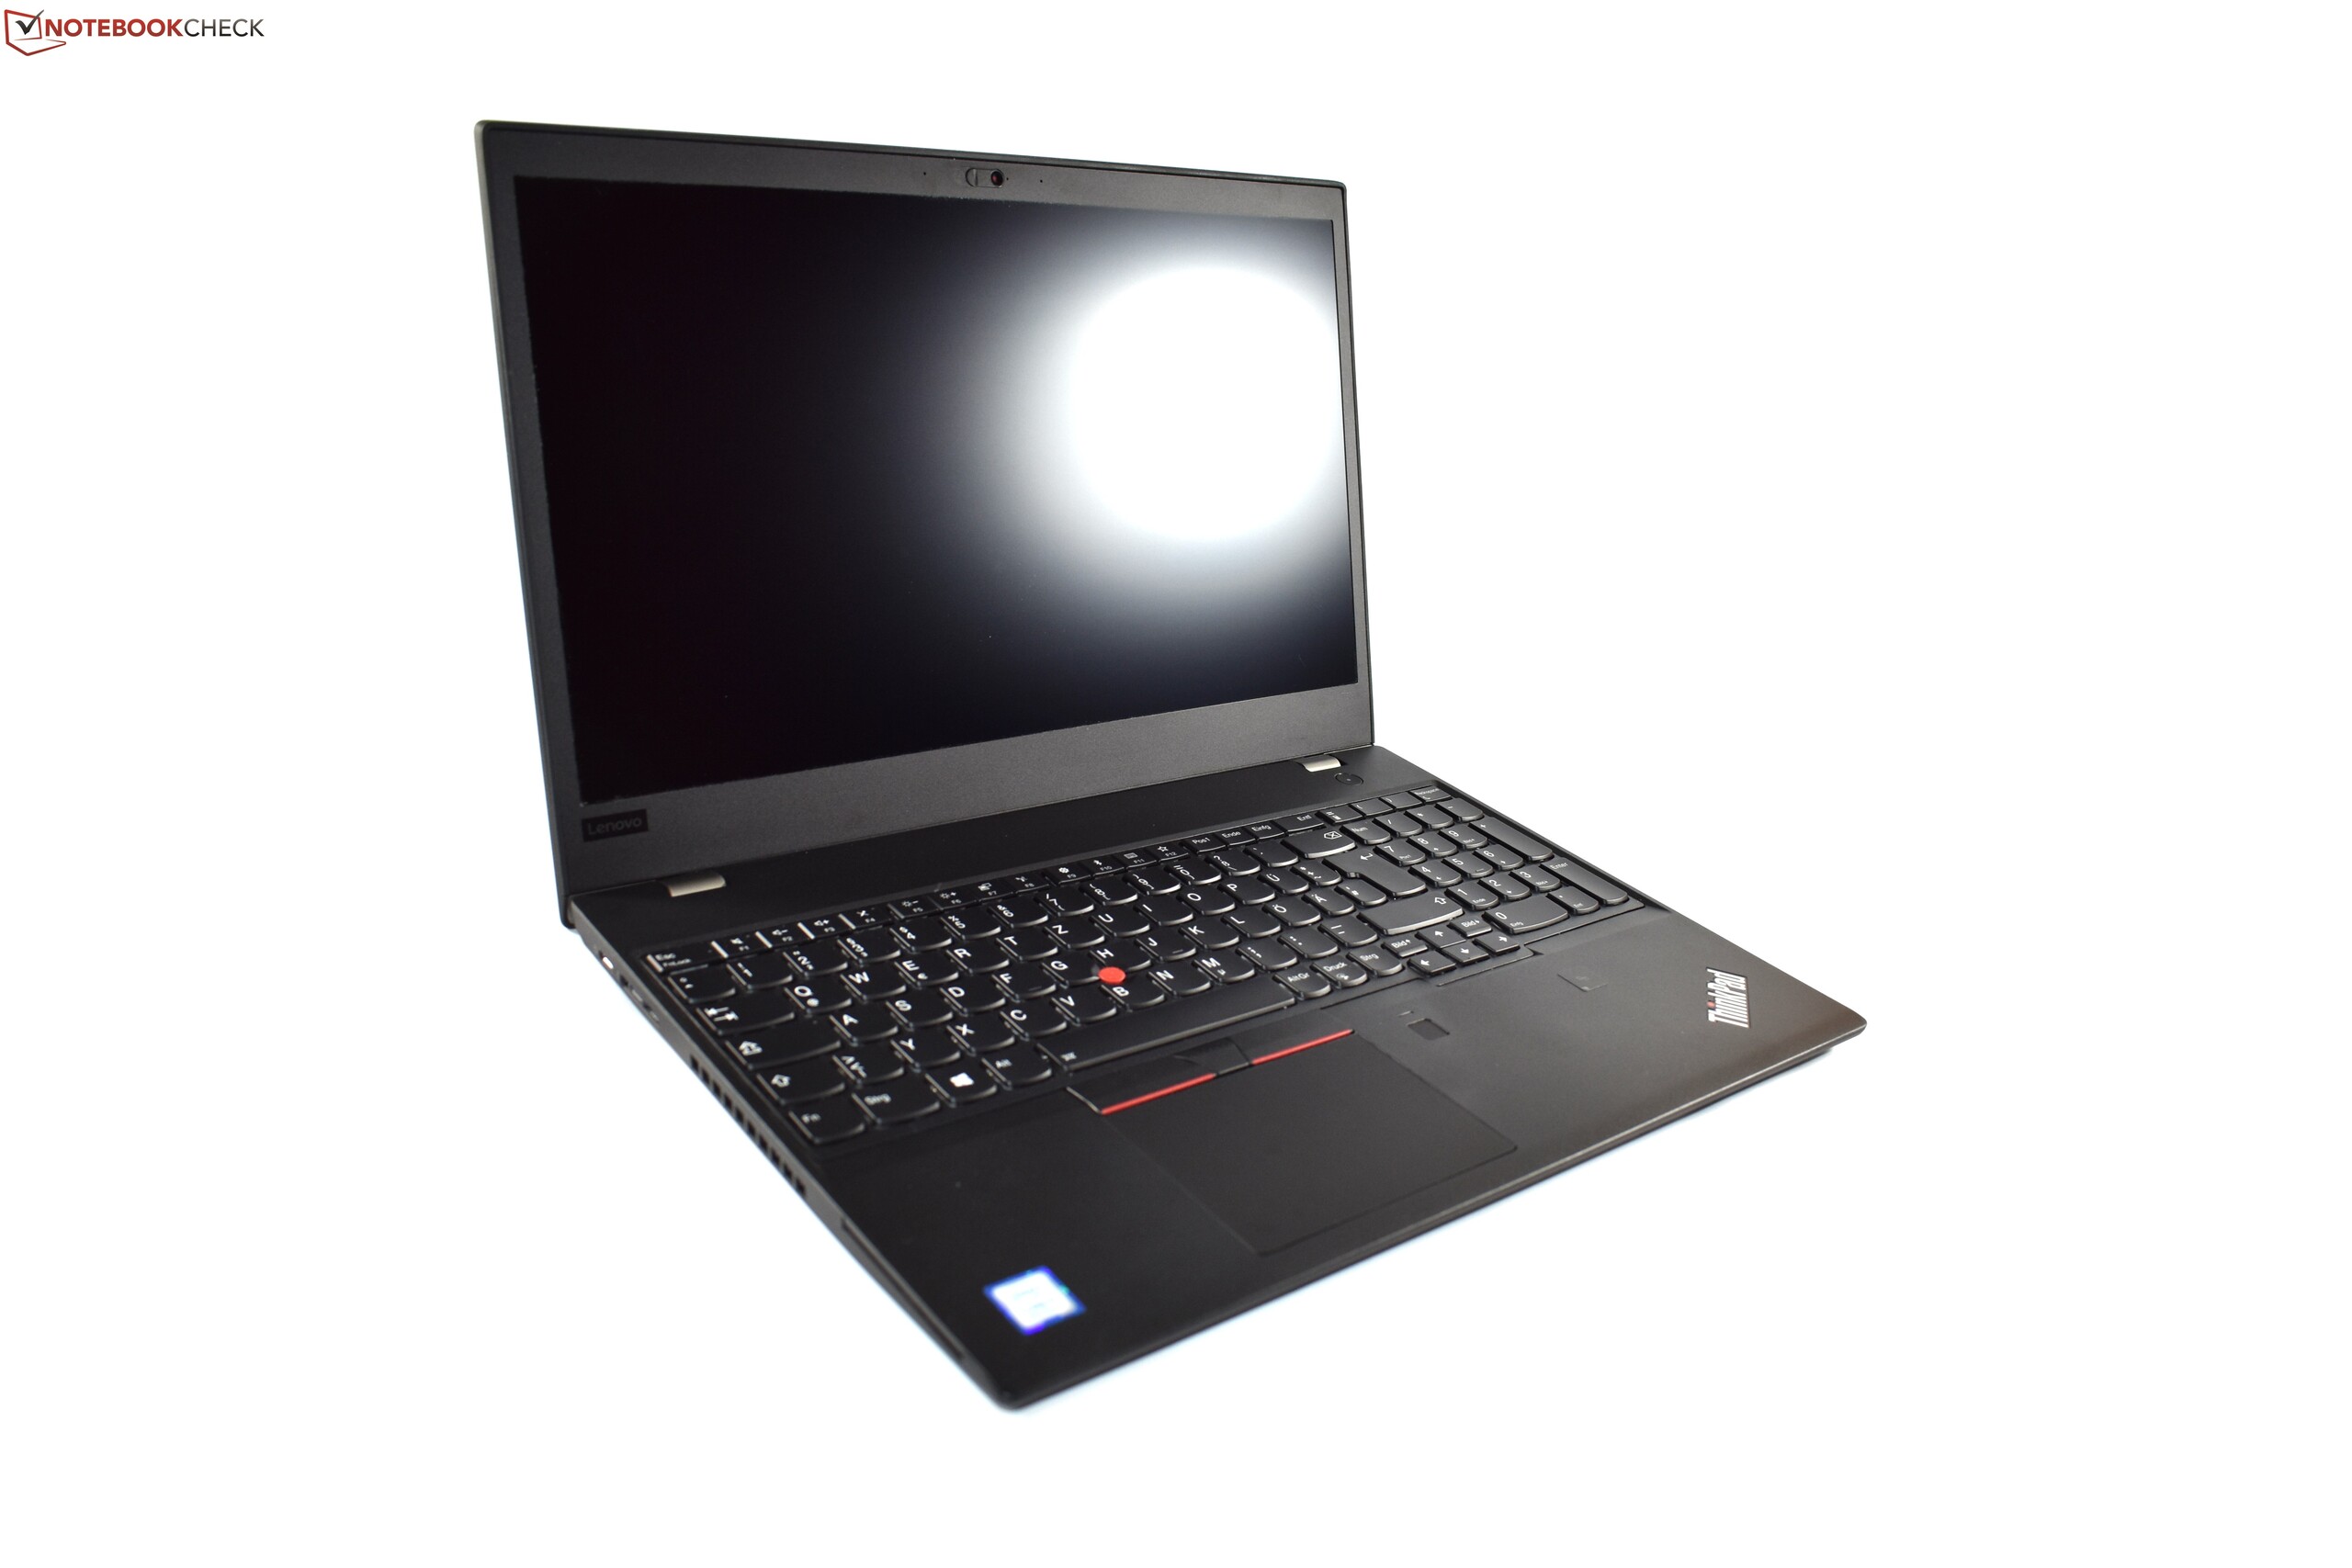
A lista de nossas críticas começa com a tela: Devido a que a Lenovo ainda depende de telas Full HD inferiores, a tela 4K representa a única opção de alta qualidade aqui. No entanto, a nosso ver, a tela do T580 não é boa o suficiente: O brilho é mediano e a cobertura do espaço de cor de 90% do sRGB também não é tão ruim assim. No entanto, não é 100%. A tela Ultra HD LCD no ThinkPad P51 demonstra que a Lenovo pode se air muito melhor. A tela UHD no novo EliteBook 850 G5 deve atingir um brilho médio de 400 cd/m². A Lenovo deve fazer algumas melhorias nesse departamento no próximo modelo de 15 polegadas da série ThinkPad T.
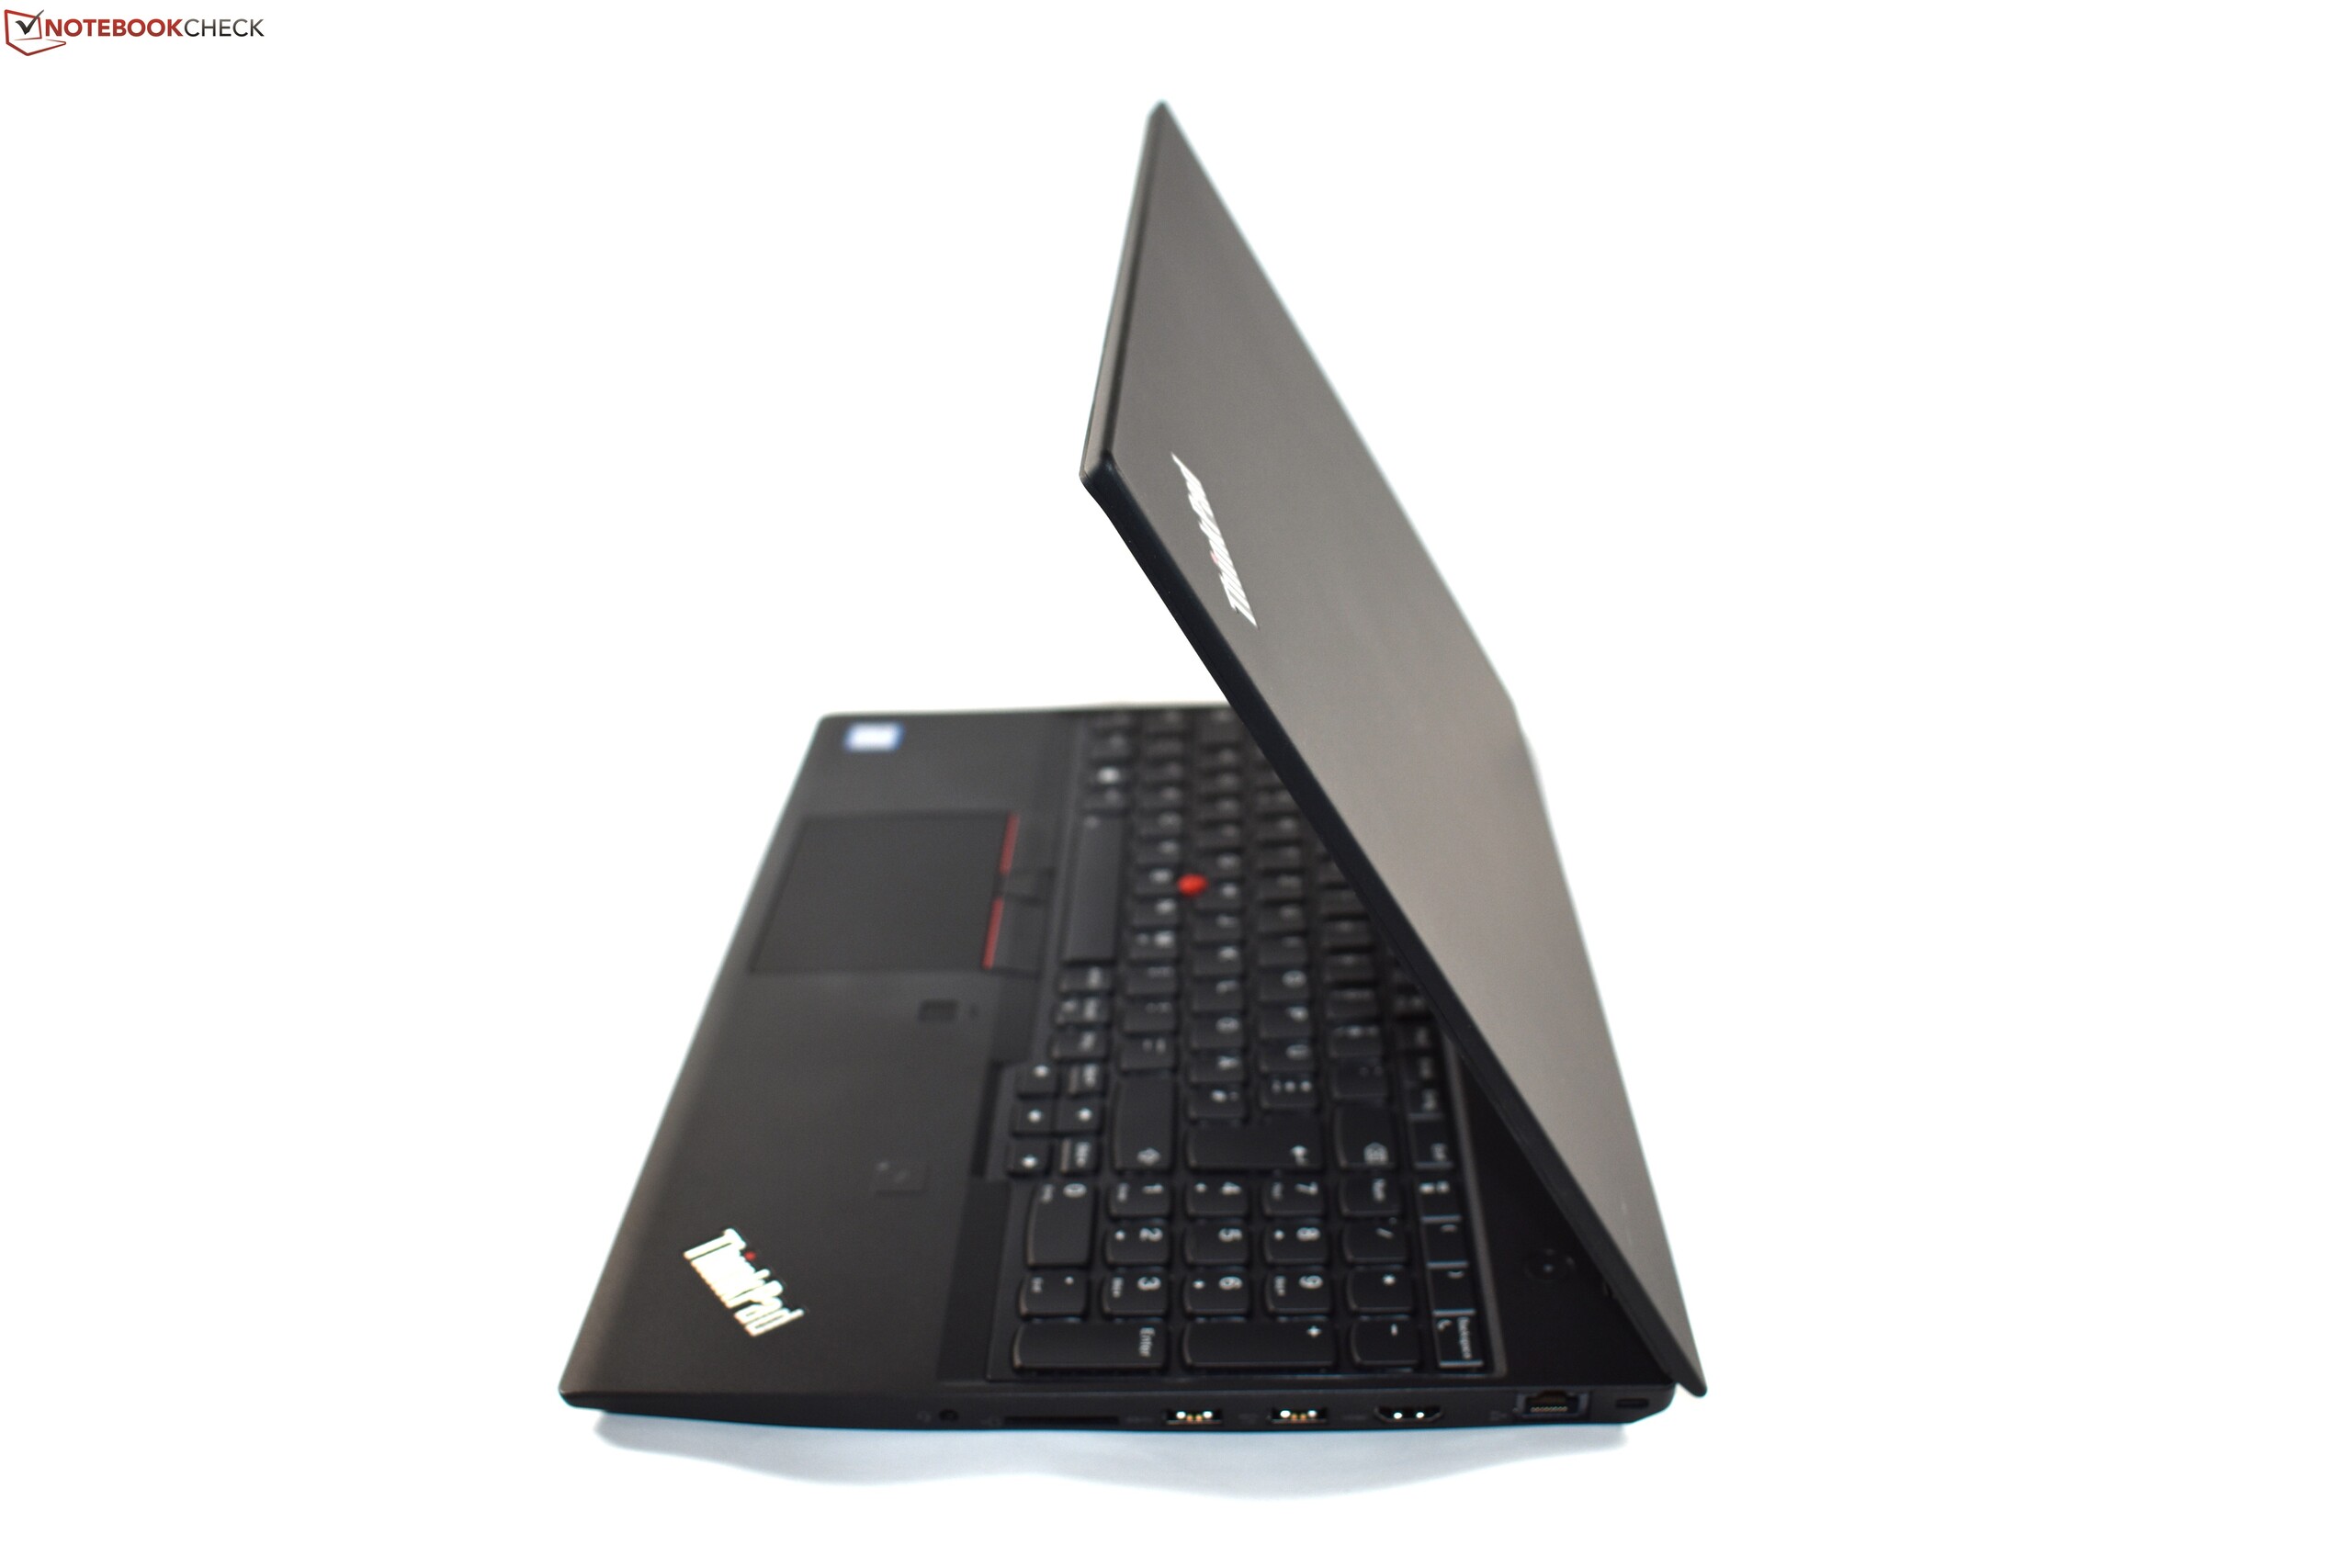
Temos algumas reclamações quando se trata do design, e não nos surpreende que a Lenovo tenha mantido o design praticamente igual ao modelo predecessor. Algumas de nossas reclamações incluem: O superaquecimento e a decepcionante duração da bateria: O T580 não pode atingir uma duração de até dez horas em nosso teste Wi-Fi com uma capacidade de bateria de 105 Wh - aqui a Lenovo deveria ter gasto mais tempo e esforço para otimizar o consumo de energia. O T580 simplesmente consome muita energia para um portátil de negócios. Também é bastante lamentável que o T580 emita um forte ruído da bobina. Por fim, o desempenho do SSD rápido em nosso dispositivo de teste é limitado desnecessariamente por uma conexão PCIe lenta.
No entanto, ainda damos ao T580 uma recomendação. Porém, não é tão bom quanto os modelos menores de 14 polegadas, como o T480 e o T480s.
Então o T580 recebe uma recomendação? Sim, a relação preço/desempenho no modelo “Campus Program” é impressionante. No entanto, para aqueles que não se qualificam para o Programa Campus da Lenovo, parece um pouco pior. O T580 não é um portátil ruim. No entanto, quando comparado a outros portáteis premium de 15 polegadas, como o Dell XPS 15, que em breve estará disponível com CPUs hexa-core, o T580 não parece fazer isso bem. O sistema Power Bridge pode ser visto como um motivo para comprar, o que, em teoria, permite uma duração ilimitada da bateria. No entanto, o alto consumo de energia enfraquece esse recurso em algum grau. O T580 é um bom portátil para usuários corporativos, especialmente se você decidir abrir mão da GeForce MX150, sem o qual o portátil funciona bastante mais frio e mais silencioso. No entanto, os modelos de 14 polegadas como o T480 e T480s serão uma melhor opção para os empresários, a não ser que você precise do teclado numérico e da tela de 15 polegadas. Claro que nesse caso o ThinkPad P51 será uma melhor opção para muito usuários.
Lenovo ThinkPad T580-20LAS01H00
- 07/25/2019 v6 (old)
Benjamin Herzig