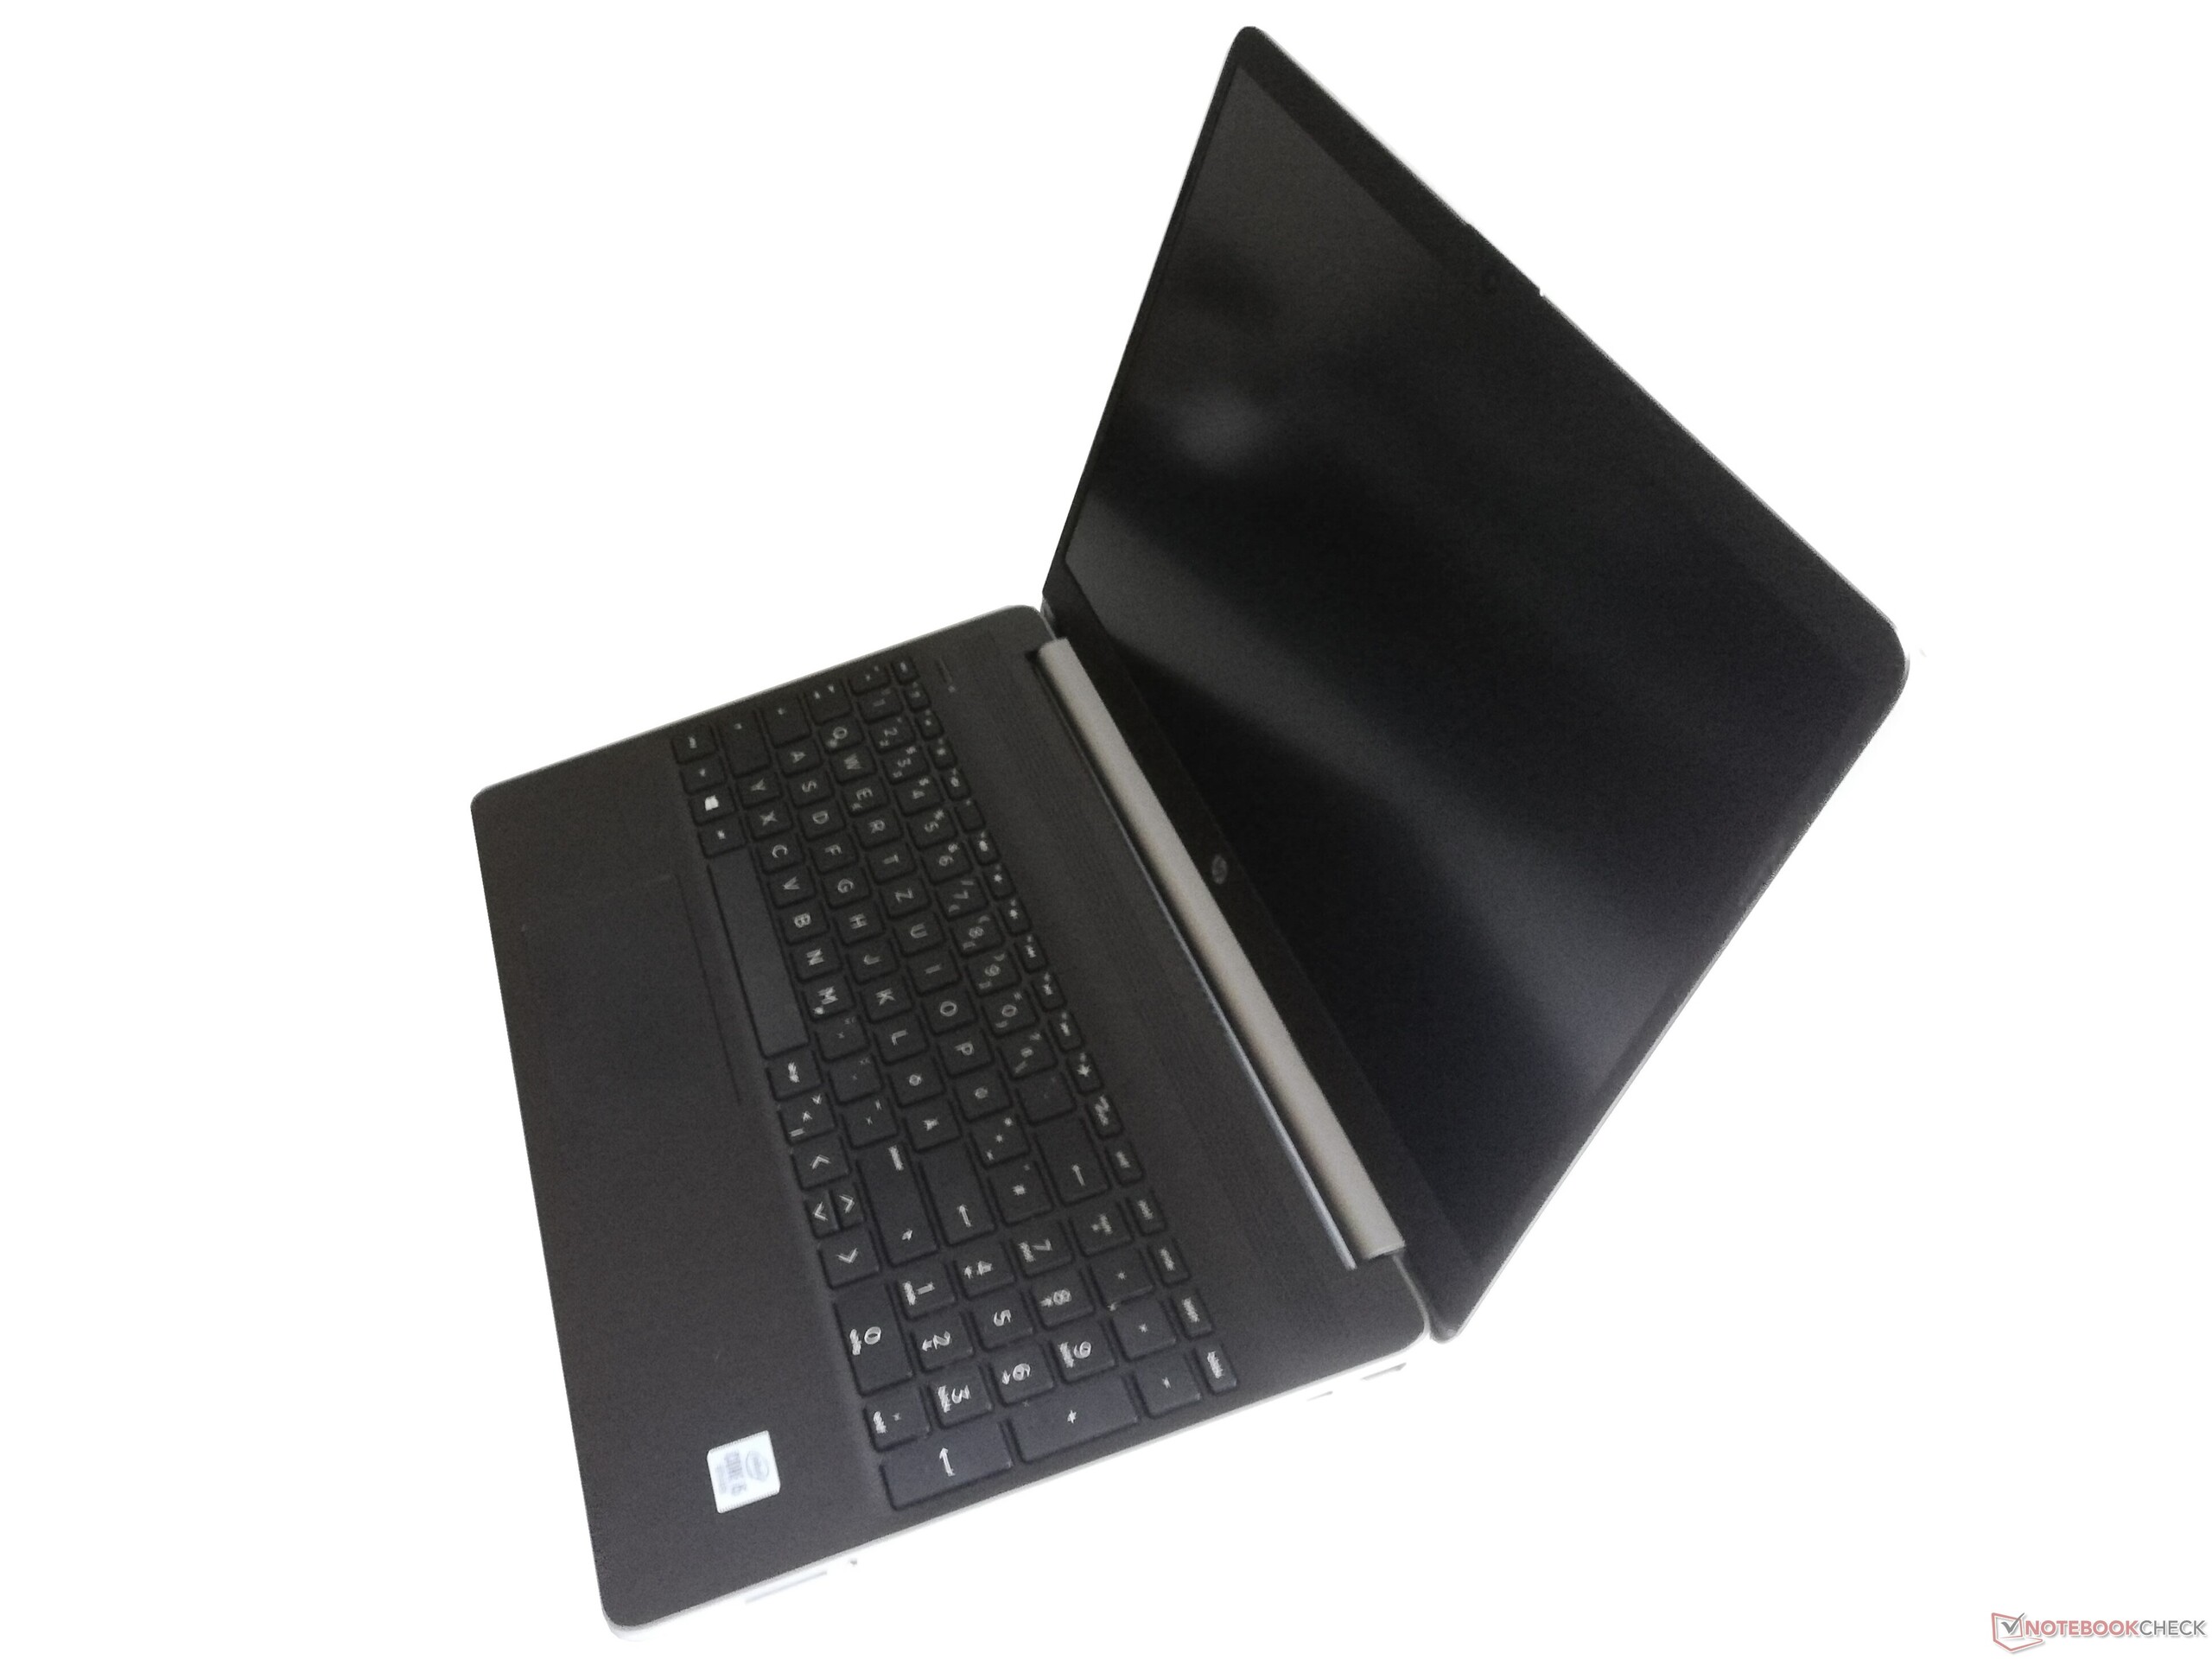
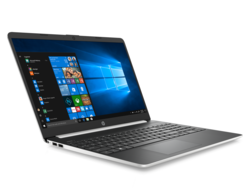
Breve Análise do Portátil HP Notebook 15s: Com CPU Ice Lake e Design Fino
Avaliação | Data | Modelo | Peso | Altura | Size | Resolução | Preço |
|---|---|---|---|---|---|---|---|
| 78.5 % v7 (old) | 02/2020 | HP 15s-fq1556ng i5-1035G1, UHD Graphics G1 (Ice Lake 32 EU) | 1.7 kg | 18 mm | 15.60" | 1920x1080 | |
| 88.4 % v6 (old) | 10/2024 | Lenovo ThinkPad E595-20NF0000GE R7 3700U, Vega 10 | 1.9 kg | 19.9 mm | 15.60" | 1920x1080 | |
| 82.9 % v7 (old) | 10/2019 | Dell Latitude 5500 i7-8665U, UHD Graphics 620 | 1.9 kg | 22 mm | 15.60" | 1920x1080 | |
| 78.4 % v7 (old) | 11/2019 | Acer Aspire 5 A515-43-R6WW R5 3500U, Vega 8 | 1.8 kg | 18 mm | 15.60" | 1920x1080 |
| Networking | |
| iperf3 transmit AX12 | |
| Dell Latitude 5500 | |
| Lenovo ThinkPad E595-20NF0000GE | |
| Acer Aspire 5 A515-43-R6WW | |
| HP 15s-fq1556ng | |
| iperf3 receive AX12 | |
| Lenovo ThinkPad E595-20NF0000GE | |
| Dell Latitude 5500 | |
| Acer Aspire 5 A515-43-R6WW | |
| HP 15s-fq1556ng | |
| |||||||||||||||||||||||||
iluminação: 86 %
iluminação com acumulador: 215 cd/m²
Contraste: 1411:1 (Preto: 0.18 cd/m²)
ΔE ColorChecker Calman: 5.58 | ∀{0.5-29.43 Ø4.72}
calibrated: 4.53
ΔE Greyscale Calman: 5.02 | ∀{0.09-98 Ø4.97}
56% sRGB (Argyll 1.6.3 3D)
36% AdobeRGB 1998 (Argyll 1.6.3 3D)
38.91% AdobeRGB 1998 (Argyll 3D)
56.4% sRGB (Argyll 3D)
37.66% Display P3 (Argyll 3D)
Gamma: 2.83
CCT: 6570 K
| HP 15s-fq1556ng AU Optronics B156HW02, IPS, 1920x1080, 15.6" | Lenovo ThinkPad E595-20NF0000GE NV156FHM-N49, IPS, 1920x1080, 15.6" | Dell Latitude 5500 LGD05FF 156WFD, IPS, 1920x1080, 15.6" | Acer Aspire 5 A515-43-R6WW CEC PANDA LM156LF-CL07, IPS, 1920x1080, 15.6" | |
|---|---|---|---|---|
| Display | 5% | 1% | 5% | |
| Display P3 Coverage (%) | 37.66 | 39.88 6% | 38.07 1% | 39.53 5% |
| sRGB Coverage (%) | 56.4 | 58.6 4% | 57.3 2% | 59.5 5% |
| AdobeRGB 1998 Coverage (%) | 38.91 | 41.2 6% | 39.33 1% | 40.84 5% |
| Response Times | 9% | 19% | 26% | |
| Response Time Grey 50% / Grey 80% * (ms) | 51 ? | 41.2 ? 19% | 37.6 ? 26% | 36 ? 29% |
| Response Time Black / White * (ms) | 32 ? | 32.8 ? -2% | 28.4 ? 11% | 25 ? 22% |
| PWM Frequency (Hz) | 1220 ? | 178 ? | ||
| Screen | 4% | -5% | -9% | |
| Brightness middle (cd/m²) | 254 | 318 25% | 234 -8% | 250 -2% |
| Brightness (cd/m²) | 234 | 297 27% | 229 -2% | 228 -3% |
| Brightness Distribution (%) | 86 | 89 3% | 93 8% | 83 -3% |
| Black Level * (cd/m²) | 0.18 | 0.17 6% | 0.23 -28% | 0.205 -14% |
| Contrast (:1) | 1411 | 1871 33% | 1017 -28% | 1220 -14% |
| Colorchecker dE 2000 * | 5.58 | 5.5 1% | 5.2 7% | 5.65 -1% |
| Colorchecker dE 2000 max. * | 9.83 | 21 -114% | 14.7 -50% | 13.7 -39% |
| Colorchecker dE 2000 calibrated * | 4.53 | 5.1 -13% | 4.6 -2% | |
| Greyscale dE 2000 * | 5.02 | 1.8 64% | 2.5 50% | 6.32 -26% |
| Gamma | 2.83 78% | 2.12 104% | 2.44 90% | 2.45 90% |
| CCT | 6570 99% | 6257 104% | 6649 98% | 7287 89% |
| Color Space (Percent of AdobeRGB 1998) (%) | 36 | 37.6 4% | 36.2 1% | 38 6% |
| Color Space (Percent of sRGB) (%) | 56 | 58.2 4% | 57 2% | 59 5% |
| Média Total (Programa/Configurações) | 6% /
5% | 5% /
-1% | 7% /
-2% |
* ... menor é melhor
Exibir tempos de resposta
| ↔ Tempo de resposta preto para branco | ||
|---|---|---|
| 32 ms ... ascensão ↗ e queda ↘ combinadas | ↗ 18 ms ascensão | 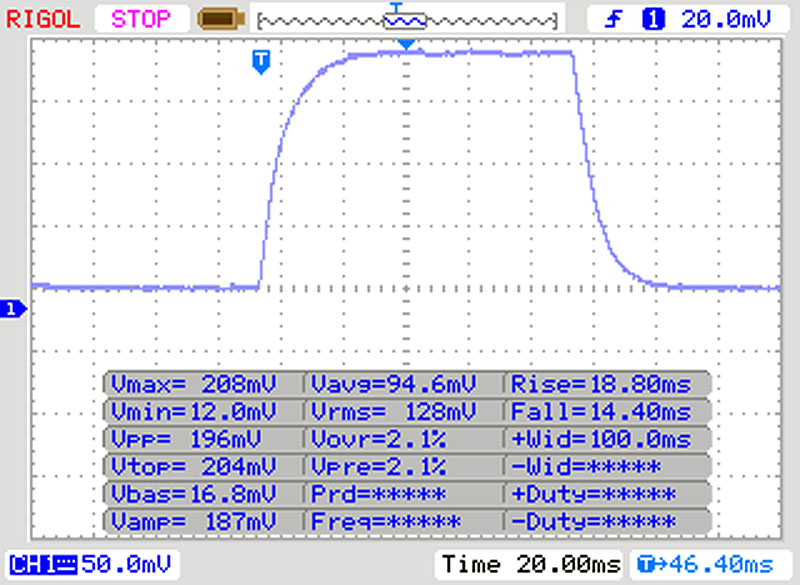 |
| ↘ 14 ms queda | ||
| A tela mostra taxas de resposta lentas em nossos testes e será insatisfatória para os jogadores. Em comparação, todos os dispositivos testados variam de 0.1 (mínimo) a 240 (máximo) ms. » 86 % de todos os dispositivos são melhores. Isso significa que o tempo de resposta medido é pior que a média de todos os dispositivos testados (19.8 ms). | ||
| ↔ Tempo de resposta 50% cinza a 80% cinza | ||
| 51 ms ... ascensão ↗ e queda ↘ combinadas | ↗ 25 ms ascensão | 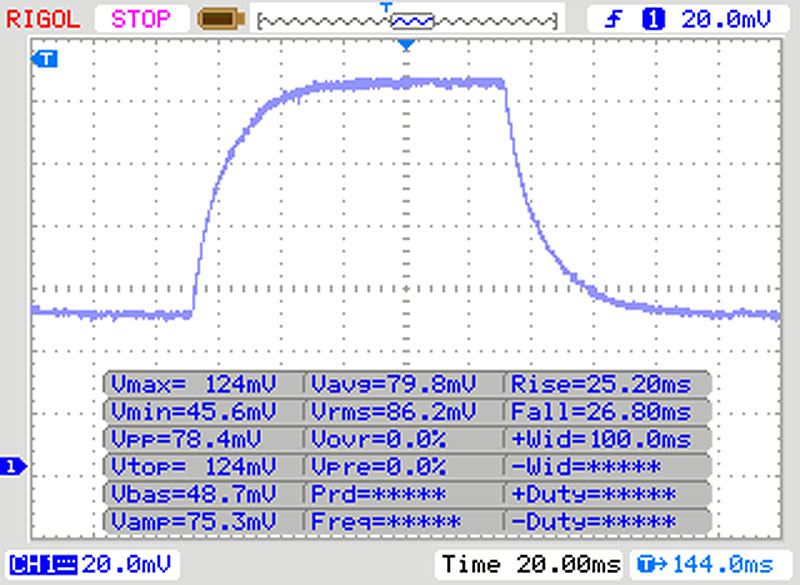 |
| ↘ 26 ms queda | ||
| A tela mostra taxas de resposta lentas em nossos testes e será insatisfatória para os jogadores. Em comparação, todos os dispositivos testados variam de 0.165 (mínimo) a 636 (máximo) ms. » 87 % de todos os dispositivos são melhores. Isso significa que o tempo de resposta medido é pior que a média de todos os dispositivos testados (31 ms). | ||
Cintilação da tela / PWM (modulação por largura de pulso)
| Tela tremeluzindo / PWM não detectado | 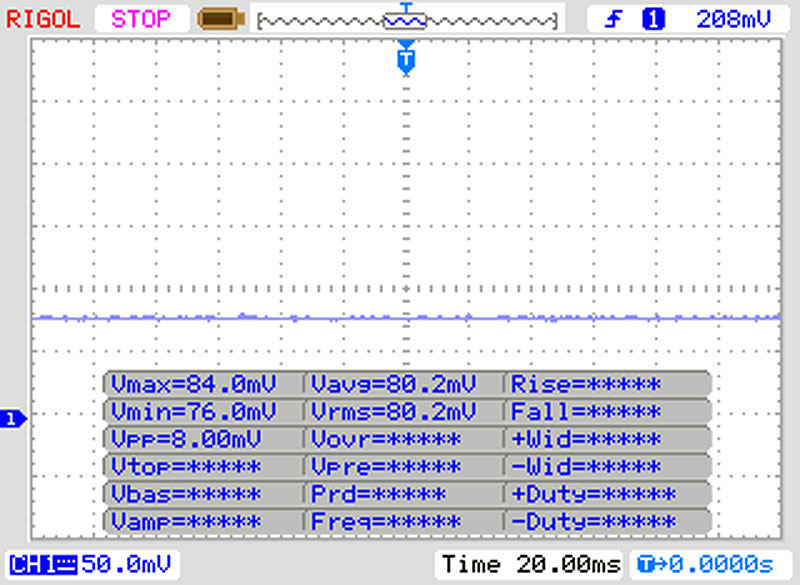 | ||
[pwm_comparison] Em comparação: 52 % de todos os dispositivos testados não usam PWM para escurecer a tela. Se PWM foi detectado, uma média de 7763 (mínimo: 5 - máximo: 343500) Hz foi medida. | |||
| PCMark 8 Home Score Accelerated v2 | 3673 pontos | |
| PCMark 8 Work Score Accelerated v2 | 5035 pontos | |
| PCMark 10 Score | 3992 pontos | |
Ajuda | ||
| HP 15s-fq1556ng Intel SSD 660p SSDPEKNW512G8 | Lenovo ThinkPad E595-20NF0000GE SK Hynix BC501 HFM512GDJTNG | Dell Latitude 5500 Toshiba XG6 KXG60ZNV1T02 | Acer Aspire 5 A515-43-R6WW Intel SSD 660p 1TB SSDPEKNW010T8 | Média Intel SSD 660p SSDPEKNW512G8 | |
|---|---|---|---|---|---|
| CrystalDiskMark 5.2 / 6 | -21% | 22% | -9% | -12% | |
| Write 4K (MB/s) | 203.1 | 129.5 -36% | 149 -27% | 114.9 -43% | 136 ? -33% |
| Read 4K (MB/s) | 65.3 | 41.23 -37% | 48.26 -26% | 52.7 -19% | 55.2 ? -15% |
| Write Seq (MB/s) | 973 | 811 -17% | 1772 82% | 1361 40% | 926 ? -5% |
| Read Seq (MB/s) | 1651 | 1145 -31% | 1200 -27% | 1385 -16% | 1523 ? -8% |
| Write 4K Q32T1 (MB/s) | 526 | 314.1 -40% | 414.5 -21% | 181.1 -66% | 380 ? -28% |
| Read 4K Q32T1 (MB/s) | 345.2 | 356.2 3% | 393 14% | 340.5 -1% | 334 ? -3% |
| Write Seq Q32T1 (MB/s) | 980 | 839 -14% | 2941 200% | 1519 55% | 987 ? 1% |
| Read Seq Q32T1 (MB/s) | 1883 | 2042 8% | 1510 -20% | 1515 -20% | 1744 ? -7% |
| AS SSD | 13% | 58% | 3% | -20% | |
| Seq Read (MB/s) | 1705 | 1698 0% | 1287 -25% | 1358 -20% | 1423 ? -17% |
| Seq Write (MB/s) | 904 | 740 -18% | 1280 42% | 1300 44% | 828 ? -8% |
| 4K Read (MB/s) | 58.5 | 39.18 -33% | 49.57 -15% | 44.88 -23% | 51.3 ? -12% |
| 4K Write (MB/s) | 165.4 | 87.7 -47% | 158 -4% | 77.5 -53% | 128.9 ? -22% |
| 4K-64 Read (MB/s) | 323.1 | 764 136% | 1043 223% | 586 81% | 326 ? 1% |
| 4K-64 Write (MB/s) | 827 | 669 -19% | 1415 71% | 738 -11% | 721 ? -13% |
| Access Time Read * (ms) | 0.056 | 0.04 29% | 0.039 30% | 0.09003 ? -61% | |
| Access Time Write * (ms) | 0.044 | 0.036 18% | 0.027 39% | 0.057 -30% | 0.07378 ? -68% |
| Score Read (Points) | 522 | 973 86% | 1221 134% | 767 47% | 519 ? -1% |
| Score Write (Points) | 1083 | 831 -23% | 1701 57% | 945 -13% | 932 ? -14% |
| Score Total (Points) | 1901 | 2261 19% | 3558 87% | 2115 11% | 1708 ? -10% |
| Média Total (Programa/Configurações) | -4% /
-1% | 40% /
43% | -3% /
-2% | -16% /
-17% |
* ... menor é melhor

| 3DMark 11 Performance | 2784 pontos | |
| 3DMark Cloud Gate Standard Score | pontos | |
Ajuda | ||
| Final Fantasy XV Benchmark | |
| 1280x720 Lite Quality | |
| Média da turma Office (16.5 - 171.2, n=70, últimos 2 anos) | |
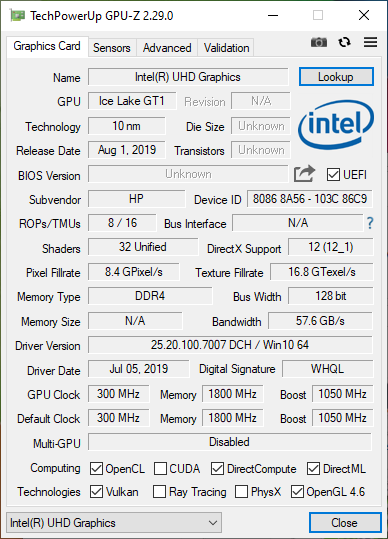
| Média Intel UHD Graphics G1 (Ice Lake 32 EU) (13 - 16.8, n=8) | |
| HP 15s-fq1556ng | |
| 1920x1080 Standard Quality | |
| Média da turma Office (7.86 - 105.7, n=70, últimos 2 anos) | |
| Média Intel UHD Graphics G1 (Ice Lake 32 EU) (6.8 - 8.32, n=6) | |
| HP 15s-fq1556ng | |
| baixo | média | alto | ultra | |
|---|---|---|---|---|
| BioShock Infinite (2013) | 71.9 | 37.2 | 32.21 | 11.58 |
| Dota 2 Reborn (2015) | 57.7 | 40.9 | 21.8 | 19.9 |
| Final Fantasy XV Benchmark (2018) | 12.99 | 6.85 |
Barulho
| Ocioso |
| 30.3 / 30.3 / 30.3 dB |
| Carga |
| 34 / 41.3 dB |
 | ||
30 dB silencioso 40 dB(A) audível 50 dB(A) ruidosamente alto |
||
min: | ||
(+) A temperatura máxima no lado superior é 35.2 °C / 95 F, em comparação com a média de 34.3 °C / 94 F , variando de 21.2 a 62.5 °C para a classe Office.
(+) A parte inferior aquece até um máximo de 37.2 °C / 99 F, em comparação com a média de 36.8 °C / 98 F
(+) Em uso inativo, a temperatura média para o lado superior é 23.3 °C / 74 F, em comparação com a média do dispositivo de 29.5 °C / ### class_avg_f### F.
(+) Os apoios para as mãos e o touchpad são mais frios que a temperatura da pele, com um máximo de 25.9 °C / 78.6 F e, portanto, são frios ao toque.
(±) A temperatura média da área do apoio para as mãos de dispositivos semelhantes foi 27.5 °C / 81.5 F (+1.6 °C / 2.9 F).
HP 15s-fq1556ng análise de áudio
(-) | alto-falantes não muito altos (###valor### dB)
Graves 100 - 315Hz
(-) | quase nenhum baixo - em média 19.3% menor que a mediana
(±) | a linearidade dos graves é média (10.8% delta para a frequência anterior)
Médios 400 - 2.000 Hz
(+) | médios equilibrados - apenas 2.7% longe da mediana
(±) | a linearidade dos médios é média (7.1% delta para frequência anterior)
Altos 2 - 16 kHz
(+) | agudos equilibrados - apenas 2.7% longe da mediana
(+) | os máximos são lineares (5.5% delta da frequência anterior)
Geral 100 - 16.000 Hz
(±) | a linearidade do som geral é média (18.2% diferença em relação à mediana)
Comparado com a mesma classe
» 32% de todos os dispositivos testados nesta classe foram melhores, 7% semelhantes, 62% piores
» O melhor teve um delta de 7%, a média foi 21%, o pior foi 53%
Comparado com todos os dispositivos testados
» 39% de todos os dispositivos testados foram melhores, 8% semelhantes, 53% piores
» O melhor teve um delta de 4%, a média foi 23%, o pior foi 134%
Apple MacBook 12 (Early 2016) 1.1 GHz análise de áudio
(+) | os alto-falantes podem tocar relativamente alto (###valor### dB)
Graves 100 - 315Hz
(±) | graves reduzidos - em média 11.3% menor que a mediana
(±) | a linearidade dos graves é média (14.2% delta para a frequência anterior)
Médios 400 - 2.000 Hz
(+) | médios equilibrados - apenas 2.4% longe da mediana
(+) | médios são lineares (5.5% delta para frequência anterior)
Altos 2 - 16 kHz
(+) | agudos equilibrados - apenas 2% longe da mediana
(+) | os máximos são lineares (4.5% delta da frequência anterior)
Geral 100 - 16.000 Hz
(+) | o som geral é linear (10.2% diferença em relação à mediana)
Comparado com a mesma classe
» 7% de todos os dispositivos testados nesta classe foram melhores, 2% semelhantes, 91% piores
» O melhor teve um delta de 5%, a média foi 18%, o pior foi 53%
Comparado com todos os dispositivos testados
» 5% de todos os dispositivos testados foram melhores, 1% semelhantes, 94% piores
» O melhor teve um delta de 4%, a média foi 23%, o pior foi 134%
| desligado | |
| Ocioso | |
| Carga |
|
Key:
min: | |
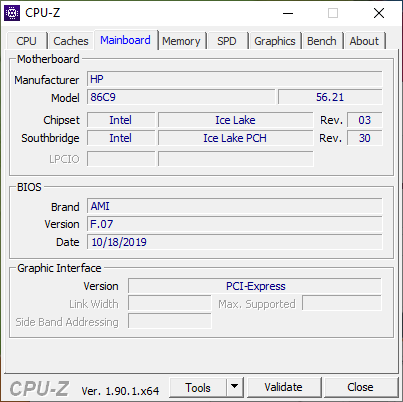
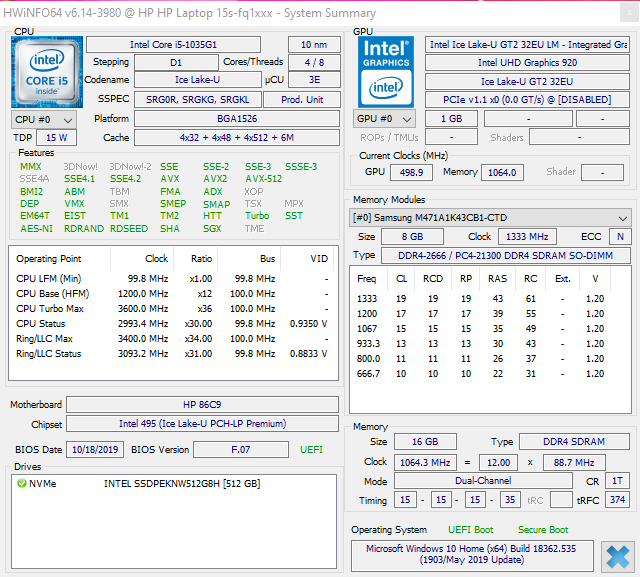
| HP 15s-fq1556ng i5-1035G1, UHD Graphics G1 (Ice Lake 32 EU), Intel SSD 660p SSDPEKNW512G8, IPS, 1920x1080, 15.6" | Lenovo ThinkPad E595-20NF0000GE R7 3700U, Vega 10, SK Hynix BC501 HFM512GDJTNG, IPS, 1920x1080, 15.6" | Dell Latitude 5500 i7-8665U, UHD Graphics 620, Toshiba XG6 KXG60ZNV1T02, IPS, 1920x1080, 15.6" | Acer Aspire 5 A515-43-R6WW R5 3500U, Vega 8, Intel SSD 660p 1TB SSDPEKNW010T8, IPS, 1920x1080, 15.6" | Média Intel UHD Graphics G1 (Ice Lake 32 EU) | Média da turma Office | |
|---|---|---|---|---|---|---|
| Power Consumption | -13% | -31% | -7% | -13% | -33% | |
| Idle Minimum * (Watt) | 3.3 | 4.2 -27% | 4.4 -33% | 3.7 -12% | 4.13 ? -25% | 4.39 ? -33% |
| Idle Average * (Watt) | 6.4 | 7.92 -24% | 6.9 -8% | 6.2 3% | 7.07 ? -10% | 7.38 ? -15% |
| Idle Maximum * (Watt) | 6.8 | 8.16 -20% | 7.7 -13% | 8.4 -24% | 8.36 ? -23% | 8.63 ? -27% |
| Load Average * (Watt) | 29 | 29 -0% | 43.6 -50% | 31.1 -7% | 30.6 ? -6% | 43.6 ? -50% |
| Load Maximum * (Watt) | 46 | 42.2 8% | 69.1 -50% | 43.1 6% | 45.6 ? 1% | 64.5 ? -40% |
* ... menor é melhor
| HP 15s-fq1556ng i5-1035G1, UHD Graphics G1 (Ice Lake 32 EU), 41 Wh | Lenovo ThinkPad E595-20NF0000GE R7 3700U, Vega 10, 45 Wh | Dell Latitude 5500 i7-8665U, UHD Graphics 620, 68 Wh | Acer Aspire 5 A515-43-R6WW R5 3500U, Vega 8, 48 Wh | Média da turma Office | |
|---|---|---|---|---|---|
| Duração da bateria | 12% | 105% | 31% | 67% | |
| Reader / Idle (h) | 13.1 | 15.7 20% | 17.7 35% | 23.7 ? 81% | |
| WiFi v1.3 (h) | 6 | 7.7 28% | 12.3 105% | 7.8 30% | 12.9 ? 115% |
| Load (h) | 1.7 | 1.5 -12% | 2.2 29% | 1.795 ? 6% |
Pro
Contra
Veredicto - Um portátil com potencial para a otimização
Na variante com o equipamento que testamos, o HP 15s é adequado para usuários cujas demandas não são altas. O sistema faz o que deve ser feito, e os aplicativos habituais de escritório, navegar na Internet e o consumo de conteúdo de mídia não apresentam nenhum problema. Gostamos do design e o acabamento também é sólido. Uma duração de bateria de quase seis horas também deve satisfazer a maioria dos usuários.
Embora o HP 15s possa satisfazer a maioria dos usuários, aqueles que desejam usar um sistema ideal precisarão fazer alguns compromissos.
Somente quando você olha um pouco mais de perto, algumas fraquezas se tornam aparentes. Elas não são de forma alguma graves, mas podem levar a algumas sacudidas de cabeças além do mercado consumidor. Ainda podemos aceitar que o HP 15s não pode ser atualizado. No entanto, o estranho comportamento do ventilador, que até tem um efeito negativo no perfil de potência "Melhor desempenho", tem um calibre diferente. Para obter um melhor uso da CPU, os usuários precisam modificar ativamente o controle do ventilador. Mas se eles fizerem isso, o nível de ruído também aumentará fortemente.
HP 15s-fq1556ng
- 02/10/2020 v7 (old)
Mike Wobker
Price comparison
