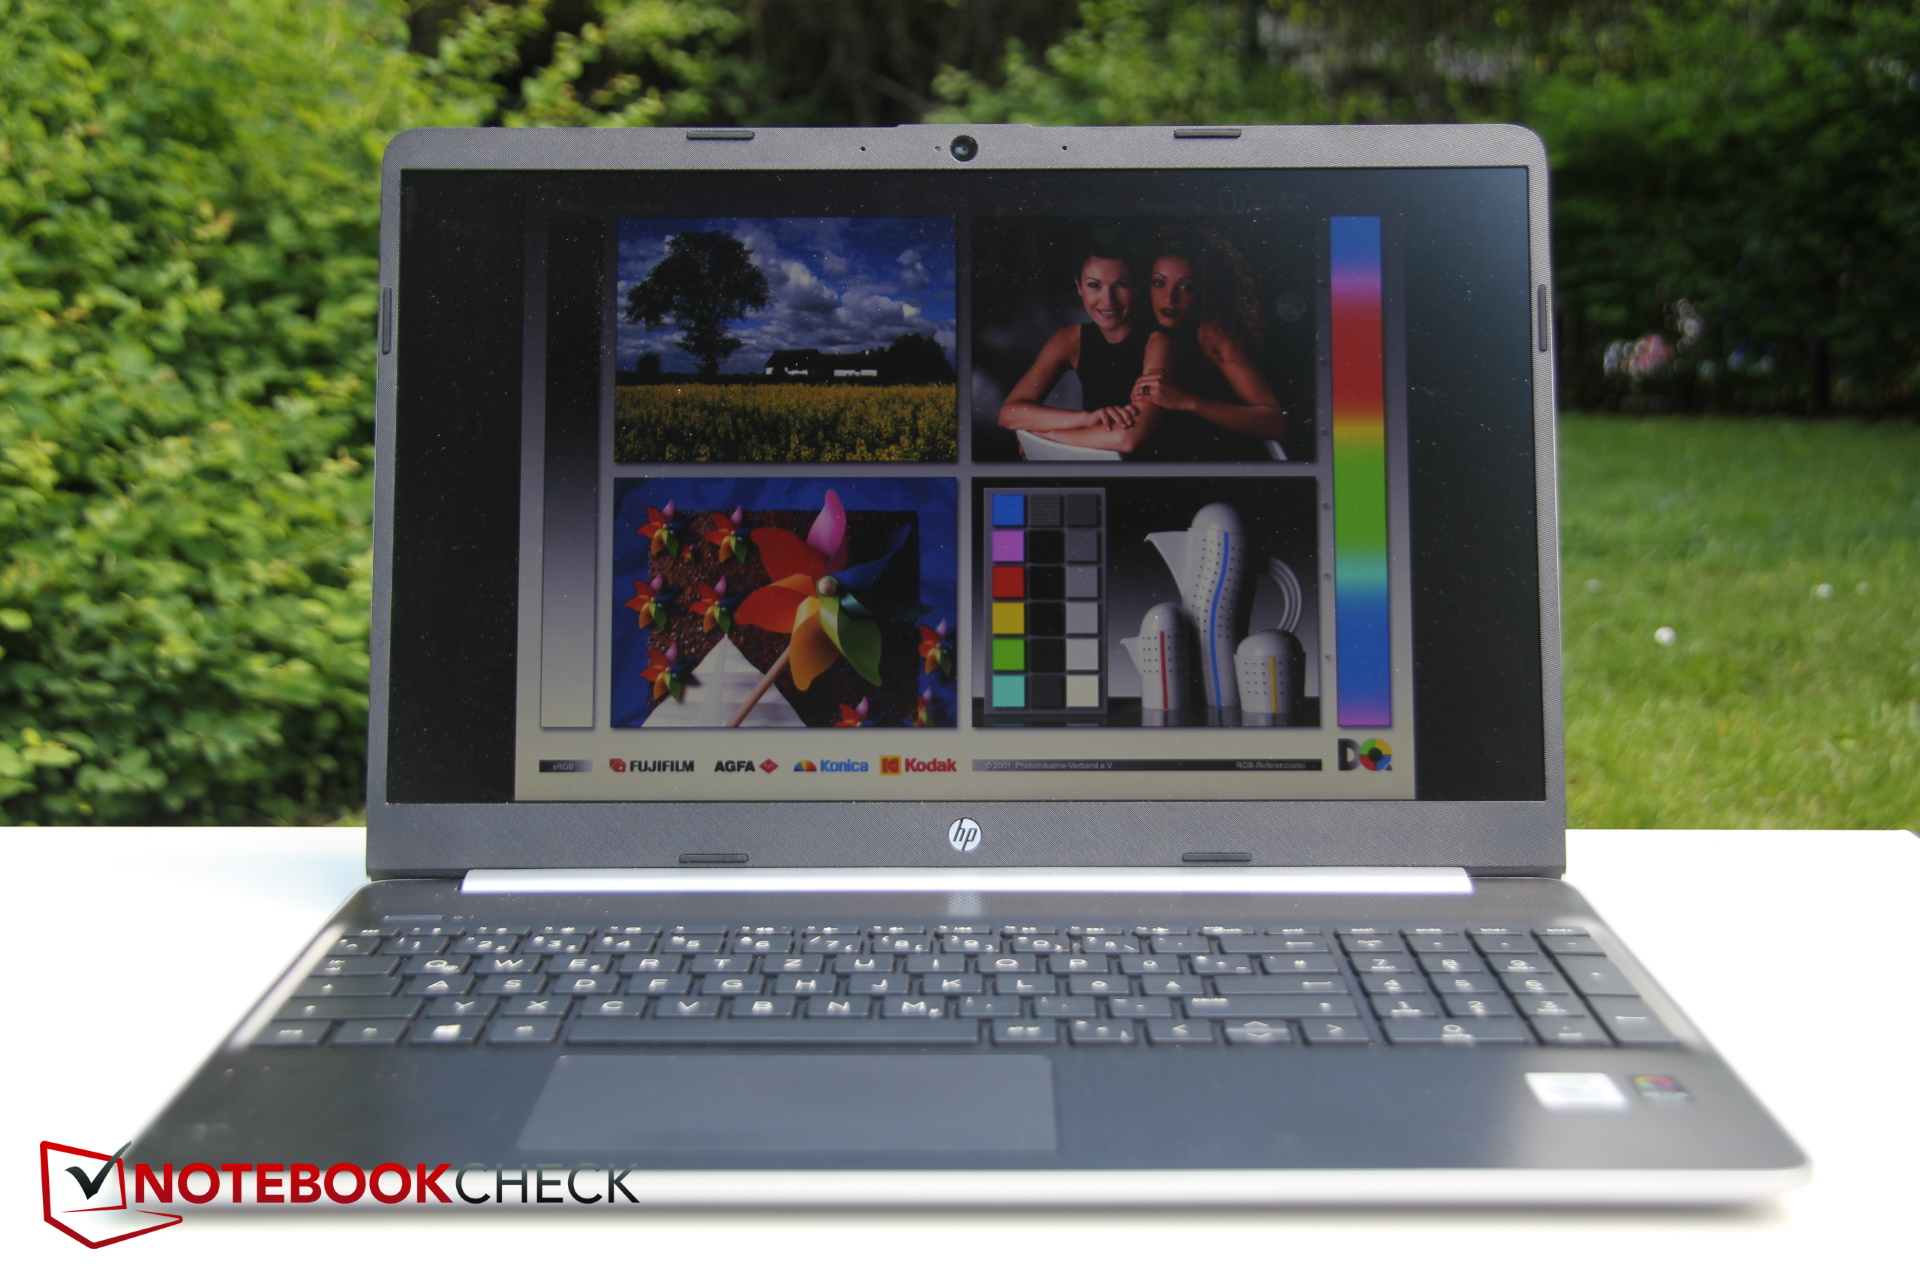
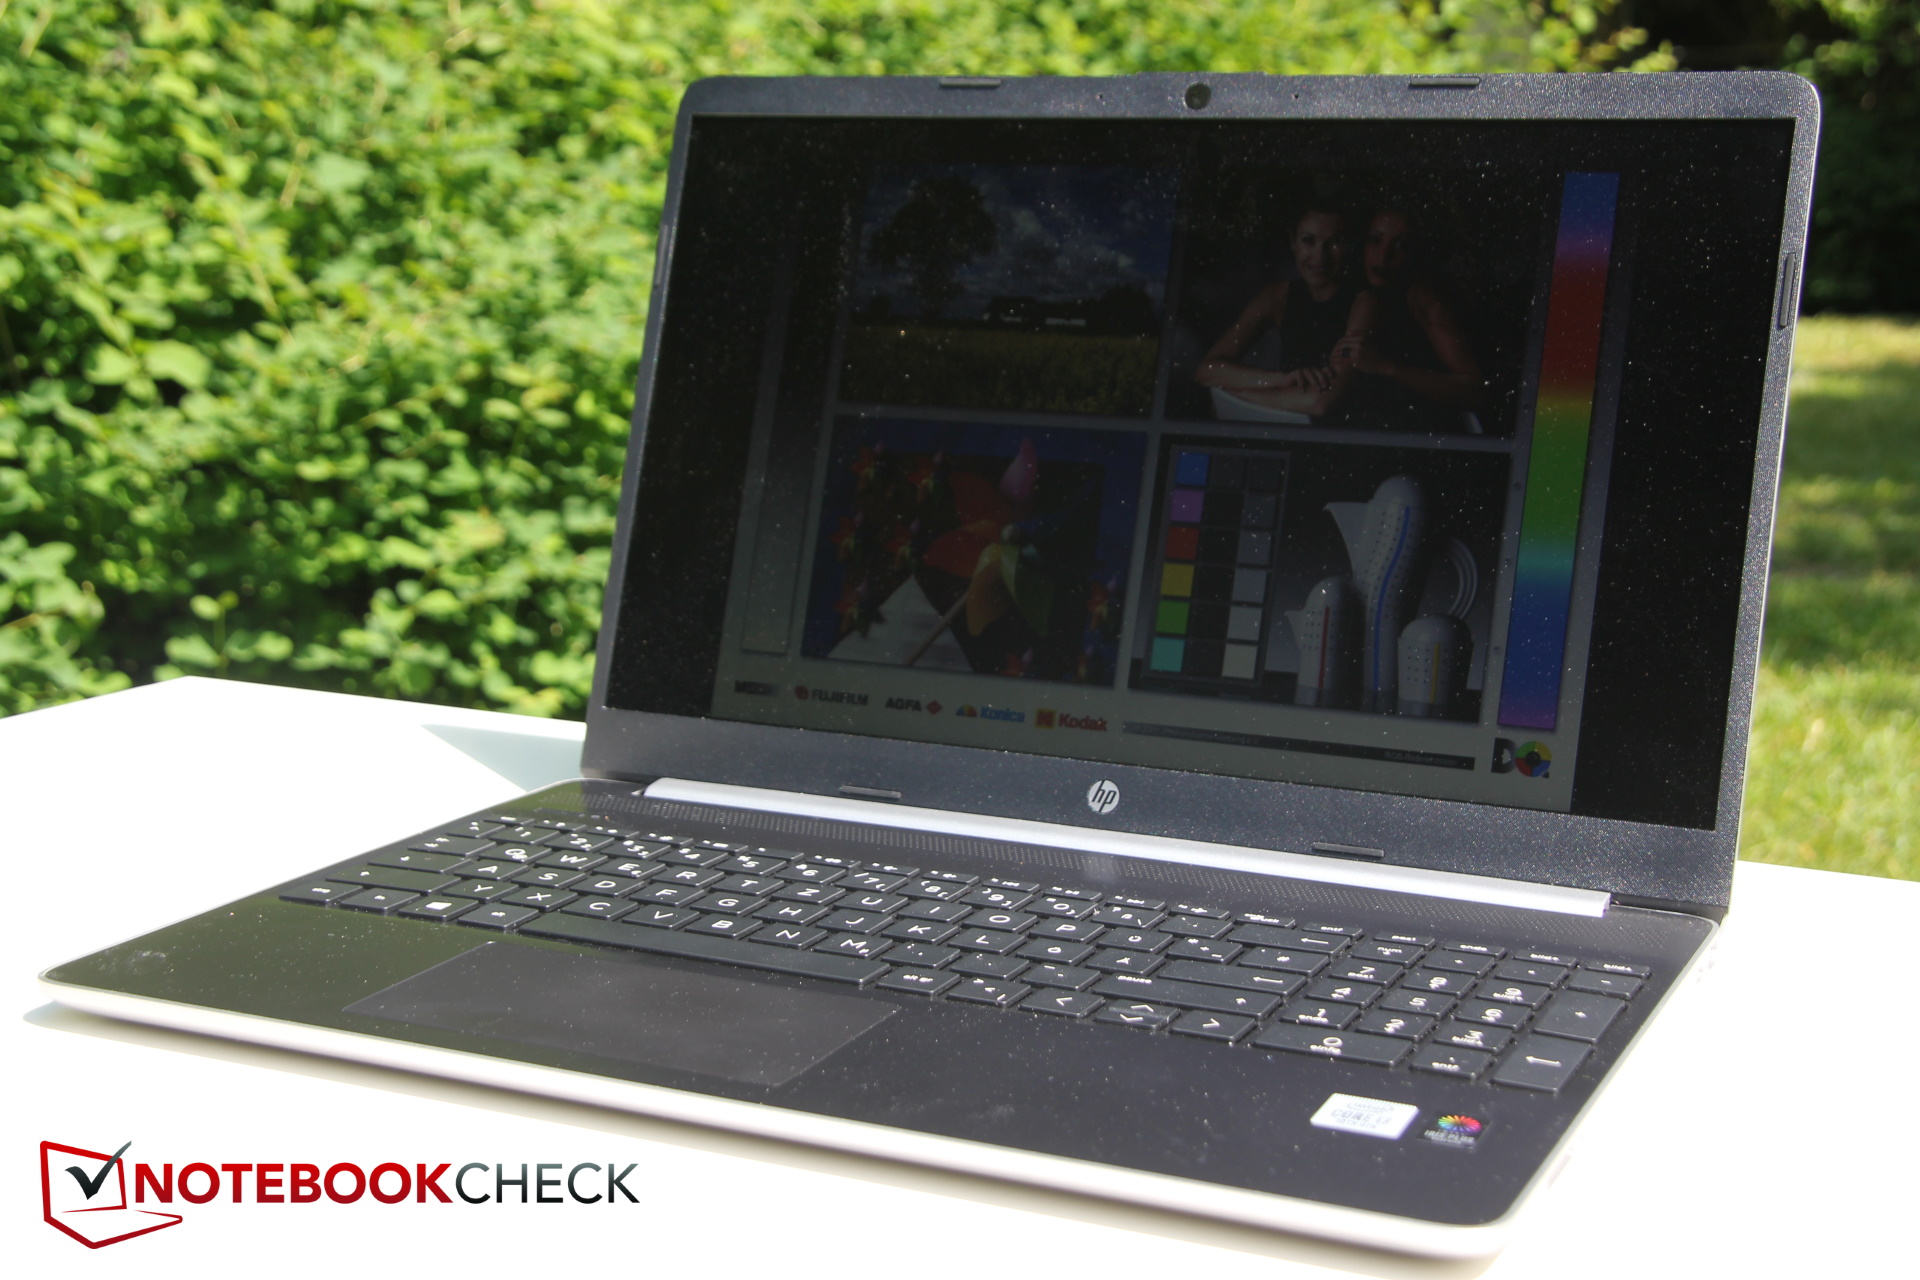
Portátil de escritório HP 15s-fq1440ng no teste: hardware enganoso - potencial desperdiçado
Avaliação | Data | Modelo | Peso | Altura | Size | Resolução | Preço |
|---|---|---|---|---|---|---|---|
| 77.9 % v7 (old) | 06/2020 | HP 15s-fq1440ng i7-1065G7, Iris Plus Graphics G7 (Ice Lake 64 EU) | 1.6 kg | 17.9 mm | 15.60" | 1920x1080 | |
| 78.5 % v7 (old) | 02/2020 | HP 15s-fq1556ng i5-1035G1, UHD Graphics G1 (Ice Lake 32 EU) | 1.7 kg | 18 mm | 15.60" | 1920x1080 | |
| 83.9 % v7 (old) | 12/2019 | Microsoft Surface Laptop 3 15 i7-1065G7 i7-1065G7, Iris Plus Graphics G7 (Ice Lake 64 EU) | 1.5 kg | 14.7 mm | 15.00" | 2496x1664 | |
| 79.4 % v7 (old) | 03/2020 | Lenovo Ideapad S340-15IIL i7-1065G7, Iris Plus Graphics G7 (Ice Lake 64 EU) | 1.8 kg | 17.9 mm | 15.60" | 1920x1080 | |
| 79.7 % v6 (old) | 08/2019 | Dell Inspiron 15 5000 5585 R7 3700U, Vega 10 | 1.8 kg | 19.5 mm | 15.60" | 1920x1080 | |
| 82.8 % v6 (old) | 12/2018 | Dell Inspiron 15 7000 2-in-1 Black Edition i7-8565U, GeForce MX150 | 2.1 kg | 17 mm | 15.60" | 3840x2160 |
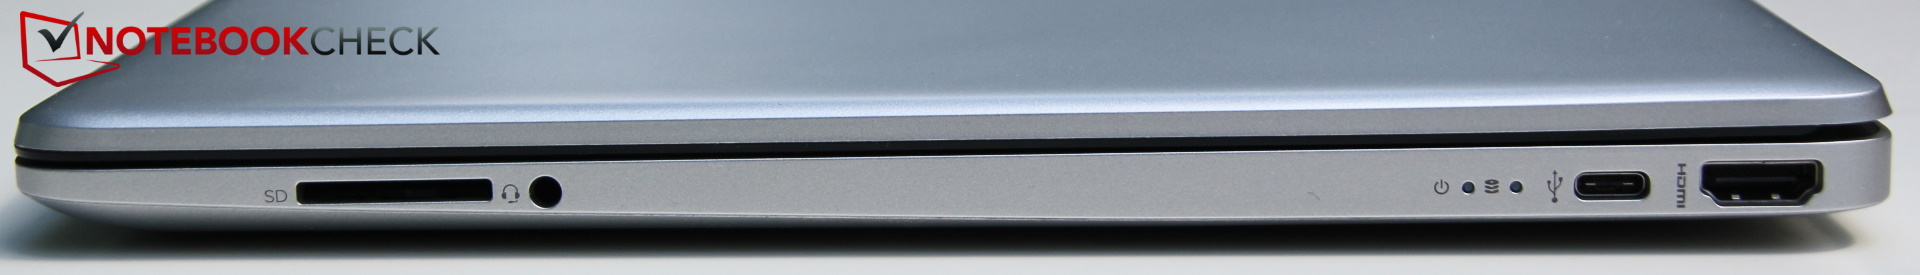
| SD Card Reader | |
| average JPG Copy Test (av. of 3 runs) | |
| Lenovo Ideapad S340-15IIL (Toshiba Exceria Pro SDXC 64 GB UHS-II) | |
| Média da turma Office (19.8 - 198.5, n=22, últimos 2 anos) | |
| Dell Inspiron 15 5000 5585 (Toshiba Exceria Pro SDXC 64 GB UHS-II) | |
| HP 15s-fq1440ng (Toshiba Exceria Pro SDXC 64 GB UHS-II) | |
| Dell Inspiron 15 7000 2-in-1 Black Edition (Toshiba Exceria Pro SDXC 64 GB UHS-II) | |
| maximum AS SSD Seq Read Test (1GB) | |
| Lenovo Ideapad S340-15IIL (Toshiba Exceria Pro SDXC 64 GB UHS-II) | |
| Média da turma Office (27.4 - 249, n=21, últimos 2 anos) | |
| Dell Inspiron 15 5000 5585 (Toshiba Exceria Pro SDXC 64 GB UHS-II) | |
| Dell Inspiron 15 7000 2-in-1 Black Edition (Toshiba Exceria Pro SDXC 64 GB UHS-II) | |

, i7-1065G7, Samsung PM991 MZVLQ512HALU")
, i7-1065G7, Samsung PM991 MZVLQ512HALU")
| |||||||||||||||||||||||||
iluminação: 79 %
iluminação com acumulador: 197 cd/m²
Contraste: 568:1 (Preto: 0.4 cd/m²)
ΔE ColorChecker Calman: 10.48 | ∀{0.5-29.43 Ø4.73}
calibrated: 4.64
ΔE Greyscale Calman: 12.44 | ∀{0.09-98 Ø4.97}
54% sRGB (Argyll 1.6.3 3D)
34% AdobeRGB 1998 (Argyll 1.6.3 3D)
37.24% AdobeRGB 1998 (Argyll 3D)
54.2% sRGB (Argyll 3D)
36.04% Display P3 (Argyll 3D)
Gamma: 2.77
CCT: 13027 K
| HP 15s-fq1440ng AU Optronics AUO61ED, TN, 1920x1080, 15.6" | HP 15s-fq1556ng AU Optronics B156HW02, IPS, 1920x1080, 15.6" | Microsoft Surface Laptop 3 15 i7-1065G7 Sharp LQ150P1JX51, IPS, 2496x1664, 15" | Lenovo Ideapad S340-15IIL BOE CQ NV156FHM-T03, IPS, 1920x1080, 15.6" | Dell Inspiron 15 5000 5585 LG Philips 156WFC, IPS, 1920x1080, 15.6" | Dell Inspiron 15 7000 2-in-1 Black Edition AUO34EB, IPS, 3840x2160, 15.6" | |
|---|---|---|---|---|---|---|
| Display | 4% | 82% | 11% | 4% | 99% | |
| Display P3 Coverage (%) | 36.04 | 37.66 4% | 65.6 82% | 40.43 12% | 37.31 4% | 75.7 110% |
| sRGB Coverage (%) | 54.2 | 56.4 4% | 98.4 82% | 58.8 8% | 56.2 4% | 99.3 83% |
| AdobeRGB 1998 Coverage (%) | 37.24 | 38.91 4% | 67.8 82% | 41.77 12% | 38.55 4% | 75.7 103% |
| Response Times | -93% | -124% | -101% | -47% | -75% | |
| Response Time Grey 50% / Grey 80% * (ms) | 43 ? | 51 ? -19% | 56 ? -30% | 46.4 ? -8% | 28.4 ? 34% | 48 ? -12% |
| Response Time Black / White * (ms) | 12 ? | 32 ? -167% | 38 ? -217% | 35.2 ? -193% | 27.2 ? -127% | 28.4 ? -137% |
| PWM Frequency (Hz) | 21370 ? | |||||
| Screen | 37% | 72% | 30% | 25% | 49% | |
| Brightness middle (cd/m²) | 227 | 254 12% | 412.4 82% | 320.8 41% | 253.6 12% | 321.1 41% |
| Brightness (cd/m²) | 215 | 234 9% | 374 74% | 309 44% | 227 6% | 315 47% |
| Brightness Distribution (%) | 79 | 86 9% | 78 -1% | 87 10% | 84 6% | 95 20% |
| Black Level * (cd/m²) | 0.4 | 0.18 55% | 0.35 13% | 0.27 32% | 0.27 32% | 0.36 10% |
| Contrast (:1) | 568 | 1411 148% | 1178 107% | 1188 109% | 939 65% | 892 57% |
| Colorchecker dE 2000 * | 10.48 | 5.58 47% | 1.04 90% | 7.68 27% | 6.05 42% | 5.45 48% |
| Colorchecker dE 2000 max. * | 22.49 | 9.83 56% | 2.83 87% | 21.97 2% | 14.03 38% | 12.6 44% |
| Colorchecker dE 2000 calibrated * | 4.64 | 4.53 2% | 0.74 84% | 4.65 -0% | 4.97 -7% | 2.08 55% |
| Greyscale dE 2000 * | 12.44 | 5.02 60% | 1.3 90% | 7.3 41% | 3.2 74% | 8.1 35% |
| Gamma | 2.77 79% | 2.83 78% | 2.07 106% | 2.12 104% | 2 110% | 2.207 100% |
| CCT | 13027 50% | 6570 99% | 6634 98% | 6213 105% | 6820 95% | 6845 95% |
| Color Space (Percent of AdobeRGB 1998) (%) | 34 | 36 6% | 62.4 84% | 37.8 11% | 35.5 4% | 67.3 98% |
| Color Space (Percent of sRGB) (%) | 54 | 56 4% | 98.4 82% | 58.3 8% | 55.6 3% | 99.3 84% |
| Média Total (Programa/Configurações) | -17% /
15% | 10% /
49% | -20% /
10% | -6% /
12% | 24% /
43% |
* ... menor é melhor
Exibir tempos de resposta
| ↔ Tempo de resposta preto para branco | ||
|---|---|---|
| 12 ms ... ascensão ↗ e queda ↘ combinadas | ↗ 9 ms ascensão | 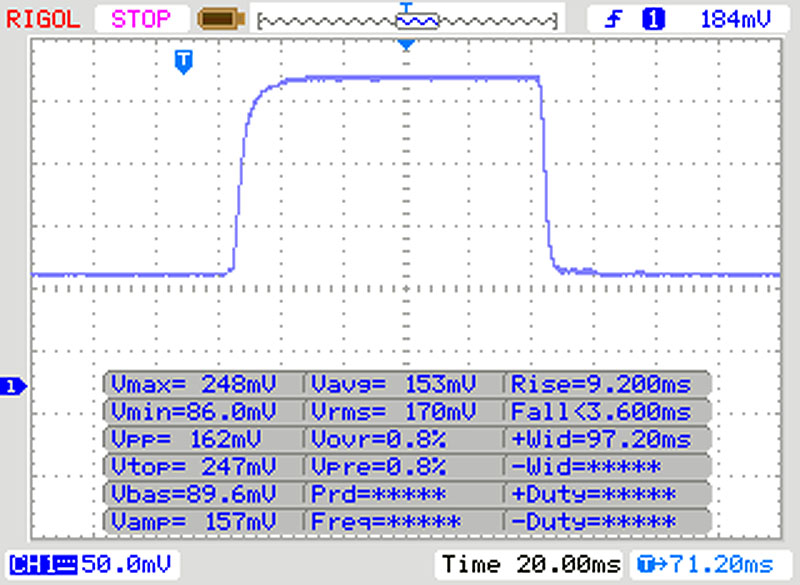 |
| ↘ 3 ms queda | ||
| A tela mostra boas taxas de resposta em nossos testes, mas pode ser muito lenta para jogadores competitivos. Em comparação, todos os dispositivos testados variam de 0.1 (mínimo) a 240 (máximo) ms. » 31 % de todos os dispositivos são melhores. Isso significa que o tempo de resposta medido é melhor que a média de todos os dispositivos testados (19.9 ms). | ||
| ↔ Tempo de resposta 50% cinza a 80% cinza | ||
| 43 ms ... ascensão ↗ e queda ↘ combinadas | ↗ 24 ms ascensão | 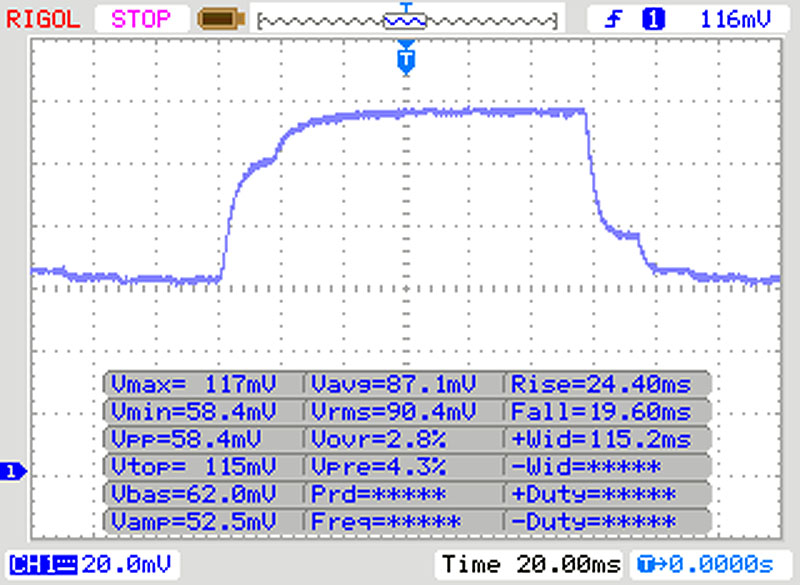 |
| ↘ 19 ms queda | ||
| A tela mostra taxas de resposta lentas em nossos testes e será insatisfatória para os jogadores. Em comparação, todos os dispositivos testados variam de 0.165 (mínimo) a 636 (máximo) ms. » 71 % de todos os dispositivos são melhores. Isso significa que o tempo de resposta medido é pior que a média de todos os dispositivos testados (31.1 ms). | ||
Cintilação da tela / PWM (modulação por largura de pulso)
| Tela tremeluzindo / PWM não detectado |  | ||
[pwm_comparison] Em comparação: 52 % de todos os dispositivos testados não usam PWM para escurecer a tela. Se PWM foi detectado, uma média de 7784 (mínimo: 5 - máximo: 343500) Hz foi medida. | |||
Cinebench R15: CPU Single 64Bit | CPU Multi 64Bit
Blender: v2.79 BMW27 CPU
7-Zip 18.03: 7z b 4 -mmt1 | 7z b 4
Geekbench 5.5: Single-Core | Multi-Core
HWBOT x265 Benchmark v2.2: 4k Preset
LibreOffice : 20 Documents To PDF
R Benchmark 2.5: Overall mean
| Cinebench R20 / CPU (Single Core) | |
| Média da turma Office (345 - 816, n=73, últimos 2 anos) | |
| Microsoft Surface Laptop 3 15 i7-1065G7 | |
| HP 15s-fq1440ng | |
| Lenovo Ideapad S340-15IIL | |
| Média Intel Core i7-1065G7 (358 - 474, n=31) | |
| Dell Inspiron 15 5000 5585 | |
| Cinebench R20 / CPU (Multi Core) | |
| Média da turma Office (648 - 8840, n=73, últimos 2 anos) | |
| Microsoft Surface Laptop 3 15 i7-1065G7 | |
| Lenovo Ideapad S340-15IIL | |
| Média Intel Core i7-1065G7 (1081 - 2024, n=31) | |
| Dell Inspiron 15 5000 5585 | |
| HP 15s-fq1440ng | |
| Cinebench R15 / CPU Single 64Bit | |
| Média da turma Office (99.5 - 312, n=75, últimos 2 anos) | |
| Dell Inspiron 15 7000 2-in-1 Black Edition | |
| Microsoft Surface Laptop 3 15 i7-1065G7 | |
| Lenovo Ideapad S340-15IIL | |
| HP 15s-fq1440ng | |
| Média Intel Core i7-1065G7 (141 - 190, n=35) | |
| HP 15s-fq1556ng | |
| Dell Inspiron 15 5000 5585 | |
| Cinebench R15 / CPU Multi 64Bit | |
| Média da turma Office (250 - 3380, n=75, últimos 2 anos) | |
| Lenovo Ideapad S340-15IIL | |
| Microsoft Surface Laptop 3 15 i7-1065G7 | |
| Dell Inspiron 15 5000 5585 | |
| Média Intel Core i7-1065G7 (288 - 836, n=36) | |
| HP 15s-fq1440ng | |
| Dell Inspiron 15 7000 2-in-1 Black Edition | |
| HP 15s-fq1556ng | |
| Blender / v2.79 BMW27 CPU | |
| HP 15s-fq1440ng | |
| Média Intel Core i7-1065G7 (675 - 1650, n=23) | |
| HP 15s-fq1556ng | |
| Média da turma Office (158 - 1940, n=74, últimos 2 anos) | |
| 7-Zip 18.03 / 7z b 4 -mmt1 | |
| Média da turma Office (3387 - 6469, n=75, últimos 2 anos) | |
| HP 15s-fq1440ng | |
| Média Intel Core i7-1065G7 (3289 - 4589, n=24) | |
| 7-Zip 18.03 / 7z b 4 | |
| Média da turma Office (7098 - 76886, n=75, últimos 2 anos) | |
| Média Intel Core i7-1065G7 (10406 - 22898, n=24) | |
| HP 15s-fq1440ng | |
| Geekbench 5.5 / Single-Core | |
| Média da turma Office (811 - 2128, n=71, últimos 2 anos) | |
| HP 15s-fq1440ng | |
| Média Intel Core i7-1065G7 (948 - 1348, n=18) | |
| Geekbench 5.5 / Multi-Core | |
| Média da turma Office (1483 - 16999, n=71, últimos 2 anos) | |
| Média Intel Core i7-1065G7 (2464 - 4855, n=18) | |
| HP 15s-fq1440ng | |
| HWBOT x265 Benchmark v2.2 / 4k Preset | |
| Média da turma Office (2.21 - 26, n=74, últimos 2 anos) | |
| Média Intel Core i7-1065G7 (2.2 - 6.38, n=22) | |
| HP 15s-fq1440ng | |
| LibreOffice / 20 Documents To PDF | |
| Média Intel Core i7-1065G7 (46.9 - 85.3, n=19) | |
| Média da turma Office (39.9 - 102.3, n=74, últimos 2 anos) | |
| HP 15s-fq1440ng | |
| R Benchmark 2.5 / Overall mean | |
| Média Intel Core i7-1065G7 (0.661 - 0.798, n=18) | |
| HP 15s-fq1440ng | |
| Média da turma Office (0.4098 - 0.888, n=74, últimos 2 anos) | |
* ... menor é melhor
| PCMark 8 Home Score Accelerated v2 | 3696 pontos | |
| PCMark 8 Work Score Accelerated v2 | 2768 pontos | |
| PCMark 10 Score | 3878 pontos | |
Ajuda | ||
| DPC Latencies / LatencyMon - interrupt to process latency (max), Web, Youtube, Prime95 | |
| HP 15s-fq1440ng | |
* ... menor é melhor
| HP 15s-fq1440ng Samsung PM991 MZVLQ512HALU | HP 15s-fq1556ng Intel SSD 660p SSDPEKNW512G8 | Lenovo Ideapad S340-15IIL Intel SSD 660p SSDPEKNW512G8 | Dell Inspiron 15 7000 2-in-1 Black Edition Toshiba BG3 KBG30ZMS256G | Microsoft Surface Laptop 3 15 i7-1065G7 Toshiba KBG40ZNS256G NVMe | Dell Inspiron 15 5000 5585 WDC PC SN520 SDAPNUW-512G | Média Samsung PM991 MZVLQ512HALU | |
|---|---|---|---|---|---|---|---|
| CrystalDiskMark 5.2 / 6 / Write 4K | |||||||
| Write 4K (MB/s) | 156.2 | 203.1 30% | 130.8 -16% | 83.4 -47% | 125 -20% | 105.9 -32% | 131.8 ? -16% |
| CrystalDiskMark 5.2 / 6 / Read 4K | |||||||
| Read 4K (MB/s) | 40.32 | 65.3 62% | 54.8 36% | 32.22 -20% | 54.9 36% | 36.56 -9% | 44.9 ? 11% |
| CrystalDiskMark 5.2 / 6 / Write Seq | |||||||
| Write Seq (MB/s) | 824 | 973 18% | 978 19% | 171.7 -79% | 1220 48% | 1165 41% | 1162 ? 41% |
| CrystalDiskMark 5.2 / 6 / Read Seq | |||||||
| Read Seq (MB/s) | 1044 | 1651 58% | 1627 56% | 924 -11% | 1690 62% | 423.2 -59% | 1473 ? 41% |
| CrystalDiskMark 5.2 / 6 / Write 4K Q32T1 | |||||||
| Write 4K Q32T1 (MB/s) | 437.2 | 526 20% | 450.1 3% | 161.5 -63% | 348.3 -20% | 332.1 -24% | 399 ? -9% |
| CrystalDiskMark 5.2 / 6 / Read 4K Q32T1 | |||||||
| Read 4K Q32T1 (MB/s) | 461.6 | 345.2 -25% | 345.9 -25% | 301.1 -35% | 423.7 -8% | 229.3 -50% | 426 ? -8% |
| CrystalDiskMark 5.2 / 6 / Write Seq Q32T1 | |||||||
| Write Seq Q32T1 (MB/s) | 1267 | 980 -23% | 982 -22% | 222.3 -82% | 1570 24% | 1460 15% | 1348 ? 6% |
| CrystalDiskMark 5.2 / 6 / Read Seq Q32T1 | |||||||
| Read Seq Q32T1 (MB/s) | 2343 | 1883 -20% | 1842 -21% | 1300 -45% | 2378 1% | 472.5 -80% | 2398 ? 2% |
| AS SSD / Seq Read | |||||||
| Seq Read (MB/s) | 1925 | 1705 -11% | 1447 -25% | 1123 -42% | 1756 -9% | 398.9 -79% | 1921 ? 0% |
| AS SSD / Seq Write | |||||||
| Seq Write (MB/s) | 1207 | 904 -25% | 926 -23% | 208.9 -83% | 818 -32% | 884 -27% | 1128 ? -7% |
| AS SSD / 4K Read | |||||||
| 4K Read (MB/s) | 50.9 | 58.5 15% | 40.06 -21% | 27.36 -46% | 52.3 3% | 34.54 -32% | 47.6 ? -6% |
| AS SSD / 4K Write | |||||||
| 4K Write (MB/s) | 144.7 | 165.4 14% | 97.9 -32% | 65 -55% | 112.2 -22% | 82.1 -43% | 137.9 ? -5% |
| AS SSD / 4K-64 Read | |||||||
| 4K-64 Read (MB/s) | 886 | 323.1 -64% | 323.7 -63% | 313.2 -65% | 985 11% | 647 -27% | 878 ? -1% |
| AS SSD / 4K-64 Write | |||||||
| 4K-64 Write (MB/s) | 811 | 827 2% | 791 -2% | 111.2 -86% | 292.7 -64% | 985 21% | 782 ? -4% |
| AS SSD / Access Time Read | |||||||
| Access Time Read * (ms) | 0.066 | 0.056 15% | 0.06 9% | 0.684 -936% | 0.083 -26% | 0.072 -9% | 0.09367 ? -42% |
| AS SSD / Access Time Write | |||||||
| Access Time Write * (ms) | 0.027 | 0.044 -63% | 0.144 -433% | 0.344 -1174% | 0.619 -2193% | 0.047 -74% | 0.03708 ? -37% |
| AS SSD / Score Read | |||||||
| Score Read (Points) | 1130 | 522 -54% | 508 -55% | 453 -60% | 1213 7% | 721 -36% | 1118 ? -1% |
| AS SSD / Score Write | |||||||
| Score Write (Points) | 1076 | 1083 1% | 982 -9% | 197 -82% | 487 -55% | 1155 7% | 1033 ? -4% |
| AS SSD / Score Total | |||||||
| Score Total (Points) | 2760 | 1901 -31% | 1738 -37% | 844 -69% | 2285 -17% | 2279 -17% | 2694 ? -2% |
| AS SSD / Copy ISO MB/s | |||||||
| Copy ISO MB/s (MB/s) | 1384 | 943 -32% | 927 -33% | 1192 -14% | 862 -38% | 1347 ? -3% | |
| AS SSD / Copy Program MB/s | |||||||
| Copy Program MB/s (MB/s) | 344.8 | 612 77% | 206.4 -40% | 604 75% | 457 33% | 421 ? 22% | |
| AS SSD / Copy Game MB/s | |||||||
| Copy Game MB/s (MB/s) | 741 | 826 11% | 360.4 -51% | 1136 53% | 902 22% | 825 ? 11% | |
| Média Total (Programa/Configurações) | -4% /
-4% | -28% /
-28% | -146% /
-146% | -98% /
-98% | -23% /
-23% | -1% /
-1% |
* ... menor é melhor

Continuous reading: DiskSpd Read Loop, Queue Depth 8
| 3DMark 11 Performance | 3731 pontos | |
| 3DMark Cloud Gate Standard Score | 9422 pontos | |
| 3DMark Fire Strike Score | 1692 pontos | |
| 3DMark Time Spy Score | 640 pontos | |
Ajuda | ||
| baixo | média | alto | ultra | |
|---|---|---|---|---|
| The Witcher 3 (2015) | 38.7 | 21.9 | 13.3 | 7.4 |
| Dota 2 Reborn (2015) | 71.5 | 45.6 | 29.4 | 27.4 |
| Rocket League (2017) | 67.3 | 48 | 28.9 | |
| X-Plane 11.11 (2018) | 33.6 | 18.7 | 17.3 | |
| Far Cry 5 (2018) | 22 | 12 | 11 | 10 |
Barulho
| Ocioso |
| 31.2 / 31.2 / 31.2 dB |
| Carga |
| 36 / 40.7 dB |
 | ||
30 dB silencioso 40 dB(A) audível 50 dB(A) ruidosamente alto |
||
min: | ||
| HP 15s-fq1440ng Iris Plus Graphics G7 (Ice Lake 64 EU), i7-1065G7, Samsung PM991 MZVLQ512HALU | HP 15s-fq1556ng UHD Graphics G1 (Ice Lake 32 EU), i5-1035G1, Intel SSD 660p SSDPEKNW512G8 | Microsoft Surface Laptop 3 15 i7-1065G7 Iris Plus Graphics G7 (Ice Lake 64 EU), i7-1065G7, Toshiba KBG40ZNS256G NVMe | Lenovo Ideapad S340-15IIL Iris Plus Graphics G7 (Ice Lake 64 EU), i7-1065G7, Intel SSD 660p SSDPEKNW512G8 | Dell Inspiron 15 5000 5585 Vega 10, R7 3700U, WDC PC SN520 SDAPNUW-512G | Dell Inspiron 15 7000 2-in-1 Black Edition GeForce MX150, i7-8565U, Toshiba BG3 KBG30ZMS256G | |
|---|---|---|---|---|---|---|
| Noise | 3% | 9% | 11% | 8% | -3% | |
| desligado / ambiente * (dB) | 31.2 | 30.3 3% | 28.5 9% | 28.5 9% | 28.3 9% | 28 10% |
| Idle Minimum * (dB) | 31.2 | 30.3 3% | 28.5 9% | 28.5 9% | 28.3 9% | 28 10% |
| Idle Average * (dB) | 31.2 | 30.3 3% | 28.5 9% | 28.5 9% | 28.3 9% | 28 10% |
| Idle Maximum * (dB) | 31.2 | 30.3 3% | 28.7 8% | 28.5 9% | 28.3 9% | 28.4 9% |
| Load Average * (dB) | 36 | 34 6% | 30 17% | 30.3 16% | 31.4 13% | 48.6 -35% |
| Load Maximum * (dB) | 40.7 | 41.3 -1% | 41.2 -1% | 35.5 13% | 41.4 -2% | 49.2 -21% |
| Witcher 3 ultra * (dB) | 39.2 | 41.4 | 47.9 |
* ... menor é melhor
(+) A temperatura máxima no lado superior é 38.6 °C / 101 F, em comparação com a média de 34.3 °C / 94 F , variando de 21.2 a 62.5 °C para a classe Office.
(±) A parte inferior aquece até um máximo de 40.2 °C / 104 F, em comparação com a média de 36.8 °C / 98 F
(+) Em uso inativo, a temperatura média para o lado superior é 24.6 °C / 76 F, em comparação com a média do dispositivo de 29.5 °C / ### class_avg_f### F.
(+) Os apoios para as mãos e o touchpad são mais frios que a temperatura da pele, com um máximo de 25.5 °C / 77.9 F e, portanto, são frios ao toque.
(±) A temperatura média da área do apoio para as mãos de dispositivos semelhantes foi 27.5 °C / 81.5 F (+2 °C / 3.6 F).
HP 15s-fq1440ng análise de áudio
(±) | o volume do alto-falante é médio, mas bom (###valor### dB)
Graves 100 - 315Hz
(-) | quase nenhum baixo - em média 19.3% menor que a mediana
(±) | a linearidade dos graves é média (12.3% delta para a frequência anterior)
Médios 400 - 2.000 Hz
(+) | médios equilibrados - apenas 3.2% longe da mediana
(±) | a linearidade dos médios é média (7.3% delta para frequência anterior)
Altos 2 - 16 kHz
(+) | agudos equilibrados - apenas 2.3% longe da mediana
(+) | os máximos são lineares (4.3% delta da frequência anterior)
Geral 100 - 16.000 Hz
(±) | a linearidade do som geral é média (18.3% diferença em relação à mediana)
Comparado com a mesma classe
» 32% de todos os dispositivos testados nesta classe foram melhores, 6% semelhantes, 61% piores
» O melhor teve um delta de 7%, a média foi 21%, o pior foi 53%
Comparado com todos os dispositivos testados
» 40% de todos os dispositivos testados foram melhores, 8% semelhantes, 52% piores
» O melhor teve um delta de 4%, a média foi 24%, o pior foi 134%
Microsoft Surface Laptop 3 15 i7-1065G7 análise de áudio
(±) | o volume do alto-falante é médio, mas bom (###valor### dB)
Graves 100 - 315Hz
(±) | graves reduzidos - em média 5.3% menor que a mediana
(±) | a linearidade dos graves é média (10.3% delta para a frequência anterior)
Médios 400 - 2.000 Hz
(+) | médios equilibrados - apenas 2.7% longe da mediana
(+) | médios são lineares (6.7% delta para frequência anterior)
Altos 2 - 16 kHz
(+) | agudos equilibrados - apenas 2.7% longe da mediana
(±) | a linearidade dos máximos é média (8.5% delta para frequência anterior)
Geral 100 - 16.000 Hz
(+) | o som geral é linear (11.7% diferença em relação à mediana)
Comparado com a mesma classe
» 3% de todos os dispositivos testados nesta classe foram melhores, 2% semelhantes, 95% piores
» O melhor teve um delta de 7%, a média foi 21%, o pior foi 53%
Comparado com todos os dispositivos testados
» 8% de todos os dispositivos testados foram melhores, 3% semelhantes, 89% piores
» O melhor teve um delta de 4%, a média foi 24%, o pior foi 134%
Lenovo Ideapad S340-15IIL análise de áudio
(+) | os alto-falantes podem tocar relativamente alto (###valor### dB)
Graves 100 - 315Hz
(-) | quase nenhum baixo - em média 21.2% menor que a mediana
(±) | a linearidade dos graves é média (11.4% delta para a frequência anterior)
Médios 400 - 2.000 Hz
(+) | médios equilibrados - apenas 4.8% longe da mediana
(±) | a linearidade dos médios é média (7% delta para frequência anterior)
Altos 2 - 16 kHz
(+) | agudos equilibrados - apenas 2.5% longe da mediana
(+) | os máximos são lineares (4% delta da frequência anterior)
Geral 100 - 16.000 Hz
(±) | a linearidade do som geral é média (22% diferença em relação à mediana)
Comparado com a mesma classe
» 78% de todos os dispositivos testados nesta classe foram melhores, 4% semelhantes, 18% piores
» O melhor teve um delta de 5%, a média foi 17%, o pior foi 45%
Comparado com todos os dispositivos testados
» 63% de todos os dispositivos testados foram melhores, 6% semelhantes, 30% piores
» O melhor teve um delta de 4%, a média foi 24%, o pior foi 134%
Dell Inspiron 15 7000 2-in-1 Black Edition análise de áudio
(±) | o volume do alto-falante é médio, mas bom (###valor### dB)
Graves 100 - 315Hz
(-) | quase nenhum baixo - em média 15% menor que a mediana
(±) | a linearidade dos graves é média (14% delta para a frequência anterior)
Médios 400 - 2.000 Hz
(+) | médios equilibrados - apenas 4.5% longe da mediana
(+) | médios são lineares (6% delta para frequência anterior)
Altos 2 - 16 kHz
(+) | agudos equilibrados - apenas 2.9% longe da mediana
(±) | a linearidade dos máximos é média (10.6% delta para frequência anterior)
Geral 100 - 16.000 Hz
(±) | a linearidade do som geral é média (18.1% diferença em relação à mediana)
Comparado com a mesma classe
» 54% de todos os dispositivos testados nesta classe foram melhores, 8% semelhantes, 38% piores
» O melhor teve um delta de 5%, a média foi 17%, o pior foi 45%
Comparado com todos os dispositivos testados
» 38% de todos os dispositivos testados foram melhores, 8% semelhantes, 54% piores
» O melhor teve um delta de 4%, a média foi 24%, o pior foi 134%
| desligado | |
| Ocioso | |
| Carga |
|
Key:
min: | |
| HP 15s-fq1440ng i7-1065G7, Iris Plus Graphics G7 (Ice Lake 64 EU), Samsung PM991 MZVLQ512HALU, TN, 1920x1080, 15.6" | HP 15s-fq1556ng i5-1035G1, UHD Graphics G1 (Ice Lake 32 EU), Intel SSD 660p SSDPEKNW512G8, IPS, 1920x1080, 15.6" | Lenovo Ideapad S340-15IIL i7-1065G7, Iris Plus Graphics G7 (Ice Lake 64 EU), Intel SSD 660p SSDPEKNW512G8, IPS, 1920x1080, 15.6" | Dell Inspiron 15 7000 2-in-1 Black Edition i7-8565U, GeForce MX150, Toshiba BG3 KBG30ZMS256G, IPS, 3840x2160, 15.6" | Microsoft Surface Laptop 3 15 i7-1065G7 i7-1065G7, Iris Plus Graphics G7 (Ice Lake 64 EU), Toshiba KBG40ZNS256G NVMe, IPS, 2496x1664, 15" | Dell Inspiron 15 5000 5585 R7 3700U, Vega 10, WDC PC SN520 SDAPNUW-512G, IPS, 1920x1080, 15.6" | Média Intel Iris Plus Graphics G7 (Ice Lake 64 EU) | Média da turma Office | |
|---|---|---|---|---|---|---|---|---|
| Power Consumption | 23% | 9% | -14% | -6% | 15% | 6% | -3% | |
| Idle Minimum * (Watt) | 6.9 | 3.3 52% | 3.8 45% | 4.2 39% | 4.4 36% | 4.2 39% | 3.91 ? 43% | 4.41 ? 36% |
| Idle Average * (Watt) | 9.2 | 6.4 30% | 6.9 25% | 7.8 15% | 8.3 10% | 6.8 26% | 7.33 ? 20% | 7.37 ? 20% |
| Idle Maximum * (Watt) | 9.5 | 6.8 28% | 7.7 19% | 8.5 11% | 8.6 9% | 7 26% | 9.16 ? 4% | 8.58 ? 10% |
| Load Average * (Watt) | 31 | 29 6% | 43.3 -40% | 57 -84% | 43.6 -41% | 36.5 -18% | 39.2 ? -26% | 43 ? -39% |
| Load Maximum * (Watt) | 45.4 | 46 -1% | 47.5 -5% | 68 -50% | 64.4 -42% | 44 3% | 49.8 ? -10% | 64.6 ? -42% |
| Witcher 3 ultra * (Watt) | 40.4 | 57.3 | 41.5 | 37.9 |
* ... menor é melhor
| HP 15s-fq1440ng i7-1065G7, Iris Plus Graphics G7 (Ice Lake 64 EU), 41 Wh | HP 15s-fq1556ng i5-1035G1, UHD Graphics G1 (Ice Lake 32 EU), 41 Wh | Microsoft Surface Laptop 3 15 i7-1065G7 i7-1065G7, Iris Plus Graphics G7 (Ice Lake 64 EU), 45 Wh | Lenovo Ideapad S340-15IIL i7-1065G7, Iris Plus Graphics G7 (Ice Lake 64 EU), 36 Wh | Dell Inspiron 15 5000 5585 R7 3700U, Vega 10, 42 Wh | Dell Inspiron 15 7000 2-in-1 Black Edition i7-8565U, GeForce MX150, 56 Wh | Média da turma Office | |
|---|---|---|---|---|---|---|---|
| Duração da bateria | -5% | 60% | -33% | -1% | 25% | 85% | |
| Reader / Idle (h) | 15.2 | 13.1 -14% | 35 130% | 10 -34% | 14.3 -6% | 23.7 ? 56% | |
| H.264 (h) | 6 | 15 ? 150% | |||||
| WiFi v1.3 (h) | 5.3 | 6 13% | 8.2 55% | 4.3 -19% | 7 32% | 6.6 25% | 12.9 ? 143% |
| Load (h) | 2 | 1.7 -15% | 1.9 -5% | 1.1 -45% | 1.4 -30% | 1.794 ? -10% |
Pro
Contra
Veredicto - Bom no papel, mas com muitas fraquezas
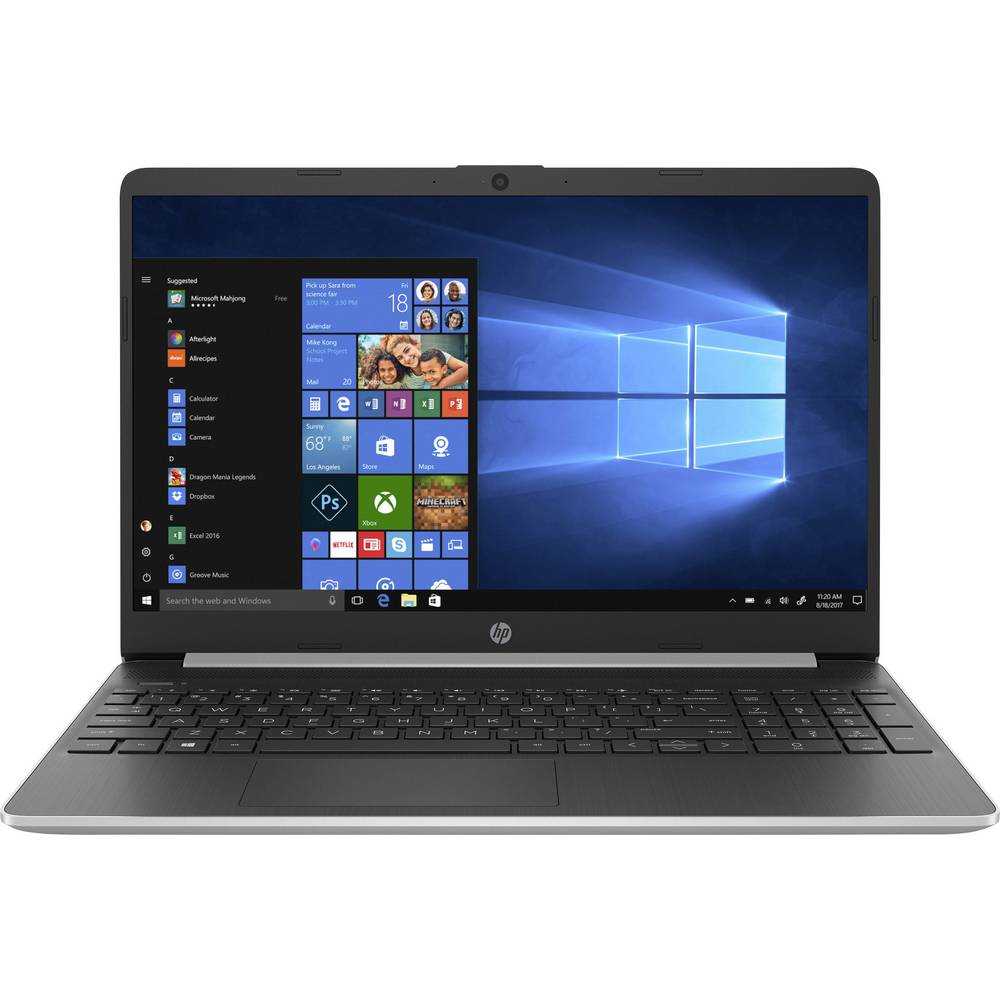
Infelizmente, não podemos fazer uma recomendação de compra para o HP 15s. Clientes que não usam o portátil exclusivamente em um monitor externo (ou seja, aproximadamente 99 por cento de todos os clientes) devem ser desencorajados pela má tela TN. A HP provavelmente não se importa com o novo processador com gráficos Iris Plus, que só consegue convencer no papel, mas é afogada pelo fabricante. Portanto, o cliente seria mais sensato se optasse por uma alternativa igualmente rápida, mais antiga e mais barata, com uma tela melhor. A GPU sugere que o portátil é capaz de mais do que apenas trabalho de escritório, mas na prática isso é colocado em perspectiva.
O HP 15s é um enganador. O hardware com um novo processador Intel e especialmente os gráficos potencialmente potentes do Iris Plus impressiona no papel, mas infelizmente não no teste. Além do bom desempenho da CPU, existem apenas alguns pontos que se destacam, mas diversas fraquezas.
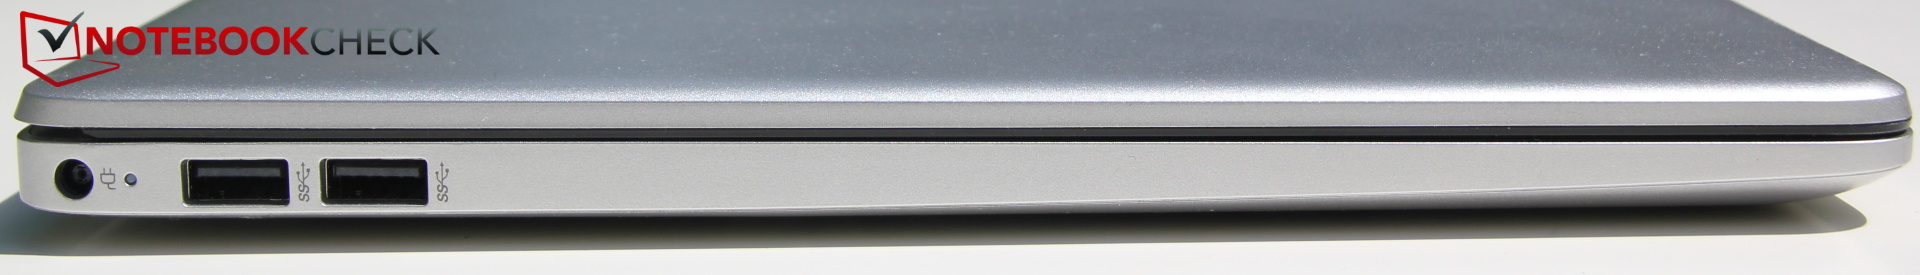
Então por que você deve comprar um portátil que tem uma tela ruim, é afogado, muito poucas conexões, na melhor das hipóteses tem dispositivos de entrada medíocres, tem um controle de ventilador longe do ideal e que consome energia desnecessariamente no modo inativo? Nós também não sabemos. Um dos poucos fatores positivos é o desempenho bastante decente da CPU, que, no entanto, não consegue compensar os muitos pontos fracos. Além das especificações puras, muita coisa parece ser economizada. Para o preço de 850 a 900 Euros (~$960 a $1.000), existem melhores alternativas (nosso top 10 dos melhores portáteis abaixo dos 1.000 Euros/~$1.130).
HP 15s-fq1440ng
- 06/03/2020 v7 (old)
Christian Hintze
Price comparison
