Breve Análise do Portátil HP ProBook 650 G2
| SD Card Reader | |
| average JPG Copy Test (av. of 3 runs) | |
| Dell Latitude 15 E5570 | |
| Lenovo ThinkPad L560-20F10026GE | |
| Acer TravelMate P658-M-537B | |
| HP ProBook 650 G2-T9X61ET | |
| Toshiba Tecra Z50-C-10P | |
| maximum AS SSD Seq Read Test (1GB) | |
| HP ProBook 650 G2-T9X61ET | |
| Lenovo ThinkPad L560-20F10026GE | |
| Toshiba Tecra Z50-C-10P | |
| Networking | |
| Wi-Fi Client 1m | |
| Wi-Fi Server 1m |
| |||||||||||||||||||||||||
iluminação: 85 %
iluminação com acumulador: 247 cd/m²
Contraste: 405:1 (Preto: 0.61 cd/m²)
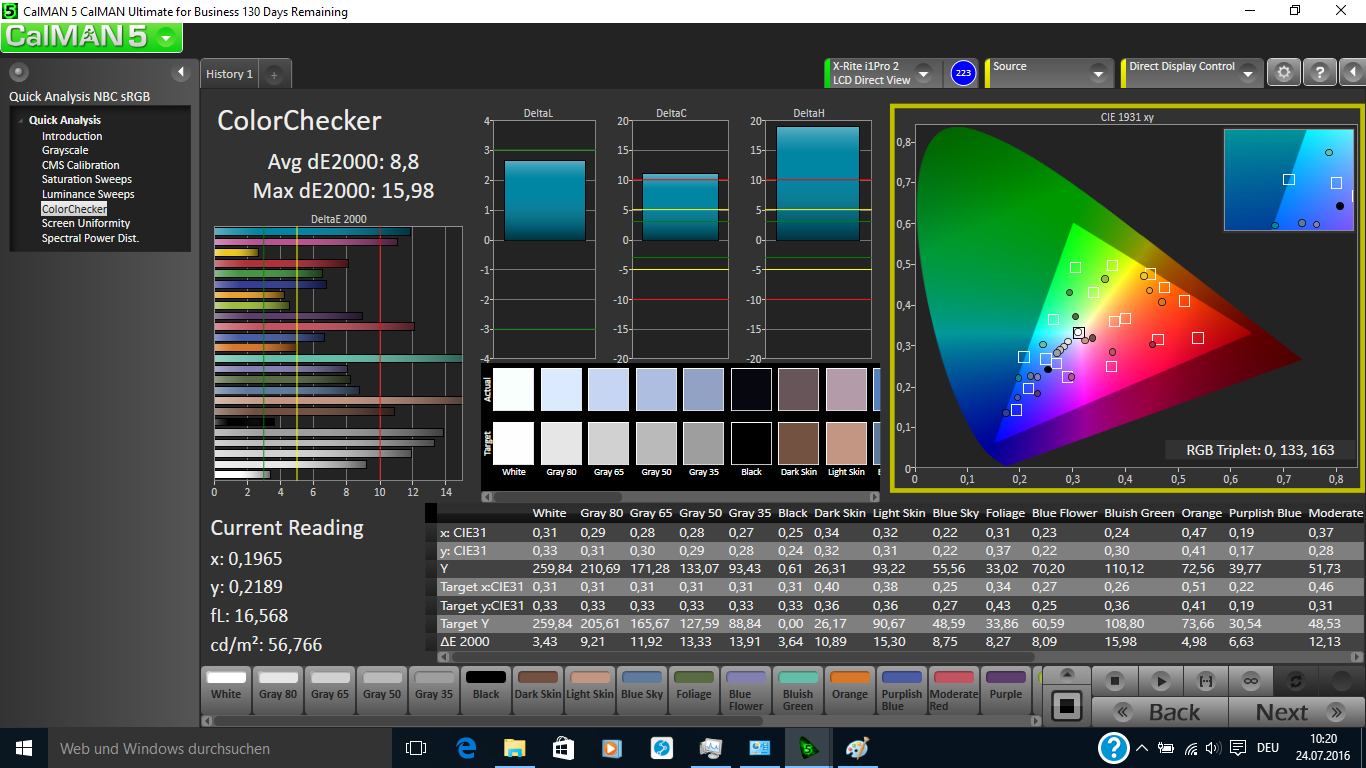
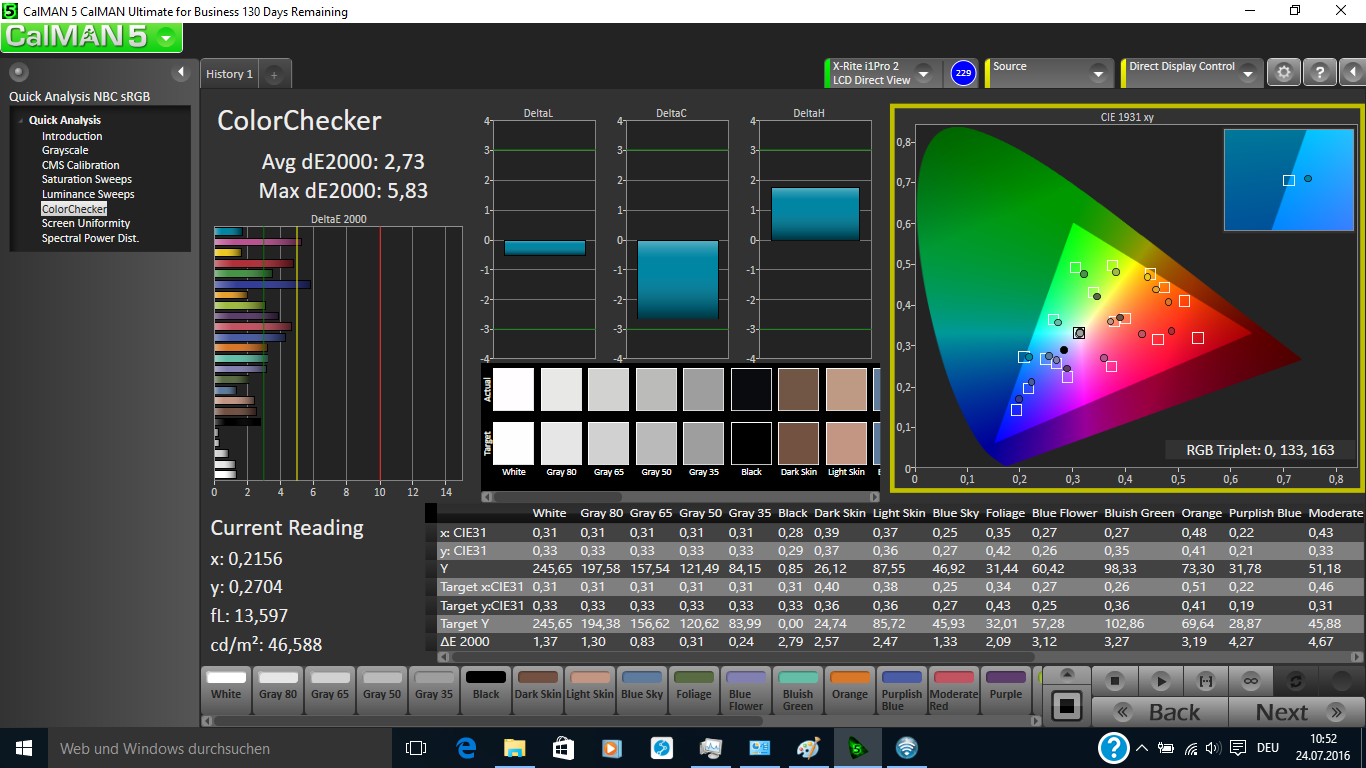
ΔE ColorChecker Calman: 8.8 | ∀{0.5-29.43 Ø4.73}
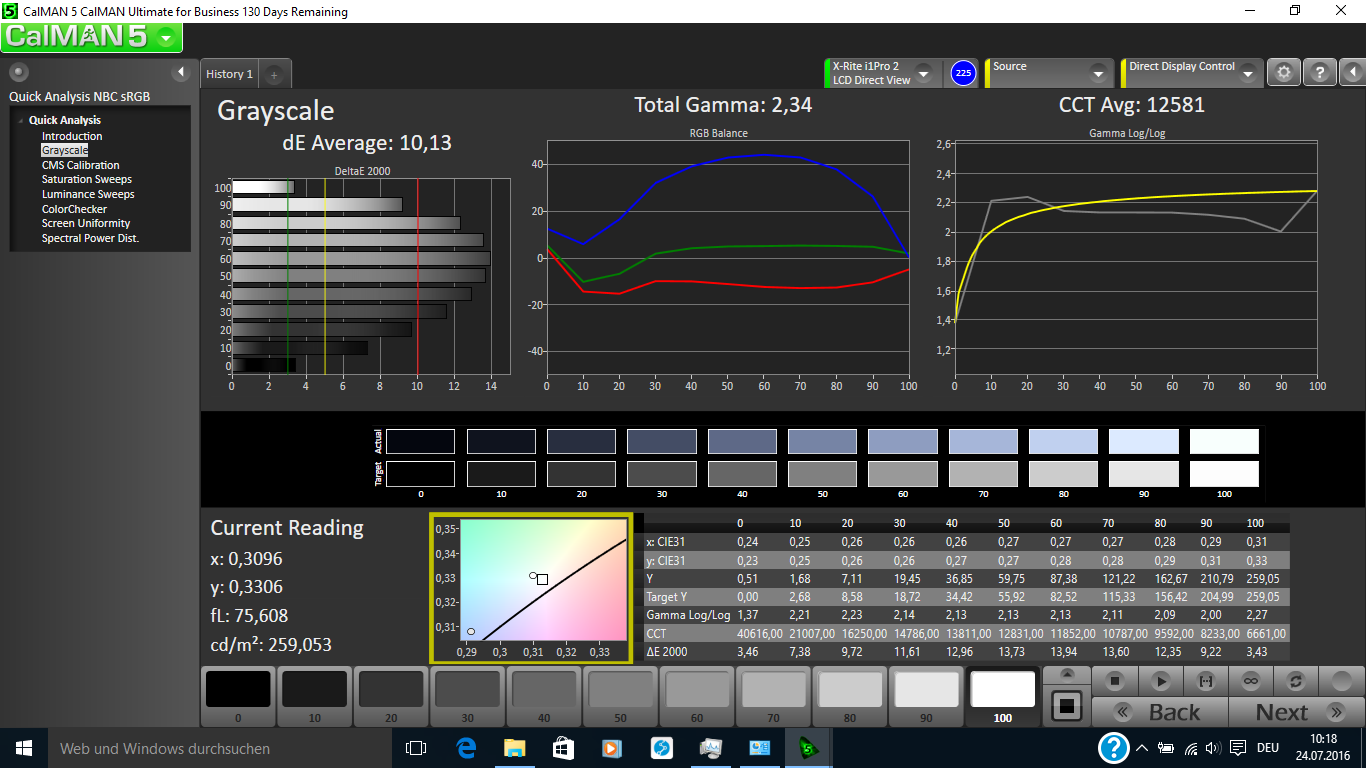
ΔE Greyscale Calman: 10.13 | ∀{0.09-98 Ø4.97}
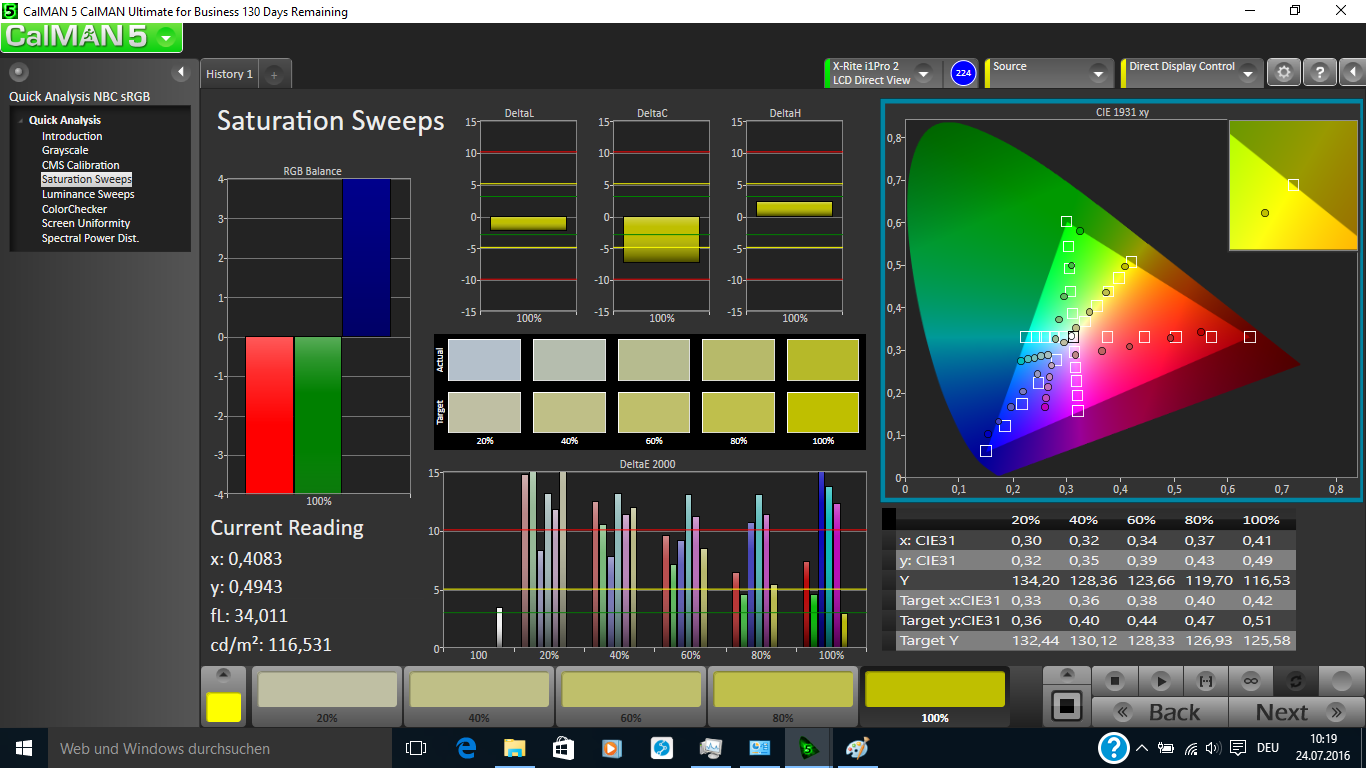
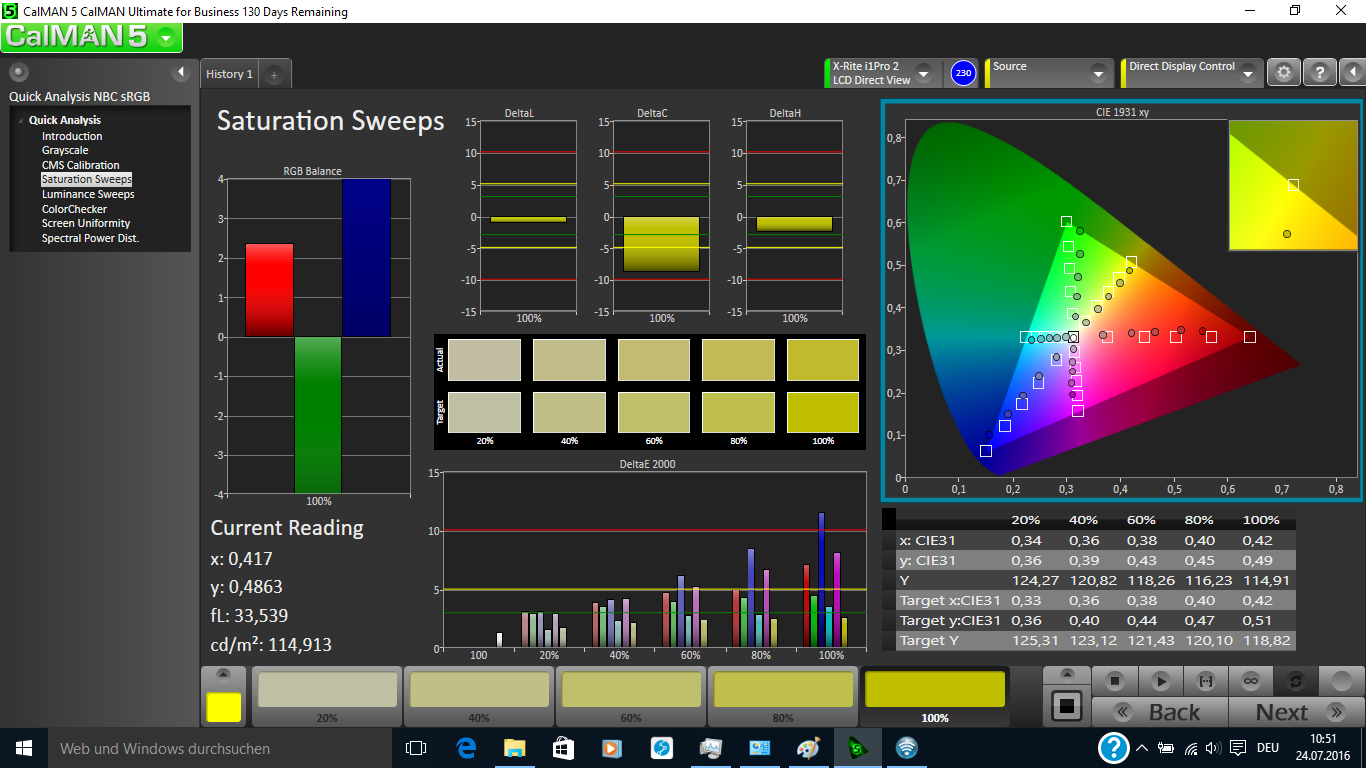
62.2% sRGB (Argyll 1.6.3 3D)
39.6% AdobeRGB 1998 (Argyll 1.6.3 3D)
43% AdobeRGB 1998 (Argyll 3D)
62.3% sRGB (Argyll 3D)
41.59% Display P3 (Argyll 3D)
Gamma: 2.34
CCT: 12581 K
| HP ProBook 650 G2-T9X61ET TN LED, 1366x768, 15.6" | Lenovo ThinkPad L560-20F10026GE AH-IPS, 1920x1080, 15.6" | Dell Latitude 15 E5570 TN LED, 1366x768, 15.6" | Toshiba Tecra Z50-C-10P IPS-Panel, 1920x1080, 15.6" | Acer TravelMate P658-M-537B IPS, 1920x1080, 15.6" | HP ProBook 650 G1 H5G74E TN LED, 1366x768, 15.6" | |
|---|---|---|---|---|---|---|
| Display | -6% | -3% | 46% | 48% | ||
| Display P3 Coverage (%) | 41.59 | 39 -6% | 40.48 -3% | 65.4 57% | 66.6 60% | |
| sRGB Coverage (%) | 62.3 | 58.3 -6% | 60.9 -2% | 84.6 36% | 85.7 38% | |
| AdobeRGB 1998 Coverage (%) | 43 | 40.33 -6% | 41.82 -3% | 61.8 44% | 62.8 46% | |
| Response Times | 8% | 0% | 35% | 14% | ||
| Response Time Grey 50% / Grey 80% * (ms) | 40.4 ? | 39.2 ? 3% | 47 ? -16% | 20 ? 50% | 38 ? 6% | |
| Response Time Black / White * (ms) | 32 ? | 28 ? 12% | 27 ? 16% | 26 ? 19% | 25 ? 22% | |
| PWM Frequency (Hz) | 200 ? | 50 ? | ||||
| Screen | 20% | -1% | 50% | 31% | -13% | |
| Brightness middle (cd/m²) | 247 | 262 6% | 228 -8% | 288 17% | 308 25% | 197 -20% |
| Brightness (cd/m²) | 223 | 250 12% | 236 6% | 277 24% | 319 43% | 186 -17% |
| Brightness Distribution (%) | 85 | 92 8% | 90 6% | 83 -2% | 71 -16% | 82 -4% |
| Black Level * (cd/m²) | 0.61 | 0.29 52% | 0.56 8% | 0.27 56% | 0.61 -0% | 0.63 -3% |
| Contrast (:1) | 405 | 903 123% | 407 0% | 1067 163% | 505 25% | 313 -23% |
| Colorchecker dE 2000 * | 8.8 | 8.49 4% | 10.02 -14% | 4.7 47% | 4.51 49% | 10.48 -19% |
| Colorchecker dE 2000 max. * | 15.98 | 17.99 -13% | 15.93 -0% | 11.7 27% | 10.19 36% | |
| Greyscale dE 2000 * | 10.13 | 8.11 20% | 10.66 -5% | 3.1 69% | 2.91 71% | 10.68 -5% |
| Gamma | 2.34 94% | 2.37 93% | 2.48 89% | 2.7 81% | 2.4 92% | 2.31 95% |
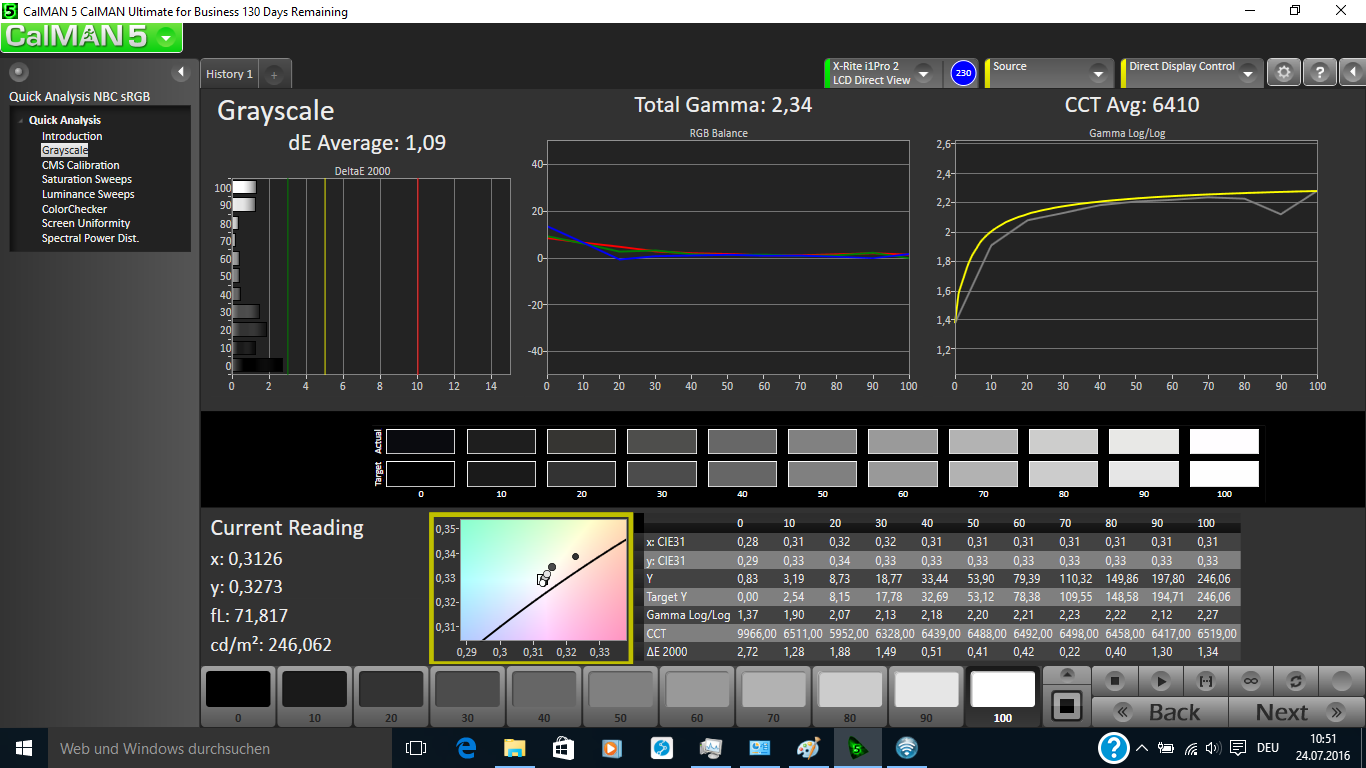
| CCT | 12581 52% | 6300 103% | 11800 55% | 6603 98% | 6740 96% | 12387 52% |
| Color Space (Percent of AdobeRGB 1998) (%) | 39.6 | 37.07 -6% | 39 -2% | 61.9 56% | 56 41% | 35.2 -11% |
| Color Space (Percent of sRGB) (%) | 62.2 | 57.94 -7% | 61 -2% | 90.3 45% | 86 38% | |
| Média Total (Programa/Configurações) | 7% /
13% | -1% /
-1% | 44% /
47% | 31% /
32% | -13% /
-13% |
* ... menor é melhor
Exibir tempos de resposta
| ↔ Tempo de resposta preto para branco | ||
|---|---|---|
| 32 ms ... ascensão ↗ e queda ↘ combinadas | ↗ 18.8 ms ascensão | 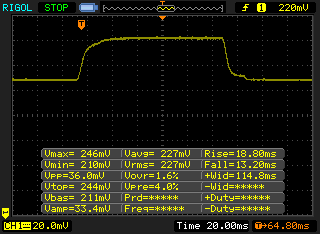 |
| ↘ 13.2 ms queda | ||
| A tela mostra taxas de resposta lentas em nossos testes e será insatisfatória para os jogadores. Em comparação, todos os dispositivos testados variam de 0.1 (mínimo) a 240 (máximo) ms. » 86 % de todos os dispositivos são melhores. Isso significa que o tempo de resposta medido é pior que a média de todos os dispositivos testados (19.9 ms). | ||
| ↔ Tempo de resposta 50% cinza a 80% cinza | ||
| 40.4 ms ... ascensão ↗ e queda ↘ combinadas | ↗ 19.6 ms ascensão | 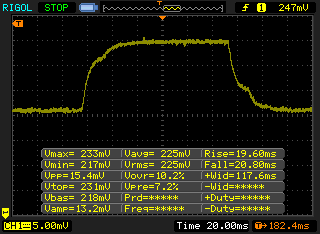 |
| ↘ 20.8 ms queda | ||
| A tela mostra taxas de resposta lentas em nossos testes e será insatisfatória para os jogadores. Em comparação, todos os dispositivos testados variam de 0.165 (mínimo) a 636 (máximo) ms. » 63 % de todos os dispositivos são melhores. Isso significa que o tempo de resposta medido é pior que a média de todos os dispositivos testados (31.1 ms). | ||
Cintilação da tela / PWM (modulação por largura de pulso)
| Tela tremeluzindo/PWM detectado | 200 Hz | ≤ 90 % configuração de brilho | 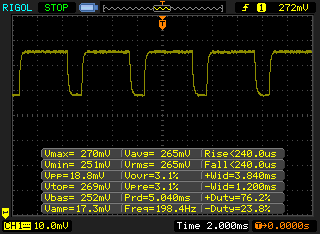 |
A luz de fundo da tela pisca em 200 Hz (pior caso, por exemplo, utilizando PWM) Cintilação detectada em uma configuração de brilho de 90 % e abaixo. Não deve haver cintilação ou PWM acima desta configuração de brilho. A frequência de 200 Hz é relativamente baixa, portanto, usuários sensíveis provavelmente notarão cintilação e sentirão fadiga ocular na configuração de brilho indicada e abaixo. [pwm_comparison] Em comparação: 52 % de todos os dispositivos testados não usam PWM para escurecer a tela. Se PWM foi detectado, uma média de 7798 (mínimo: 5 - máximo: 343500) Hz foi medida. | |||
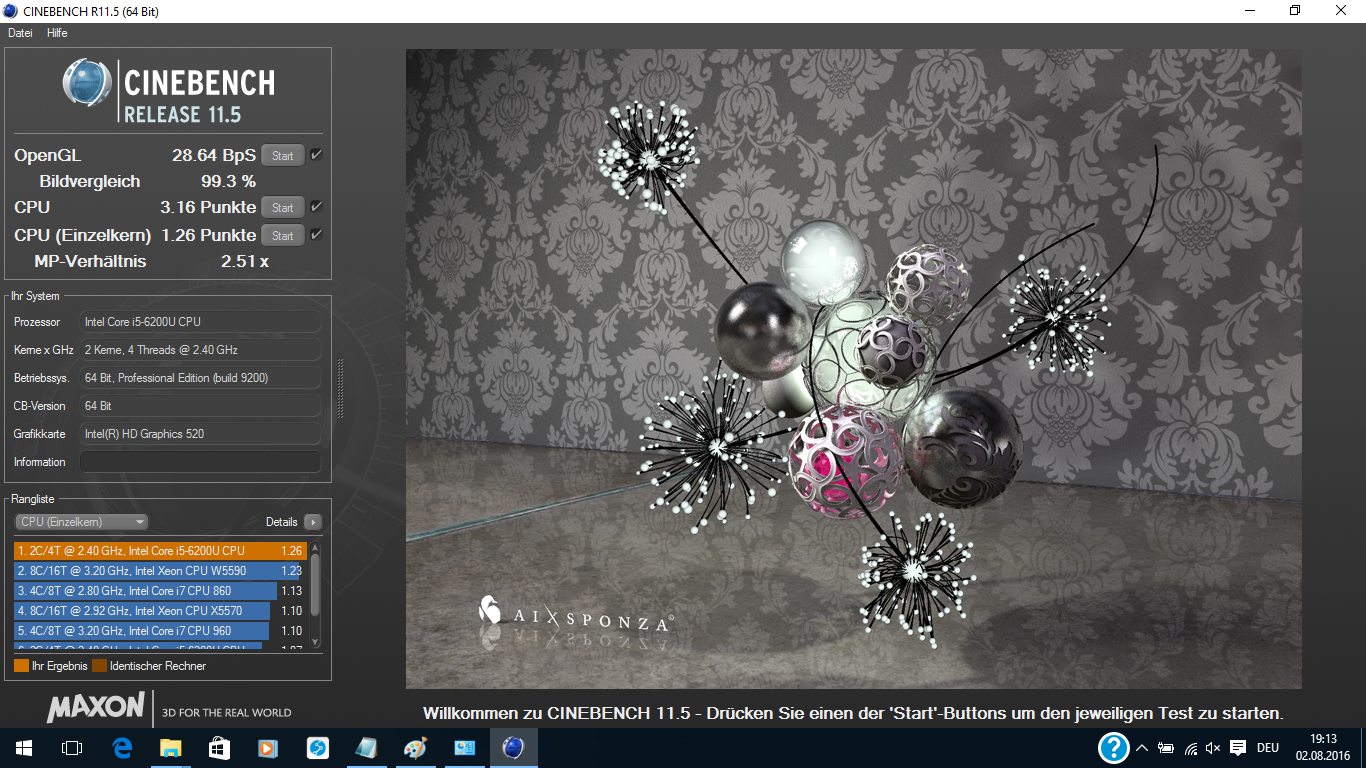
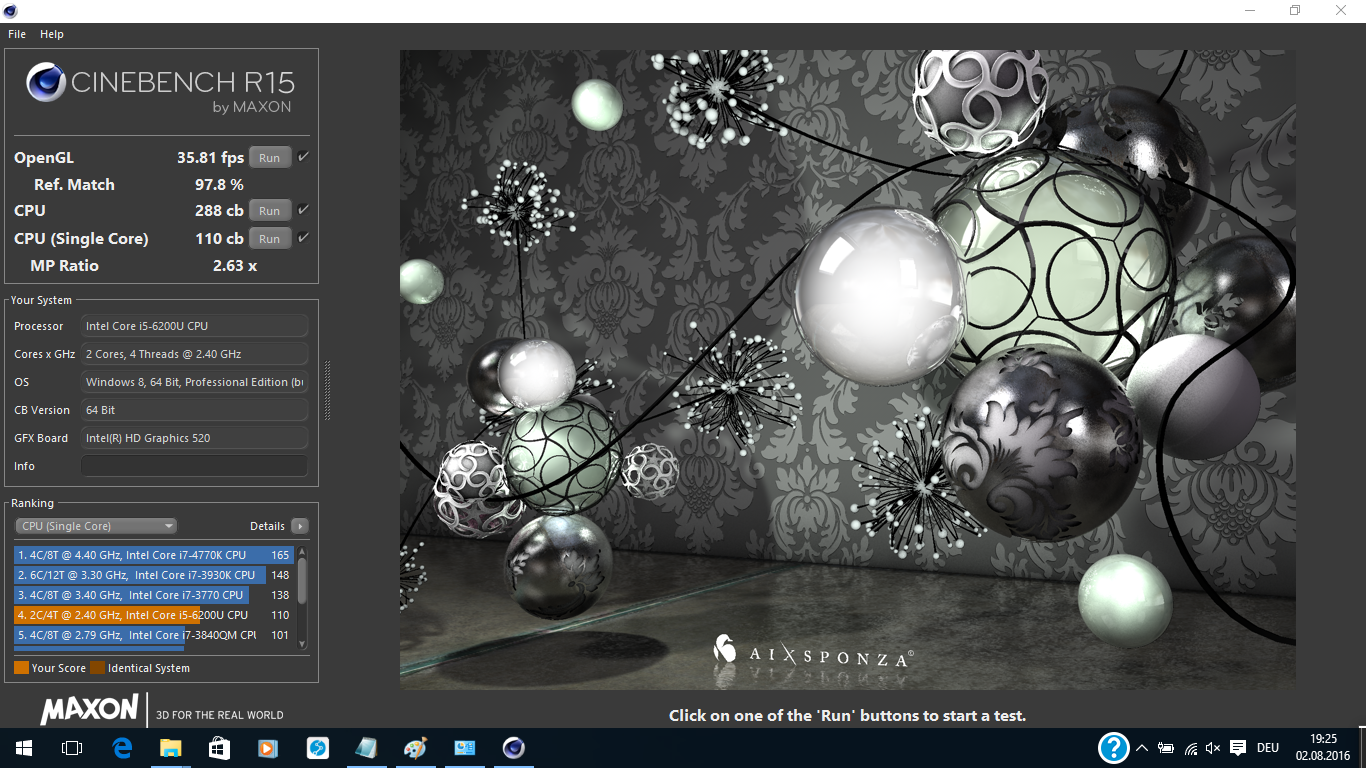
| Cinebench R15 | |
| CPU Single 64Bit | |
| Dell Latitude 15 E5570 | |
| Lenovo ThinkPad L560-20F10026GE | |
| HP ProBook 650 G2-T9X61ET | |
| Toshiba Tecra Z50-C-10P | |
| HP ProBook 650 G1 H5G74E | |
| Acer TravelMate P658-M-537B | |
| CPU Multi 64Bit | |
| Dell Latitude 15 E5570 | |
| Lenovo ThinkPad L560-20F10026GE | |
| HP ProBook 650 G2-T9X61ET | |
| Toshiba Tecra Z50-C-10P | |
| HP ProBook 650 G1 H5G74E | |
| Acer TravelMate P658-M-537B | |
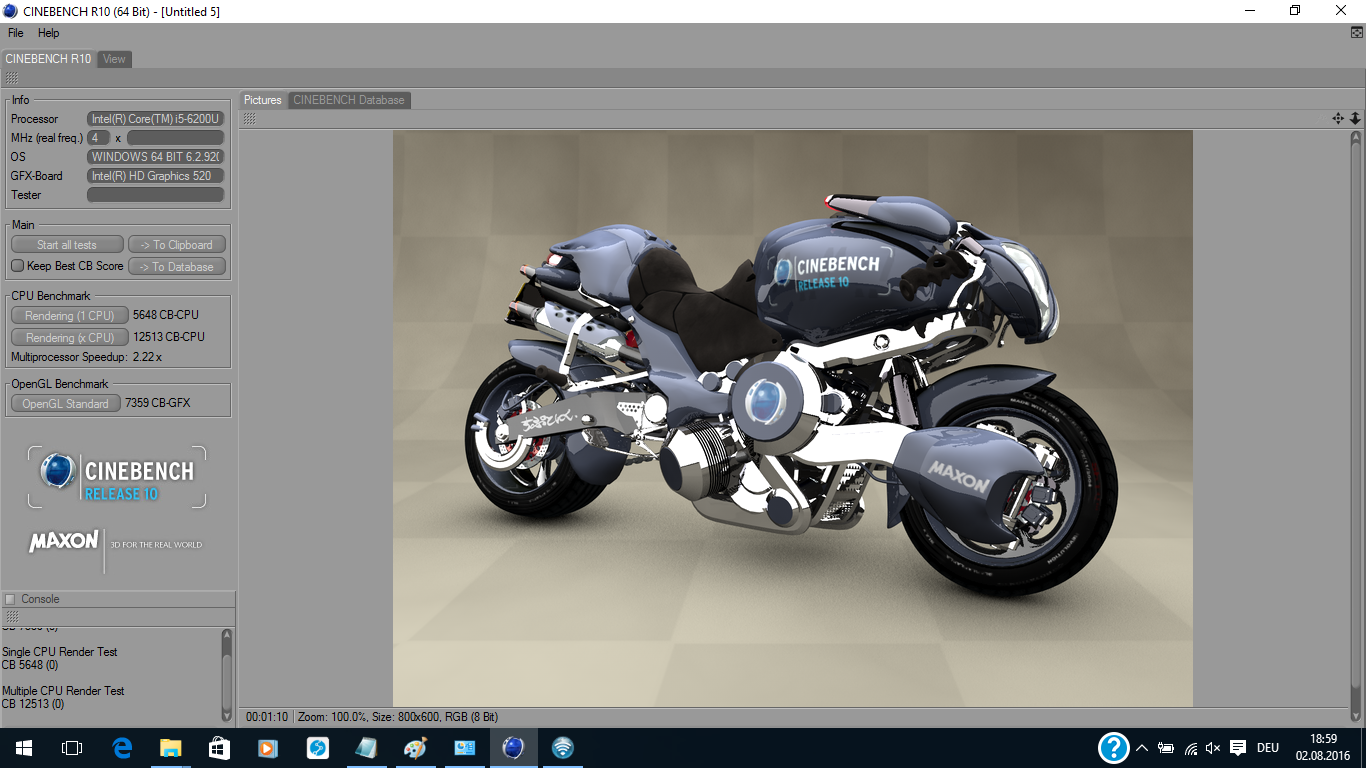
| Cinebench R10 | |
| Rendering Single CPUs 64Bit | |
| HP ProBook 650 G2-T9X61ET | |
| Lenovo ThinkPad L560-20F10026GE | |
| HP ProBook 650 G1 H5G74E | |
| Rendering Multiple CPUs 64Bit | |
| Lenovo ThinkPad L560-20F10026GE | |
| HP ProBook 650 G2-T9X61ET | |
| HP ProBook 650 G1 H5G74E | |
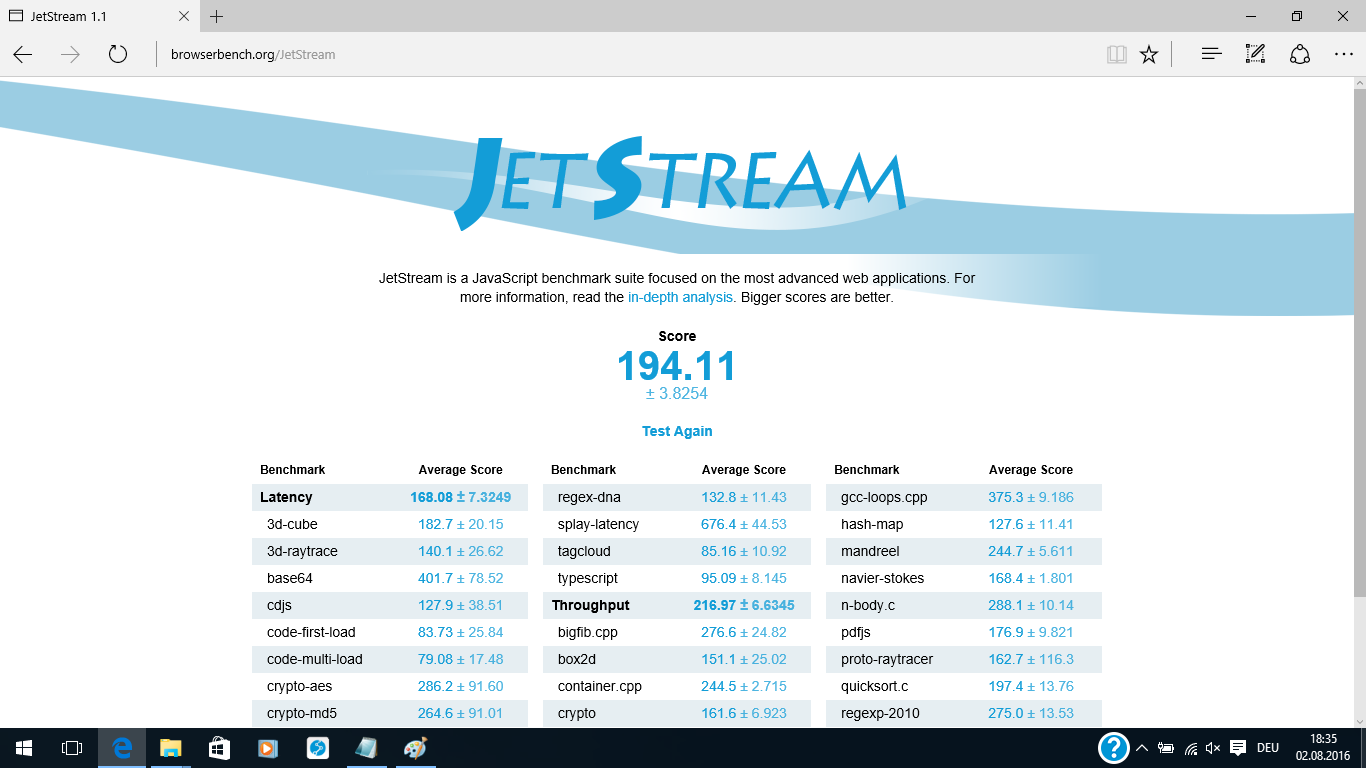
| JetStream 1.1 - 1.1 Total | |
| HP ProBook 650 G2-T9X61ET | |
| Dell Latitude 15 E5570 | |
| Lenovo ThinkPad L560-20F10026GE | |
| Toshiba Tecra Z50-C-10P | |
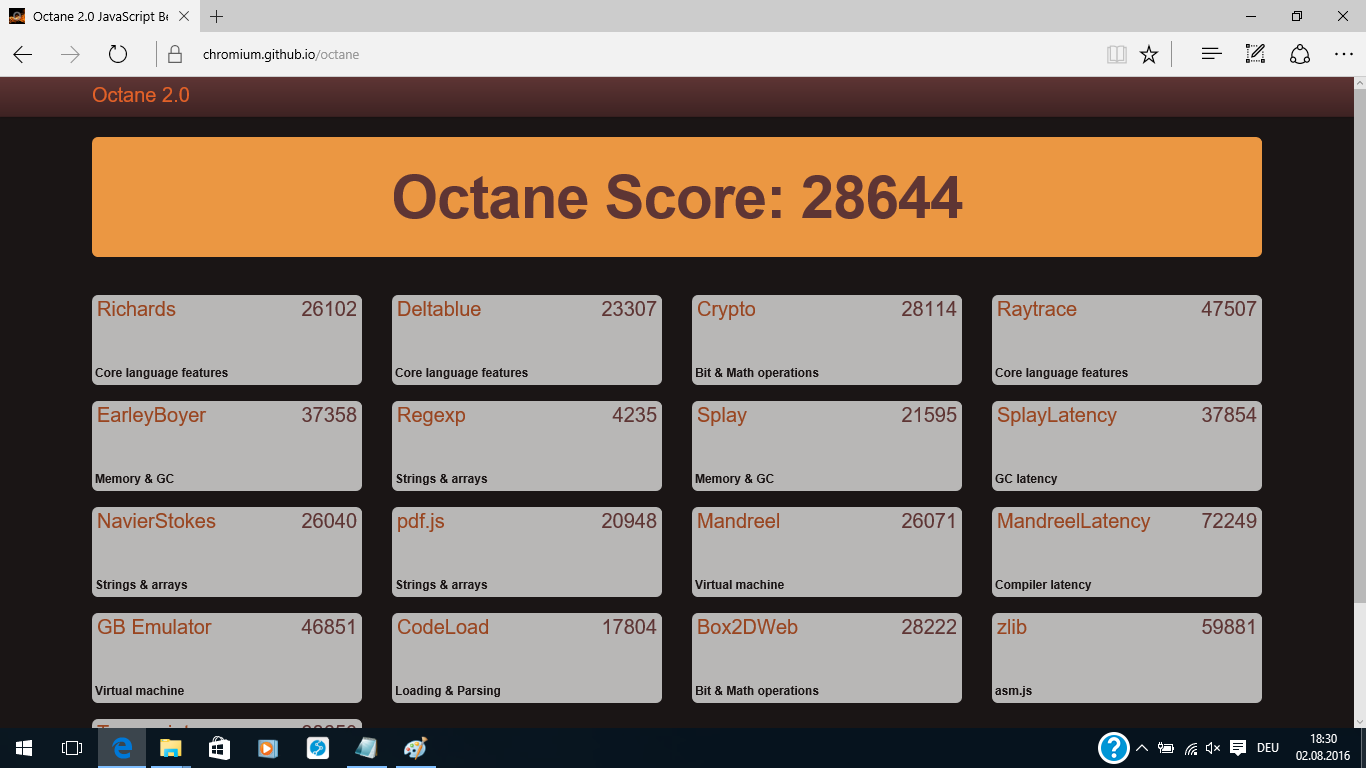
| Octane V2 - Total Score | |
| HP ProBook 650 G2-T9X61ET | |
| Dell Latitude 15 E5570 | |
| Lenovo ThinkPad L560-20F10026GE | |
| Acer TravelMate P658-M-537B | |
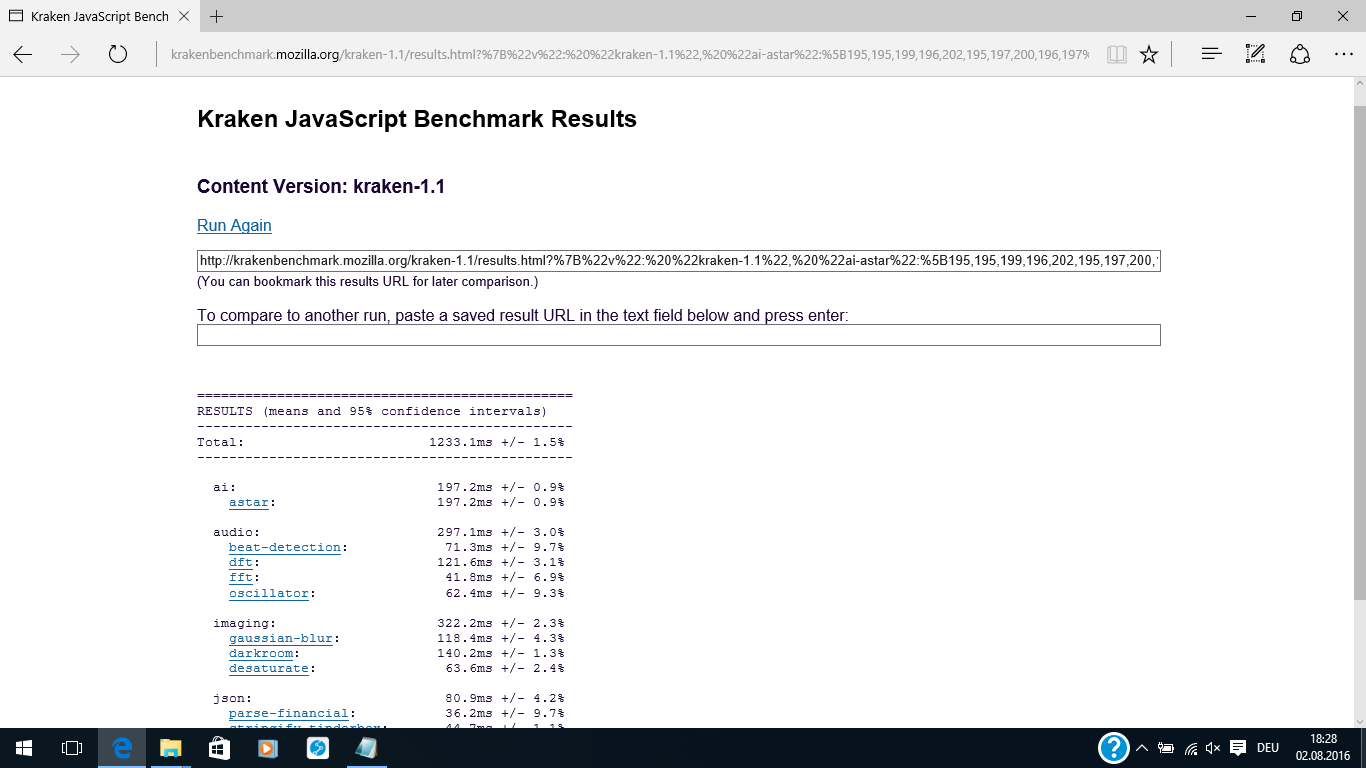
| Mozilla Kraken 1.1 - Total | |
| Acer TravelMate P658-M-537B | |
| Lenovo ThinkPad L560-20F10026GE | |
| Dell Latitude 15 E5570 | |
| HP ProBook 650 G2-T9X61ET | |
* ... menor é melhor
| PCMark 8 | |
| Home Score Accelerated v2 | |
| Acer TravelMate P658-M-537B | |
| Dell Latitude 15 E5570 | |
| HP ProBook 650 G2-T9X61ET | |
| Toshiba Tecra Z50-C-10P | |
| Lenovo ThinkPad L560-20F10026GE | |
| Work Score Accelerated v2 | |
| Acer TravelMate P658-M-537B | |
| Dell Latitude 15 E5570 | |
| HP ProBook 650 G2-T9X61ET | |
| Lenovo ThinkPad L560-20F10026GE | |
| Toshiba Tecra Z50-C-10P | |
| Creative Score Accelerated v2 | |
| HP ProBook 650 G2-T9X61ET | |
| Dell Latitude 15 E5570 | |
| Lenovo ThinkPad L560-20F10026GE | |
| PCMark Vantage Result | 8328 pontos | |
| PCMark 7 Score | 2988 pontos | |
| PCMark 8 Home Score Accelerated v2 | 3229 pontos | |
| PCMark 8 Creative Score Accelerated v2 | 3649 pontos | |
| PCMark 8 Work Score Accelerated v2 | 4191 pontos | |
Ajuda | ||
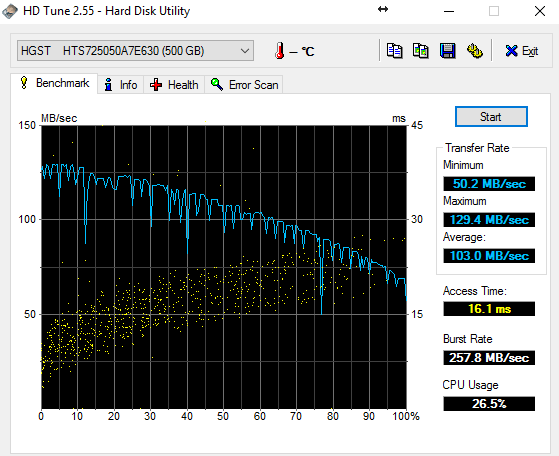
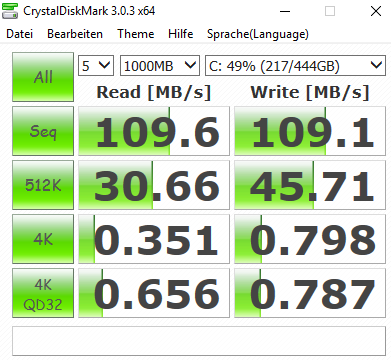
| HP ProBook 650 G2-T9X61ET Hitachi Travelstar Z7K500 HTS725050A7E630 | Lenovo ThinkPad L560-20F10026GE WDC Slim WD10SPCX-21KHST0 | Dell Latitude 15 E5570 Samsung SSD PM871 MZ7LN128HCHP | Toshiba Tecra Z50-C-10P Toshiba HG6 THNSNJ256G8NU | Acer TravelMate P658-M-537B Kingston RBU-SNS8152S3256GG2 | |
|---|---|---|---|---|---|
| CrystalDiskMark 3.0 | 33% | 11784% | 3372% | 9846% | |
| Read Seq (MB/s) | 109.6 | 113.6 4% | 474.7 333% | 512 367% | 479.1 337% |
| Write Seq (MB/s) | 109.1 | 111.7 2% | 155 42% | 415.8 281% | 333.1 205% |
| Read 512 (MB/s) | 30.66 | 39.65 29% | 393.6 1184% | 404.4 1219% | 418 1263% |
| Write 512 (MB/s) | 45.71 | 55.3 21% | 119.7 162% | 382.2 736% | 320.5 601% |
| Read 4k (MB/s) | 0.351 | 0.488 39% | 34 9587% | 24.05 6752% | 25.66 7211% |
| Write 4k (MB/s) | 0.798 | 1.022 28% | 96.6 12005% | 87.6 10877% | 64.7 8008% |
| Read 4k QD32 (MB/s) | 0.656 | 1.367 108% | 383.3 58330% | 226.2 34382% | |
| Write 4k QD32 (MB/s) | 0.787 | 1.036 32% | 100.2 12632% | 211.4 26761% |

| 3DMark | |
| 1280x720 Cloud Gate Standard Graphics | |
| Acer TravelMate P658-M-537B | |
| Dell Latitude 15 E5570 | |
| HP ProBook 650 G2-T9X61ET | |
| Lenovo ThinkPad L560-20F10026GE | |
| Toshiba Tecra Z50-C-10P | |
| HP ProBook 650 G1 H5G74E | |
| 1920x1080 Fire Strike Graphics | |
| Dell Latitude 15 E5570 | |
| HP ProBook 650 G2-T9X61ET | |
| Lenovo ThinkPad L560-20F10026GE | |
| Toshiba Tecra Z50-C-10P | |
| HP ProBook 650 G1 H5G74E | |
| 1280x720 Ice Storm Standard Score | |
| Acer TravelMate P658-M-537B | |
| Dell Latitude 15 E5570 | |
| HP ProBook 650 G2-T9X61ET | |
| Lenovo ThinkPad L560-20F10026GE | |
| HP ProBook 650 G1 H5G74E | |
| Toshiba Tecra Z50-C-10P | |
| 3DMark 11 | |
| 1280x720 Performance GPU | |
| Acer TravelMate P658-M-537B | |
| HP ProBook 650 G2-T9X61ET | |
| Dell Latitude 15 E5570 | |
| Lenovo ThinkPad L560-20F10026GE | |
| Toshiba Tecra Z50-C-10P | |
| HP ProBook 650 G1 H5G74E | |
| 1280x720 Performance | |
| Acer TravelMate P658-M-537B | |
| Dell Latitude 15 E5570 | |
| HP ProBook 650 G2-T9X61ET | |
| Lenovo ThinkPad L560-20F10026GE | |
| Toshiba Tecra Z50-C-10P | |
| HP ProBook 650 G1 H5G74E | |
| 3DMark 06 - 1280x1024 Standard Score AA:0x AF:0x | |
| HP ProBook 650 G2-T9X61ET | |
| HP ProBook 650 G1 H5G74E | |
| 3DMark 2001SE Standard | 20229 pontos | |
| 3DMark 03 Standard | 15594 pontos | |
| 3DMark 05 Standard | 11700 pontos | |
| 3DMark 06 Standard Score | 8423 pontos | |
| 3DMark 11 Performance | 1414 pontos | |
| 3DMark Ice Storm Standard Score | 47002 pontos | |
| 3DMark Cloud Gate Standard Score | 5045 pontos | |
| 3DMark Fire Strike Score | 677 pontos | |
| 3DMark Fire Strike Extreme Score | 317 pontos | |
Ajuda | ||
| baixo | média | alto | ultra | |
|---|---|---|---|---|
| BioShock Infinite (2013) | 36.4 | 22.3 | 18.5 | |
| Battlefield 4 (2013) | 35.1 | 27.6 | 16.7 | |
| Rise of the Tomb Raider (2016) | 13.5 | 10.1 |
Barulho
| Ocioso |
| 30.9 / 30.9 / 31.3 dB |
| HDD |
| 30.9 dB |
| Carga |
| 33.8 / 36.7 dB |
 | ||
30 dB silencioso 40 dB(A) audível 50 dB(A) ruidosamente alto |
||
min: | ||
| HP ProBook 650 G2-T9X61ET 6200U, HD Graphics 520, Hitachi Travelstar Z7K500 HTS725050A7E630 | Lenovo ThinkPad L560-20F10026GE 6200U, HD Graphics 520, WDC Slim WD10SPCX-21KHST0 | Dell Latitude 15 E5570 6300U, HD Graphics 520, Samsung SSD PM871 MZ7LN128HCHP | Toshiba Tecra Z50-C-10P 6200U, HD Graphics 520, Toshiba HG6 THNSNJ256G8NU | Acer TravelMate P658-M-537B 6200U, HD Graphics 520, Kingston RBU-SNS8152S3256GG2 | HP ProBook 650 G1 H5G74E 4000M, HD Graphics 4600, Hitachi Travelstar Z7K500 HTS725050A7E630 | |
|---|---|---|---|---|---|---|
| Noise | 3% | -5% | -2% | -9% | -2% | |
| desligado / ambiente * (dB) | 29 | 29.4 -1% | 31.2 -8% | 31.2 -8% | 31.2 -8% | |
| Idle Minimum * (dB) | 30.9 | 30.1 3% | 31.2 -1% | 32.4 -5% | 32.5 -5% | 31.6 -2% |
| Idle Average * (dB) | 30.9 | 30.1 3% | 33.2 -7% | 32.4 -5% | 32.5 -5% | 31.6 -2% |
| Idle Maximum * (dB) | 31.3 | 30.1 4% | 34.3 -10% | 32.4 -4% | 35 -12% | 31.6 -1% |
| Load Average * (dB) | 33.8 | 33.4 1% | 36.6 -8% | 33.5 1% | 42 -24% | 35.6 -5% |
| Load Maximum * (dB) | 36.7 | 34.7 5% | 34.7 5% | 33.5 9% | 37.5 -2% | 36.7 -0% |
* ... menor é melhor
(+) A temperatura máxima no lado superior é 37.4 °C / 99 F, em comparação com a média de 34.3 °C / 94 F , variando de 21.2 a 62.5 °C para a classe Office.
(+) A parte inferior aquece até um máximo de 38.3 °C / 101 F, em comparação com a média de 36.8 °C / 98 F
(+) Em uso inativo, a temperatura média para o lado superior é 28.3 °C / 83 F, em comparação com a média do dispositivo de 29.5 °C / ### class_avg_f### F.
(+) Os apoios para as mãos e o touchpad são mais frios que a temperatura da pele, com um máximo de 29 °C / 84.2 F e, portanto, são frios ao toque.
(±) A temperatura média da área do apoio para as mãos de dispositivos semelhantes foi 27.5 °C / 81.5 F (-1.5 °C / -2.7 F).
| HP ProBook 650 G2-T9X61ET | Lenovo ThinkPad L560-20F10026GE | Dell Latitude 15 E5570 | Toshiba Tecra Z50-C-10P | Acer TravelMate P658-M-537B | HP ProBook 650 G1 H5G74E | |
|---|---|---|---|---|---|---|
| Heat | ||||||
| Maximum Upper Side * (°C) | 37.4 | 37.2 1% | 37.3 -0% | 36 4% | 35.2 6% | 32.7 13% |
| Maximum Bottom * (°C) | 38.3 | 36 6% | 41.5 -8% | 50 -31% | 38 1% | 46.1 -20% |
| Idle Upper Side * (°C) | 30.1 | 30.7 -2% | 34.2 -14% | 23.9 21% | 29.5 2% | 27.7 8% |
| Idle Bottom * (°C) | 31.1 | 32.8 -5% | 38.8 -25% | 23.8 23% | 29 7% | 30.5 2% |
* ... menor é melhor
| desligado | |
| Ocioso | |
| Carga |
|
Key:
min: | |
| HP ProBook 650 G2-T9X61ET 6200U, HD Graphics 520, Hitachi Travelstar Z7K500 HTS725050A7E630, TN LED, 1366x768, 15.6" | Lenovo ThinkPad L560-20F10026GE 6200U, HD Graphics 520, WDC Slim WD10SPCX-21KHST0, AH-IPS, 1920x1080, 15.6" | Dell Latitude 15 E5570 6300U, HD Graphics 520, Samsung SSD PM871 MZ7LN128HCHP, TN LED, 1366x768, 15.6" | Toshiba Tecra Z50-C-10P 6200U, HD Graphics 520, Toshiba HG6 THNSNJ256G8NU, IPS-Panel, 1920x1080, 15.6" | Acer TravelMate P658-M-537B 6200U, HD Graphics 520, Kingston RBU-SNS8152S3256GG2, IPS, 1920x1080, 15.6" | HP ProBook 650 G1 H5G74E 4000M, HD Graphics 4600, Hitachi Travelstar Z7K500 HTS725050A7E630, TN LED, 1366x768, 15.6" | |
|---|---|---|---|---|---|---|
| Power Consumption | -8% | -3% | -11% | -40% | -21% | |
| Idle Minimum * (Watt) | 4.6 | 5 -9% | 4.5 2% | 4.7 -2% | 6.6 -43% | 4.6 -0% |
| Idle Average * (Watt) | 6.8 | 7.9 -16% | 7.6 -12% | 8 -18% | 10.4 -53% | 8.2 -21% |
| Idle Maximum * (Watt) | 7.5 | 8.6 -15% | 8.7 -16% | 9.8 -31% | 12.7 -69% | 9.4 -25% |
| Load Average * (Watt) | 26.3 | 27.5 -5% | 28.5 -8% | 29.7 -13% | 36 -37% | 37.1 -41% |
| Load Maximum * (Watt) | 35.1 | 33.7 4% | 29.2 17% | 32.6 7% | 35 -0% | 41.5 -18% |
* ... menor é melhor
| HP ProBook 650 G2-T9X61ET 6200U, HD Graphics 520, 48 Wh | Lenovo ThinkPad L560-20F10026GE 6200U, HD Graphics 520, 48 Wh | Dell Latitude 15 E5570 6300U, HD Graphics 520, 62 Wh | Toshiba Tecra Z50-C-10P 6200U, HD Graphics 520, 44 Wh | Acer TravelMate P658-M-537B 6200U, HD Graphics 520, 55 Wh | HP ProBook 650 G1 H5G74E 4000M, HD Graphics 4600, 55 Wh | |
|---|---|---|---|---|---|---|
| Duração da bateria | -15% | 43% | -13% | 8% | -35% | |
| Reader / Idle (h) | 11.5 | 11.6 1% | 20.5 78% | 14 22% | 7.7 -33% | |
| H.264 (h) | 6.4 | 4.6 -28% | 9.5 48% | |||
| WiFi v1.3 (h) | 6.8 | 6.8 0% | 10.5 54% | 5.9 -13% | 8.5 25% | |
| Load (h) | 2.7 | 1.8 -33% | 2.5 -7% | 2.1 -22% | 1.7 -37% | |
| WiFi (h) | 5.3 |
Pro
Contra
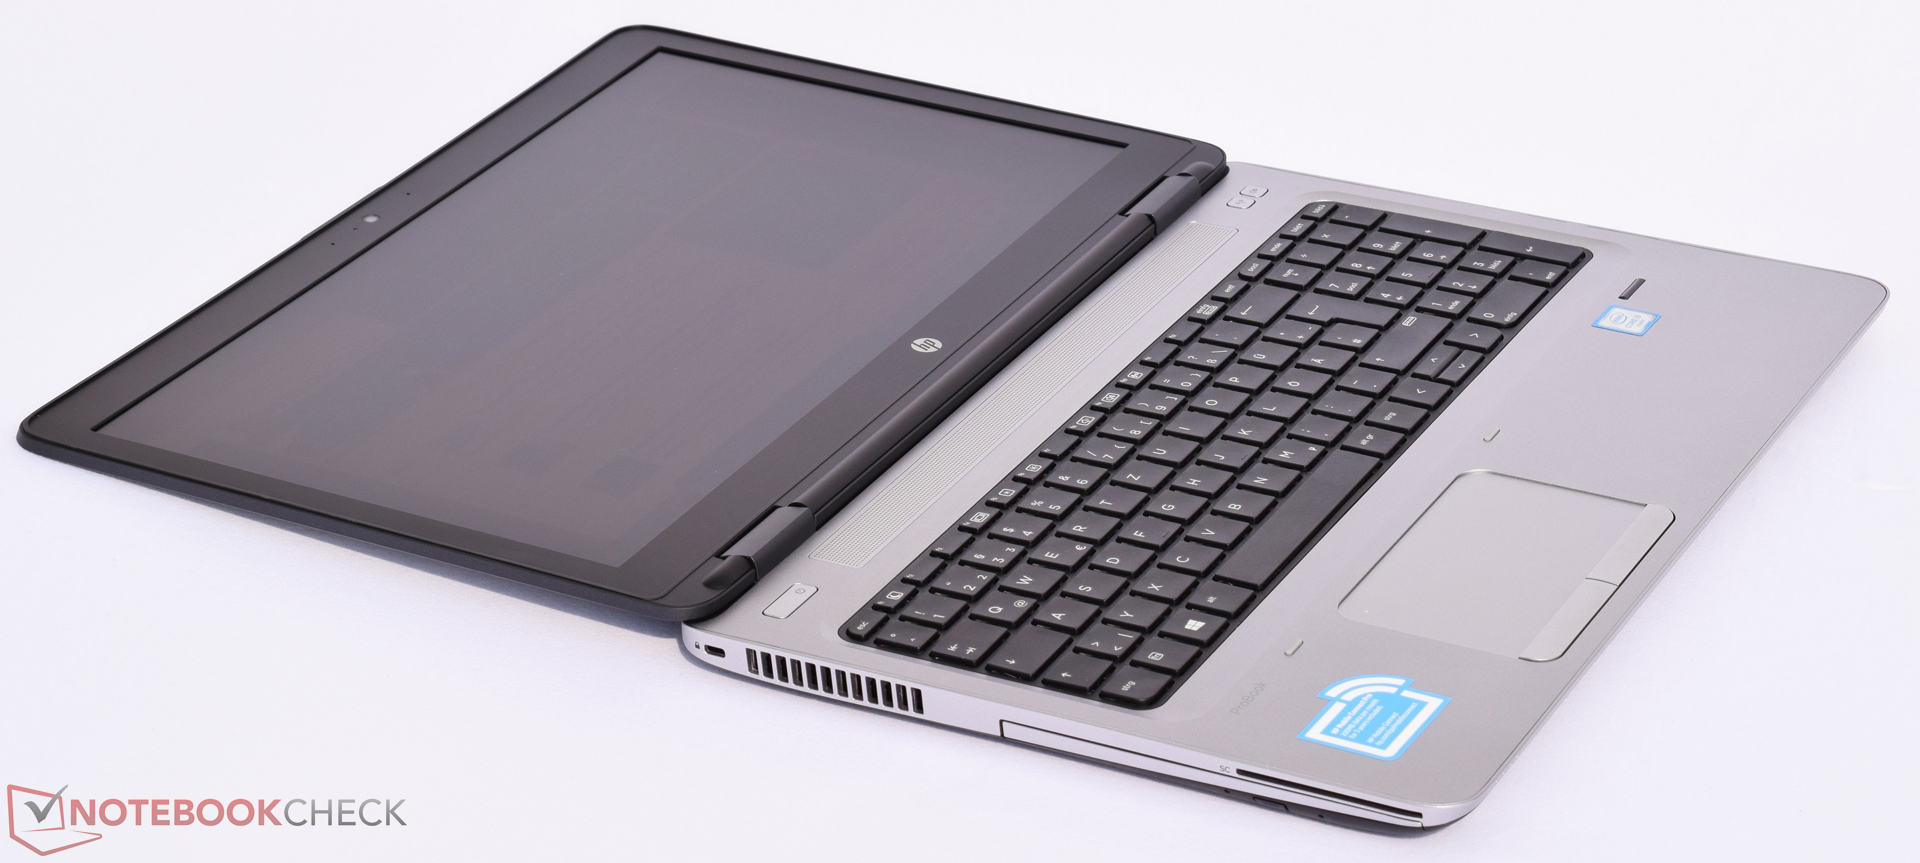
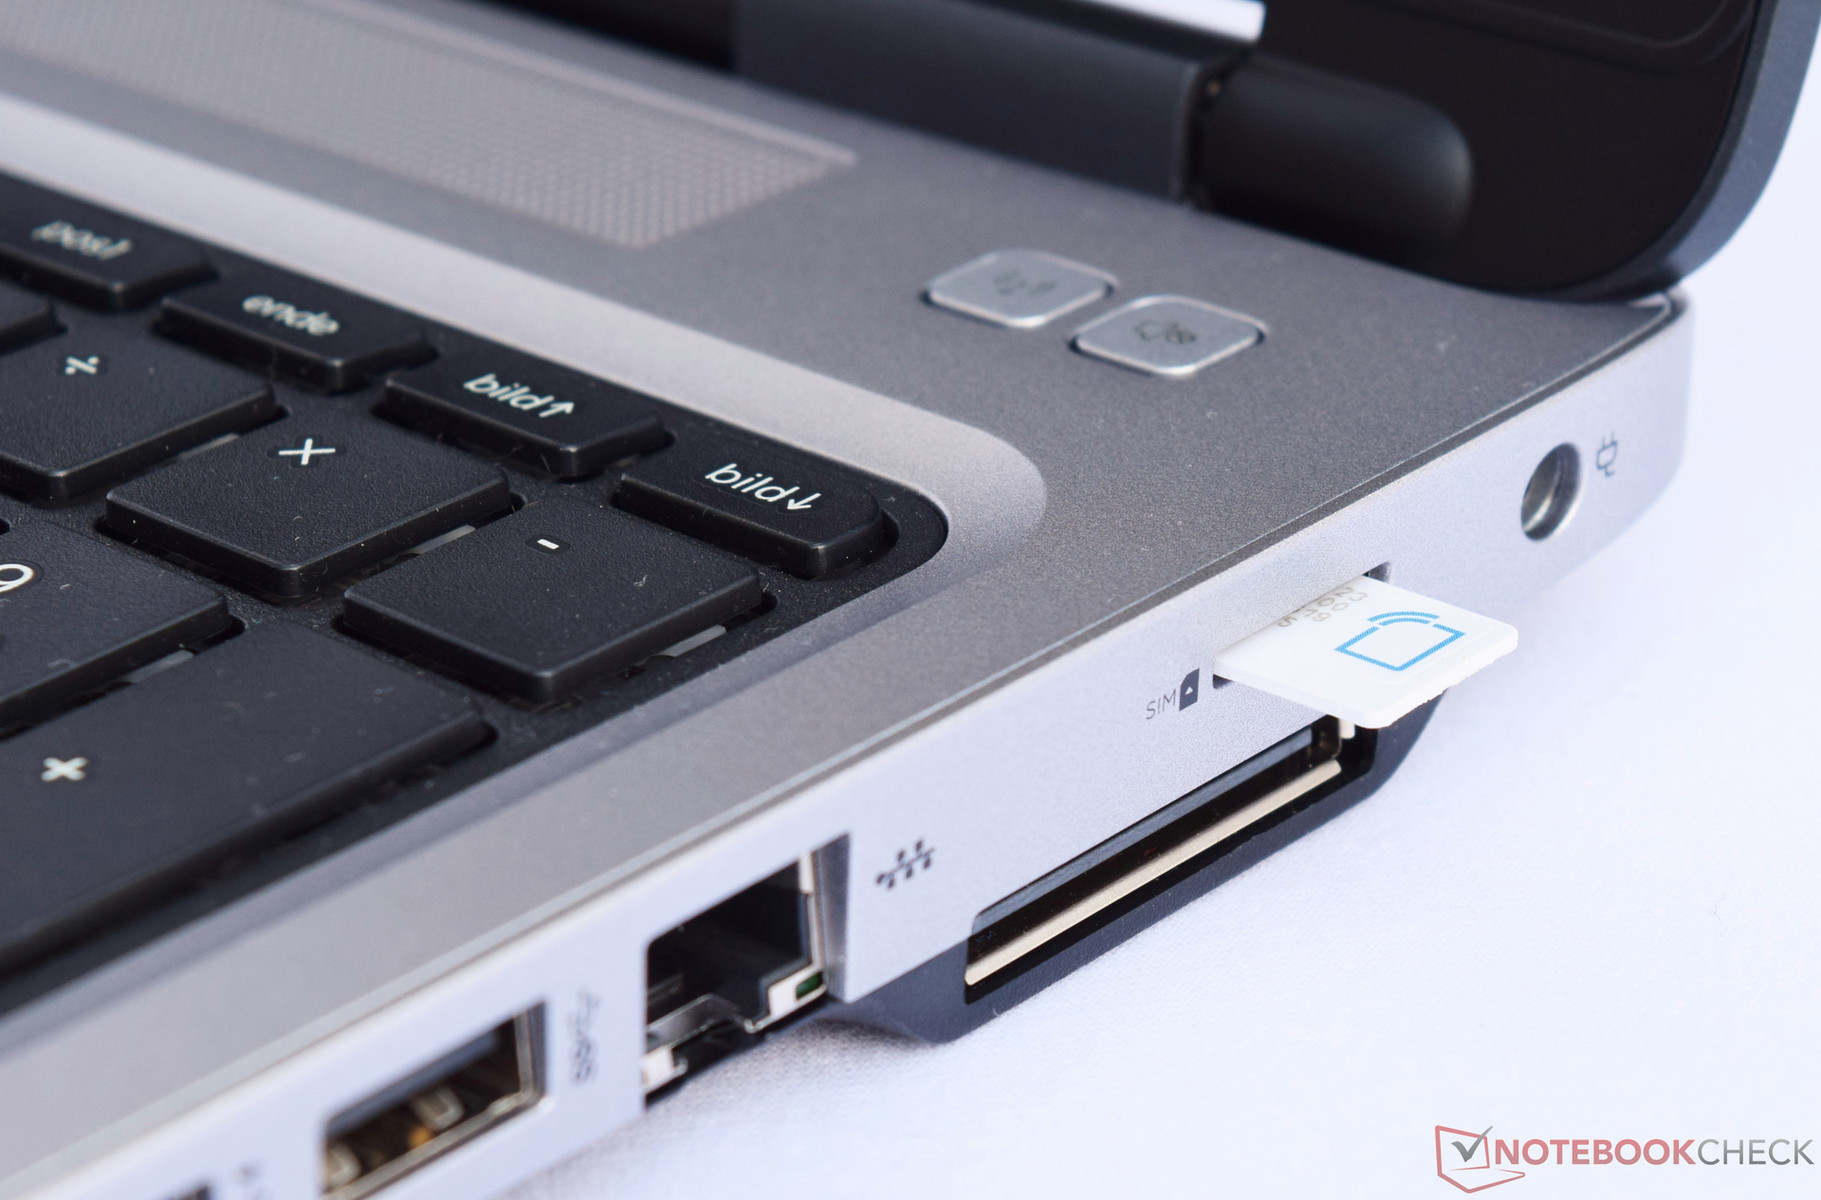
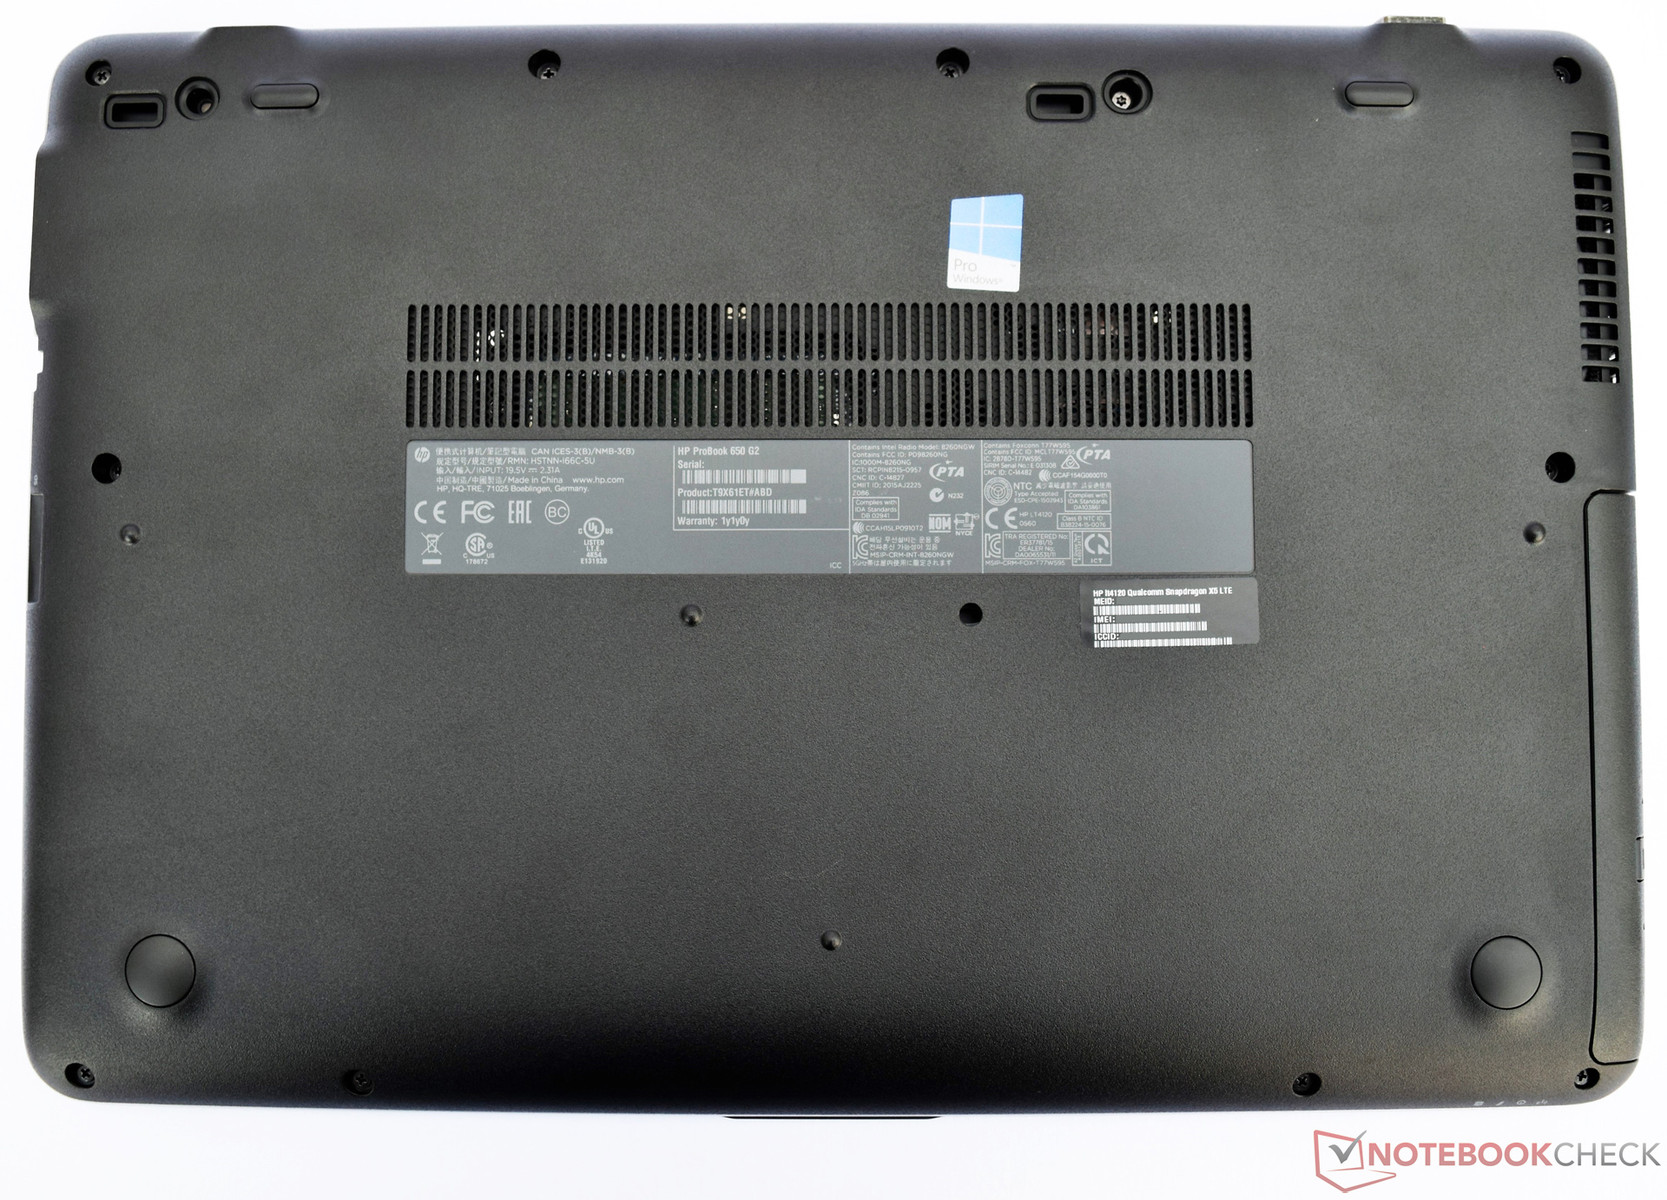
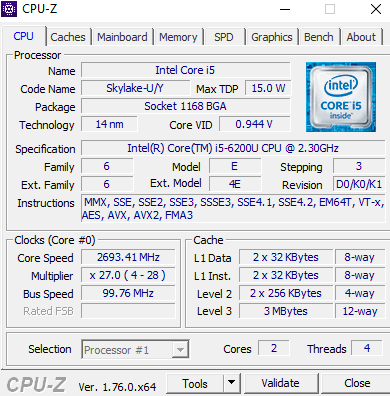
Depois de dois anos, a Hewlett Packard apresenta o sucessor do HP ProBook 650 G1 - HP ProBook 650 G2. O duradouro, portátil empresarial de 15-polegadas que testamos é vendido por 1150 Euros (~$1303). Por este preço, o comprador recebe um aparelho que consegue lidar com os requisitos típico de escritório. A HP implementou recursos de segurança comuns e equipou o nosso modelo de teste com um modem LTE. O pulo de uma CPU Haswell para uma moderna arquitetura Skylake ilustra claramente os avanços técnicos dos anos recentes. Isto se torna obvio no consumo de energia que consequentemente leva a uma boa duração da bateria.
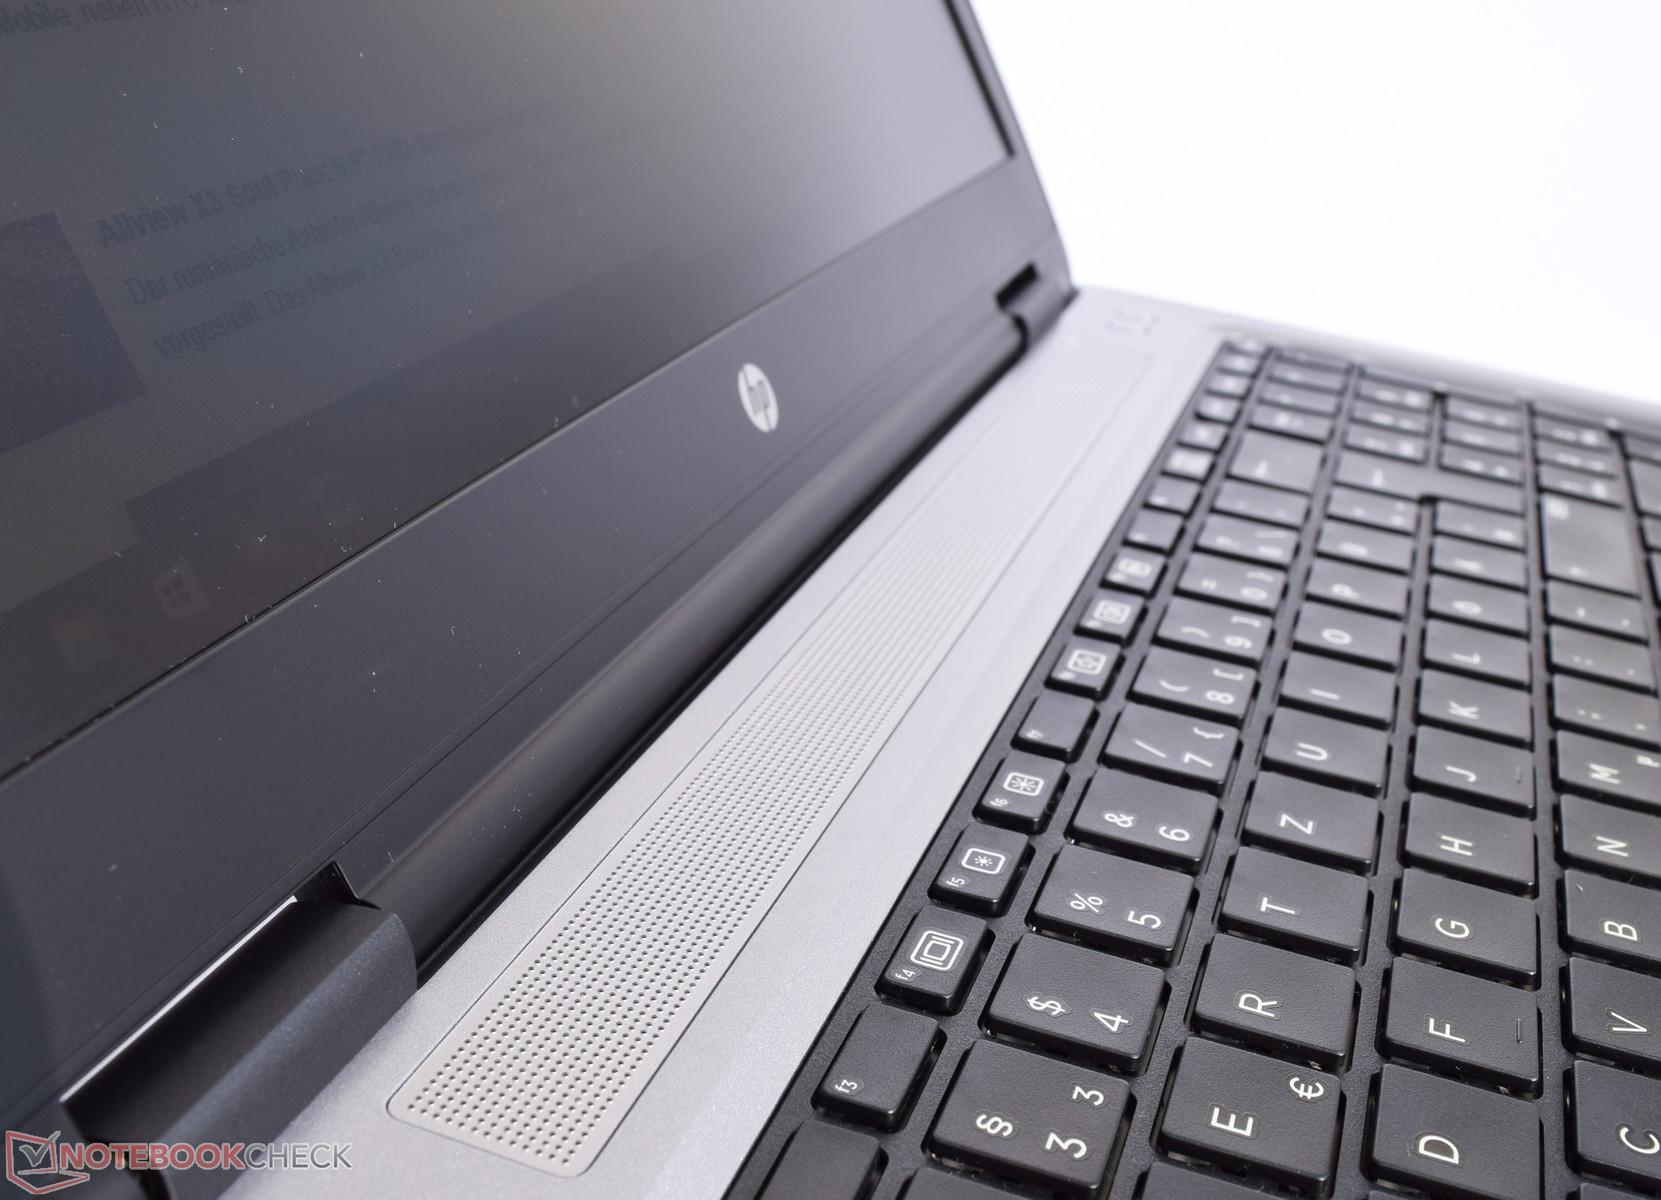
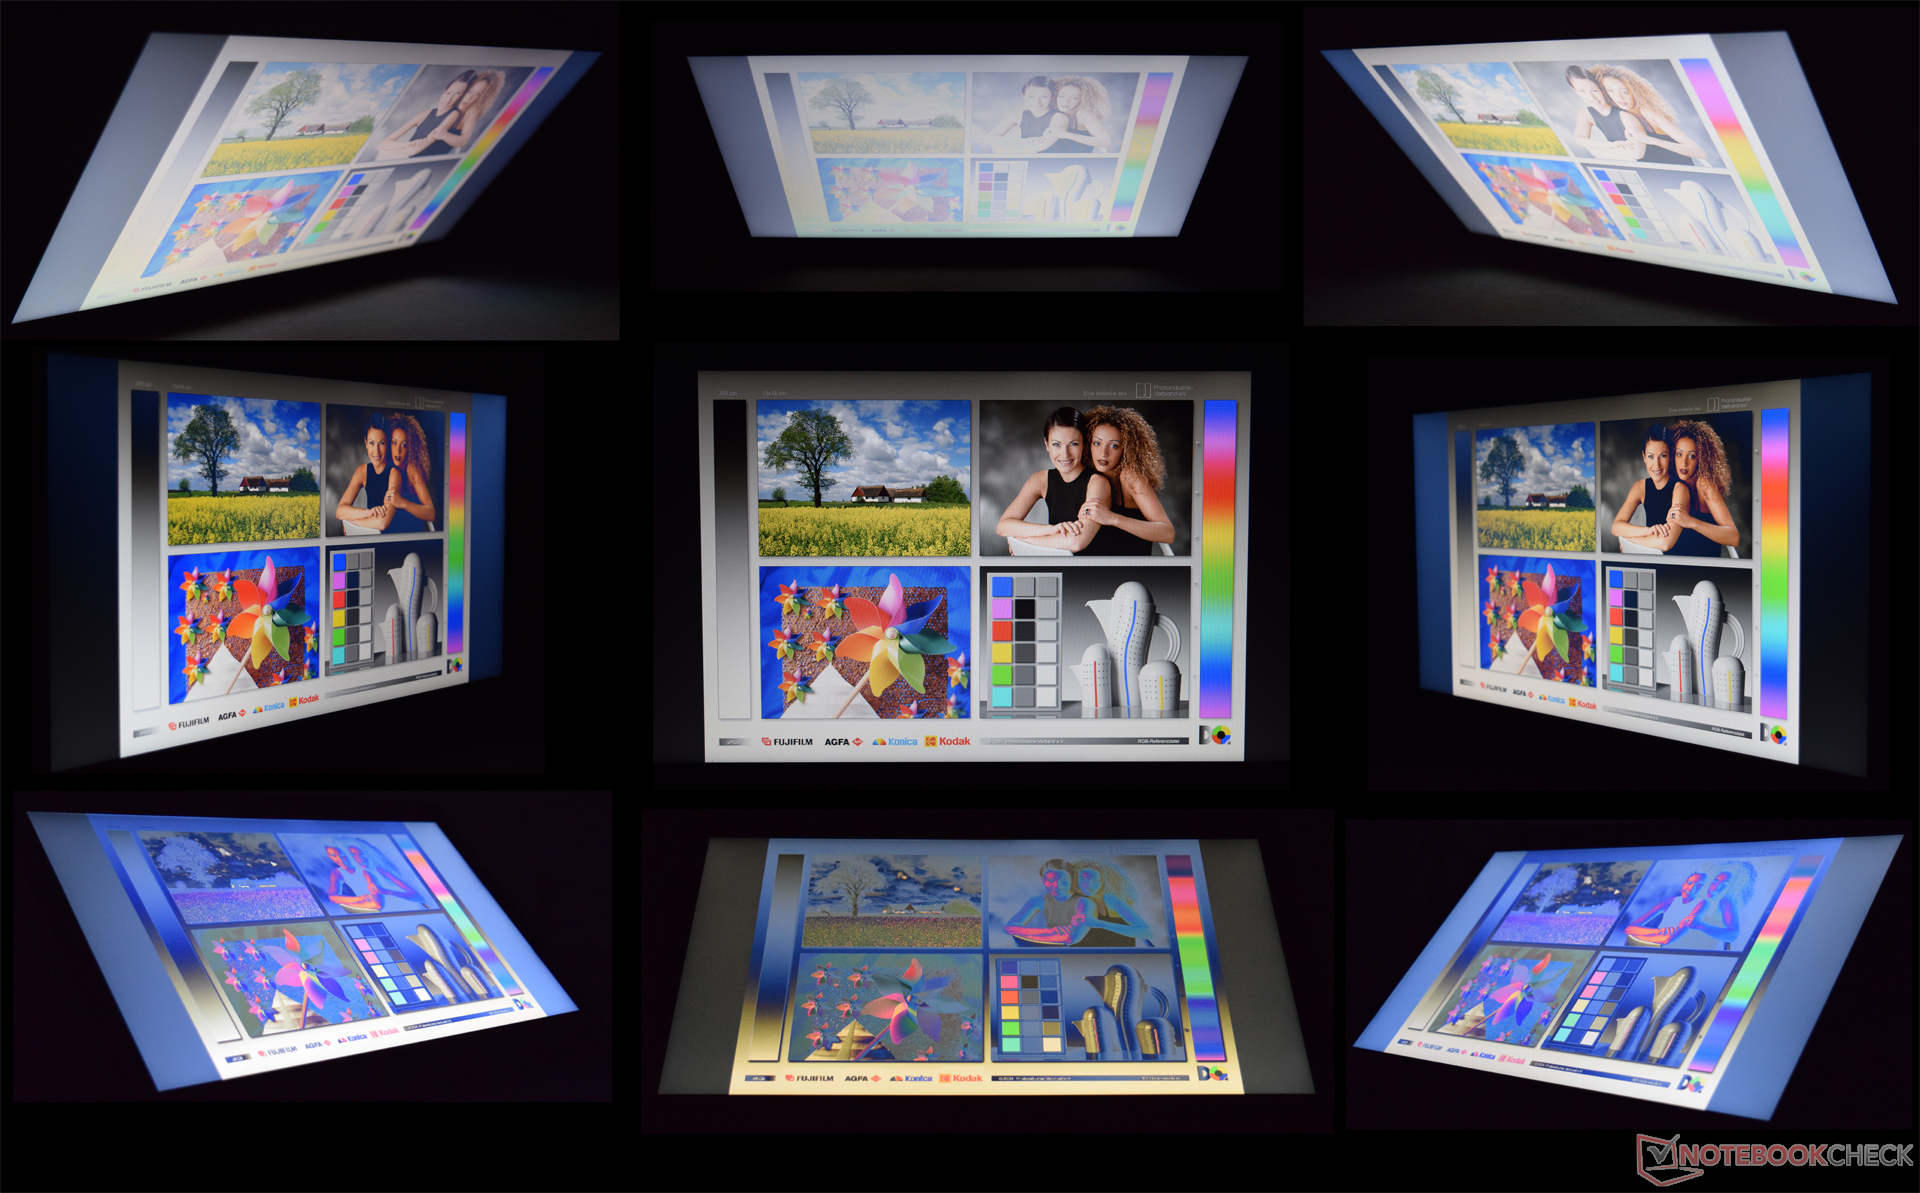
O HP ProBook 650 G2 convence com um desempenho sólido do sistema. A impressão é literalmente estragada pela qualidade da tela abaixo da média, que simplesmente não tem lugar nesta faixa de preços.
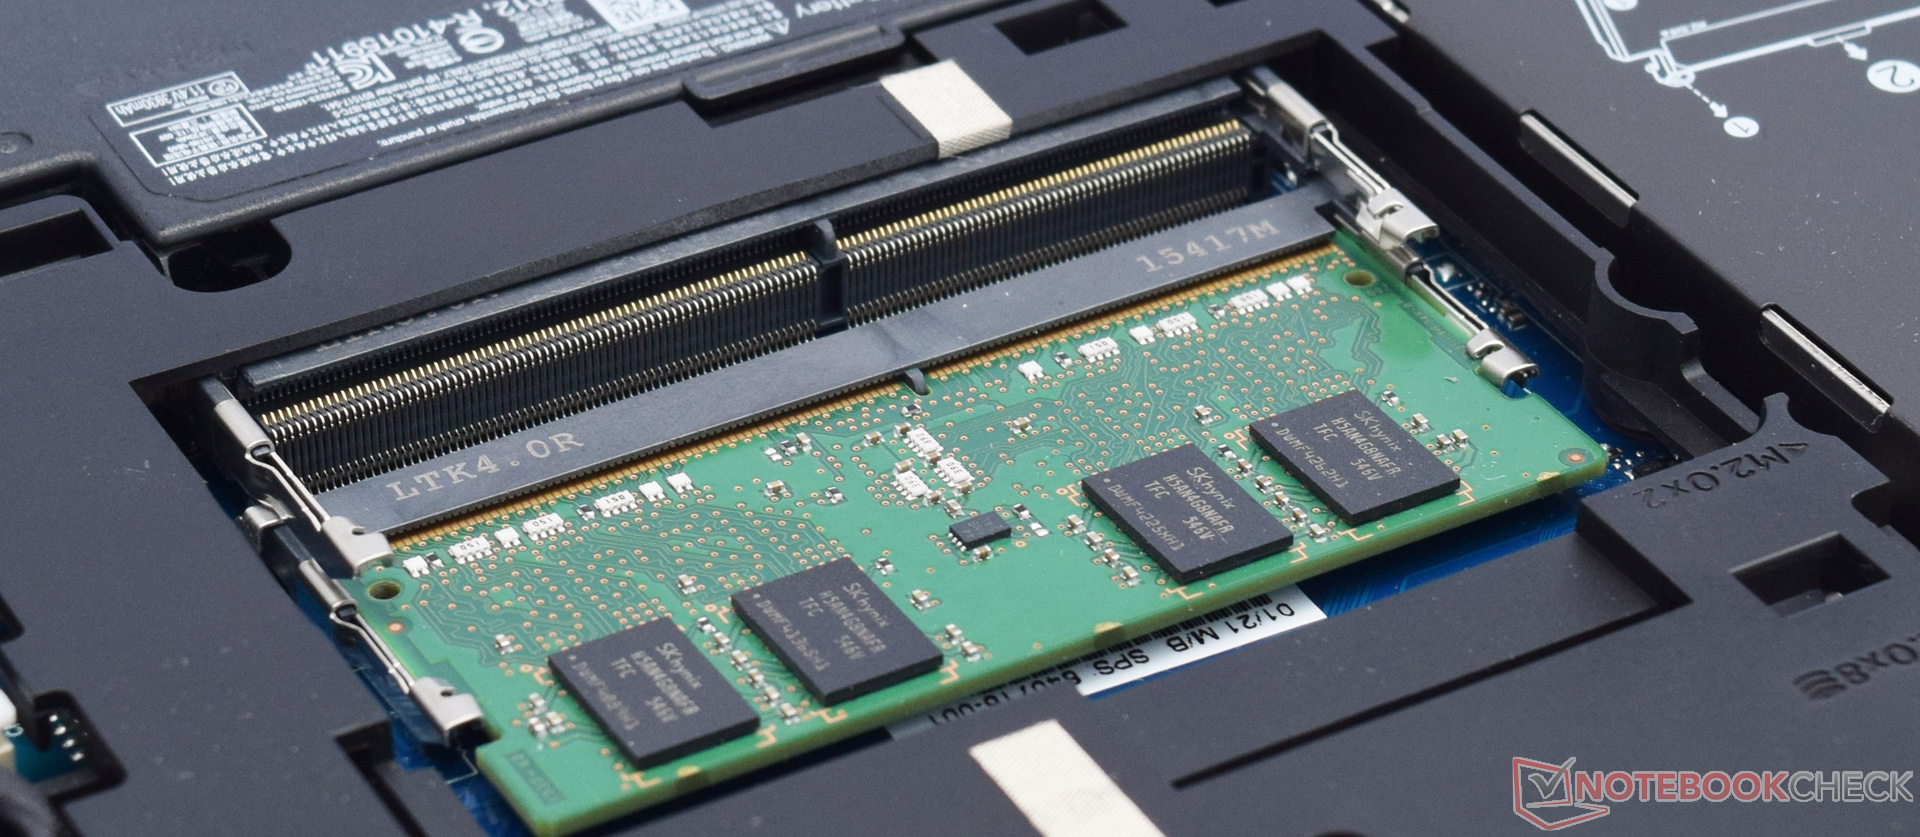
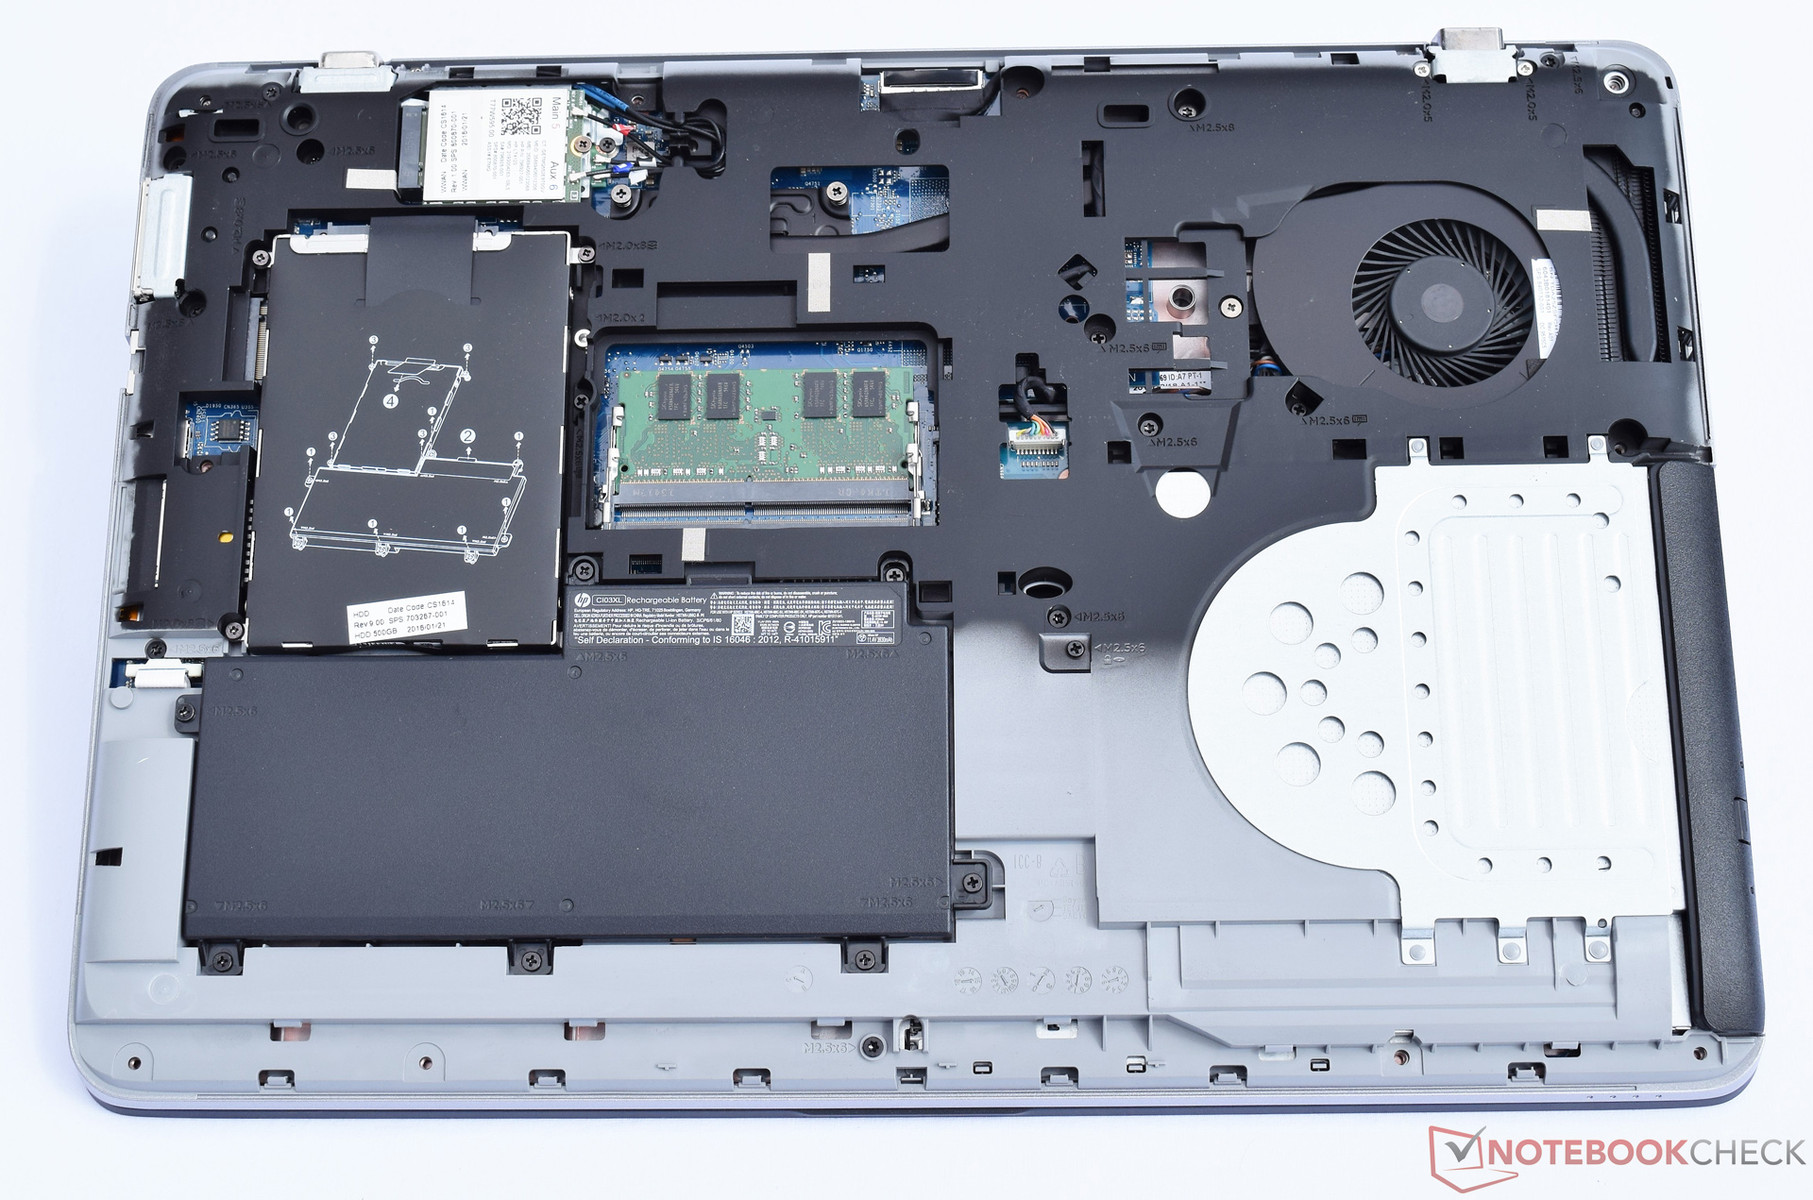
O ProBook 650 G2 é uma boa abordagem para ser um companheiro do dia a dia no escritório. Nós recomendaríamos optar por um aparelho com painel Full HD aos compradores que estejam pensando seriamente em comprar este aparelho. Também seria sensato expandir a memória de trabalho e instalar um dispositivo de armazenamento SSD para uma melhor utilização do desempenho existente.
Esta é uma versão reduzida da análise original. Você pode ler a análise completa em inglês.
HP ProBook 650 G2-T9X61ET
- 08/11/2016 v5.1 (old)
Sebastian Bade