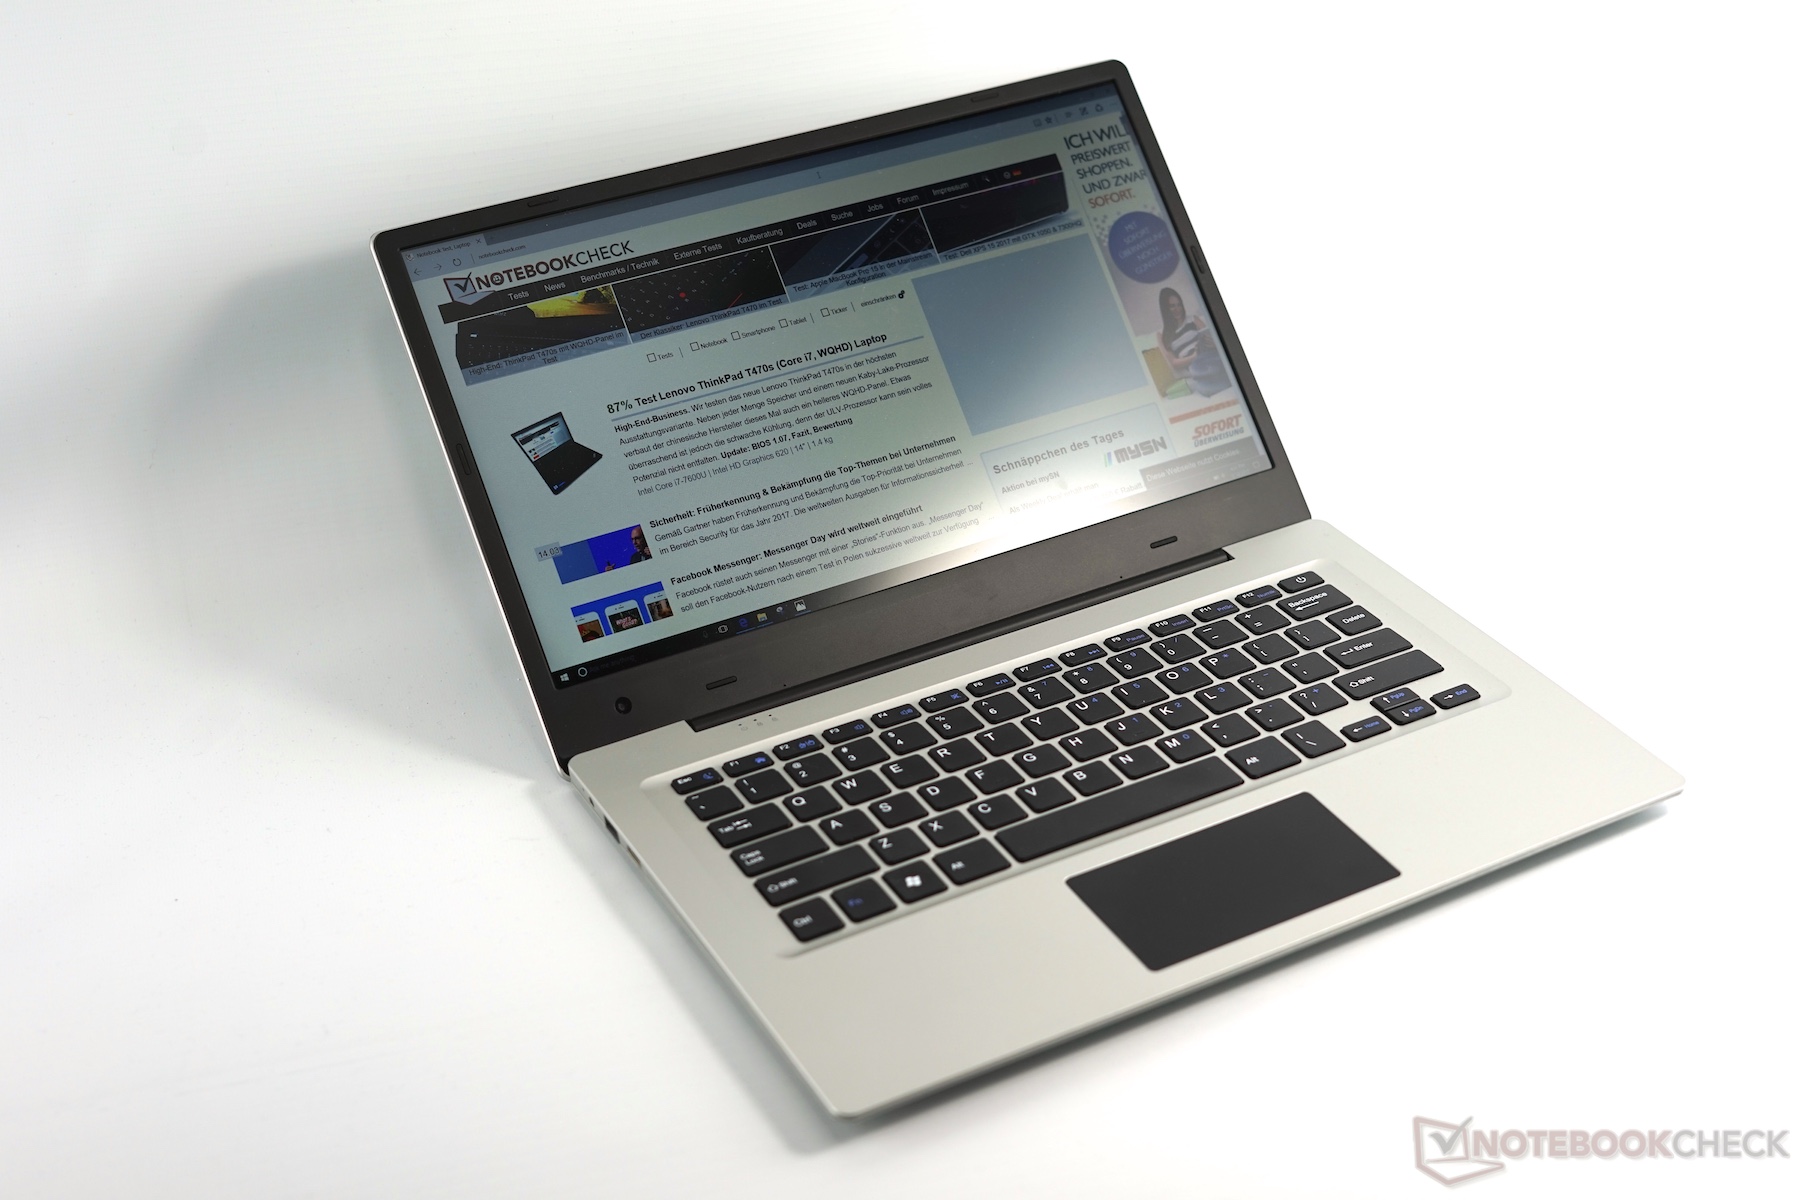
Breve Análise do Portátil Jumper EZBook 3 (N3350, FHD)

| SD Card Reader | |
| average JPG Copy Test (av. of 3 runs) | |
| HP Pavilion x360 11t T5M27AV | |
| HP 250 G5 Y1V08UT | |
| Acer Swift 1 SF114-31-P6F6 | |
| Jumper EZbook 3 | |
| Acer Aspire ES1-332-P91H | |
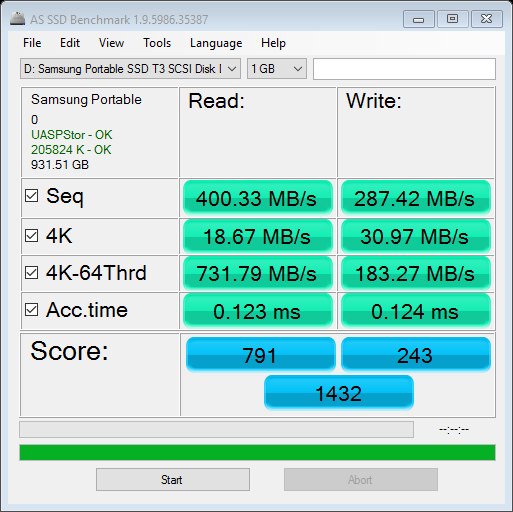
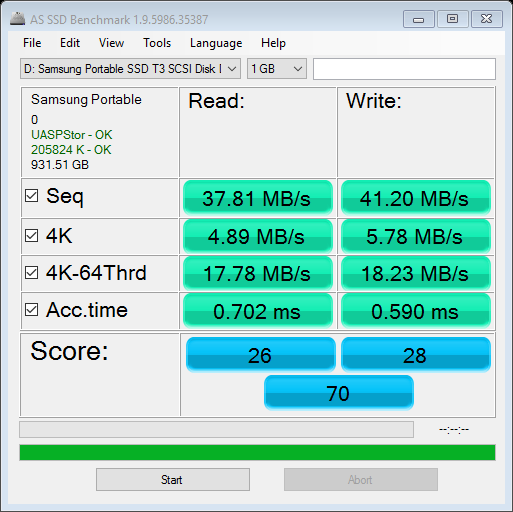
| maximum AS SSD Seq Read Test (1GB) | |
| HP Pavilion x360 11t T5M27AV | |
| Acer Aspire ES1-332-P91H | |
| Acer Swift 1 SF114-31-P6F6 | |
| Jumper EZbook 3 | |
| HP 250 G5 Y1V08UT | |
| Networking | |
| iperf3 transmit AX12 | |
| Asus Zenbook UX3410UA | |
| Chuwi LapBook 14 inch 2017 | |
| Jumper EZbook 3 | |
| Acer Swift 1 SF114-31-P6F6 (jseb) | |
| Chuwi Hi10 Pro | |
| iperf3 receive AX12 | |
| Chuwi LapBook 14 inch 2017 | |
| Asus Zenbook UX3410UA | |
| Jumper EZbook 3 | |
| Acer Swift 1 SF114-31-P6F6 (jseb) | |
| Chuwi Hi10 Pro | |
| |||||||||||||||||||||||||
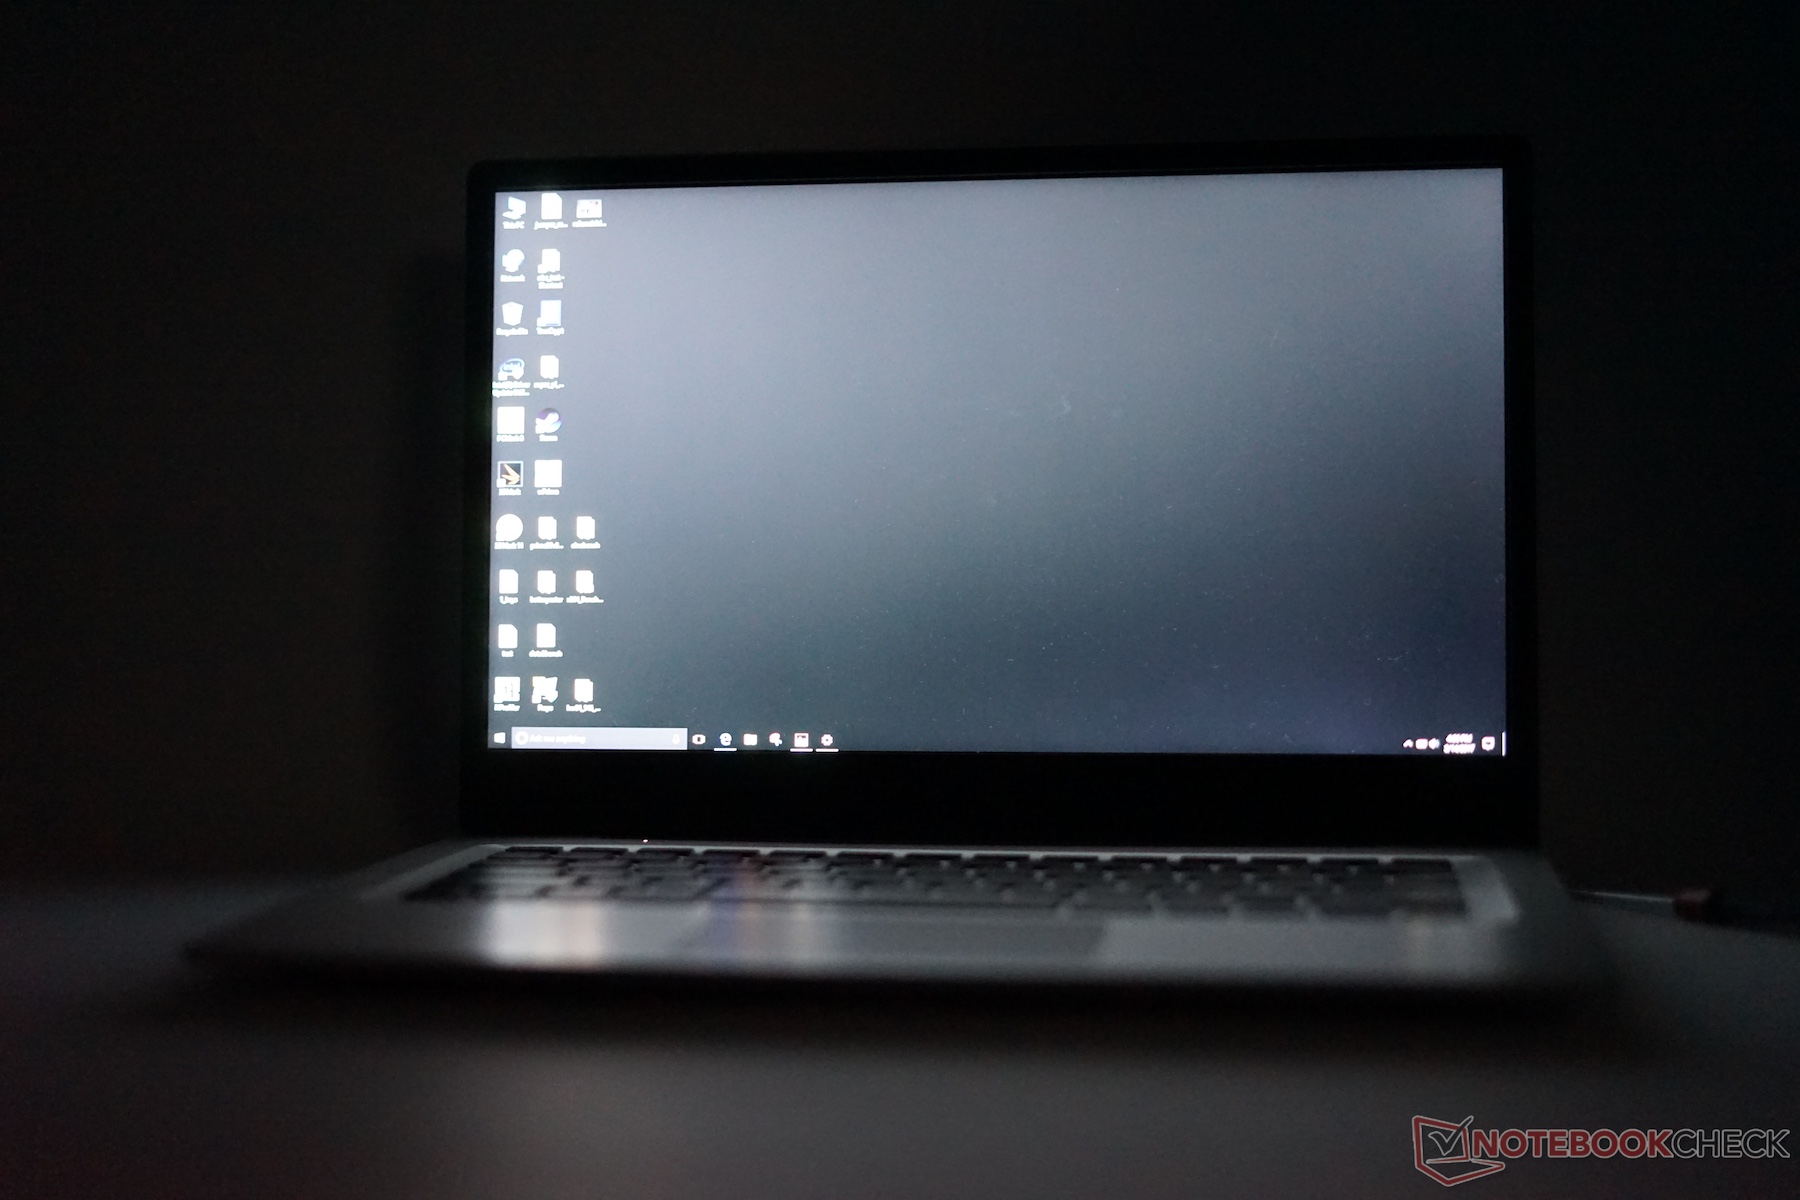
iluminação: 76 %
iluminação com acumulador: 384 cd/m²
Contraste: 300:1 (Preto: 1.28 cd/m²)
ΔE ColorChecker Calman: 8.7 | ∀{0.5-29.43 Ø4.72}
ΔE Greyscale Calman: 11.1 | ∀{0.09-98 Ø4.97}
53% AdobeRGB 1998 (Argyll 3D)
77.3% sRGB (Argyll 3D)
51.6% Display P3 (Argyll 3D)
Gamma: 2.2
CCT: 12445 K
| Jumper EZbook 3 MS_9003, TN LED, 1920x1080, 14.1" | Acer Swift 1 SF114-31-P6F6 Chi Mei N140BGA-EA3, TN LED, 1366x768, 14" | Apple MacBook 12 (Early 2016) 1.1 GHz APPA027, IPS, 2304x1440, 12" | Teclast Tbook 10s LCD, IPS, 1920x1200, 10.1" | VOYO VBook V3 Chi Mei N116HSE, IPS LED, 1920x1080, 13.3" | Cube i7 Book CDK09 Samsung LTN140W1-L01, IPS, 1920x1080, 10.6" | |
|---|---|---|---|---|---|---|
| Display | -20% | 27% | ||||
| Display P3 Coverage (%) | 51.6 | 40.97 -21% | 66.8 29% | |||
| sRGB Coverage (%) | 77.3 | 61.5 -20% | 95.4 23% | |||
| AdobeRGB 1998 Coverage (%) | 53 | 42.35 -20% | 68 28% | |||
| Response Times | -65% | -76% | -58% | -126% | ||
| Response Time Grey 50% / Grey 80% * (ms) | 46 ? | 32 ? 30% | 41.2 ? 10% | 40 ? 13% | 49 ? -7% | |
| Response Time Black / White * (ms) | 11.6 ? | 30 ? -159% | 30.4 ? -162% | 26.4 ? -128% | 40 ? -245% | |
| PWM Frequency (Hz) | 200 ? | 200 ? | ||||
| Screen | 22% | 64% | 45% | 36% | 51% | |
| Brightness middle (cd/m²) | 384 | 270 -30% | 387 1% | 279 -27% | 195 -49% | 384 0% |
| Brightness (cd/m²) | 341 | 247 -28% | 358 5% | 280 -18% | 200 -41% | 370 9% |
| Brightness Distribution (%) | 76 | 80 5% | 88 16% | 82 8% | 72 -5% | 89 17% |
| Black Level * (cd/m²) | 1.28 | 0.57 55% | 0.47 63% | 0.29 77% | 0.24 81% | 0.37 71% |
| Contrast (:1) | 300 | 474 58% | 823 174% | 962 221% | 813 171% | 1038 246% |
| Colorchecker dE 2000 * | 8.7 | 3.01 65% | 1.6 82% | 6.7 23% | 5 43% | 5.8 33% |
| Colorchecker dE 2000 max. * | 16.7 | 6.33 62% | 4 76% | 10.8 35% | 9.31 44% | 19.8 -19% |
| Greyscale dE 2000 * | 11.1 | 12.73 -15% | 1 91% | 6.8 39% | 5.98 46% | 5.1 54% |
| Gamma | 2.2 100% | 2.36 93% | 2.26 97% | 2.27 97% | 2.17 101% | 2.4 92% |
| CCT | 12445 52% | 14629 44% | 6680 97% | 8466 77% | 6764 96% | 7125 91% |
| Color Space (Percent of AdobeRGB 1998) (%) | 39 | 61.6 | ||||
| Color Space (Percent of sRGB) (%) | 62 | 82.2 | ||||
| Média Total (Programa/Configurações) | -21% /
-1% | 5% /
34% | -7% /
24% | -45% /
4% | 51% /
51% |
* ... menor é melhor
Exibir tempos de resposta
| ↔ Tempo de resposta preto para branco | ||
|---|---|---|
| 11.6 ms ... ascensão ↗ e queda ↘ combinadas | ↗ 7.7 ms ascensão | 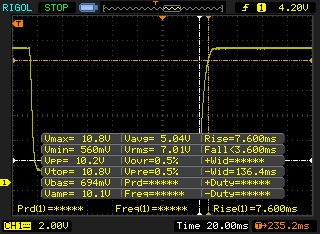 |
| ↘ 3.8 ms queda | ||
| A tela mostra boas taxas de resposta em nossos testes, mas pode ser muito lenta para jogadores competitivos. Em comparação, todos os dispositivos testados variam de 0.1 (mínimo) a 240 (máximo) ms. » 31 % de todos os dispositivos são melhores. Isso significa que o tempo de resposta medido é melhor que a média de todos os dispositivos testados (19.8 ms). | ||
| ↔ Tempo de resposta 50% cinza a 80% cinza | ||
| 46 ms ... ascensão ↗ e queda ↘ combinadas | ↗ 25 ms ascensão | 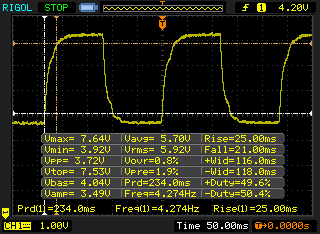 |
| ↘ 21 ms queda | ||
| A tela mostra taxas de resposta lentas em nossos testes e será insatisfatória para os jogadores. Em comparação, todos os dispositivos testados variam de 0.165 (mínimo) a 636 (máximo) ms. » 79 % de todos os dispositivos são melhores. Isso significa que o tempo de resposta medido é pior que a média de todos os dispositivos testados (31 ms). | ||
Cintilação da tela / PWM (modulação por largura de pulso)
| Tela tremeluzindo/PWM detectado | 200 Hz | ≤ 99 % configuração de brilho | 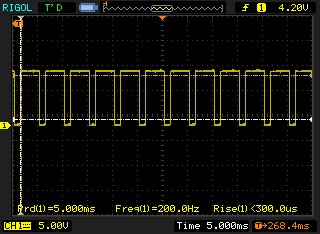 |
A luz de fundo da tela pisca em 200 Hz (pior caso, por exemplo, utilizando PWM) Cintilação detectada em uma configuração de brilho de 99 % e abaixo. Não deve haver cintilação ou PWM acima desta configuração de brilho. A frequência de 200 Hz é relativamente baixa, portanto, usuários sensíveis provavelmente notarão cintilação e sentirão fadiga ocular na configuração de brilho indicada e abaixo. [pwm_comparison] Em comparação: 52 % de todos os dispositivos testados não usam PWM para escurecer a tela. Se PWM foi detectado, uma média de 7763 (mínimo: 5 - máximo: 343500) Hz foi medida. | |||
| Cinebench R15 | |
| CPU Single 64Bit | |
| Apple MacBook 12 (Early 2016) 1.1 GHz | |
| Apple MacBook 12 (Early 2016) 1.1 GHz | |
| Cube i7 Book CDK09 | |
| Acer Aspire ES1-332-P91H | |
| Jumper EZbook 3 | |
| Acer Swift 1 SF114-31-P6F6 | |
| HP Pavilion 11-k103ng x360 | |
| CPU Multi 64Bit | |
| Apple MacBook 12 (Early 2016) 1.1 GHz | |
| Cube i7 Book CDK09 | |
| Acer Aspire ES1-332-P91H | |
| Acer Swift 1 SF114-31-P6F6 | |
| Jumper EZbook 3 | |
| HP Pavilion 11-k103ng x360 | |
| PCMark 8 | |
| Home Score Accelerated v2 | |
| Cube i7 Book CDK09 | |
| Apple MacBook 12 (Early 2016) 1.1 GHz | |
| Acer Swift 1 SF114-31-P6F6 | |
| Acer Aspire ES1-332-P91H | |
| HP 250 G5 Y1V08UT | |
| Jumper EZbook 3 | |
| Teclast Tbook 10s | |
| Work Score Accelerated v2 | |
| Apple MacBook 12 (Early 2016) 1.1 GHz | |
| Acer Aspire ES1-332-P91H | |
| Jumper EZbook 3 | |
| Acer Swift 1 SF114-31-P6F6 | |
| HP 250 G5 Y1V08UT | |
| Teclast Tbook 10s | |
| PCMark 8 Home Score Accelerated v2 | 1592 pontos | |
| PCMark 8 Work Score Accelerated v2 | 2207 pontos | |
| PCMark 10 Score | 1195 pontos | |
Ajuda | ||
| Jumper EZbook 3 Toshiba 064G93 64 GB eMMC | Apple MacBook 12 (Early 2016) 1.3 GHz Apple SSD AP0256 | Asus TransformerBook T302CA-FL010T Samsung CM871 MZNLF128HCHP | Acer Swift 1 SF114-31-P6F6 128 GB eMMC Flash | Chuwi Hi12 Hynix HCG8E 64 GB | Acer Aspire ES1-521-87DN Western Digital Scorpio Blue WD5000LPVX | HP Pavilion 11-k103ng x360 Hitachi Travelstar Z5K500 HTS545050A7E680 | |
|---|---|---|---|---|---|---|---|
| CrystalDiskMark 3.0 | 1814% | 265% | 155% | 134% | -32% | -38% | |
| Read Seq (MB/s) | 151 | 821 444% | 428 183% | 166.5 10% | 141 -7% | 109.6 -27% | 106 -30% |
| Write Seq (MB/s) | 50 | 660 1220% | 124.2 148% | 85 70% | 50 0% | 107.5 115% | 106.1 112% |
| Read 512 (MB/s) | 133 | 672 405% | 283.9 113% | 153.8 16% | 132 -1% | 36.63 -72% | 33.53 -75% |
| Write 512 (MB/s) | 41.3 | 737 1685% | 41.49 0% | 75.6 83% | 44.8 8% | 49.35 19% | 39.03 -5% |
| Read 4k (MB/s) | 5.07 | 16.28 221% | 15.95 215% | 13.2 160% | 17.9 253% | 0.419 -92% | 0.407 -92% |
| Write 4k (MB/s) | 2.47 | 24.87 907% | 14.67 494% | 13.04 428% | 11.4 362% | 1.171 -53% | 1.026 -58% |
| Read 4k QD32 (MB/s) | 16.4 | 271.9 1558% | 98.9 503% | 35.12 114% | 35.3 115% | 1.03 -94% | 0.898 -95% |
| Write 4k QD32 (MB/s) | 2.74 | 223.9 8072% | 15.41 462% | 12.66 362% | 12.1 342% | 1.239 -55% | 1.003 -63% |

| 3DMark 11 - 1280x720 Performance GPU | |
| Asus TransformerBook T302CA-FL010T | |
| Asus Vivobook F556UQ-XO626D | |
| Acer Aspire ES1-332-P91H | |
| Acer Swift 1 SF114-31-P6F6 | |
| HP Pavilion x360 11t T5M27AV | |
| Jumper EZbook 3 | |
| Acer Switch One 10 SW1-011-14UQ | |
| 3DMark 06 Standard Score | 3393 pontos | |
| 3DMark 11 Performance | 505 pontos | |
| 3DMark Cloud Gate Standard Score | 2074 pontos | |
Ajuda | ||
| World of Warships - 1366x768 Low Preset AF:Trilinear | |
| MSI CX61 2QC 2970M MS-16GD | |
| Acer Aspire ES1-521-87DN | |
| Jumper EZbook 3 | |
| Acer Extensa 2519-C7DC | |
| Chuwi Hi12 | |
| baixo | média | alto | ultra | |
|---|---|---|---|---|
| World of Warcraft (2005) | 46 | |||
| Diablo III (2012) | 12.7 | |||
| Counter-Strike: GO (2012) | 14 | |||
| Dota 2 Reborn (2015) | 15.9 | |||
| World of Warships (2015) | 19.1 | |||
| Team Fortress 2 (2017) | 21.2 | |||
| X-Plane 11.11 (2018) | 5.3 | |||
| World of Tanks enCore (2018) | 34 (error at the end) | 4 (error at the end) | ||
| Strange Brigade (2018) | 0 o jogo não começa | |||
| League of Legends (2019) | 28.2 | 20.2 | 13.9 | 12.6 |
| Hearthstone (2020) | 23.9 | 24 | 11.2 | |
| Valorant (2020) | 9.09 |
(±) A temperatura máxima no lado superior é 41 °C / 106 F, em comparação com a média de 35.9 °C / 97 F , variando de 21.4 a 59 °C para a classe Subnotebook.
(±) A parte inferior aquece até um máximo de 42 °C / 108 F, em comparação com a média de 39.2 °C / 103 F
(+) Em uso inativo, a temperatura média para o lado superior é 24.2 °C / 76 F, em comparação com a média do dispositivo de 30.8 °C / ### class_avg_f### F.
(+) Os apoios para as mãos e o touchpad estão atingindo a temperatura máxima da pele (32 °C / 89.6 F) e, portanto, não estão quentes.
(-) A temperatura média da área do apoio para as mãos de dispositivos semelhantes foi 28.2 °C / 82.8 F (-3.8 °C / -6.8 F).
Jumper EZbook 3 análise de áudio
(±) | o volume do alto-falante é médio, mas bom (###valor### dB)
Graves 100 - 315Hz
(-) | quase nenhum baixo - em média 25.1% menor que a mediana
(±) | a linearidade dos graves é média (10.6% delta para a frequência anterior)
Médios 400 - 2.000 Hz
(±) | médios mais altos - em média 7.2% maior que a mediana
(±) | a linearidade dos médios é média (10.8% delta para frequência anterior)
Altos 2 - 16 kHz
(±) | máximos mais altos - em média 5% maior que a mediana
(+) | os máximos são lineares (4.4% delta da frequência anterior)
Geral 100 - 16.000 Hz
(±) | a linearidade do som geral é média (27.3% diferença em relação à mediana)
Comparado com a mesma classe
» 89% de todos os dispositivos testados nesta classe foram melhores, 3% semelhantes, 9% piores
» O melhor teve um delta de 5%, a média foi 18%, o pior foi 53%
Comparado com todos os dispositivos testados
» 83% de todos os dispositivos testados foram melhores, 4% semelhantes, 13% piores
» O melhor teve um delta de 4%, a média foi 23%, o pior foi 134%
Apple MacBook 12 (Early 2016) 1.1 GHz análise de áudio
(+) | os alto-falantes podem tocar relativamente alto (###valor### dB)
Graves 100 - 315Hz
(±) | graves reduzidos - em média 11.3% menor que a mediana
(±) | a linearidade dos graves é média (14.2% delta para a frequência anterior)
Médios 400 - 2.000 Hz
(+) | médios equilibrados - apenas 2.4% longe da mediana
(+) | médios são lineares (5.5% delta para frequência anterior)
Altos 2 - 16 kHz
(+) | agudos equilibrados - apenas 2% longe da mediana
(+) | os máximos são lineares (4.5% delta da frequência anterior)
Geral 100 - 16.000 Hz
(+) | o som geral é linear (10.2% diferença em relação à mediana)
Comparado com a mesma classe
» 7% de todos os dispositivos testados nesta classe foram melhores, 2% semelhantes, 91% piores
» O melhor teve um delta de 5%, a média foi 18%, o pior foi 53%
Comparado com todos os dispositivos testados
» 5% de todos os dispositivos testados foram melhores, 1% semelhantes, 94% piores
» O melhor teve um delta de 4%, a média foi 23%, o pior foi 134%
| desligado | |
| Ocioso | |
| Carga |
|
Key:
min: | |
| Jumper EZbook 3 Celeron N3350, HD Graphics 500, Toshiba 064G93 64 GB eMMC, TN LED, 1920x1080, 14.1" | Chuwi Hi10 Pro Z8300, HD Graphics (Cherry Trail), 64 GB eMMC Flash, IPS, 1920x1200, 10.1" | HP 250 G5 Y1V08UT N3060, HD Graphics 400 (Braswell), Samsung CM871 MZNLF128HCHP, TN LED, 1366x768, 15.6" | Apple MacBook 12 (Early 2016) 1.3 GHz 6Y75, HD Graphics 515, Apple SSD AP0256, IPS, 2304x1440, 12" | Acer Swift 1 SF114-31-P6F6 N3710, HD Graphics 405 (Braswell), 128 GB eMMC Flash, TN LED, 1366x768, 14" | Acer Aspire ES1-332-P91H Pentium N4200, HD Graphics 505, WDC Slim WD10SPCX-21KHST0, TN LED, 1366x768, 13.3" | HP Pavilion 11-k103ng x360 N3050, HD Graphics (Braswell), Hitachi Travelstar Z5K500 HTS545050A7E680, IPS, 1366x768, 11.6" | |
|---|---|---|---|---|---|---|---|
| Power Consumption | 23% | -3% | -11% | -21% | -32% | -33% | |
| Idle Minimum * (Watt) | 3.18 | 1.4 56% | 3.9 -23% | 2 37% | 4.1 -29% | 4.5 -42% | 5.3 -67% |
| Idle Average * (Watt) | 6.14 | 4.82 21% | 6.4 -4% | 2.06 66% | 8.3 -35% | 7.6 -24% | 7.1 -16% |
| Idle Maximum * (Watt) | 6.4 | 5.43 15% | 6.5 -2% | 6.94 -8% | 8.6 -34% | 8.5 -33% | 8.2 -28% |
| Load Average * (Watt) | 13.3 | 11.61 13% | 11.1 17% | 22.52 -69% | 13.5 -2% | 17.4 -31% | 15.5 -17% |
| Load Maximum * (Watt) | 13.6 | 12.48 8% | 13.8 -1% | 24.87 -83% | 14.5 -7% | 17.6 -29% | 18.9 -39% |
* ... menor é melhor
| Battery Runtime - WiFi Websurfing | |
| Acer Swift 1 SF114-31-P6F6 | |
| Apple MacBook Air 13 inch 2015-03 | |
| Apple MacBook 12 (Early 2016) 1.3 GHz | |
| Jumper EZbook 3 | |
| Xiaomi Mi Notebook Air 13.3 2016 | |
| Acer Swift 3 SF314-51-731X | |
| VOYO VBook V3 | |
Pro
Contra
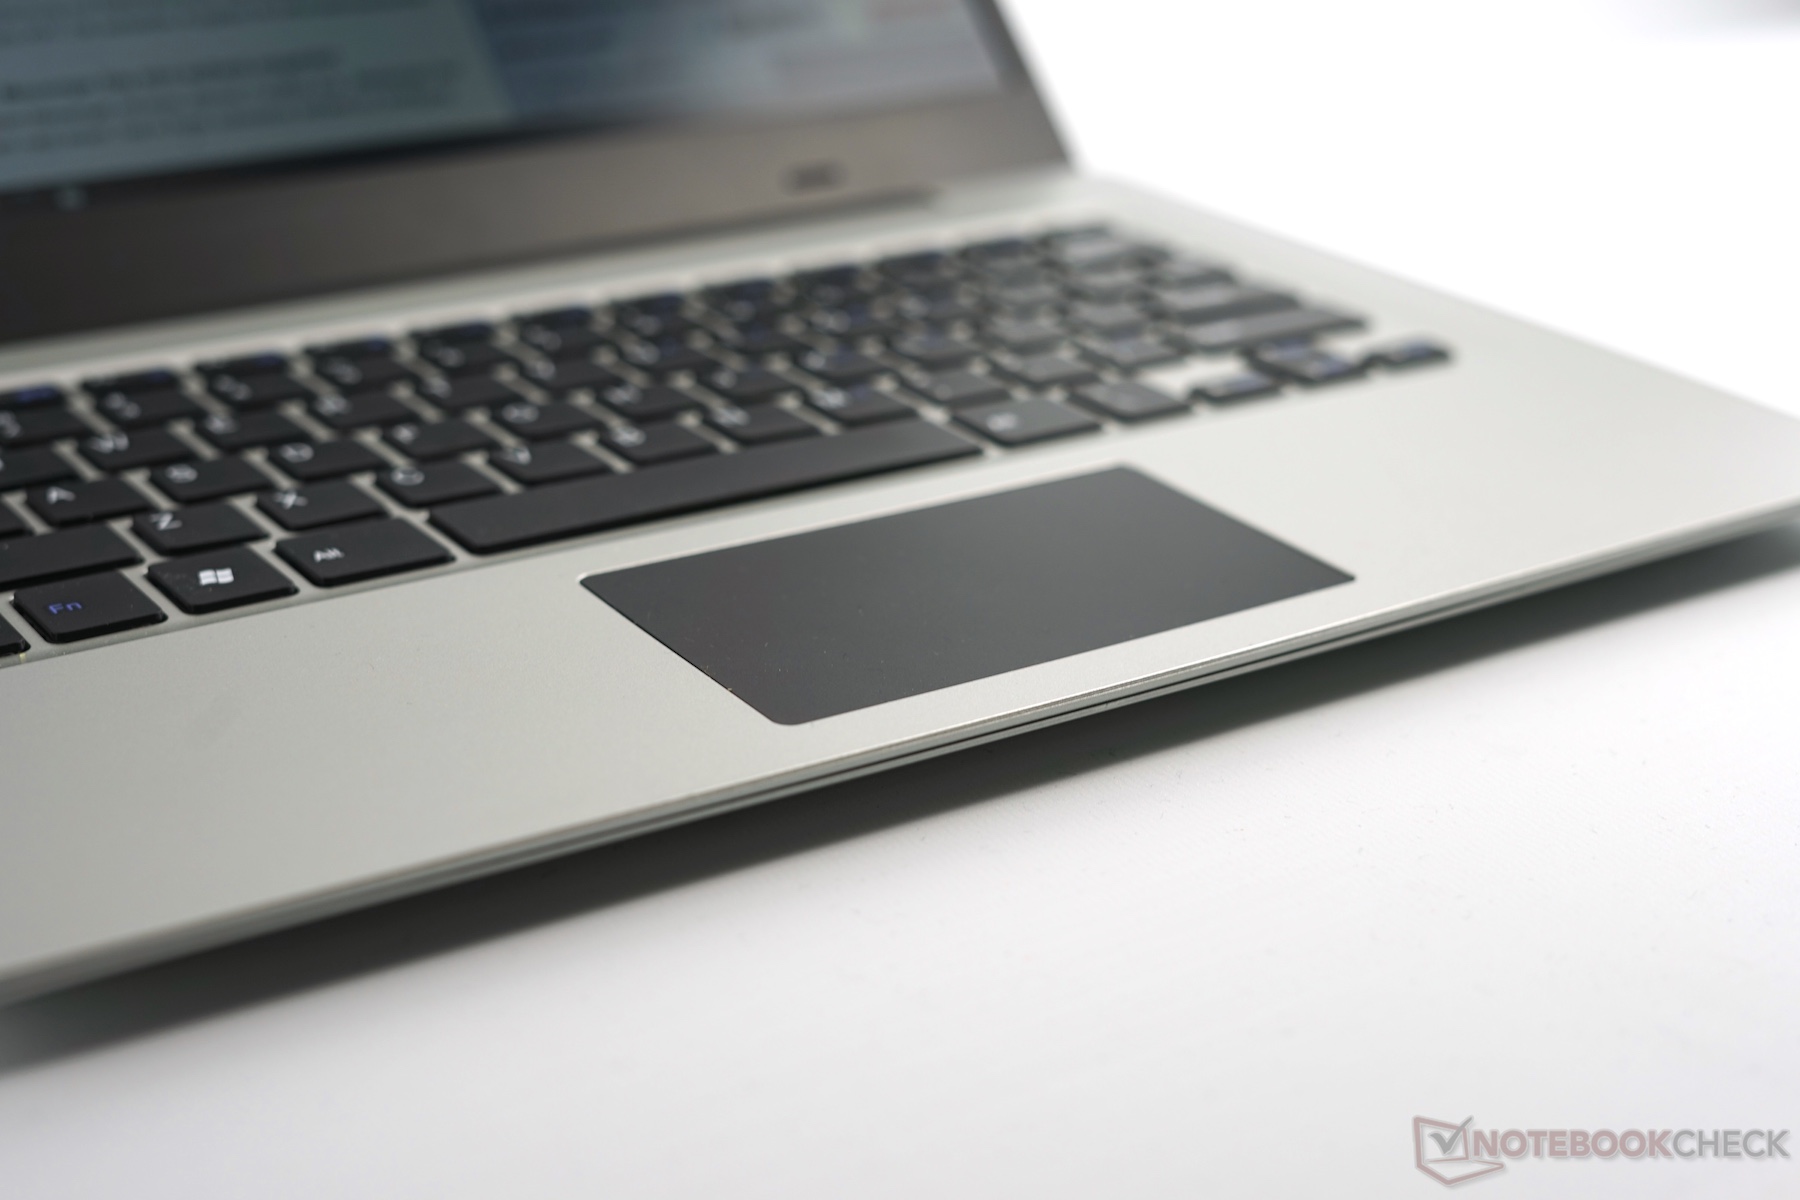
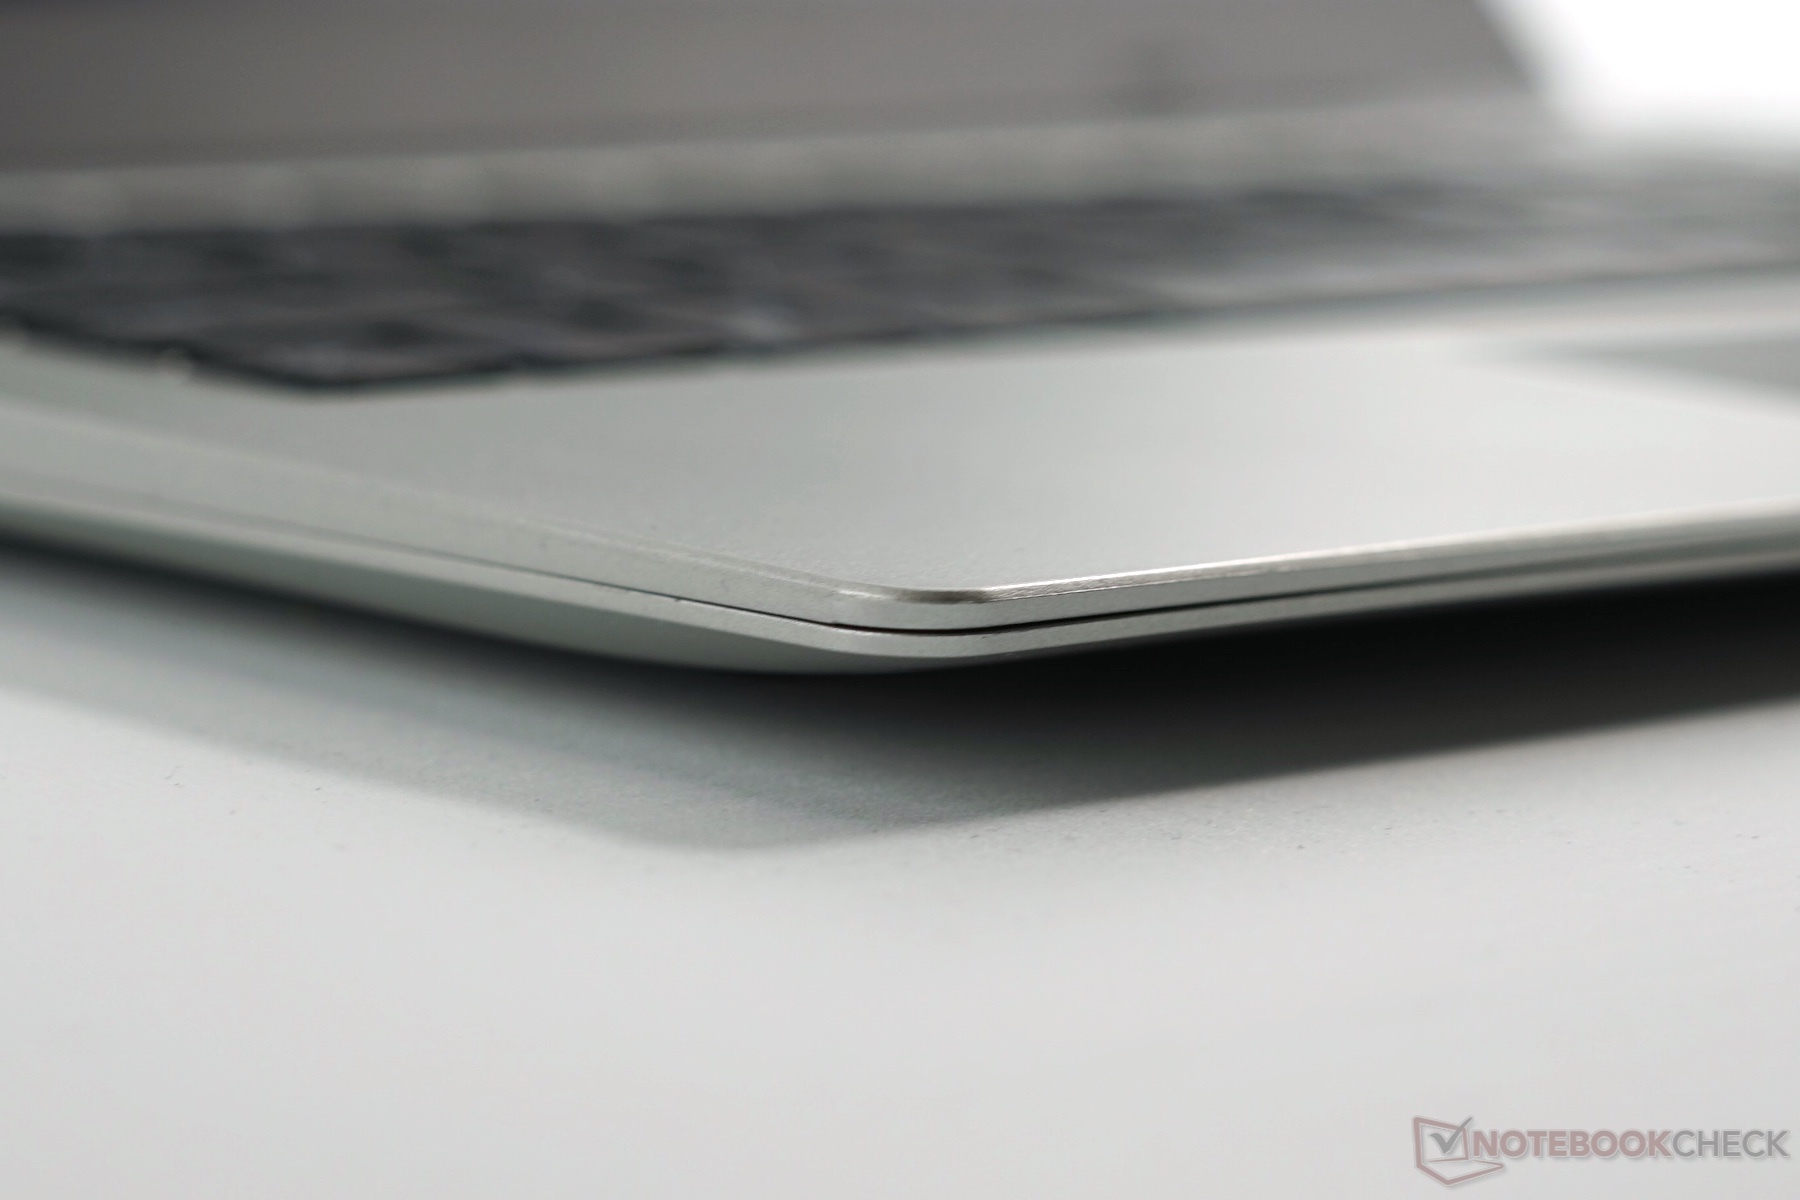
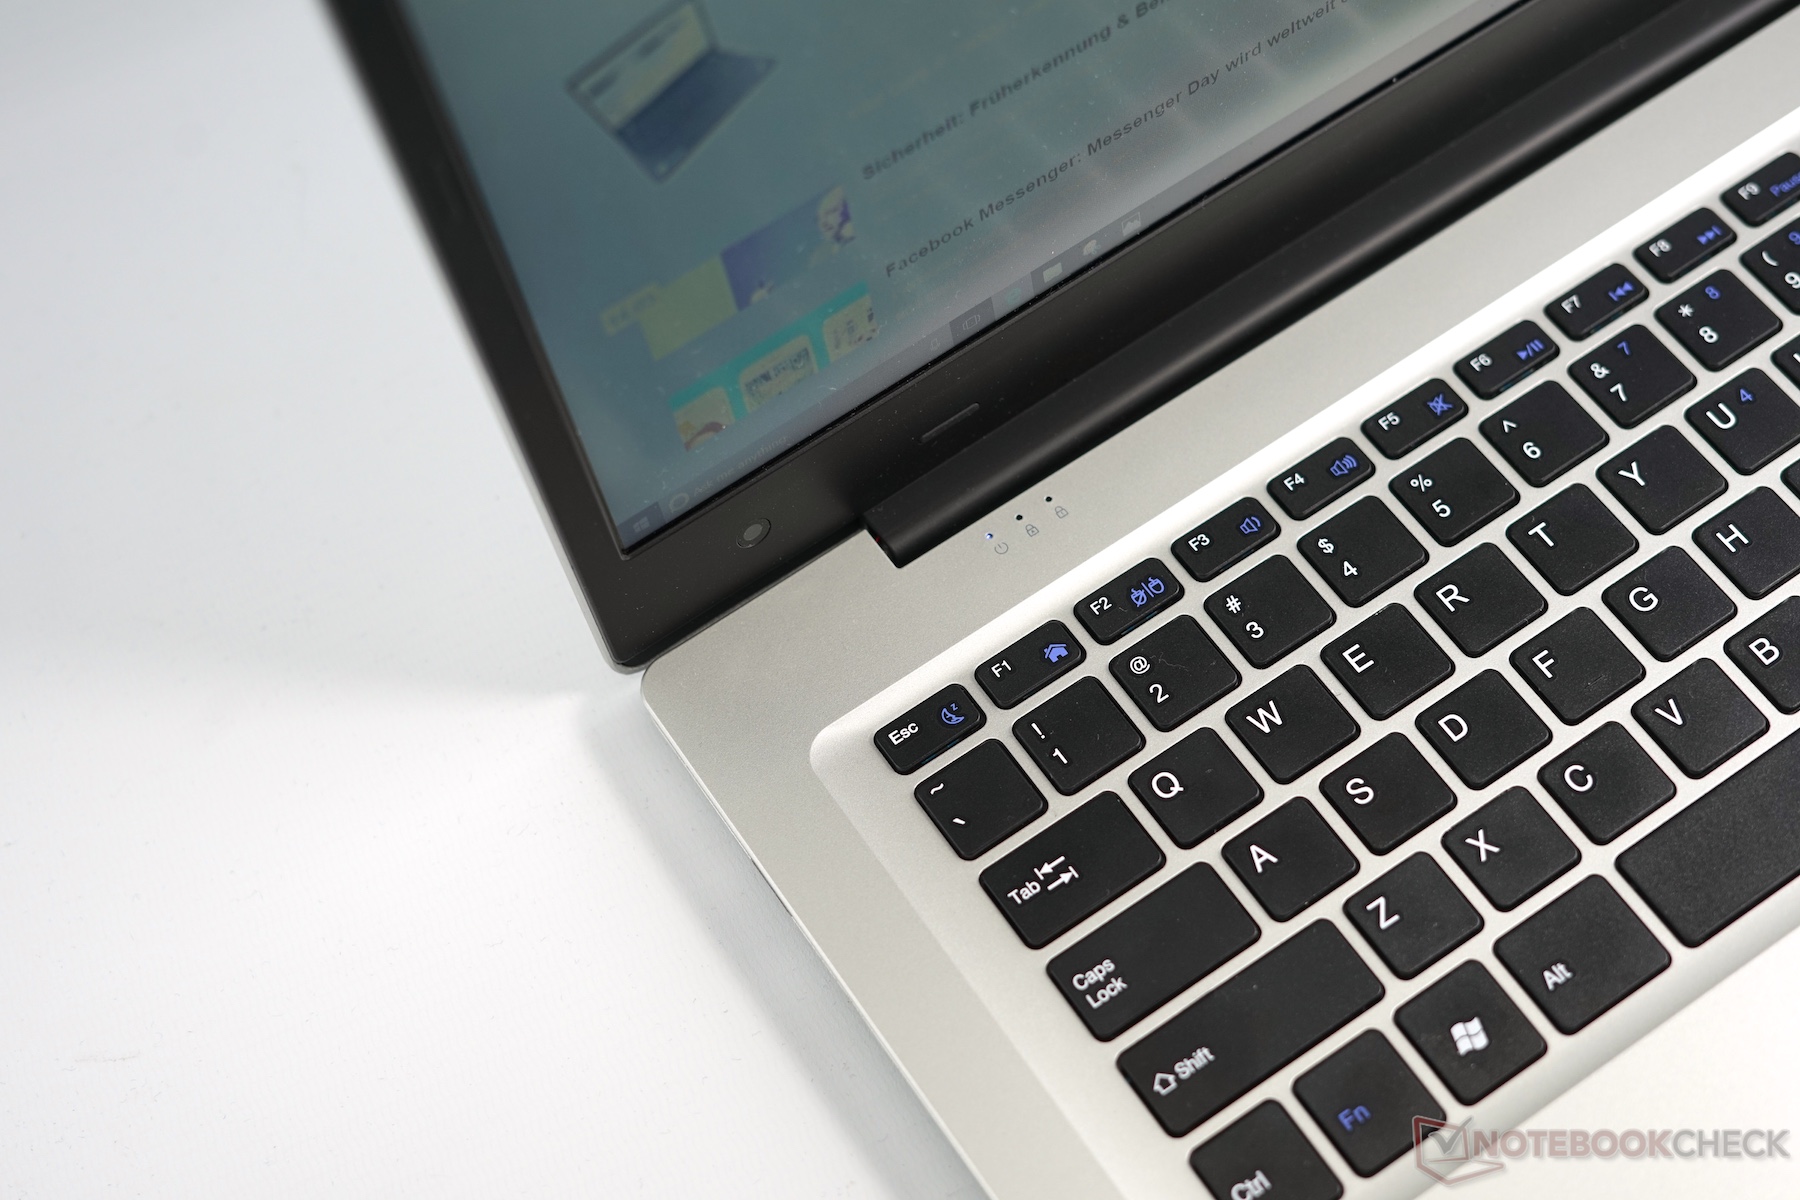
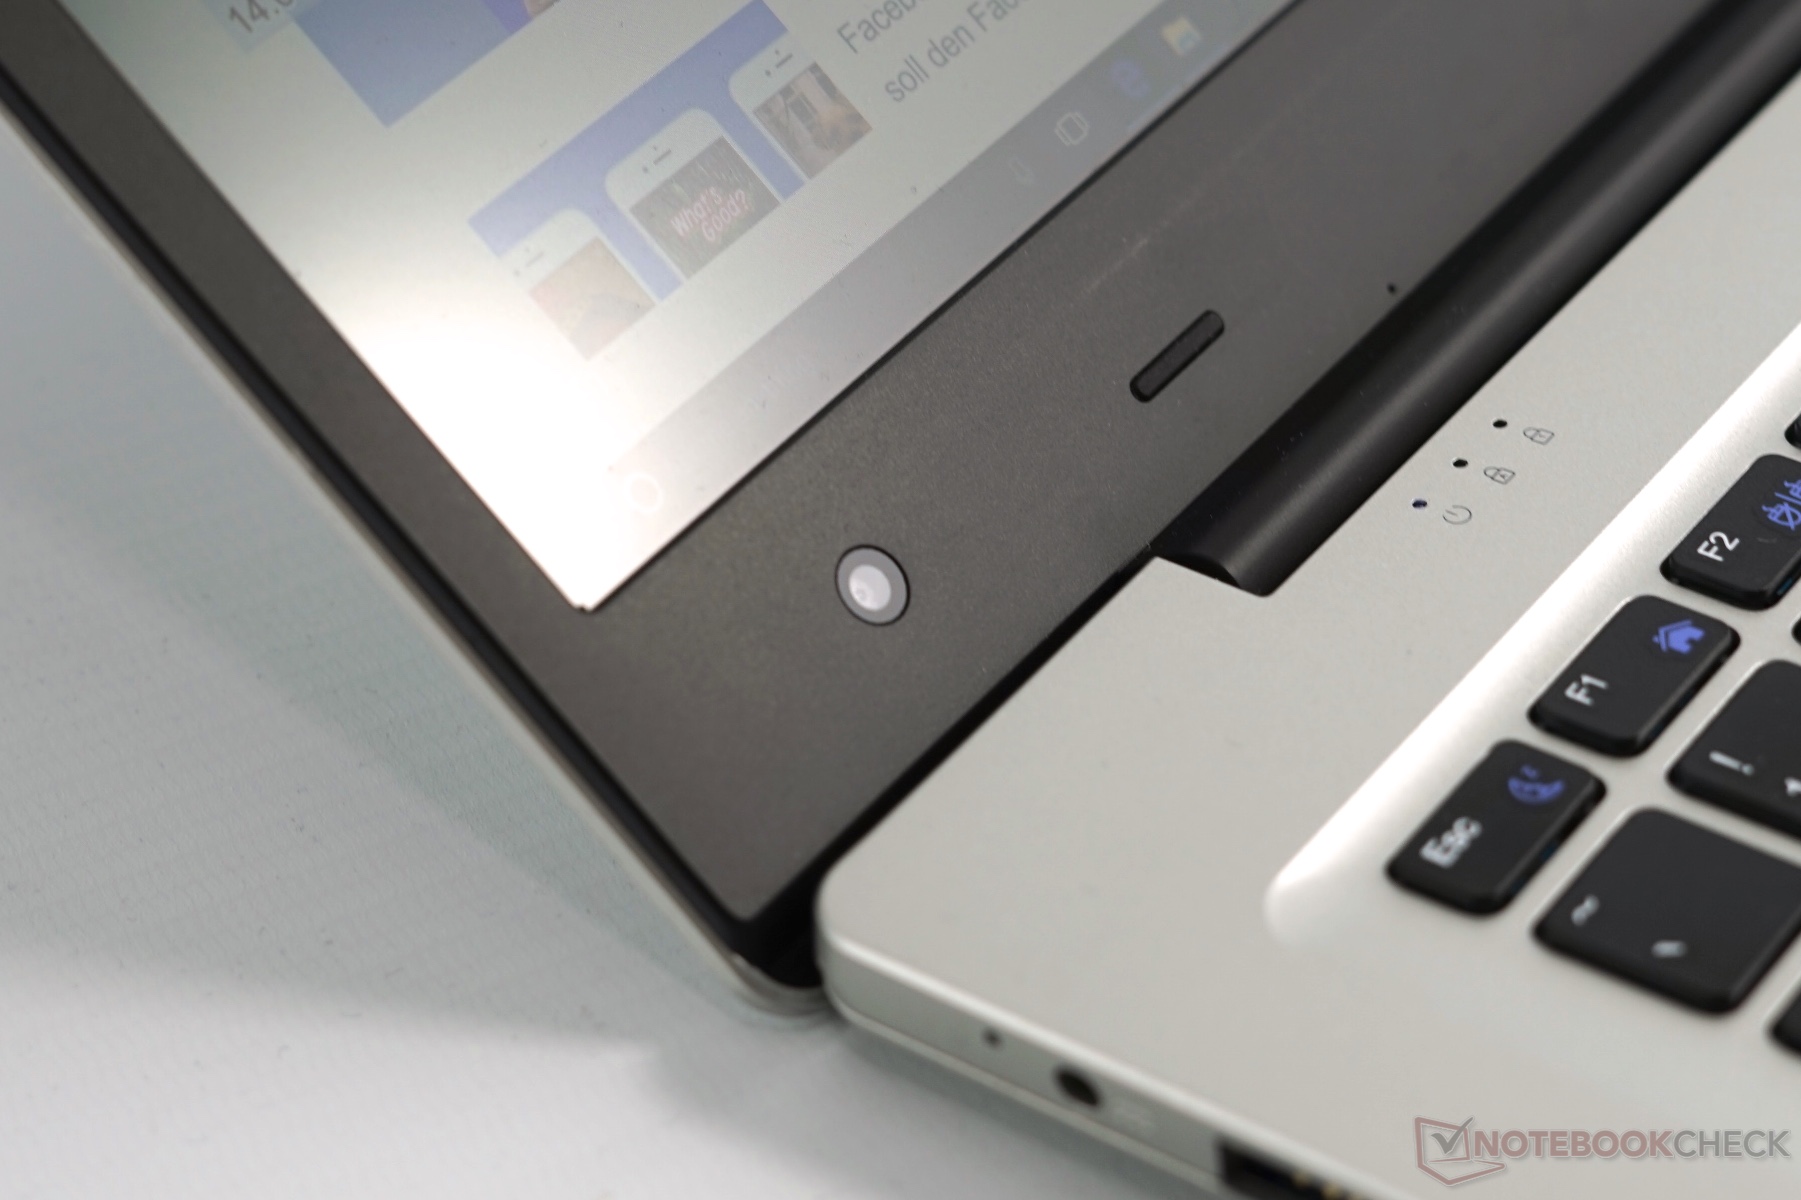
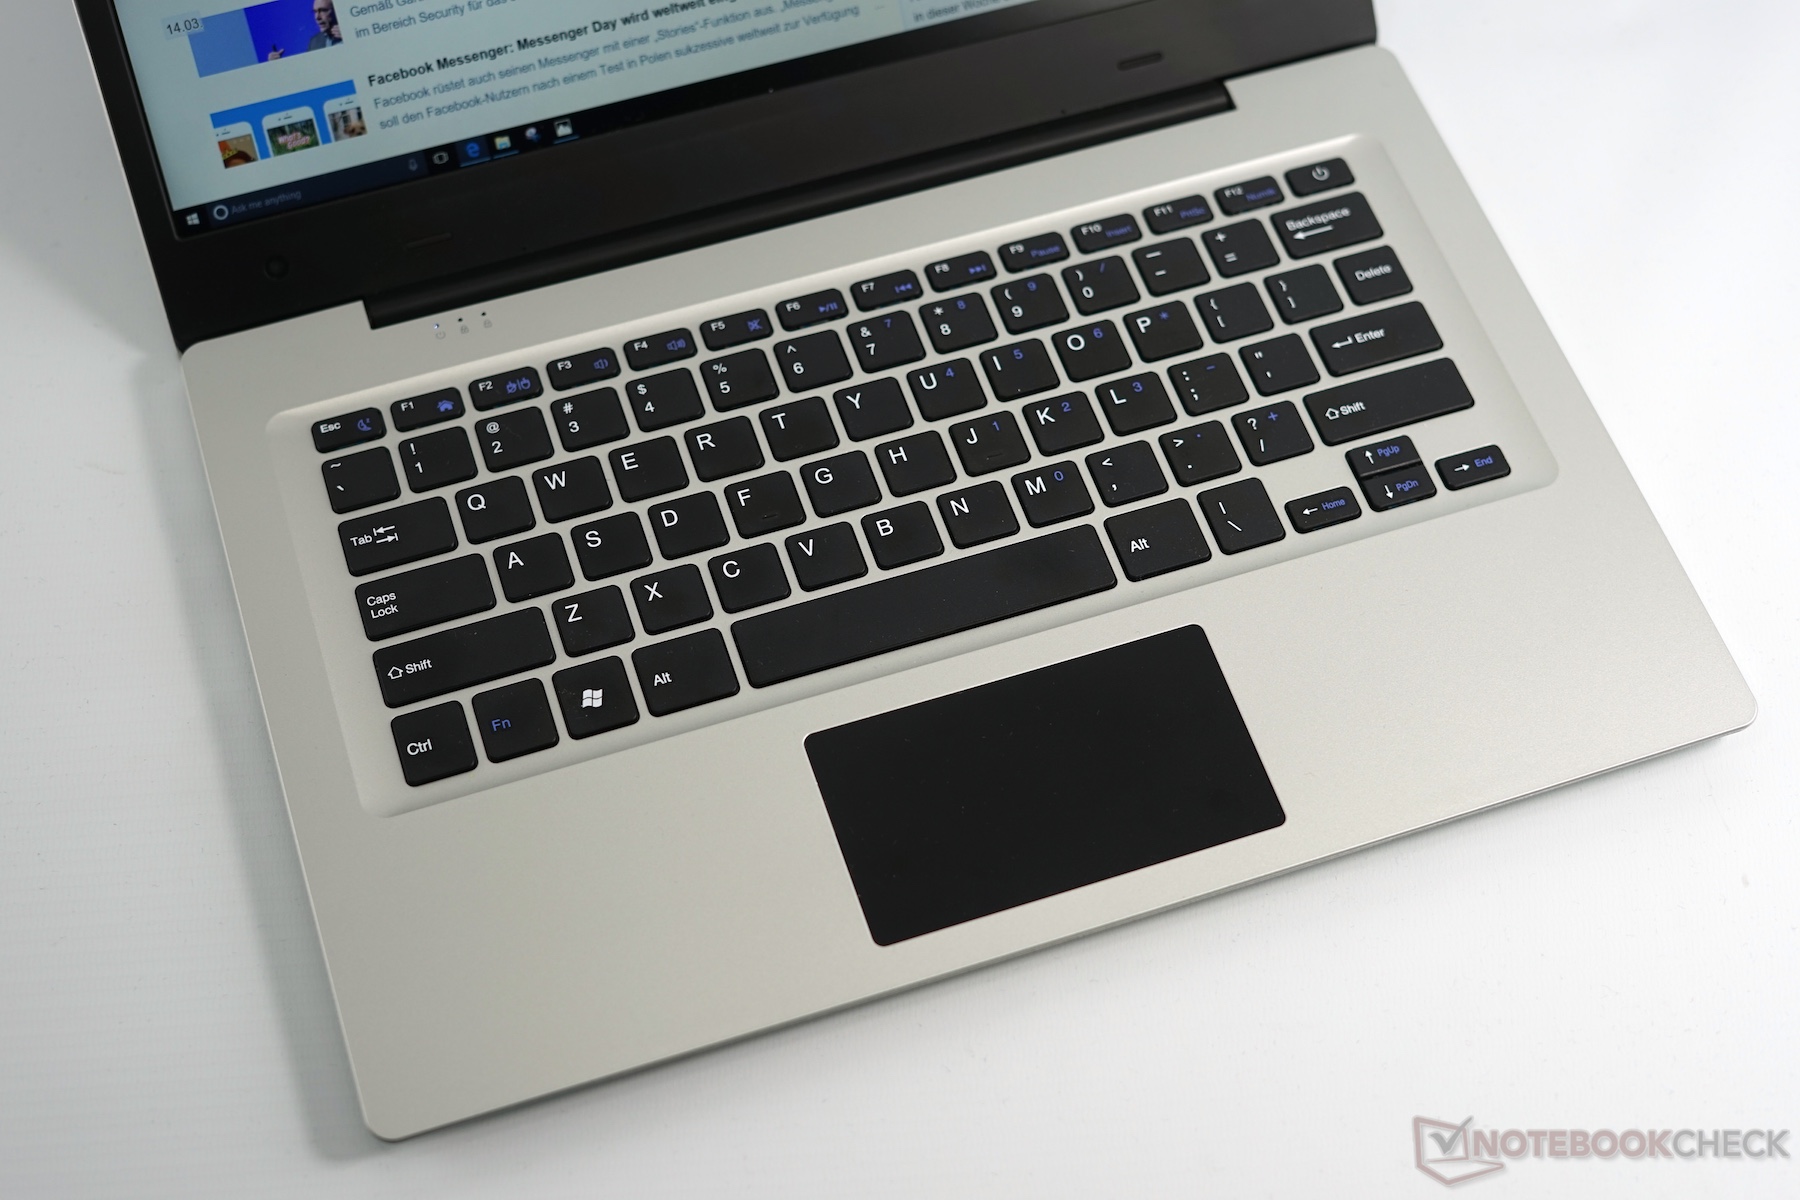
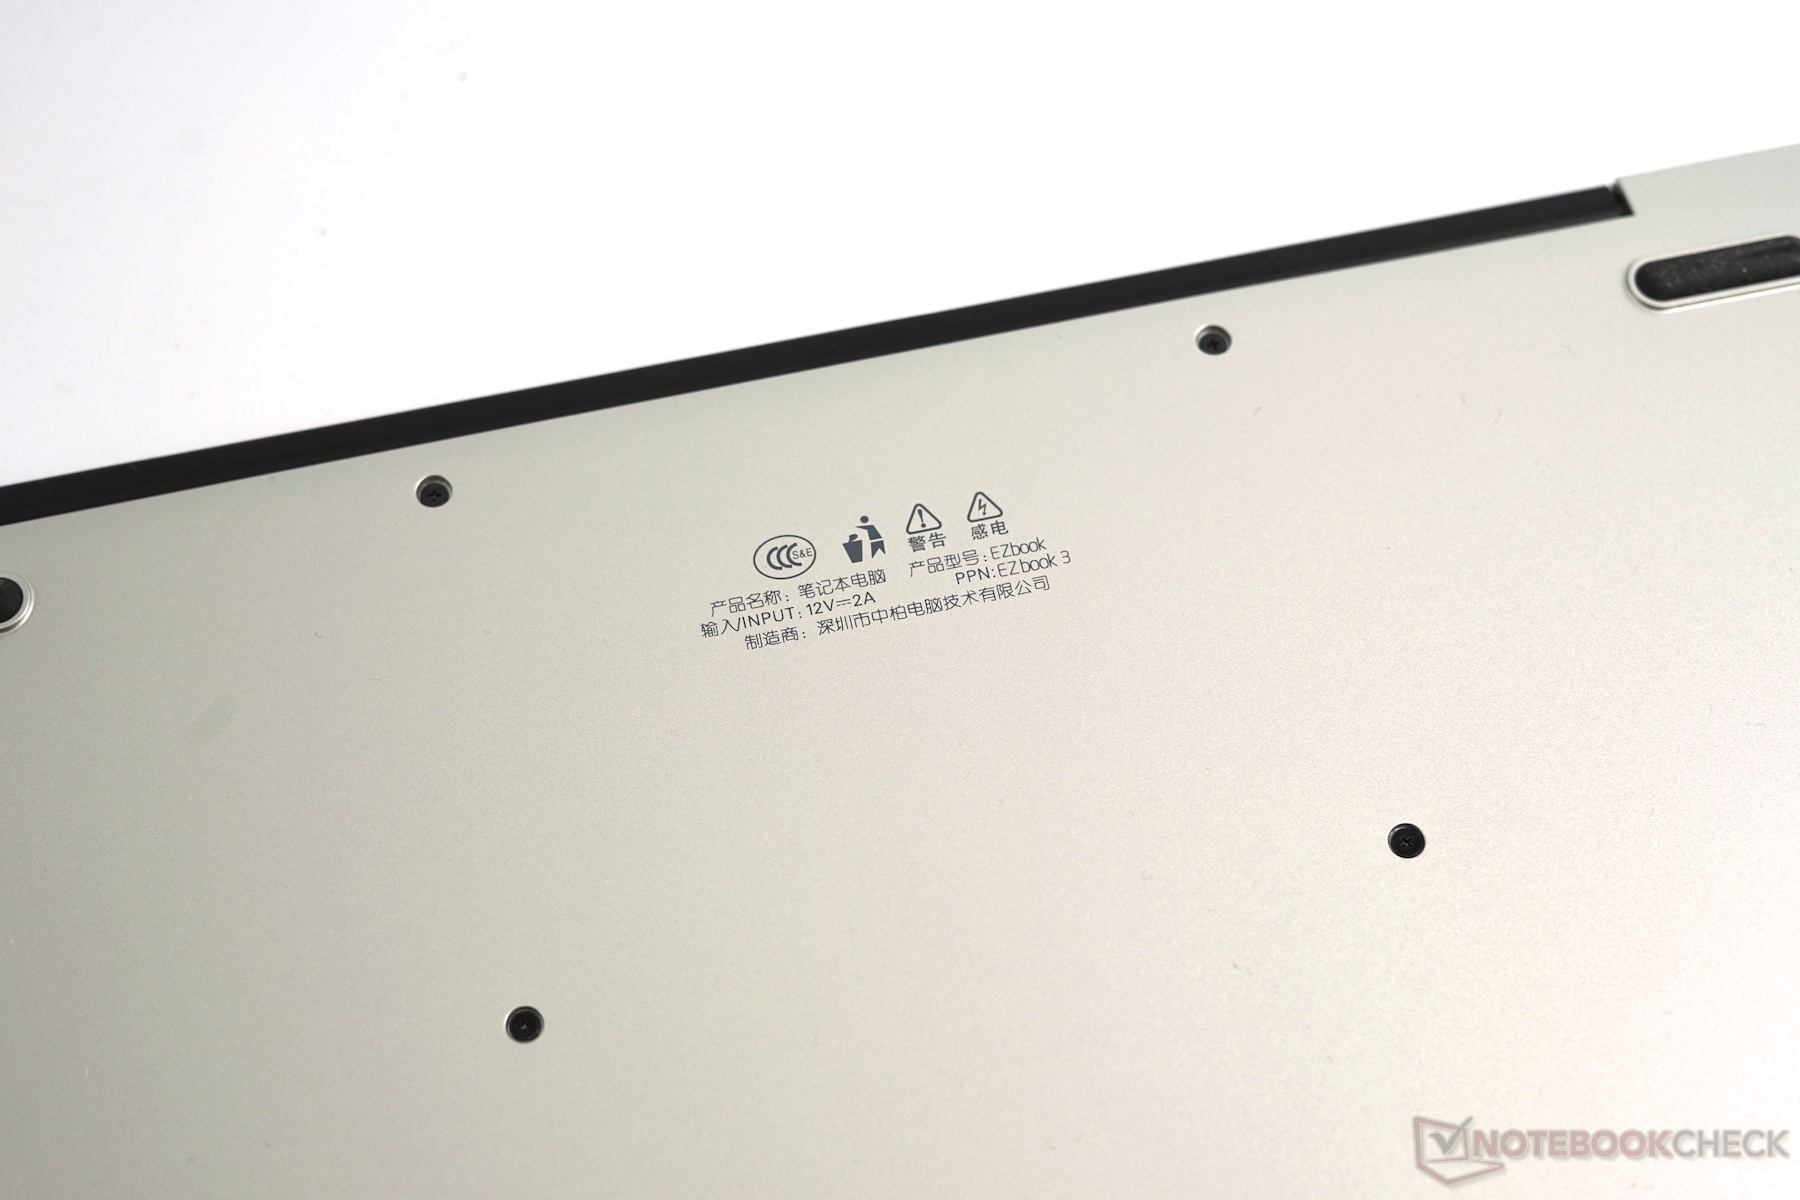
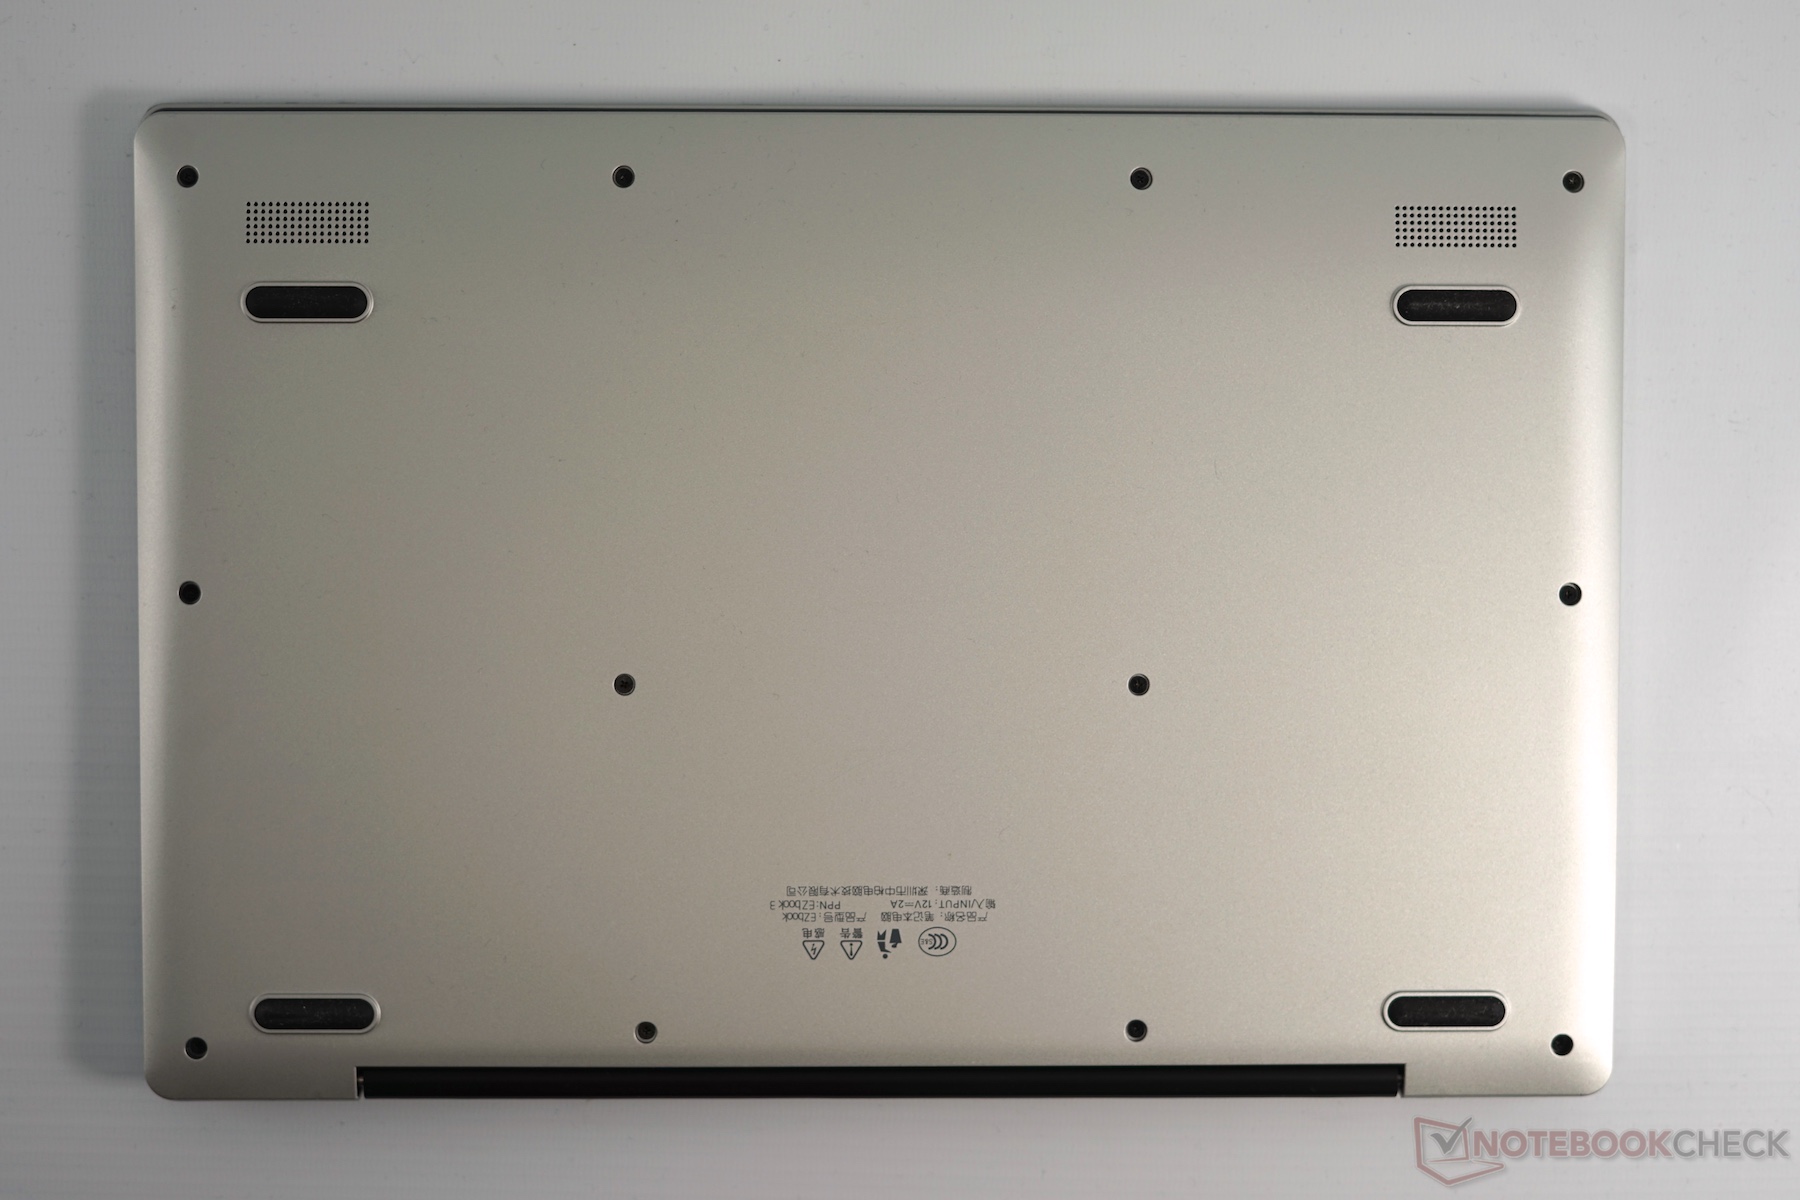
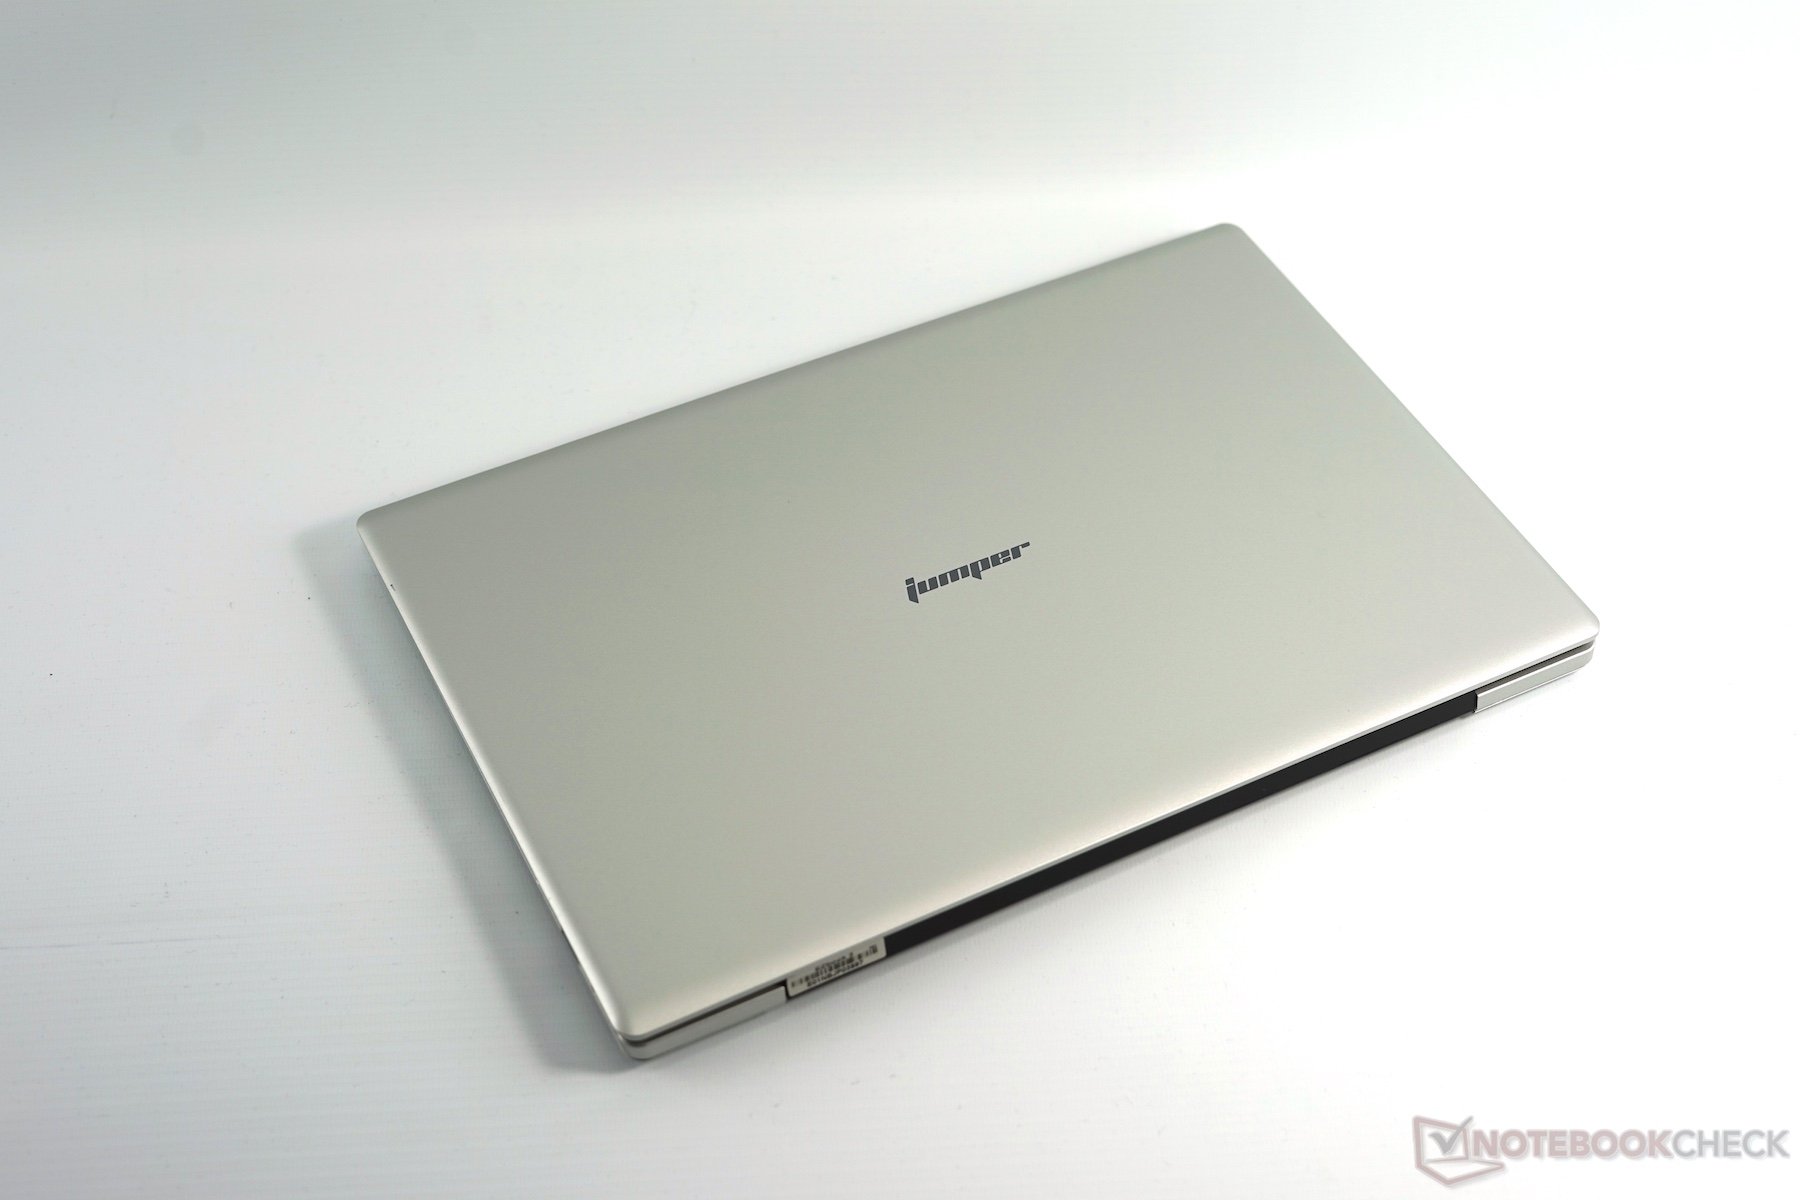
O EZBook 3 é um portátil acessível e leve com uma tela mate brilhante, resfriamento silencioso (por ser passivo), e visual atraente. Como é habitual, algumas concessões devem ser feitas nesta faixa de preços. Construção e materiais de construção medíocres, ângulos de visão limitados, PWM a 200 Hz, desempenho muito baixo, e uma duração de bateria moderada são as desvantagens que devem ser aceitas. Embora o touchpad e o teclado estejam longe do seu padrão supremo a imitar, o MacBook Air, eles são bastante úteis para o trabalho ocasional. Como muitos produtos feitos na China, o EZBook 3 atualmente não possui um CE label (e os testes envolvidos), e o comprador é quase completamente dependente da loja onde comprou o portátil, em casos de garantia. O suporte para controlador também não está disponível. No entanto, pelo menos é possível usar diretamente os controladores gráficos da Intel.
O Jumper EZBook 3 atualmente está disponível em prata na Gearbest por 194,25 Euros (~$210) do armazém da UE (lista: 343 Euros, ~$370). Este preço provavelmente será muito atraente para os usuários que podem viver com as desvantagens mencionadas.
Jumper EZbook 3
- 03/24/2017 v6 (old)
Klaus Hinum